Zip Codes with the Highest Percentage of Population Employed in Health Diagnosing & Treating in London, KY
RELATED REPORTS & OPTIONS
Health Diagnosing & Treating
London
Compare Zip Codes
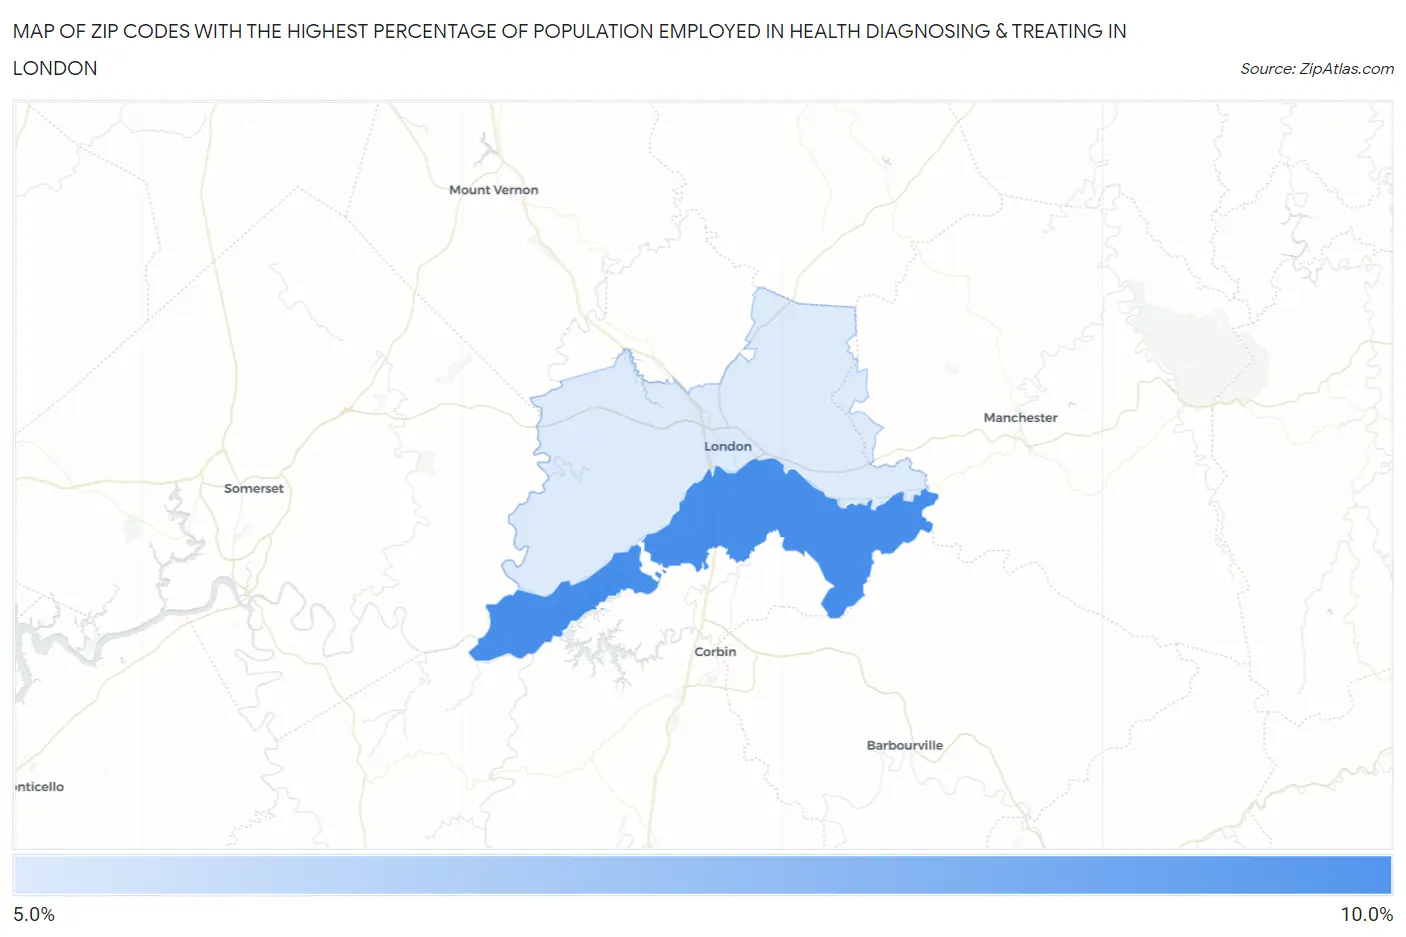
Map of Zip Codes with the Highest Percentage of Population Employed in Health Diagnosing & Treating in London
0.0%
10.0%
Zip Codes with the Highest Percentage of Population Employed in Health Diagnosing & Treating in London, KY
| Zip Code | % Employed | vs State | vs National | |
| 1. | 40744 | 8.1% | 7.2%(+0.859)#242 | 6.2%(+1.82)#7,328 |
| 2. | 40741 | 5.5% | 7.2%(-1.75)#393 | 6.2%(-0.788)#15,943 |
1
Common Questions
What are the Top Zip Codes with the Highest Percentage of Population Employed in Health Diagnosing & Treating in London, KY?
Top Zip Codes with the Highest Percentage of Population Employed in Health Diagnosing & Treating in London, KY are:
What zip code has the Highest Percentage of Population Employed in Health Diagnosing & Treating in London, KY?
40744 has the Highest Percentage of Population Employed in Health Diagnosing & Treating in London, KY with 8.1%.
What is the Percentage of Population Employed in Health Diagnosing & Treating in London, KY?
Percentage of Population Employed in Health Diagnosing & Treating in London is 6.4%.
What is the Percentage of Population Employed in Health Diagnosing & Treating in Kentucky?
Percentage of Population Employed in Health Diagnosing & Treating in Kentucky is 7.2%.
What is the Percentage of Population Employed in Health Diagnosing & Treating in the United States?
Percentage of Population Employed in Health Diagnosing & Treating in the United States is 6.2%.