Scotch-Irish vs Immigrants from Ethiopia Per Capita Income
COMPARE
Scotch-Irish
Immigrants from Ethiopia
Per Capita Income
Per Capita Income Comparison
Scotch-Irish
Immigrants from Ethiopia
$42,563
PER CAPITA INCOME
22.6/ 100
METRIC RATING
197th/ 347
METRIC RANK
$45,923
PER CAPITA INCOME
92.7/ 100
METRIC RATING
120th/ 347
METRIC RANK
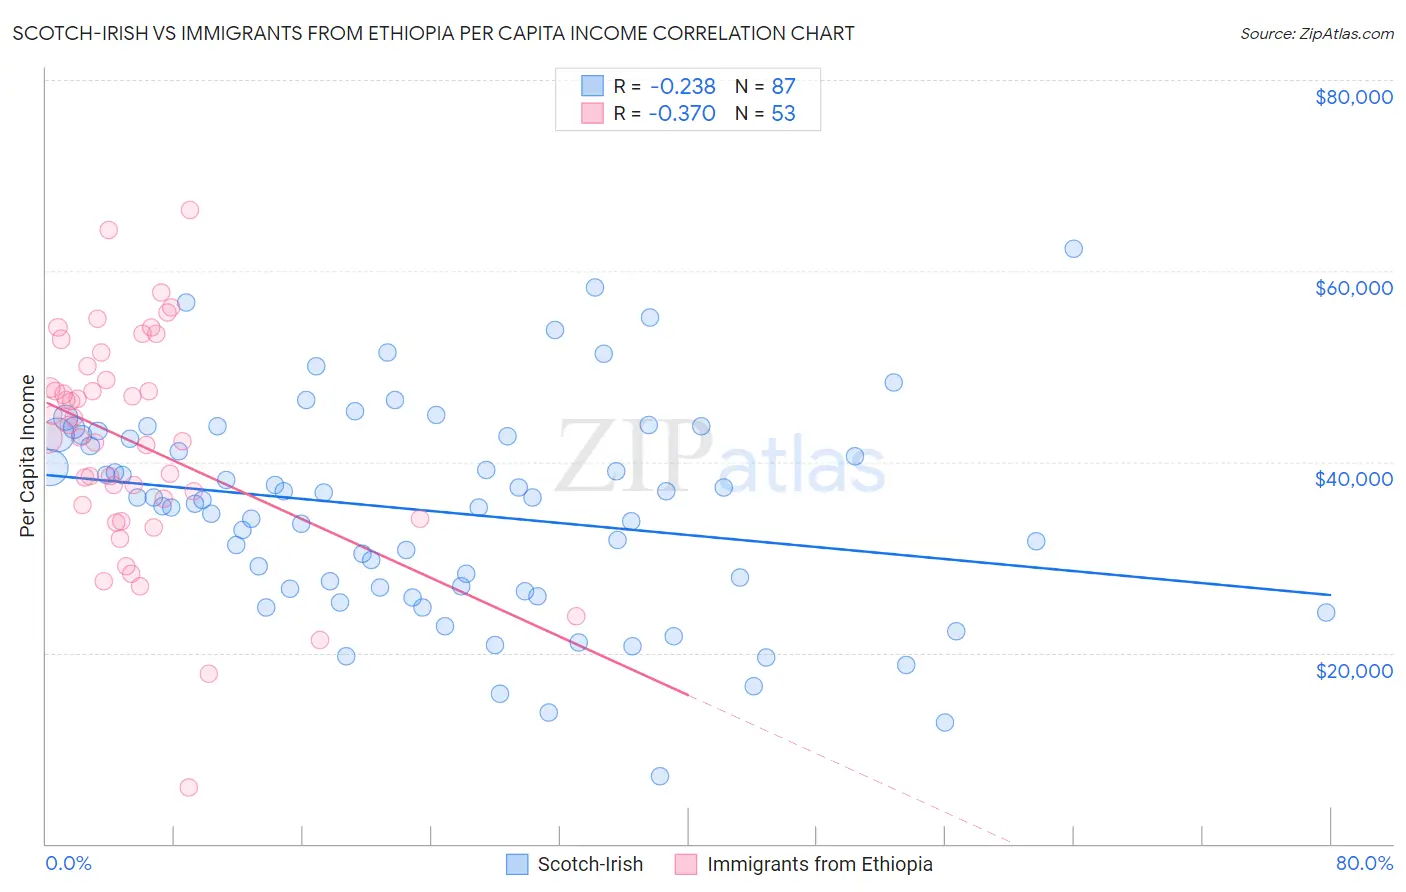
Scotch-Irish vs Immigrants from Ethiopia Per Capita Income Correlation Chart
The statistical analysis conducted on geographies consisting of 548,816,006 people shows a weak negative correlation between the proportion of Scotch-Irish and per capita income in the United States with a correlation coefficient (R) of -0.238 and weighted average of $42,563. Similarly, the statistical analysis conducted on geographies consisting of 211,574,891 people shows a mild negative correlation between the proportion of Immigrants from Ethiopia and per capita income in the United States with a correlation coefficient (R) of -0.370 and weighted average of $45,923, a difference of 7.9%.
Per Capita Income Correlation Summary
| Measurement | Scotch-Irish | Immigrants from Ethiopia |
| Minimum | $7,124 | $5,866 |
| Maximum | $62,377 | $66,352 |
| Range | $55,253 | $60,486 |
| Mean | $34,830 | $42,004 |
| Median | $35,981 | $42,502 |
| Interquartile 25% (IQ1) | $26,689 | $34,771 |
| Interquartile 75% (IQ3) | $42,802 | $49,297 |
| Interquartile Range (IQR) | $16,113 | $14,526 |
| Standard Deviation (Sample) | $10,987 | $11,622 |
| Standard Deviation (Population) | $10,923 | $11,512 |
Similar Demographics by Per Capita Income
Demographics Similar to Scotch-Irish by Per Capita Income
In terms of per capita income, the demographic groups most similar to Scotch-Irish are Dutch ($42,605, a difference of 0.10%), Immigrants from Kenya ($42,661, a difference of 0.23%), Immigrants from Fiji ($42,694, a difference of 0.31%), Immigrants from Portugal ($42,412, a difference of 0.36%), and Barbadian ($42,406, a difference of 0.37%).
| Demographics | Rating | Rank | Per Capita Income |
| Kenyans | 27.7 /100 | #190 | Fair $42,808 |
| Yugoslavians | 27.4 /100 | #191 | Fair $42,792 |
| Iraqis | 26.7 /100 | #192 | Fair $42,760 |
| Immigrants | Sierra Leone | 26.5 /100 | #193 | Fair $42,752 |
| Immigrants | Fiji | 25.2 /100 | #194 | Fair $42,694 |
| Immigrants | Kenya | 24.5 /100 | #195 | Fair $42,661 |
| Dutch | 23.4 /100 | #196 | Fair $42,605 |
| Scotch-Irish | 22.6 /100 | #197 | Fair $42,563 |
| Immigrants | Portugal | 19.7 /100 | #198 | Poor $42,412 |
| Barbadians | 19.6 /100 | #199 | Poor $42,406 |
| Vietnamese | 19.0 /100 | #200 | Poor $42,368 |
| Immigrants | Thailand | 17.6 /100 | #201 | Poor $42,289 |
| Immigrants | Bosnia and Herzegovina | 17.5 /100 | #202 | Poor $42,278 |
| Spanish | 17.0 /100 | #203 | Poor $42,249 |
| Aleuts | 16.4 /100 | #204 | Poor $42,210 |
Demographics Similar to Immigrants from Ethiopia by Per Capita Income
In terms of per capita income, the demographic groups most similar to Immigrants from Ethiopia are Immigrants from Poland ($45,979, a difference of 0.12%), Canadian ($45,858, a difference of 0.14%), Moroccan ($45,854, a difference of 0.15%), Lebanese ($45,840, a difference of 0.18%), and Immigrants from Saudi Arabia ($46,008, a difference of 0.19%).
| Demographics | Rating | Rank | Per Capita Income |
| Immigrants | Albania | 95.5 /100 | #113 | Exceptional $46,387 |
| Afghans | 94.9 /100 | #114 | Exceptional $46,268 |
| Immigrants | Chile | 94.6 /100 | #115 | Exceptional $46,213 |
| Poles | 94.1 /100 | #116 | Exceptional $46,123 |
| Chinese | 93.9 /100 | #117 | Exceptional $46,098 |
| Immigrants | Saudi Arabia | 93.3 /100 | #118 | Exceptional $46,008 |
| Immigrants | Poland | 93.1 /100 | #119 | Exceptional $45,979 |
| Immigrants | Ethiopia | 92.7 /100 | #120 | Exceptional $45,923 |
| Canadians | 92.2 /100 | #121 | Exceptional $45,858 |
| Moroccans | 92.1 /100 | #122 | Exceptional $45,854 |
| Lebanese | 92.0 /100 | #123 | Exceptional $45,840 |
| Europeans | 92.0 /100 | #124 | Exceptional $45,836 |
| Zimbabweans | 91.7 /100 | #125 | Exceptional $45,804 |
| Palestinians | 91.6 /100 | #126 | Exceptional $45,790 |
| Immigrants | Germany | 91.3 /100 | #127 | Exceptional $45,751 |