Bayonet Point, FL
Bayonet Point Map
Bayonet Point Overview
24,628
TOTAL POPULATION
11,138
MALE POPULATION
13,490
FEMALE POPULATION
82.56
MALES / 100 FEMALES
121.12
FEMALES / 100 MALES
53.2
MEDIAN AGE
2.8
AVG FAMILY SIZE
2.1
AVG HOUSEHOLD SIZE
$28,928
PER CAPITA INCOME
$55,408
AVG FAMILY INCOME
$42,932
AVG HOUSEHOLD INCOME
20.3%
WAGE / INCOME GAP [ % ]
79.7¢/ $1
WAGE / INCOME GAP [ $ ]
0.47
INEQUALITY / GINI INDEX
9,622
LABOR FORCE [ PEOPLE ]
45.6%
PERCENT IN LABOR FORCE
7.5%
UNEMPLOYMENT RATE
Bayonet Point Area Codes
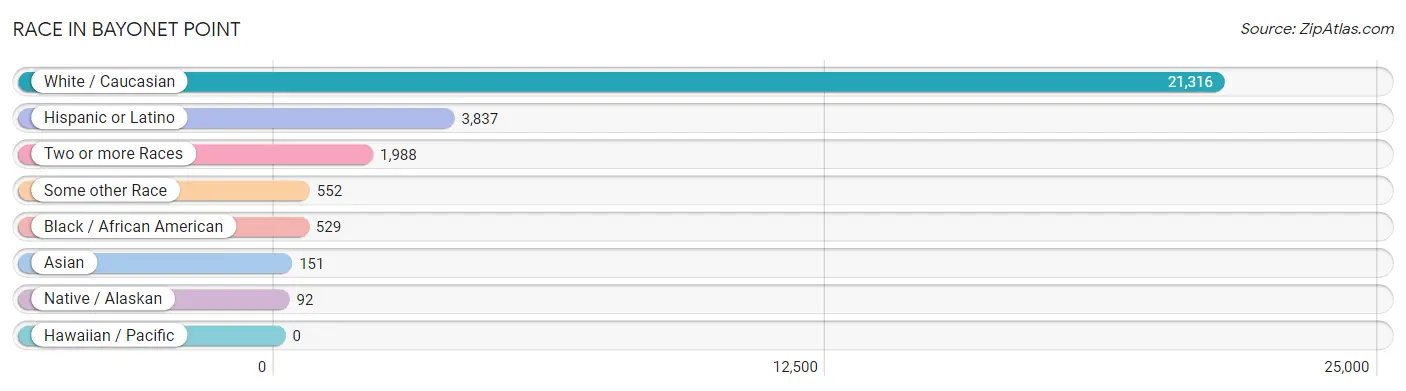
Race in Bayonet Point
The most populous races in Bayonet Point are White / Caucasian (21,316 | 86.6%), Hispanic or Latino (3,837 | 15.6%), and Two or more Races (1,988 | 8.1%).
| Race | # Population | % Population |
| Asian | 151 | 0.6% |
| Black / African American | 529 | 2.1% |
| Hawaiian / Pacific | 0 | 0.0% |
| Hispanic or Latino | 3,837 | 15.6% |
| Native / Alaskan | 92 | 0.4% |
| White / Caucasian | 21,316 | 86.6% |
| Two or more Races | 1,988 | 8.1% |
| Some other Race | 552 | 2.2% |
| Total | 24,628 | 100.0% |
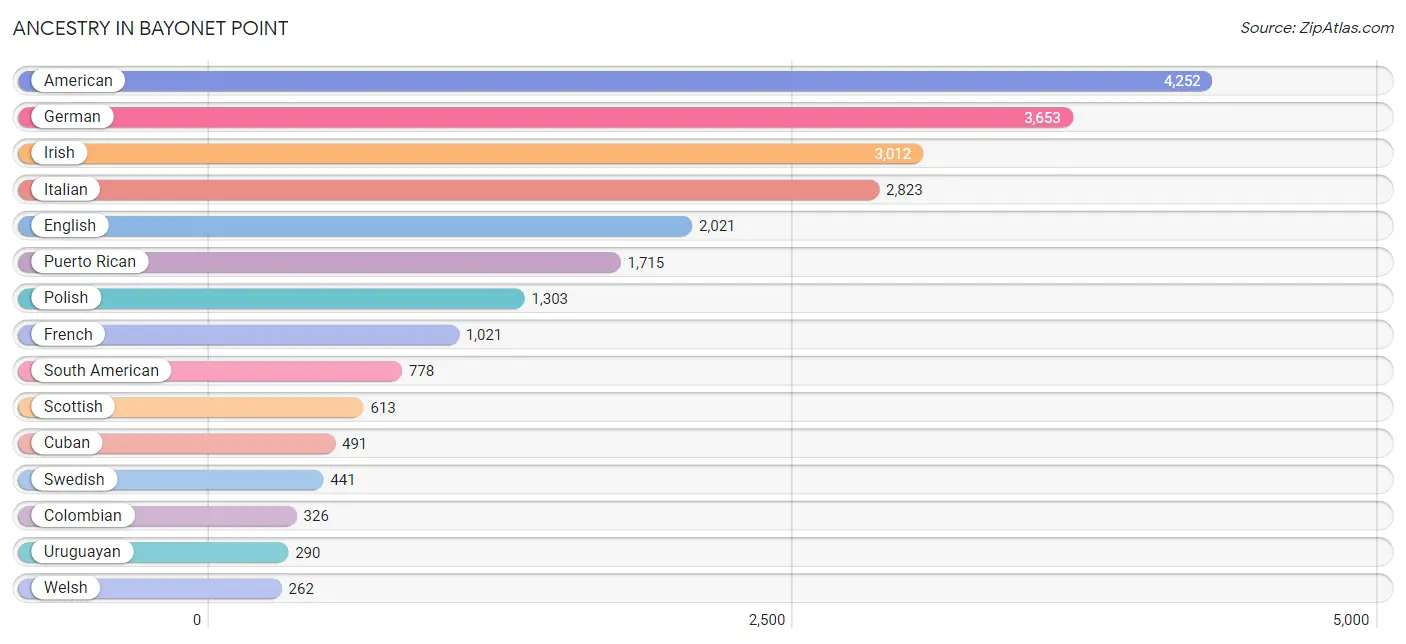
Ancestry in Bayonet Point
The most populous ancestries reported in Bayonet Point are American (4,252 | 17.3%), German (3,653 | 14.8%), Irish (3,012 | 12.2%), Italian (2,823 | 11.5%), and English (2,021 | 8.2%), together accounting for 64.0% of all Bayonet Point residents.
| Ancestry | # Population | % Population |
| Albanian | 22 | 0.1% |
| American | 4,252 | 17.3% |
| Apache | 2 | 0.0% |
| Arab | 98 | 0.4% |
| Armenian | 8 | 0.0% |
| Austrian | 93 | 0.4% |
| Belgian | 17 | 0.1% |
| Blackfeet | 127 | 0.5% |
| British | 106 | 0.4% |
| British West Indian | 34 | 0.1% |
| Canadian | 42 | 0.2% |
| Central American | 161 | 0.6% |
| Central American Indian | 18 | 0.1% |
| Cherokee | 14 | 0.1% |
| Chilean | 34 | 0.1% |
| Colombian | 326 | 1.3% |
| Croatian | 9 | 0.0% |
| Cuban | 491 | 2.0% |
| Cypriot | 4 | 0.0% |
| Czech | 67 | 0.3% |
| Czechoslovakian | 118 | 0.5% |
| Danish | 116 | 0.5% |
| Dominican | 111 | 0.4% |
| Dutch | 219 | 0.9% |
| Eastern European | 81 | 0.3% |
| English | 2,021 | 8.2% |
| European | 146 | 0.6% |
| Finnish | 43 | 0.2% |
| French | 1,021 | 4.2% |
| French Canadian | 238 | 1.0% |
| German | 3,653 | 14.8% |
| Greek | 220 | 0.9% |
| Haitian | 22 | 0.1% |
| Honduran | 60 | 0.2% |
| Hungarian | 100 | 0.4% |
| Icelander | 23 | 0.1% |
| Indian (Asian) | 10 | 0.0% |
| Irish | 3,012 | 12.2% |
| Italian | 2,823 | 11.5% |
| Jamaican | 38 | 0.2% |
| Korean | 140 | 0.6% |
| Lebanese | 69 | 0.3% |
| Lithuanian | 112 | 0.4% |
| Macedonian | 19 | 0.1% |
| Mexican | 184 | 0.7% |
| Nicaraguan | 1 | 0.0% |
| Norwegian | 169 | 0.7% |
| Panamanian | 100 | 0.4% |
| Pennsylvania German | 22 | 0.1% |
| Peruvian | 69 | 0.3% |
| Polish | 1,303 | 5.3% |
| Portuguese | 44 | 0.2% |
| Puerto Rican | 1,715 | 7.0% |
| Romanian | 20 | 0.1% |
| Russian | 153 | 0.6% |
| Scandinavian | 9 | 0.0% |
| Scotch-Irish | 115 | 0.5% |
| Scottish | 613 | 2.5% |
| Serbian | 5 | 0.0% |
| Sioux | 10 | 0.0% |
| Slavic | 36 | 0.2% |
| Slovak | 21 | 0.1% |
| South American | 778 | 3.2% |
| Spaniard | 30 | 0.1% |
| Swedish | 441 | 1.8% |
| Swiss | 26 | 0.1% |
| Syrian | 17 | 0.1% |
| Thai | 76 | 0.3% |
| Trinidadian and Tobagonian | 34 | 0.1% |
| Turkish | 5 | 0.0% |
| Ukrainian | 28 | 0.1% |
| Uruguayan | 290 | 1.2% |
| Venezuelan | 59 | 0.2% |
| Welsh | 262 | 1.1% |
| Yugoslavian | 7 | 0.0% | View All 75 Rows |
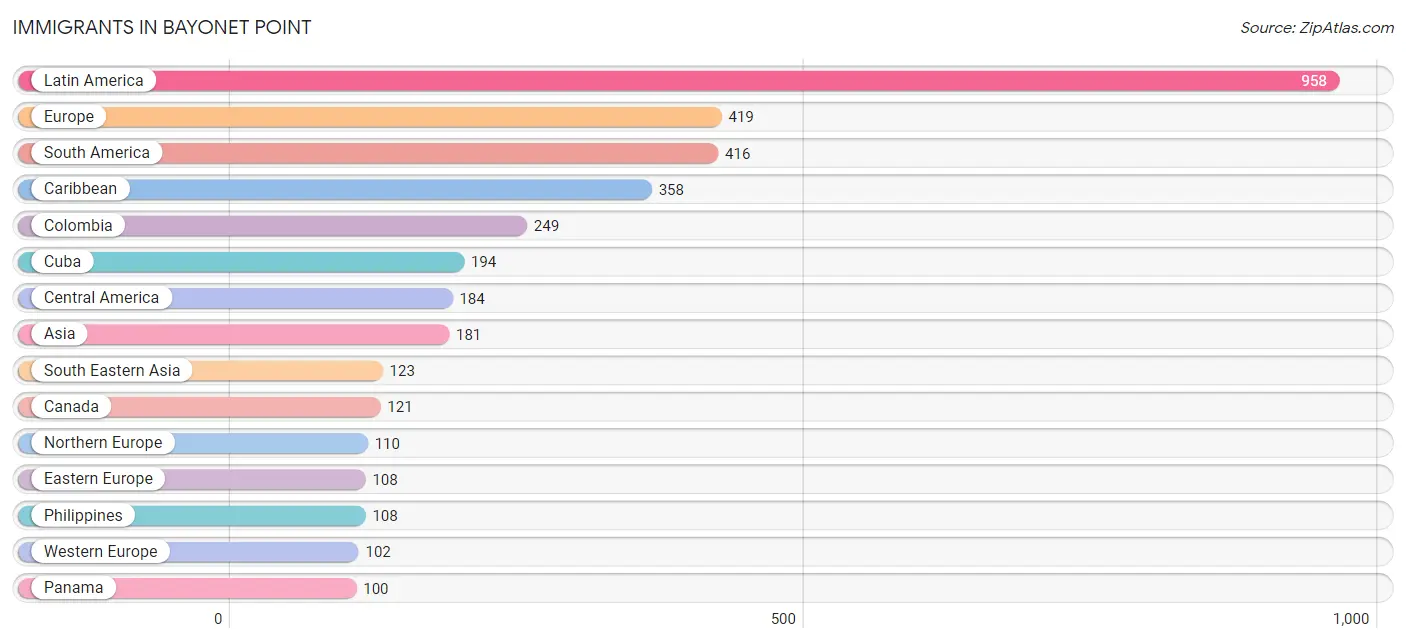
Immigrants in Bayonet Point
The most numerous immigrant groups reported in Bayonet Point came from Latin America (958 | 3.9%), Europe (419 | 1.7%), South America (416 | 1.7%), Caribbean (358 | 1.5%), and Colombia (249 | 1.0%), together accounting for 9.7% of all Bayonet Point residents.
| Immigration Origin | # Population | % Population |
| Africa | 17 | 0.1% |
| Asia | 181 | 0.7% |
| Bolivia | 29 | 0.1% |
| Canada | 121 | 0.5% |
| Caribbean | 358 | 1.5% |
| Central America | 184 | 0.7% |
| China | 10 | 0.0% |
| Colombia | 249 | 1.0% |
| Cuba | 194 | 0.8% |
| Dominican Republic | 95 | 0.4% |
| Eastern Africa | 17 | 0.1% |
| Eastern Asia | 10 | 0.0% |
| Eastern Europe | 108 | 0.4% |
| England | 61 | 0.3% |
| Europe | 419 | 1.7% |
| France | 13 | 0.1% |
| Germany | 89 | 0.4% |
| Greece | 33 | 0.1% |
| Guyana | 10 | 0.0% |
| Haiti | 22 | 0.1% |
| Honduras | 60 | 0.2% |
| Hungary | 16 | 0.1% |
| India | 16 | 0.1% |
| Ireland | 15 | 0.1% |
| Italy | 27 | 0.1% |
| Jamaica | 47 | 0.2% |
| Latin America | 958 | 3.9% |
| Lebanon | 10 | 0.0% |
| Mexico | 24 | 0.1% |
| Northern Europe | 110 | 0.4% |
| Norway | 7 | 0.0% |
| Panama | 100 | 0.4% |
| Peru | 30 | 0.1% |
| Philippines | 108 | 0.4% |
| Poland | 43 | 0.2% |
| Portugal | 23 | 0.1% |
| Romania | 20 | 0.1% |
| Russia | 22 | 0.1% |
| Scotland | 27 | 0.1% |
| South America | 416 | 1.7% |
| South Central Asia | 16 | 0.1% |
| South Eastern Asia | 123 | 0.5% |
| Southern Europe | 99 | 0.4% |
| Spain | 16 | 0.1% |
| Syria | 17 | 0.1% |
| Turkey | 5 | 0.0% |
| Uruguay | 65 | 0.3% |
| Venezuela | 33 | 0.1% |
| Vietnam | 15 | 0.1% |
| Western Asia | 32 | 0.1% |
| Western Europe | 102 | 0.4% | View All 51 Rows |
Sex and Age in Bayonet Point
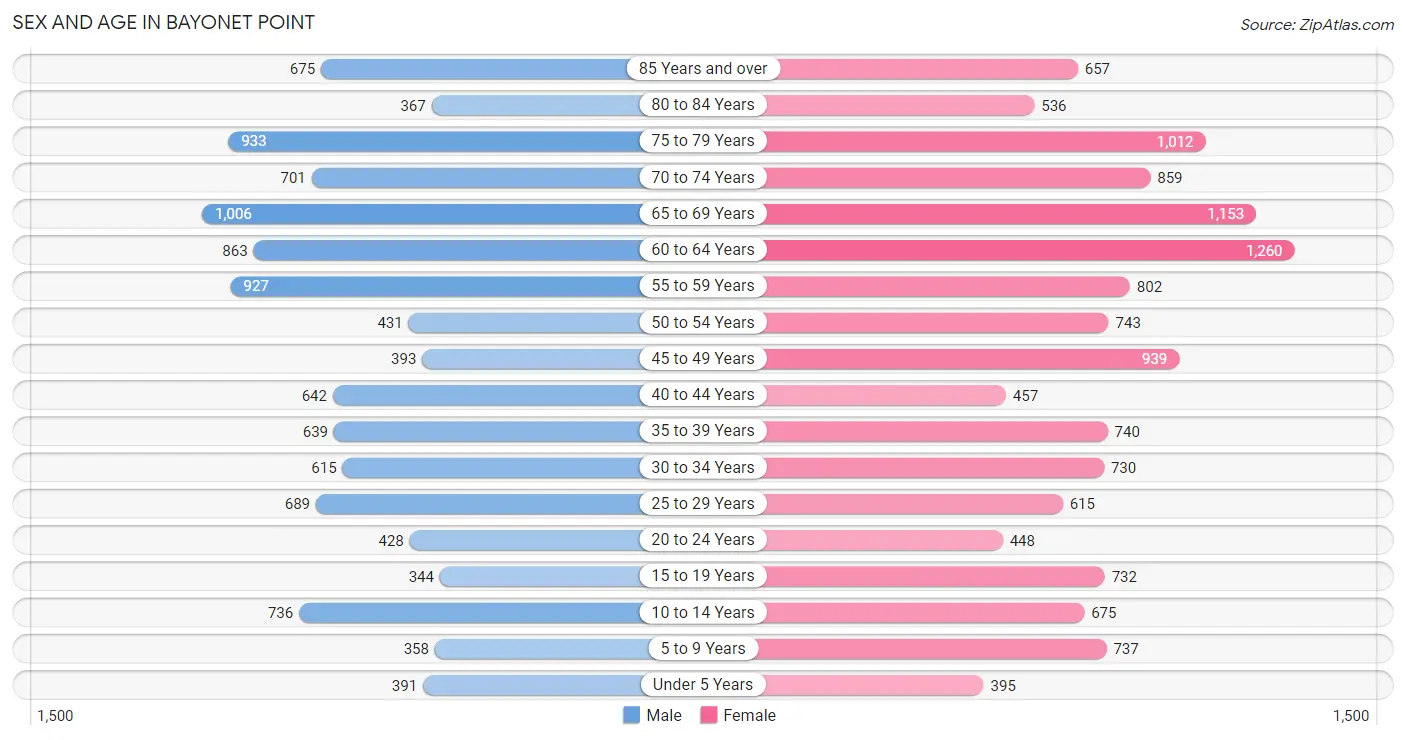
Sex and Age in Bayonet Point
The most populous age groups in Bayonet Point are 65 to 69 Years (1,006 | 9.0%) for men and 60 to 64 Years (1,260 | 9.3%) for women.
| Age Bracket | Male | Female |
| Under 5 Years | 391 (3.5%) | 395 (2.9%) |
| 5 to 9 Years | 358 (3.2%) | 737 (5.5%) |
| 10 to 14 Years | 736 (6.6%) | 675 (5.0%) |
| 15 to 19 Years | 344 (3.1%) | 732 (5.4%) |
| 20 to 24 Years | 428 (3.8%) | 448 (3.3%) |
| 25 to 29 Years | 689 (6.2%) | 615 (4.6%) |
| 30 to 34 Years | 615 (5.5%) | 730 (5.4%) |
| 35 to 39 Years | 639 (5.7%) | 740 (5.5%) |
| 40 to 44 Years | 642 (5.8%) | 457 (3.4%) |
| 45 to 49 Years | 393 (3.5%) | 939 (7.0%) |
| 50 to 54 Years | 431 (3.9%) | 743 (5.5%) |
| 55 to 59 Years | 927 (8.3%) | 802 (5.9%) |
| 60 to 64 Years | 863 (7.7%) | 1,260 (9.3%) |
| 65 to 69 Years | 1,006 (9.0%) | 1,153 (8.6%) |
| 70 to 74 Years | 701 (6.3%) | 859 (6.4%) |
| 75 to 79 Years | 933 (8.4%) | 1,012 (7.5%) |
| 80 to 84 Years | 367 (3.3%) | 536 (4.0%) |
| 85 Years and over | 675 (6.1%) | 657 (4.9%) |
| Total | 11,138 (100.0%) | 13,490 (100.0%) |
Families and Households in Bayonet Point
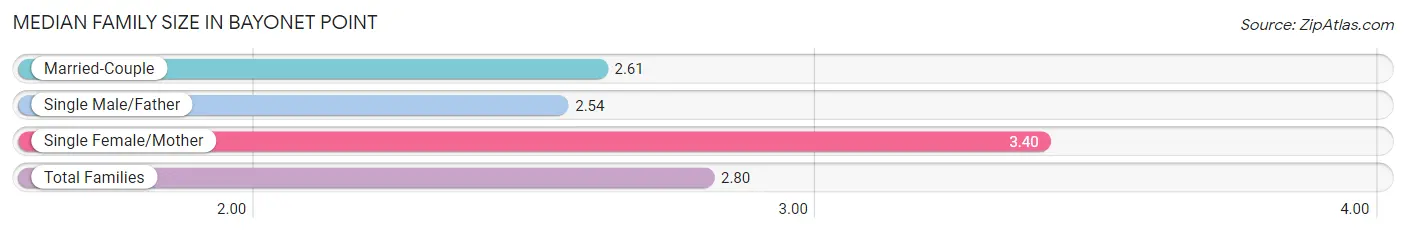
Median Family Size in Bayonet Point
The median family size in Bayonet Point is 2.80 persons per family, with single female/mother families (1,482 | 24.4%) accounting for the largest median family size of 3.4 persons per family. On the other hand, single male/father families (496 | 8.2%) represent the smallest median family size with 2.54 persons per family.
| Family Type | # Families | Family Size |
| Married-Couple | 4,103 (67.5%) | 2.61 |
| Single Male/Father | 496 (8.2%) | 2.54 |
| Single Female/Mother | 1,482 (24.4%) | 3.40 |
| Total Families | 6,081 (100.0%) | 2.80 |
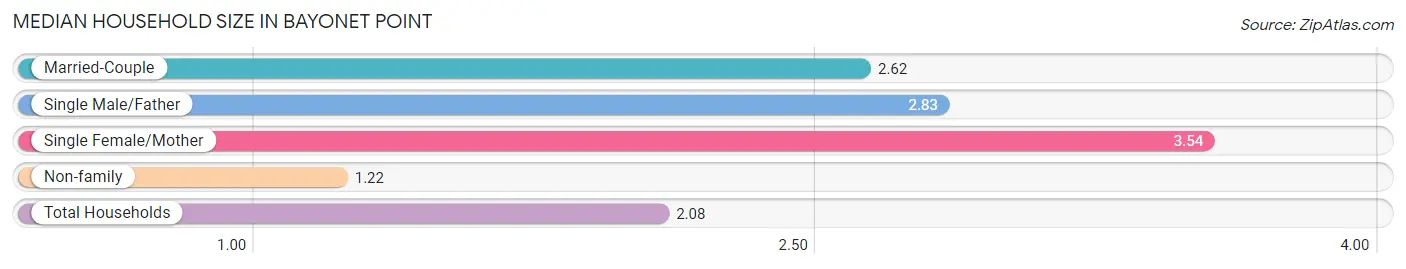
Median Household Size in Bayonet Point
The median household size in Bayonet Point is 2.08 persons per household, with single female/mother households (1,482 | 12.7%) accounting for the largest median household size of 3.54 persons per household. non-family households (5,587 | 47.9%) represent the smallest median household size with 1.22 persons per household.
| Household Type | # Households | Household Size |
| Married-Couple | 4,103 (35.2%) | 2.62 |
| Single Male/Father | 496 (4.3%) | 2.83 |
| Single Female/Mother | 1,482 (12.7%) | 3.54 |
| Non-family | 5,587 (47.9%) | 1.22 |
| Total Households | 11,668 (100.0%) | 2.08 |
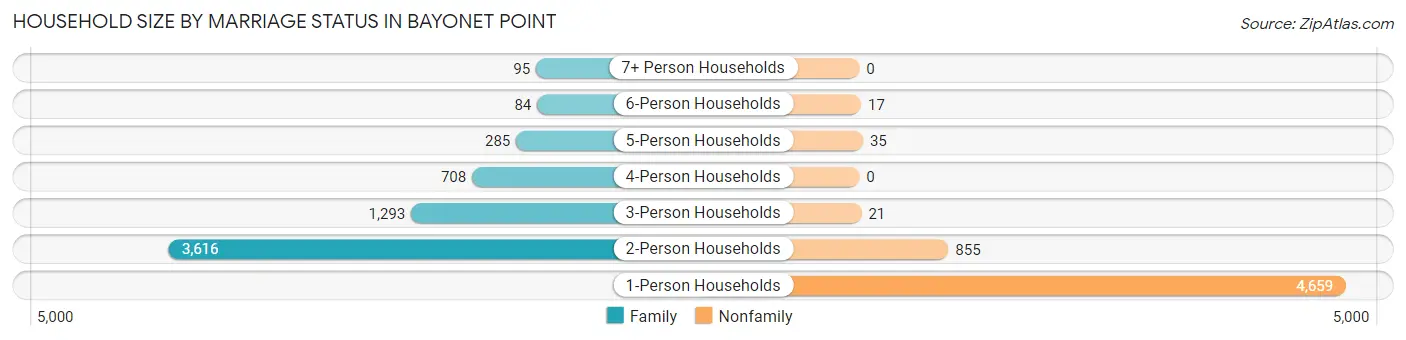
Household Size by Marriage Status in Bayonet Point
Out of a total of 11,668 households in Bayonet Point, 6,081 (52.1%) are family households, while 5,587 (47.9%) are nonfamily households. The most numerous type of family households are 2-person households, comprising 3,616, and the most common type of nonfamily households are 1-person households, comprising 4,659.
| Household Size | Family Households | Nonfamily Households |
| 1-Person Households | - | 4,659 (39.9%) |
| 2-Person Households | 3,616 (31.0%) | 855 (7.3%) |
| 3-Person Households | 1,293 (11.1%) | 21 (0.2%) |
| 4-Person Households | 708 (6.1%) | 0 (0.0%) |
| 5-Person Households | 285 (2.4%) | 35 (0.3%) |
| 6-Person Households | 84 (0.7%) | 17 (0.2%) |
| 7+ Person Households | 95 (0.8%) | 0 (0.0%) |
| Total | 6,081 (52.1%) | 5,587 (47.9%) |
Female Fertility in Bayonet Point
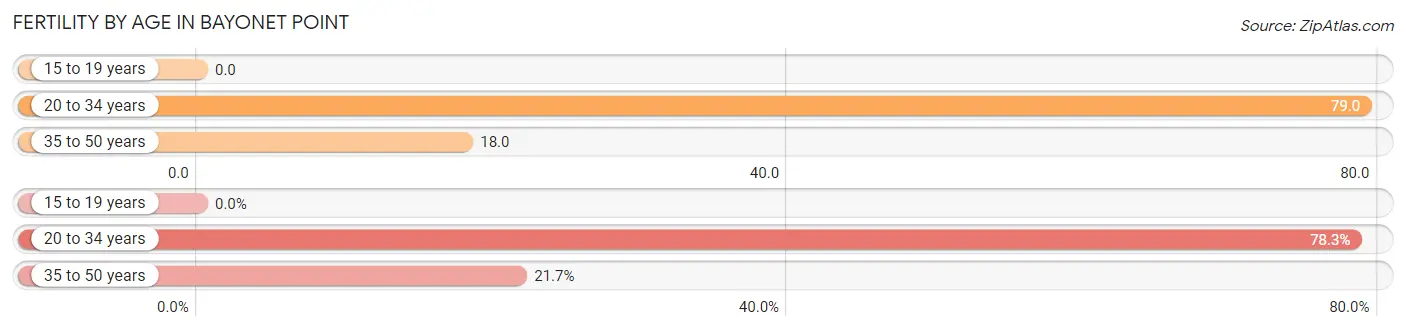
Fertility by Age in Bayonet Point
Average fertility rate in Bayonet Point is 38.0 births per 1,000 women. Women in the age bracket of 20 to 34 years have the highest fertility rate with 79.0 births per 1,000 women. Women in the age bracket of 20 to 34 years acount for 78.3% of all women with births.
| Age Bracket | Women with Births | Births / 1,000 Women |
| 15 to 19 years | 0 (0.0%) | 0.0 |
| 20 to 34 years | 141 (78.3%) | 79.0 |
| 35 to 50 years | 39 (21.7%) | 18.0 |
| Total | 180 (100.0%) | 38.0 |
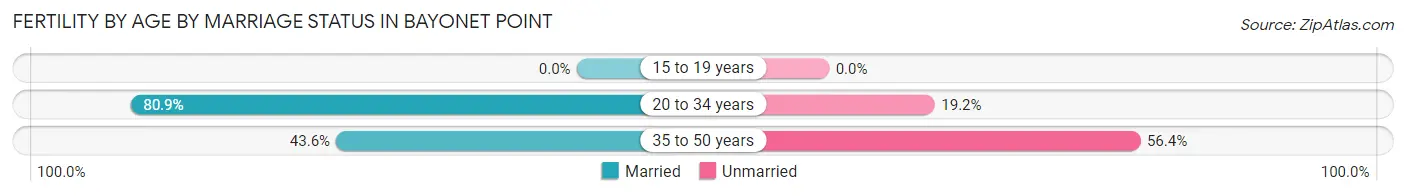
Fertility by Age by Marriage Status in Bayonet Point
72.8% of women with births (180) in Bayonet Point are married. The highest percentage of unmarried women with births falls into 35 to 50 years age bracket with 56.4% of them unmarried at the time of birth, while the lowest percentage of unmarried women with births belong to 20 to 34 years age bracket with 19.2% of them unmarried.
| Age Bracket | Married | Unmarried |
| 15 to 19 years | 0 (0.0%) | 0 (0.0%) |
| 20 to 34 years | 114 (80.8%) | 27 (19.2%) |
| 35 to 50 years | 17 (43.6%) | 22 (56.4%) |
| Total | 131 (72.8%) | 49 (27.2%) |
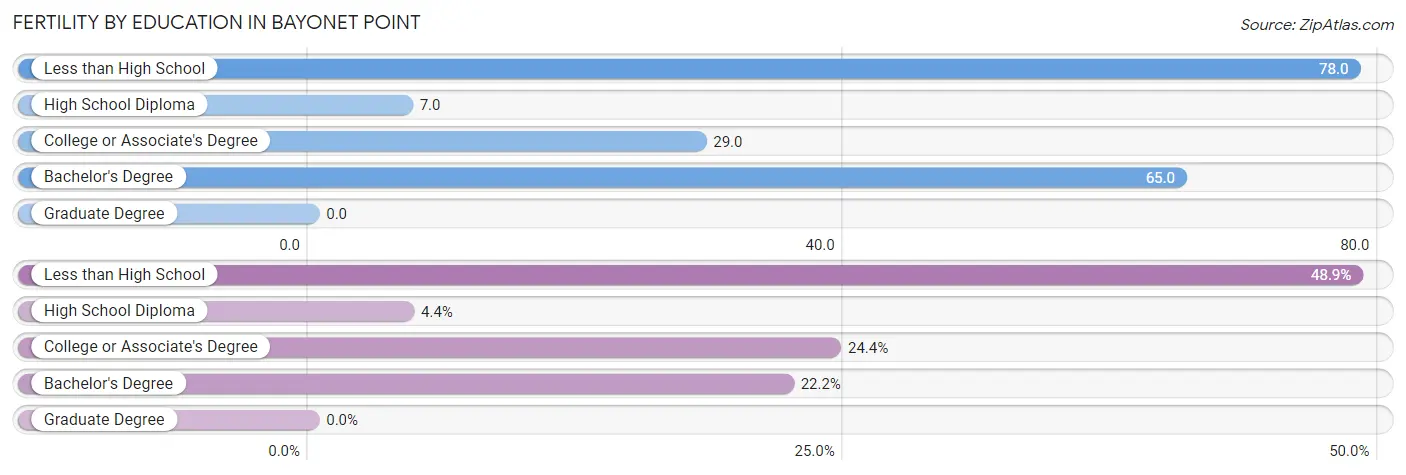
Fertility by Education in Bayonet Point
| Educational Attainment | Women with Births | Births / 1,000 Women |
| Less than High School | 88 (48.9%) | 78.0 |
| High School Diploma | 8 (4.4%) | 7.0 |
| College or Associate's Degree | 44 (24.4%) | 29.0 |
| Bachelor's Degree | 40 (22.2%) | 65.0 |
| Graduate Degree | 0 (0.0%) | 0.0 |
| Total | 180 (100.0%) | 38.0 |
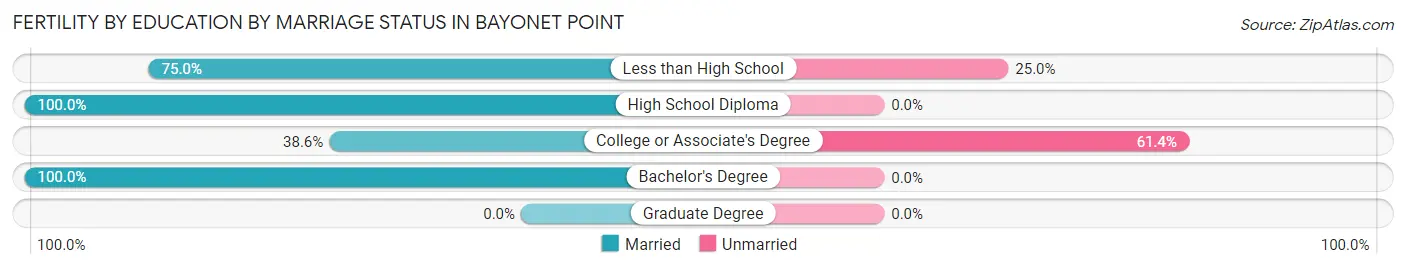
Fertility by Education by Marriage Status in Bayonet Point
27.2% of women with births in Bayonet Point are unmarried. Women with the educational attainment of high school diploma are most likely to be married with 100.0% of them married at childbirth, while women with the educational attainment of college or associate's degree are least likely to be married with 61.4% of them unmarried at childbirth.
| Educational Attainment | Married | Unmarried |
| Less than High School | 66 (75.0%) | 22 (25.0%) |
| High School Diploma | 8 (100.0%) | 0 (0.0%) |
| College or Associate's Degree | 17 (38.6%) | 27 (61.4%) |
| Bachelor's Degree | 40 (100.0%) | 0 (0.0%) |
| Graduate Degree | 0 (0.0%) | 0 (0.0%) |
| Total | 131 (72.8%) | 49 (27.2%) |
Income in Bayonet Point
Income Overview in Bayonet Point
Per Capita Income in Bayonet Point is $28,928, while median incomes of families and households are $55,408 and $42,932 respectively.
| Characteristic | Number | Measure |
| Per Capita Income | 24,628 | $28,928 |
| Median Family Income | 6,081 | $55,408 |
| Mean Family Income | 6,081 | $74,311 |
| Median Household Income | 11,668 | $42,932 |
| Mean Household Income | 11,668 | $58,671 |
| Income Deficit | 6,081 | $0 |
| Wage / Income Gap (%) | 24,628 | 20.26% |
| Wage / Income Gap ($) | 24,628 | 79.74¢ per $1 |
| Gini / Inequality Index | 24,628 | 0.47 |
Earnings by Sex in Bayonet Point
Average Earnings in Bayonet Point are $35,522, $38,537 for men and $30,728 for women, a difference of 20.3%.
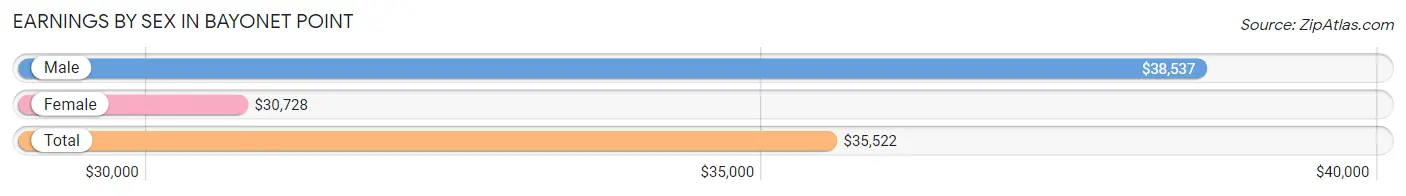
| Sex | Number | Average Earnings |
| Male | 4,603 (48.2%) | $38,537 |
| Female | 4,952 (51.8%) | $30,728 |
| Total | 9,555 (100.0%) | $35,522 |
Earnings by Sex by Income Bracket in Bayonet Point
The most common earnings brackets in Bayonet Point are $35,000 to $39,999 for men (512 | 11.1%) and $25,000 to $29,999 for women (425 | 8.6%).
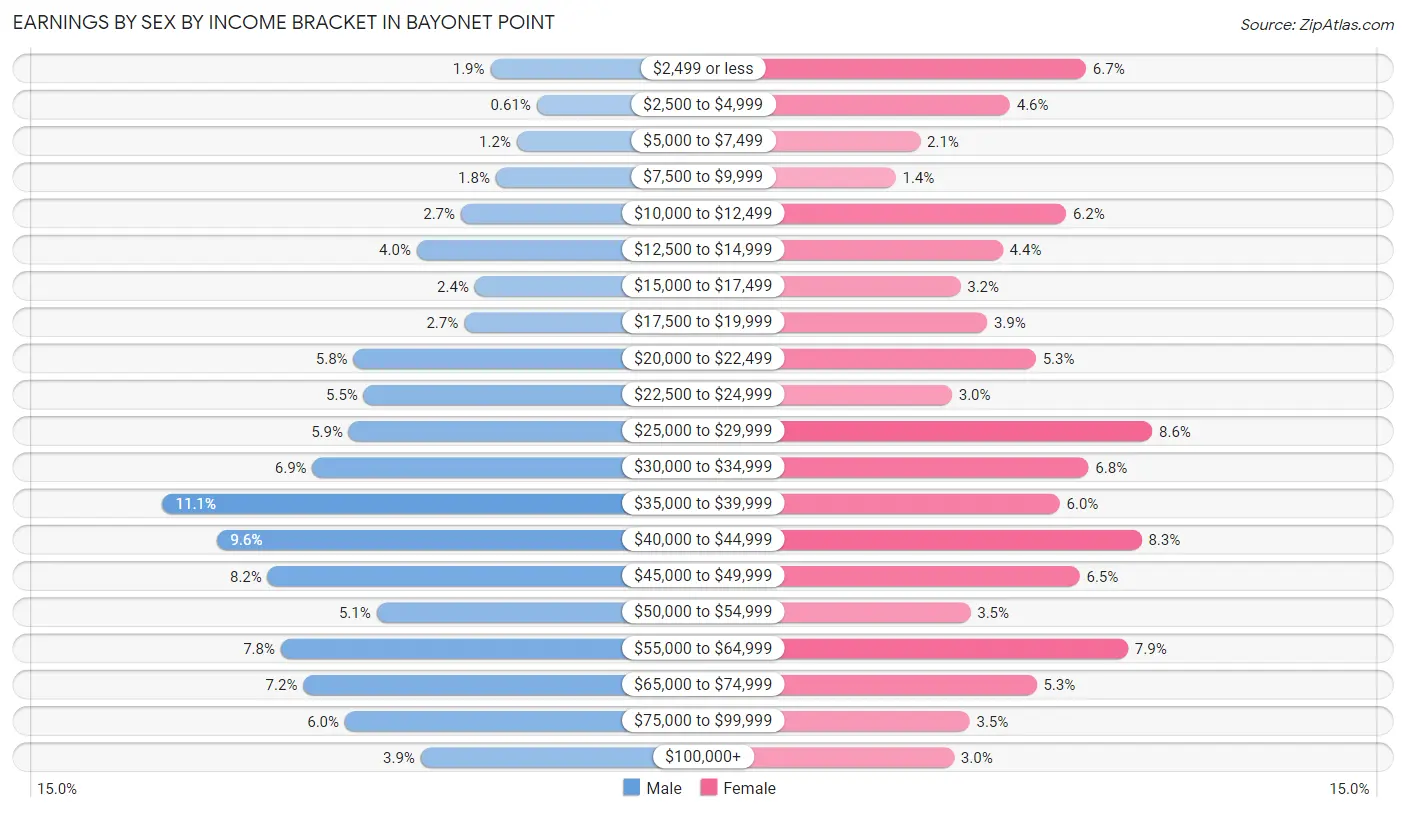
| Income | Male | Female |
| $2,499 or less | 88 (1.9%) | 333 (6.7%) |
| $2,500 to $4,999 | 28 (0.6%) | 227 (4.6%) |
| $5,000 to $7,499 | 54 (1.2%) | 102 (2.1%) |
| $7,500 to $9,999 | 81 (1.8%) | 68 (1.4%) |
| $10,000 to $12,499 | 126 (2.7%) | 305 (6.2%) |
| $12,500 to $14,999 | 183 (4.0%) | 217 (4.4%) |
| $15,000 to $17,499 | 108 (2.4%) | 158 (3.2%) |
| $17,500 to $19,999 | 122 (2.6%) | 195 (3.9%) |
| $20,000 to $22,499 | 265 (5.8%) | 263 (5.3%) |
| $22,500 to $24,999 | 252 (5.5%) | 146 (2.9%) |
| $25,000 to $29,999 | 271 (5.9%) | 425 (8.6%) |
| $30,000 to $34,999 | 318 (6.9%) | 336 (6.8%) |
| $35,000 to $39,999 | 512 (11.1%) | 296 (6.0%) |
| $40,000 to $44,999 | 441 (9.6%) | 410 (8.3%) |
| $45,000 to $49,999 | 376 (8.2%) | 324 (6.5%) |
| $50,000 to $54,999 | 235 (5.1%) | 172 (3.5%) |
| $55,000 to $64,999 | 359 (7.8%) | 391 (7.9%) |
| $65,000 to $74,999 | 330 (7.2%) | 264 (5.3%) |
| $75,000 to $99,999 | 276 (6.0%) | 171 (3.5%) |
| $100,000+ | 178 (3.9%) | 149 (3.0%) |
| Total | 4,603 (100.0%) | 4,952 (100.0%) |
Earnings by Sex by Educational Attainment in Bayonet Point
Average earnings in Bayonet Point are $42,470 for men and $33,993 for women, a difference of 20.0%. Men with an educational attainment of graduate degree enjoy the highest average annual earnings of $59,631, while those with high school diploma education earn the least with $34,971. Women with an educational attainment of graduate degree earn the most with the average annual earnings of $67,959, while those with less than high school education have the smallest earnings of $23,287.
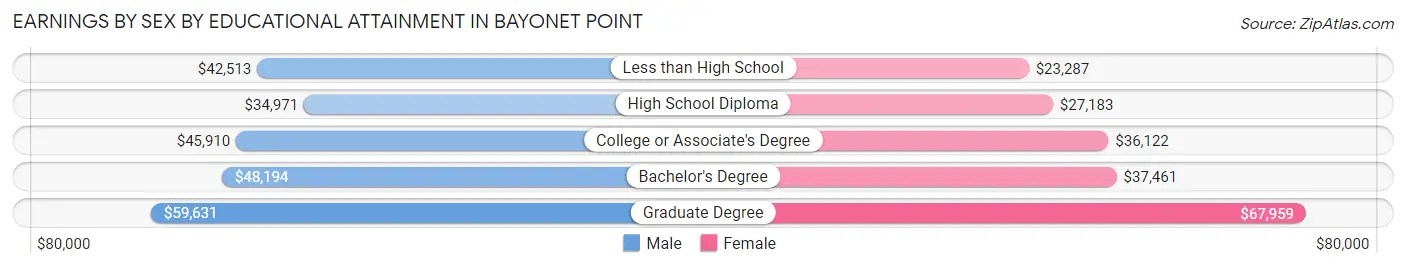
| Educational Attainment | Male Income | Female Income |
| Less than High School | $42,513 | $23,287 |
| High School Diploma | $34,971 | $27,183 |
| College or Associate's Degree | $45,910 | $36,122 |
| Bachelor's Degree | $48,194 | $37,461 |
| Graduate Degree | $59,631 | $67,959 |
| Total | $42,470 | $33,993 |
Family Income in Bayonet Point
Family Income Brackets in Bayonet Point
According to the Bayonet Point family income data, there are 1,496 families falling into the $50,000 to $74,999 income range, which is the most common income bracket and makes up 24.6% of all families. Conversely, the $10,000 to $14,999 income bracket is the least frequent group with only 67 families (1.1%) belonging to this category.
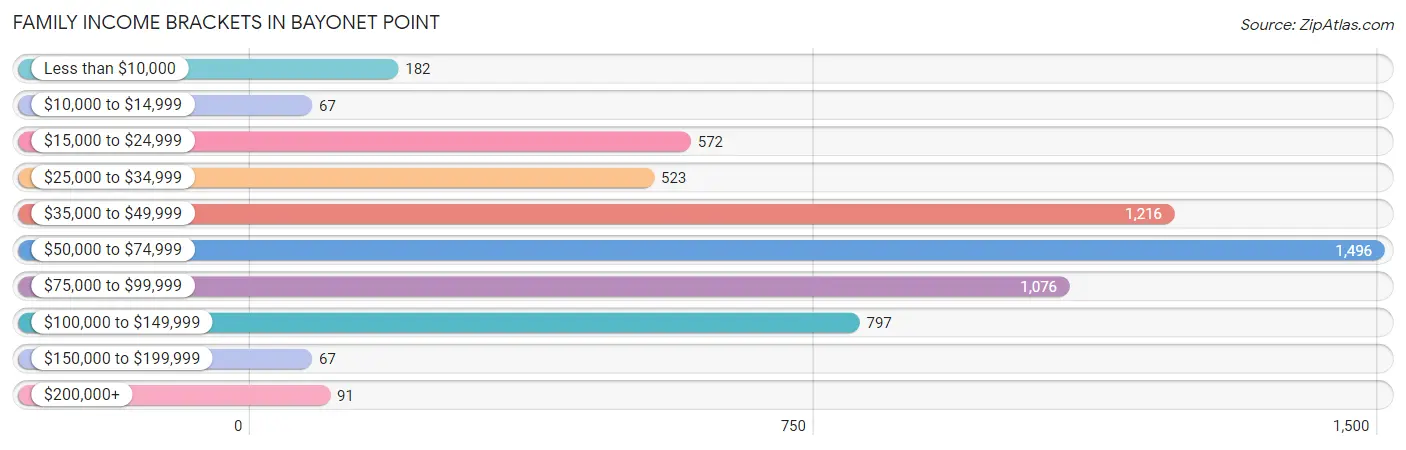
| Income Bracket | # Families | % Families |
| Less than $10,000 | 182 | 3.0% |
| $10,000 to $14,999 | 67 | 1.1% |
| $15,000 to $24,999 | 572 | 9.4% |
| $25,000 to $34,999 | 523 | 8.6% |
| $35,000 to $49,999 | 1,216 | 20.0% |
| $50,000 to $74,999 | 1,496 | 24.6% |
| $75,000 to $99,999 | 1,076 | 17.7% |
| $100,000 to $149,999 | 797 | 13.1% |
| $150,000 to $199,999 | 67 | 1.1% |
| $200,000+ | 91 | 1.5% |
Family Income by Famaliy Size in Bayonet Point
6-person families (75 | 1.2%) account for the highest median family income in Bayonet Point with $95,662 per family, while 2-person families (3,806 | 62.6%) have the highest median income of $27,336 per family member.
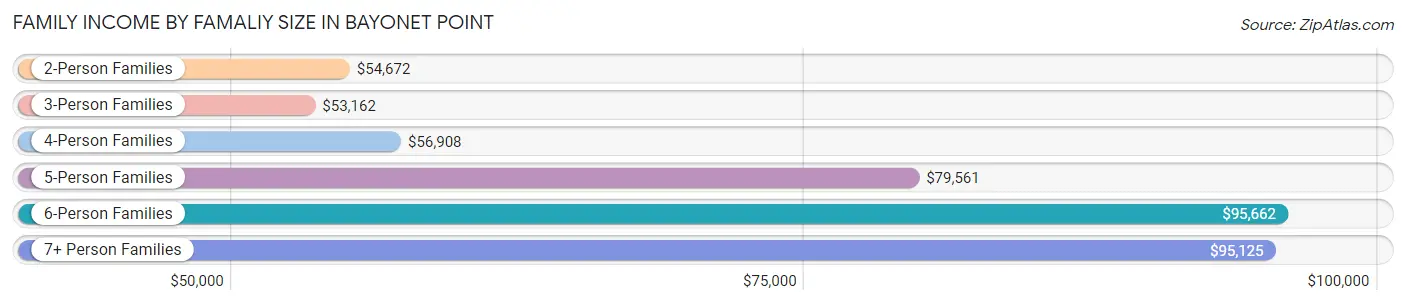
| Income Bracket | # Families | Median Income |
| 2-Person Families | 3,806 (62.6%) | $54,672 |
| 3-Person Families | 1,187 (19.5%) | $53,162 |
| 4-Person Families | 676 (11.1%) | $56,908 |
| 5-Person Families | 242 (4.0%) | $79,561 |
| 6-Person Families | 75 (1.2%) | $95,662 |
| 7+ Person Families | 95 (1.6%) | $95,125 |
| Total | 6,081 (100.0%) | $55,408 |
Family Income by Number of Earners in Bayonet Point
The median family income in Bayonet Point is $55,408, with families comprising 3+ earners (226) having the highest median family income of $107,850, while families with no earners (1,822) have the lowest median family income of $42,653, accounting for 3.7% and 30.0% of families, respectively.
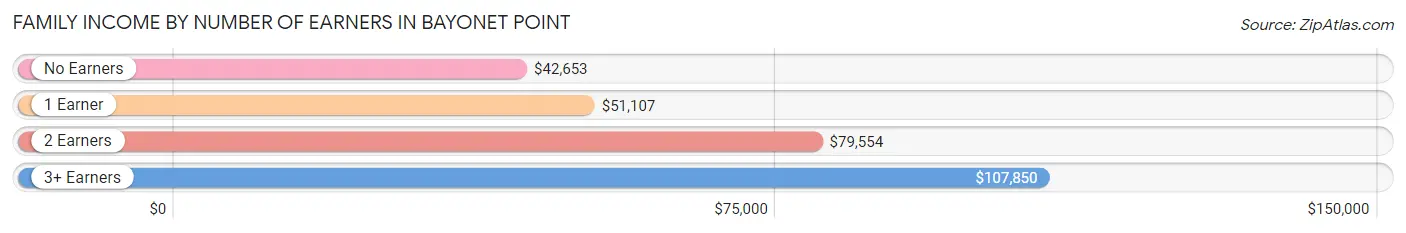
| Number of Earners | # Families | Median Income |
| No Earners | 1,822 (30.0%) | $42,653 |
| 1 Earner | 2,414 (39.7%) | $51,107 |
| 2 Earners | 1,619 (26.6%) | $79,554 |
| 3+ Earners | 226 (3.7%) | $107,850 |
| Total | 6,081 (100.0%) | $55,408 |
Household Income in Bayonet Point
Household Income Brackets in Bayonet Point
With 2,275 households falling in the category, the $50,000 to $74,999 income range is the most frequent in Bayonet Point, accounting for 19.5% of all households. In contrast, only 128 households (1.1%) fall into the $150,000 to $199,999 income bracket, making it the least populous group.
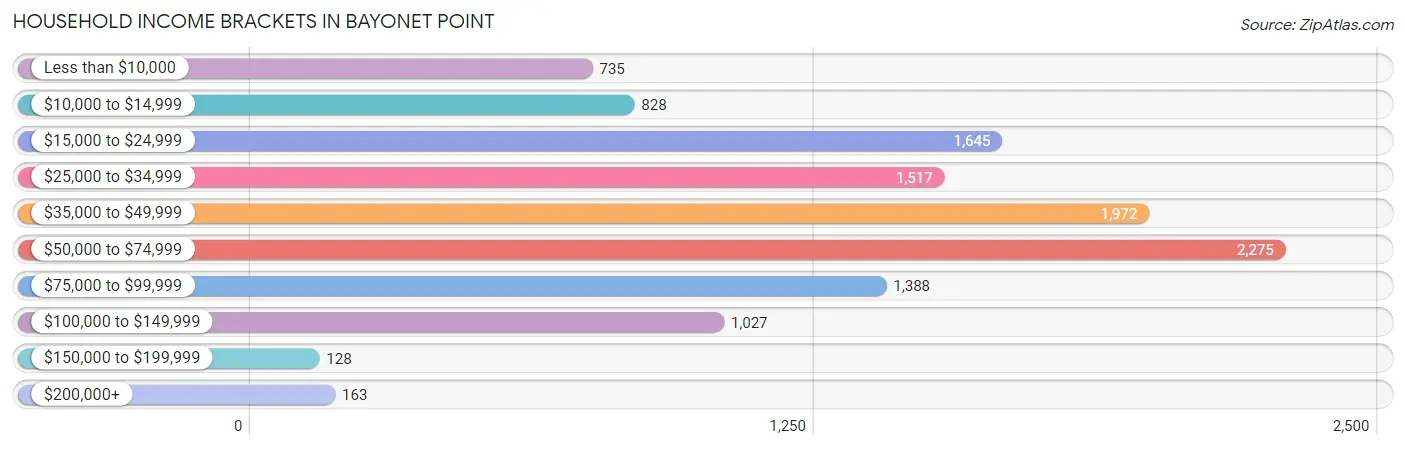
| Income Bracket | # Households | % Households |
| Less than $10,000 | 735 | 6.3% |
| $10,000 to $14,999 | 828 | 7.1% |
| $15,000 to $24,999 | 1,645 | 14.1% |
| $25,000 to $34,999 | 1,517 | 13.0% |
| $35,000 to $49,999 | 1,972 | 16.9% |
| $50,000 to $74,999 | 2,275 | 19.5% |
| $75,000 to $99,999 | 1,388 | 11.9% |
| $100,000 to $149,999 | 1,027 | 8.8% |
| $150,000 to $199,999 | 128 | 1.1% |
| $200,000+ | 163 | 1.4% |
Household Income by Householder Age in Bayonet Point
The median household income in Bayonet Point is $42,932, with the highest median household income of $53,849 found in the 25 to 44 years age bracket for the primary householder. A total of 2,678 households (23.0%) fall into this category. Meanwhile, the 65+ years age bracket for the primary householder has the lowest median household income of $34,301, with 5,210 households (44.7%) in this group.
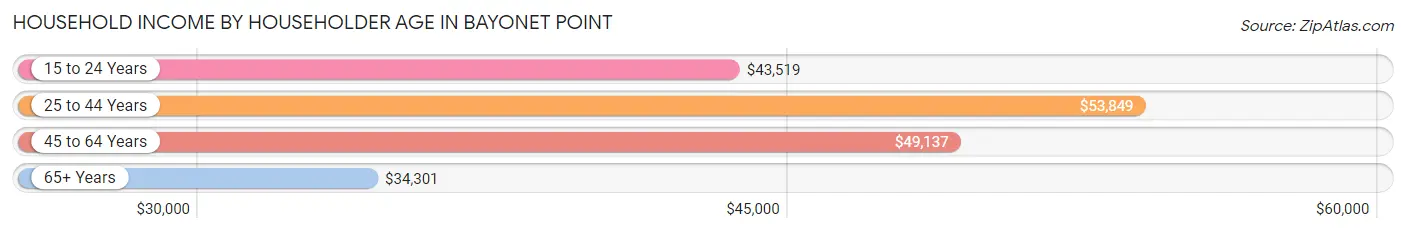
| Income Bracket | # Households | Median Income |
| 15 to 24 Years | 247 (2.1%) | $43,519 |
| 25 to 44 Years | 2,678 (23.0%) | $53,849 |
| 45 to 64 Years | 3,533 (30.3%) | $49,137 |
| 65+ Years | 5,210 (44.7%) | $34,301 |
| Total | 11,668 (100.0%) | $42,932 |
Poverty in Bayonet Point
Income Below Poverty by Sex and Age in Bayonet Point
With 13.3% poverty level for males and 21.6% for females among the residents of Bayonet Point, 15 year old males and 12 to 14 year old females are the most vulnerable to poverty, with 30 males (100.0%) and 177 females (56.7%) in their respective age groups living below the poverty level.
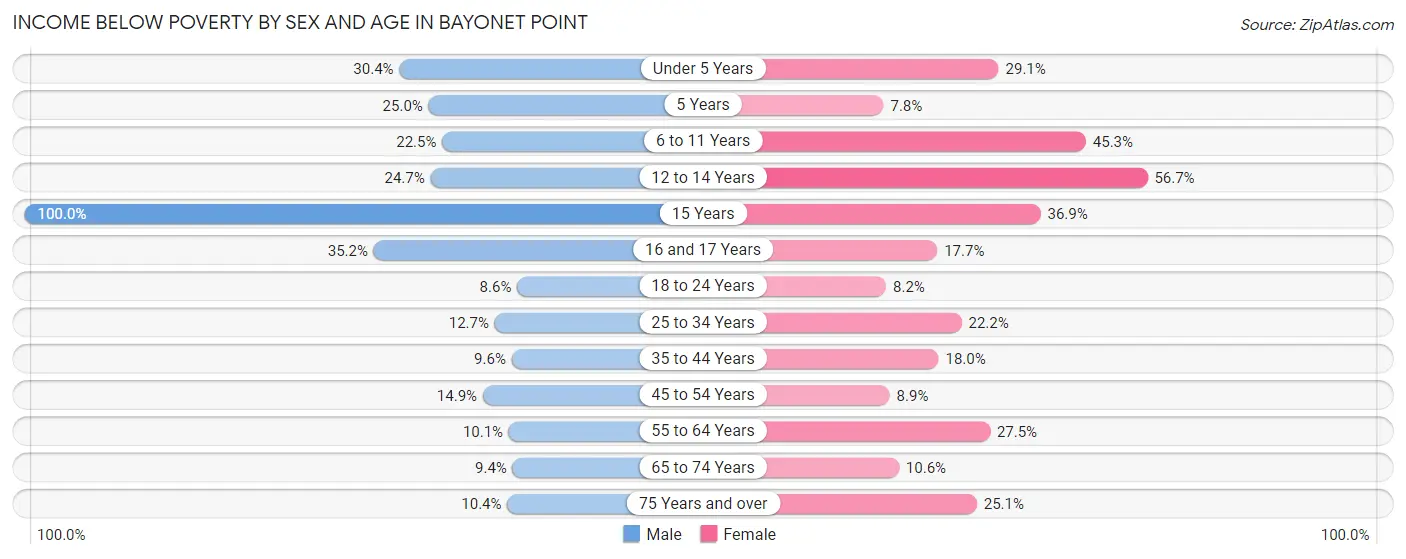
| Age Bracket | Male | Female |
| Under 5 Years | 119 (30.4%) | 115 (29.1%) |
| 5 Years | 15 (25.0%) | 10 (7.7%) |
| 6 to 11 Years | 140 (22.5%) | 414 (45.3%) |
| 12 to 14 Years | 89 (24.6%) | 177 (56.7%) |
| 15 Years | 30 (100.0%) | 76 (36.9%) |
| 16 and 17 Years | 76 (35.2%) | 67 (17.7%) |
| 18 to 24 Years | 45 (8.6%) | 49 (8.2%) |
| 25 to 34 Years | 166 (12.7%) | 299 (22.2%) |
| 35 to 44 Years | 122 (9.6%) | 215 (18.0%) |
| 45 to 54 Years | 123 (14.9%) | 149 (8.9%) |
| 55 to 64 Years | 179 (10.1%) | 566 (27.5%) |
| 65 to 74 Years | 155 (9.4%) | 206 (10.6%) |
| 75 Years and over | 201 (10.4%) | 510 (25.1%) |
| Total | 1,460 (13.3%) | 2,853 (21.6%) |
Income Above Poverty by Sex and Age in Bayonet Point
According to the poverty statistics in Bayonet Point, males aged 18 to 24 years and females aged 5 years are the age groups that are most secure financially, with 91.4% of males and 92.2% of females in these age groups living above the poverty line.
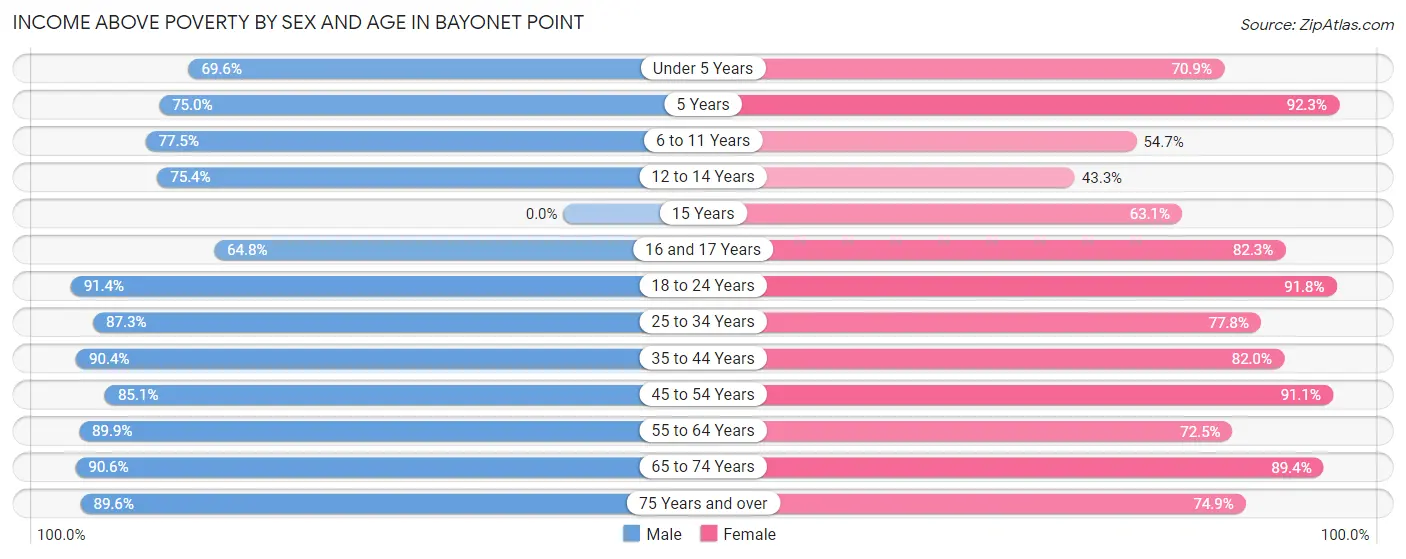
| Age Bracket | Male | Female |
| Under 5 Years | 272 (69.6%) | 280 (70.9%) |
| 5 Years | 45 (75.0%) | 119 (92.2%) |
| 6 to 11 Years | 483 (77.5%) | 500 (54.7%) |
| 12 to 14 Years | 272 (75.3%) | 135 (43.3%) |
| 15 Years | 0 (0.0%) | 130 (63.1%) |
| 16 and 17 Years | 140 (64.8%) | 311 (82.3%) |
| 18 to 24 Years | 481 (91.4%) | 547 (91.8%) |
| 25 to 34 Years | 1,138 (87.3%) | 1,046 (77.8%) |
| 35 to 44 Years | 1,152 (90.4%) | 982 (82.0%) |
| 45 to 54 Years | 701 (85.1%) | 1,529 (91.1%) |
| 55 to 64 Years | 1,594 (89.9%) | 1,492 (72.5%) |
| 65 to 74 Years | 1,492 (90.6%) | 1,737 (89.4%) |
| 75 Years and over | 1,734 (89.6%) | 1,525 (74.9%) |
| Total | 9,504 (86.7%) | 10,333 (78.4%) |
Income Below Poverty Among Married-Couple Families in Bayonet Point
The poverty statistics for married-couple families in Bayonet Point show that 9.1% or 372 of the total 4,103 families live below the poverty line. Families with 5 or more children have the highest poverty rate of 66.7%, comprising of 20 families. On the other hand, families with no children have the lowest poverty rate of 4.2%, which includes 133 families.
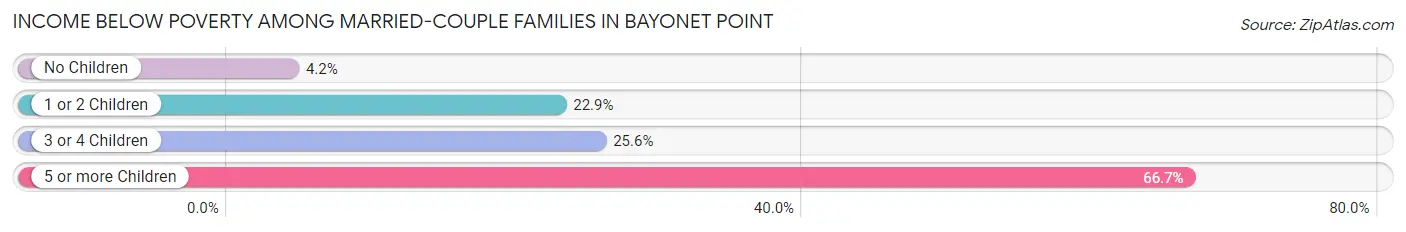
| Children | Above Poverty | Below Poverty |
| No Children | 3,001 (95.8%) | 133 (4.2%) |
| 1 or 2 Children | 604 (77.1%) | 179 (22.9%) |
| 3 or 4 Children | 116 (74.4%) | 40 (25.6%) |
| 5 or more Children | 10 (33.3%) | 20 (66.7%) |
| Total | 3,731 (90.9%) | 372 (9.1%) |
Income Below Poverty Among Single-Parent Households in Bayonet Point
According to the poverty data in Bayonet Point, 0.6% or 3 single-father households and 22.6% or 335 single-mother households are living below the poverty line. Among single-father households, those with 1 or 2 children have the highest poverty rate, with 3 households (1.2%) experiencing poverty. Likewise, among single-mother households, those with 3 or 4 children have the highest poverty rate, with 146 households (61.6%) falling below the poverty line.
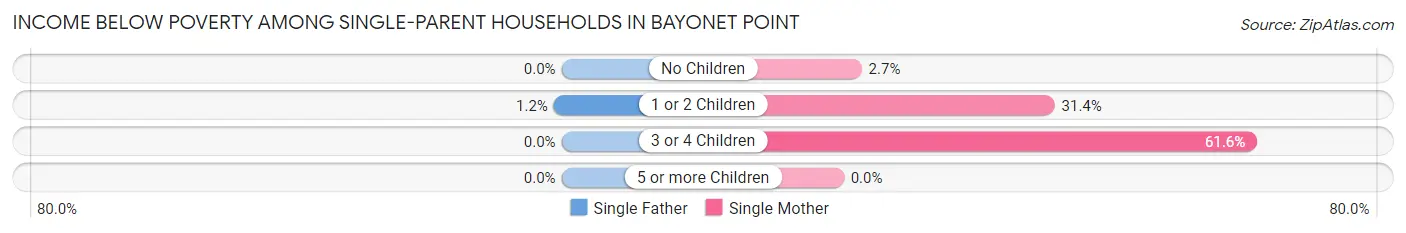
| Children | Single Father | Single Mother |
| No Children | 0 (0.0%) | 18 (2.7%) |
| 1 or 2 Children | 3 (1.2%) | 171 (31.4%) |
| 3 or 4 Children | 0 (0.0%) | 146 (61.6%) |
| 5 or more Children | 0 (0.0%) | 0 (0.0%) |
| Total | 3 (0.6%) | 335 (22.6%) |
Income Below Poverty Among Married-Couple vs Single-Parent Households in Bayonet Point
The poverty data for Bayonet Point shows that 372 of the married-couple family households (9.1%) and 338 of the single-parent households (17.1%) are living below the poverty level. Within the married-couple family households, those with 5 or more children have the highest poverty rate, with 20 households (66.7%) falling below the poverty line. Among the single-parent households, those with 3 or 4 children have the highest poverty rate, with 146 household (61.6%) living below poverty.
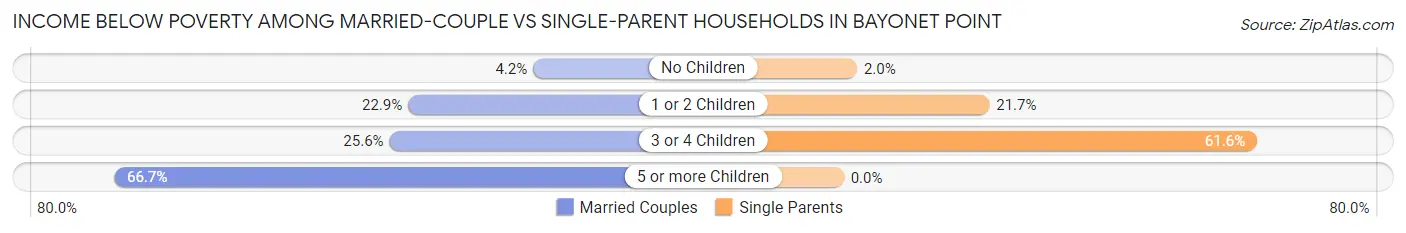
| Children | Married-Couple Families | Single-Parent Households |
| No Children | 133 (4.2%) | 18 (2.0%) |
| 1 or 2 Children | 179 (22.9%) | 174 (21.7%) |
| 3 or 4 Children | 40 (25.6%) | 146 (61.6%) |
| 5 or more Children | 20 (66.7%) | 0 (0.0%) |
| Total | 372 (9.1%) | 338 (17.1%) |
Employment Characteristics in Bayonet Point
Employment by Class of Employer in Bayonet Point
Among the 8,788 employed individuals in Bayonet Point, private company employees (6,591 | 75.0%), local government employees (676 | 7.7%), and not-for-profit organizations (583 | 6.6%) make up the most common classes of employment.
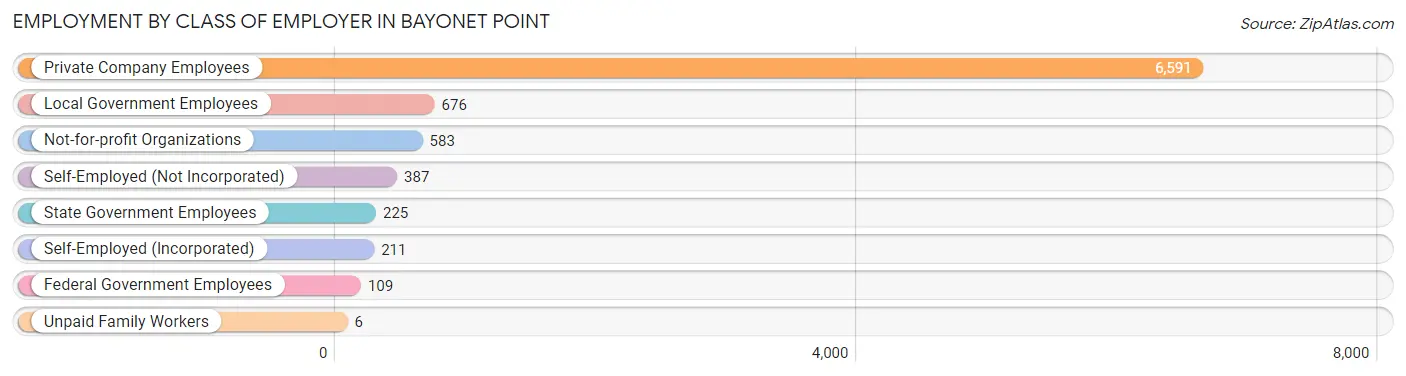
| Employer Class | # Employees | % Employees |
| Private Company Employees | 6,591 | 75.0% |
| Self-Employed (Incorporated) | 211 | 2.4% |
| Self-Employed (Not Incorporated) | 387 | 4.4% |
| Not-for-profit Organizations | 583 | 6.6% |
| Local Government Employees | 676 | 7.7% |
| State Government Employees | 225 | 2.6% |
| Federal Government Employees | 109 | 1.2% |
| Unpaid Family Workers | 6 | 0.1% |
| Total | 8,788 | 100.0% |
Employment Status by Age in Bayonet Point
According to the labor force statistics for Bayonet Point, out of the total population over 16 years of age (21,100), 45.6% or 9,622 individuals are in the labor force, with 7.5% or 722 of them unemployed. The age group with the highest labor force participation rate is 20 to 24 years, with 89.6% or 785 individuals in the labor force. Within the labor force, the 55 to 59 years age range has the highest percentage of unemployed individuals, with 19.5% or 241 of them being unemployed.
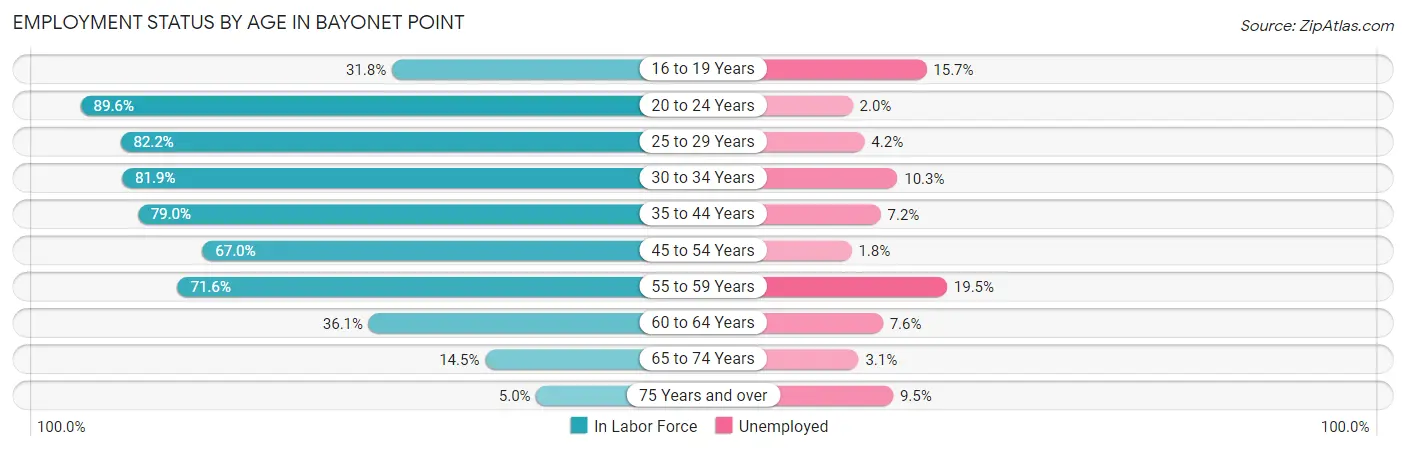
| Age Bracket | In Labor Force | Unemployed |
| 16 to 19 Years | 267 (31.8%) | 42 (15.7%) |
| 20 to 24 Years | 785 (89.6%) | 16 (2.0%) |
| 25 to 29 Years | 1,072 (82.2%) | 45 (4.2%) |
| 30 to 34 Years | 1,102 (81.9%) | 114 (10.3%) |
| 35 to 44 Years | 1,958 (79.0%) | 141 (7.2%) |
| 45 to 54 Years | 1,679 (67.0%) | 30 (1.8%) |
| 55 to 59 Years | 1,238 (71.6%) | 241 (19.5%) |
| 60 to 64 Years | 766 (36.1%) | 58 (7.6%) |
| 65 to 74 Years | 539 (14.5%) | 17 (3.1%) |
| 75 Years and over | 209 (5.0%) | 20 (9.5%) |
| Total | 9,622 (45.6%) | 722 (7.5%) |
Employment Status by Educational Attainment in Bayonet Point
According to labor force statistics for Bayonet Point, 68.0% of individuals (7,810) out of the total population between 25 and 64 years of age (11,485) are in the labor force, with 8.0% or 625 of them being unemployed. The group with the highest labor force participation rate are those with the educational attainment of bachelor's degree or higher, with 76.7% or 1,411 individuals in the labor force. Within the labor force, individuals with less than high school education have the highest percentage of unemployment, with 17.2% or 163 of them being unemployed.
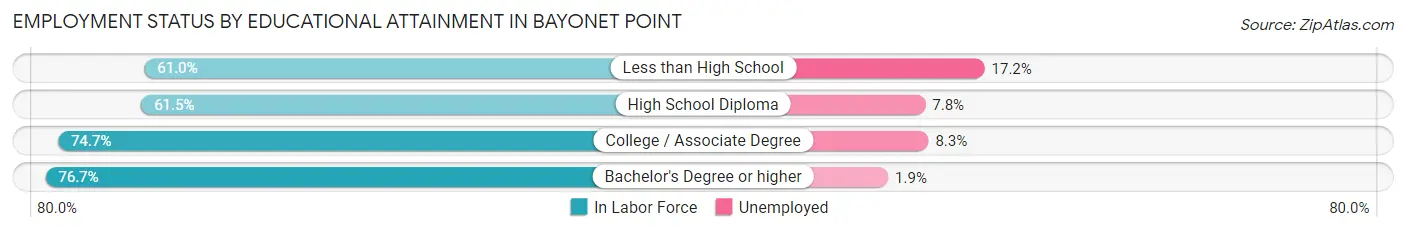
| Educational Attainment | In Labor Force | Unemployed |
| Less than High School | 950 (61.0%) | 268 (17.2%) |
| High School Diploma | 2,739 (61.5%) | 347 (7.8%) |
| College / Associate Degree | 2,715 (74.7%) | 302 (8.3%) |
| Bachelor's Degree or higher | 1,411 (76.7%) | 35 (1.9%) |
| Total | 7,810 (68.0%) | 919 (8.0%) |
Employment Occupations by Sex in Bayonet Point
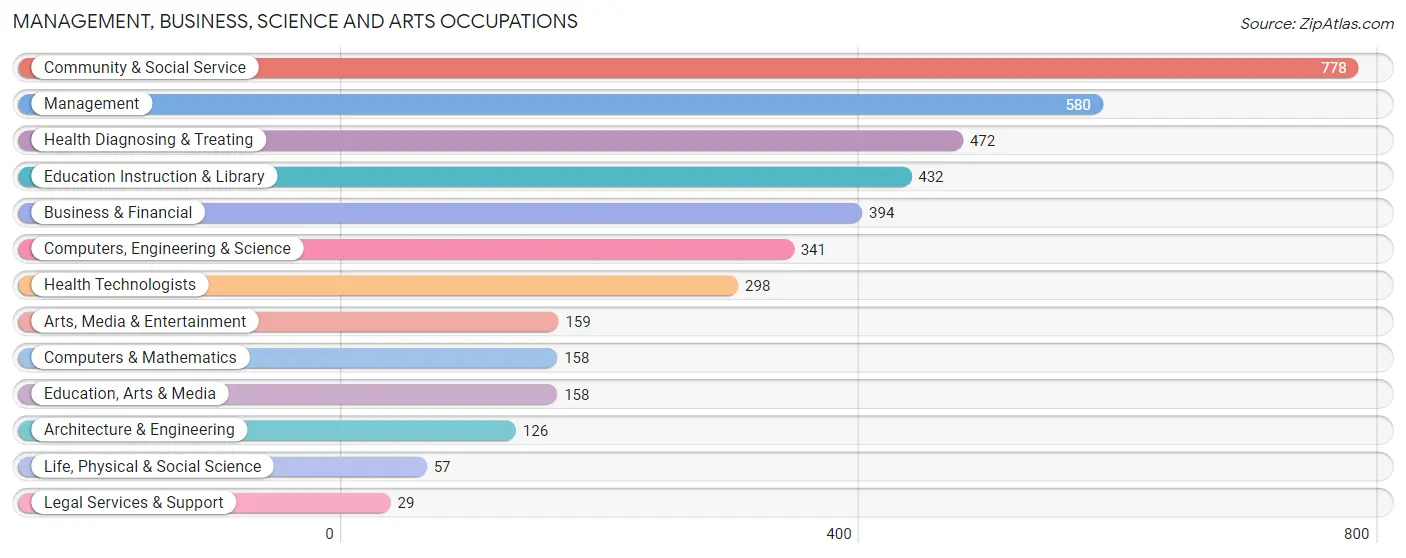
Management, Business, Science and Arts Occupations
The most common Management, Business, Science and Arts occupations in Bayonet Point are Community & Social Service (778 | 8.7%), Management (580 | 6.5%), Health Diagnosing & Treating (472 | 5.3%), Education Instruction & Library (432 | 4.9%), and Business & Financial (394 | 4.4%).
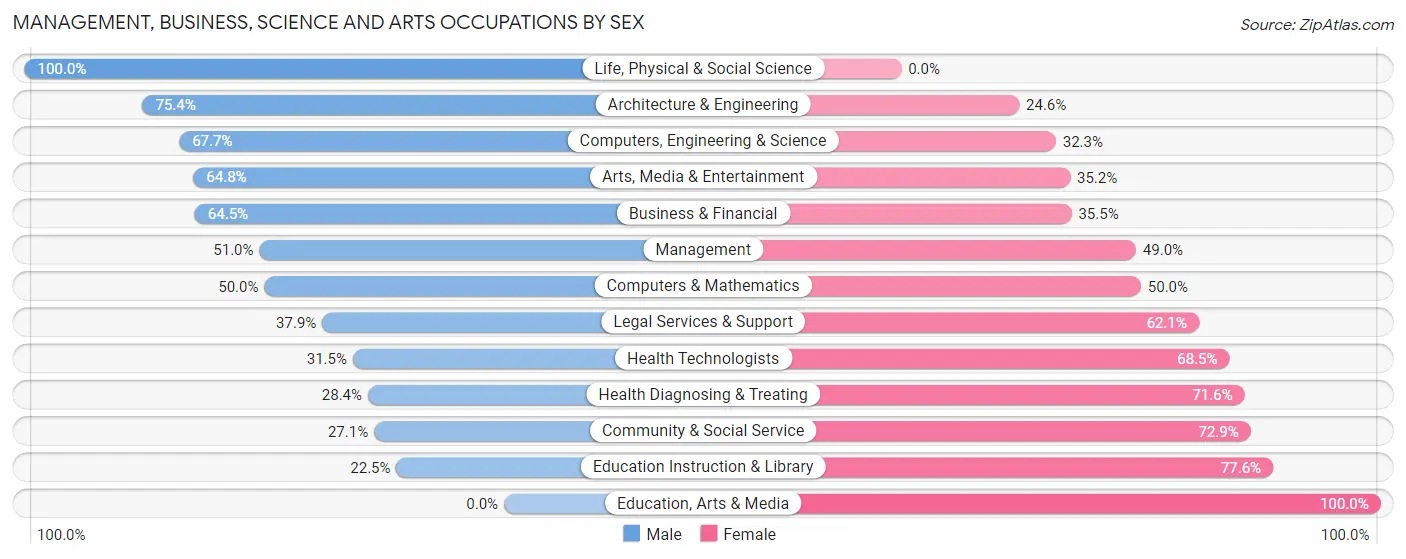
Management, Business, Science and Arts Occupations by Sex
Within the Management, Business, Science and Arts occupations in Bayonet Point, the most male-oriented occupations are Life, Physical & Social Science (100.0%), Architecture & Engineering (75.4%), and Computers, Engineering & Science (67.7%), while the most female-oriented occupations are Education, Arts & Media (100.0%), Education Instruction & Library (77.5%), and Community & Social Service (72.9%).
| Occupation | Male | Female |
| Management | 296 (51.0%) | 284 (49.0%) |
| Business & Financial | 254 (64.5%) | 140 (35.5%) |
| Computers, Engineering & Science | 231 (67.7%) | 110 (32.3%) |
| Computers & Mathematics | 79 (50.0%) | 79 (50.0%) |
| Architecture & Engineering | 95 (75.4%) | 31 (24.6%) |
| Life, Physical & Social Science | 57 (100.0%) | 0 (0.0%) |
| Community & Social Service | 211 (27.1%) | 567 (72.9%) |
| Education, Arts & Media | 0 (0.0%) | 158 (100.0%) |
| Legal Services & Support | 11 (37.9%) | 18 (62.1%) |
| Education Instruction & Library | 97 (22.5%) | 335 (77.5%) |
| Arts, Media & Entertainment | 103 (64.8%) | 56 (35.2%) |
| Health Diagnosing & Treating | 134 (28.4%) | 338 (71.6%) |
| Health Technologists | 94 (31.5%) | 204 (68.5%) |
| Total (Category) | 1,126 (43.9%) | 1,439 (56.1%) |
| Total (Overall) | 4,256 (47.8%) | 4,638 (52.1%) |
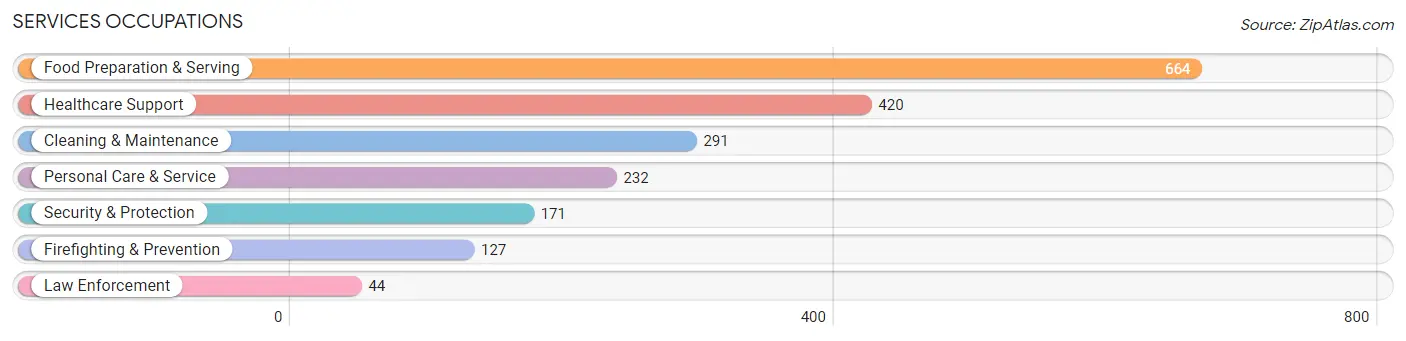
Services Occupations
The most common Services occupations in Bayonet Point are Food Preparation & Serving (664 | 7.5%), Healthcare Support (420 | 4.7%), Cleaning & Maintenance (291 | 3.3%), Personal Care & Service (232 | 2.6%), and Security & Protection (171 | 1.9%).
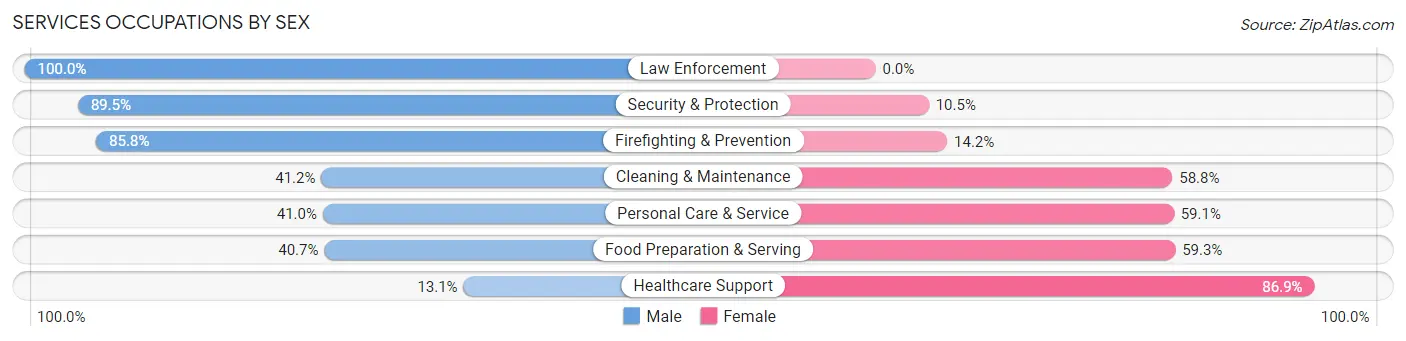
Services Occupations by Sex
Within the Services occupations in Bayonet Point, the most male-oriented occupations are Law Enforcement (100.0%), Security & Protection (89.5%), and Firefighting & Prevention (85.8%), while the most female-oriented occupations are Healthcare Support (86.9%), Food Preparation & Serving (59.3%), and Personal Care & Service (59.1%).
| Occupation | Male | Female |
| Healthcare Support | 55 (13.1%) | 365 (86.9%) |
| Security & Protection | 153 (89.5%) | 18 (10.5%) |
| Firefighting & Prevention | 109 (85.8%) | 18 (14.2%) |
| Law Enforcement | 44 (100.0%) | 0 (0.0%) |
| Food Preparation & Serving | 270 (40.7%) | 394 (59.3%) |
| Cleaning & Maintenance | 120 (41.2%) | 171 (58.8%) |
| Personal Care & Service | 95 (40.9%) | 137 (59.1%) |
| Total (Category) | 693 (39.0%) | 1,085 (61.0%) |
| Total (Overall) | 4,256 (47.8%) | 4,638 (52.1%) |
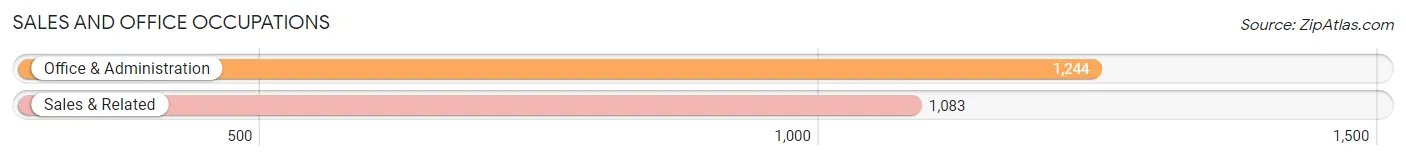
Sales and Office Occupations
The most common Sales and Office occupations in Bayonet Point are Office & Administration (1,244 | 14.0%), and Sales & Related (1,083 | 12.2%).
Sales and Office Occupations by Sex
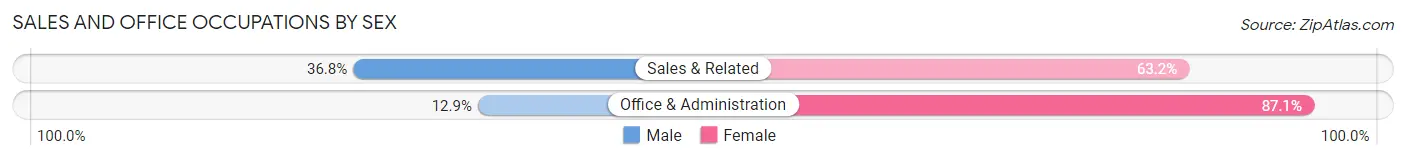
| Occupation | Male | Female |
| Sales & Related | 399 (36.8%) | 684 (63.2%) |
| Office & Administration | 160 (12.9%) | 1,084 (87.1%) |
| Total (Category) | 559 (24.0%) | 1,768 (76.0%) |
| Total (Overall) | 4,256 (47.8%) | 4,638 (52.1%) |
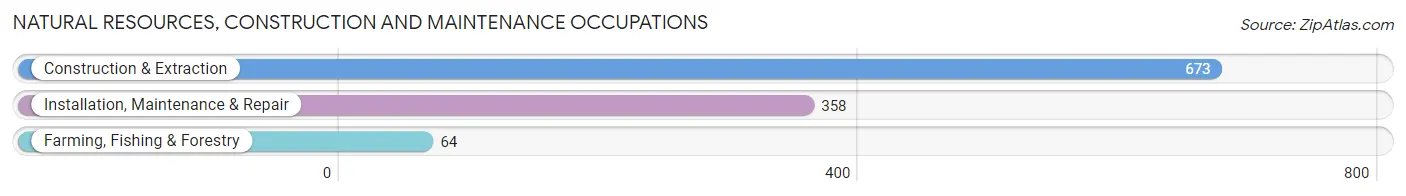
Natural Resources, Construction and Maintenance Occupations
The most common Natural Resources, Construction and Maintenance occupations in Bayonet Point are Construction & Extraction (673 | 7.6%), Installation, Maintenance & Repair (358 | 4.0%), and Farming, Fishing & Forestry (64 | 0.7%).
Natural Resources, Construction and Maintenance Occupations by Sex
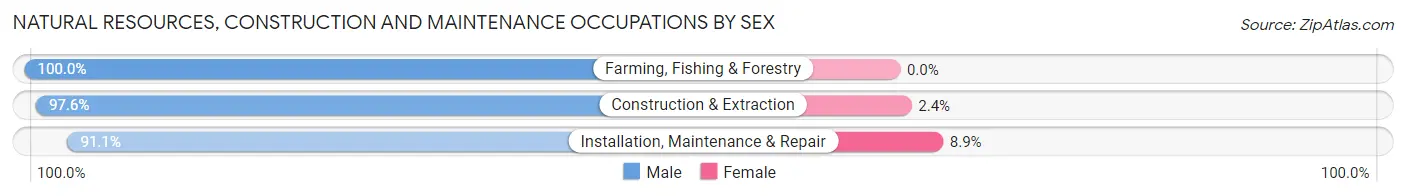
| Occupation | Male | Female |
| Farming, Fishing & Forestry | 64 (100.0%) | 0 (0.0%) |
| Construction & Extraction | 657 (97.6%) | 16 (2.4%) |
| Installation, Maintenance & Repair | 326 (91.1%) | 32 (8.9%) |
| Total (Category) | 1,047 (95.6%) | 48 (4.4%) |
| Total (Overall) | 4,256 (47.8%) | 4,638 (52.1%) |
Production, Transportation and Moving Occupations
The most common Production, Transportation and Moving occupations in Bayonet Point are Material Moving (477 | 5.4%), Transportation (408 | 4.6%), and Production (244 | 2.7%).
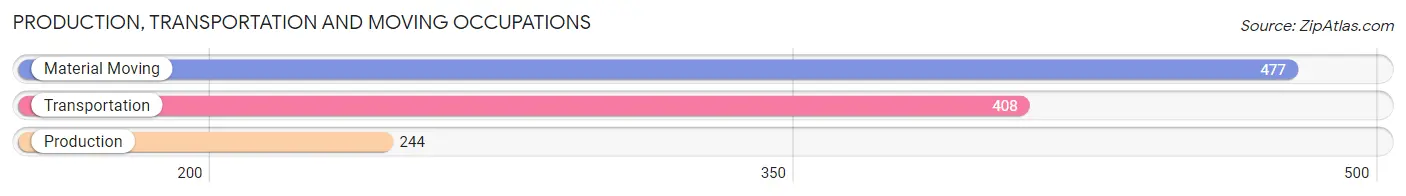
Production, Transportation and Moving Occupations by Sex

| Occupation | Male | Female |
| Production | 138 (56.6%) | 106 (43.4%) |
| Transportation | 349 (85.5%) | 59 (14.5%) |
| Material Moving | 344 (72.1%) | 133 (27.9%) |
| Total (Category) | 831 (73.6%) | 298 (26.4%) |
| Total (Overall) | 4,256 (47.8%) | 4,638 (52.1%) |
Employment Industries by Sex in Bayonet Point
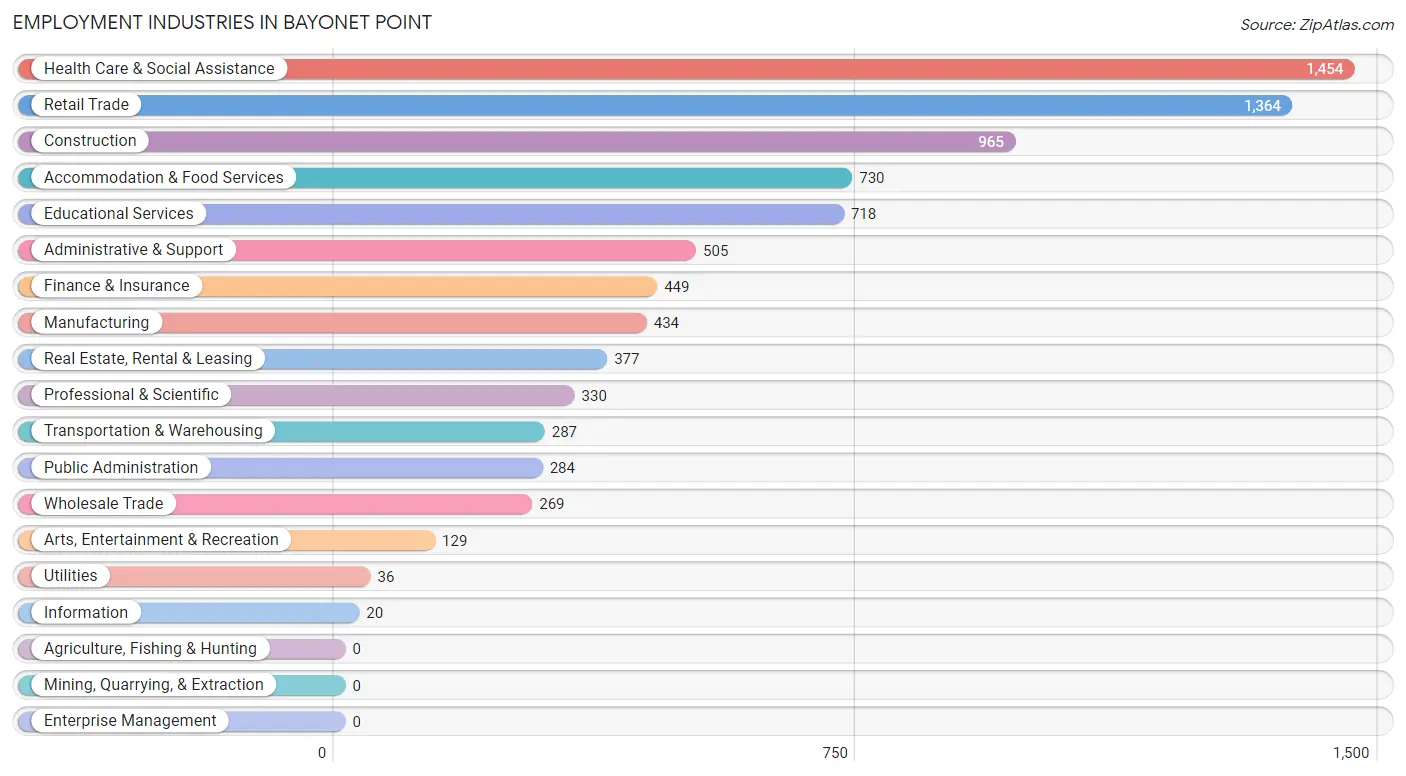
Employment Industries in Bayonet Point
The major employment industries in Bayonet Point include Health Care & Social Assistance (1,454 | 16.4%), Retail Trade (1,364 | 15.3%), Construction (965 | 10.8%), Accommodation & Food Services (730 | 8.2%), and Educational Services (718 | 8.1%).
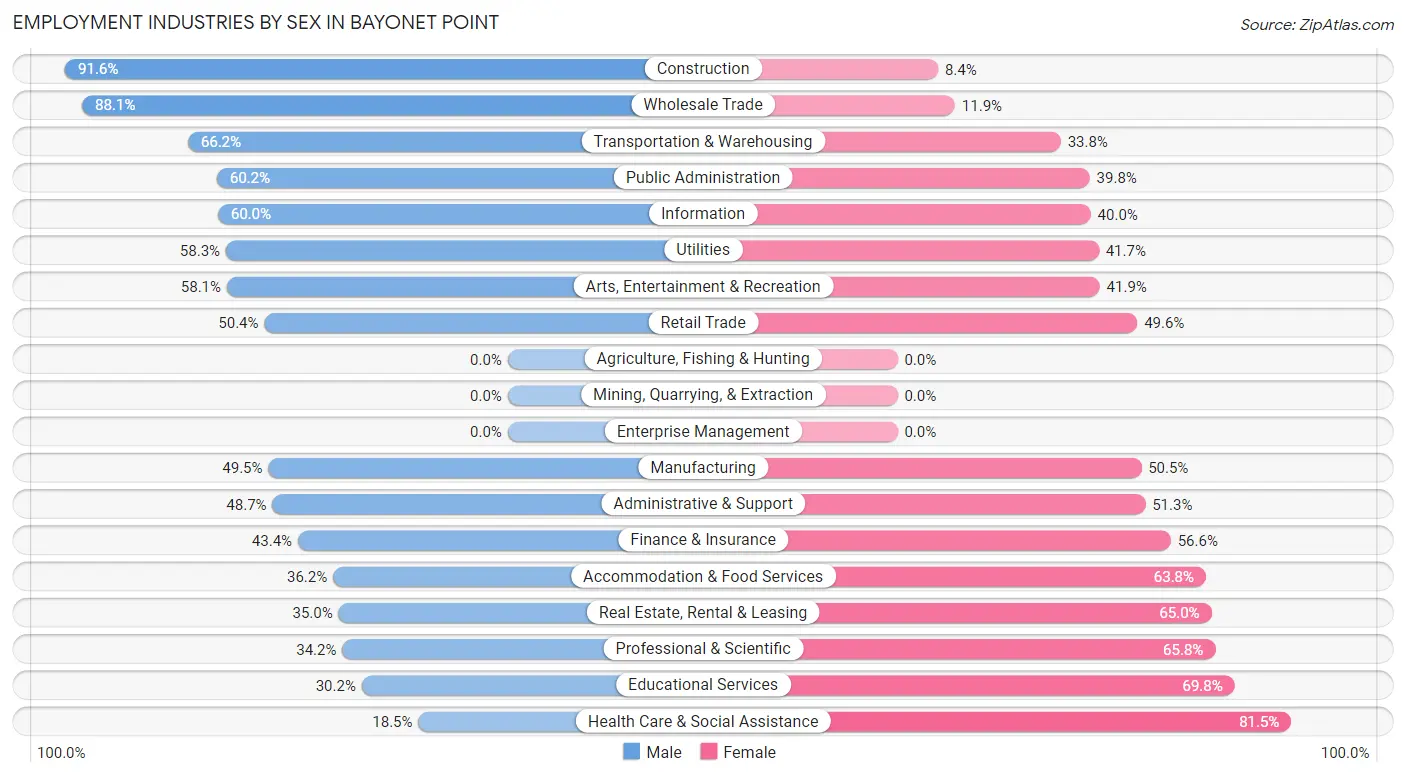
Employment Industries by Sex in Bayonet Point
The Bayonet Point industries that see more men than women are Construction (91.6%), Wholesale Trade (88.1%), and Transportation & Warehousing (66.2%), whereas the industries that tend to have a higher number of women are Health Care & Social Assistance (81.5%), Educational Services (69.8%), and Professional & Scientific (65.8%).
| Industry | Male | Female |
| Agriculture, Fishing & Hunting | 0 (0.0%) | 0 (0.0%) |
| Mining, Quarrying, & Extraction | 0 (0.0%) | 0 (0.0%) |
| Construction | 884 (91.6%) | 81 (8.4%) |
| Manufacturing | 215 (49.5%) | 219 (50.5%) |
| Wholesale Trade | 237 (88.1%) | 32 (11.9%) |
| Retail Trade | 687 (50.4%) | 677 (49.6%) |
| Transportation & Warehousing | 190 (66.2%) | 97 (33.8%) |
| Utilities | 21 (58.3%) | 15 (41.7%) |
| Information | 12 (60.0%) | 8 (40.0%) |
| Finance & Insurance | 195 (43.4%) | 254 (56.6%) |
| Real Estate, Rental & Leasing | 132 (35.0%) | 245 (65.0%) |
| Professional & Scientific | 113 (34.2%) | 217 (65.8%) |
| Enterprise Management | 0 (0.0%) | 0 (0.0%) |
| Administrative & Support | 246 (48.7%) | 259 (51.3%) |
| Educational Services | 217 (30.2%) | 501 (69.8%) |
| Health Care & Social Assistance | 269 (18.5%) | 1,185 (81.5%) |
| Arts, Entertainment & Recreation | 75 (58.1%) | 54 (41.9%) |
| Accommodation & Food Services | 264 (36.2%) | 466 (63.8%) |
| Public Administration | 171 (60.2%) | 113 (39.8%) |
| Total | 4,256 (47.8%) | 4,638 (52.1%) |
Education in Bayonet Point
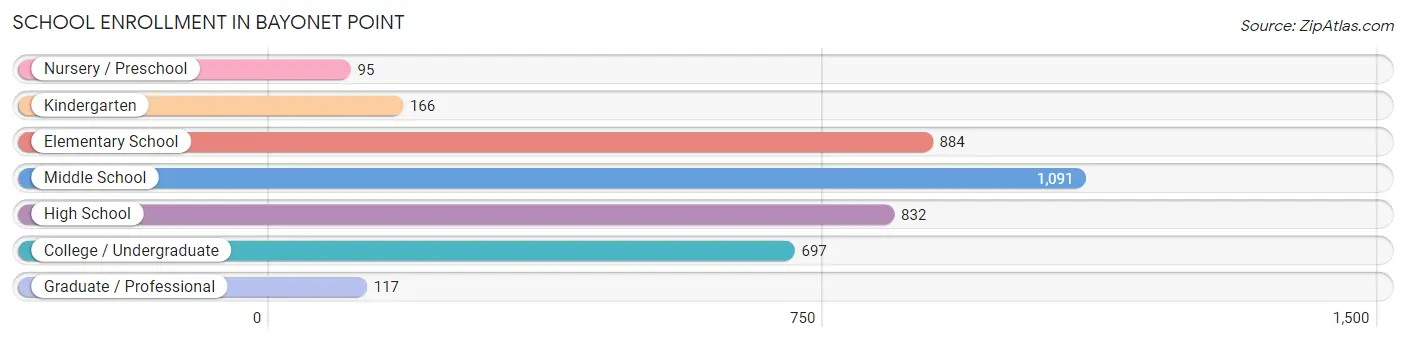
School Enrollment in Bayonet Point
The most common levels of schooling among the 3,882 students in Bayonet Point are middle school (1,091 | 28.1%), elementary school (884 | 22.8%), and high school (832 | 21.4%).
| School Level | # Students | % Students |
| Nursery / Preschool | 95 | 2.5% |
| Kindergarten | 166 | 4.3% |
| Elementary School | 884 | 22.8% |
| Middle School | 1,091 | 28.1% |
| High School | 832 | 21.4% |
| College / Undergraduate | 697 | 17.9% |
| Graduate / Professional | 117 | 3.0% |
| Total | 3,882 | 100.0% |
School Enrollment by Age by Funding Source in Bayonet Point
Out of a total of 3,882 students who are enrolled in schools in Bayonet Point, 1,118 (28.8%) attend a private institution, while the remaining 2,764 (71.2%) are enrolled in public schools. The age group of 35 years and over has the highest likelihood of being enrolled in private schools, with 118 (43.9% in the age bracket) enrolled. Conversely, the age group of 18 to 19 year olds has the lowest likelihood of being enrolled in a private school, with 201 (94.8% in the age bracket) attending a public institution.
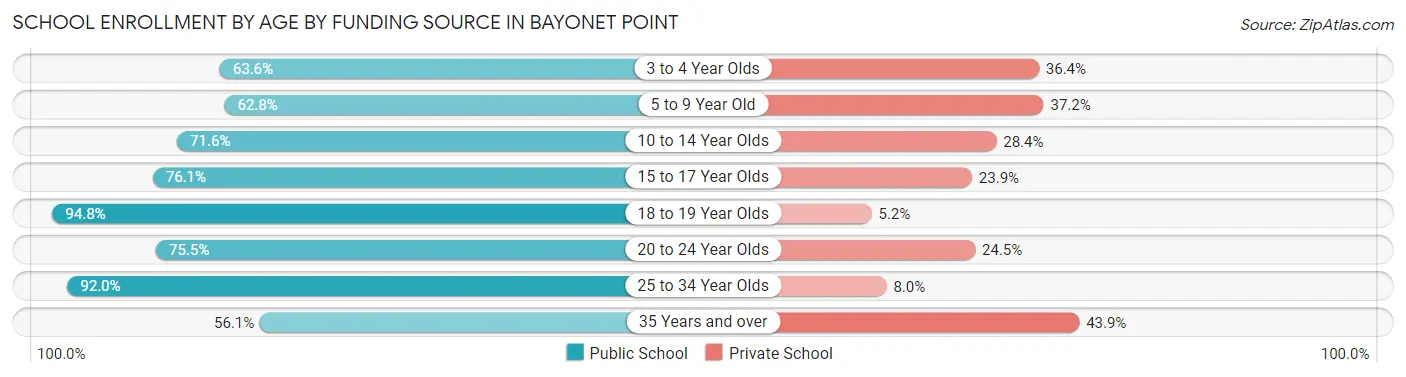
| Age Bracket | Public School | Private School |
| 3 to 4 Year Olds | 56 (63.6%) | 32 (36.4%) |
| 5 to 9 Year Old | 602 (62.8%) | 357 (37.2%) |
| 10 to 14 Year Olds | 932 (71.6%) | 370 (28.4%) |
| 15 to 17 Year Olds | 478 (76.1%) | 150 (23.9%) |
| 18 to 19 Year Olds | 201 (94.8%) | 11 (5.2%) |
| 20 to 24 Year Olds | 216 (75.5%) | 70 (24.5%) |
| 25 to 34 Year Olds | 127 (92.0%) | 11 (8.0%) |
| 35 Years and over | 151 (56.1%) | 118 (43.9%) |
| Total | 2,764 (71.2%) | 1,118 (28.8%) |
Educational Attainment by Field of Study in Bayonet Point
Business (739 | 25.0%), education (535 | 18.1%), social sciences (282 | 9.6%), science & technology (262 | 8.9%), and bio, nature & agricultural (193 | 6.5%) are the most common fields of study among 2,953 individuals in Bayonet Point who have obtained a bachelor's degree or higher.
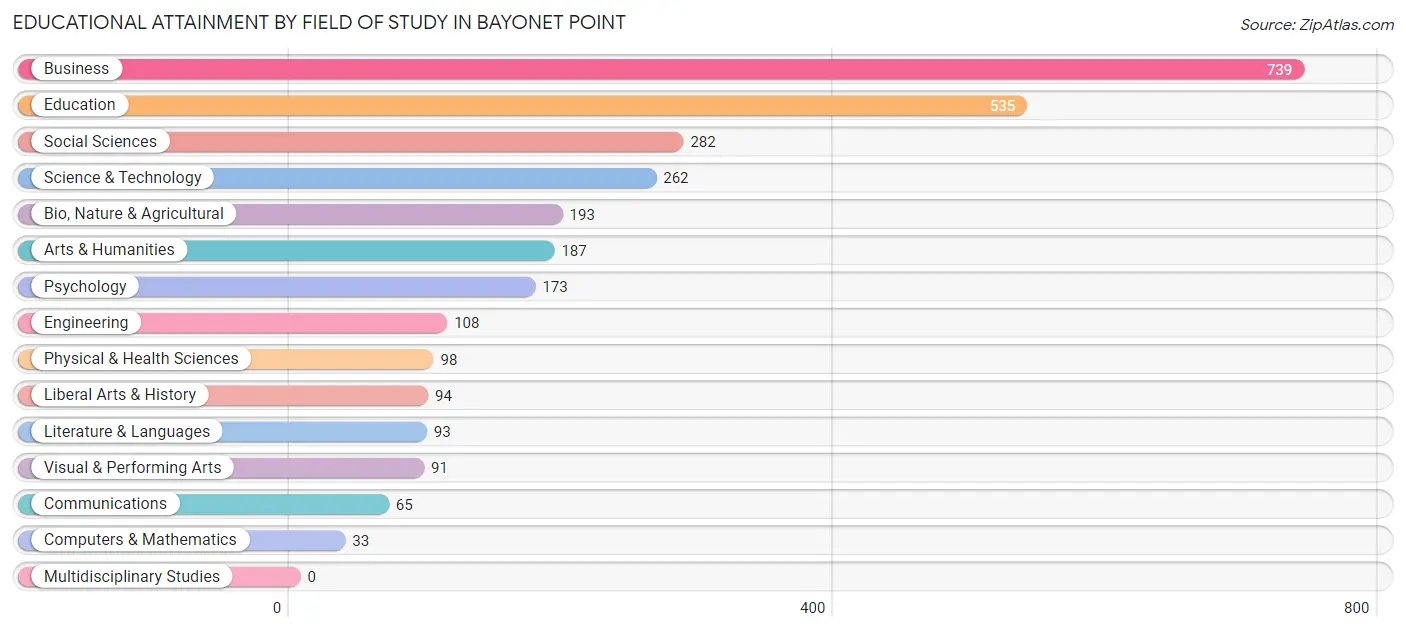
| Field of Study | # Graduates | % Graduates |
| Computers & Mathematics | 33 | 1.1% |
| Bio, Nature & Agricultural | 193 | 6.5% |
| Physical & Health Sciences | 98 | 3.3% |
| Psychology | 173 | 5.9% |
| Social Sciences | 282 | 9.6% |
| Engineering | 108 | 3.7% |
| Multidisciplinary Studies | 0 | 0.0% |
| Science & Technology | 262 | 8.9% |
| Business | 739 | 25.0% |
| Education | 535 | 18.1% |
| Literature & Languages | 93 | 3.2% |
| Liberal Arts & History | 94 | 3.2% |
| Visual & Performing Arts | 91 | 3.1% |
| Communications | 65 | 2.2% |
| Arts & Humanities | 187 | 6.3% |
| Total | 2,953 | 100.0% |
Transportation & Commute in Bayonet Point
Vehicle Availability by Sex in Bayonet Point
The most prevalent vehicle ownership categories in Bayonet Point are males with 2 vehicles (2,207, accounting for 53.1%) and females with 2 vehicles (2,148, making up 47.7%).
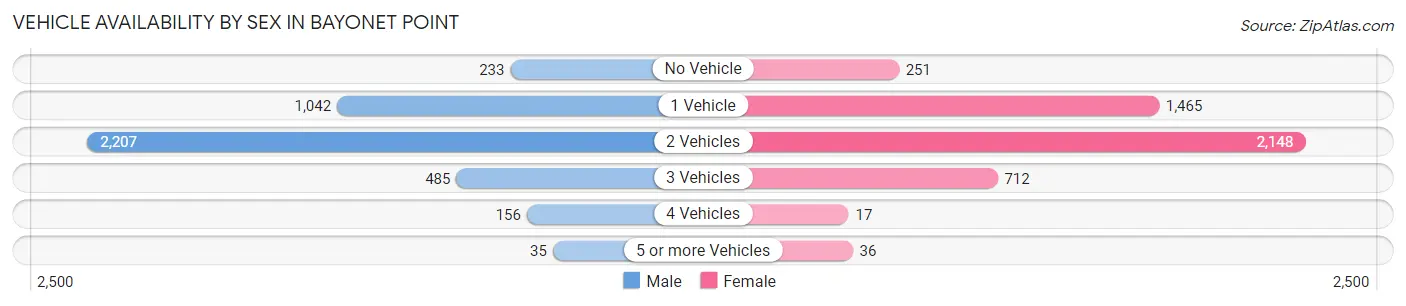
| Vehicles Available | Male | Female |
| No Vehicle | 233 (5.6%) | 251 (5.4%) |
| 1 Vehicle | 1,042 (25.1%) | 1,465 (31.7%) |
| 2 Vehicles | 2,207 (53.1%) | 2,148 (46.4%) |
| 3 Vehicles | 485 (11.7%) | 712 (15.4%) |
| 4 Vehicles | 156 (3.7%) | 17 (0.4%) |
| 5 or more Vehicles | 35 (0.8%) | 36 (0.8%) |
| Total | 4,158 (100.0%) | 4,629 (100.0%) |
Commute Time in Bayonet Point
The most frequently occuring commute durations in Bayonet Point are 10 to 14 minutes (1,419 commuters, 17.6%), 20 to 24 minutes (1,311 commuters, 16.3%), and 60 to 89 minutes (1,104 commuters, 13.7%).
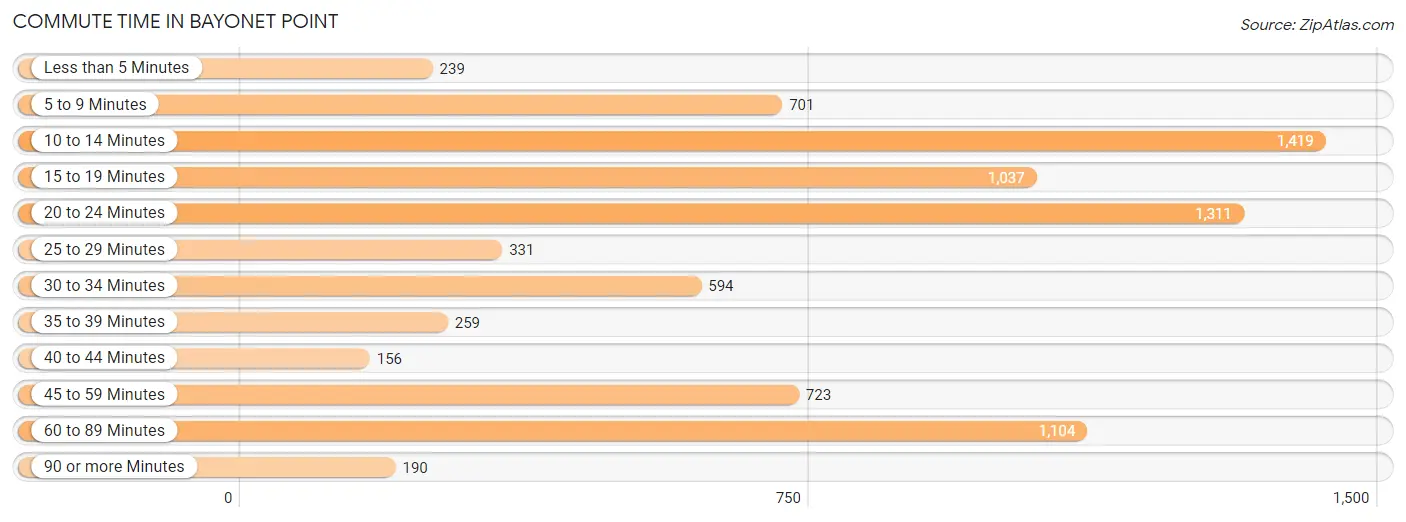
| Commute Time | # Commuters | % Commuters |
| Less than 5 Minutes | 239 | 3.0% |
| 5 to 9 Minutes | 701 | 8.7% |
| 10 to 14 Minutes | 1,419 | 17.6% |
| 15 to 19 Minutes | 1,037 | 12.9% |
| 20 to 24 Minutes | 1,311 | 16.3% |
| 25 to 29 Minutes | 331 | 4.1% |
| 30 to 34 Minutes | 594 | 7.4% |
| 35 to 39 Minutes | 259 | 3.2% |
| 40 to 44 Minutes | 156 | 1.9% |
| 45 to 59 Minutes | 723 | 9.0% |
| 60 to 89 Minutes | 1,104 | 13.7% |
| 90 or more Minutes | 190 | 2.4% |
Commute Time by Sex in Bayonet Point
The most common commute times in Bayonet Point are 10 to 14 minutes (710 commuters, 18.2%) for males and 20 to 24 minutes (857 commuters, 20.5%) for females.
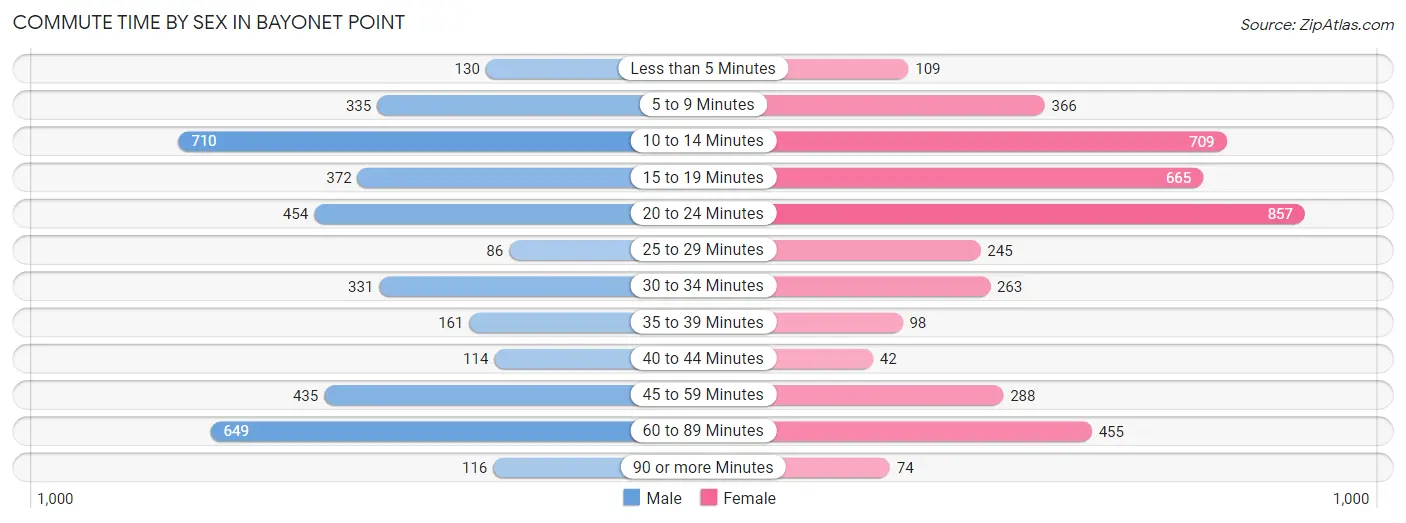
| Commute Time | Male | Female |
| Less than 5 Minutes | 130 (3.3%) | 109 (2.6%) |
| 5 to 9 Minutes | 335 (8.6%) | 366 (8.8%) |
| 10 to 14 Minutes | 710 (18.2%) | 709 (17.0%) |
| 15 to 19 Minutes | 372 (9.6%) | 665 (15.9%) |
| 20 to 24 Minutes | 454 (11.7%) | 857 (20.5%) |
| 25 to 29 Minutes | 86 (2.2%) | 245 (5.9%) |
| 30 to 34 Minutes | 331 (8.5%) | 263 (6.3%) |
| 35 to 39 Minutes | 161 (4.1%) | 98 (2.4%) |
| 40 to 44 Minutes | 114 (2.9%) | 42 (1.0%) |
| 45 to 59 Minutes | 435 (11.2%) | 288 (6.9%) |
| 60 to 89 Minutes | 649 (16.7%) | 455 (10.9%) |
| 90 or more Minutes | 116 (3.0%) | 74 (1.8%) |
Time of Departure to Work by Sex in Bayonet Point
The most frequent times of departure to work in Bayonet Point are 7:00 AM to 7:29 AM (744, 19.1%) for males and 7:00 AM to 7:29 AM (697, 16.7%) for females.
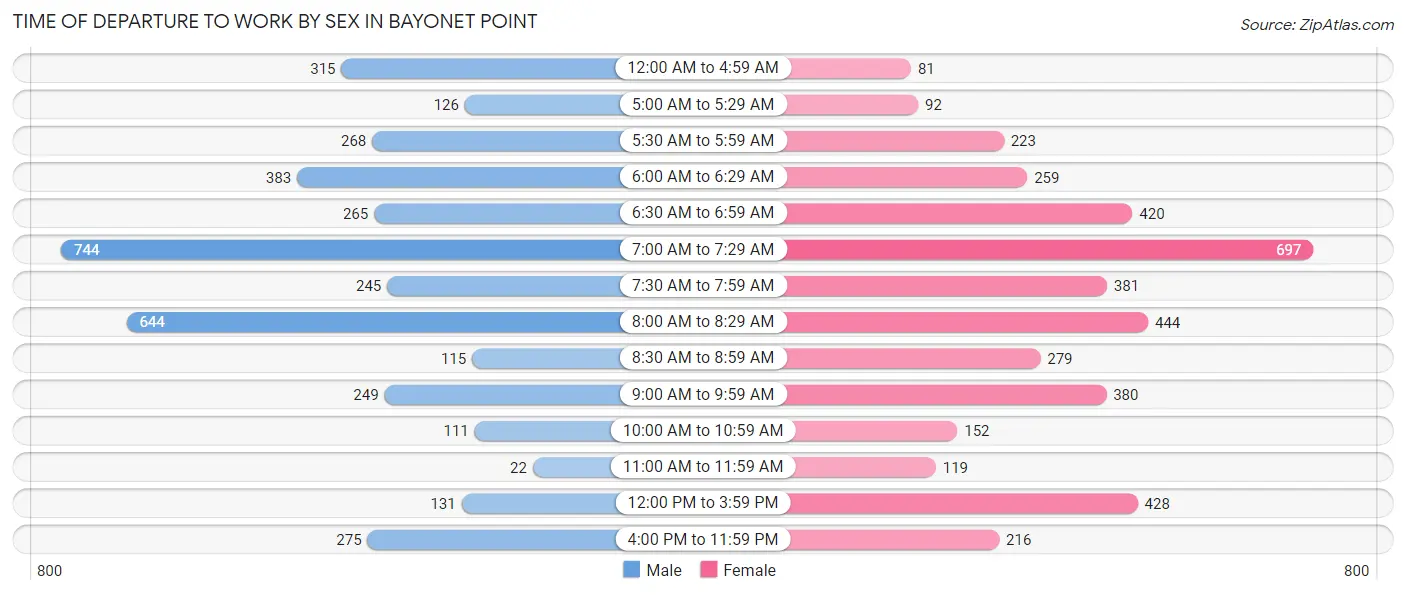
| Time of Departure | Male | Female |
| 12:00 AM to 4:59 AM | 315 (8.1%) | 81 (1.9%) |
| 5:00 AM to 5:29 AM | 126 (3.2%) | 92 (2.2%) |
| 5:30 AM to 5:59 AM | 268 (6.9%) | 223 (5.3%) |
| 6:00 AM to 6:29 AM | 383 (9.8%) | 259 (6.2%) |
| 6:30 AM to 6:59 AM | 265 (6.8%) | 420 (10.1%) |
| 7:00 AM to 7:29 AM | 744 (19.1%) | 697 (16.7%) |
| 7:30 AM to 7:59 AM | 245 (6.3%) | 381 (9.1%) |
| 8:00 AM to 8:29 AM | 644 (16.5%) | 444 (10.6%) |
| 8:30 AM to 8:59 AM | 115 (2.9%) | 279 (6.7%) |
| 9:00 AM to 9:59 AM | 249 (6.4%) | 380 (9.1%) |
| 10:00 AM to 10:59 AM | 111 (2.9%) | 152 (3.6%) |
| 11:00 AM to 11:59 AM | 22 (0.6%) | 119 (2.9%) |
| 12:00 PM to 3:59 PM | 131 (3.4%) | 428 (10.3%) |
| 4:00 PM to 11:59 PM | 275 (7.1%) | 216 (5.2%) |
| Total | 3,893 (100.0%) | 4,171 (100.0%) |
Housing Occupancy in Bayonet Point
Occupancy by Ownership in Bayonet Point
Of the total 11,668 dwellings in Bayonet Point, owner-occupied units account for 8,303 (71.2%), while renter-occupied units make up 3,365 (28.8%).
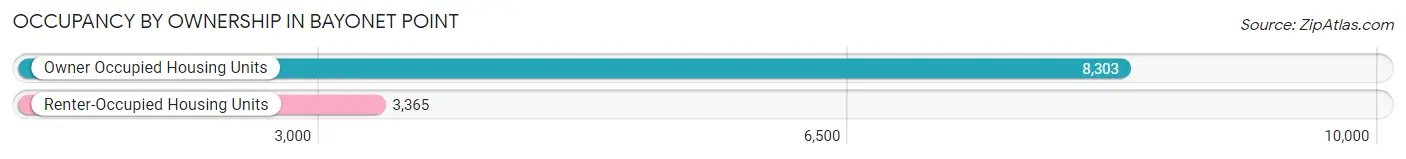
| Occupancy | # Housing Units | % Housing Units |
| Owner Occupied Housing Units | 8,303 | 71.2% |
| Renter-Occupied Housing Units | 3,365 | 28.8% |
| Total Occupied Housing Units | 11,668 | 100.0% |
Occupancy by Household Size in Bayonet Point
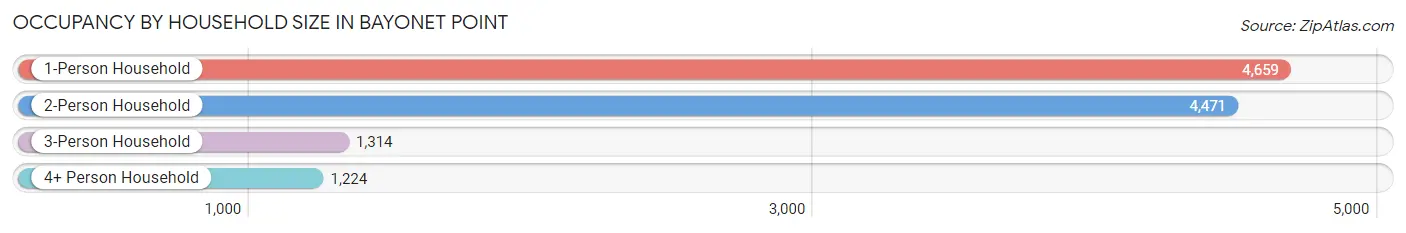
| Household Size | # Housing Units | % Housing Units |
| 1-Person Household | 4,659 | 39.9% |
| 2-Person Household | 4,471 | 38.3% |
| 3-Person Household | 1,314 | 11.3% |
| 4+ Person Household | 1,224 | 10.5% |
| Total Housing Units | 11,668 | 100.0% |
Occupancy by Ownership by Household Size in Bayonet Point
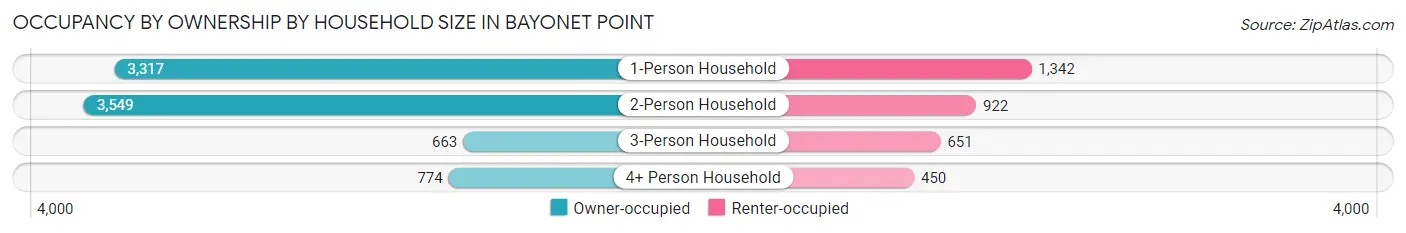
| Household Size | Owner-occupied | Renter-occupied |
| 1-Person Household | 3,317 (71.2%) | 1,342 (28.8%) |
| 2-Person Household | 3,549 (79.4%) | 922 (20.6%) |
| 3-Person Household | 663 (50.5%) | 651 (49.5%) |
| 4+ Person Household | 774 (63.2%) | 450 (36.8%) |
| Total Housing Units | 8,303 (71.2%) | 3,365 (28.8%) |
Occupancy by Educational Attainment in Bayonet Point
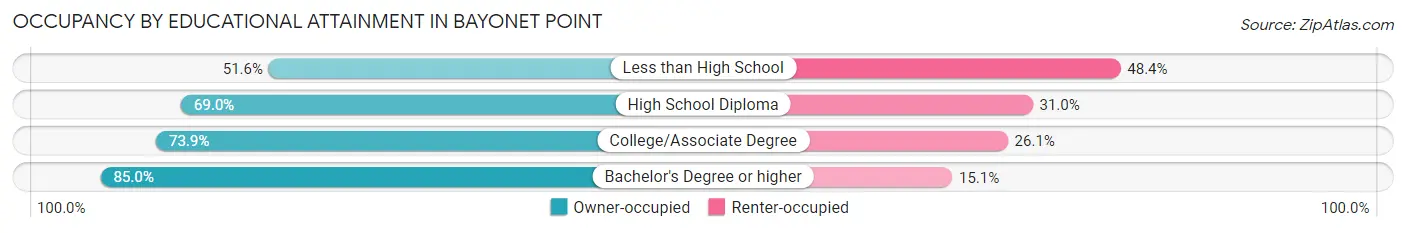
| Household Size | Owner-occupied | Renter-occupied |
| Less than High School | 587 (51.6%) | 551 (48.4%) |
| High School Diploma | 3,543 (69.0%) | 1,592 (31.0%) |
| College/Associate Degree | 2,751 (73.9%) | 970 (26.1%) |
| Bachelor's Degree or higher | 1,422 (85.0%) | 252 (15.0%) |
Occupancy by Age of Householder in Bayonet Point
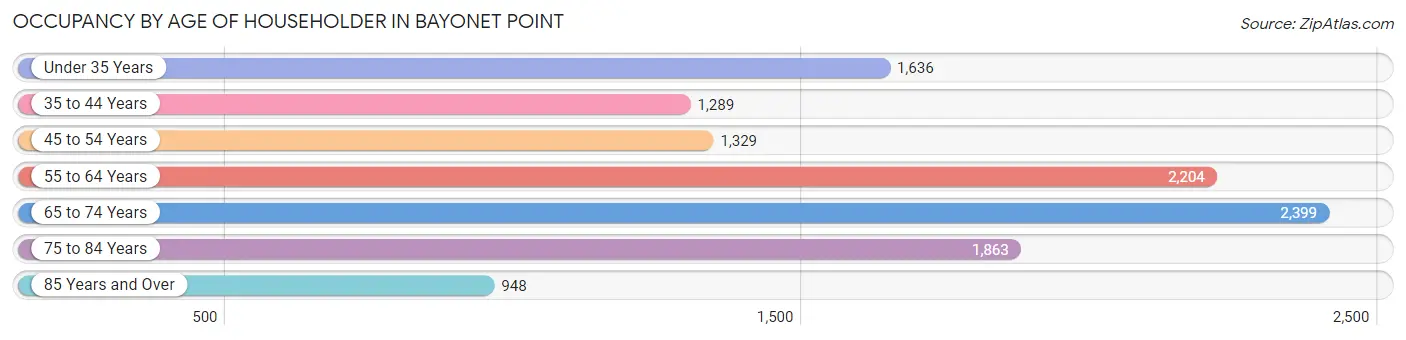
| Age Bracket | # Households | % Households |
| Under 35 Years | 1,636 | 14.0% |
| 35 to 44 Years | 1,289 | 11.1% |
| 45 to 54 Years | 1,329 | 11.4% |
| 55 to 64 Years | 2,204 | 18.9% |
| 65 to 74 Years | 2,399 | 20.6% |
| 75 to 84 Years | 1,863 | 16.0% |
| 85 Years and Over | 948 | 8.1% |
| Total | 11,668 | 100.0% |
Housing Finances in Bayonet Point
Median Income by Occupancy in Bayonet Point
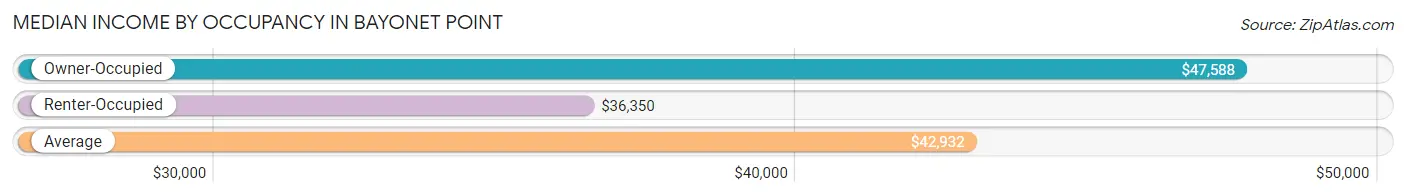
| Occupancy Type | # Households | Median Income |
| Owner-Occupied | 8,303 (71.2%) | $47,588 |
| Renter-Occupied | 3,365 (28.8%) | $36,350 |
| Average | 11,668 (100.0%) | $42,932 |
Occupancy by Householder Income Bracket in Bayonet Point
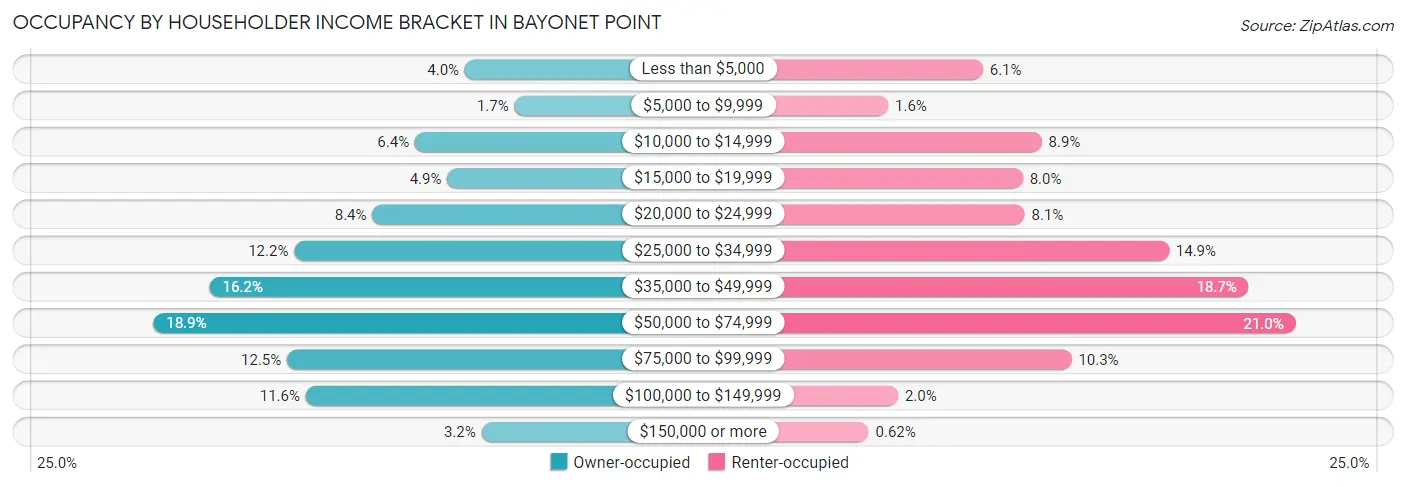
| Income Bracket | Owner-occupied | Renter-occupied |
| Less than $5,000 | 335 (4.0%) | 204 (6.1%) |
| $5,000 to $9,999 | 139 (1.7%) | 52 (1.5%) |
| $10,000 to $14,999 | 532 (6.4%) | 298 (8.9%) |
| $15,000 to $19,999 | 404 (4.9%) | 268 (8.0%) |
| $20,000 to $24,999 | 701 (8.4%) | 271 (8.1%) |
| $25,000 to $34,999 | 1,010 (12.2%) | 502 (14.9%) |
| $35,000 to $49,999 | 1,344 (16.2%) | 630 (18.7%) |
| $50,000 to $74,999 | 1,567 (18.9%) | 705 (20.9%) |
| $75,000 to $99,999 | 1,038 (12.5%) | 346 (10.3%) |
| $100,000 to $149,999 | 964 (11.6%) | 68 (2.0%) |
| $150,000 or more | 269 (3.2%) | 21 (0.6%) |
| Total | 8,303 (100.0%) | 3,365 (100.0%) |
Monthly Housing Cost Tiers in Bayonet Point
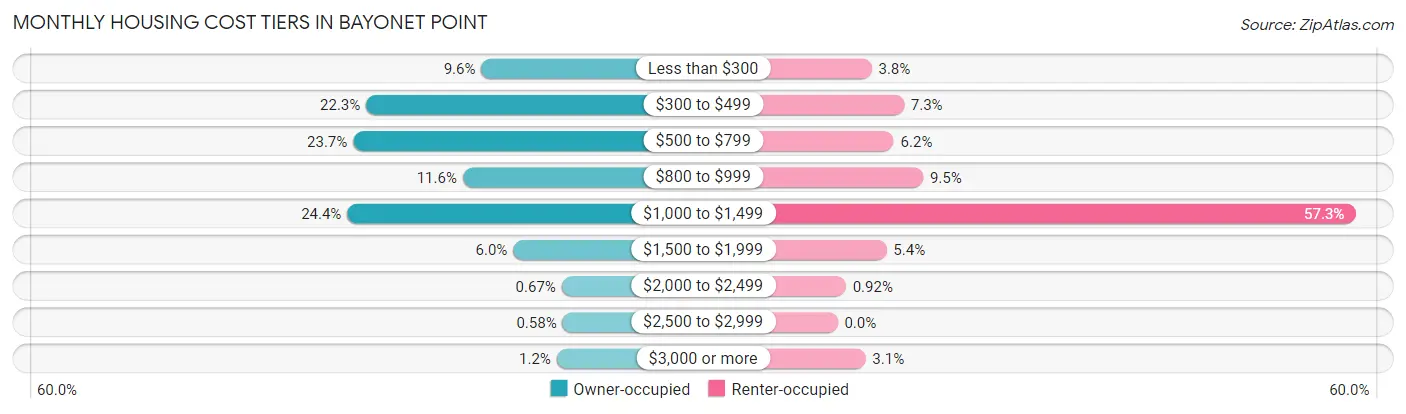
| Monthly Cost | Owner-occupied | Renter-occupied |
| Less than $300 | 793 (9.6%) | 127 (3.8%) |
| $300 to $499 | 1,849 (22.3%) | 247 (7.3%) |
| $500 to $799 | 1,969 (23.7%) | 209 (6.2%) |
| $800 to $999 | 963 (11.6%) | 318 (9.5%) |
| $1,000 to $1,499 | 2,023 (24.4%) | 1,928 (57.3%) |
| $1,500 to $1,999 | 501 (6.0%) | 182 (5.4%) |
| $2,000 to $2,499 | 56 (0.7%) | 31 (0.9%) |
| $2,500 to $2,999 | 48 (0.6%) | 0 (0.0%) |
| $3,000 or more | 101 (1.2%) | 104 (3.1%) |
| Total | 8,303 (100.0%) | 3,365 (100.0%) |
Physical Housing Characteristics in Bayonet Point
Housing Structures in Bayonet Point
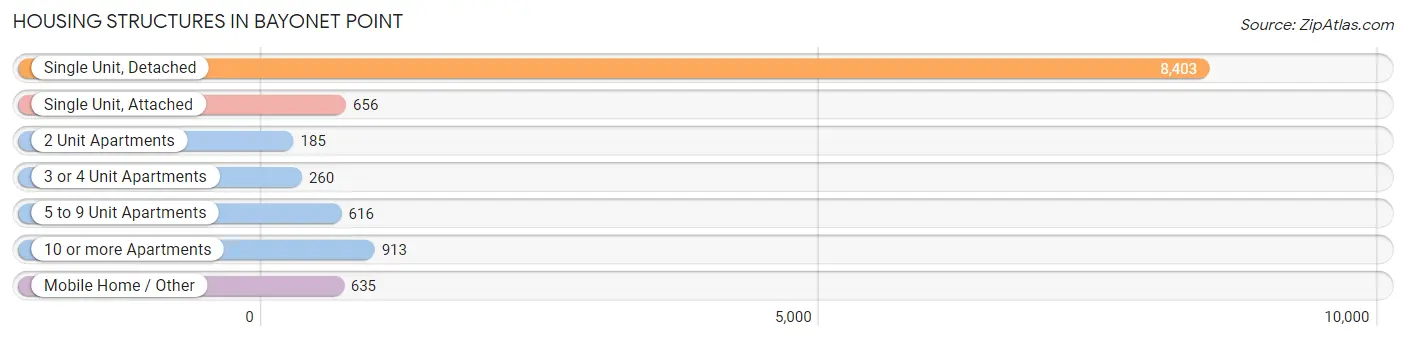
| Structure Type | # Housing Units | % Housing Units |
| Single Unit, Detached | 8,403 | 72.0% |
| Single Unit, Attached | 656 | 5.6% |
| 2 Unit Apartments | 185 | 1.6% |
| 3 or 4 Unit Apartments | 260 | 2.2% |
| 5 to 9 Unit Apartments | 616 | 5.3% |
| 10 or more Apartments | 913 | 7.8% |
| Mobile Home / Other | 635 | 5.4% |
| Total | 11,668 | 100.0% |
Housing Structures by Occupancy in Bayonet Point
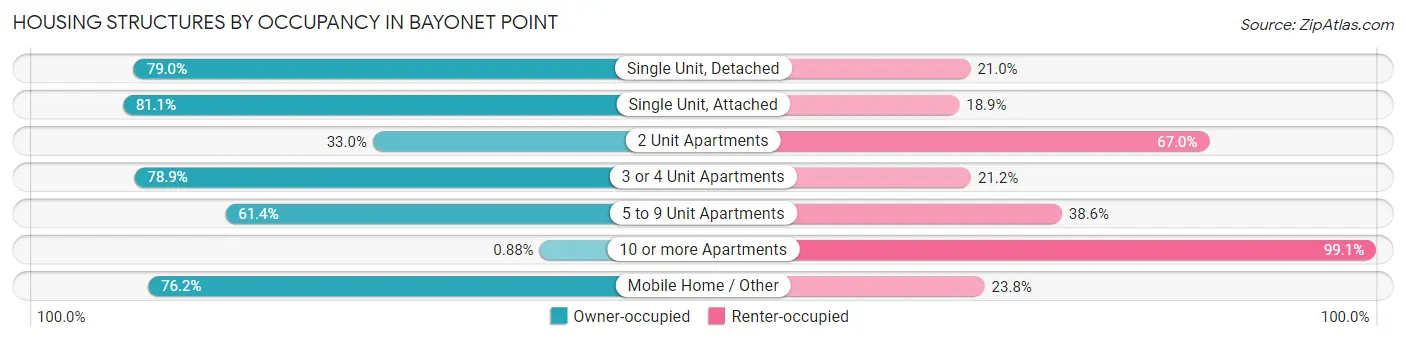
| Structure Type | Owner-occupied | Renter-occupied |
| Single Unit, Detached | 6,635 (79.0%) | 1,768 (21.0%) |
| Single Unit, Attached | 532 (81.1%) | 124 (18.9%) |
| 2 Unit Apartments | 61 (33.0%) | 124 (67.0%) |
| 3 or 4 Unit Apartments | 205 (78.8%) | 55 (21.1%) |
| 5 to 9 Unit Apartments | 378 (61.4%) | 238 (38.6%) |
| 10 or more Apartments | 8 (0.9%) | 905 (99.1%) |
| Mobile Home / Other | 484 (76.2%) | 151 (23.8%) |
| Total | 8,303 (71.2%) | 3,365 (28.8%) |
Housing Structures by Number of Rooms in Bayonet Point
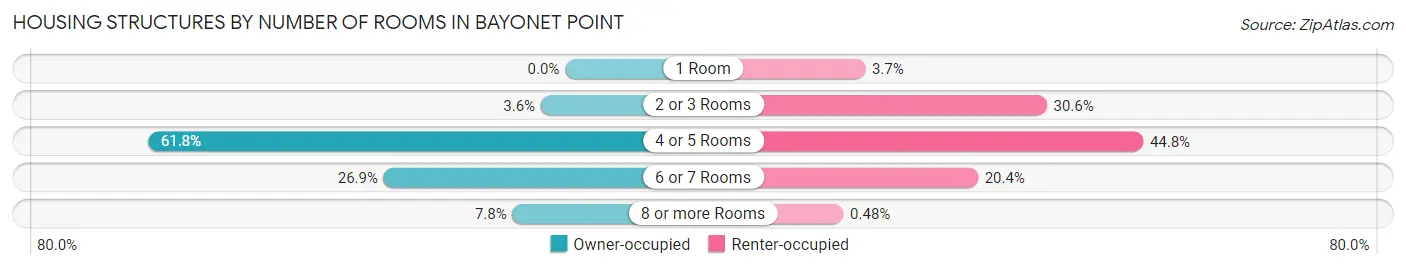
| Number of Rooms | Owner-occupied | Renter-occupied |
| 1 Room | 0 (0.0%) | 125 (3.7%) |
| 2 or 3 Rooms | 299 (3.6%) | 1,029 (30.6%) |
| 4 or 5 Rooms | 5,128 (61.8%) | 1,509 (44.8%) |
| 6 or 7 Rooms | 2,229 (26.9%) | 686 (20.4%) |
| 8 or more Rooms | 647 (7.8%) | 16 (0.5%) |
| Total | 8,303 (100.0%) | 3,365 (100.0%) |
Housing Structure by Heating Type in Bayonet Point
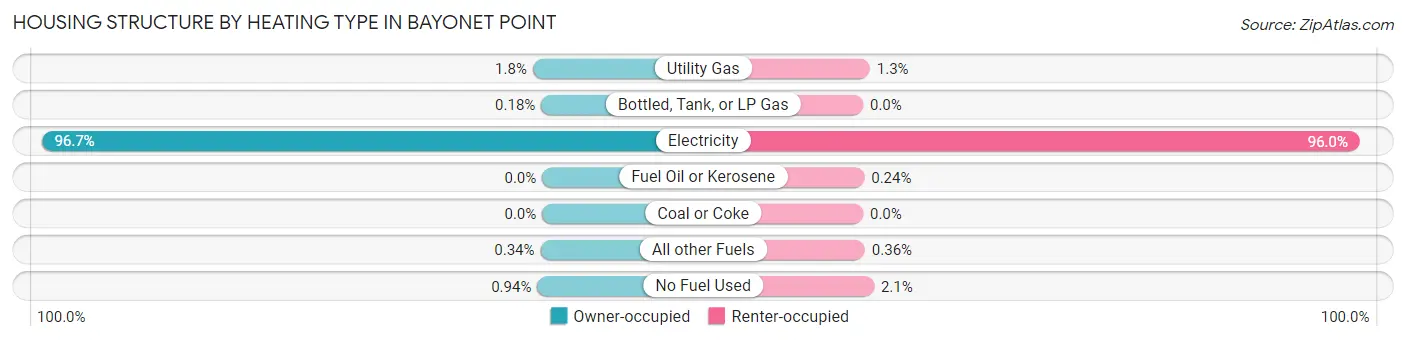
| Heating Type | Owner-occupied | Renter-occupied |
| Utility Gas | 150 (1.8%) | 44 (1.3%) |
| Bottled, Tank, or LP Gas | 15 (0.2%) | 0 (0.0%) |
| Electricity | 8,032 (96.7%) | 3,230 (96.0%) |
| Fuel Oil or Kerosene | 0 (0.0%) | 8 (0.2%) |
| Coal or Coke | 0 (0.0%) | 0 (0.0%) |
| All other Fuels | 28 (0.3%) | 12 (0.4%) |
| No Fuel Used | 78 (0.9%) | 71 (2.1%) |
| Total | 8,303 (100.0%) | 3,365 (100.0%) |
Household Vehicle Usage in Bayonet Point
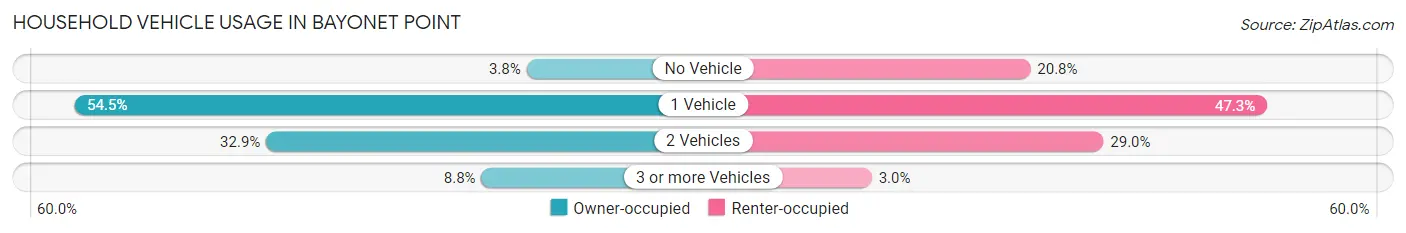
| Vehicles per Household | Owner-occupied | Renter-occupied |
| No Vehicle | 313 (3.8%) | 699 (20.8%) |
| 1 Vehicle | 4,522 (54.5%) | 1,591 (47.3%) |
| 2 Vehicles | 2,735 (32.9%) | 974 (28.9%) |
| 3 or more Vehicles | 733 (8.8%) | 101 (3.0%) |
| Total | 8,303 (100.0%) | 3,365 (100.0%) |
Real Estate & Mortgages in Bayonet Point
Real Estate and Mortgage Overview in Bayonet Point
| Characteristic | Without Mortgage | With Mortgage |
| Housing Units | 4,227 | 4,076 |
| Median Property Value | $121,300 | $145,300 |
| Median Household Income | $34,916 | $175 |
| Monthly Housing Costs | $427 | $101 |
| Real Estate Taxes | $829 | $81 |
Property Value by Mortgage Status in Bayonet Point
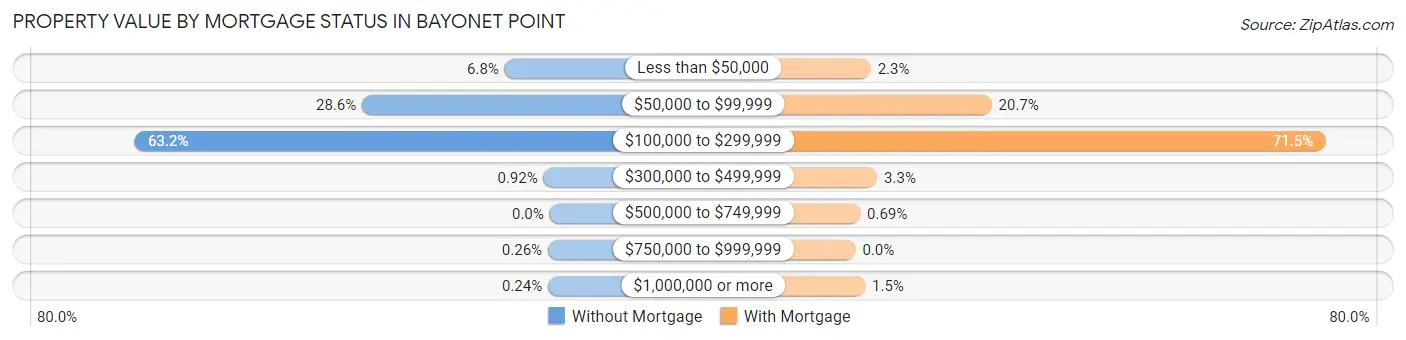
| Property Value | Without Mortgage | With Mortgage |
| Less than $50,000 | 289 (6.8%) | 94 (2.3%) |
| $50,000 to $99,999 | 1,208 (28.6%) | 845 (20.7%) |
| $100,000 to $299,999 | 2,670 (63.2%) | 2,916 (71.5%) |
| $300,000 to $499,999 | 39 (0.9%) | 134 (3.3%) |
| $500,000 to $749,999 | 0 (0.0%) | 28 (0.7%) |
| $750,000 to $999,999 | 11 (0.3%) | 0 (0.0%) |
| $1,000,000 or more | 10 (0.2%) | 59 (1.5%) |
| Total | 4,227 (100.0%) | 4,076 (100.0%) |
Household Income by Mortgage Status in Bayonet Point
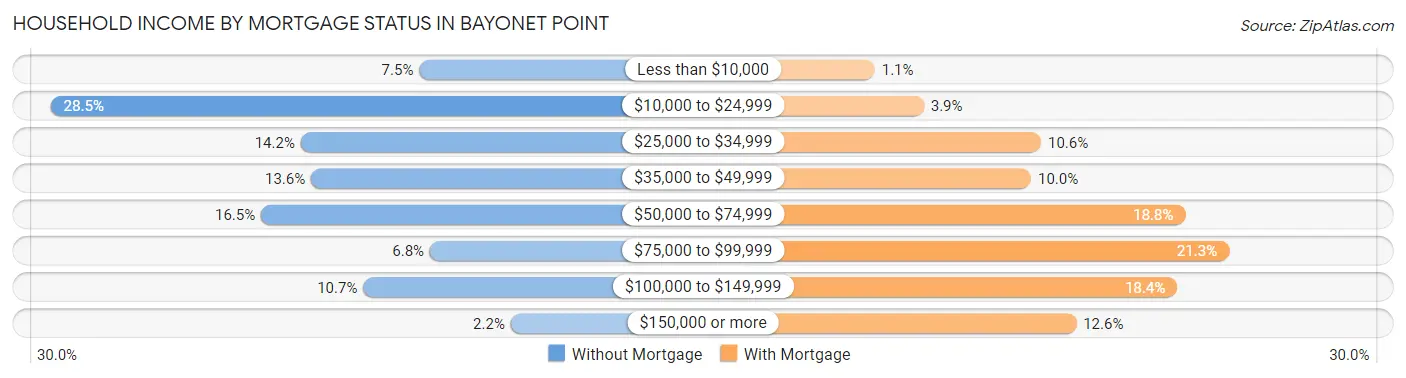
| Household Income | Without Mortgage | With Mortgage |
| Less than $10,000 | 315 (7.4%) | 45 (1.1%) |
| $10,000 to $24,999 | 1,205 (28.5%) | 159 (3.9%) |
| $25,000 to $34,999 | 601 (14.2%) | 432 (10.6%) |
| $35,000 to $49,999 | 576 (13.6%) | 409 (10.0%) |
| $50,000 to $74,999 | 697 (16.5%) | 768 (18.8%) |
| $75,000 to $99,999 | 289 (6.8%) | 870 (21.3%) |
| $100,000 to $149,999 | 450 (10.6%) | 749 (18.4%) |
| $150,000 or more | 94 (2.2%) | 514 (12.6%) |
| Total | 4,227 (100.0%) | 4,076 (100.0%) |
Property Value to Household Income Ratio in Bayonet Point
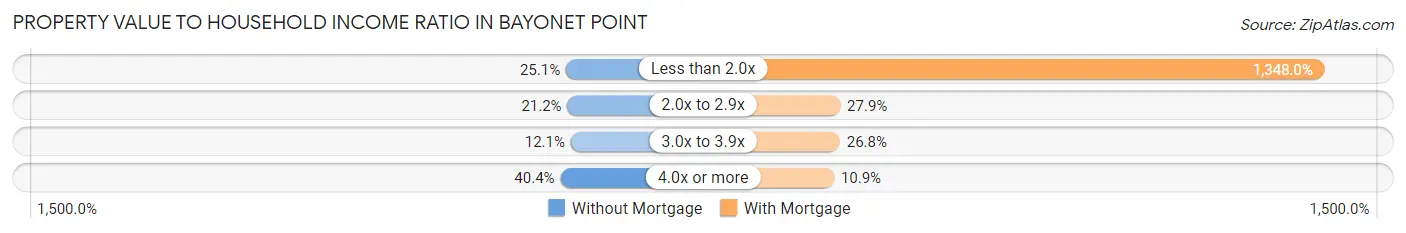
| Value-to-Income Ratio | Without Mortgage | With Mortgage |
| Less than 2.0x | 1,062 (25.1%) | 54,946 (1,348.0%) |
| 2.0x to 2.9x | 895 (21.2%) | 1,136 (27.9%) |
| 3.0x to 3.9x | 511 (12.1%) | 1,094 (26.8%) |
| 4.0x or more | 1,707 (40.4%) | 446 (10.9%) |
| Total | 4,227 (100.0%) | 4,076 (100.0%) |
Real Estate Taxes by Mortgage Status in Bayonet Point
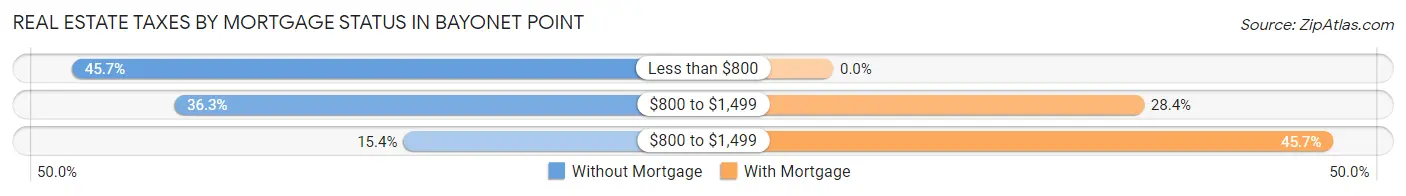
| Property Taxes | Without Mortgage | With Mortgage |
| Less than $800 | 1,931 (45.7%) | 0 (0.0%) |
| $800 to $1,499 | 1,536 (36.3%) | 1,157 (28.4%) |
| $800 to $1,499 | 652 (15.4%) | 1,862 (45.7%) |
| Total | 4,227 (100.0%) | 4,076 (100.0%) |
Health & Disability in Bayonet Point
Health Insurance Coverage by Age in Bayonet Point
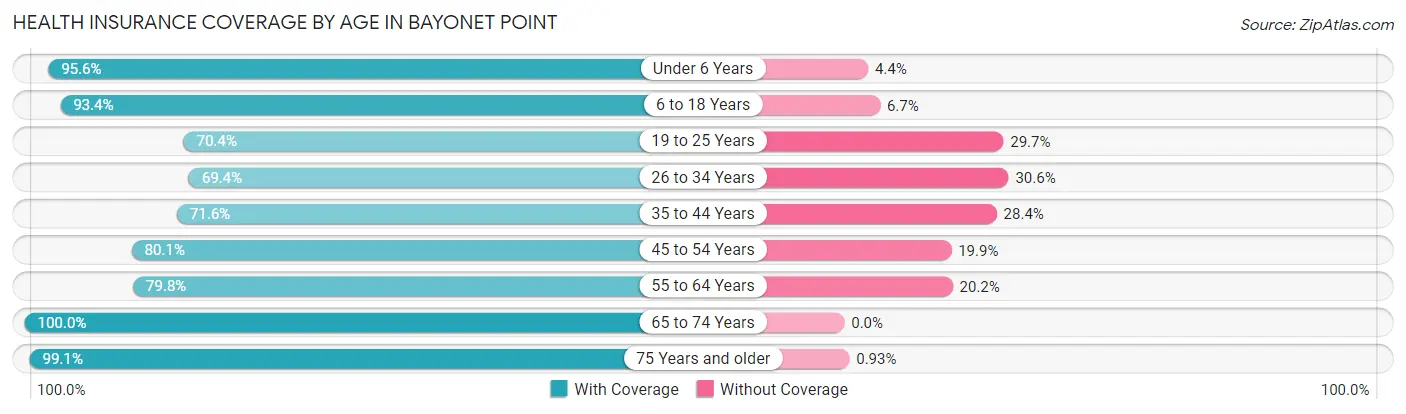
| Age Bracket | With Coverage | Without Coverage |
| Under 6 Years | 932 (95.6%) | 43 (4.4%) |
| 6 to 18 Years | 3,116 (93.3%) | 222 (6.7%) |
| 19 to 25 Years | 892 (70.4%) | 376 (29.6%) |
| 26 to 34 Years | 1,604 (69.4%) | 708 (30.6%) |
| 35 to 44 Years | 1,769 (71.6%) | 702 (28.4%) |
| 45 to 54 Years | 2,003 (80.1%) | 499 (19.9%) |
| 55 to 64 Years | 3,057 (79.8%) | 774 (20.2%) |
| 65 to 74 Years | 3,590 (100.0%) | 0 (0.0%) |
| 75 Years and older | 3,933 (99.1%) | 37 (0.9%) |
| Total | 20,896 (86.1%) | 3,361 (13.9%) |
Health Insurance Coverage by Citizenship Status in Bayonet Point
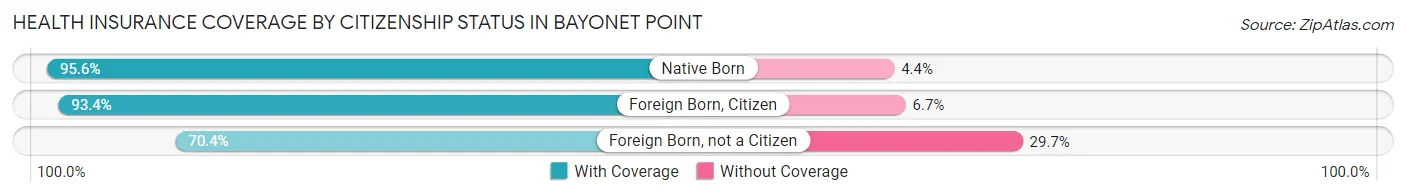
| Citizenship Status | With Coverage | Without Coverage |
| Native Born | 932 (95.6%) | 43 (4.4%) |
| Foreign Born, Citizen | 3,116 (93.3%) | 222 (6.7%) |
| Foreign Born, not a Citizen | 892 (70.4%) | 376 (29.6%) |
Health Insurance Coverage by Household Income in Bayonet Point
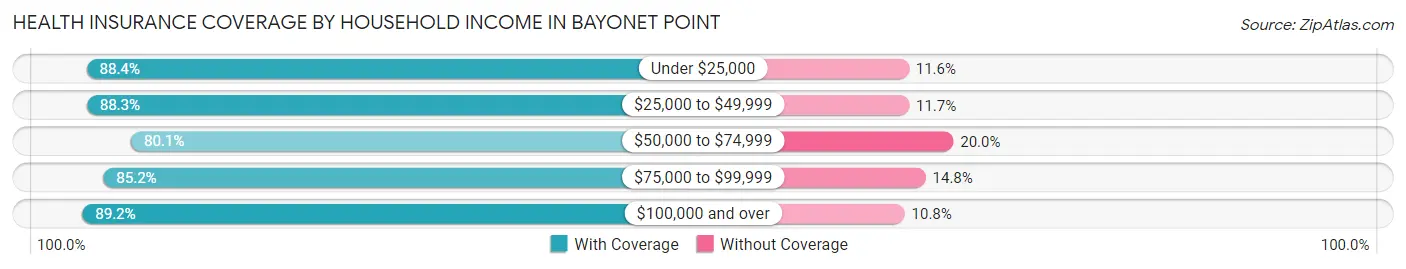
| Household Income | With Coverage | Without Coverage |
| Under $25,000 | 4,251 (88.4%) | 559 (11.6%) |
| $25,000 to $49,999 | 5,570 (88.3%) | 735 (11.7%) |
| $50,000 to $74,999 | 4,330 (80.0%) | 1,079 (20.0%) |
| $75,000 to $99,999 | 3,283 (85.2%) | 569 (14.8%) |
| $100,000 and over | 3,451 (89.2%) | 419 (10.8%) |
Public vs Private Health Insurance Coverage by Age in Bayonet Point
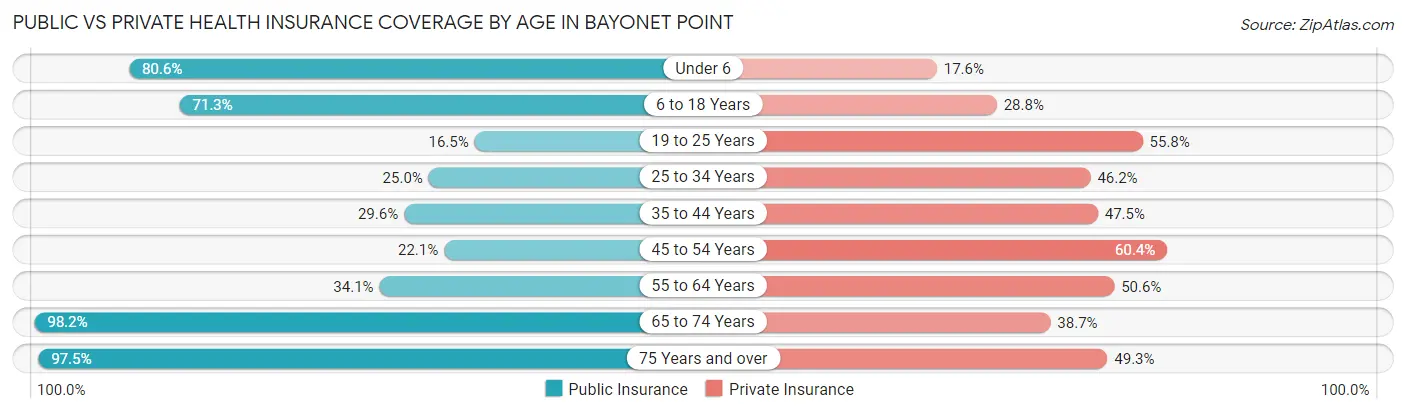
| Age Bracket | Public Insurance | Private Insurance |
| Under 6 | 786 (80.6%) | 172 (17.6%) |
| 6 to 18 Years | 2,379 (71.3%) | 960 (28.8%) |
| 19 to 25 Years | 209 (16.5%) | 708 (55.8%) |
| 25 to 34 Years | 578 (25.0%) | 1,067 (46.2%) |
| 35 to 44 Years | 731 (29.6%) | 1,174 (47.5%) |
| 45 to 54 Years | 554 (22.1%) | 1,511 (60.4%) |
| 55 to 64 Years | 1,308 (34.1%) | 1,937 (50.6%) |
| 65 to 74 Years | 3,525 (98.2%) | 1,390 (38.7%) |
| 75 Years and over | 3,869 (97.5%) | 1,957 (49.3%) |
| Total | 13,939 (57.5%) | 10,876 (44.8%) |
Disability Status by Sex by Age in Bayonet Point
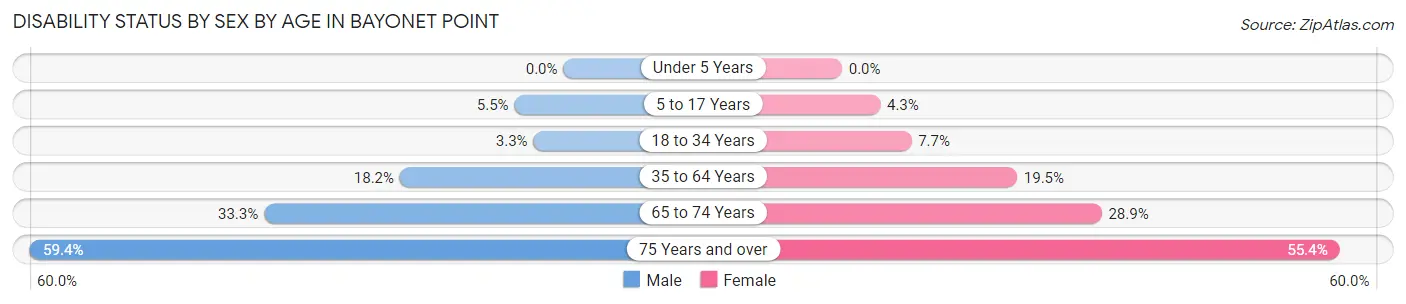
| Age Bracket | Male | Female |
| Under 5 Years | 0 (0.0%) | 0 (0.0%) |
| 5 to 17 Years | 73 (5.4%) | 85 (4.3%) |
| 18 to 34 Years | 61 (3.3%) | 150 (7.7%) |
| 35 to 64 Years | 705 (18.2%) | 962 (19.5%) |
| 65 to 74 Years | 549 (33.3%) | 562 (28.9%) |
| 75 Years and over | 1,149 (59.4%) | 1,128 (55.4%) |
Disability Class by Sex by Age in Bayonet Point
Disability Class: Hearing Difficulty
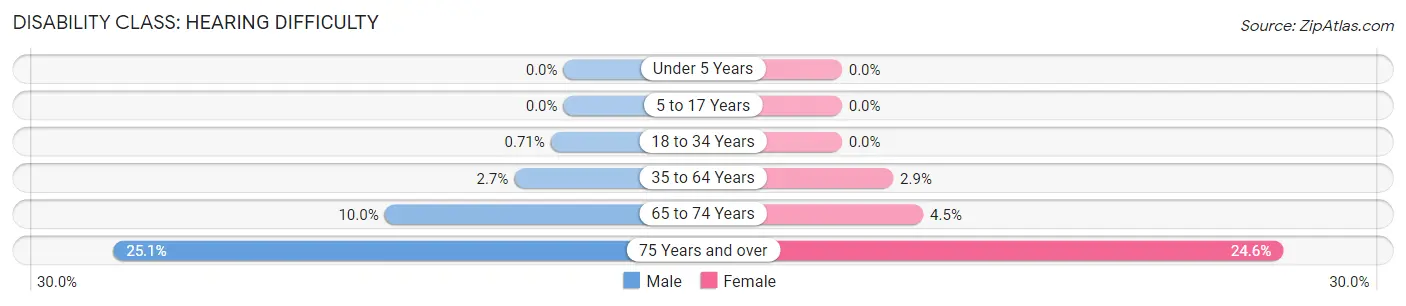
| Age Bracket | Male | Female |
| Under 5 Years | 0 (0.0%) | 0 (0.0%) |
| 5 to 17 Years | 0 (0.0%) | 0 (0.0%) |
| 18 to 34 Years | 13 (0.7%) | 0 (0.0%) |
| 35 to 64 Years | 106 (2.7%) | 141 (2.9%) |
| 65 to 74 Years | 164 (10.0%) | 88 (4.5%) |
| 75 Years and over | 485 (25.1%) | 500 (24.6%) |
Disability Class: Vision Difficulty
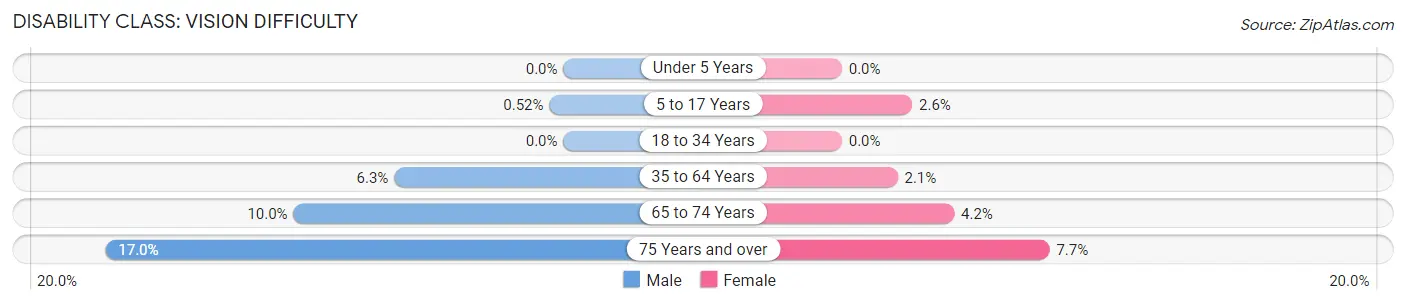
| Age Bracket | Male | Female |
| Under 5 Years | 0 (0.0%) | 0 (0.0%) |
| 5 to 17 Years | 7 (0.5%) | 52 (2.6%) |
| 18 to 34 Years | 0 (0.0%) | 0 (0.0%) |
| 35 to 64 Years | 243 (6.3%) | 102 (2.1%) |
| 65 to 74 Years | 165 (10.0%) | 81 (4.2%) |
| 75 Years and over | 329 (17.0%) | 157 (7.7%) |
Disability Class: Cognitive Difficulty
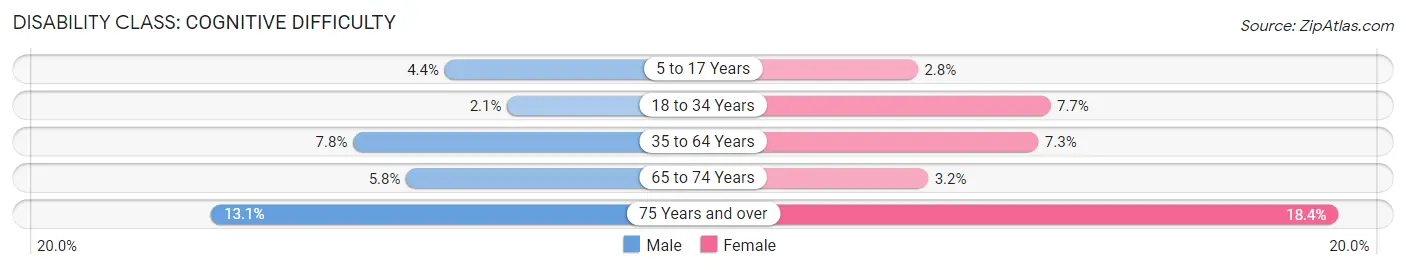
| Age Bracket | Male | Female |
| 5 to 17 Years | 59 (4.4%) | 56 (2.8%) |
| 18 to 34 Years | 38 (2.1%) | 150 (7.7%) |
| 35 to 64 Years | 302 (7.8%) | 359 (7.3%) |
| 65 to 74 Years | 96 (5.8%) | 62 (3.2%) |
| 75 Years and over | 253 (13.1%) | 375 (18.4%) |
Disability Class: Ambulatory Difficulty
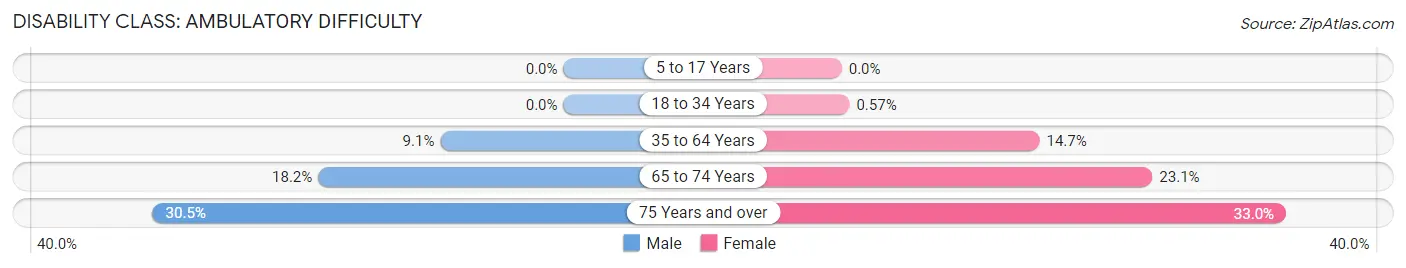
| Age Bracket | Male | Female |
| 5 to 17 Years | 0 (0.0%) | 0 (0.0%) |
| 18 to 34 Years | 0 (0.0%) | 11 (0.6%) |
| 35 to 64 Years | 354 (9.1%) | 724 (14.7%) |
| 65 to 74 Years | 300 (18.2%) | 448 (23.1%) |
| 75 Years and over | 590 (30.5%) | 671 (33.0%) |
Disability Class: Self-Care Difficulty
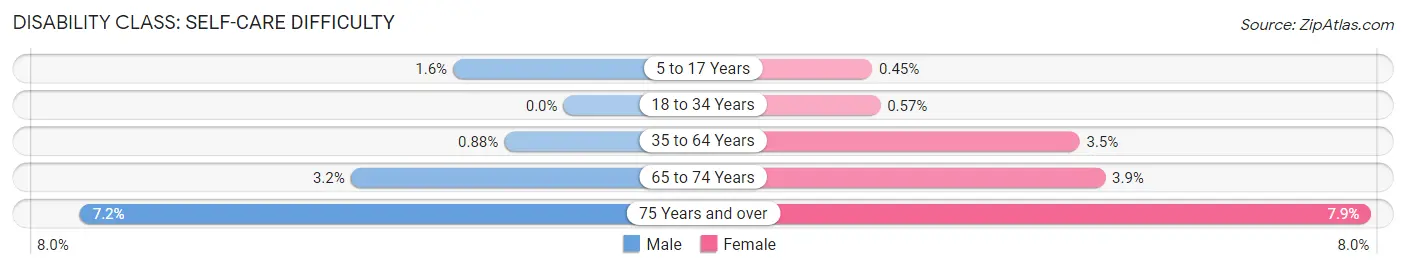
| Age Bracket | Male | Female |
| 5 to 17 Years | 22 (1.6%) | 9 (0.4%) |
| 18 to 34 Years | 0 (0.0%) | 11 (0.6%) |
| 35 to 64 Years | 34 (0.9%) | 174 (3.5%) |
| 65 to 74 Years | 52 (3.2%) | 76 (3.9%) |
| 75 Years and over | 139 (7.2%) | 160 (7.9%) |
Technology Access in Bayonet Point
Computing Device Access in Bayonet Point
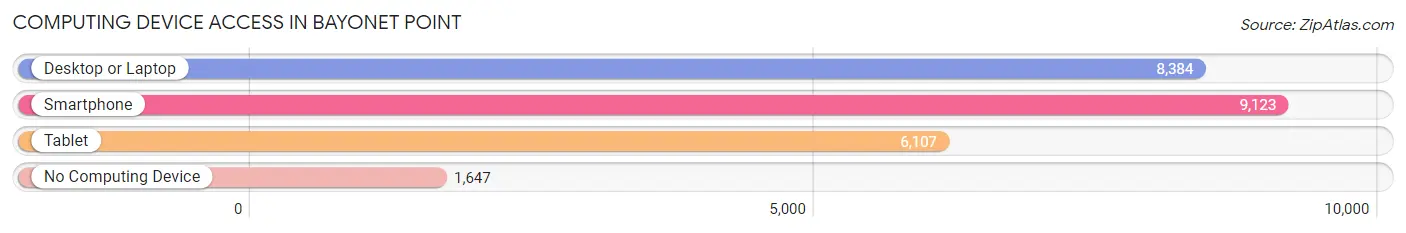
| Device Type | # Households | % Households |
| Desktop or Laptop | 8,384 | 71.9% |
| Smartphone | 9,123 | 78.2% |
| Tablet | 6,107 | 52.3% |
| No Computing Device | 1,647 | 14.1% |
| Total | 11,668 | 100.0% |
Internet Access in Bayonet Point
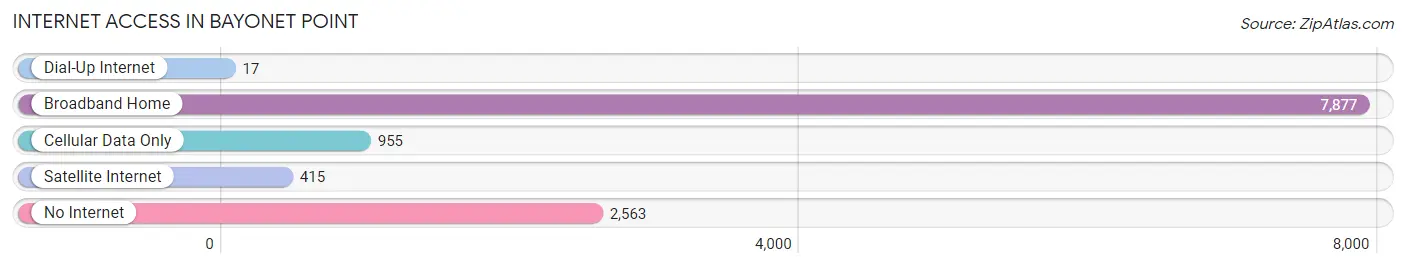
| Internet Type | # Households | % Households |
| Dial-Up Internet | 17 | 0.2% |
| Broadband Home | 7,877 | 67.5% |
| Cellular Data Only | 955 | 8.2% |
| Satellite Internet | 415 | 3.6% |
| No Internet | 2,563 | 22.0% |
| Total | 11,668 | 100.0% |
Bayonet Point Summary
Bayonet Point is a census-designated place (CDP) located in Pasco County, Florida, United States. It is located on the Gulf of Mexico, about 25 miles northwest of Tampa. The population was 19,719 at the 2010 census.
History
The area now known as Bayonet Point was originally inhabited by the Tocobaga Indians. The first European settlers arrived in the area in the late 1700s. The area was named after a bayonet-shaped point of land that jutted out into the Gulf of Mexico. The area was used for fishing and farming until the early 1900s, when it began to be developed as a residential community.
In the 1950s, the area was developed as a retirement community. The first subdivision was built in 1954, and the area quickly grew in popularity. By the 1970s, Bayonet Point had become a popular destination for retirees and vacationers.
Geography
Bayonet Point is located at 28°17'N 82°41'W (28.28, -82.68). According to the United States Census Bureau, the CDP has a total area of 8.3 square miles (21.5 km2), of which 8.2 square miles (21.3 km2) is land and 0.1 square miles (0.2 km2) (1.17%) is water.
Economy
Bayonet Point is home to several businesses, including a variety of retail stores, restaurants, and medical facilities. The area is also home to several industrial parks, which provide employment opportunities for local residents.
Demographics
As of the 2010 census, there were 19,719 people, 8,845 households, and 5,845 families residing in the CDP. The population density was 2,400.3 people per square mile (926.2/km2). There were 9,845 housing units at an average density of 1,200.1 per square mile (463.7/km2). The racial makeup of the CDP was 87.2% White, 5.3% African American, 0.4% Native American, 2.2% Asian, 0.1% Pacific Islander, 2.7% from other races, and 2.1% from two or more races. Hispanic or Latino of any race were 11.2% of the population.
There were 8,845 households, out of which 22.2% had children under the age of 18 living with them, 51.2% were married couples living together, 11.2% had a female householder with no husband present, and 33.2% were non-families. 27.2% of all households were made up of individuals, and 11.7% had someone living alone who was 65 years of age or older. The average household size was 2.21 and the average family size was 2.67.
In the CDP, the population was spread out, with 18.2% under the age of 18, 6.2% from 18 to 24, 24.2% from 25 to 44, 28.2% from 45 to 64, and 23.2% who were 65 years of age or older. The median age was 45 years. For every 100 females, there were 94.2 males. For every 100 females age 18 and over, there were 91.3 males.
The median income for a household in the CDP was $41,945, and the median income for a family was $50,945. Males had a median income of $37,945 versus $27,945 for females. The per capita income for the CDP was $22,945. About 6.2% of families and 8.2% of the population were below the poverty line, including 11.2% of those under age 18 and 6.2% of those age 65 or over.
Common Questions
What is the Total Population of Bayonet Point?
Total Population of Bayonet Point is 24,628.
What is the Total Male Population of Bayonet Point?
Total Male Population of Bayonet Point is 11,138.
What is the Total Female Population of Bayonet Point?
Total Female Population of Bayonet Point is 13,490.
What is the Ratio of Males per 100 Females in Bayonet Point?
There are 82.56 Males per 100 Females in Bayonet Point.
What is the Ratio of Females per 100 Males in Bayonet Point?
There are 121.12 Females per 100 Males in Bayonet Point.
What is the Median Population Age in Bayonet Point?
Median Population Age in Bayonet Point is 53.2 Years.
What is the Average Family Size in Bayonet Point
Average Family Size in Bayonet Point is 2.8 People.
What is the Average Household Size in Bayonet Point
Average Household Size in Bayonet Point is 2.1 People.
What is Per Capita Income in Bayonet Point?
Per Capita income in Bayonet Point is $28,928.
What is the Median Family Income in Bayonet Point?
Median Family Income in Bayonet Point is $55,408.
What is the Median Household income in Bayonet Point?
Median Household Income in Bayonet Point is $42,932.
What is Income or Wage Gap in Bayonet Point?
Income or Wage Gap in Bayonet Point is 20.3%.
Women in Bayonet Point earn 79.7 cents for every dollar earned by a man.
What is Inequality or Gini Index in Bayonet Point?
Inequality or Gini Index in Bayonet Point is 0.47.
How Large is the Labor Force in Bayonet Point?
There are 9,622 People in the Labor Forcein in Bayonet Point.
What is the Percentage of People in the Labor Force in Bayonet Point?
45.6% of People are in the Labor Force in Bayonet Point.
What is the Unemployment Rate in Bayonet Point?
Unemployment Rate in Bayonet Point is 7.5%.