Combee Settlement, FL
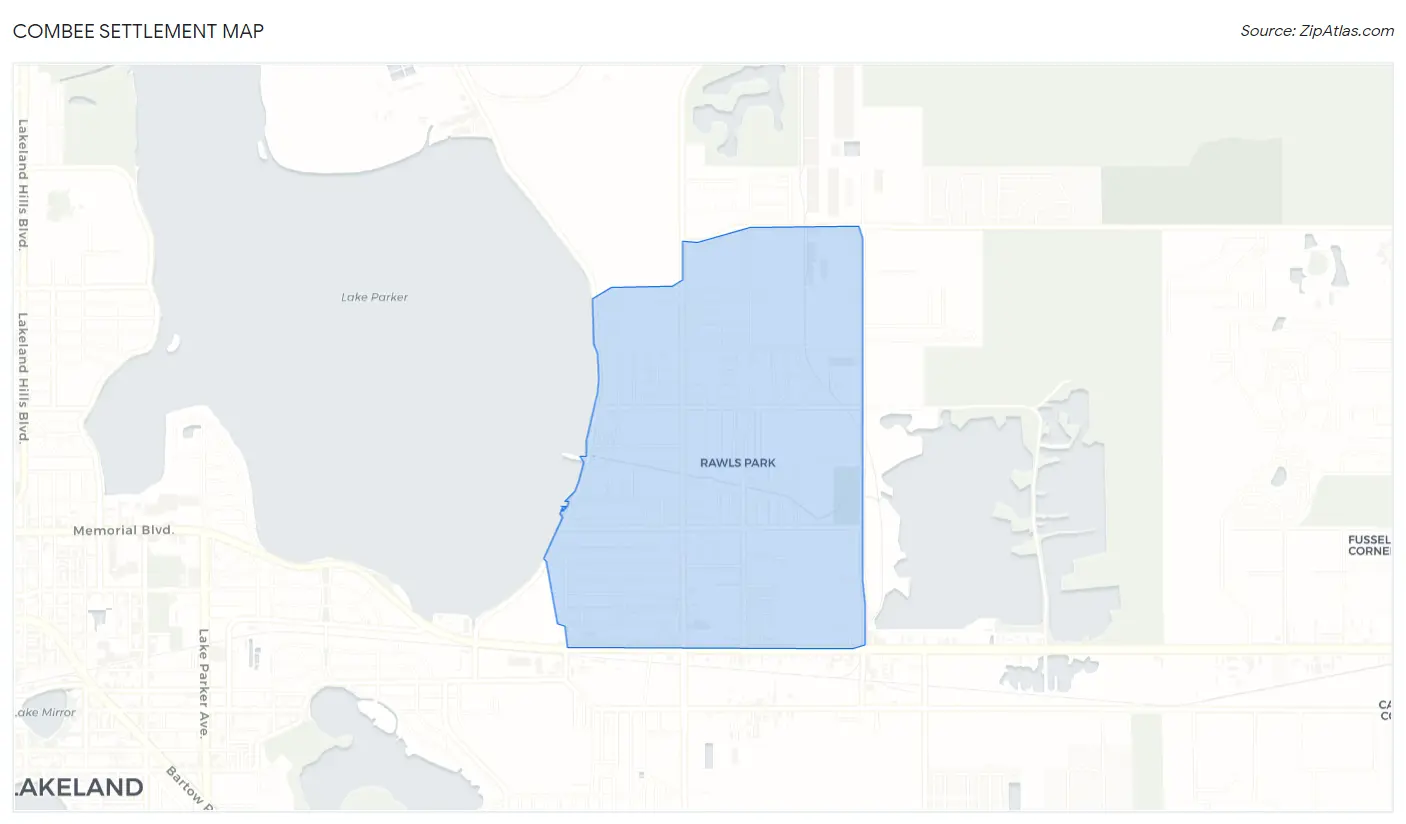
Combee Settlement Map
Combee Settlement Overview
4,880
TOTAL POPULATION
2,322
MALE POPULATION
2,558
FEMALE POPULATION
90.77
MALES / 100 FEMALES
110.16
FEMALES / 100 MALES
33.0
MEDIAN AGE
3.4
AVG FAMILY SIZE
2.8
AVG HOUSEHOLD SIZE
$19,485
PER CAPITA INCOME
$56,250
AVG FAMILY INCOME
$37,763
AVG HOUSEHOLD INCOME
24.8%
WAGE / INCOME GAP [ % ]
75.2¢/ $1
WAGE / INCOME GAP [ $ ]
0.42
INEQUALITY / GINI INDEX
2,087
LABOR FORCE [ PEOPLE ]
53.3%
PERCENT IN LABOR FORCE
5.2%
UNEMPLOYMENT RATE
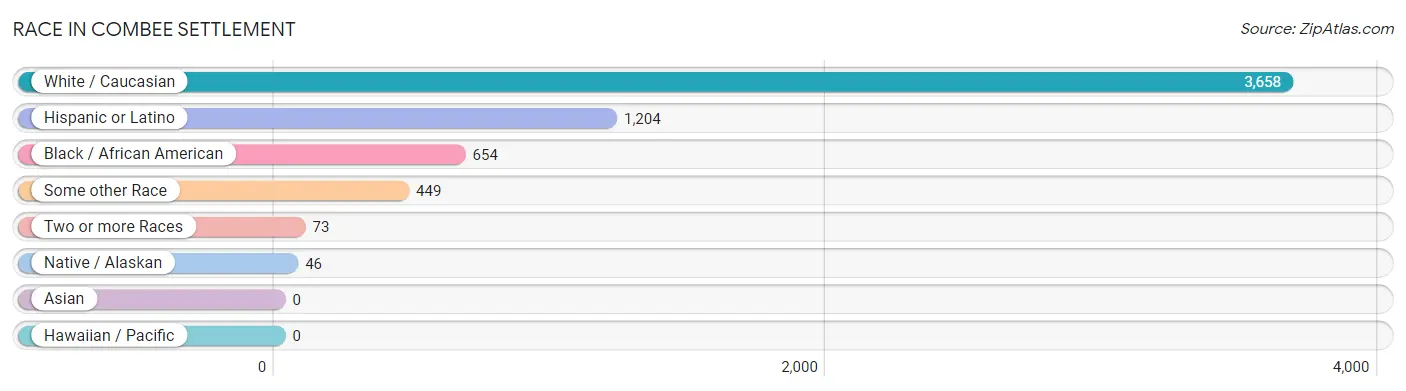
Race in Combee Settlement
The most populous races in Combee Settlement are White / Caucasian (3,658 | 75.0%), Hispanic or Latino (1,204 | 24.7%), and Black / African American (654 | 13.4%).
| Race | # Population | % Population |
| Asian | 0 | 0.0% |
| Black / African American | 654 | 13.4% |
| Hawaiian / Pacific | 0 | 0.0% |
| Hispanic or Latino | 1,204 | 24.7% |
| Native / Alaskan | 46 | 0.9% |
| White / Caucasian | 3,658 | 75.0% |
| Two or more Races | 73 | 1.5% |
| Some other Race | 449 | 9.2% |
| Total | 4,880 | 100.0% |
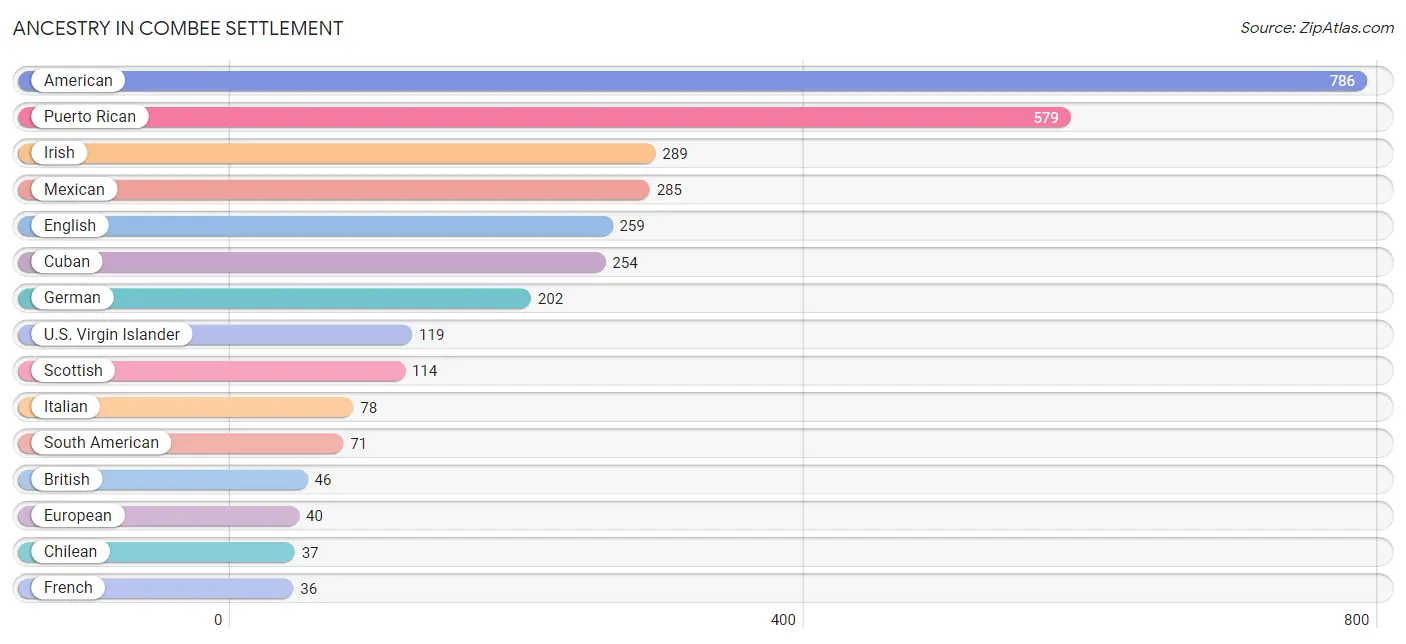
Ancestry in Combee Settlement
The most populous ancestries reported in Combee Settlement are American (786 | 16.1%), Puerto Rican (579 | 11.9%), Irish (289 | 5.9%), Mexican (285 | 5.8%), and English (259 | 5.3%), together accounting for 45.0% of all Combee Settlement residents.
| Ancestry | # Population | % Population |
| American | 786 | 16.1% |
| Austrian | 21 | 0.4% |
| Bolivian | 34 | 0.7% |
| British | 46 | 0.9% |
| Cherokee | 11 | 0.2% |
| Chilean | 37 | 0.8% |
| Cuban | 254 | 5.2% |
| Dominican | 15 | 0.3% |
| English | 259 | 5.3% |
| European | 40 | 0.8% |
| French | 36 | 0.7% |
| German | 202 | 4.1% |
| Irish | 289 | 5.9% |
| Italian | 78 | 1.6% |
| Mexican | 285 | 5.8% |
| Norwegian | 6 | 0.1% |
| Polish | 19 | 0.4% |
| Portuguese | 21 | 0.4% |
| Puerto Rican | 579 | 11.9% |
| Russian | 25 | 0.5% |
| Scotch-Irish | 27 | 0.5% |
| Scottish | 114 | 2.3% |
| South American | 71 | 1.5% |
| U.S. Virgin Islander | 119 | 2.4% | View All 24 Rows |
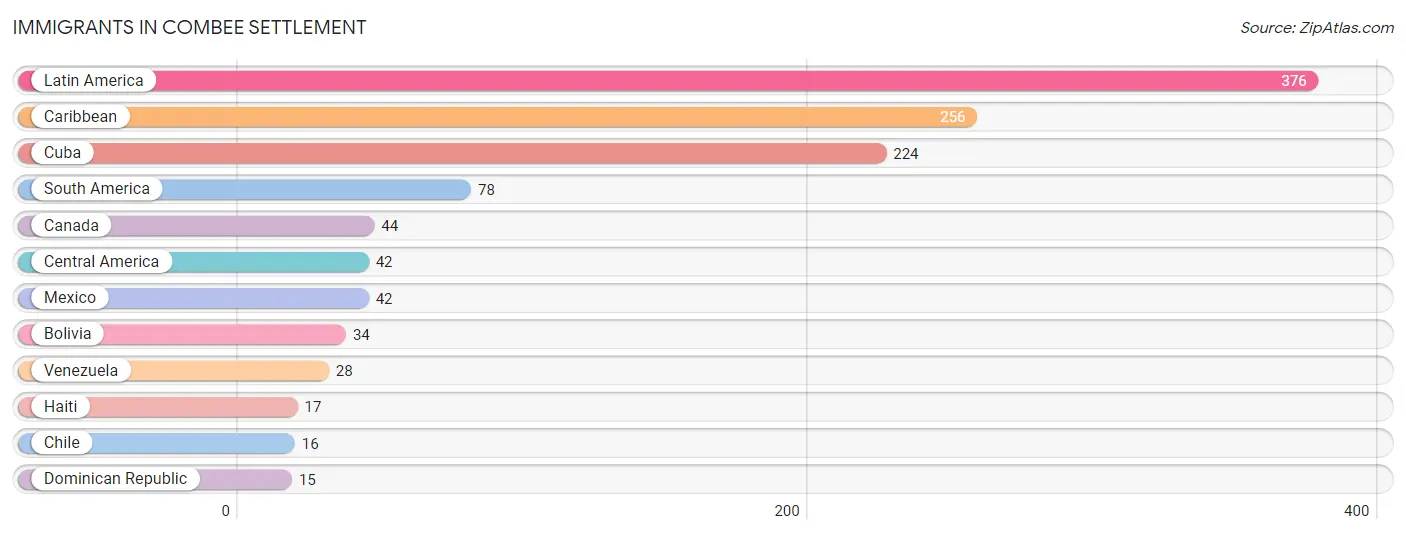
Immigrants in Combee Settlement
The most numerous immigrant groups reported in Combee Settlement came from Latin America (376 | 7.7%), Caribbean (256 | 5.2%), Cuba (224 | 4.6%), South America (78 | 1.6%), and Canada (44 | 0.9%), together accounting for 20.0% of all Combee Settlement residents.
| Immigration Origin | # Population | % Population |
| Bolivia | 34 | 0.7% |
| Canada | 44 | 0.9% |
| Caribbean | 256 | 5.2% |
| Central America | 42 | 0.9% |
| Chile | 16 | 0.3% |
| Cuba | 224 | 4.6% |
| Dominican Republic | 15 | 0.3% |
| Haiti | 17 | 0.4% |
| Latin America | 376 | 7.7% |
| Mexico | 42 | 0.9% |
| South America | 78 | 1.6% |
| Venezuela | 28 | 0.6% | View All 12 Rows |
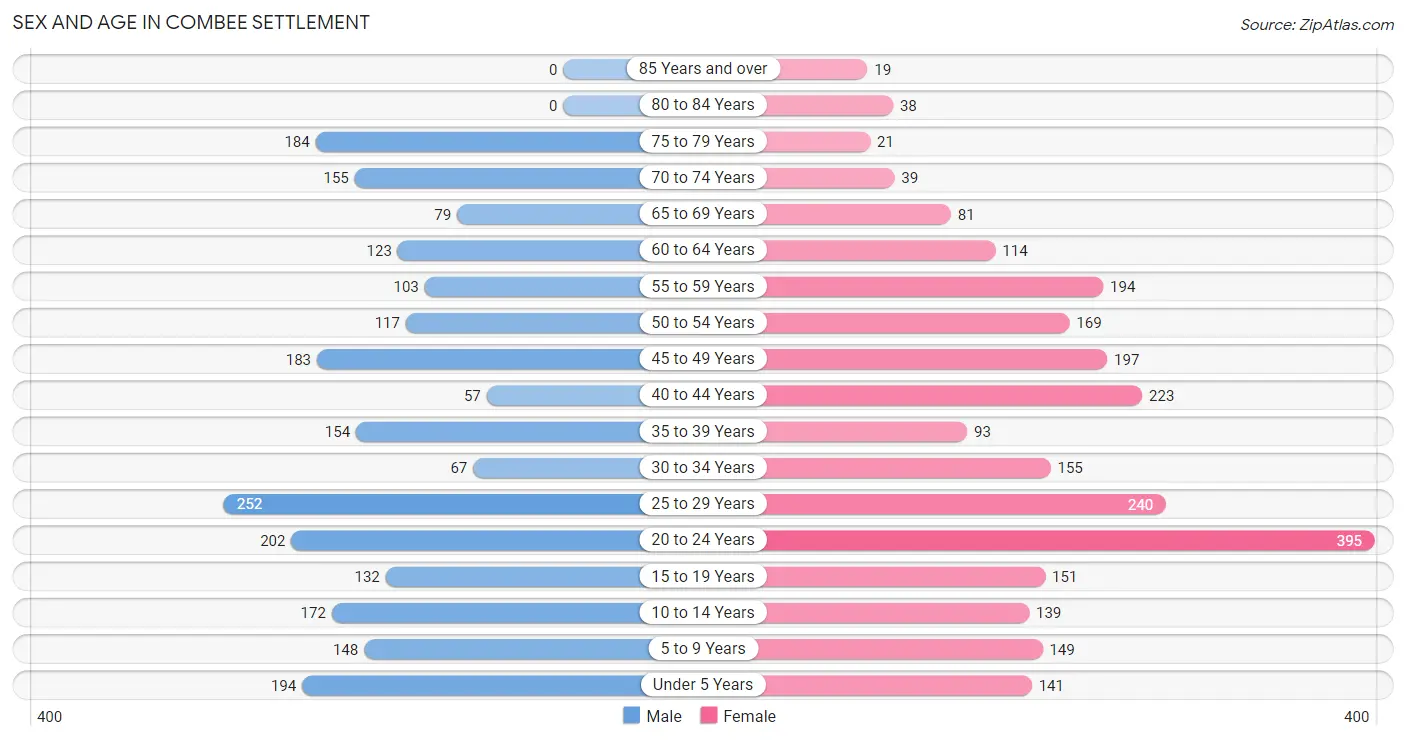
Sex and Age in Combee Settlement
Sex and Age in Combee Settlement
The most populous age groups in Combee Settlement are 25 to 29 Years (252 | 10.8%) for men and 20 to 24 Years (395 | 15.4%) for women.
| Age Bracket | Male | Female |
| Under 5 Years | 194 (8.4%) | 141 (5.5%) |
| 5 to 9 Years | 148 (6.4%) | 149 (5.8%) |
| 10 to 14 Years | 172 (7.4%) | 139 (5.4%) |
| 15 to 19 Years | 132 (5.7%) | 151 (5.9%) |
| 20 to 24 Years | 202 (8.7%) | 395 (15.4%) |
| 25 to 29 Years | 252 (10.8%) | 240 (9.4%) |
| 30 to 34 Years | 67 (2.9%) | 155 (6.1%) |
| 35 to 39 Years | 154 (6.6%) | 93 (3.6%) |
| 40 to 44 Years | 57 (2.5%) | 223 (8.7%) |
| 45 to 49 Years | 183 (7.9%) | 197 (7.7%) |
| 50 to 54 Years | 117 (5.0%) | 169 (6.6%) |
| 55 to 59 Years | 103 (4.4%) | 194 (7.6%) |
| 60 to 64 Years | 123 (5.3%) | 114 (4.5%) |
| 65 to 69 Years | 79 (3.4%) | 81 (3.2%) |
| 70 to 74 Years | 155 (6.7%) | 39 (1.5%) |
| 75 to 79 Years | 184 (7.9%) | 21 (0.8%) |
| 80 to 84 Years | 0 (0.0%) | 38 (1.5%) |
| 85 Years and over | 0 (0.0%) | 19 (0.7%) |
| Total | 2,322 (100.0%) | 2,558 (100.0%) |
Families and Households in Combee Settlement
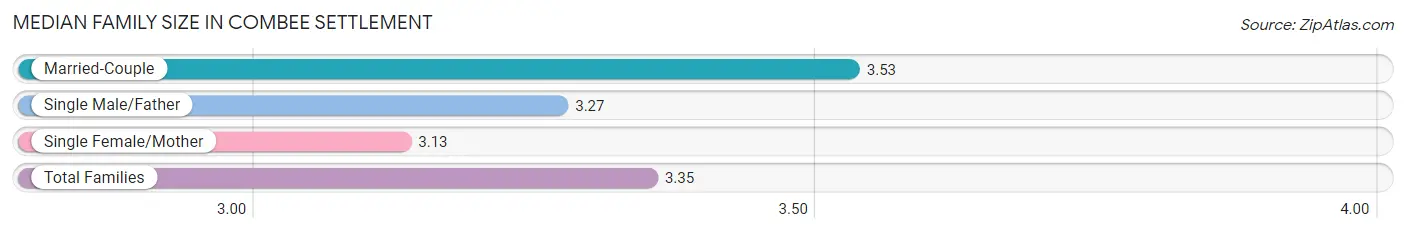
Median Family Size in Combee Settlement
The median family size in Combee Settlement is 3.35 persons per family, with married-couple families (578 | 51.3%) accounting for the largest median family size of 3.53 persons per family. On the other hand, single female/mother families (482 | 42.8%) represent the smallest median family size with 3.13 persons per family.
| Family Type | # Families | Family Size |
| Married-Couple | 578 (51.3%) | 3.53 |
| Single Male/Father | 66 (5.9%) | 3.27 |
| Single Female/Mother | 482 (42.8%) | 3.13 |
| Total Families | 1,126 (100.0%) | 3.35 |
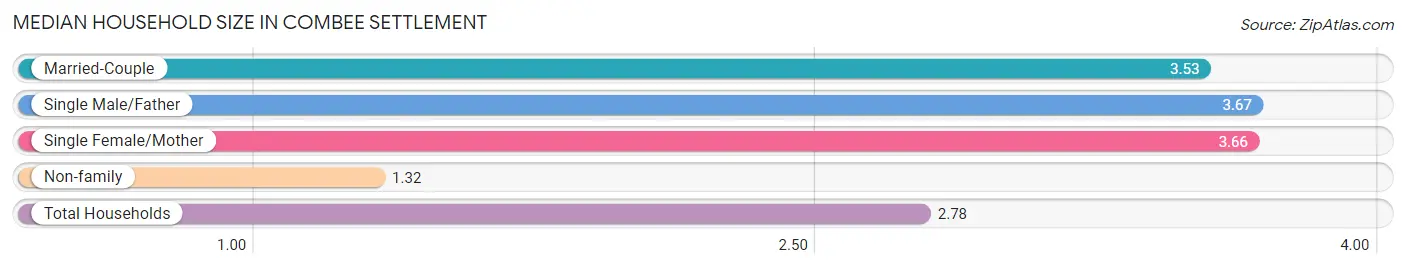
Median Household Size in Combee Settlement
The median household size in Combee Settlement is 2.78 persons per household, with single male/father households (66 | 3.7%) accounting for the largest median household size of 3.67 persons per household. non-family households (632 | 35.9%) represent the smallest median household size with 1.32 persons per household.
| Household Type | # Households | Household Size |
| Married-Couple | 578 (32.9%) | 3.53 |
| Single Male/Father | 66 (3.7%) | 3.67 |
| Single Female/Mother | 482 (27.4%) | 3.66 |
| Non-family | 632 (35.9%) | 1.32 |
| Total Households | 1,758 (100.0%) | 2.78 |
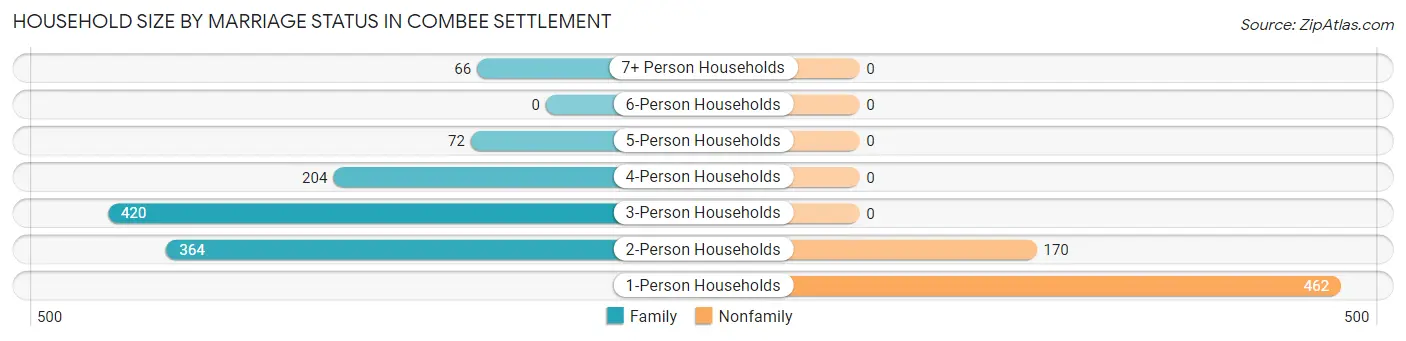
Household Size by Marriage Status in Combee Settlement
Out of a total of 1,758 households in Combee Settlement, 1,126 (64.0%) are family households, while 632 (35.9%) are nonfamily households. The most numerous type of family households are 3-person households, comprising 420, and the most common type of nonfamily households are 1-person households, comprising 462.
| Household Size | Family Households | Nonfamily Households |
| 1-Person Households | - | 462 (26.3%) |
| 2-Person Households | 364 (20.7%) | 170 (9.7%) |
| 3-Person Households | 420 (23.9%) | 0 (0.0%) |
| 4-Person Households | 204 (11.6%) | 0 (0.0%) |
| 5-Person Households | 72 (4.1%) | 0 (0.0%) |
| 6-Person Households | 0 (0.0%) | 0 (0.0%) |
| 7+ Person Households | 66 (3.7%) | 0 (0.0%) |
| Total | 1,126 (64.0%) | 632 (35.9%) |
Female Fertility in Combee Settlement
Fertility by Age in Combee Settlement
Average fertility rate in Combee Settlement is 167.0 births per 1,000 women. Women in the age bracket of 20 to 34 years have the highest fertility rate with 338.0 births per 1,000 women. Women in the age bracket of 20 to 34 years acount for 100.0% of all women with births.
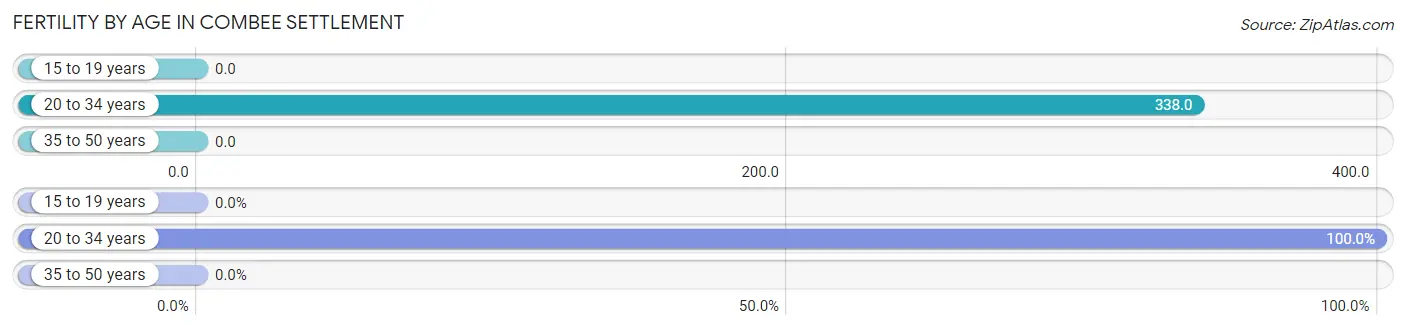
| Age Bracket | Women with Births | Births / 1,000 Women |
| 15 to 19 years | 0 (0.0%) | 0.0 |
| 20 to 34 years | 267 (100.0%) | 338.0 |
| 35 to 50 years | 0 (0.0%) | 0.0 |
| Total | 267 (100.0%) | 167.0 |
Fertility by Age by Marriage Status in Combee Settlement
15.7% of women with births (267) in Combee Settlement are married. The highest percentage of unmarried women with births falls into 20 to 34 years age bracket with 84.3% of them unmarried at the time of birth, while the lowest percentage of unmarried women with births belong to 20 to 34 years age bracket with 84.3% of them unmarried.
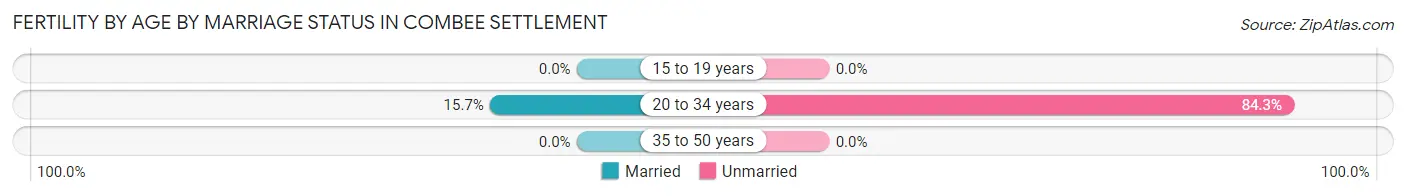
| Age Bracket | Married | Unmarried |
| 15 to 19 years | 0 (0.0%) | 0 (0.0%) |
| 20 to 34 years | 42 (15.7%) | 225 (84.3%) |
| 35 to 50 years | 0 (0.0%) | 0 (0.0%) |
| Total | 42 (15.7%) | 225 (84.3%) |
Fertility by Education in Combee Settlement
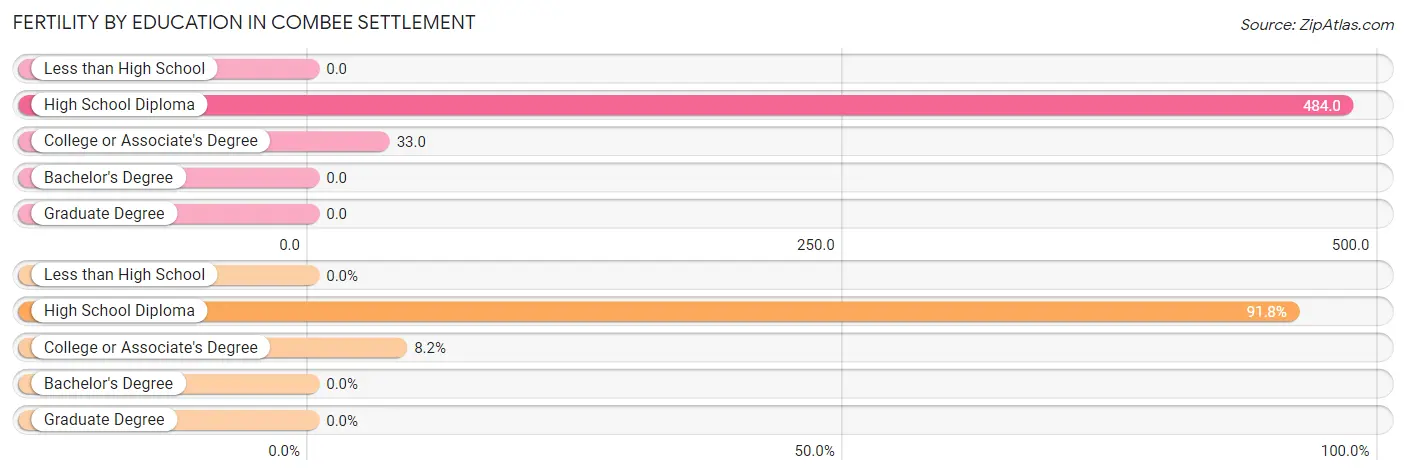
| Educational Attainment | Women with Births | Births / 1,000 Women |
| Less than High School | 0 (0.0%) | 0.0 |
| High School Diploma | 245 (91.8%) | 484.0 |
| College or Associate's Degree | 22 (8.2%) | 33.0 |
| Bachelor's Degree | 0 (0.0%) | 0.0 |
| Graduate Degree | 0 (0.0%) | 0.0 |
| Total | 267 (100.0%) | 167.0 |
Fertility by Education by Marriage Status in Combee Settlement
84.3% of women with births in Combee Settlement are unmarried. Women with the educational attainment of high school diploma are most likely to be married with 17.1% of them married at childbirth, while women with the educational attainment of college or associate's degree are least likely to be married with 100.0% of them unmarried at childbirth.
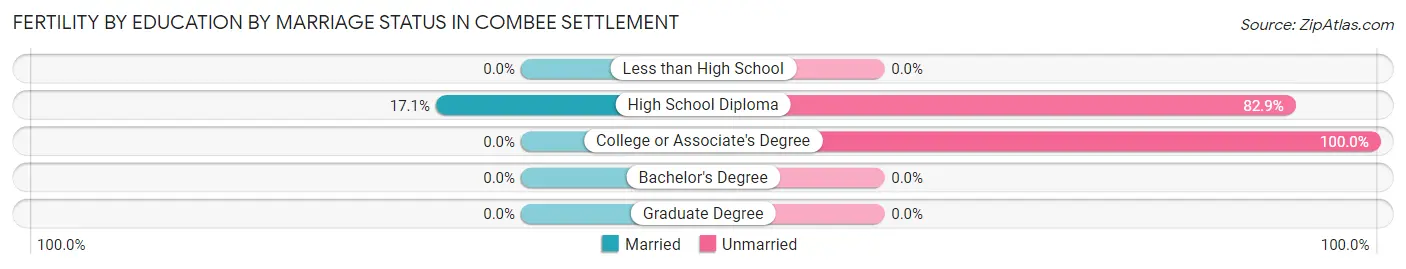
| Educational Attainment | Married | Unmarried |
| Less than High School | 0 (0.0%) | 0 (0.0%) |
| High School Diploma | 42 (17.1%) | 203 (82.9%) |
| College or Associate's Degree | 0 (0.0%) | 22 (100.0%) |
| Bachelor's Degree | 0 (0.0%) | 0 (0.0%) |
| Graduate Degree | 0 (0.0%) | 0 (0.0%) |
| Total | 42 (15.7%) | 225 (84.3%) |
Income in Combee Settlement
Income Overview in Combee Settlement
Per Capita Income in Combee Settlement is $19,485, while median incomes of families and households are $56,250 and $37,763 respectively.
| Characteristic | Number | Measure |
| Per Capita Income | 4,880 | $19,485 |
| Median Family Income | 1,126 | $56,250 |
| Mean Family Income | 1,126 | $56,052 |
| Median Household Income | 1,758 | $37,763 |
| Mean Household Income | 1,758 | $49,751 |
| Income Deficit | 1,126 | $0 |
| Wage / Income Gap (%) | 4,880 | 24.80% |
| Wage / Income Gap ($) | 4,880 | 75.20¢ per $1 |
| Gini / Inequality Index | 4,880 | 0.42 |
Earnings by Sex in Combee Settlement
Average Earnings in Combee Settlement are $28,771, $29,789 for men and $22,401 for women, a difference of 24.8%.
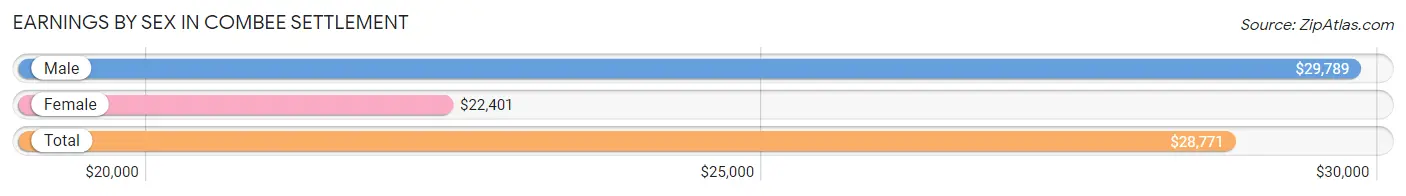
| Sex | Number | Average Earnings |
| Male | 1,016 (47.6%) | $29,789 |
| Female | 1,119 (52.4%) | $22,401 |
| Total | 2,135 (100.0%) | $28,771 |
Earnings by Sex by Income Bracket in Combee Settlement
The most common earnings brackets in Combee Settlement are $75,000 to $99,999 for men (145 | 14.3%) and $30,000 to $34,999 for women (274 | 24.5%).
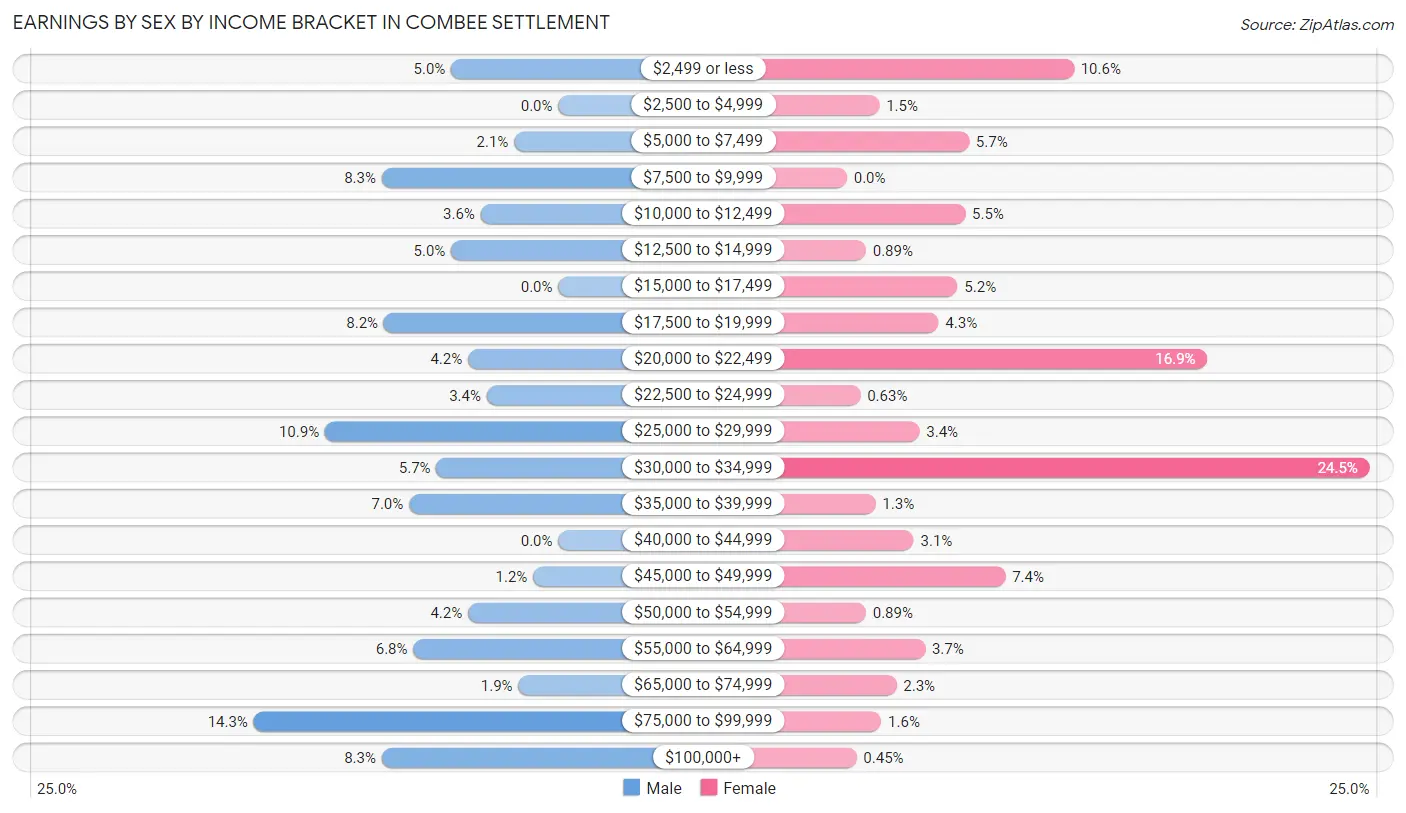
| Income | Male | Female |
| $2,499 or less | 51 (5.0%) | 119 (10.6%) |
| $2,500 to $4,999 | 0 (0.0%) | 17 (1.5%) |
| $5,000 to $7,499 | 21 (2.1%) | 64 (5.7%) |
| $7,500 to $9,999 | 84 (8.3%) | 0 (0.0%) |
| $10,000 to $12,499 | 37 (3.6%) | 62 (5.5%) |
| $12,500 to $14,999 | 51 (5.0%) | 10 (0.9%) |
| $15,000 to $17,499 | 0 (0.0%) | 58 (5.2%) |
| $17,500 to $19,999 | 83 (8.2%) | 48 (4.3%) |
| $20,000 to $22,499 | 43 (4.2%) | 189 (16.9%) |
| $22,500 to $24,999 | 34 (3.4%) | 7 (0.6%) |
| $25,000 to $29,999 | 111 (10.9%) | 38 (3.4%) |
| $30,000 to $34,999 | 58 (5.7%) | 274 (24.5%) |
| $35,000 to $39,999 | 71 (7.0%) | 15 (1.3%) |
| $40,000 to $44,999 | 0 (0.0%) | 35 (3.1%) |
| $45,000 to $49,999 | 12 (1.2%) | 83 (7.4%) |
| $50,000 to $54,999 | 43 (4.2%) | 10 (0.9%) |
| $55,000 to $64,999 | 69 (6.8%) | 41 (3.7%) |
| $65,000 to $74,999 | 19 (1.9%) | 26 (2.3%) |
| $75,000 to $99,999 | 145 (14.3%) | 18 (1.6%) |
| $100,000+ | 84 (8.3%) | 5 (0.4%) |
| Total | 1,016 (100.0%) | 1,119 (100.0%) |
Earnings by Sex by Educational Attainment in Combee Settlement
Average earnings in Combee Settlement are $34,550 for men and $32,581 for women, a difference of 5.7%. Men with an educational attainment of bachelor's degree enjoy the highest average annual earnings of $58,977, while those with high school diploma education earn the least with $28,991. Women with an educational attainment of college or associate's degree earn the most with the average annual earnings of $33,553, while those with high school diploma education have the smallest earnings of $30,417.
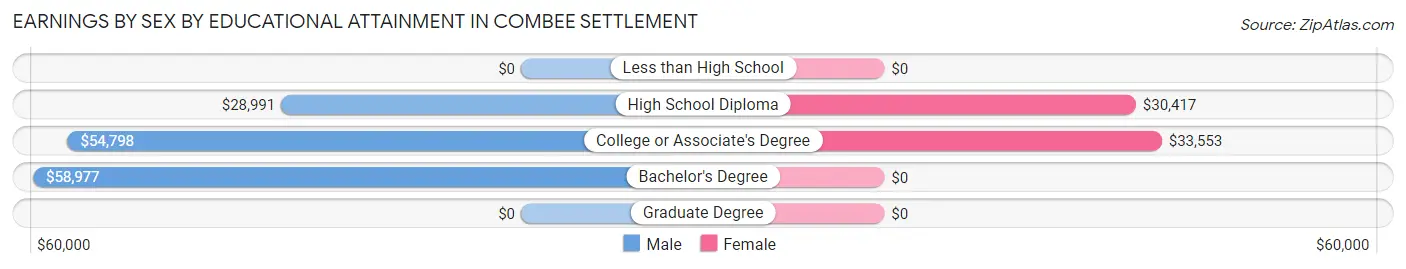
| Educational Attainment | Male Income | Female Income |
| Less than High School | - | - |
| High School Diploma | $28,991 | $30,417 |
| College or Associate's Degree | $54,798 | $33,553 |
| Bachelor's Degree | $58,977 | $0 |
| Graduate Degree | - | - |
| Total | $34,550 | $32,581 |
Family Income in Combee Settlement
Family Income Brackets in Combee Settlement
According to the Combee Settlement family income data, there are 356 families falling into the $50,000 to $74,999 income range, which is the most common income bracket and makes up 31.6% of all families.
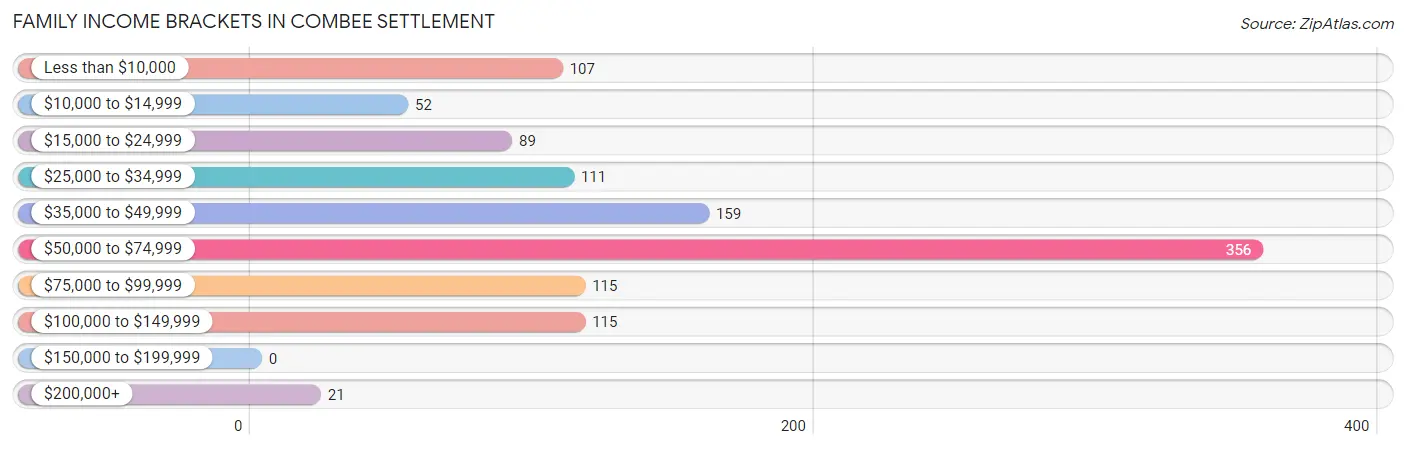
| Income Bracket | # Families | % Families |
| Less than $10,000 | 107 | 9.5% |
| $10,000 to $14,999 | 52 | 4.6% |
| $15,000 to $24,999 | 89 | 7.9% |
| $25,000 to $34,999 | 111 | 9.9% |
| $35,000 to $49,999 | 159 | 14.1% |
| $50,000 to $74,999 | 356 | 31.6% |
| $75,000 to $99,999 | 115 | 10.2% |
| $100,000 to $149,999 | 115 | 10.2% |
| $150,000 to $199,999 | 0 | 0.0% |
| $200,000+ | 21 | 1.9% |
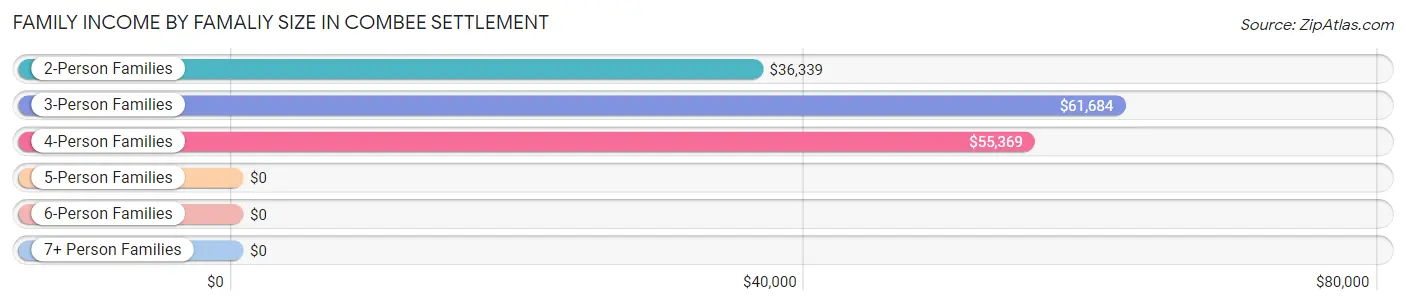
Family Income by Famaliy Size in Combee Settlement
3-person families (403 | 35.8%) account for the highest median family income in Combee Settlement with $61,684 per family, while 3-person families (403 | 35.8%) have the highest median income of $20,561 per family member.
| Income Bracket | # Families | Median Income |
| 2-Person Families | 421 (37.4%) | $36,339 |
| 3-Person Families | 403 (35.8%) | $61,684 |
| 4-Person Families | 169 (15.0%) | $55,369 |
| 5-Person Families | 85 (7.5%) | $0 |
| 6-Person Families | 0 (0.0%) | $0 |
| 7+ Person Families | 48 (4.3%) | $0 |
| Total | 1,126 (100.0%) | $56,250 |
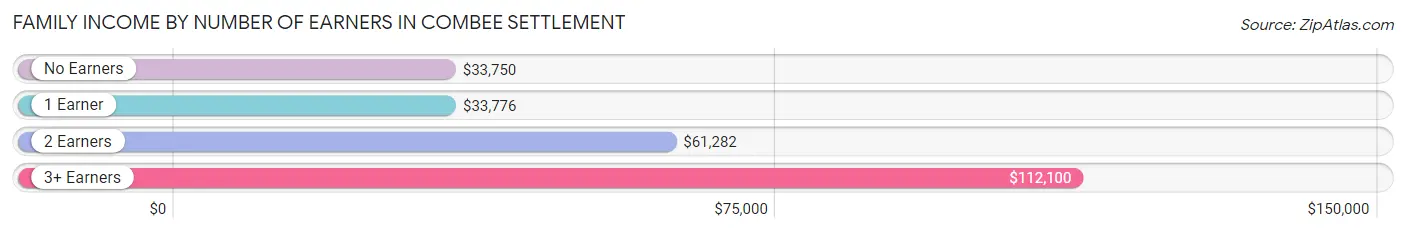
Family Income by Number of Earners in Combee Settlement
The median family income in Combee Settlement is $56,250, with families comprising 3+ earners (78) having the highest median family income of $112,100, while families with no earners (290) have the lowest median family income of $33,750, accounting for 6.9% and 25.8% of families, respectively.
| Number of Earners | # Families | Median Income |
| No Earners | 290 (25.8%) | $33,750 |
| 1 Earner | 315 (28.0%) | $33,776 |
| 2 Earners | 443 (39.3%) | $61,282 |
| 3+ Earners | 78 (6.9%) | $112,100 |
| Total | 1,126 (100.0%) | $56,250 |
Household Income in Combee Settlement
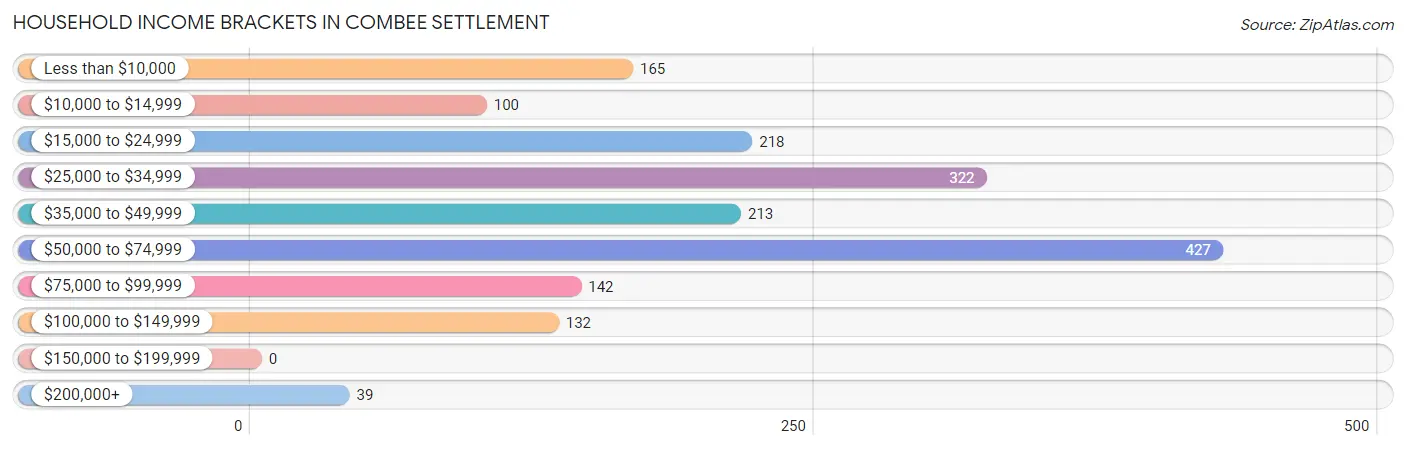
Household Income Brackets in Combee Settlement
With 427 households falling in the category, the $50,000 to $74,999 income range is the most frequent in Combee Settlement, accounting for 24.3% of all households.
| Income Bracket | # Households | % Households |
| Less than $10,000 | 165 | 9.4% |
| $10,000 to $14,999 | 100 | 5.7% |
| $15,000 to $24,999 | 218 | 12.4% |
| $25,000 to $34,999 | 322 | 18.3% |
| $35,000 to $49,999 | 213 | 12.1% |
| $50,000 to $74,999 | 427 | 24.3% |
| $75,000 to $99,999 | 142 | 8.1% |
| $100,000 to $149,999 | 132 | 7.5% |
| $150,000 to $199,999 | 0 | 0.0% |
| $200,000+ | 39 | 2.2% |
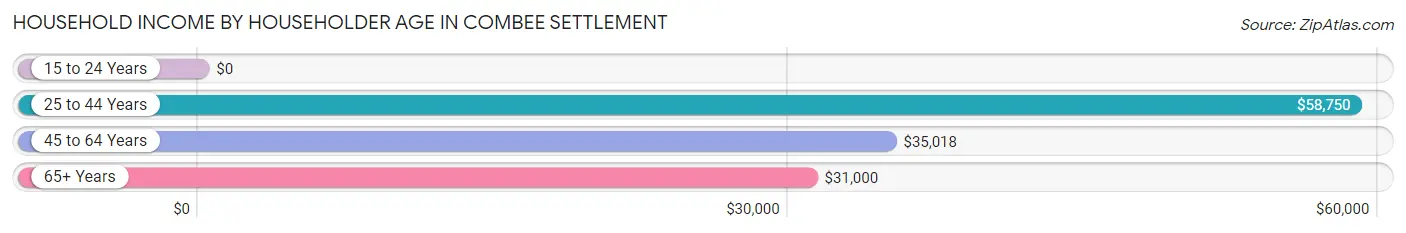
Household Income by Householder Age in Combee Settlement
The median household income in Combee Settlement is $37,763, with the highest median household income of $58,750 found in the 25 to 44 years age bracket for the primary householder. A total of 727 households (41.3%) fall into this category. Meanwhile, the 15 to 24 years age bracket for the primary householder has the lowest median household income of $0, with 48 households (2.7%) in this group.
| Income Bracket | # Households | Median Income |
| 15 to 24 Years | 48 (2.7%) | $0 |
| 25 to 44 Years | 727 (41.3%) | $58,750 |
| 45 to 64 Years | 655 (37.3%) | $35,018 |
| 65+ Years | 328 (18.7%) | $31,000 |
| Total | 1,758 (100.0%) | $37,763 |
Poverty in Combee Settlement
Income Below Poverty by Sex and Age in Combee Settlement
With 26.0% poverty level for males and 29.2% for females among the residents of Combee Settlement, 16 and 17 year old males and 55 to 64 year old females are the most vulnerable to poverty, with 4 males (100.0%) and 182 females (59.1%) in their respective age groups living below the poverty level.
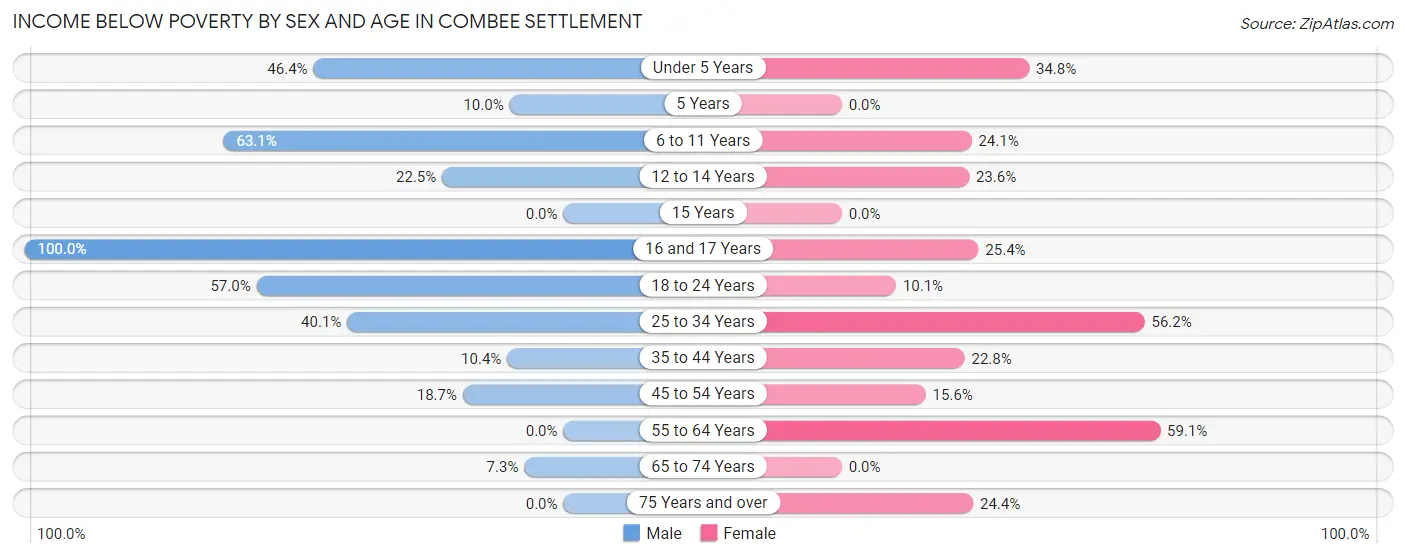
| Age Bracket | Male | Female |
| Under 5 Years | 90 (46.4%) | 49 (34.7%) |
| 5 Years | 11 (10.0%) | 0 (0.0%) |
| 6 to 11 Years | 82 (63.1%) | 52 (24.1%) |
| 12 to 14 Years | 18 (22.5%) | 17 (23.6%) |
| 15 Years | 0 (0.0%) | 0 (0.0%) |
| 16 and 17 Years | 4 (100.0%) | 35 (25.4%) |
| 18 to 24 Years | 176 (57.0%) | 41 (10.1%) |
| 25 to 34 Years | 128 (40.1%) | 222 (56.2%) |
| 35 to 44 Years | 22 (10.4%) | 72 (22.8%) |
| 45 to 54 Years | 56 (18.7%) | 57 (15.6%) |
| 55 to 64 Years | 0 (0.0%) | 182 (59.1%) |
| 65 to 74 Years | 17 (7.3%) | 0 (0.0%) |
| 75 Years and over | 0 (0.0%) | 19 (24.4%) |
| Total | 604 (26.0%) | 746 (29.2%) |
Income Above Poverty by Sex and Age in Combee Settlement
According to the poverty statistics in Combee Settlement, males aged 15 years and females aged 65 to 74 years are the age groups that are most secure financially, with 100.0% of males and 100.0% of females in these age groups living above the poverty line.
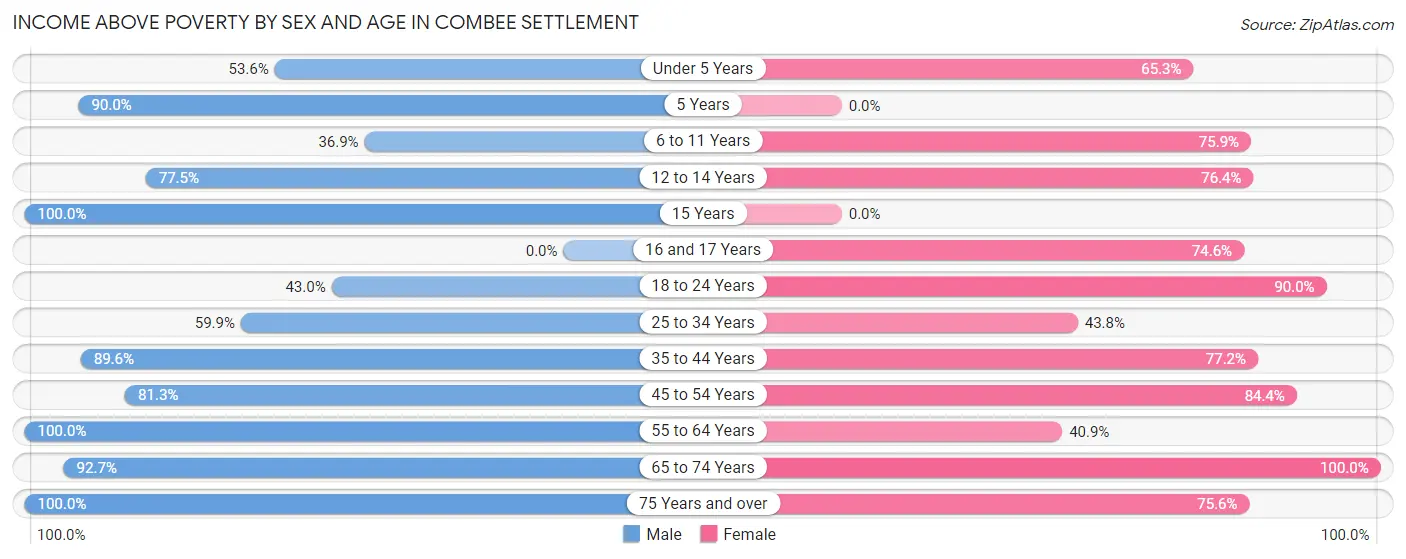
| Age Bracket | Male | Female |
| Under 5 Years | 104 (53.6%) | 92 (65.2%) |
| 5 Years | 99 (90.0%) | 0 (0.0%) |
| 6 to 11 Years | 48 (36.9%) | 164 (75.9%) |
| 12 to 14 Years | 62 (77.5%) | 55 (76.4%) |
| 15 Years | 21 (100.0%) | 0 (0.0%) |
| 16 and 17 Years | 0 (0.0%) | 103 (74.6%) |
| 18 to 24 Years | 133 (43.0%) | 367 (89.9%) |
| 25 to 34 Years | 191 (59.9%) | 173 (43.8%) |
| 35 to 44 Years | 189 (89.6%) | 244 (77.2%) |
| 45 to 54 Years | 244 (81.3%) | 309 (84.4%) |
| 55 to 64 Years | 226 (100.0%) | 126 (40.9%) |
| 65 to 74 Years | 217 (92.7%) | 120 (100.0%) |
| 75 Years and over | 184 (100.0%) | 59 (75.6%) |
| Total | 1,718 (74.0%) | 1,812 (70.8%) |
Income Below Poverty Among Married-Couple Families in Combee Settlement
The poverty statistics for married-couple families in Combee Settlement show that 15.6% or 90 of the total 578 families live below the poverty line. Families with 1 or 2 children have the highest poverty rate of 39.2%, comprising of 76 families. On the other hand, families with 3 or 4 children have the lowest poverty rate of 0.0%, which includes 0 families.
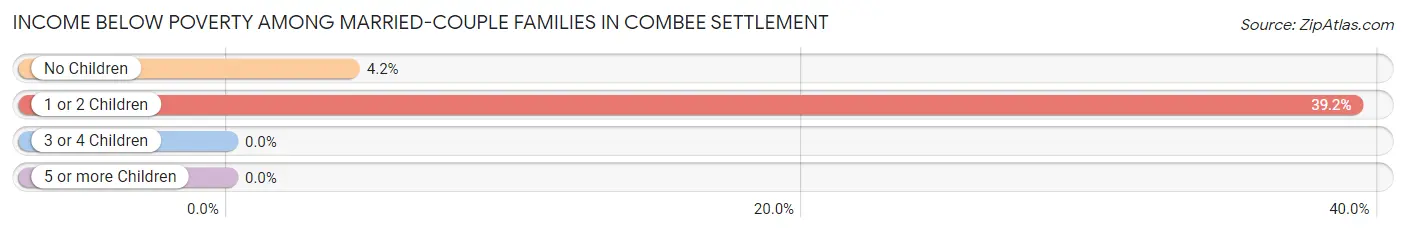
| Children | Above Poverty | Below Poverty |
| No Children | 316 (95.8%) | 14 (4.2%) |
| 1 or 2 Children | 118 (60.8%) | 76 (39.2%) |
| 3 or 4 Children | 6 (100.0%) | 0 (0.0%) |
| 5 or more Children | 48 (100.0%) | 0 (0.0%) |
| Total | 488 (84.4%) | 90 (15.6%) |
Income Below Poverty Among Single-Parent Households in Combee Settlement
According to the poverty data in Combee Settlement, 7.6% or 5 single-father households and 39.8% or 192 single-mother households are living below the poverty line. Among single-father households, those with 3 or 4 children have the highest poverty rate, with 5 households (100.0%) experiencing poverty. Likewise, among single-mother households, those with 1 or 2 children have the highest poverty rate, with 138 households (45.9%) falling below the poverty line.
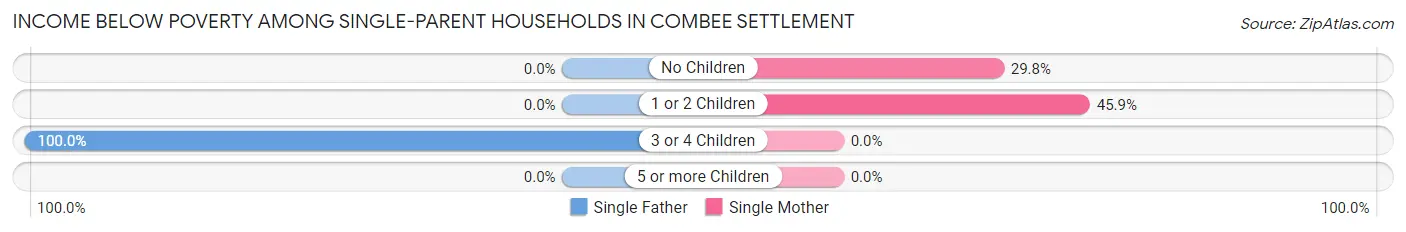
| Children | Single Father | Single Mother |
| No Children | 0 (0.0%) | 54 (29.8%) |
| 1 or 2 Children | 0 (0.0%) | 138 (45.9%) |
| 3 or 4 Children | 5 (100.0%) | 0 (0.0%) |
| 5 or more Children | 0 (0.0%) | 0 (0.0%) |
| Total | 5 (7.6%) | 192 (39.8%) |
Income Below Poverty Among Married-Couple vs Single-Parent Households in Combee Settlement
The poverty data for Combee Settlement shows that 90 of the married-couple family households (15.6%) and 197 of the single-parent households (35.9%) are living below the poverty level. Within the married-couple family households, those with 1 or 2 children have the highest poverty rate, with 76 households (39.2%) falling below the poverty line. Among the single-parent households, those with 3 or 4 children have the highest poverty rate, with 5 household (100.0%) living below poverty.
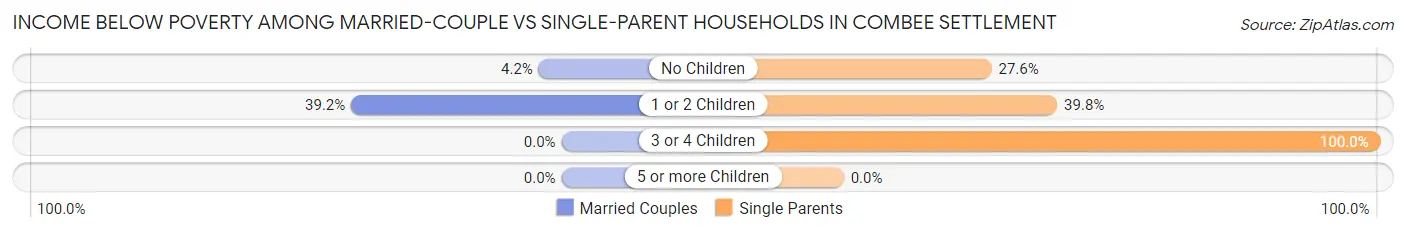
| Children | Married-Couple Families | Single-Parent Households |
| No Children | 14 (4.2%) | 54 (27.6%) |
| 1 or 2 Children | 76 (39.2%) | 138 (39.8%) |
| 3 or 4 Children | 0 (0.0%) | 5 (100.0%) |
| 5 or more Children | 0 (0.0%) | 0 (0.0%) |
| Total | 90 (15.6%) | 197 (35.9%) |
Employment Characteristics in Combee Settlement
Employment by Class of Employer in Combee Settlement
Among the 1,963 employed individuals in Combee Settlement, private company employees (1,620 | 82.5%), self-employed (not incorporated) (83 | 4.2%), and self-employed (incorporated) (81 | 4.1%) make up the most common classes of employment.
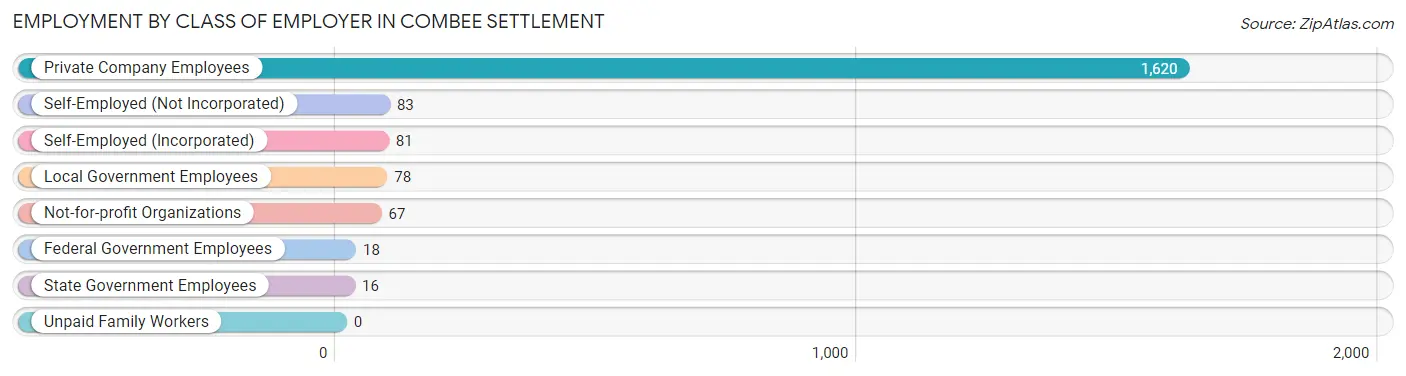
| Employer Class | # Employees | % Employees |
| Private Company Employees | 1,620 | 82.5% |
| Self-Employed (Incorporated) | 81 | 4.1% |
| Self-Employed (Not Incorporated) | 83 | 4.2% |
| Not-for-profit Organizations | 67 | 3.4% |
| Local Government Employees | 78 | 4.0% |
| State Government Employees | 16 | 0.8% |
| Federal Government Employees | 18 | 0.9% |
| Unpaid Family Workers | 0 | 0.0% |
| Total | 1,963 | 100.0% |
Employment Status by Age in Combee Settlement
According to the labor force statistics for Combee Settlement, out of the total population over 16 years of age (3,916), 53.3% or 2,087 individuals are in the labor force, with 5.2% or 109 of them unemployed. The age group with the highest labor force participation rate is 35 to 44 years, with 94.9% or 500 individuals in the labor force. Within the labor force, the 75 years and over age range has the highest percentage of unemployed individuals, with 28.3% or 13 of them being unemployed.
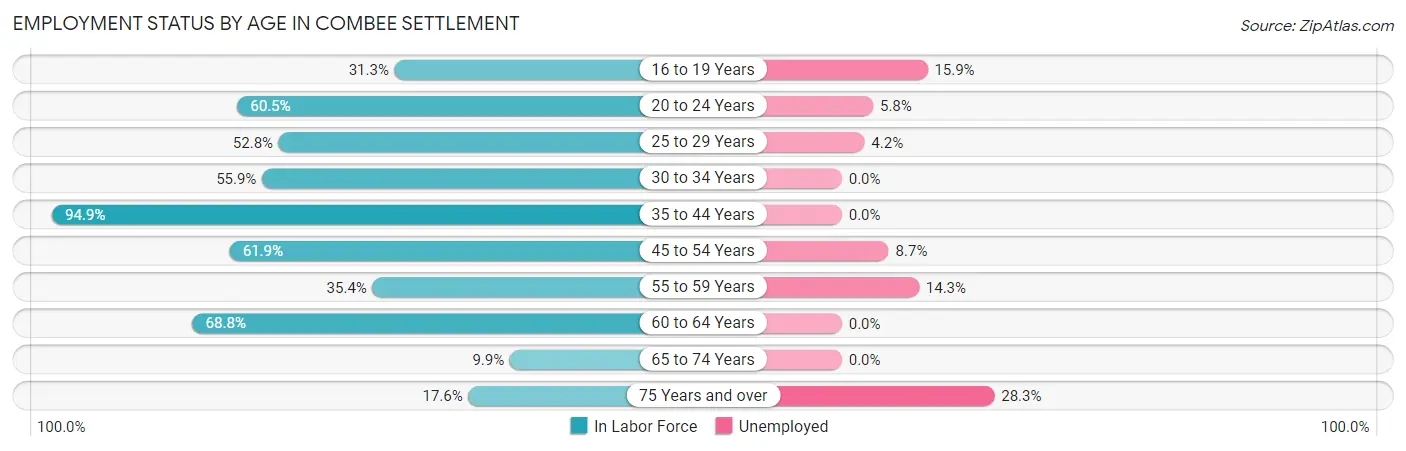
| Age Bracket | In Labor Force | Unemployed |
| 16 to 19 Years | 82 (31.3%) | 13 (15.9%) |
| 20 to 24 Years | 361 (60.5%) | 21 (5.8%) |
| 25 to 29 Years | 260 (52.8%) | 11 (4.2%) |
| 30 to 34 Years | 124 (55.9%) | 0 (0.0%) |
| 35 to 44 Years | 500 (94.9%) | 0 (0.0%) |
| 45 to 54 Years | 412 (61.9%) | 36 (8.7%) |
| 55 to 59 Years | 105 (35.4%) | 15 (14.3%) |
| 60 to 64 Years | 163 (68.8%) | 0 (0.0%) |
| 65 to 74 Years | 35 (9.9%) | 0 (0.0%) |
| 75 Years and over | 46 (17.6%) | 13 (28.3%) |
| Total | 2,087 (53.3%) | 109 (5.2%) |
Employment Status by Educational Attainment in Combee Settlement
According to labor force statistics for Combee Settlement, 64.1% of individuals (1,565) out of the total population between 25 and 64 years of age (2,441) are in the labor force, with 4.0% or 63 of them being unemployed. The group with the highest labor force participation rate are those with the educational attainment of bachelor's degree or higher, with 100.0% or 86 individuals in the labor force. Within the labor force, individuals with less than high school education have the highest percentage of unemployment, with 34.3% or 36 of them being unemployed.
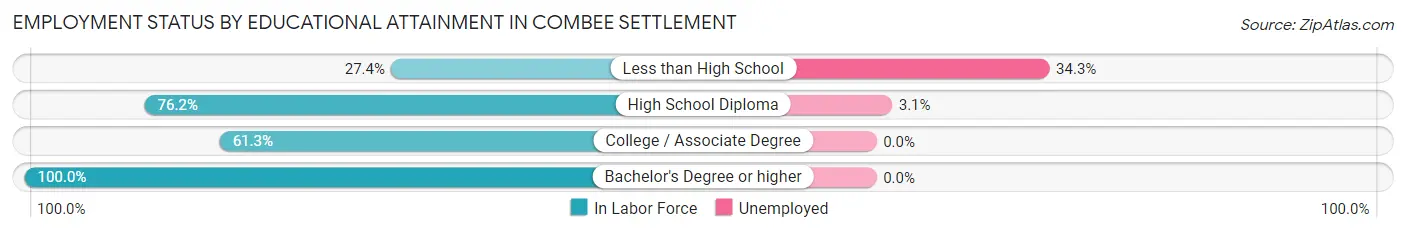
| Educational Attainment | In Labor Force | Unemployed |
| Less than High School | 105 (27.4%) | 131 (34.3%) |
| High School Diploma | 840 (76.2%) | 34 (3.1%) |
| College / Associate Degree | 533 (61.3%) | 0 (0.0%) |
| Bachelor's Degree or higher | 86 (100.0%) | 0 (0.0%) |
| Total | 1,565 (64.1%) | 98 (4.0%) |
Employment Occupations by Sex in Combee Settlement
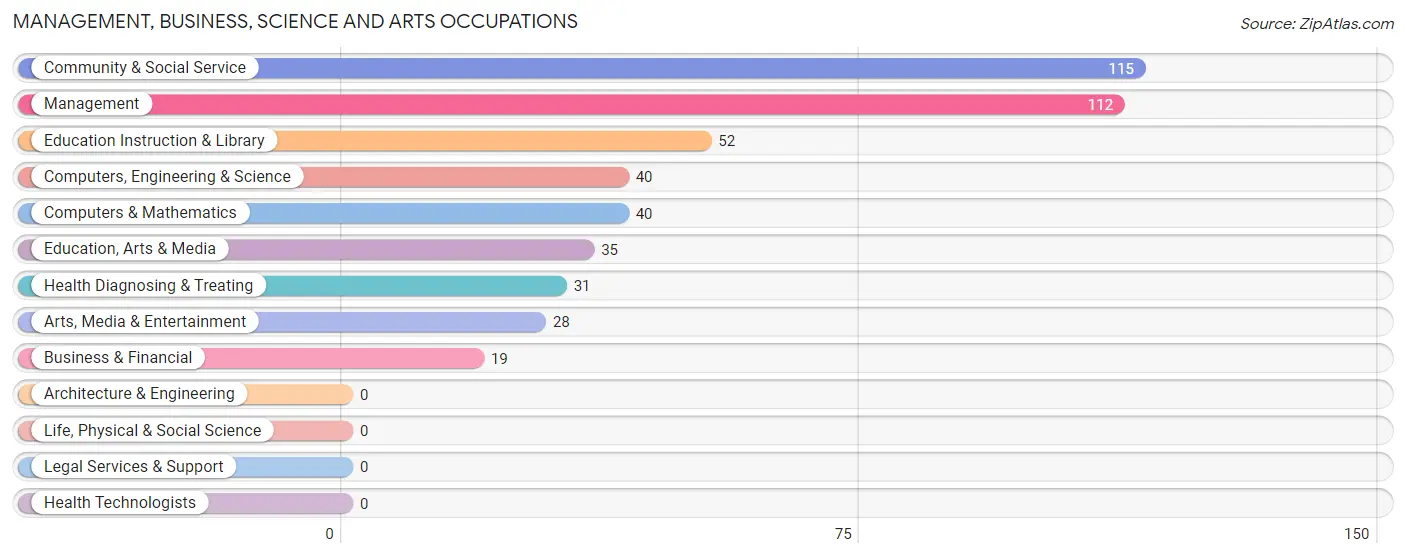
Management, Business, Science and Arts Occupations
The most common Management, Business, Science and Arts occupations in Combee Settlement are Community & Social Service (115 | 5.8%), Management (112 | 5.7%), Education Instruction & Library (52 | 2.6%), Computers, Engineering & Science (40 | 2.0%), and Computers & Mathematics (40 | 2.0%).
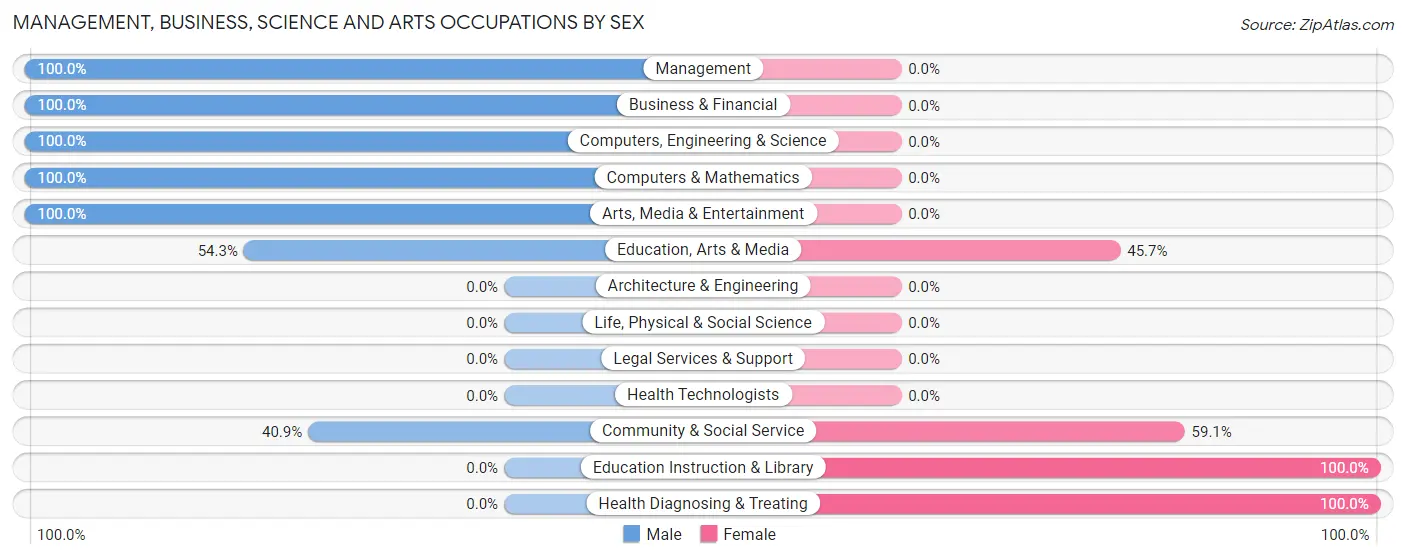
Management, Business, Science and Arts Occupations by Sex
Within the Management, Business, Science and Arts occupations in Combee Settlement, the most male-oriented occupations are Management (100.0%), Business & Financial (100.0%), and Computers, Engineering & Science (100.0%), while the most female-oriented occupations are Education Instruction & Library (100.0%), Health Diagnosing & Treating (100.0%), and Community & Social Service (59.1%).
| Occupation | Male | Female |
| Management | 112 (100.0%) | 0 (0.0%) |
| Business & Financial | 19 (100.0%) | 0 (0.0%) |
| Computers, Engineering & Science | 40 (100.0%) | 0 (0.0%) |
| Computers & Mathematics | 40 (100.0%) | 0 (0.0%) |
| Architecture & Engineering | 0 (0.0%) | 0 (0.0%) |
| Life, Physical & Social Science | 0 (0.0%) | 0 (0.0%) |
| Community & Social Service | 47 (40.9%) | 68 (59.1%) |
| Education, Arts & Media | 19 (54.3%) | 16 (45.7%) |
| Legal Services & Support | 0 (0.0%) | 0 (0.0%) |
| Education Instruction & Library | 0 (0.0%) | 52 (100.0%) |
| Arts, Media & Entertainment | 28 (100.0%) | 0 (0.0%) |
| Health Diagnosing & Treating | 0 (0.0%) | 31 (100.0%) |
| Health Technologists | 0 (0.0%) | 0 (0.0%) |
| Total (Category) | 218 (68.8%) | 99 (31.2%) |
| Total (Overall) | 984 (49.7%) | 995 (50.3%) |
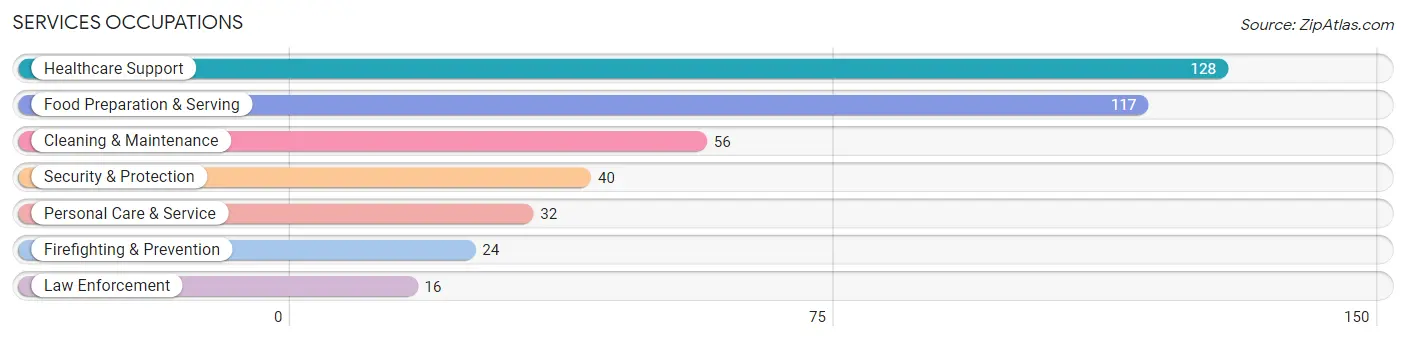
Services Occupations
The most common Services occupations in Combee Settlement are Healthcare Support (128 | 6.5%), Food Preparation & Serving (117 | 5.9%), Cleaning & Maintenance (56 | 2.8%), Security & Protection (40 | 2.0%), and Personal Care & Service (32 | 1.6%).
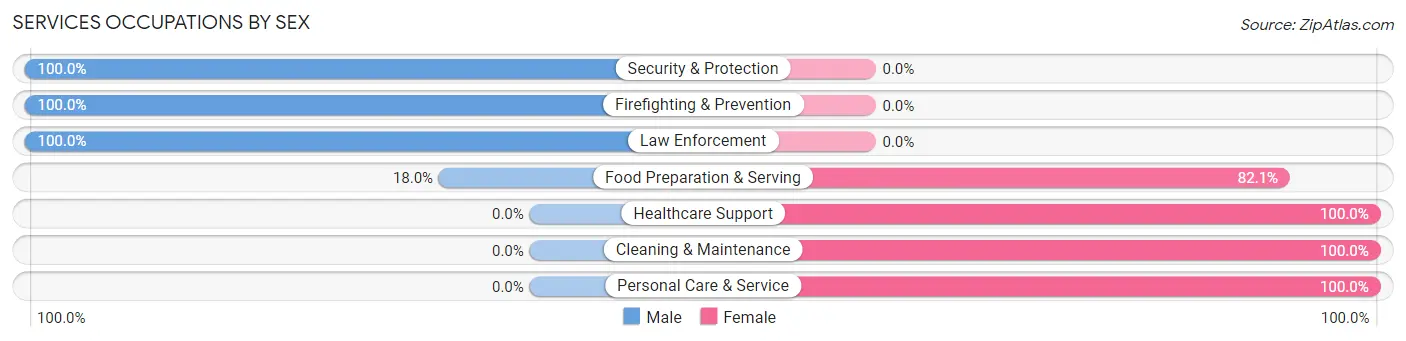
Services Occupations by Sex
Within the Services occupations in Combee Settlement, the most male-oriented occupations are Security & Protection (100.0%), Firefighting & Prevention (100.0%), and Law Enforcement (100.0%), while the most female-oriented occupations are Healthcare Support (100.0%), Cleaning & Maintenance (100.0%), and Personal Care & Service (100.0%).
| Occupation | Male | Female |
| Healthcare Support | 0 (0.0%) | 128 (100.0%) |
| Security & Protection | 40 (100.0%) | 0 (0.0%) |
| Firefighting & Prevention | 24 (100.0%) | 0 (0.0%) |
| Law Enforcement | 16 (100.0%) | 0 (0.0%) |
| Food Preparation & Serving | 21 (17.9%) | 96 (82.1%) |
| Cleaning & Maintenance | 0 (0.0%) | 56 (100.0%) |
| Personal Care & Service | 0 (0.0%) | 32 (100.0%) |
| Total (Category) | 61 (16.4%) | 312 (83.7%) |
| Total (Overall) | 984 (49.7%) | 995 (50.3%) |
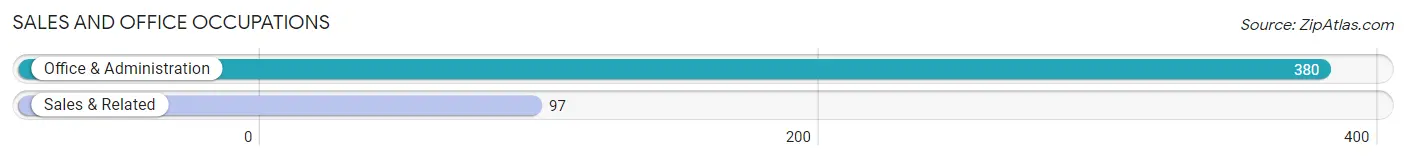
Sales and Office Occupations
The most common Sales and Office occupations in Combee Settlement are Office & Administration (380 | 19.2%), and Sales & Related (97 | 4.9%).
Sales and Office Occupations by Sex
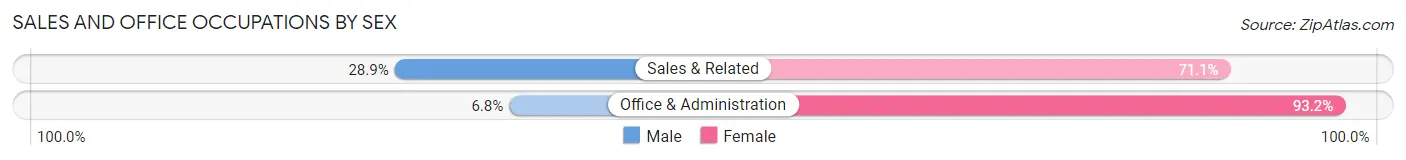
| Occupation | Male | Female |
| Sales & Related | 28 (28.9%) | 69 (71.1%) |
| Office & Administration | 26 (6.8%) | 354 (93.2%) |
| Total (Category) | 54 (11.3%) | 423 (88.7%) |
| Total (Overall) | 984 (49.7%) | 995 (50.3%) |
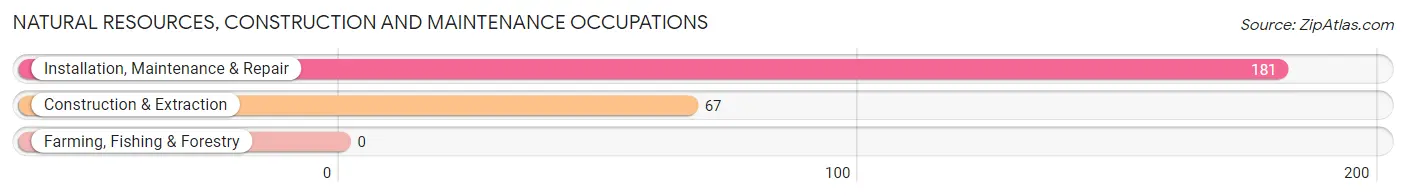
Natural Resources, Construction and Maintenance Occupations
The most common Natural Resources, Construction and Maintenance occupations in Combee Settlement are Installation, Maintenance & Repair (181 | 9.1%), and Construction & Extraction (67 | 3.4%).
Natural Resources, Construction and Maintenance Occupations by Sex
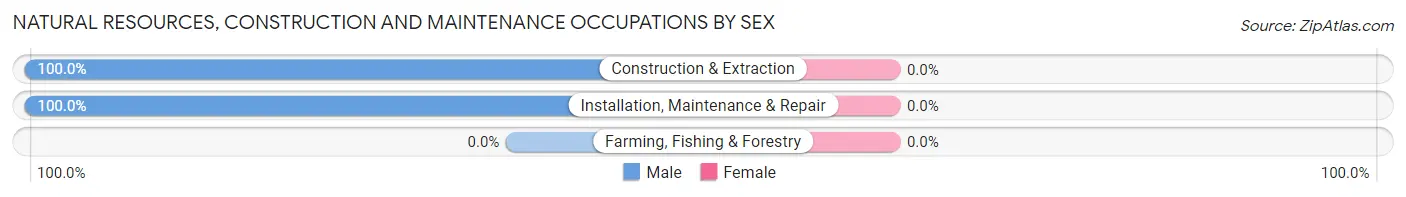
| Occupation | Male | Female |
| Farming, Fishing & Forestry | 0 (0.0%) | 0 (0.0%) |
| Construction & Extraction | 67 (100.0%) | 0 (0.0%) |
| Installation, Maintenance & Repair | 181 (100.0%) | 0 (0.0%) |
| Total (Category) | 248 (100.0%) | 0 (0.0%) |
| Total (Overall) | 984 (49.7%) | 995 (50.3%) |
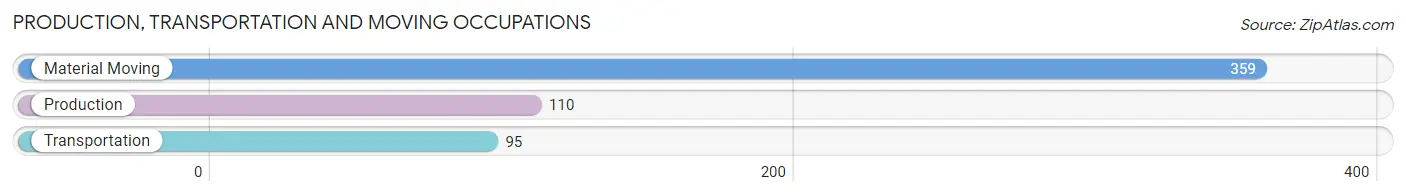
Production, Transportation and Moving Occupations
The most common Production, Transportation and Moving occupations in Combee Settlement are Material Moving (359 | 18.1%), Production (110 | 5.6%), and Transportation (95 | 4.8%).
Production, Transportation and Moving Occupations by Sex
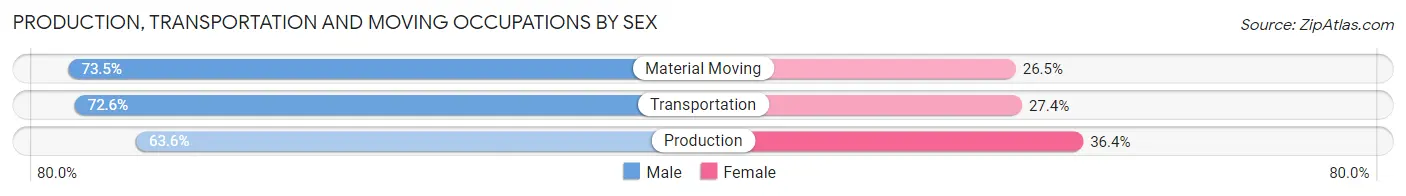
| Occupation | Male | Female |
| Production | 70 (63.6%) | 40 (36.4%) |
| Transportation | 69 (72.6%) | 26 (27.4%) |
| Material Moving | 264 (73.5%) | 95 (26.5%) |
| Total (Category) | 403 (71.5%) | 161 (28.5%) |
| Total (Overall) | 984 (49.7%) | 995 (50.3%) |
Employment Industries by Sex in Combee Settlement
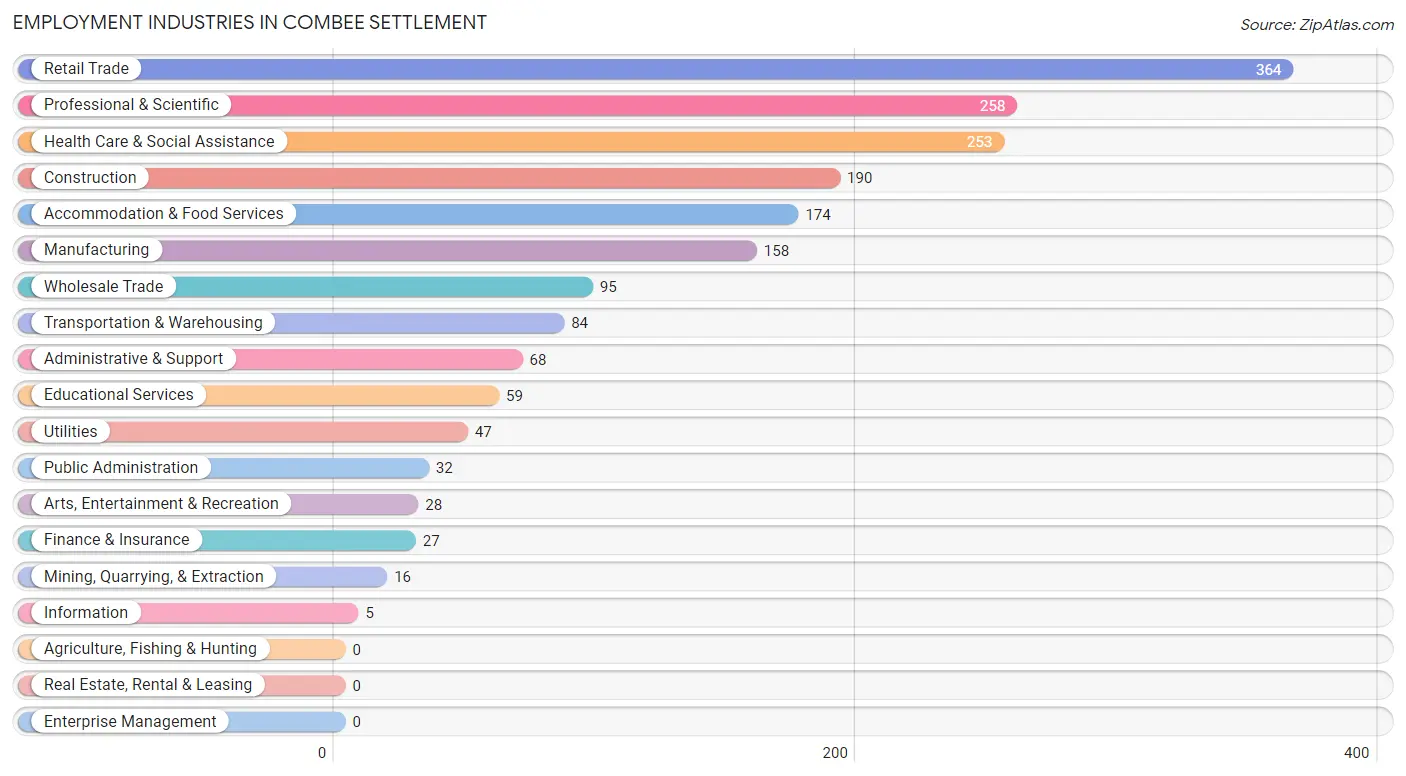
Employment Industries in Combee Settlement
The major employment industries in Combee Settlement include Retail Trade (364 | 18.4%), Professional & Scientific (258 | 13.0%), Health Care & Social Assistance (253 | 12.8%), Construction (190 | 9.6%), and Accommodation & Food Services (174 | 8.8%).
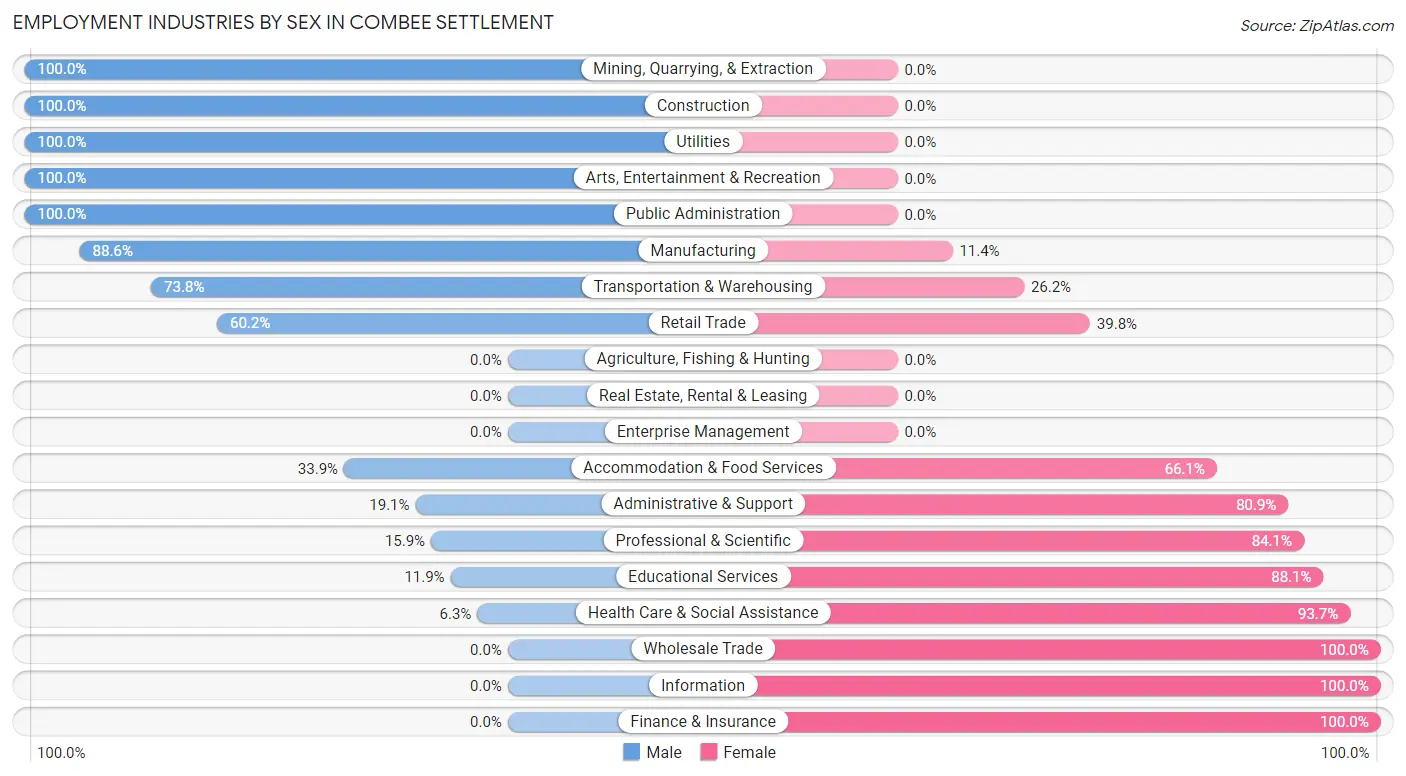
Employment Industries by Sex in Combee Settlement
The Combee Settlement industries that see more men than women are Mining, Quarrying, & Extraction (100.0%), Construction (100.0%), and Utilities (100.0%), whereas the industries that tend to have a higher number of women are Wholesale Trade (100.0%), Information (100.0%), and Finance & Insurance (100.0%).
| Industry | Male | Female |
| Agriculture, Fishing & Hunting | 0 (0.0%) | 0 (0.0%) |
| Mining, Quarrying, & Extraction | 16 (100.0%) | 0 (0.0%) |
| Construction | 190 (100.0%) | 0 (0.0%) |
| Manufacturing | 140 (88.6%) | 18 (11.4%) |
| Wholesale Trade | 0 (0.0%) | 95 (100.0%) |
| Retail Trade | 219 (60.2%) | 145 (39.8%) |
| Transportation & Warehousing | 62 (73.8%) | 22 (26.2%) |
| Utilities | 47 (100.0%) | 0 (0.0%) |
| Information | 0 (0.0%) | 5 (100.0%) |
| Finance & Insurance | 0 (0.0%) | 27 (100.0%) |
| Real Estate, Rental & Leasing | 0 (0.0%) | 0 (0.0%) |
| Professional & Scientific | 41 (15.9%) | 217 (84.1%) |
| Enterprise Management | 0 (0.0%) | 0 (0.0%) |
| Administrative & Support | 13 (19.1%) | 55 (80.9%) |
| Educational Services | 7 (11.9%) | 52 (88.1%) |
| Health Care & Social Assistance | 16 (6.3%) | 237 (93.7%) |
| Arts, Entertainment & Recreation | 28 (100.0%) | 0 (0.0%) |
| Accommodation & Food Services | 59 (33.9%) | 115 (66.1%) |
| Public Administration | 32 (100.0%) | 0 (0.0%) |
| Total | 984 (49.7%) | 995 (50.3%) |
Education in Combee Settlement
School Enrollment in Combee Settlement
The most common levels of schooling among the 934 students in Combee Settlement are elementary school (250 | 26.8%), college / undergraduate (249 | 26.7%), and high school (236 | 25.3%).
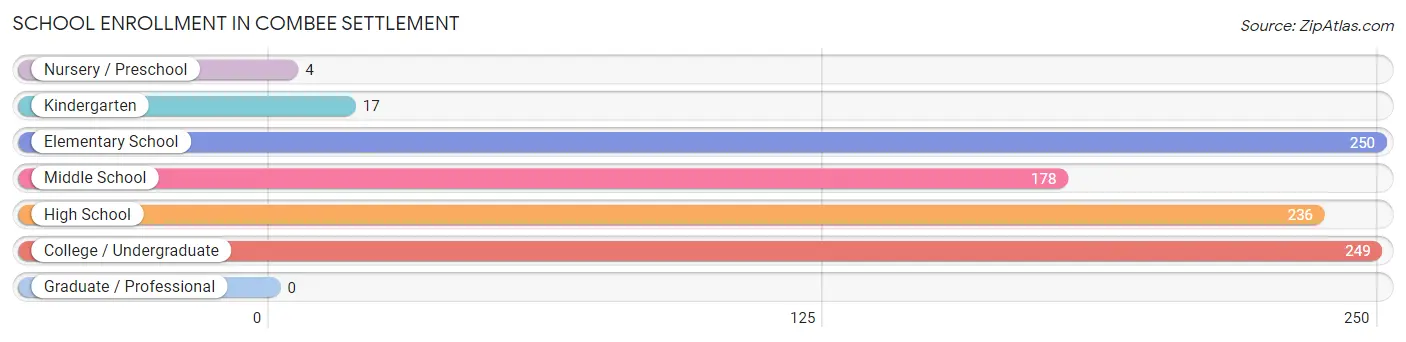
| School Level | # Students | % Students |
| Nursery / Preschool | 4 | 0.4% |
| Kindergarten | 17 | 1.8% |
| Elementary School | 250 | 26.8% |
| Middle School | 178 | 19.1% |
| High School | 236 | 25.3% |
| College / Undergraduate | 249 | 26.7% |
| Graduate / Professional | 0 | 0.0% |
| Total | 934 | 100.0% |
School Enrollment by Age by Funding Source in Combee Settlement
Out of a total of 934 students who are enrolled in schools in Combee Settlement, 168 (18.0%) attend a private institution, while the remaining 766 (82.0%) are enrolled in public schools. The age group of 25 to 34 year olds has the highest likelihood of being enrolled in private schools, with 48 (100.0% in the age bracket) enrolled. Conversely, the age group of 15 to 17 year olds has the lowest likelihood of being enrolled in a private school, with 146 (100.0% in the age bracket) attending a public institution.
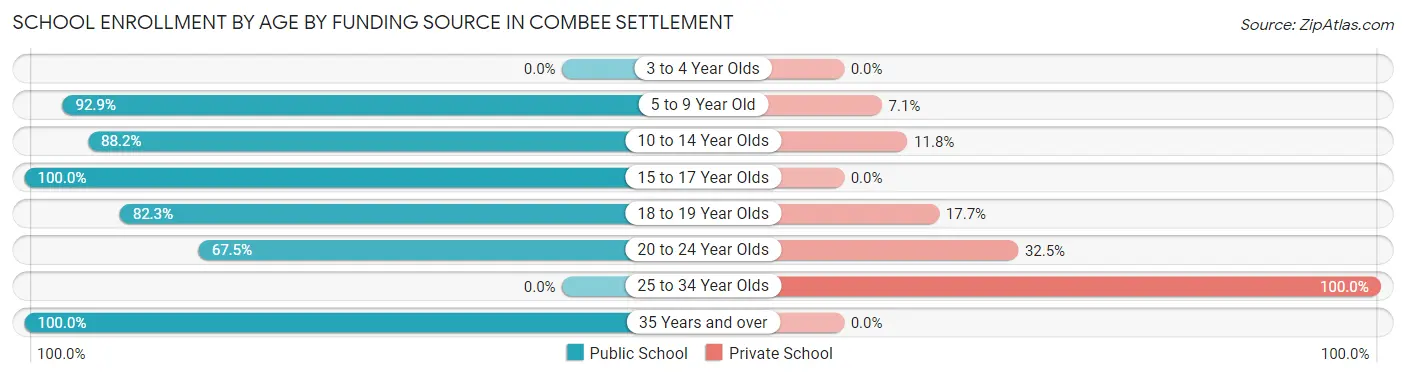
| Age Bracket | Public School | Private School |
| 3 to 4 Year Olds | 0 (0.0%) | 0 (0.0%) |
| 5 to 9 Year Old | 184 (92.9%) | 14 (7.1%) |
| 10 to 14 Year Olds | 246 (88.2%) | 33 (11.8%) |
| 15 to 17 Year Olds | 146 (100.0%) | 0 (0.0%) |
| 18 to 19 Year Olds | 51 (82.3%) | 11 (17.7%) |
| 20 to 24 Year Olds | 129 (67.5%) | 62 (32.5%) |
| 25 to 34 Year Olds | 0 (0.0%) | 48 (100.0%) |
| 35 Years and over | 10 (100.0%) | 0 (0.0%) |
| Total | 766 (82.0%) | 168 (18.0%) |
Educational Attainment by Field of Study in Combee Settlement
Liberal arts & history (73 | 33.3%), education (59 | 26.9%), engineering (22 | 10.1%), social sciences (21 | 9.6%), and literature & languages (17 | 7.8%) are the most common fields of study among 219 individuals in Combee Settlement who have obtained a bachelor's degree or higher.
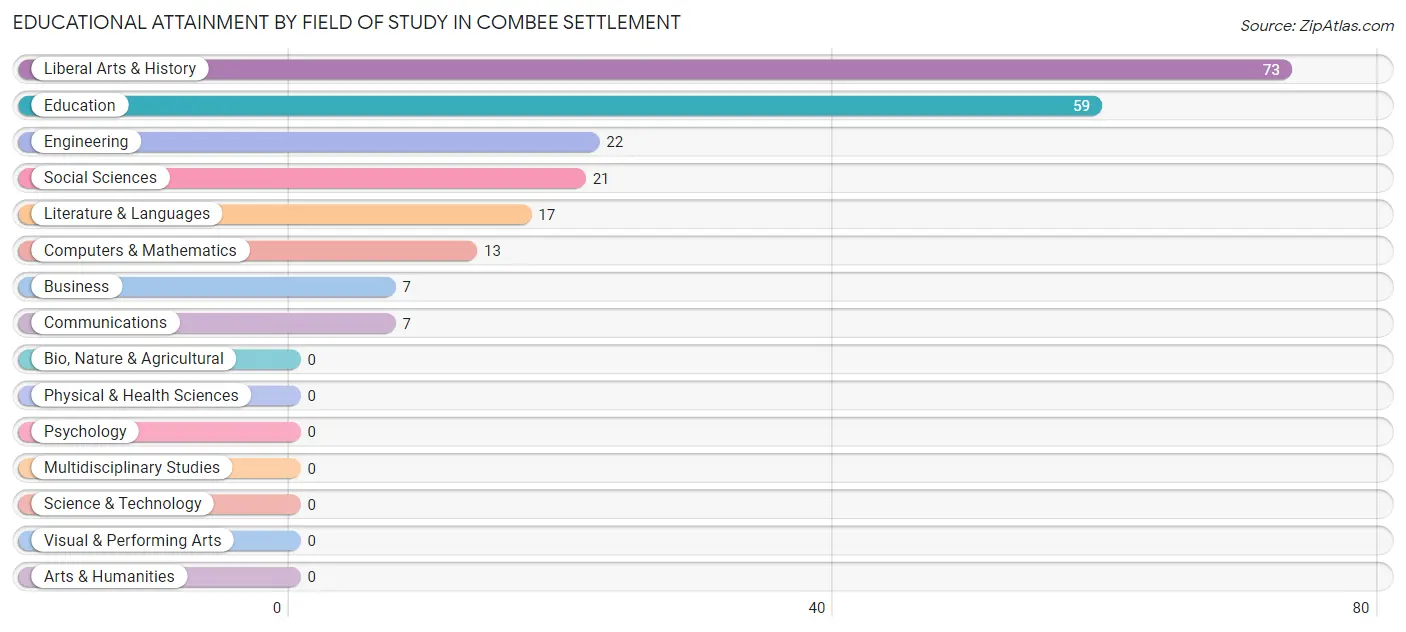
| Field of Study | # Graduates | % Graduates |
| Computers & Mathematics | 13 | 5.9% |
| Bio, Nature & Agricultural | 0 | 0.0% |
| Physical & Health Sciences | 0 | 0.0% |
| Psychology | 0 | 0.0% |
| Social Sciences | 21 | 9.6% |
| Engineering | 22 | 10.1% |
| Multidisciplinary Studies | 0 | 0.0% |
| Science & Technology | 0 | 0.0% |
| Business | 7 | 3.2% |
| Education | 59 | 26.9% |
| Literature & Languages | 17 | 7.8% |
| Liberal Arts & History | 73 | 33.3% |
| Visual & Performing Arts | 0 | 0.0% |
| Communications | 7 | 3.2% |
| Arts & Humanities | 0 | 0.0% |
| Total | 219 | 100.0% |
Transportation & Commute in Combee Settlement
Vehicle Availability by Sex in Combee Settlement
The most prevalent vehicle ownership categories in Combee Settlement are males with 2 vehicles (481, accounting for 48.9%) and females with 2 vehicles (204, making up 49.1%).
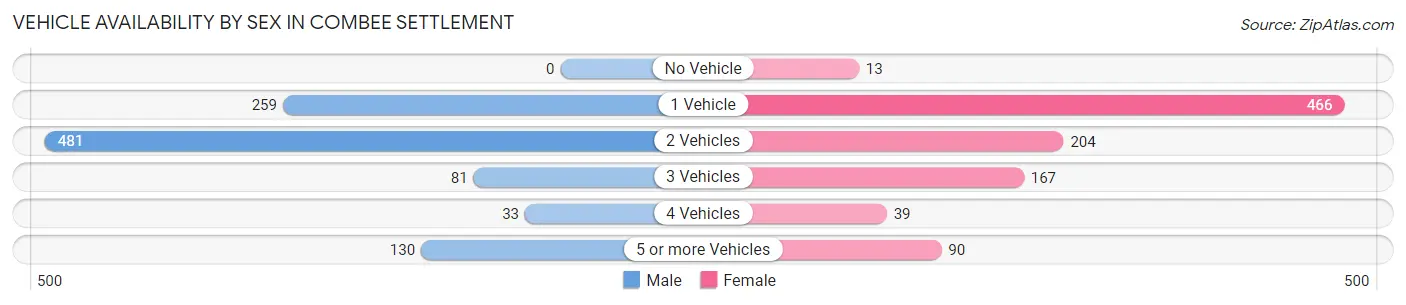
| Vehicles Available | Male | Female |
| No Vehicle | 0 (0.0%) | 13 (1.3%) |
| 1 Vehicle | 259 (26.3%) | 466 (47.6%) |
| 2 Vehicles | 481 (48.9%) | 204 (20.8%) |
| 3 Vehicles | 81 (8.2%) | 167 (17.1%) |
| 4 Vehicles | 33 (3.4%) | 39 (4.0%) |
| 5 or more Vehicles | 130 (13.2%) | 90 (9.2%) |
| Total | 984 (100.0%) | 979 (100.0%) |
Commute Time in Combee Settlement
The most frequently occuring commute durations in Combee Settlement are 20 to 24 minutes (398 commuters, 20.9%), 15 to 19 minutes (370 commuters, 19.4%), and 90 or more minutes (244 commuters, 12.8%).
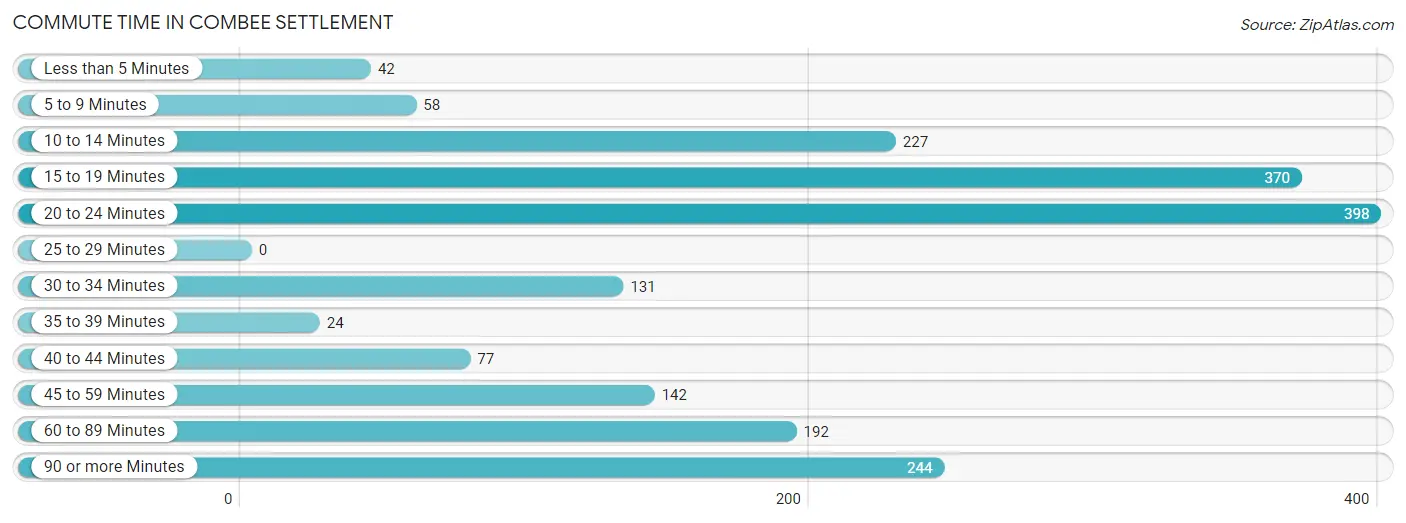
| Commute Time | # Commuters | % Commuters |
| Less than 5 Minutes | 42 | 2.2% |
| 5 to 9 Minutes | 58 | 3.0% |
| 10 to 14 Minutes | 227 | 11.9% |
| 15 to 19 Minutes | 370 | 19.4% |
| 20 to 24 Minutes | 398 | 20.9% |
| 25 to 29 Minutes | 0 | 0.0% |
| 30 to 34 Minutes | 131 | 6.9% |
| 35 to 39 Minutes | 24 | 1.3% |
| 40 to 44 Minutes | 77 | 4.0% |
| 45 to 59 Minutes | 142 | 7.4% |
| 60 to 89 Minutes | 192 | 10.1% |
| 90 or more Minutes | 244 | 12.8% |
Commute Time by Sex in Combee Settlement
The most common commute times in Combee Settlement are 20 to 24 minutes (209 commuters, 22.1%) for males and 15 to 19 minutes (268 commuters, 28.0%) for females.
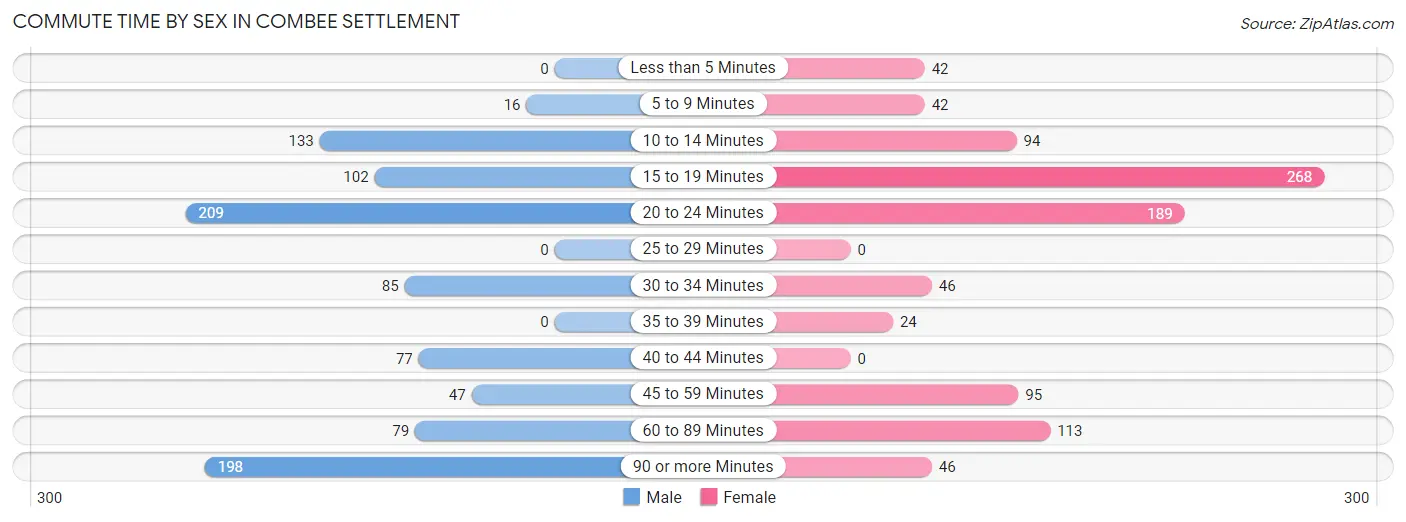
| Commute Time | Male | Female |
| Less than 5 Minutes | 0 (0.0%) | 42 (4.4%) |
| 5 to 9 Minutes | 16 (1.7%) | 42 (4.4%) |
| 10 to 14 Minutes | 133 (14.1%) | 94 (9.8%) |
| 15 to 19 Minutes | 102 (10.8%) | 268 (28.0%) |
| 20 to 24 Minutes | 209 (22.1%) | 189 (19.7%) |
| 25 to 29 Minutes | 0 (0.0%) | 0 (0.0%) |
| 30 to 34 Minutes | 85 (9.0%) | 46 (4.8%) |
| 35 to 39 Minutes | 0 (0.0%) | 24 (2.5%) |
| 40 to 44 Minutes | 77 (8.1%) | 0 (0.0%) |
| 45 to 59 Minutes | 47 (5.0%) | 95 (9.9%) |
| 60 to 89 Minutes | 79 (8.4%) | 113 (11.8%) |
| 90 or more Minutes | 198 (20.9%) | 46 (4.8%) |
Time of Departure to Work by Sex in Combee Settlement
The most frequent times of departure to work in Combee Settlement are 6:30 AM to 6:59 AM (209, 22.1%) for males and 4:00 PM to 11:59 PM (232, 24.2%) for females.
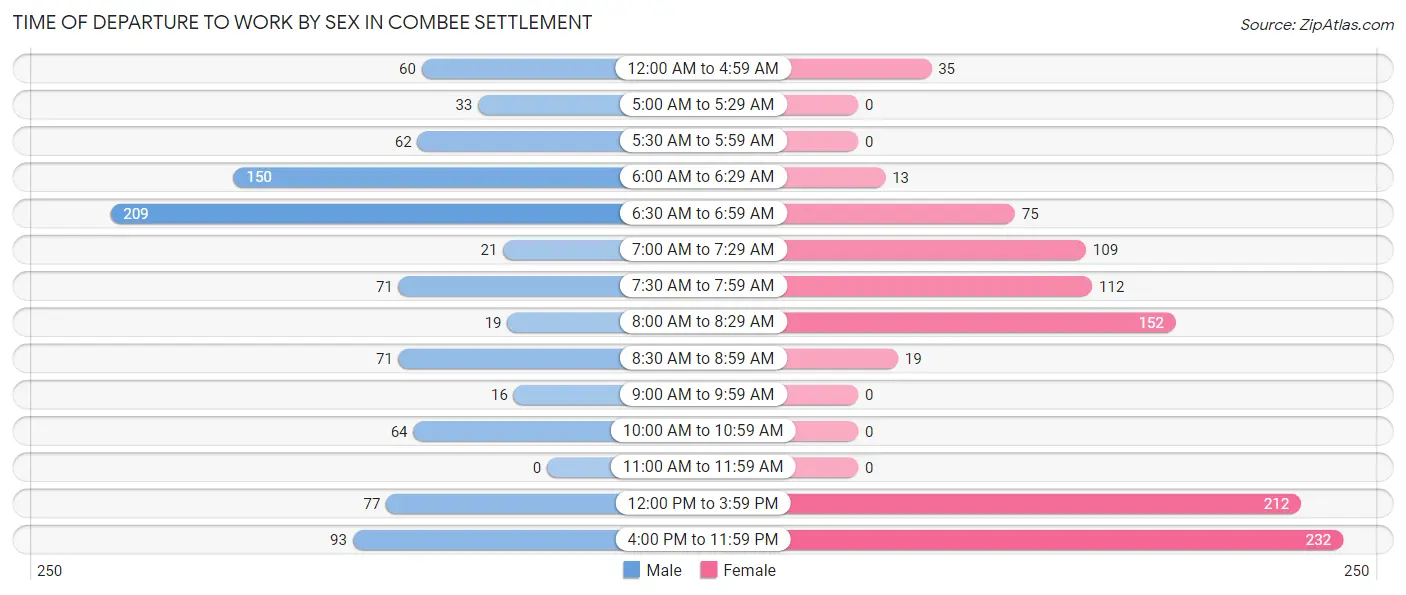
| Time of Departure | Male | Female |
| 12:00 AM to 4:59 AM | 60 (6.3%) | 35 (3.6%) |
| 5:00 AM to 5:29 AM | 33 (3.5%) | 0 (0.0%) |
| 5:30 AM to 5:59 AM | 62 (6.6%) | 0 (0.0%) |
| 6:00 AM to 6:29 AM | 150 (15.9%) | 13 (1.4%) |
| 6:30 AM to 6:59 AM | 209 (22.1%) | 75 (7.8%) |
| 7:00 AM to 7:29 AM | 21 (2.2%) | 109 (11.4%) |
| 7:30 AM to 7:59 AM | 71 (7.5%) | 112 (11.7%) |
| 8:00 AM to 8:29 AM | 19 (2.0%) | 152 (15.9%) |
| 8:30 AM to 8:59 AM | 71 (7.5%) | 19 (2.0%) |
| 9:00 AM to 9:59 AM | 16 (1.7%) | 0 (0.0%) |
| 10:00 AM to 10:59 AM | 64 (6.8%) | 0 (0.0%) |
| 11:00 AM to 11:59 AM | 0 (0.0%) | 0 (0.0%) |
| 12:00 PM to 3:59 PM | 77 (8.1%) | 212 (22.1%) |
| 4:00 PM to 11:59 PM | 93 (9.8%) | 232 (24.2%) |
| Total | 946 (100.0%) | 959 (100.0%) |
Housing Occupancy in Combee Settlement
Occupancy by Ownership in Combee Settlement
Of the total 1,758 dwellings in Combee Settlement, owner-occupied units account for 837 (47.6%), while renter-occupied units make up 921 (52.4%).
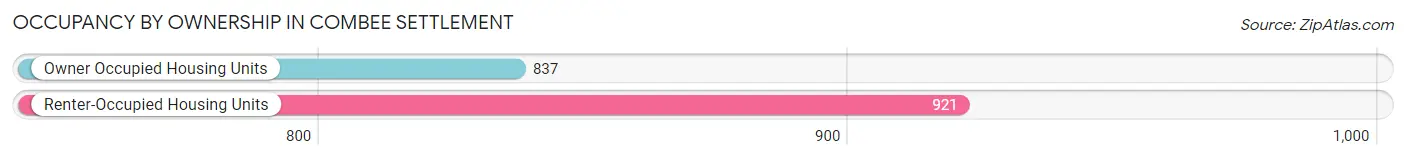
| Occupancy | # Housing Units | % Housing Units |
| Owner Occupied Housing Units | 837 | 47.6% |
| Renter-Occupied Housing Units | 921 | 52.4% |
| Total Occupied Housing Units | 1,758 | 100.0% |
Occupancy by Household Size in Combee Settlement
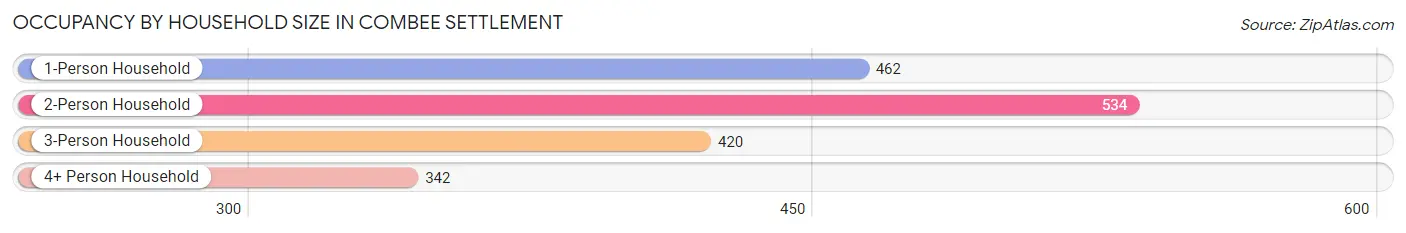
| Household Size | # Housing Units | % Housing Units |
| 1-Person Household | 462 | 26.3% |
| 2-Person Household | 534 | 30.4% |
| 3-Person Household | 420 | 23.9% |
| 4+ Person Household | 342 | 19.5% |
| Total Housing Units | 1,758 | 100.0% |
Occupancy by Ownership by Household Size in Combee Settlement
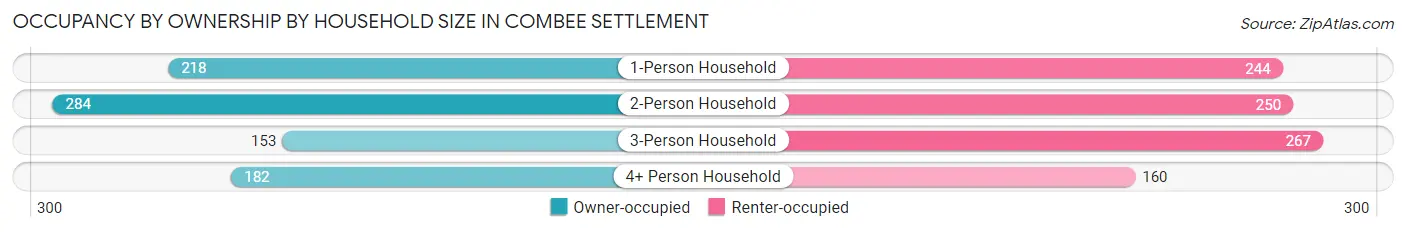
| Household Size | Owner-occupied | Renter-occupied |
| 1-Person Household | 218 (47.2%) | 244 (52.8%) |
| 2-Person Household | 284 (53.2%) | 250 (46.8%) |
| 3-Person Household | 153 (36.4%) | 267 (63.6%) |
| 4+ Person Household | 182 (53.2%) | 160 (46.8%) |
| Total Housing Units | 837 (47.6%) | 921 (52.4%) |
Occupancy by Educational Attainment in Combee Settlement
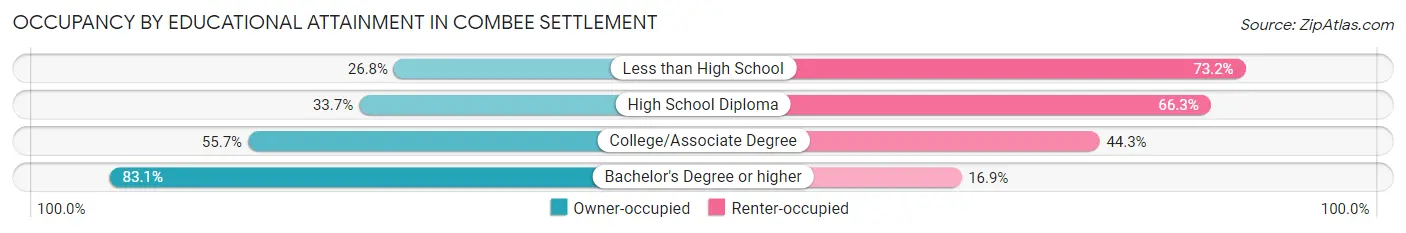
| Household Size | Owner-occupied | Renter-occupied |
| Less than High School | 45 (26.8%) | 123 (73.2%) |
| High School Diploma | 216 (33.7%) | 425 (66.3%) |
| College/Associate Degree | 433 (55.7%) | 344 (44.3%) |
| Bachelor's Degree or higher | 143 (83.1%) | 29 (16.9%) |
Occupancy by Age of Householder in Combee Settlement
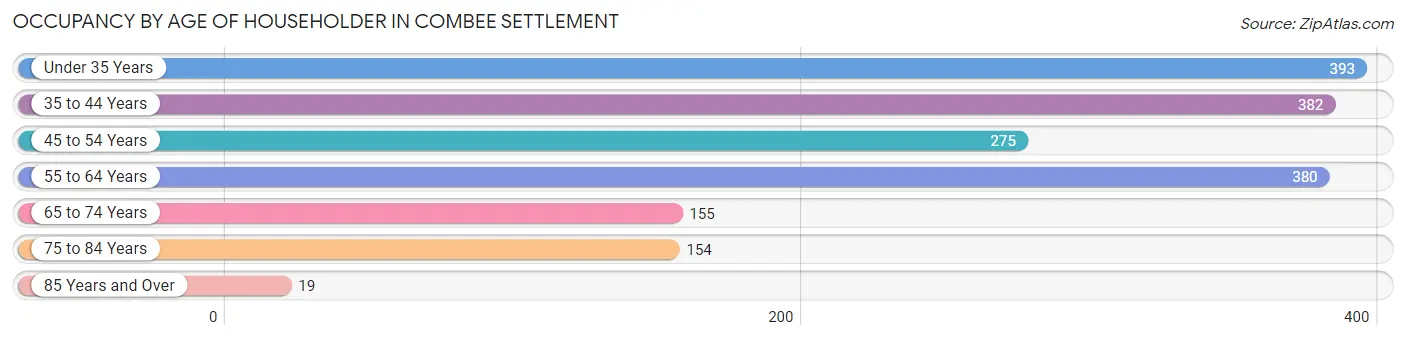
| Age Bracket | # Households | % Households |
| Under 35 Years | 393 | 22.4% |
| 35 to 44 Years | 382 | 21.7% |
| 45 to 54 Years | 275 | 15.6% |
| 55 to 64 Years | 380 | 21.6% |
| 65 to 74 Years | 155 | 8.8% |
| 75 to 84 Years | 154 | 8.8% |
| 85 Years and Over | 19 | 1.1% |
| Total | 1,758 | 100.0% |
Housing Finances in Combee Settlement
Median Income by Occupancy in Combee Settlement
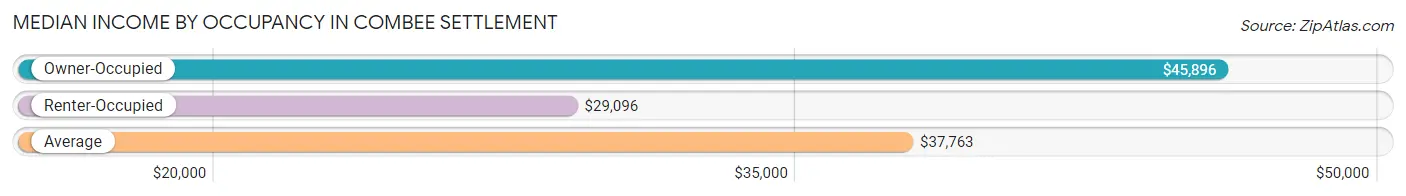
| Occupancy Type | # Households | Median Income |
| Owner-Occupied | 837 (47.6%) | $45,896 |
| Renter-Occupied | 921 (52.4%) | $29,096 |
| Average | 1,758 (100.0%) | $37,763 |
Occupancy by Householder Income Bracket in Combee Settlement
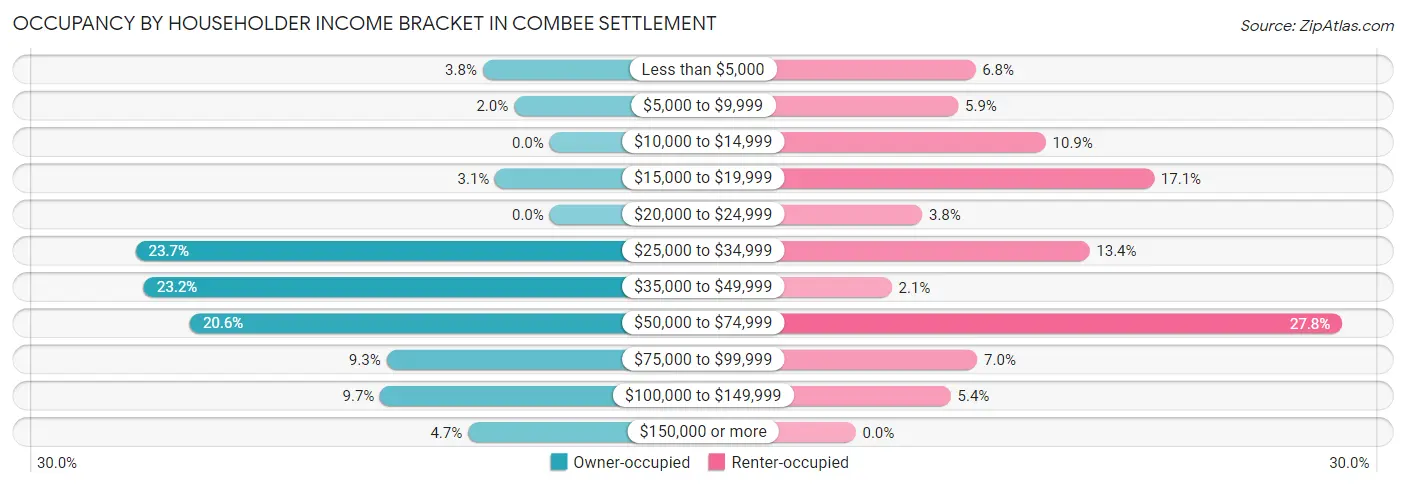
| Income Bracket | Owner-occupied | Renter-occupied |
| Less than $5,000 | 32 (3.8%) | 63 (6.8%) |
| $5,000 to $9,999 | 17 (2.0%) | 54 (5.9%) |
| $10,000 to $14,999 | 0 (0.0%) | 100 (10.9%) |
| $15,000 to $19,999 | 26 (3.1%) | 157 (17.1%) |
| $20,000 to $24,999 | 0 (0.0%) | 35 (3.8%) |
| $25,000 to $34,999 | 198 (23.7%) | 123 (13.4%) |
| $35,000 to $49,999 | 194 (23.2%) | 19 (2.1%) |
| $50,000 to $74,999 | 172 (20.5%) | 256 (27.8%) |
| $75,000 to $99,999 | 78 (9.3%) | 64 (7.0%) |
| $100,000 to $149,999 | 81 (9.7%) | 50 (5.4%) |
| $150,000 or more | 39 (4.7%) | 0 (0.0%) |
| Total | 837 (100.0%) | 921 (100.0%) |
Monthly Housing Cost Tiers in Combee Settlement
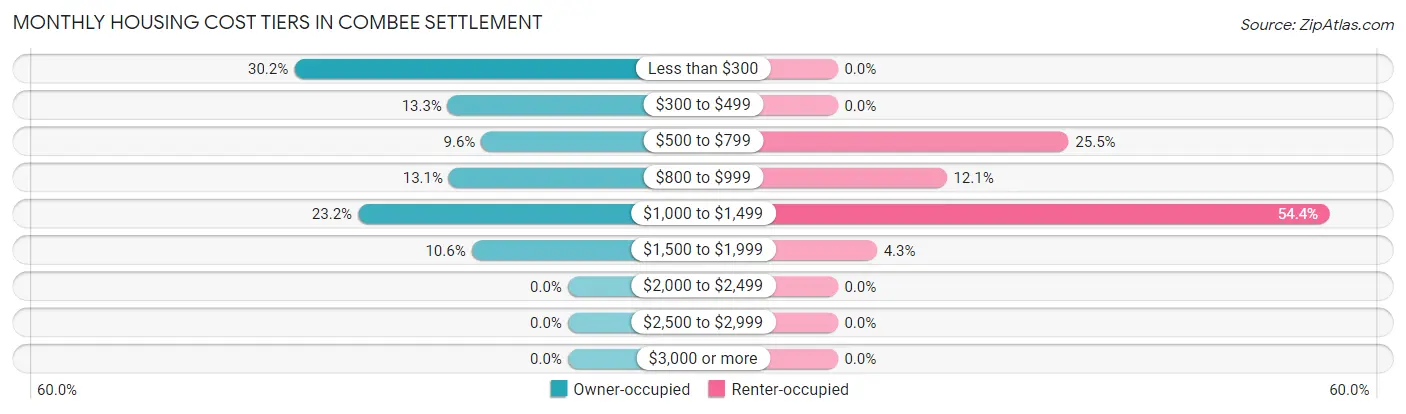
| Monthly Cost | Owner-occupied | Renter-occupied |
| Less than $300 | 253 (30.2%) | 0 (0.0%) |
| $300 to $499 | 111 (13.3%) | 0 (0.0%) |
| $500 to $799 | 80 (9.6%) | 235 (25.5%) |
| $800 to $999 | 110 (13.1%) | 111 (12.0%) |
| $1,000 to $1,499 | 194 (23.2%) | 501 (54.4%) |
| $1,500 to $1,999 | 89 (10.6%) | 40 (4.3%) |
| $2,000 to $2,499 | 0 (0.0%) | 0 (0.0%) |
| $2,500 to $2,999 | 0 (0.0%) | 0 (0.0%) |
| $3,000 or more | 0 (0.0%) | 0 (0.0%) |
| Total | 837 (100.0%) | 921 (100.0%) |
Physical Housing Characteristics in Combee Settlement
Housing Structures in Combee Settlement
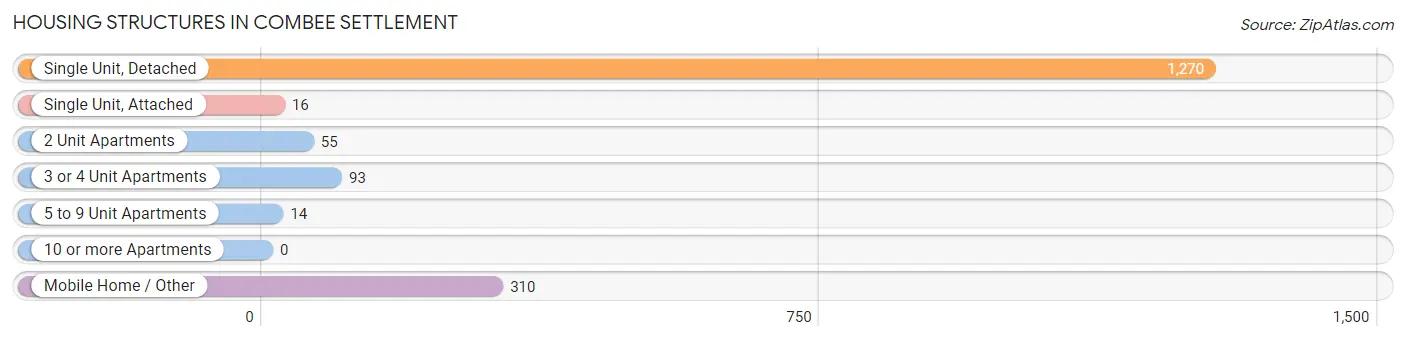
| Structure Type | # Housing Units | % Housing Units |
| Single Unit, Detached | 1,270 | 72.2% |
| Single Unit, Attached | 16 | 0.9% |
| 2 Unit Apartments | 55 | 3.1% |
| 3 or 4 Unit Apartments | 93 | 5.3% |
| 5 to 9 Unit Apartments | 14 | 0.8% |
| 10 or more Apartments | 0 | 0.0% |
| Mobile Home / Other | 310 | 17.6% |
| Total | 1,758 | 100.0% |
Housing Structures by Occupancy in Combee Settlement
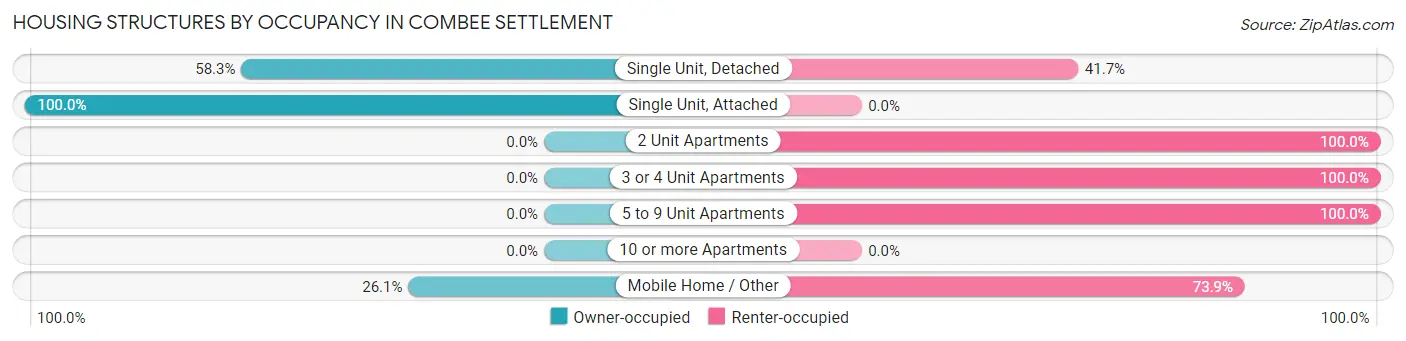
| Structure Type | Owner-occupied | Renter-occupied |
| Single Unit, Detached | 740 (58.3%) | 530 (41.7%) |
| Single Unit, Attached | 16 (100.0%) | 0 (0.0%) |
| 2 Unit Apartments | 0 (0.0%) | 55 (100.0%) |
| 3 or 4 Unit Apartments | 0 (0.0%) | 93 (100.0%) |
| 5 to 9 Unit Apartments | 0 (0.0%) | 14 (100.0%) |
| 10 or more Apartments | 0 (0.0%) | 0 (0.0%) |
| Mobile Home / Other | 81 (26.1%) | 229 (73.9%) |
| Total | 837 (47.6%) | 921 (52.4%) |
Housing Structures by Number of Rooms in Combee Settlement
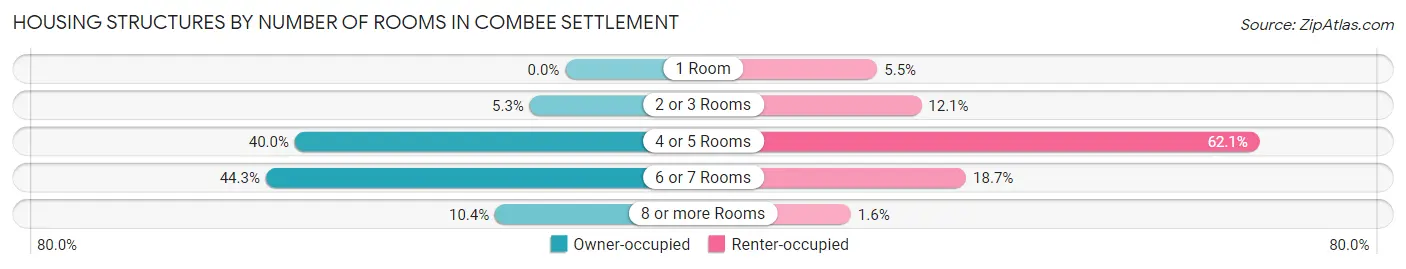
| Number of Rooms | Owner-occupied | Renter-occupied |
| 1 Room | 0 (0.0%) | 51 (5.5%) |
| 2 or 3 Rooms | 44 (5.3%) | 111 (12.0%) |
| 4 or 5 Rooms | 335 (40.0%) | 572 (62.1%) |
| 6 or 7 Rooms | 371 (44.3%) | 172 (18.7%) |
| 8 or more Rooms | 87 (10.4%) | 15 (1.6%) |
| Total | 837 (100.0%) | 921 (100.0%) |
Housing Structure by Heating Type in Combee Settlement
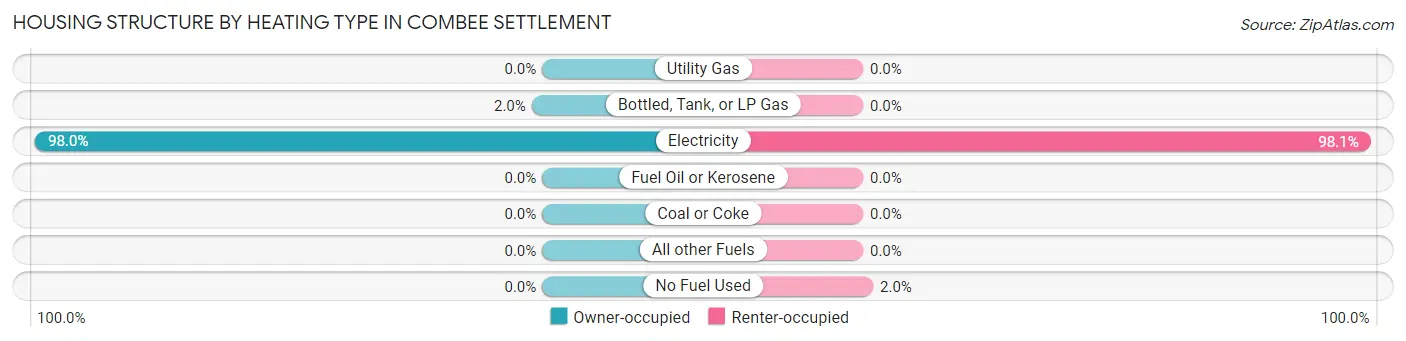
| Heating Type | Owner-occupied | Renter-occupied |
| Utility Gas | 0 (0.0%) | 0 (0.0%) |
| Bottled, Tank, or LP Gas | 17 (2.0%) | 0 (0.0%) |
| Electricity | 820 (98.0%) | 903 (98.1%) |
| Fuel Oil or Kerosene | 0 (0.0%) | 0 (0.0%) |
| Coal or Coke | 0 (0.0%) | 0 (0.0%) |
| All other Fuels | 0 (0.0%) | 0 (0.0%) |
| No Fuel Used | 0 (0.0%) | 18 (1.9%) |
| Total | 837 (100.0%) | 921 (100.0%) |
Household Vehicle Usage in Combee Settlement
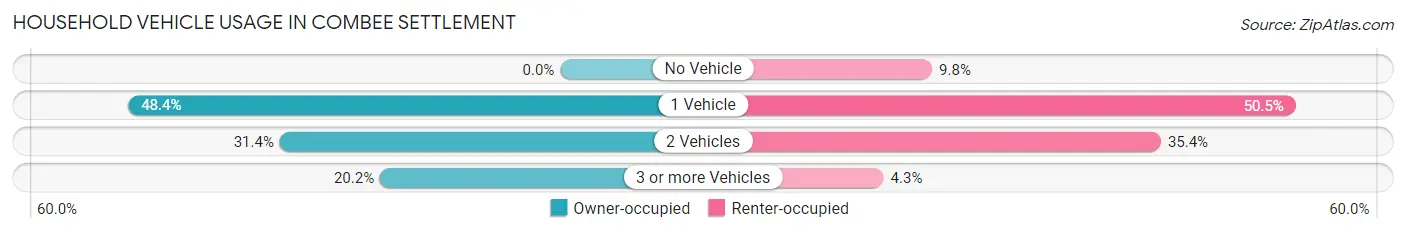
| Vehicles per Household | Owner-occupied | Renter-occupied |
| No Vehicle | 0 (0.0%) | 90 (9.8%) |
| 1 Vehicle | 405 (48.4%) | 465 (50.5%) |
| 2 Vehicles | 263 (31.4%) | 326 (35.4%) |
| 3 or more Vehicles | 169 (20.2%) | 40 (4.3%) |
| Total | 837 (100.0%) | 921 (100.0%) |
Real Estate & Mortgages in Combee Settlement
Real Estate and Mortgage Overview in Combee Settlement
| Characteristic | Without Mortgage | With Mortgage |
| Housing Units | 418 | 419 |
| Median Property Value | $134,700 | $167,300 |
| Median Household Income | $39,474 | $5 |
| Monthly Housing Costs | $247 | $0 |
| Real Estate Taxes | $671 | $77 |
Property Value by Mortgage Status in Combee Settlement
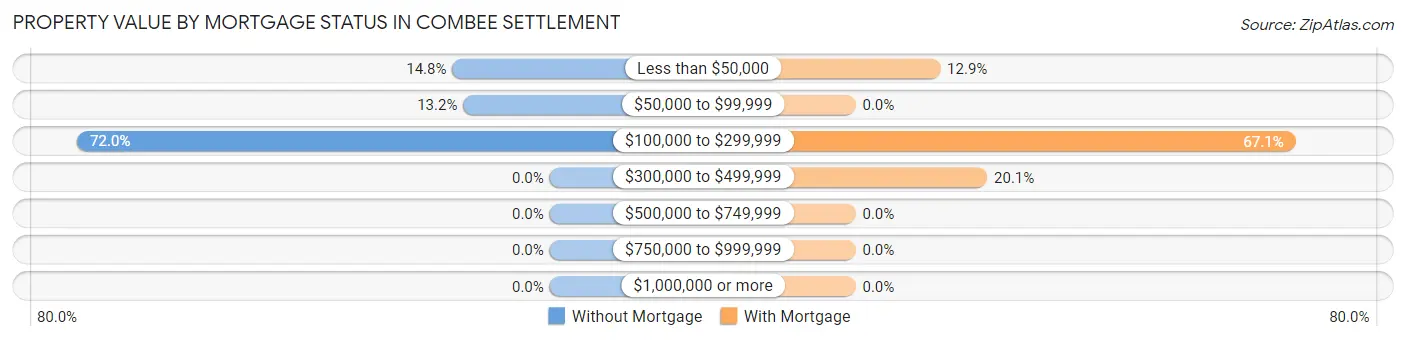
| Property Value | Without Mortgage | With Mortgage |
| Less than $50,000 | 62 (14.8%) | 54 (12.9%) |
| $50,000 to $99,999 | 55 (13.2%) | 0 (0.0%) |
| $100,000 to $299,999 | 301 (72.0%) | 281 (67.1%) |
| $300,000 to $499,999 | 0 (0.0%) | 84 (20.1%) |
| $500,000 to $749,999 | 0 (0.0%) | 0 (0.0%) |
| $750,000 to $999,999 | 0 (0.0%) | 0 (0.0%) |
| $1,000,000 or more | 0 (0.0%) | 0 (0.0%) |
| Total | 418 (100.0%) | 419 (100.0%) |
Household Income by Mortgage Status in Combee Settlement
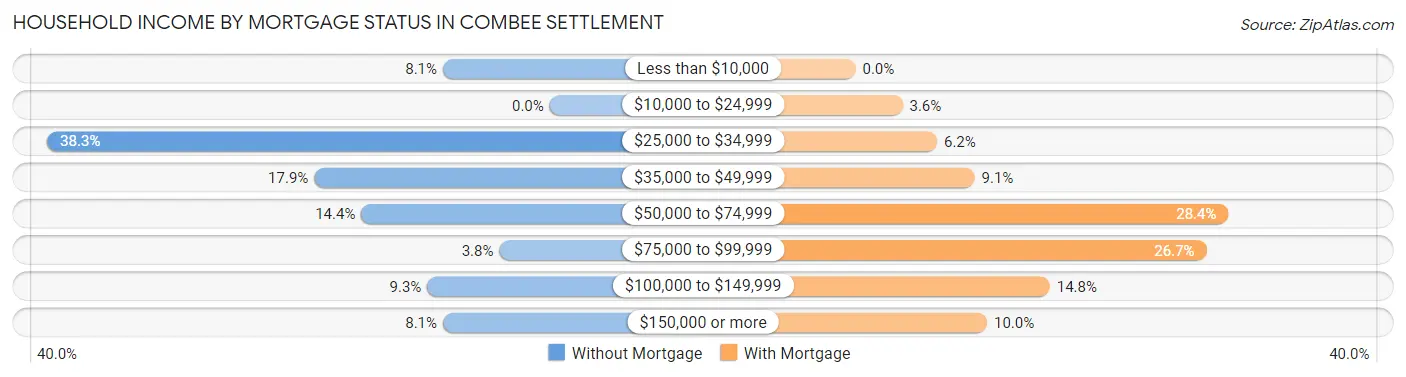
| Household Income | Without Mortgage | With Mortgage |
| Less than $10,000 | 34 (8.1%) | 0 (0.0%) |
| $10,000 to $24,999 | 0 (0.0%) | 15 (3.6%) |
| $25,000 to $34,999 | 160 (38.3%) | 26 (6.2%) |
| $35,000 to $49,999 | 75 (17.9%) | 38 (9.1%) |
| $50,000 to $74,999 | 60 (14.3%) | 119 (28.4%) |
| $75,000 to $99,999 | 16 (3.8%) | 112 (26.7%) |
| $100,000 to $149,999 | 39 (9.3%) | 62 (14.8%) |
| $150,000 or more | 34 (8.1%) | 42 (10.0%) |
| Total | 418 (100.0%) | 419 (100.0%) |
Property Value to Household Income Ratio in Combee Settlement
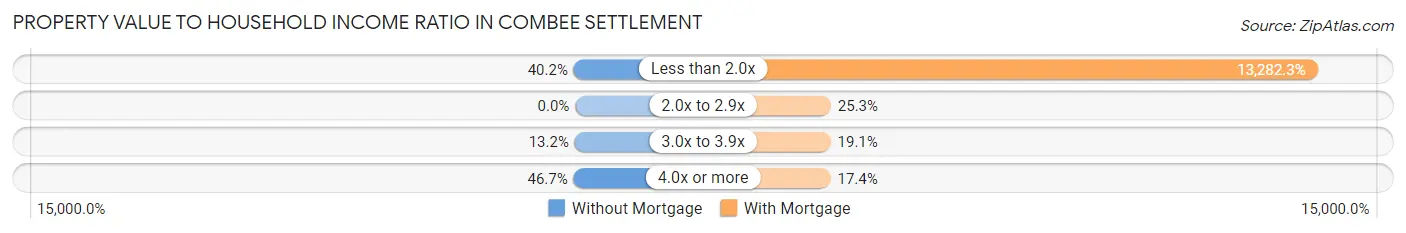
| Value-to-Income Ratio | Without Mortgage | With Mortgage |
| Less than 2.0x | 168 (40.2%) | 55,653 (13,282.3%) |
| 2.0x to 2.9x | 0 (0.0%) | 106 (25.3%) |
| 3.0x to 3.9x | 55 (13.2%) | 80 (19.1%) |
| 4.0x or more | 195 (46.7%) | 73 (17.4%) |
| Total | 418 (100.0%) | 419 (100.0%) |
Real Estate Taxes by Mortgage Status in Combee Settlement
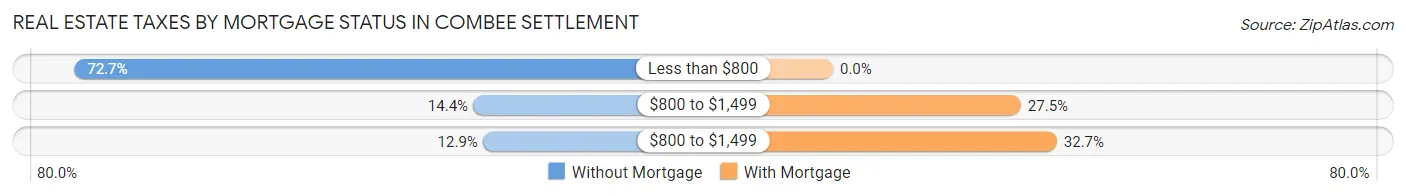
| Property Taxes | Without Mortgage | With Mortgage |
| Less than $800 | 304 (72.7%) | 0 (0.0%) |
| $800 to $1,499 | 60 (14.3%) | 115 (27.5%) |
| $800 to $1,499 | 54 (12.9%) | 137 (32.7%) |
| Total | 418 (100.0%) | 419 (100.0%) |
Health & Disability in Combee Settlement
Health Insurance Coverage by Age in Combee Settlement
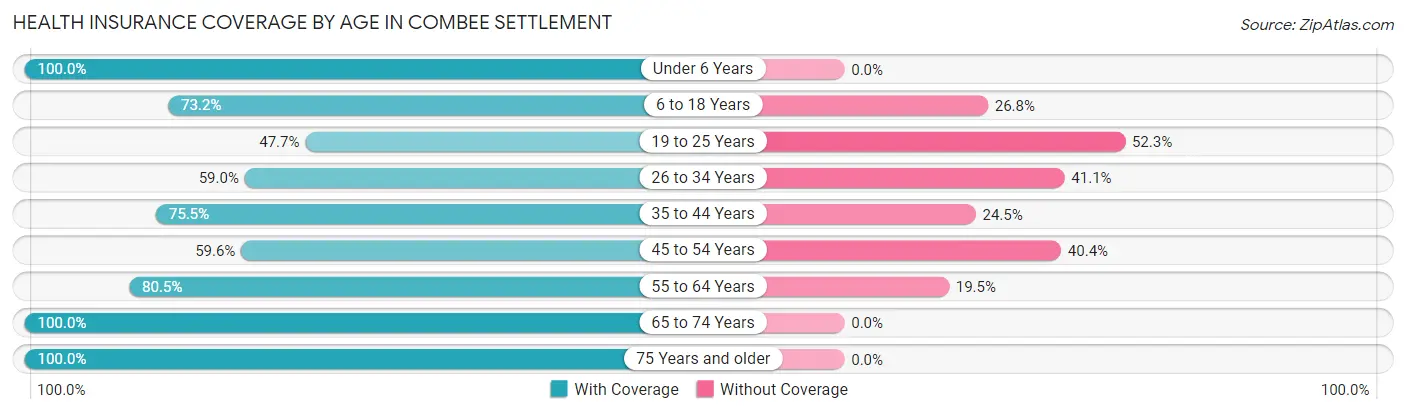
| Age Bracket | With Coverage | Without Coverage |
| Under 6 Years | 445 (100.0%) | 0 (0.0%) |
| 6 to 18 Years | 572 (73.2%) | 209 (26.8%) |
| 19 to 25 Years | 316 (47.7%) | 347 (52.3%) |
| 26 to 34 Years | 382 (59.0%) | 266 (41.0%) |
| 35 to 44 Years | 398 (75.5%) | 129 (24.5%) |
| 45 to 54 Years | 397 (59.6%) | 269 (40.4%) |
| 55 to 64 Years | 430 (80.5%) | 104 (19.5%) |
| 65 to 74 Years | 354 (100.0%) | 0 (0.0%) |
| 75 Years and older | 262 (100.0%) | 0 (0.0%) |
| Total | 3,556 (72.9%) | 1,324 (27.1%) |
Health Insurance Coverage by Citizenship Status in Combee Settlement
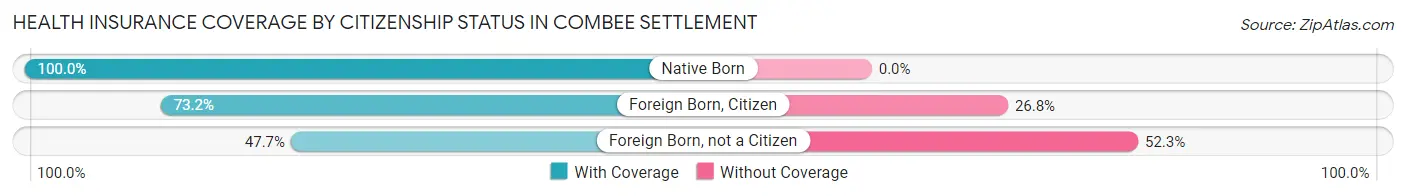
| Citizenship Status | With Coverage | Without Coverage |
| Native Born | 445 (100.0%) | 0 (0.0%) |
| Foreign Born, Citizen | 572 (73.2%) | 209 (26.8%) |
| Foreign Born, not a Citizen | 316 (47.7%) | 347 (52.3%) |
Health Insurance Coverage by Household Income in Combee Settlement
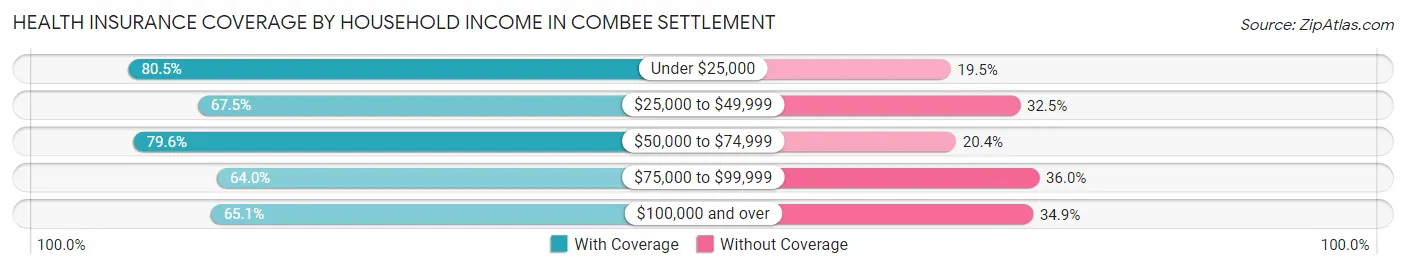
| Household Income | With Coverage | Without Coverage |
| Under $25,000 | 741 (80.5%) | 179 (19.5%) |
| $25,000 to $49,999 | 853 (67.5%) | 410 (32.5%) |
| $50,000 to $74,999 | 1,164 (79.6%) | 299 (20.4%) |
| $75,000 to $99,999 | 307 (64.0%) | 173 (36.0%) |
| $100,000 and over | 491 (65.1%) | 263 (34.9%) |
Public vs Private Health Insurance Coverage by Age in Combee Settlement
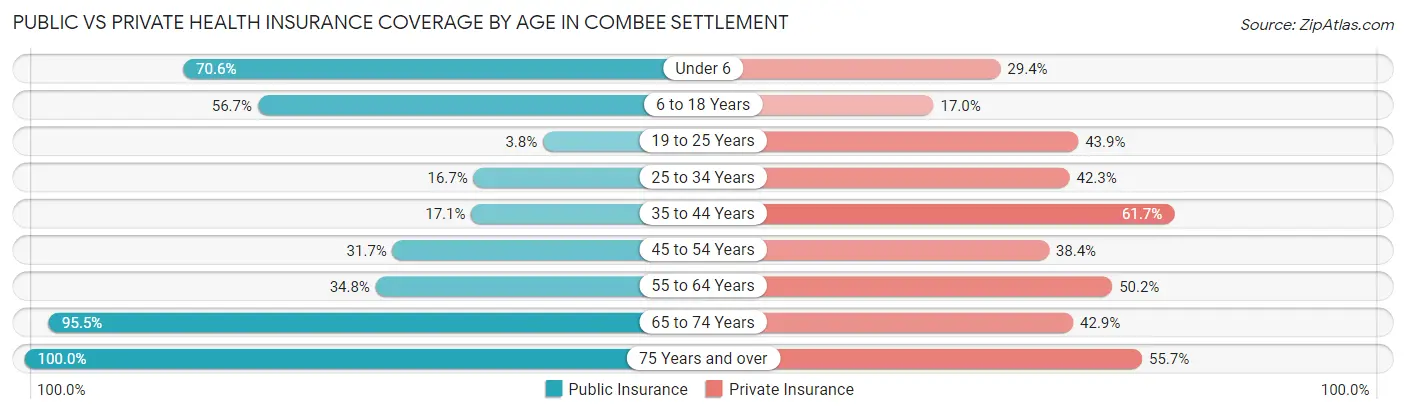
| Age Bracket | Public Insurance | Private Insurance |
| Under 6 | 314 (70.6%) | 131 (29.4%) |
| 6 to 18 Years | 443 (56.7%) | 133 (17.0%) |
| 19 to 25 Years | 25 (3.8%) | 291 (43.9%) |
| 25 to 34 Years | 108 (16.7%) | 274 (42.3%) |
| 35 to 44 Years | 90 (17.1%) | 325 (61.7%) |
| 45 to 54 Years | 211 (31.7%) | 256 (38.4%) |
| 55 to 64 Years | 186 (34.8%) | 268 (50.2%) |
| 65 to 74 Years | 338 (95.5%) | 152 (42.9%) |
| 75 Years and over | 262 (100.0%) | 146 (55.7%) |
| Total | 1,977 (40.5%) | 1,976 (40.5%) |
Disability Status by Sex by Age in Combee Settlement
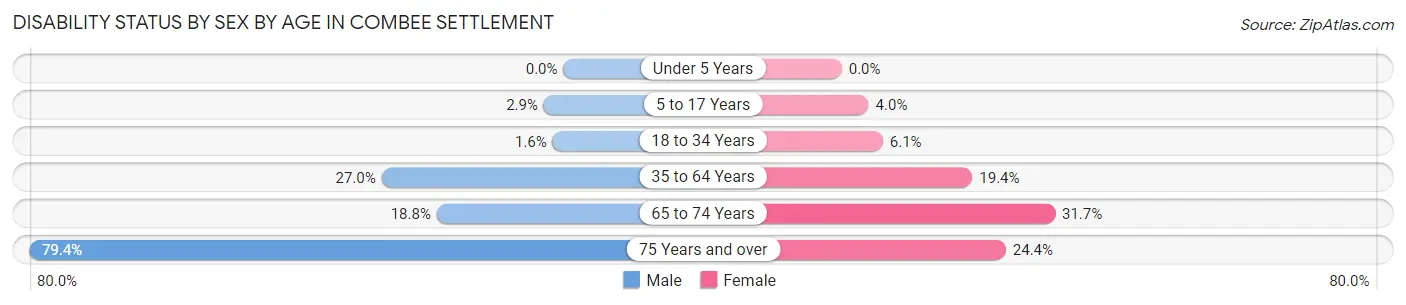
| Age Bracket | Male | Female |
| Under 5 Years | 0 (0.0%) | 0 (0.0%) |
| 5 to 17 Years | 10 (2.9%) | 17 (4.0%) |
| 18 to 34 Years | 10 (1.6%) | 49 (6.1%) |
| 35 to 64 Years | 199 (27.0%) | 192 (19.4%) |
| 65 to 74 Years | 44 (18.8%) | 38 (31.7%) |
| 75 Years and over | 146 (79.3%) | 19 (24.4%) |
Disability Class by Sex by Age in Combee Settlement
Disability Class: Hearing Difficulty
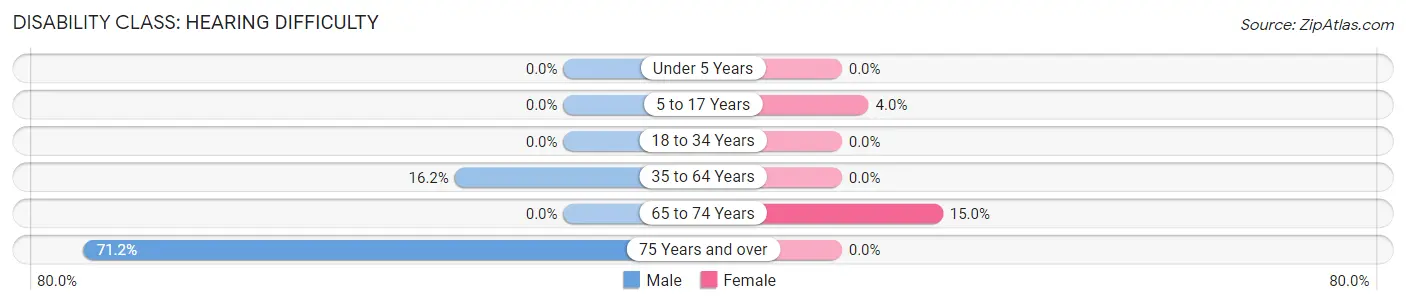
| Age Bracket | Male | Female |
| Under 5 Years | 0 (0.0%) | 0 (0.0%) |
| 5 to 17 Years | 0 (0.0%) | 17 (4.0%) |
| 18 to 34 Years | 0 (0.0%) | 0 (0.0%) |
| 35 to 64 Years | 119 (16.2%) | 0 (0.0%) |
| 65 to 74 Years | 0 (0.0%) | 18 (15.0%) |
| 75 Years and over | 131 (71.2%) | 0 (0.0%) |
Disability Class: Vision Difficulty
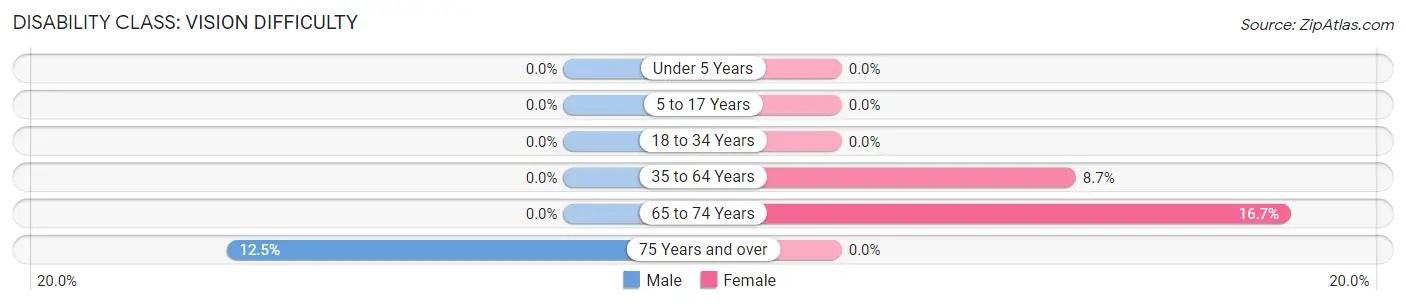
| Age Bracket | Male | Female |
| Under 5 Years | 0 (0.0%) | 0 (0.0%) |
| 5 to 17 Years | 0 (0.0%) | 0 (0.0%) |
| 18 to 34 Years | 0 (0.0%) | 0 (0.0%) |
| 35 to 64 Years | 0 (0.0%) | 86 (8.7%) |
| 65 to 74 Years | 0 (0.0%) | 20 (16.7%) |
| 75 Years and over | 23 (12.5%) | 0 (0.0%) |
Disability Class: Cognitive Difficulty
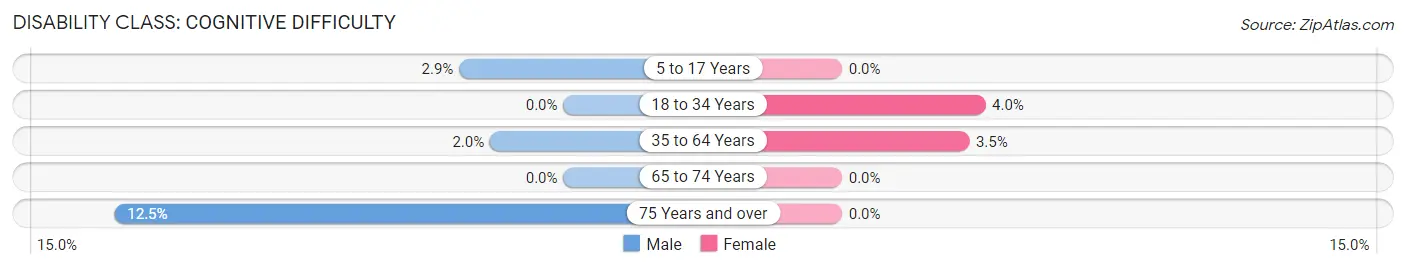
| Age Bracket | Male | Female |
| 5 to 17 Years | 10 (2.9%) | 0 (0.0%) |
| 18 to 34 Years | 0 (0.0%) | 32 (4.0%) |
| 35 to 64 Years | 15 (2.0%) | 35 (3.5%) |
| 65 to 74 Years | 0 (0.0%) | 0 (0.0%) |
| 75 Years and over | 23 (12.5%) | 0 (0.0%) |
Disability Class: Ambulatory Difficulty
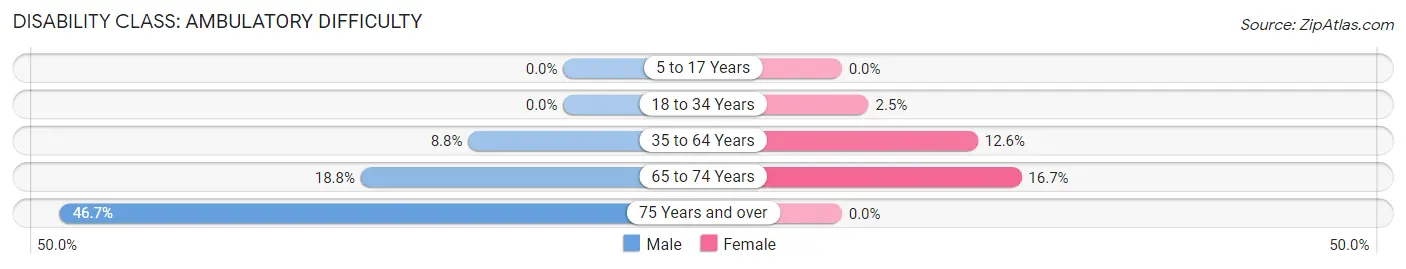
| Age Bracket | Male | Female |
| 5 to 17 Years | 0 (0.0%) | 0 (0.0%) |
| 18 to 34 Years | 0 (0.0%) | 20 (2.5%) |
| 35 to 64 Years | 65 (8.8%) | 125 (12.6%) |
| 65 to 74 Years | 44 (18.8%) | 20 (16.7%) |
| 75 Years and over | 86 (46.7%) | 0 (0.0%) |
Disability Class: Self-Care Difficulty
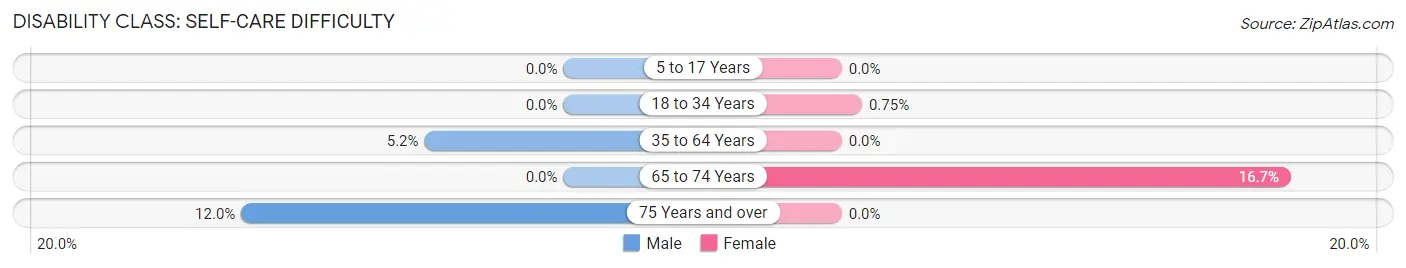
| Age Bracket | Male | Female |
| 5 to 17 Years | 0 (0.0%) | 0 (0.0%) |
| 18 to 34 Years | 0 (0.0%) | 6 (0.7%) |
| 35 to 64 Years | 38 (5.2%) | 0 (0.0%) |
| 65 to 74 Years | 0 (0.0%) | 20 (16.7%) |
| 75 Years and over | 22 (12.0%) | 0 (0.0%) |
Technology Access in Combee Settlement
Computing Device Access in Combee Settlement
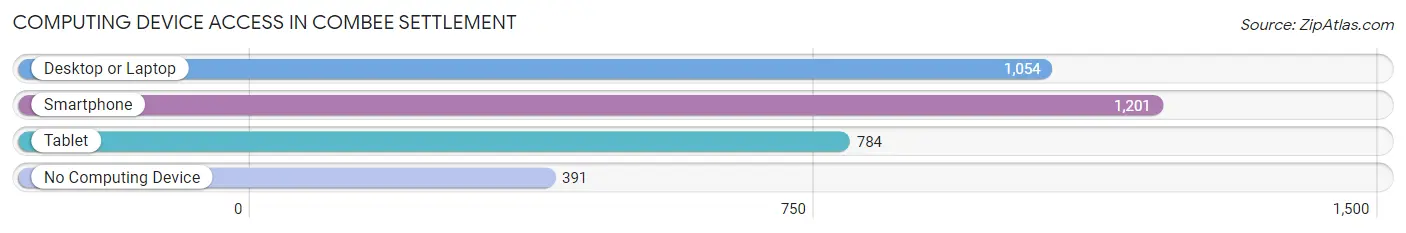
| Device Type | # Households | % Households |
| Desktop or Laptop | 1,054 | 60.0% |
| Smartphone | 1,201 | 68.3% |
| Tablet | 784 | 44.6% |
| No Computing Device | 391 | 22.2% |
| Total | 1,758 | 100.0% |
Internet Access in Combee Settlement
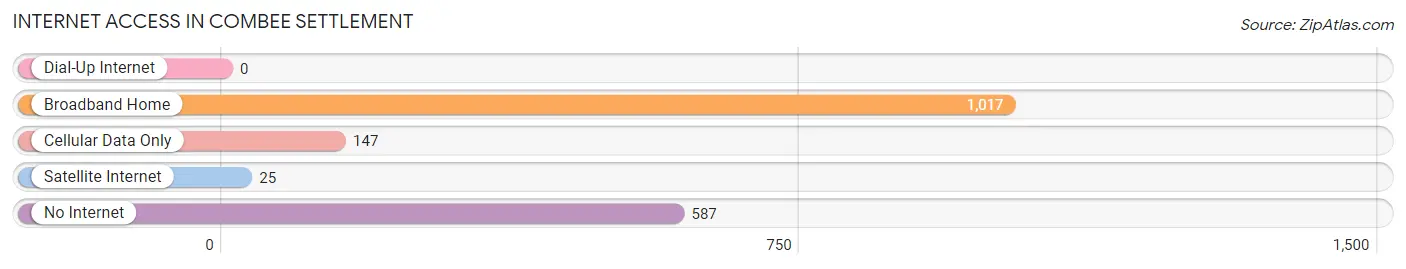
| Internet Type | # Households | % Households |
| Dial-Up Internet | 0 | 0.0% |
| Broadband Home | 1,017 | 57.9% |
| Cellular Data Only | 147 | 8.4% |
| Satellite Internet | 25 | 1.4% |
| No Internet | 587 | 33.4% |
| Total | 1,758 | 100.0% |
Combee Settlement Summary
Combee Settlement is a small unincorporated community located in Polk County, Florida. It is situated on the eastern side of Lakeland, approximately 10 miles from downtown. The population of Combee Settlement was estimated to be around 1,000 in 2020.
History
Combee Settlement was founded in the late 1800s by a group of settlers from the Combee family. The Combees were originally from Georgia and had moved to Florida in search of a better life. The family settled in the area that is now known as Combee Settlement and began to farm the land. The settlement was named after the Combee family and has remained a small, rural community ever since.
The Combee family was one of the first settlers in the area and their descendants still live in the area today. The Combee family has been an integral part of the community for generations and has contributed to the growth and development of the area.
Geography
Combee Settlement is located in Polk County, Florida. It is situated on the eastern side of Lakeland, approximately 10 miles from downtown. The area is mostly rural and is surrounded by citrus groves and other agricultural land. The area is also home to several lakes, including Lake Combee, which is the largest lake in the area.
The climate in Combee Settlement is subtropical, with hot, humid summers and mild winters. The average temperature in the summer is around 90 degrees Fahrenheit and the average temperature in the winter is around 60 degrees Fahrenheit.
Economy
The economy of Combee Settlement is largely based on agriculture. The area is home to several citrus groves and other agricultural land. The area is also home to several small businesses, including restaurants, convenience stores, and other retail stores.
The area is also home to several manufacturing companies, including a paper mill and a plastics factory. The area is also home to several trucking companies, which provide transportation services to the surrounding areas.
Demographics
The population of Combee Settlement was estimated to be around 1,000 in 2020. The majority of the population is white, with a small percentage of African Americans and Hispanics. The median household income in the area is around $50,000, which is slightly lower than the national average.
The area is home to several churches, including the Combee Settlement Baptist Church, which is the oldest church in the area. The area is also home to several schools, including Combee Elementary School and Combee Middle School.
Conclusion
Combee Settlement is a small unincorporated community located in Polk County, Florida. It is situated on the eastern side of Lakeland, approximately 10 miles from downtown. The population of Combee Settlement was estimated to be around 1,000 in 2020. The economy of Combee Settlement is largely based on agriculture and the area is home to several small businesses, manufacturing companies, and trucking companies. The majority of the population is white, with a small percentage of African Americans and Hispanics. The area is home to several churches and schools, and is a great place to live for those looking for a rural lifestyle.
Common Questions
What is the Total Population of Combee Settlement?
Total Population of Combee Settlement is 4,880.
What is the Total Male Population of Combee Settlement?
Total Male Population of Combee Settlement is 2,322.
What is the Total Female Population of Combee Settlement?
Total Female Population of Combee Settlement is 2,558.
What is the Ratio of Males per 100 Females in Combee Settlement?
There are 90.77 Males per 100 Females in Combee Settlement.
What is the Ratio of Females per 100 Males in Combee Settlement?
There are 110.16 Females per 100 Males in Combee Settlement.
What is the Median Population Age in Combee Settlement?
Median Population Age in Combee Settlement is 33.0 Years.
What is the Average Family Size in Combee Settlement
Average Family Size in Combee Settlement is 3.4 People.
What is the Average Household Size in Combee Settlement
Average Household Size in Combee Settlement is 2.8 People.
What is Per Capita Income in Combee Settlement?
Per Capita income in Combee Settlement is $19,485.
What is the Median Family Income in Combee Settlement?
Median Family Income in Combee Settlement is $56,250.
What is the Median Household income in Combee Settlement?
Median Household Income in Combee Settlement is $37,763.
What is Income or Wage Gap in Combee Settlement?
Income or Wage Gap in Combee Settlement is 24.8%.
Women in Combee Settlement earn 75.2 cents for every dollar earned by a man.
What is Inequality or Gini Index in Combee Settlement?
Inequality or Gini Index in Combee Settlement is 0.42.
How Large is the Labor Force in Combee Settlement?
There are 2,087 People in the Labor Forcein in Combee Settlement.
What is the Percentage of People in the Labor Force in Combee Settlement?
53.3% of People are in the Labor Force in Combee Settlement.
What is the Unemployment Rate in Combee Settlement?
Unemployment Rate in Combee Settlement is 5.2%.