Treasure Island, FL
Treasure Island Map
Treasure Island Overview
6,590
TOTAL POPULATION
3,203
MALE POPULATION
3,387
FEMALE POPULATION
94.57
MALES / 100 FEMALES
105.74
FEMALES / 100 MALES
63.0
MEDIAN AGE
2.3
AVG FAMILY SIZE
1.8
AVG HOUSEHOLD SIZE
$79,685
PER CAPITA INCOME
$145,536
AVG FAMILY INCOME
$87,941
AVG HOUSEHOLD INCOME
33.9%
WAGE / INCOME GAP [ % ]
66.1¢/ $1
WAGE / INCOME GAP [ $ ]
$9,306
FAMILY INCOME DEFICIT
0.49
INEQUALITY / GINI INDEX
3,069
LABOR FORCE [ PEOPLE ]
48.0%
PERCENT IN LABOR FORCE
5.5%
UNEMPLOYMENT RATE
Treasure Island Area Codes
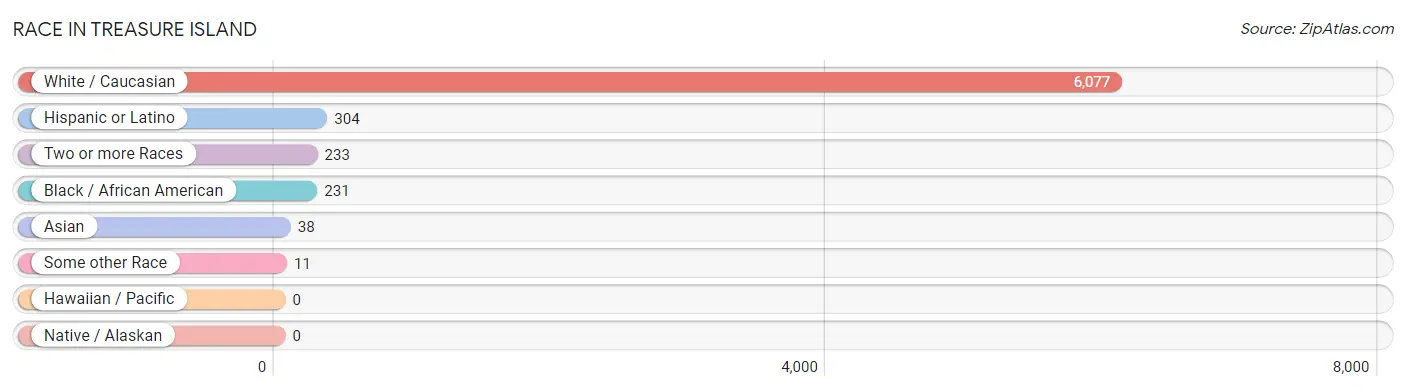
Race in Treasure Island
The most populous races in Treasure Island are White / Caucasian (6,077 | 92.2%), Hispanic or Latino (304 | 4.6%), and Two or more Races (233 | 3.5%).
| Race | # Population | % Population |
| Asian | 38 | 0.6% |
| Black / African American | 231 | 3.5% |
| Hawaiian / Pacific | 0 | 0.0% |
| Hispanic or Latino | 304 | 4.6% |
| Native / Alaskan | 0 | 0.0% |
| White / Caucasian | 6,077 | 92.2% |
| Two or more Races | 233 | 3.5% |
| Some other Race | 11 | 0.2% |
| Total | 6,590 | 100.0% |
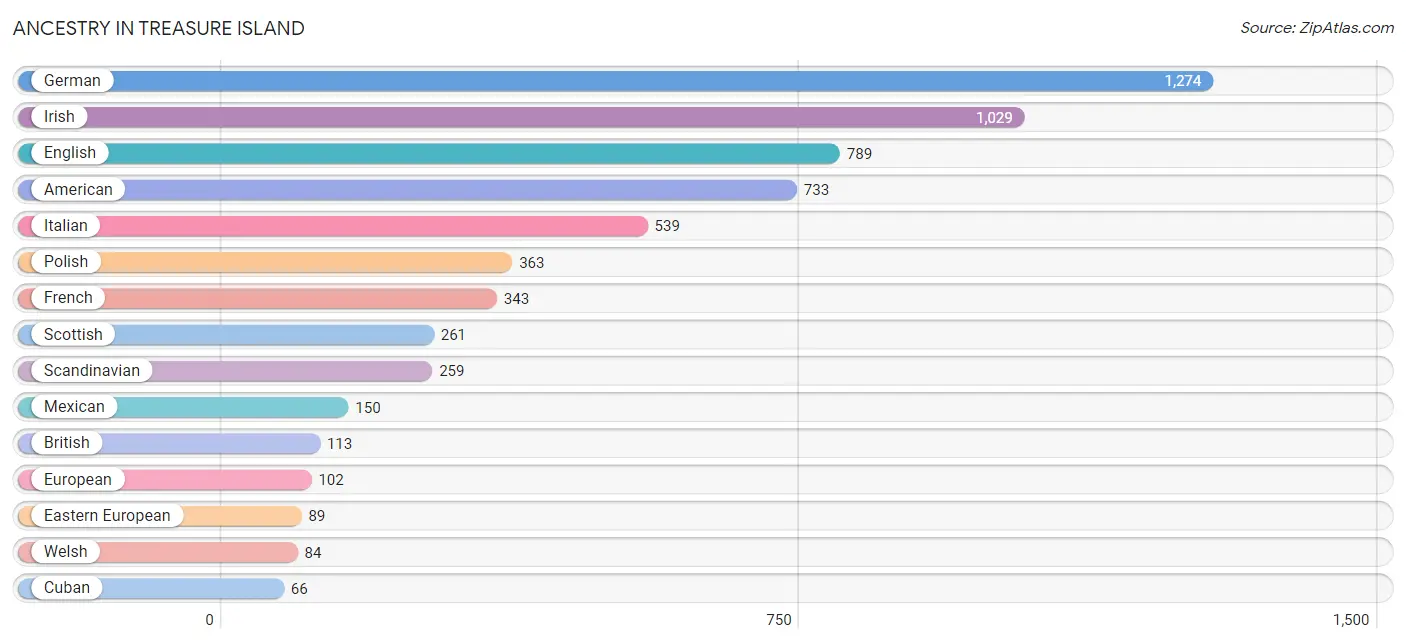
Ancestry in Treasure Island
The most populous ancestries reported in Treasure Island are German (1,274 | 19.3%), Irish (1,029 | 15.6%), English (789 | 12.0%), American (733 | 11.1%), and Italian (539 | 8.2%), together accounting for 66.2% of all Treasure Island residents.
| Ancestry | # Population | % Population |
| American | 733 | 11.1% |
| Austrian | 21 | 0.3% |
| Blackfeet | 5 | 0.1% |
| Brazilian | 31 | 0.5% |
| British | 113 | 1.7% |
| Bulgarian | 10 | 0.2% |
| Canadian | 64 | 1.0% |
| Central American | 32 | 0.5% |
| Choctaw | 7 | 0.1% |
| Colombian | 8 | 0.1% |
| Croatian | 20 | 0.3% |
| Cuban | 66 | 1.0% |
| Czech | 24 | 0.4% |
| Czechoslovakian | 9 | 0.1% |
| Danish | 32 | 0.5% |
| Dominican | 11 | 0.2% |
| Dutch | 29 | 0.4% |
| Eastern European | 89 | 1.3% |
| English | 789 | 12.0% |
| European | 102 | 1.5% |
| Finnish | 48 | 0.7% |
| French | 343 | 5.2% |
| French Canadian | 26 | 0.4% |
| German | 1,274 | 19.3% |
| Greek | 26 | 0.4% |
| Guyanese | 7 | 0.1% |
| Hungarian | 51 | 0.8% |
| Indian (Asian) | 29 | 0.4% |
| Irish | 1,029 | 15.6% |
| Italian | 539 | 8.2% |
| Latvian | 20 | 0.3% |
| Lithuanian | 21 | 0.3% |
| Mexican | 150 | 2.3% |
| Northern European | 20 | 0.3% |
| Norwegian | 36 | 0.5% |
| Polish | 363 | 5.5% |
| Russian | 16 | 0.2% |
| Scandinavian | 259 | 3.9% |
| Scotch-Irish | 53 | 0.8% |
| Scottish | 261 | 4.0% |
| Slavic | 9 | 0.1% |
| Slovak | 30 | 0.5% |
| Slovene | 14 | 0.2% |
| South African | 9 | 0.1% |
| South American | 8 | 0.1% |
| Spaniard | 37 | 0.6% |
| Subsaharan African | 9 | 0.1% |
| Swedish | 55 | 0.8% |
| Swiss | 35 | 0.5% |
| Thai | 59 | 0.9% |
| Trinidadian and Tobagonian | 32 | 0.5% |
| Welsh | 84 | 1.3% |
| West Indian | 32 | 0.5% | View All 53 Rows |
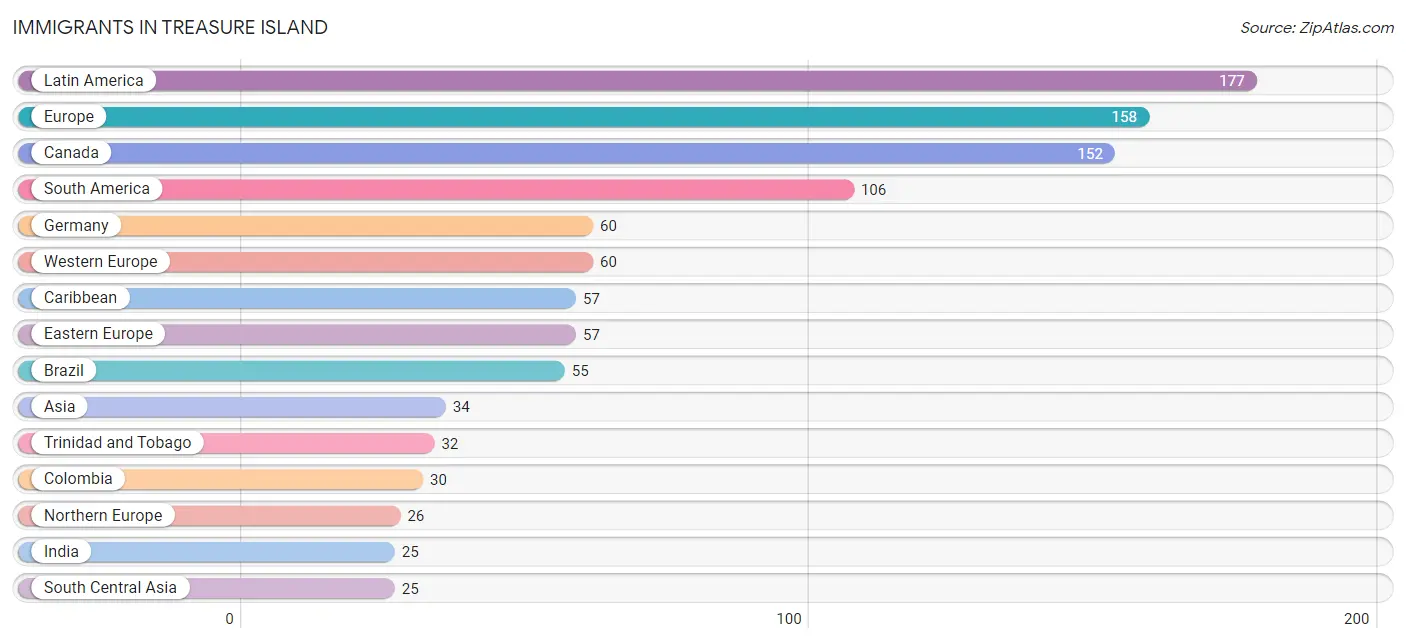
Immigrants in Treasure Island
The most numerous immigrant groups reported in Treasure Island came from Latin America (177 | 2.7%), Europe (158 | 2.4%), Canada (152 | 2.3%), South America (106 | 1.6%), and Germany (60 | 0.9%), together accounting for 9.9% of all Treasure Island residents.
| Immigration Origin | # Population | % Population |
| Africa | 9 | 0.1% |
| Asia | 34 | 0.5% |
| Brazil | 55 | 0.8% |
| Bulgaria | 10 | 0.2% |
| Canada | 152 | 2.3% |
| Caribbean | 57 | 0.9% |
| Central America | 14 | 0.2% |
| Colombia | 30 | 0.5% |
| Cuba | 20 | 0.3% |
| Dominican Republic | 5 | 0.1% |
| Eastern Asia | 9 | 0.1% |
| Eastern Europe | 57 | 0.9% |
| England | 15 | 0.2% |
| Europe | 158 | 2.4% |
| Germany | 60 | 0.9% |
| Greece | 6 | 0.1% |
| Guyana | 21 | 0.3% |
| India | 25 | 0.4% |
| Italy | 9 | 0.1% |
| Japan | 9 | 0.1% |
| Latin America | 177 | 2.7% |
| Mexico | 14 | 0.2% |
| Northern Europe | 26 | 0.4% |
| Poland | 11 | 0.2% |
| Scotland | 11 | 0.2% |
| Serbia | 11 | 0.2% |
| South Africa | 9 | 0.1% |
| South America | 106 | 1.6% |
| South Central Asia | 25 | 0.4% |
| Southern Europe | 15 | 0.2% |
| Trinidad and Tobago | 32 | 0.5% |
| Western Europe | 60 | 0.9% | View All 32 Rows |
Sex and Age in Treasure Island
Sex and Age in Treasure Island
The most populous age groups in Treasure Island are 55 to 59 Years (489 | 15.3%) for men and 65 to 69 Years (733 | 21.6%) for women.
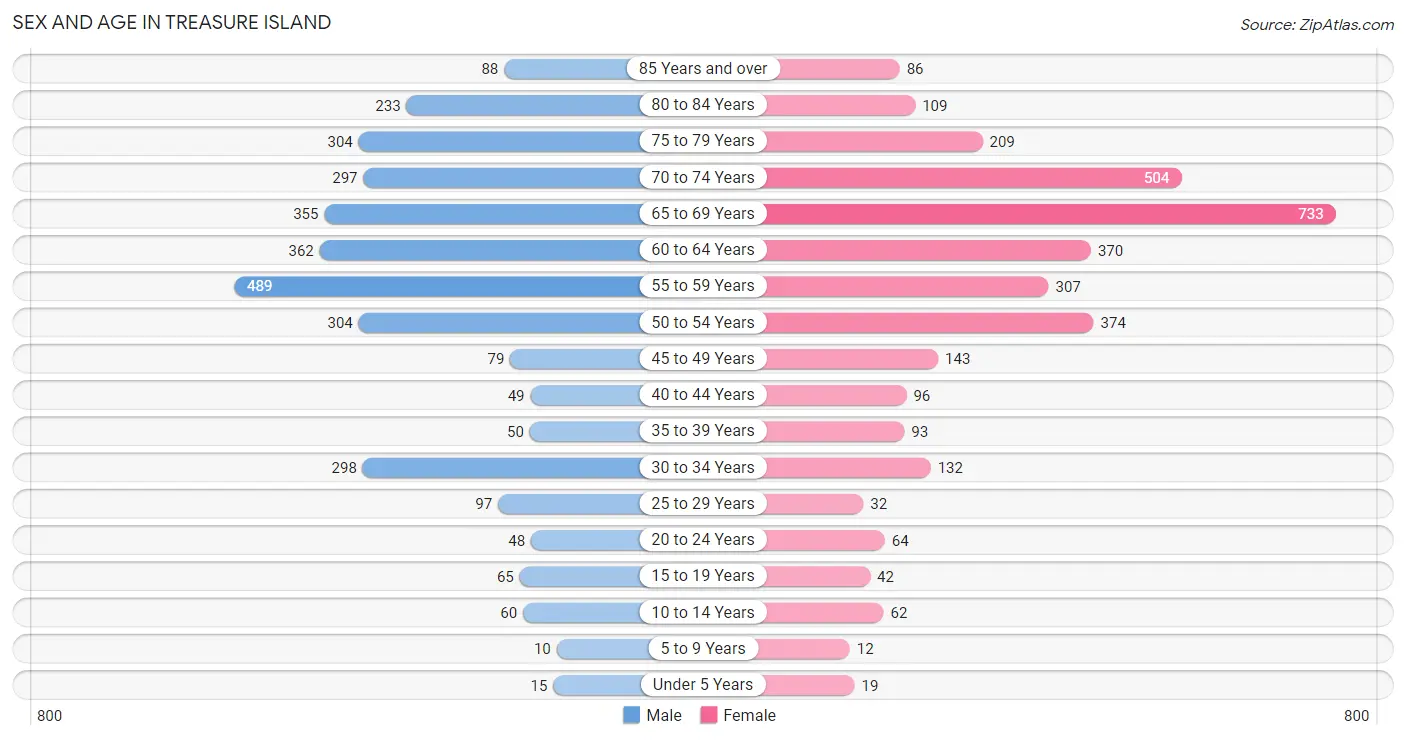
| Age Bracket | Male | Female |
| Under 5 Years | 15 (0.5%) | 19 (0.6%) |
| 5 to 9 Years | 10 (0.3%) | 12 (0.4%) |
| 10 to 14 Years | 60 (1.9%) | 62 (1.8%) |
| 15 to 19 Years | 65 (2.0%) | 42 (1.2%) |
| 20 to 24 Years | 48 (1.5%) | 64 (1.9%) |
| 25 to 29 Years | 97 (3.0%) | 32 (0.9%) |
| 30 to 34 Years | 298 (9.3%) | 132 (3.9%) |
| 35 to 39 Years | 50 (1.6%) | 93 (2.8%) |
| 40 to 44 Years | 49 (1.5%) | 96 (2.8%) |
| 45 to 49 Years | 79 (2.5%) | 143 (4.2%) |
| 50 to 54 Years | 304 (9.5%) | 374 (11.0%) |
| 55 to 59 Years | 489 (15.3%) | 307 (9.1%) |
| 60 to 64 Years | 362 (11.3%) | 370 (10.9%) |
| 65 to 69 Years | 355 (11.1%) | 733 (21.6%) |
| 70 to 74 Years | 297 (9.3%) | 504 (14.9%) |
| 75 to 79 Years | 304 (9.5%) | 209 (6.2%) |
| 80 to 84 Years | 233 (7.3%) | 109 (3.2%) |
| 85 Years and over | 88 (2.8%) | 86 (2.5%) |
| Total | 3,203 (100.0%) | 3,387 (100.0%) |
Families and Households in Treasure Island
Median Family Size in Treasure Island
The median family size in Treasure Island is 2.26 persons per family, with single male/father families (66 | 3.4%) accounting for the largest median family size of 2.8 persons per family. On the other hand, married-couple families (1,844 | 93.8%) represent the smallest median family size with 2.23 persons per family.
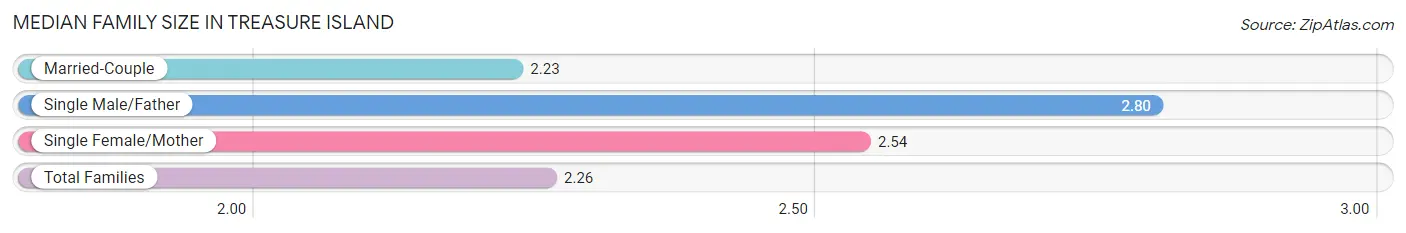
| Family Type | # Families | Family Size |
| Married-Couple | 1,844 (93.8%) | 2.23 |
| Single Male/Father | 66 (3.4%) | 2.80 |
| Single Female/Mother | 57 (2.9%) | 2.54 |
| Total Families | 1,967 (100.0%) | 2.26 |
Median Household Size in Treasure Island
The median household size in Treasure Island is 1.79 persons per household, with single male/father households (66 | 1.8%) accounting for the largest median household size of 3.17 persons per household. non-family households (1,721 | 46.7%) represent the smallest median household size with 1.19 persons per household.
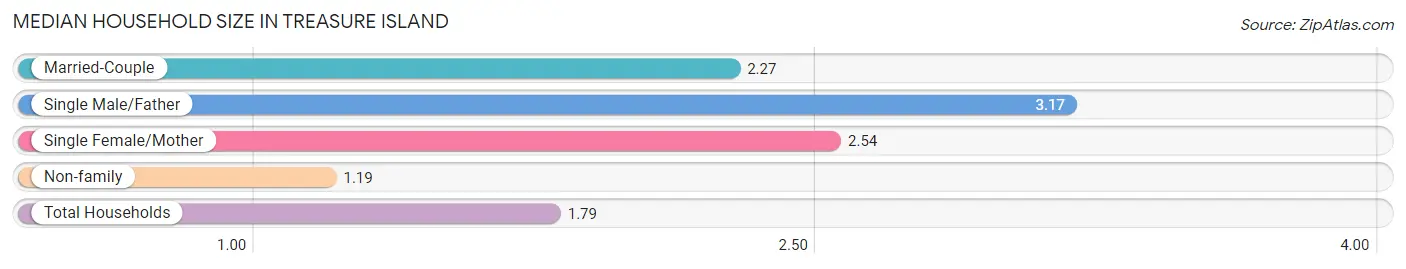
| Household Type | # Households | Household Size |
| Married-Couple | 1,844 (50.0%) | 2.27 |
| Single Male/Father | 66 (1.8%) | 3.17 |
| Single Female/Mother | 57 (1.5%) | 2.54 |
| Non-family | 1,721 (46.7%) | 1.19 |
| Total Households | 3,688 (100.0%) | 1.79 |
Household Size by Marriage Status in Treasure Island
Out of a total of 3,688 households in Treasure Island, 1,967 (53.3%) are family households, while 1,721 (46.7%) are nonfamily households. The most numerous type of family households are 2-person households, comprising 1,671, and the most common type of nonfamily households are 1-person households, comprising 1,448.
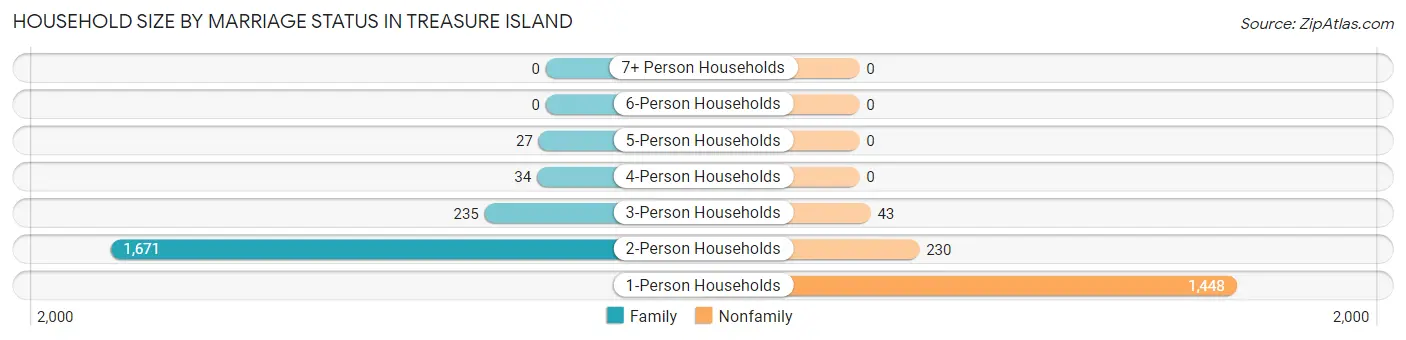
| Household Size | Family Households | Nonfamily Households |
| 1-Person Households | - | 1,448 (39.3%) |
| 2-Person Households | 1,671 (45.3%) | 230 (6.2%) |
| 3-Person Households | 235 (6.4%) | 43 (1.2%) |
| 4-Person Households | 34 (0.9%) | 0 (0.0%) |
| 5-Person Households | 27 (0.7%) | 0 (0.0%) |
| 6-Person Households | 0 (0.0%) | 0 (0.0%) |
| 7+ Person Households | 0 (0.0%) | 0 (0.0%) |
| Total | 1,967 (53.3%) | 1,721 (46.7%) |
Female Fertility in Treasure Island
Fertility by Age in Treasure Island
| Age Bracket | Women with Births | Births / 1,000 Women |
| 15 to 19 years | 0 (0.0%) | 0.0 |
| 20 to 34 years | 0 (0.0%) | 0.0 |
| 35 to 50 years | 0 (0.0%) | 0.0 |
| Total | 0 (0.0%) | 0.0 |
Fertility by Age by Marriage Status in Treasure Island
| Age Bracket | Married | Unmarried |
| 15 to 19 years | 0 (0.0%) | 0 (0.0%) |
| 20 to 34 years | 0 (0.0%) | 0 (0.0%) |
| 35 to 50 years | 0 (0.0%) | 0 (0.0%) |
| Total | 0 (0.0%) | 0 (0.0%) |
Fertility by Education in Treasure Island
| Educational Attainment | Women with Births | Births / 1,000 Women |
| Less than High School | 0 (0.0%) | 0.0 |
| High School Diploma | 0 (0.0%) | 0.0 |
| College or Associate's Degree | 0 (0.0%) | 0.0 |
| Bachelor's Degree | 0 (0.0%) | 0.0 |
| Graduate Degree | 0 (0.0%) | 0.0 |
| Total | 0 (0.0%) | 0.0 |
Fertility by Education by Marriage Status in Treasure Island
| Educational Attainment | Married | Unmarried |
| Less than High School | 0 (0.0%) | 0 (0.0%) |
| High School Diploma | 0 (0.0%) | 0 (0.0%) |
| College or Associate's Degree | 0 (0.0%) | 0 (0.0%) |
| Bachelor's Degree | 0 (0.0%) | 0 (0.0%) |
| Graduate Degree | 0 (0.0%) | 0 (0.0%) |
| Total | 0 (0.0%) | 0 (0.0%) |
Income in Treasure Island
Income Overview in Treasure Island
Per Capita Income in Treasure Island is $79,685, while median incomes of families and households are $145,536 and $87,941 respectively.
| Characteristic | Number | Measure |
| Per Capita Income | 6,590 | $79,685 |
| Median Family Income | 1,967 | $145,536 |
| Mean Family Income | 1,967 | $193,332 |
| Median Household Income | 3,688 | $87,941 |
| Mean Household Income | 3,688 | $139,639 |
| Income Deficit | 1,967 | $9,306 |
| Wage / Income Gap (%) | 6,590 | 33.89% |
| Wage / Income Gap ($) | 6,590 | 66.11¢ per $1 |
| Gini / Inequality Index | 6,590 | 0.49 |
Earnings by Sex in Treasure Island
Average Earnings in Treasure Island are $77,083, $86,667 for men and $57,292 for women, a difference of 33.9%.
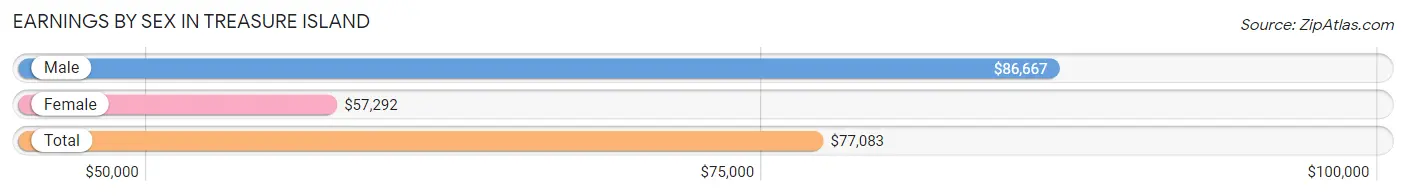
| Sex | Number | Average Earnings |
| Male | 1,714 (53.5%) | $86,667 |
| Female | 1,488 (46.5%) | $57,292 |
| Total | 3,202 (100.0%) | $77,083 |
Earnings by Sex by Income Bracket in Treasure Island
The most common earnings brackets in Treasure Island are $100,000+ for men (686 | 40.0%) and $100,000+ for women (453 | 30.4%).
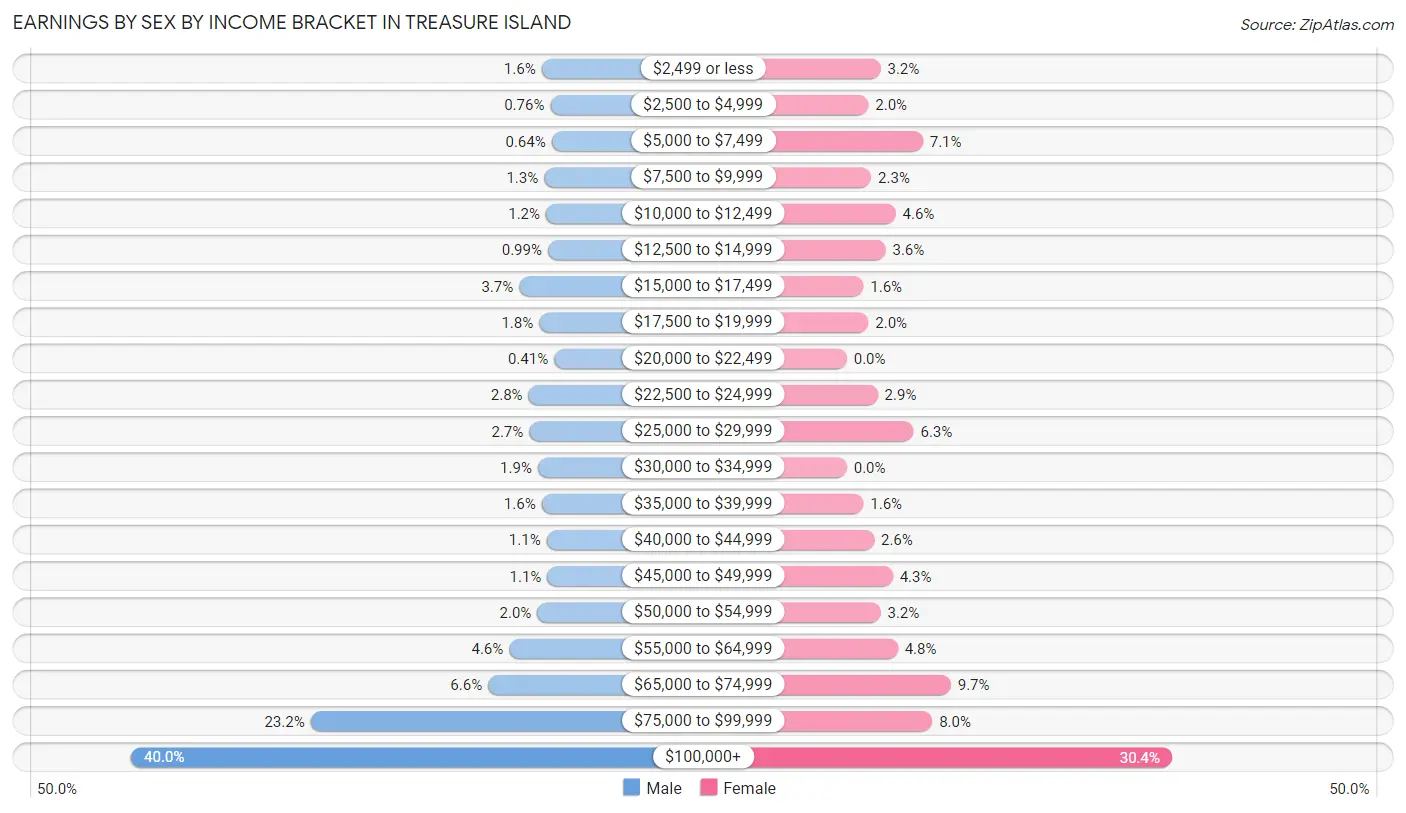
| Income | Male | Female |
| $2,499 or less | 27 (1.6%) | 47 (3.2%) |
| $2,500 to $4,999 | 13 (0.8%) | 30 (2.0%) |
| $5,000 to $7,499 | 11 (0.6%) | 106 (7.1%) |
| $7,500 to $9,999 | 23 (1.3%) | 34 (2.3%) |
| $10,000 to $12,499 | 20 (1.2%) | 68 (4.6%) |
| $12,500 to $14,999 | 17 (1.0%) | 54 (3.6%) |
| $15,000 to $17,499 | 63 (3.7%) | 23 (1.5%) |
| $17,500 to $19,999 | 31 (1.8%) | 30 (2.0%) |
| $20,000 to $22,499 | 7 (0.4%) | 0 (0.0%) |
| $22,500 to $24,999 | 48 (2.8%) | 43 (2.9%) |
| $25,000 to $29,999 | 47 (2.7%) | 93 (6.2%) |
| $30,000 to $34,999 | 33 (1.9%) | 0 (0.0%) |
| $35,000 to $39,999 | 27 (1.6%) | 23 (1.5%) |
| $40,000 to $44,999 | 19 (1.1%) | 38 (2.5%) |
| $45,000 to $49,999 | 18 (1.1%) | 64 (4.3%) |
| $50,000 to $54,999 | 34 (2.0%) | 47 (3.2%) |
| $55,000 to $64,999 | 79 (4.6%) | 71 (4.8%) |
| $65,000 to $74,999 | 113 (6.6%) | 145 (9.7%) |
| $75,000 to $99,999 | 398 (23.2%) | 119 (8.0%) |
| $100,000+ | 686 (40.0%) | 453 (30.4%) |
| Total | 1,714 (100.0%) | 1,488 (100.0%) |
Earnings by Sex by Educational Attainment in Treasure Island
Average earnings in Treasure Island are $87,122 for men and $66,094 for women, a difference of 24.1%. Men with an educational attainment of graduate degree enjoy the highest average annual earnings of $133,500, while those with high school diploma education earn the least with $60,000. Women with an educational attainment of graduate degree earn the most with the average annual earnings of $88,636, while those with college or associate's degree education have the smallest earnings of $28,080.
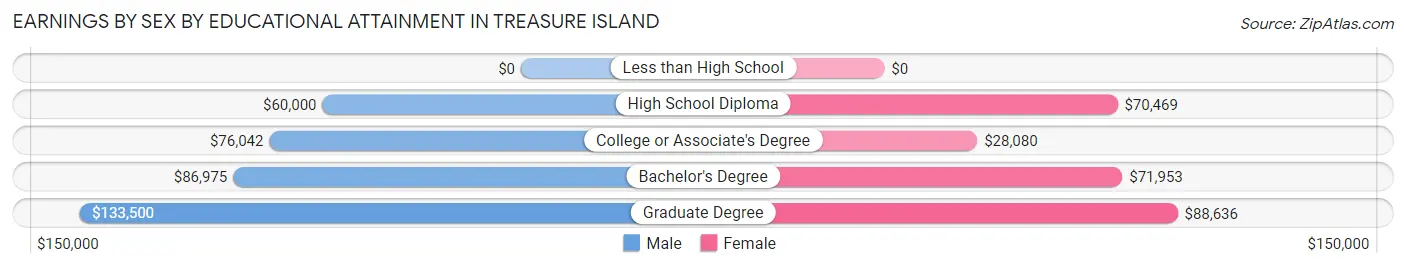
| Educational Attainment | Male Income | Female Income |
| Less than High School | - | - |
| High School Diploma | $60,000 | $70,469 |
| College or Associate's Degree | $76,042 | $28,080 |
| Bachelor's Degree | $86,975 | $71,953 |
| Graduate Degree | $133,500 | $88,636 |
| Total | $87,122 | $66,094 |
Family Income in Treasure Island
Family Income Brackets in Treasure Island
According to the Treasure Island family income data, there are 568 families falling into the $200,000+ income range, which is the most common income bracket and makes up 28.9% of all families. Conversely, the $10,000 to $14,999 income bracket is the least frequent group with only 12 families (0.6%) belonging to this category.
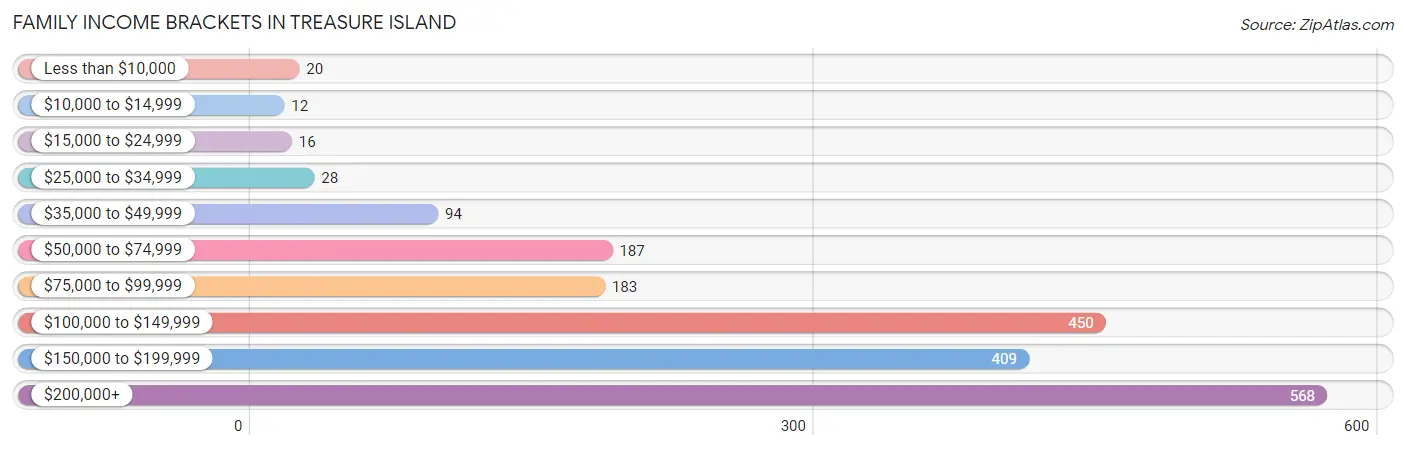
| Income Bracket | # Families | % Families |
| Less than $10,000 | 20 | 1.0% |
| $10,000 to $14,999 | 12 | 0.6% |
| $15,000 to $24,999 | 16 | 0.8% |
| $25,000 to $34,999 | 28 | 1.4% |
| $35,000 to $49,999 | 94 | 4.8% |
| $50,000 to $74,999 | 187 | 9.5% |
| $75,000 to $99,999 | 183 | 9.3% |
| $100,000 to $149,999 | 450 | 22.9% |
| $150,000 to $199,999 | 409 | 20.8% |
| $200,000+ | 568 | 28.9% |
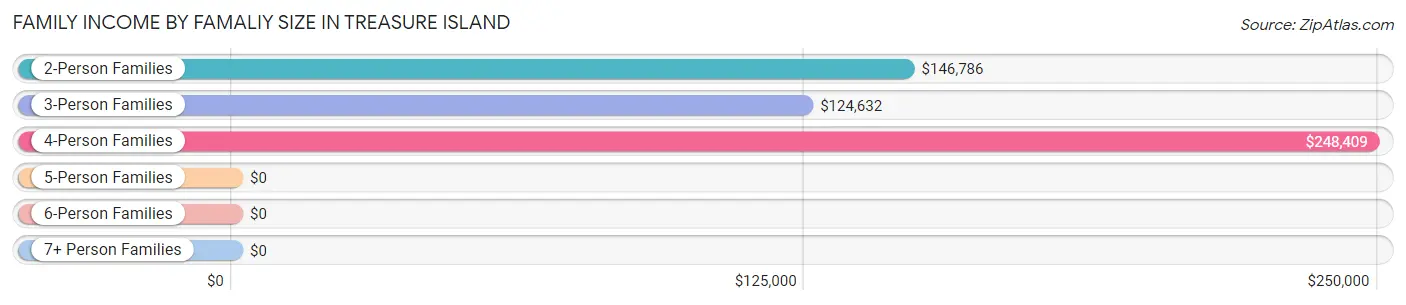
Family Income by Famaliy Size in Treasure Island
4-person families (46 | 2.3%) account for the highest median family income in Treasure Island with $248,409 per family, while 2-person families (1,700 | 86.4%) have the highest median income of $73,393 per family member.
| Income Bracket | # Families | Median Income |
| 2-Person Families | 1,700 (86.4%) | $146,786 |
| 3-Person Families | 206 (10.5%) | $124,632 |
| 4-Person Families | 46 (2.3%) | $248,409 |
| 5-Person Families | 15 (0.8%) | $0 |
| 6-Person Families | 0 (0.0%) | $0 |
| 7+ Person Families | 0 (0.0%) | $0 |
| Total | 1,967 (100.0%) | $145,536 |
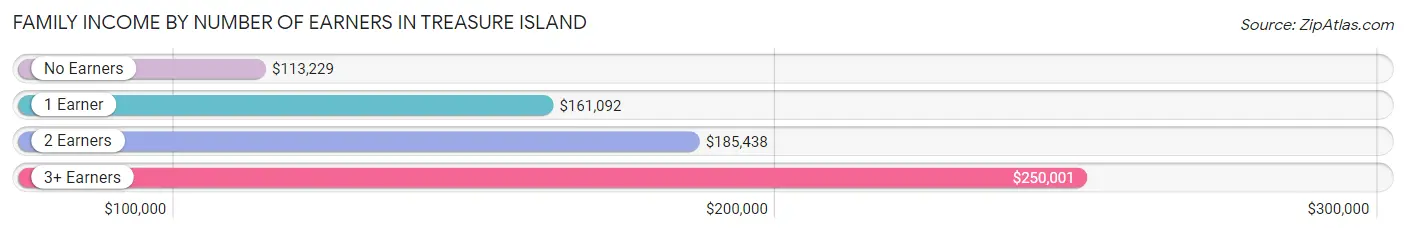
Family Income by Number of Earners in Treasure Island
The median family income in Treasure Island is $145,536, with families comprising 3+ earners (65) having the highest median family income of $250,001, while families with no earners (685) have the lowest median family income of $113,229, accounting for 3.3% and 34.8% of families, respectively.
| Number of Earners | # Families | Median Income |
| No Earners | 685 (34.8%) | $113,229 |
| 1 Earner | 562 (28.6%) | $161,092 |
| 2 Earners | 655 (33.3%) | $185,438 |
| 3+ Earners | 65 (3.3%) | $250,001 |
| Total | 1,967 (100.0%) | $145,536 |
Household Income in Treasure Island
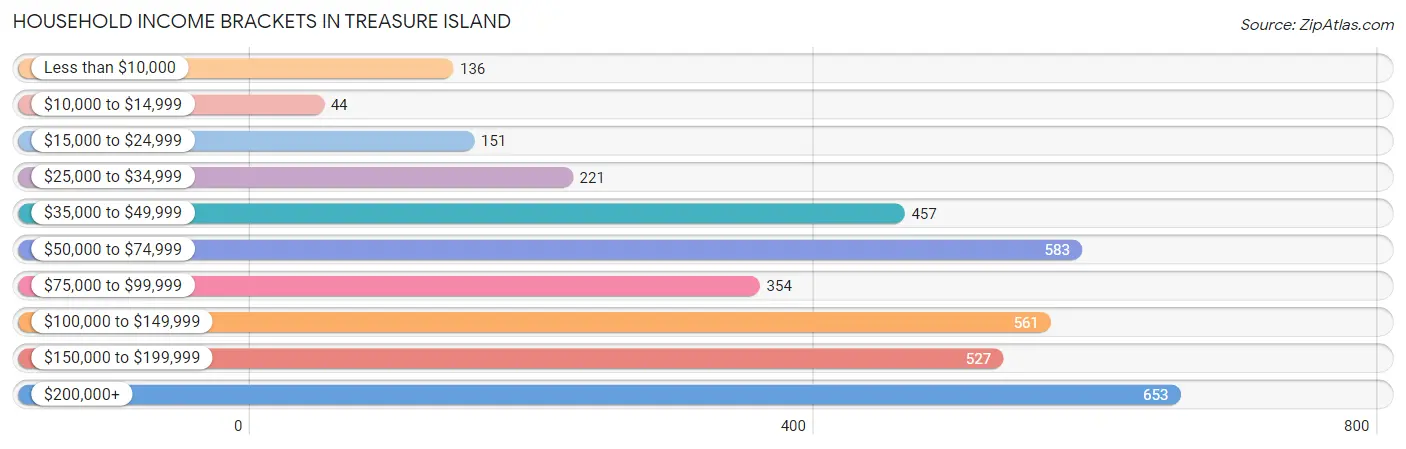
Household Income Brackets in Treasure Island
With 653 households falling in the category, the $200,000+ income range is the most frequent in Treasure Island, accounting for 17.7% of all households. In contrast, only 44 households (1.2%) fall into the $10,000 to $14,999 income bracket, making it the least populous group.
| Income Bracket | # Households | % Households |
| Less than $10,000 | 136 | 3.7% |
| $10,000 to $14,999 | 44 | 1.2% |
| $15,000 to $24,999 | 151 | 4.1% |
| $25,000 to $34,999 | 221 | 6.0% |
| $35,000 to $49,999 | 457 | 12.4% |
| $50,000 to $74,999 | 583 | 15.8% |
| $75,000 to $99,999 | 354 | 9.6% |
| $100,000 to $149,999 | 561 | 15.2% |
| $150,000 to $199,999 | 527 | 14.3% |
| $200,000+ | 653 | 17.7% |
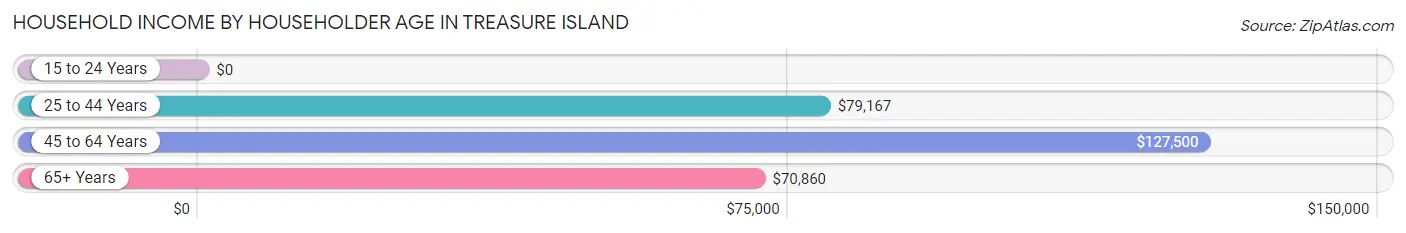
Household Income by Householder Age in Treasure Island
The median household income in Treasure Island is $87,941, with the highest median household income of $127,500 found in the 45 to 64 years age bracket for the primary householder. A total of 1,388 households (37.6%) fall into this category. Meanwhile, the 15 to 24 years age bracket for the primary householder has the lowest median household income of $0, with 11 households (0.3%) in this group.
| Income Bracket | # Households | Median Income |
| 15 to 24 Years | 11 (0.3%) | $0 |
| 25 to 44 Years | 326 (8.8%) | $79,167 |
| 45 to 64 Years | 1,388 (37.6%) | $127,500 |
| 65+ Years | 1,963 (53.2%) | $70,860 |
| Total | 3,688 (100.0%) | $87,941 |
Poverty in Treasure Island
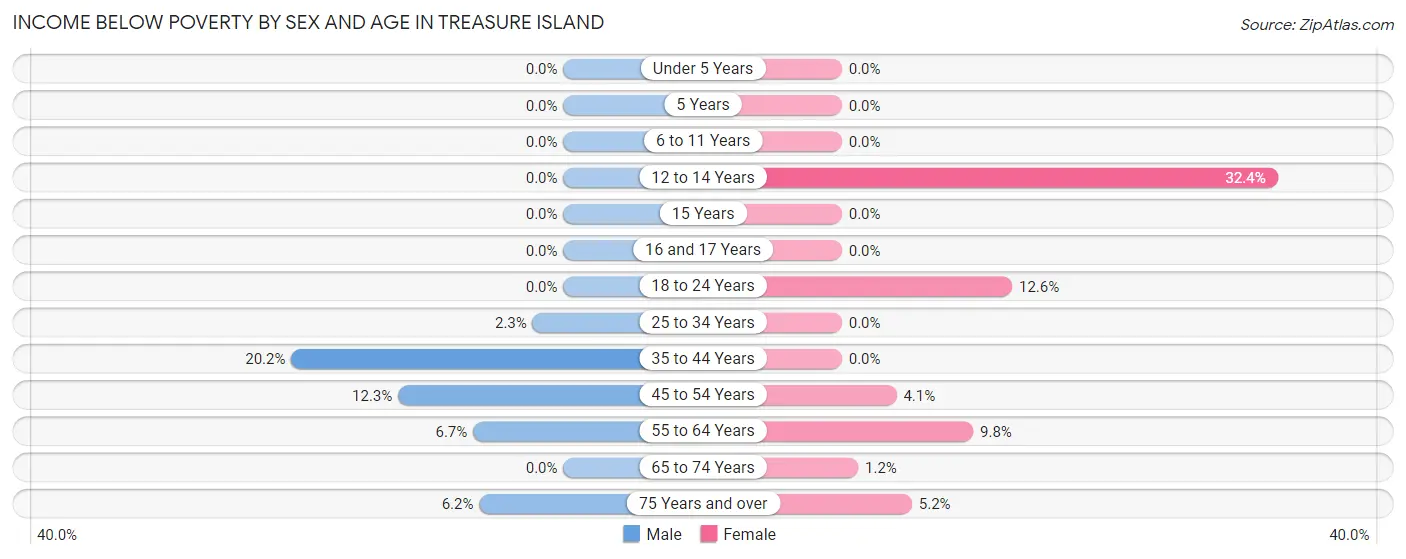
Income Below Poverty by Sex and Age in Treasure Island
With 5.4% poverty level for males and 4.3% for females among the residents of Treasure Island, 35 to 44 year old males and 12 to 14 year old females are the most vulnerable to poverty, with 20 males (20.2%) and 11 females (32.4%) in their respective age groups living below the poverty level.
| Age Bracket | Male | Female |
| Under 5 Years | 0 (0.0%) | 0 (0.0%) |
| 5 Years | 0 (0.0%) | 0 (0.0%) |
| 6 to 11 Years | 0 (0.0%) | 0 (0.0%) |
| 12 to 14 Years | 0 (0.0%) | 11 (32.4%) |
| 15 Years | 0 (0.0%) | 0 (0.0%) |
| 16 and 17 Years | 0 (0.0%) | 0 (0.0%) |
| 18 to 24 Years | 0 (0.0%) | 11 (12.6%) |
| 25 to 34 Years | 9 (2.3%) | 0 (0.0%) |
| 35 to 44 Years | 20 (20.2%) | 0 (0.0%) |
| 45 to 54 Years | 47 (12.3%) | 21 (4.1%) |
| 55 to 64 Years | 57 (6.7%) | 66 (9.8%) |
| 65 to 74 Years | 0 (0.0%) | 15 (1.2%) |
| 75 Years and over | 39 (6.2%) | 21 (5.2%) |
| Total | 172 (5.4%) | 145 (4.3%) |
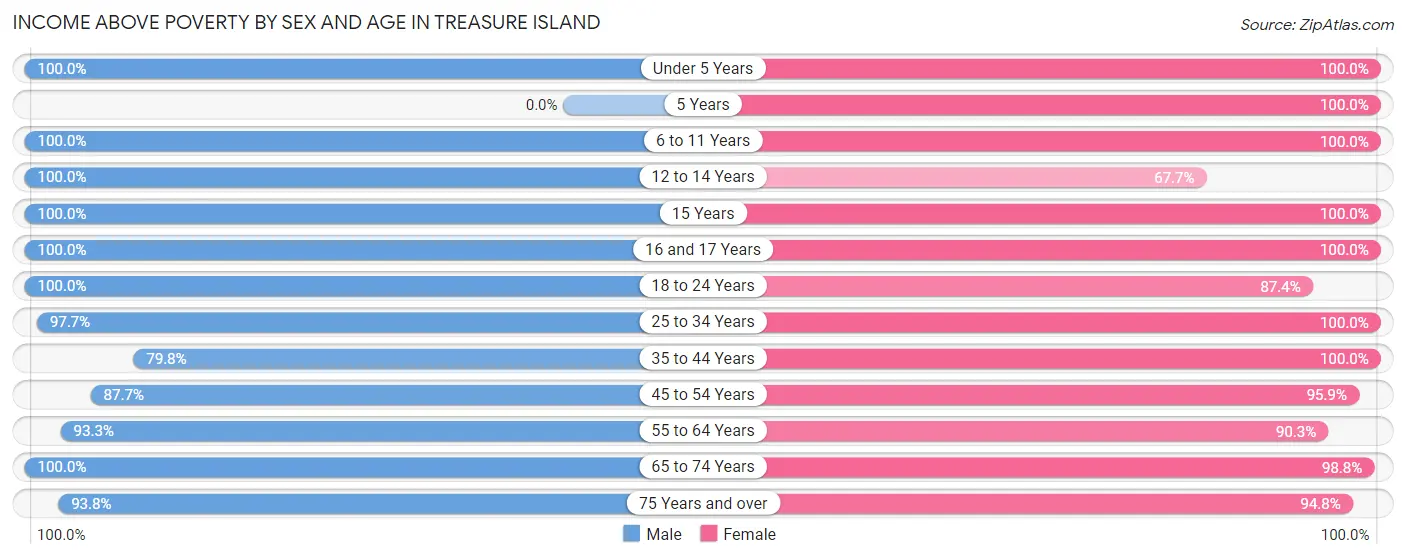
Income Above Poverty by Sex and Age in Treasure Island
According to the poverty statistics in Treasure Island, males aged under 5 years and females aged under 5 years are the age groups that are most secure financially, with 100.0% of males and 100.0% of females in these age groups living above the poverty line.
| Age Bracket | Male | Female |
| Under 5 Years | 15 (100.0%) | 19 (100.0%) |
| 5 Years | 0 (0.0%) | 5 (100.0%) |
| 6 to 11 Years | 41 (100.0%) | 35 (100.0%) |
| 12 to 14 Years | 29 (100.0%) | 23 (67.6%) |
| 15 Years | 13 (100.0%) | 6 (100.0%) |
| 16 and 17 Years | 39 (100.0%) | 13 (100.0%) |
| 18 to 24 Years | 61 (100.0%) | 76 (87.4%) |
| 25 to 34 Years | 386 (97.7%) | 164 (100.0%) |
| 35 to 44 Years | 79 (79.8%) | 189 (100.0%) |
| 45 to 54 Years | 336 (87.7%) | 496 (95.9%) |
| 55 to 64 Years | 794 (93.3%) | 611 (90.2%) |
| 65 to 74 Years | 652 (100.0%) | 1,222 (98.8%) |
| 75 Years and over | 586 (93.8%) | 383 (94.8%) |
| Total | 3,031 (94.6%) | 3,242 (95.7%) |
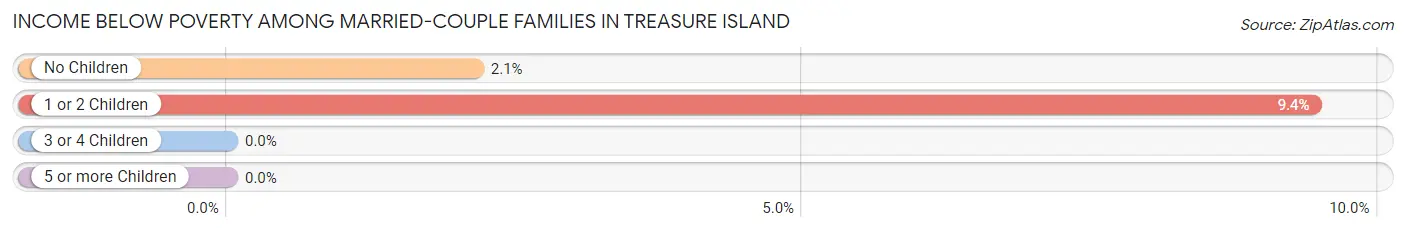
Income Below Poverty Among Married-Couple Families in Treasure Island
The poverty statistics for married-couple families in Treasure Island show that 2.5% or 47 of the total 1,844 families live below the poverty line. Families with 1 or 2 children have the highest poverty rate of 9.4%, comprising of 10 families. On the other hand, families with 3 or 4 children have the lowest poverty rate of 0.0%, which includes 0 families.
| Children | Above Poverty | Below Poverty |
| No Children | 1,696 (97.9%) | 37 (2.1%) |
| 1 or 2 Children | 96 (90.6%) | 10 (9.4%) |
| 3 or 4 Children | 5 (100.0%) | 0 (0.0%) |
| 5 or more Children | 0 (0.0%) | 0 (0.0%) |
| Total | 1,797 (97.5%) | 47 (2.5%) |
Income Below Poverty Among Single-Parent Households in Treasure Island
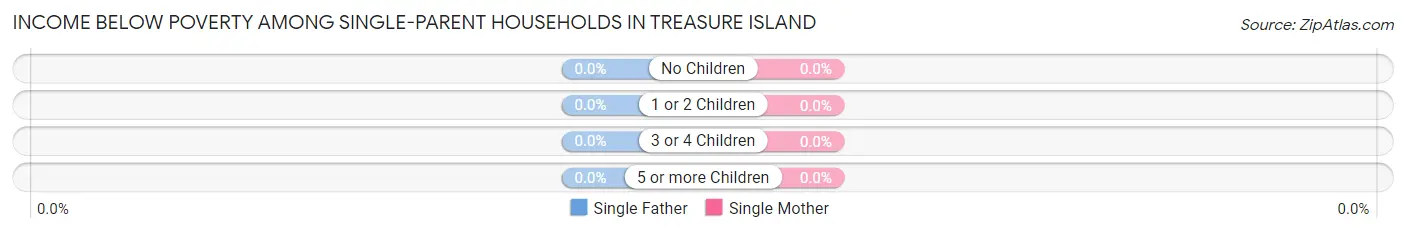
| Children | Single Father | Single Mother |
| No Children | 0 (0.0%) | 0 (0.0%) |
| 1 or 2 Children | 0 (0.0%) | 0 (0.0%) |
| 3 or 4 Children | 0 (0.0%) | 0 (0.0%) |
| 5 or more Children | 0 (0.0%) | 0 (0.0%) |
| Total | 0 (0.0%) | 0 (0.0%) |
Income Below Poverty Among Married-Couple vs Single-Parent Households in Treasure Island
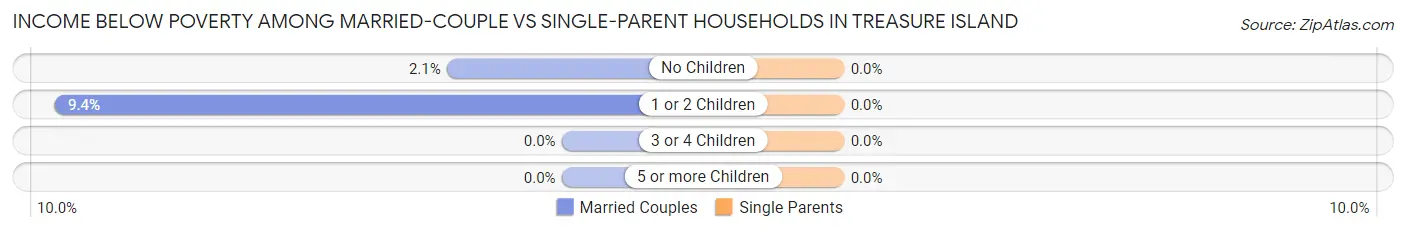
| Children | Married-Couple Families | Single-Parent Households |
| No Children | 37 (2.1%) | 0 (0.0%) |
| 1 or 2 Children | 10 (9.4%) | 0 (0.0%) |
| 3 or 4 Children | 0 (0.0%) | 0 (0.0%) |
| 5 or more Children | 0 (0.0%) | 0 (0.0%) |
| Total | 47 (2.5%) | 0 (0.0%) |
Employment Characteristics in Treasure Island
Employment by Class of Employer in Treasure Island
Among the 2,883 employed individuals in Treasure Island, private company employees (2,044 | 70.9%), self-employed (incorporated) (364 | 12.6%), and not-for-profit organizations (150 | 5.2%) make up the most common classes of employment.
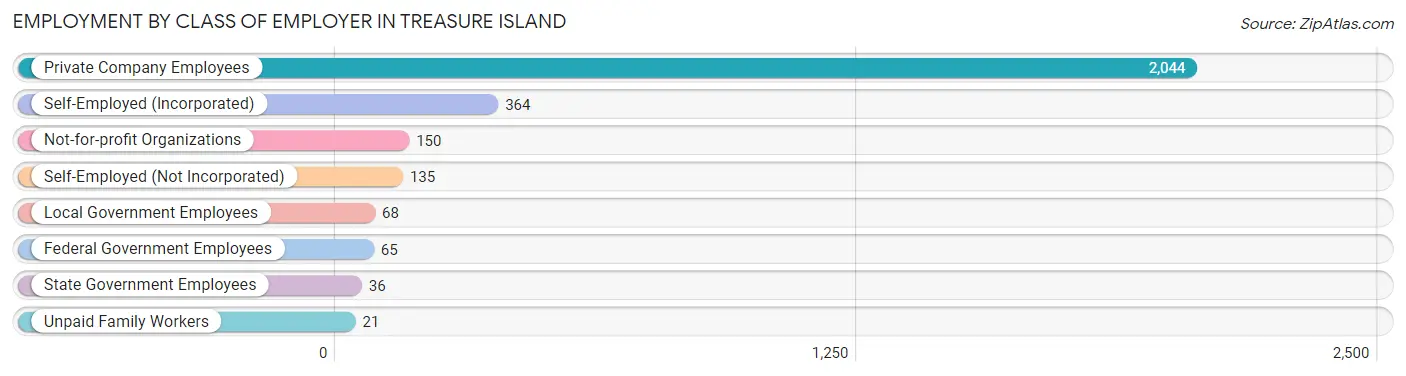
| Employer Class | # Employees | % Employees |
| Private Company Employees | 2,044 | 70.9% |
| Self-Employed (Incorporated) | 364 | 12.6% |
| Self-Employed (Not Incorporated) | 135 | 4.7% |
| Not-for-profit Organizations | 150 | 5.2% |
| Local Government Employees | 68 | 2.4% |
| State Government Employees | 36 | 1.3% |
| Federal Government Employees | 65 | 2.2% |
| Unpaid Family Workers | 21 | 0.7% |
| Total | 2,883 | 100.0% |
Employment Status by Age in Treasure Island
According to the labor force statistics for Treasure Island, out of the total population over 16 years of age (6,393), 48.0% or 3,069 individuals are in the labor force, with 5.5% or 169 of them unemployed. The age group with the highest labor force participation rate is 30 to 34 years, with 100.0% or 430 individuals in the labor force. Within the labor force, the 16 to 19 years age range has the highest percentage of unemployed individuals, with 45.8% or 11 of them being unemployed.
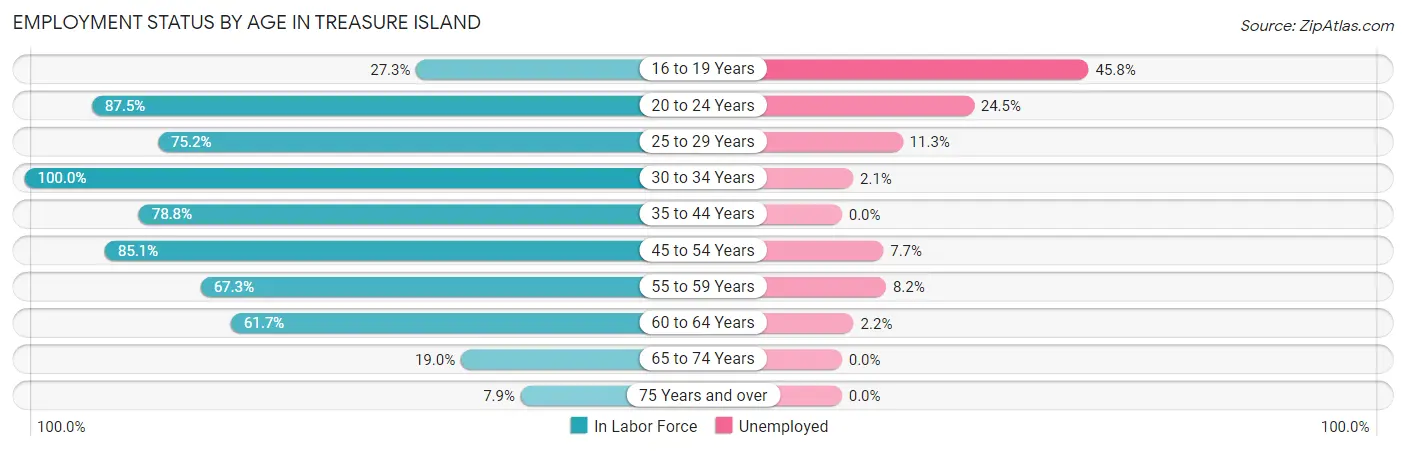
| Age Bracket | In Labor Force | Unemployed |
| 16 to 19 Years | 24 (27.3%) | 11 (45.8%) |
| 20 to 24 Years | 98 (87.5%) | 24 (24.5%) |
| 25 to 29 Years | 97 (75.2%) | 11 (11.3%) |
| 30 to 34 Years | 430 (100.0%) | 9 (2.1%) |
| 35 to 44 Years | 227 (78.8%) | 0 (0.0%) |
| 45 to 54 Years | 766 (85.1%) | 59 (7.7%) |
| 55 to 59 Years | 536 (67.3%) | 44 (8.2%) |
| 60 to 64 Years | 452 (61.7%) | 10 (2.2%) |
| 65 to 74 Years | 359 (19.0%) | 0 (0.0%) |
| 75 Years and over | 81 (7.9%) | 0 (0.0%) |
| Total | 3,069 (48.0%) | 169 (5.5%) |
Employment Status by Educational Attainment in Treasure Island
According to labor force statistics for Treasure Island, 76.6% of individuals (2,509) out of the total population between 25 and 64 years of age (3,275) are in the labor force, with 5.3% or 133 of them being unemployed. The group with the highest labor force participation rate are those with the educational attainment of bachelor's degree or higher, with 80.5% or 1,553 individuals in the labor force. Within the labor force, individuals with high school diploma education have the highest percentage of unemployment, with 10.8% or 39 of them being unemployed.
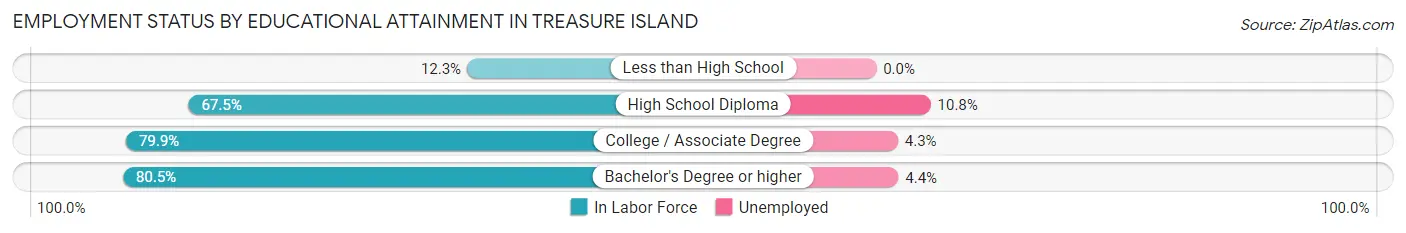
| Educational Attainment | In Labor Force | Unemployed |
| Less than High School | 10 (12.3%) | 0 (0.0%) |
| High School Diploma | 360 (67.5%) | 58 (10.8%) |
| College / Associate Degree | 585 (79.9%) | 31 (4.3%) |
| Bachelor's Degree or higher | 1,553 (80.5%) | 85 (4.4%) |
| Total | 2,509 (76.6%) | 174 (5.3%) |
Employment Occupations by Sex in Treasure Island
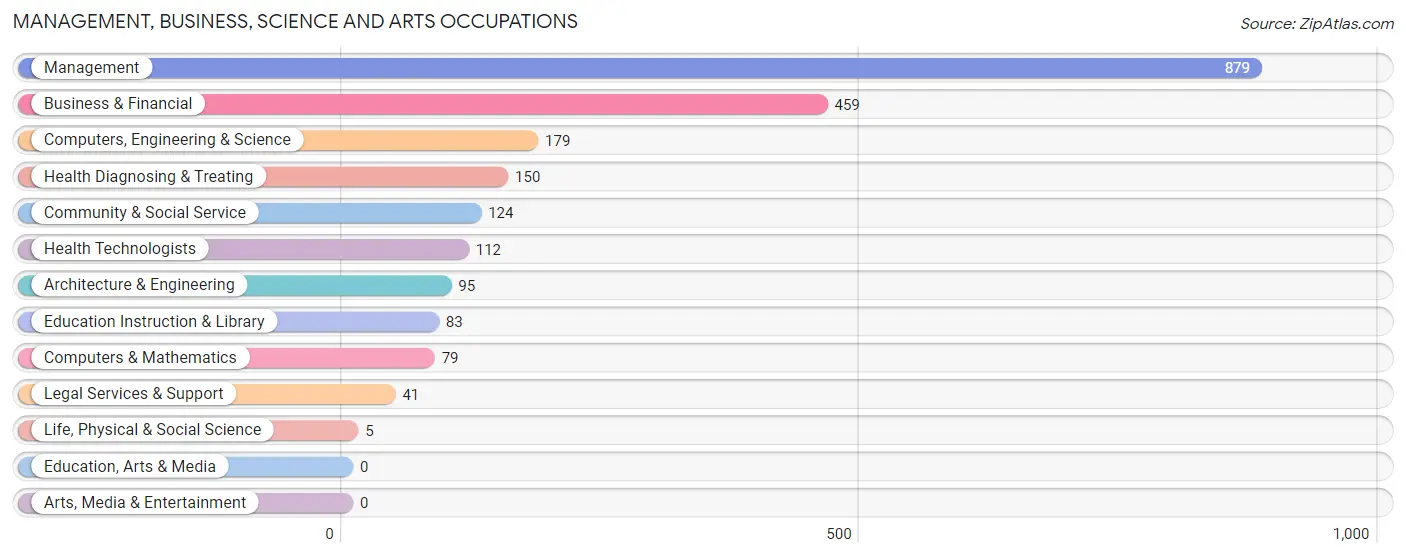
Management, Business, Science and Arts Occupations
The most common Management, Business, Science and Arts occupations in Treasure Island are Management (879 | 30.4%), Business & Financial (459 | 15.9%), Computers, Engineering & Science (179 | 6.2%), Health Diagnosing & Treating (150 | 5.2%), and Community & Social Service (124 | 4.3%).
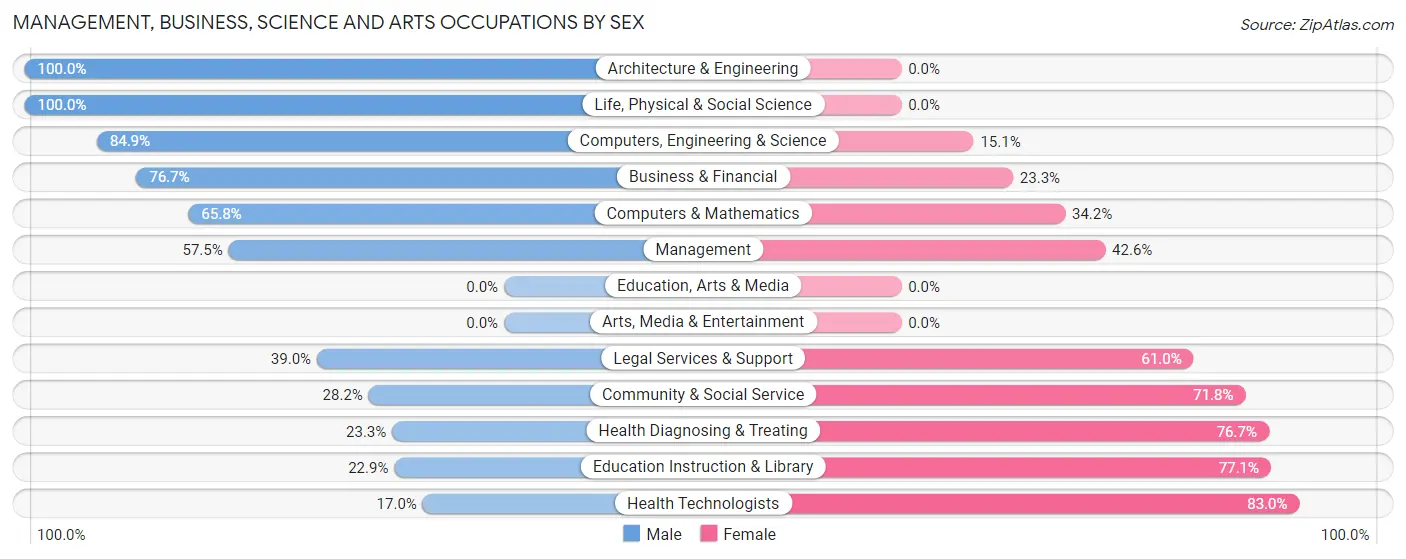
Management, Business, Science and Arts Occupations by Sex
Within the Management, Business, Science and Arts occupations in Treasure Island, the most male-oriented occupations are Architecture & Engineering (100.0%), Life, Physical & Social Science (100.0%), and Computers, Engineering & Science (84.9%), while the most female-oriented occupations are Health Technologists (83.0%), Education Instruction & Library (77.1%), and Health Diagnosing & Treating (76.7%).
| Occupation | Male | Female |
| Management | 505 (57.5%) | 374 (42.5%) |
| Business & Financial | 352 (76.7%) | 107 (23.3%) |
| Computers, Engineering & Science | 152 (84.9%) | 27 (15.1%) |
| Computers & Mathematics | 52 (65.8%) | 27 (34.2%) |
| Architecture & Engineering | 95 (100.0%) | 0 (0.0%) |
| Life, Physical & Social Science | 5 (100.0%) | 0 (0.0%) |
| Community & Social Service | 35 (28.2%) | 89 (71.8%) |
| Education, Arts & Media | 0 (0.0%) | 0 (0.0%) |
| Legal Services & Support | 16 (39.0%) | 25 (61.0%) |
| Education Instruction & Library | 19 (22.9%) | 64 (77.1%) |
| Arts, Media & Entertainment | 0 (0.0%) | 0 (0.0%) |
| Health Diagnosing & Treating | 35 (23.3%) | 115 (76.7%) |
| Health Technologists | 19 (17.0%) | 93 (83.0%) |
| Total (Category) | 1,079 (60.3%) | 712 (39.8%) |
| Total (Overall) | 1,569 (54.2%) | 1,323 (45.8%) |
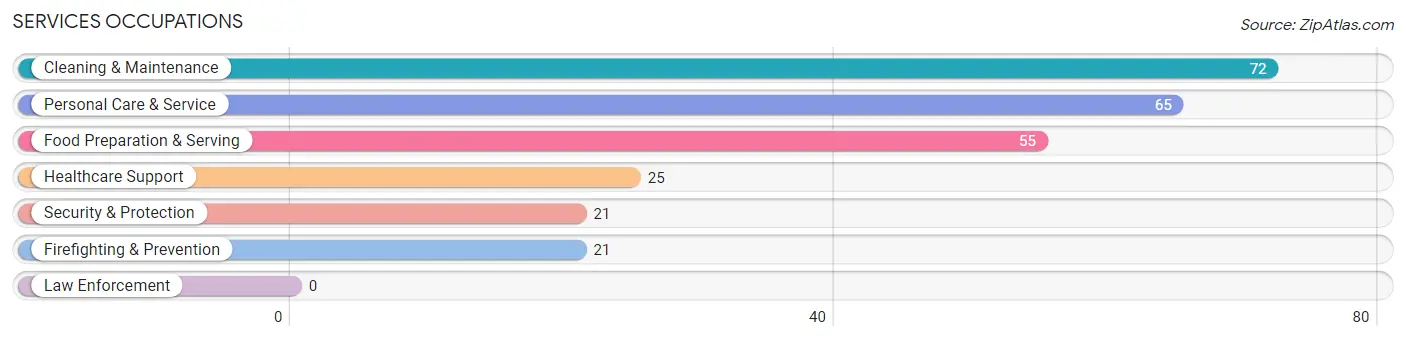
Services Occupations
The most common Services occupations in Treasure Island are Cleaning & Maintenance (72 | 2.5%), Personal Care & Service (65 | 2.2%), Food Preparation & Serving (55 | 1.9%), Healthcare Support (25 | 0.9%), and Security & Protection (21 | 0.7%).
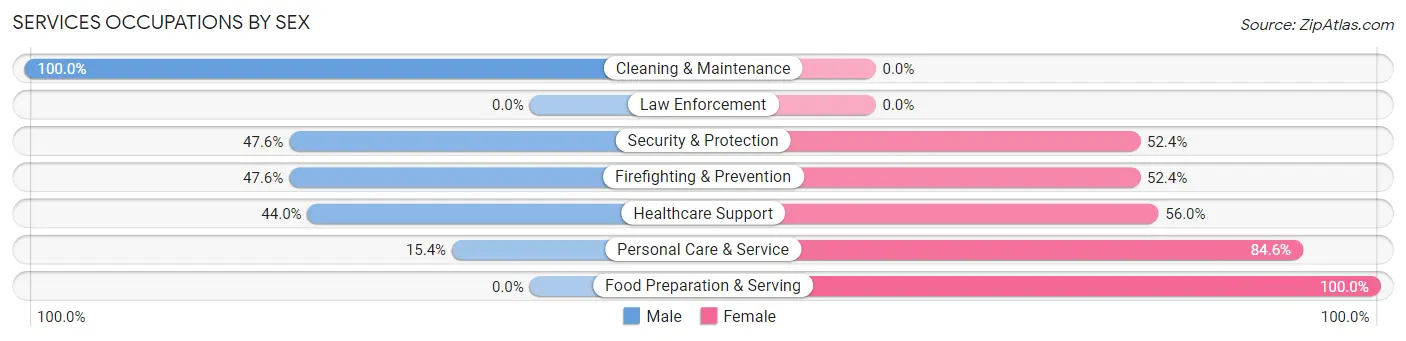
Services Occupations by Sex
Within the Services occupations in Treasure Island, the most male-oriented occupations are Cleaning & Maintenance (100.0%), Security & Protection (47.6%), and Firefighting & Prevention (47.6%), while the most female-oriented occupations are Food Preparation & Serving (100.0%), Personal Care & Service (84.6%), and Healthcare Support (56.0%).
| Occupation | Male | Female |
| Healthcare Support | 11 (44.0%) | 14 (56.0%) |
| Security & Protection | 10 (47.6%) | 11 (52.4%) |
| Firefighting & Prevention | 10 (47.6%) | 11 (52.4%) |
| Law Enforcement | 0 (0.0%) | 0 (0.0%) |
| Food Preparation & Serving | 0 (0.0%) | 55 (100.0%) |
| Cleaning & Maintenance | 72 (100.0%) | 0 (0.0%) |
| Personal Care & Service | 10 (15.4%) | 55 (84.6%) |
| Total (Category) | 103 (43.3%) | 135 (56.7%) |
| Total (Overall) | 1,569 (54.2%) | 1,323 (45.8%) |
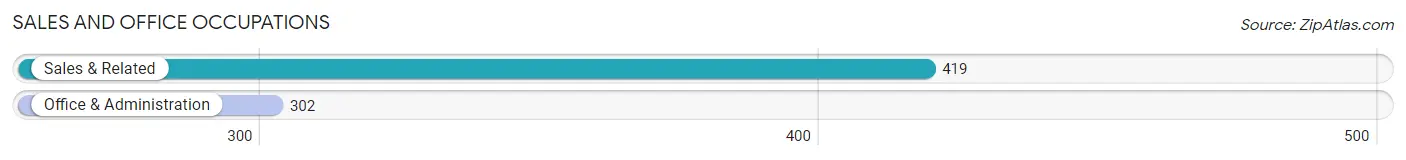
Sales and Office Occupations
The most common Sales and Office occupations in Treasure Island are Sales & Related (419 | 14.5%), and Office & Administration (302 | 10.4%).
Sales and Office Occupations by Sex
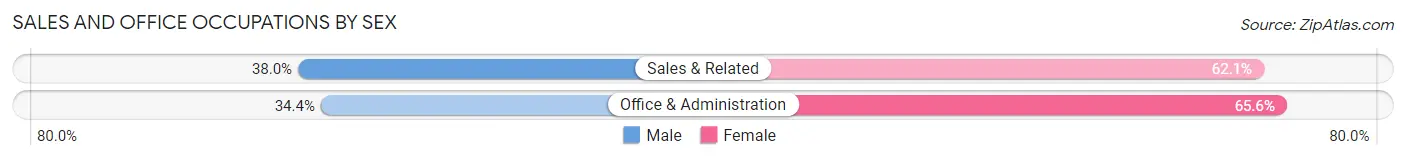
| Occupation | Male | Female |
| Sales & Related | 159 (38.0%) | 260 (62.1%) |
| Office & Administration | 104 (34.4%) | 198 (65.6%) |
| Total (Category) | 263 (36.5%) | 458 (63.5%) |
| Total (Overall) | 1,569 (54.2%) | 1,323 (45.8%) |
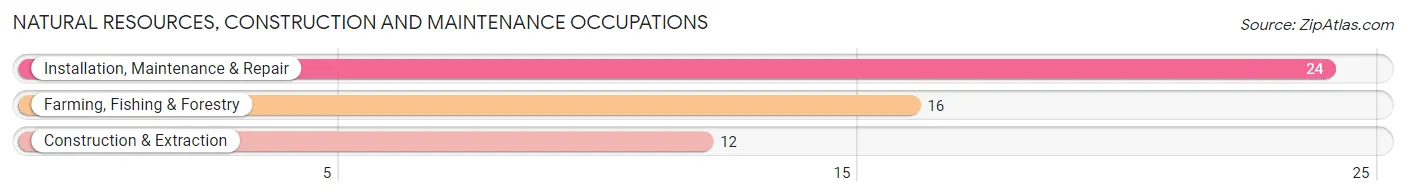
Natural Resources, Construction and Maintenance Occupations
The most common Natural Resources, Construction and Maintenance occupations in Treasure Island are Installation, Maintenance & Repair (24 | 0.8%), Farming, Fishing & Forestry (16 | 0.5%), and Construction & Extraction (12 | 0.4%).
Natural Resources, Construction and Maintenance Occupations by Sex
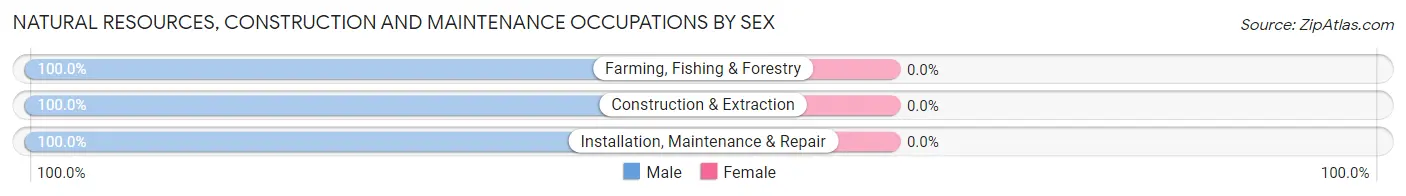
| Occupation | Male | Female |
| Farming, Fishing & Forestry | 16 (100.0%) | 0 (0.0%) |
| Construction & Extraction | 12 (100.0%) | 0 (0.0%) |
| Installation, Maintenance & Repair | 24 (100.0%) | 0 (0.0%) |
| Total (Category) | 52 (100.0%) | 0 (0.0%) |
| Total (Overall) | 1,569 (54.2%) | 1,323 (45.8%) |
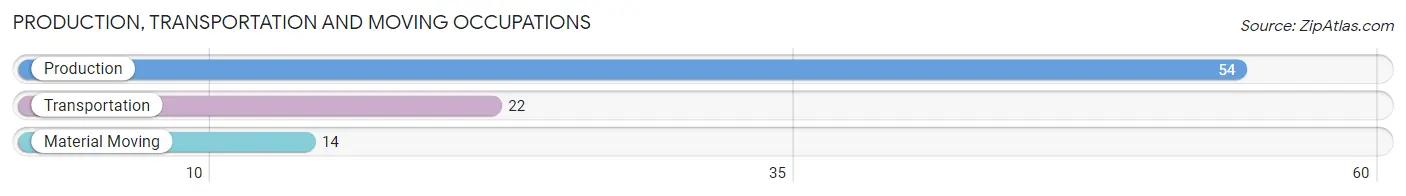
Production, Transportation and Moving Occupations
The most common Production, Transportation and Moving occupations in Treasure Island are Production (54 | 1.9%), Transportation (22 | 0.8%), and Material Moving (14 | 0.5%).
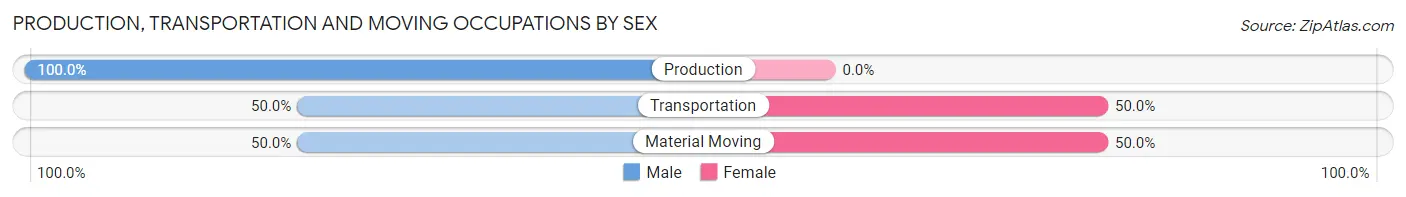
Production, Transportation and Moving Occupations by Sex
| Occupation | Male | Female |
| Production | 54 (100.0%) | 0 (0.0%) |
| Transportation | 11 (50.0%) | 11 (50.0%) |
| Material Moving | 7 (50.0%) | 7 (50.0%) |
| Total (Category) | 72 (80.0%) | 18 (20.0%) |
| Total (Overall) | 1,569 (54.2%) | 1,323 (45.8%) |
Employment Industries by Sex in Treasure Island
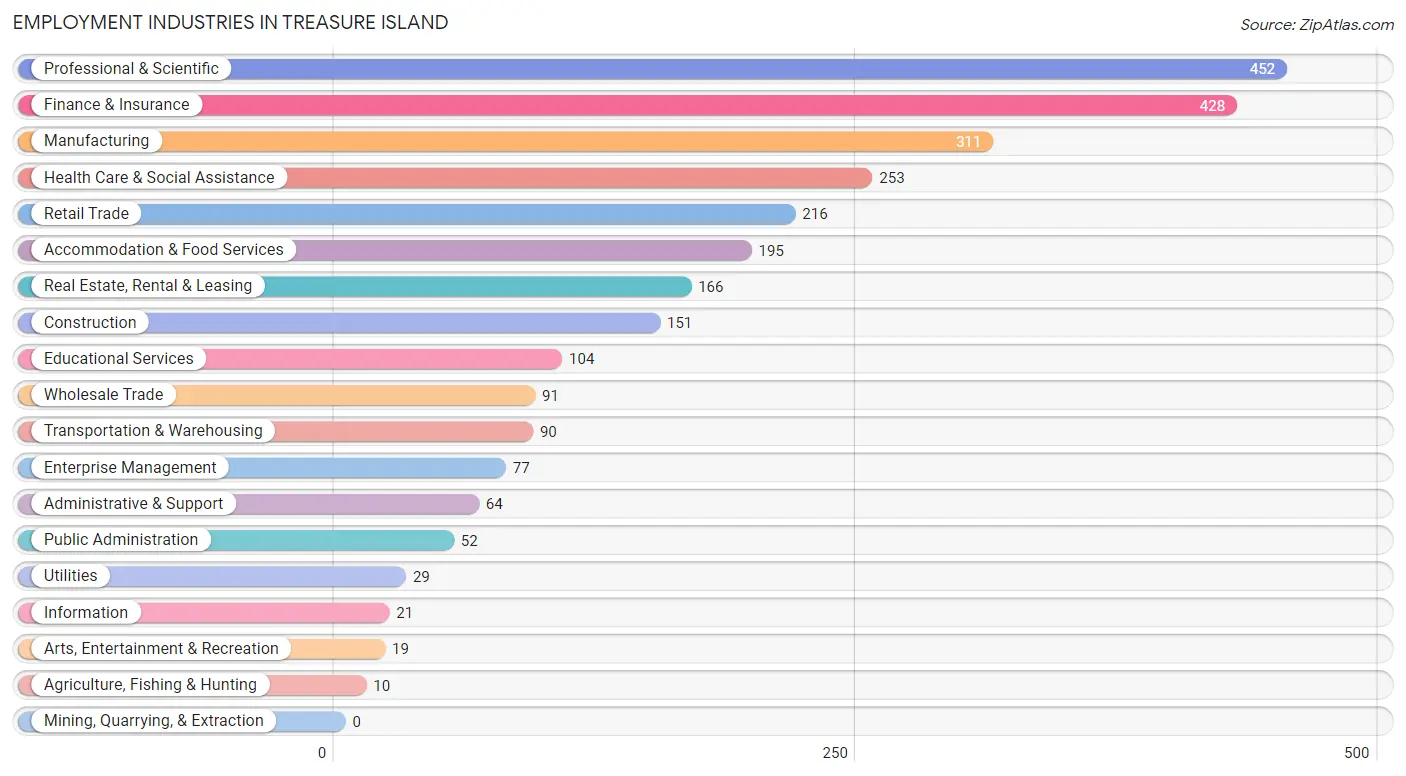
Employment Industries in Treasure Island
The major employment industries in Treasure Island include Professional & Scientific (452 | 15.6%), Finance & Insurance (428 | 14.8%), Manufacturing (311 | 10.7%), Health Care & Social Assistance (253 | 8.7%), and Retail Trade (216 | 7.5%).
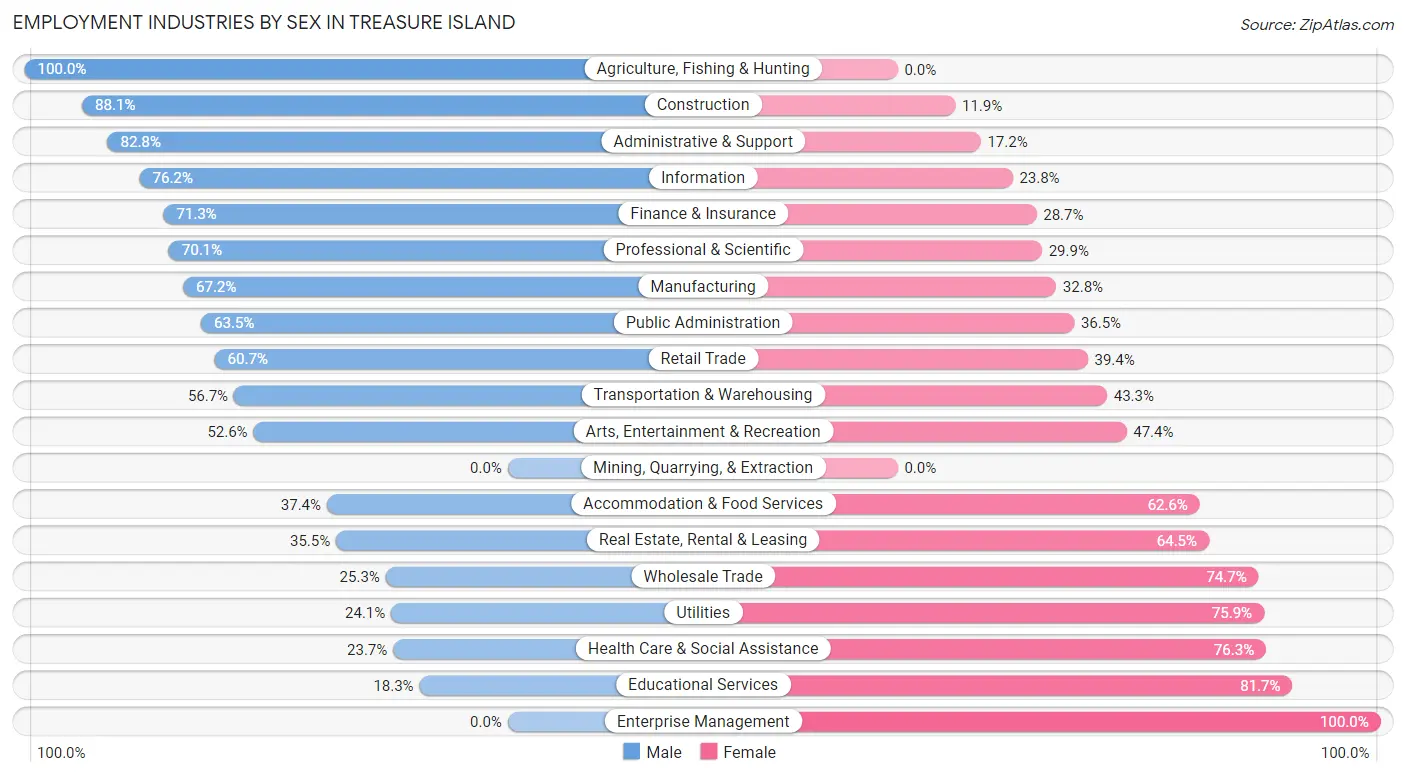
Employment Industries by Sex in Treasure Island
The Treasure Island industries that see more men than women are Agriculture, Fishing & Hunting (100.0%), Construction (88.1%), and Administrative & Support (82.8%), whereas the industries that tend to have a higher number of women are Enterprise Management (100.0%), Educational Services (81.7%), and Health Care & Social Assistance (76.3%).
| Industry | Male | Female |
| Agriculture, Fishing & Hunting | 10 (100.0%) | 0 (0.0%) |
| Mining, Quarrying, & Extraction | 0 (0.0%) | 0 (0.0%) |
| Construction | 133 (88.1%) | 18 (11.9%) |
| Manufacturing | 209 (67.2%) | 102 (32.8%) |
| Wholesale Trade | 23 (25.3%) | 68 (74.7%) |
| Retail Trade | 131 (60.7%) | 85 (39.4%) |
| Transportation & Warehousing | 51 (56.7%) | 39 (43.3%) |
| Utilities | 7 (24.1%) | 22 (75.9%) |
| Information | 16 (76.2%) | 5 (23.8%) |
| Finance & Insurance | 305 (71.3%) | 123 (28.7%) |
| Real Estate, Rental & Leasing | 59 (35.5%) | 107 (64.5%) |
| Professional & Scientific | 317 (70.1%) | 135 (29.9%) |
| Enterprise Management | 0 (0.0%) | 77 (100.0%) |
| Administrative & Support | 53 (82.8%) | 11 (17.2%) |
| Educational Services | 19 (18.3%) | 85 (81.7%) |
| Health Care & Social Assistance | 60 (23.7%) | 193 (76.3%) |
| Arts, Entertainment & Recreation | 10 (52.6%) | 9 (47.4%) |
| Accommodation & Food Services | 73 (37.4%) | 122 (62.6%) |
| Public Administration | 33 (63.5%) | 19 (36.5%) |
| Total | 1,569 (54.2%) | 1,323 (45.8%) |
Education in Treasure Island
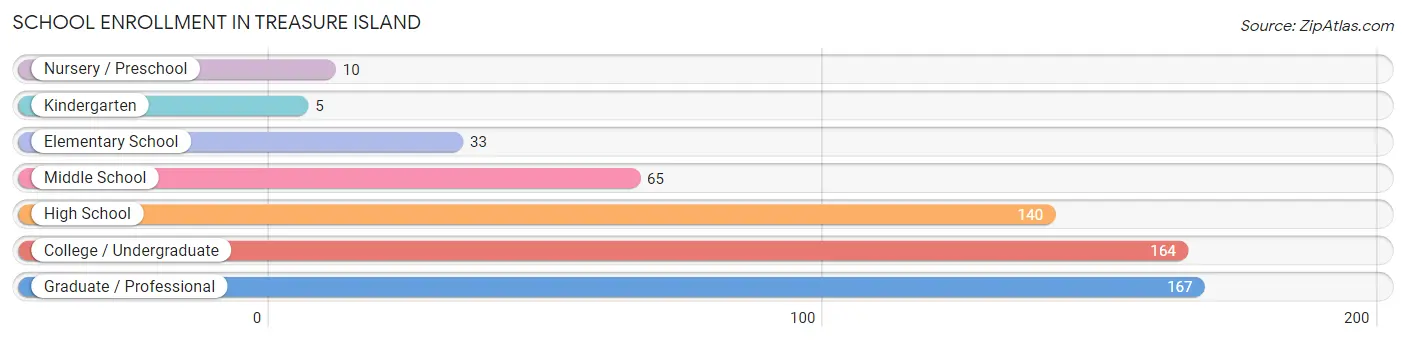
School Enrollment in Treasure Island
The most common levels of schooling among the 584 students in Treasure Island are graduate / professional (167 | 28.6%), college / undergraduate (164 | 28.1%), and high school (140 | 24.0%).
| School Level | # Students | % Students |
| Nursery / Preschool | 10 | 1.7% |
| Kindergarten | 5 | 0.9% |
| Elementary School | 33 | 5.7% |
| Middle School | 65 | 11.1% |
| High School | 140 | 24.0% |
| College / Undergraduate | 164 | 28.1% |
| Graduate / Professional | 167 | 28.6% |
| Total | 584 | 100.0% |
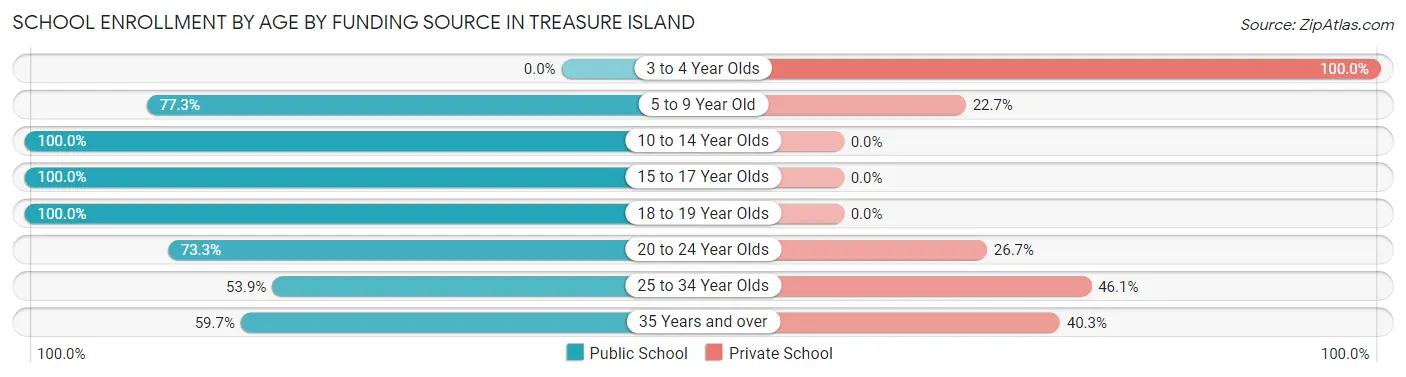
School Enrollment by Age by Funding Source in Treasure Island
Out of a total of 584 students who are enrolled in schools in Treasure Island, 147 (25.2%) attend a private institution, while the remaining 437 (74.8%) are enrolled in public schools. The age group of 3 to 4 year olds has the highest likelihood of being enrolled in private schools, with 10 (100.0% in the age bracket) enrolled. Conversely, the age group of 10 to 14 year olds has the lowest likelihood of being enrolled in a private school, with 122 (100.0% in the age bracket) attending a public institution.
| Age Bracket | Public School | Private School |
| 3 to 4 Year Olds | 0 (0.0%) | 10 (100.0%) |
| 5 to 9 Year Old | 17 (77.3%) | 5 (22.7%) |
| 10 to 14 Year Olds | 122 (100.0%) | 0 (0.0%) |
| 15 to 17 Year Olds | 71 (100.0%) | 0 (0.0%) |
| 18 to 19 Year Olds | 25 (100.0%) | 0 (0.0%) |
| 20 to 24 Year Olds | 66 (73.3%) | 24 (26.7%) |
| 25 to 34 Year Olds | 90 (53.9%) | 77 (46.1%) |
| 35 Years and over | 46 (59.7%) | 31 (40.3%) |
| Total | 437 (74.8%) | 147 (25.2%) |
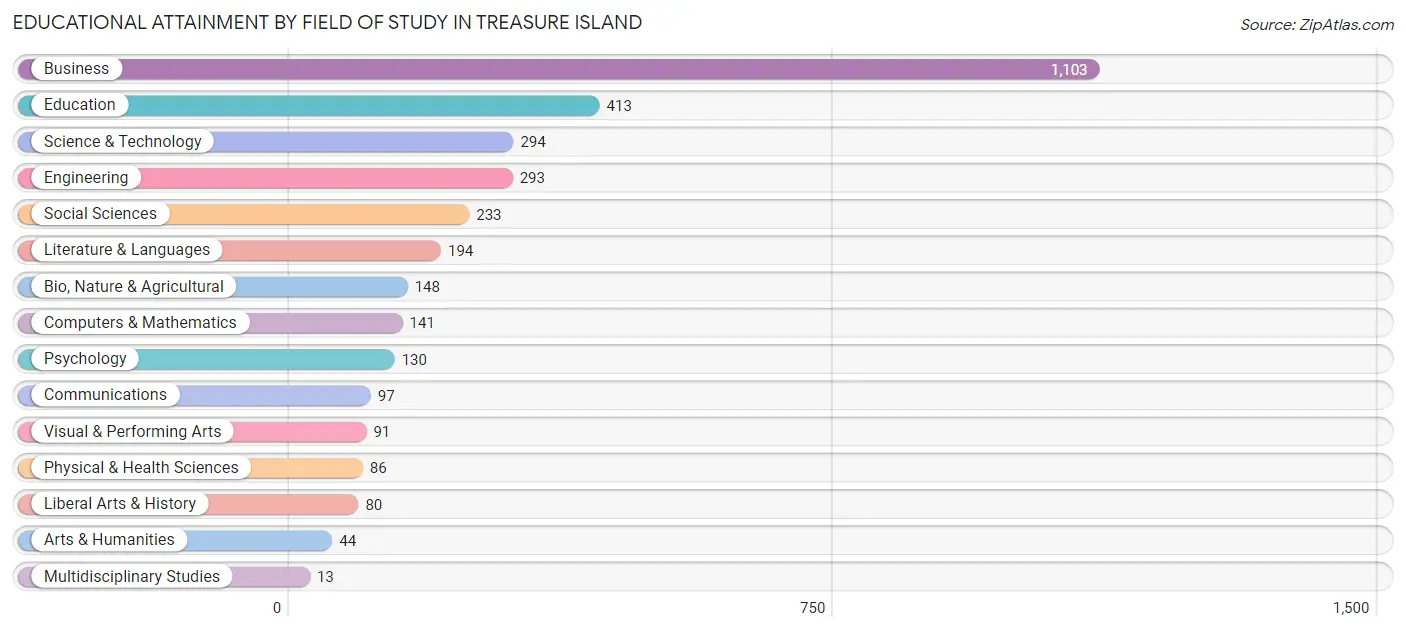
Educational Attainment by Field of Study in Treasure Island
Business (1,103 | 32.8%), education (413 | 12.3%), science & technology (294 | 8.7%), engineering (293 | 8.7%), and social sciences (233 | 6.9%) are the most common fields of study among 3,360 individuals in Treasure Island who have obtained a bachelor's degree or higher.
| Field of Study | # Graduates | % Graduates |
| Computers & Mathematics | 141 | 4.2% |
| Bio, Nature & Agricultural | 148 | 4.4% |
| Physical & Health Sciences | 86 | 2.6% |
| Psychology | 130 | 3.9% |
| Social Sciences | 233 | 6.9% |
| Engineering | 293 | 8.7% |
| Multidisciplinary Studies | 13 | 0.4% |
| Science & Technology | 294 | 8.7% |
| Business | 1,103 | 32.8% |
| Education | 413 | 12.3% |
| Literature & Languages | 194 | 5.8% |
| Liberal Arts & History | 80 | 2.4% |
| Visual & Performing Arts | 91 | 2.7% |
| Communications | 97 | 2.9% |
| Arts & Humanities | 44 | 1.3% |
| Total | 3,360 | 100.0% |
Transportation & Commute in Treasure Island
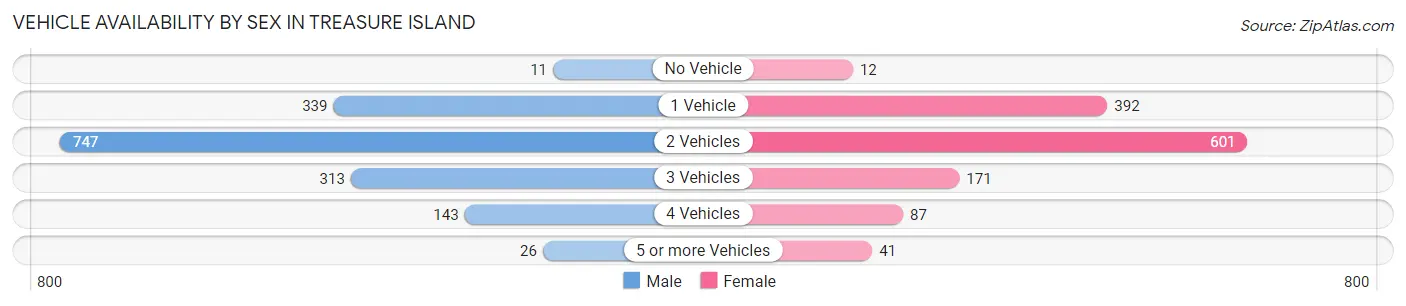
Vehicle Availability by Sex in Treasure Island
The most prevalent vehicle ownership categories in Treasure Island are males with 2 vehicles (747, accounting for 47.3%) and females with 2 vehicles (601, making up 57.3%).
| Vehicles Available | Male | Female |
| No Vehicle | 11 (0.7%) | 12 (0.9%) |
| 1 Vehicle | 339 (21.5%) | 392 (30.1%) |
| 2 Vehicles | 747 (47.3%) | 601 (46.1%) |
| 3 Vehicles | 313 (19.8%) | 171 (13.1%) |
| 4 Vehicles | 143 (9.1%) | 87 (6.7%) |
| 5 or more Vehicles | 26 (1.7%) | 41 (3.1%) |
| Total | 1,579 (100.0%) | 1,304 (100.0%) |
Commute Time in Treasure Island
The most frequently occuring commute durations in Treasure Island are 20 to 24 minutes (340 commuters, 17.2%), 15 to 19 minutes (312 commuters, 15.8%), and 30 to 34 minutes (261 commuters, 13.2%).
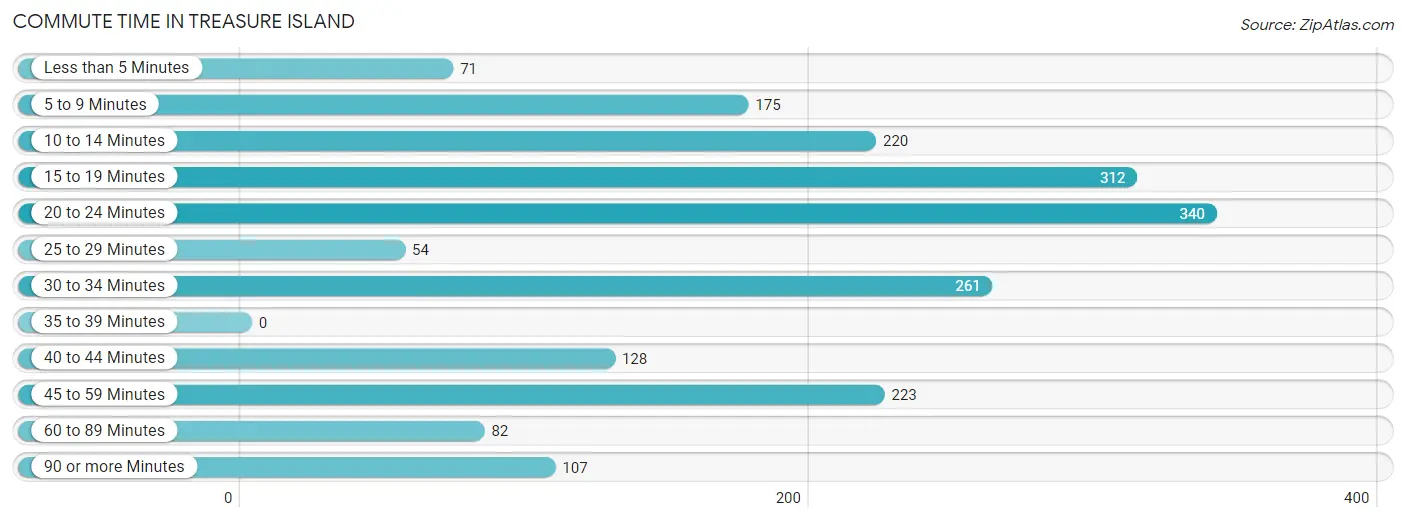
| Commute Time | # Commuters | % Commuters |
| Less than 5 Minutes | 71 | 3.6% |
| 5 to 9 Minutes | 175 | 8.9% |
| 10 to 14 Minutes | 220 | 11.2% |
| 15 to 19 Minutes | 312 | 15.8% |
| 20 to 24 Minutes | 340 | 17.2% |
| 25 to 29 Minutes | 54 | 2.7% |
| 30 to 34 Minutes | 261 | 13.2% |
| 35 to 39 Minutes | 0 | 0.0% |
| 40 to 44 Minutes | 128 | 6.5% |
| 45 to 59 Minutes | 223 | 11.3% |
| 60 to 89 Minutes | 82 | 4.2% |
| 90 or more Minutes | 107 | 5.4% |
Commute Time by Sex in Treasure Island
The most common commute times in Treasure Island are 20 to 24 minutes (214 commuters, 19.0%) for males and 15 to 19 minutes (177 commuters, 20.9%) for females.
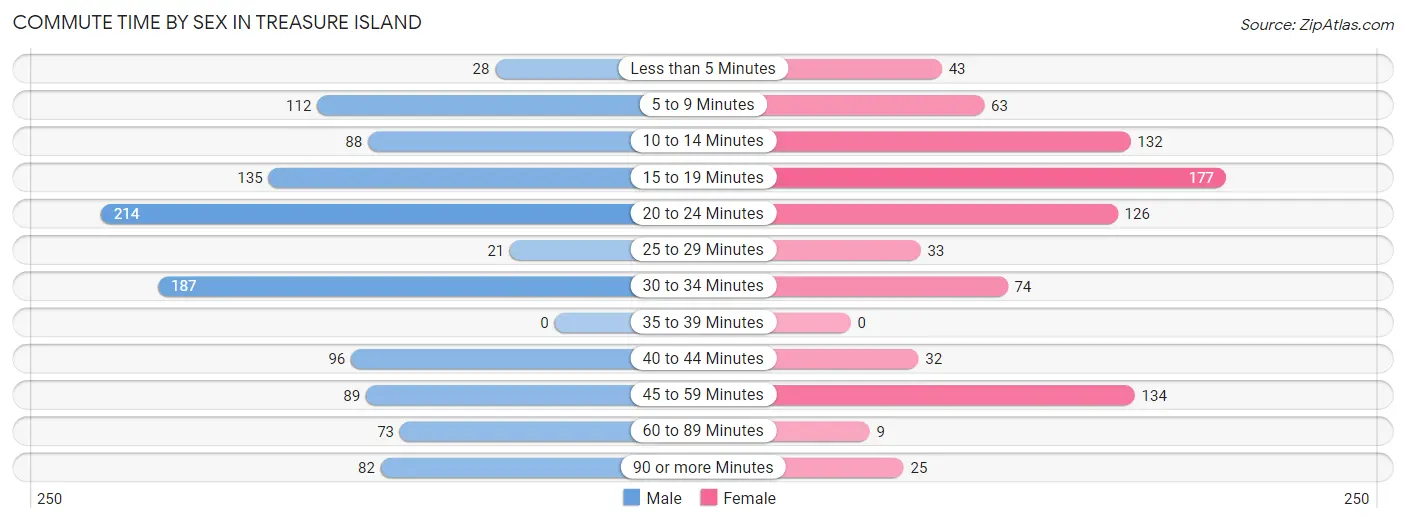
| Commute Time | Male | Female |
| Less than 5 Minutes | 28 (2.5%) | 43 (5.1%) |
| 5 to 9 Minutes | 112 (10.0%) | 63 (7.4%) |
| 10 to 14 Minutes | 88 (7.8%) | 132 (15.6%) |
| 15 to 19 Minutes | 135 (12.0%) | 177 (20.9%) |
| 20 to 24 Minutes | 214 (19.0%) | 126 (14.9%) |
| 25 to 29 Minutes | 21 (1.9%) | 33 (3.9%) |
| 30 to 34 Minutes | 187 (16.6%) | 74 (8.7%) |
| 35 to 39 Minutes | 0 (0.0%) | 0 (0.0%) |
| 40 to 44 Minutes | 96 (8.5%) | 32 (3.8%) |
| 45 to 59 Minutes | 89 (7.9%) | 134 (15.8%) |
| 60 to 89 Minutes | 73 (6.5%) | 9 (1.1%) |
| 90 or more Minutes | 82 (7.3%) | 25 (2.9%) |
Time of Departure to Work by Sex in Treasure Island
The most frequent times of departure to work in Treasure Island are 7:00 AM to 7:29 AM (259, 23.0%) for males and 9:00 AM to 9:59 AM (209, 24.6%) for females.
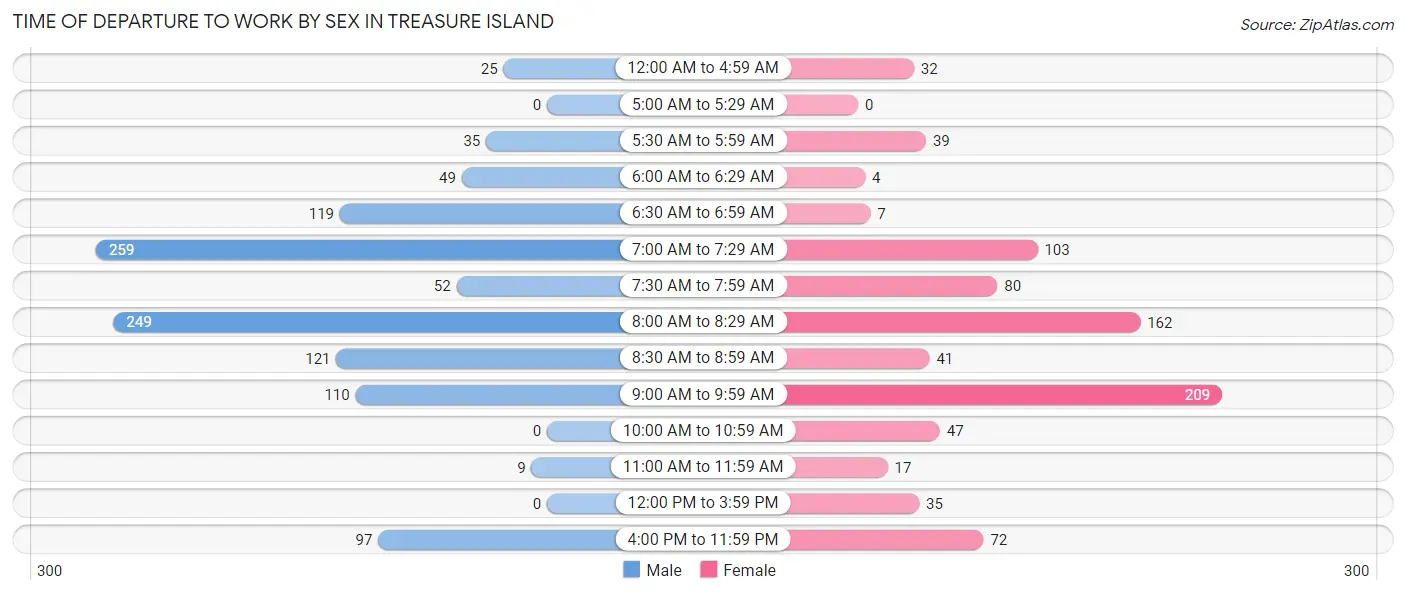
| Time of Departure | Male | Female |
| 12:00 AM to 4:59 AM | 25 (2.2%) | 32 (3.8%) |
| 5:00 AM to 5:29 AM | 0 (0.0%) | 0 (0.0%) |
| 5:30 AM to 5:59 AM | 35 (3.1%) | 39 (4.6%) |
| 6:00 AM to 6:29 AM | 49 (4.4%) | 4 (0.5%) |
| 6:30 AM to 6:59 AM | 119 (10.6%) | 7 (0.8%) |
| 7:00 AM to 7:29 AM | 259 (23.0%) | 103 (12.1%) |
| 7:30 AM to 7:59 AM | 52 (4.6%) | 80 (9.4%) |
| 8:00 AM to 8:29 AM | 249 (22.1%) | 162 (19.1%) |
| 8:30 AM to 8:59 AM | 121 (10.8%) | 41 (4.8%) |
| 9:00 AM to 9:59 AM | 110 (9.8%) | 209 (24.6%) |
| 10:00 AM to 10:59 AM | 0 (0.0%) | 47 (5.5%) |
| 11:00 AM to 11:59 AM | 9 (0.8%) | 17 (2.0%) |
| 12:00 PM to 3:59 PM | 0 (0.0%) | 35 (4.1%) |
| 4:00 PM to 11:59 PM | 97 (8.6%) | 72 (8.5%) |
| Total | 1,125 (100.0%) | 848 (100.0%) |
Housing Occupancy in Treasure Island
Occupancy by Ownership in Treasure Island
Of the total 3,688 dwellings in Treasure Island, owner-occupied units account for 2,870 (77.8%), while renter-occupied units make up 818 (22.2%).
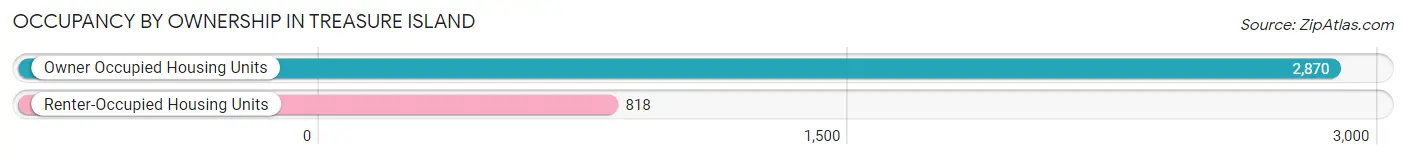
| Occupancy | # Housing Units | % Housing Units |
| Owner Occupied Housing Units | 2,870 | 77.8% |
| Renter-Occupied Housing Units | 818 | 22.2% |
| Total Occupied Housing Units | 3,688 | 100.0% |
Occupancy by Household Size in Treasure Island
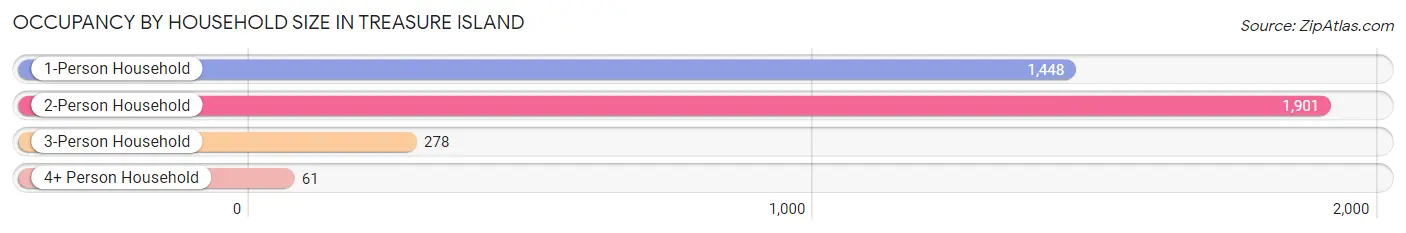
| Household Size | # Housing Units | % Housing Units |
| 1-Person Household | 1,448 | 39.3% |
| 2-Person Household | 1,901 | 51.5% |
| 3-Person Household | 278 | 7.5% |
| 4+ Person Household | 61 | 1.7% |
| Total Housing Units | 3,688 | 100.0% |
Occupancy by Ownership by Household Size in Treasure Island
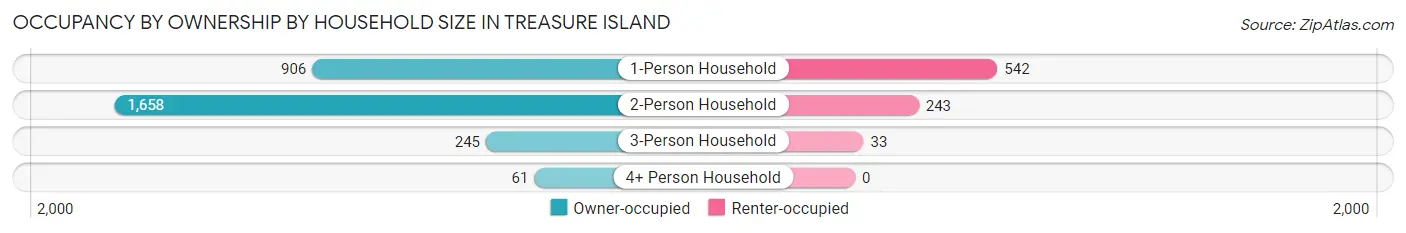
| Household Size | Owner-occupied | Renter-occupied |
| 1-Person Household | 906 (62.6%) | 542 (37.4%) |
| 2-Person Household | 1,658 (87.2%) | 243 (12.8%) |
| 3-Person Household | 245 (88.1%) | 33 (11.9%) |
| 4+ Person Household | 61 (100.0%) | 0 (0.0%) |
| Total Housing Units | 2,870 (77.8%) | 818 (22.2%) |
Occupancy by Educational Attainment in Treasure Island
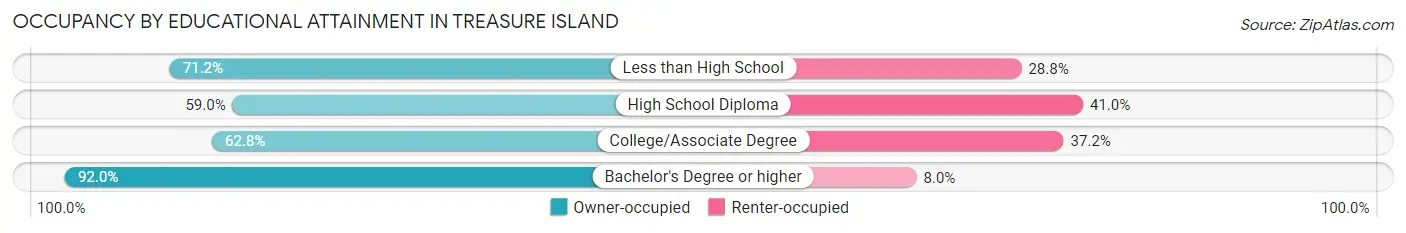
| Household Size | Owner-occupied | Renter-occupied |
| Less than High School | 84 (71.2%) | 34 (28.8%) |
| High School Diploma | 220 (59.0%) | 153 (41.0%) |
| College/Associate Degree | 808 (62.8%) | 478 (37.2%) |
| Bachelor's Degree or higher | 1,758 (92.0%) | 153 (8.0%) |
Occupancy by Age of Householder in Treasure Island
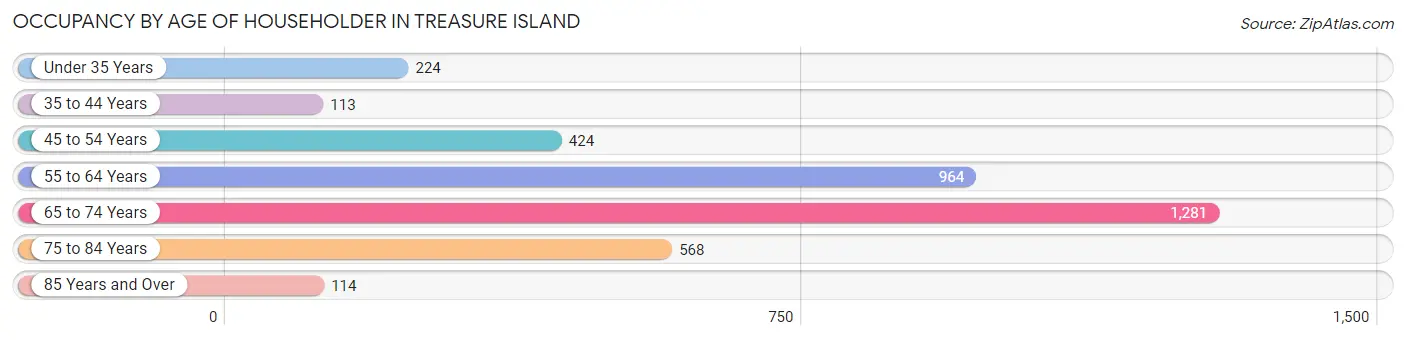
| Age Bracket | # Households | % Households |
| Under 35 Years | 224 | 6.1% |
| 35 to 44 Years | 113 | 3.1% |
| 45 to 54 Years | 424 | 11.5% |
| 55 to 64 Years | 964 | 26.1% |
| 65 to 74 Years | 1,281 | 34.7% |
| 75 to 84 Years | 568 | 15.4% |
| 85 Years and Over | 114 | 3.1% |
| Total | 3,688 | 100.0% |
Housing Finances in Treasure Island
Median Income by Occupancy in Treasure Island
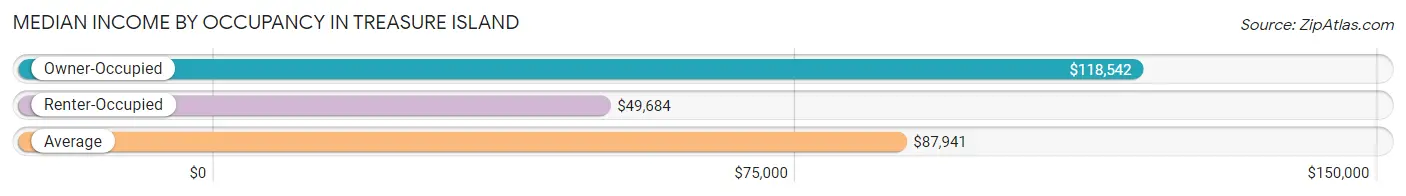
| Occupancy Type | # Households | Median Income |
| Owner-Occupied | 2,870 (77.8%) | $118,542 |
| Renter-Occupied | 818 (22.2%) | $49,684 |
| Average | 3,688 (100.0%) | $87,941 |
Occupancy by Householder Income Bracket in Treasure Island
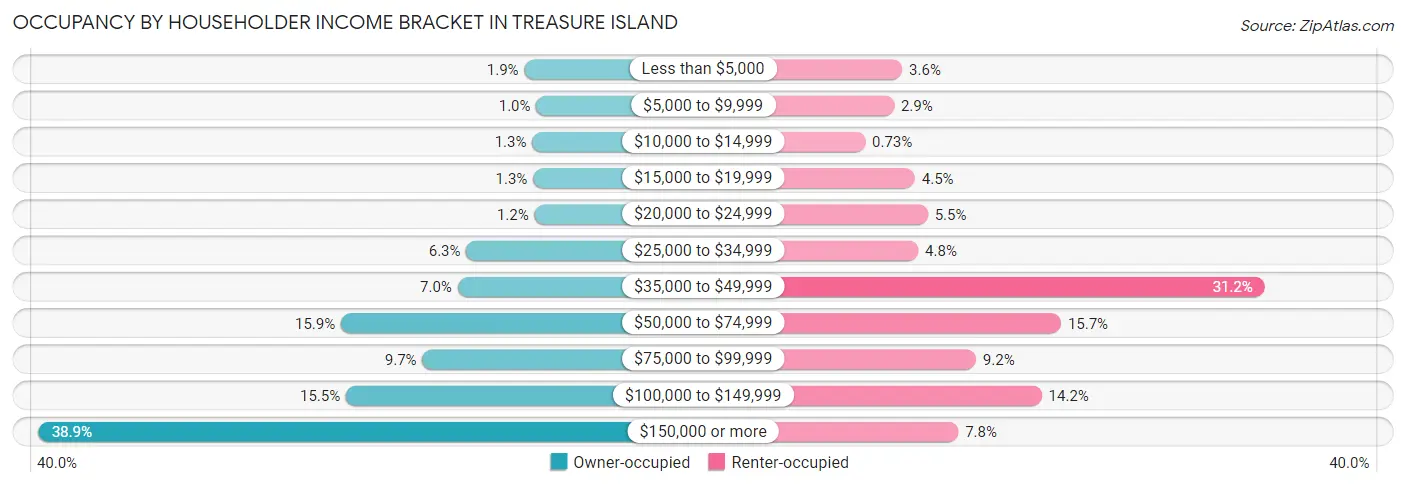
| Income Bracket | Owner-occupied | Renter-occupied |
| Less than $5,000 | 55 (1.9%) | 29 (3.5%) |
| $5,000 to $9,999 | 29 (1.0%) | 24 (2.9%) |
| $10,000 to $14,999 | 38 (1.3%) | 6 (0.7%) |
| $15,000 to $19,999 | 36 (1.3%) | 37 (4.5%) |
| $20,000 to $24,999 | 33 (1.1%) | 45 (5.5%) |
| $25,000 to $34,999 | 182 (6.3%) | 39 (4.8%) |
| $35,000 to $49,999 | 201 (7.0%) | 255 (31.2%) |
| $50,000 to $74,999 | 456 (15.9%) | 128 (15.7%) |
| $75,000 to $99,999 | 278 (9.7%) | 75 (9.2%) |
| $100,000 to $149,999 | 445 (15.5%) | 116 (14.2%) |
| $150,000 or more | 1,117 (38.9%) | 64 (7.8%) |
| Total | 2,870 (100.0%) | 818 (100.0%) |
Monthly Housing Cost Tiers in Treasure Island
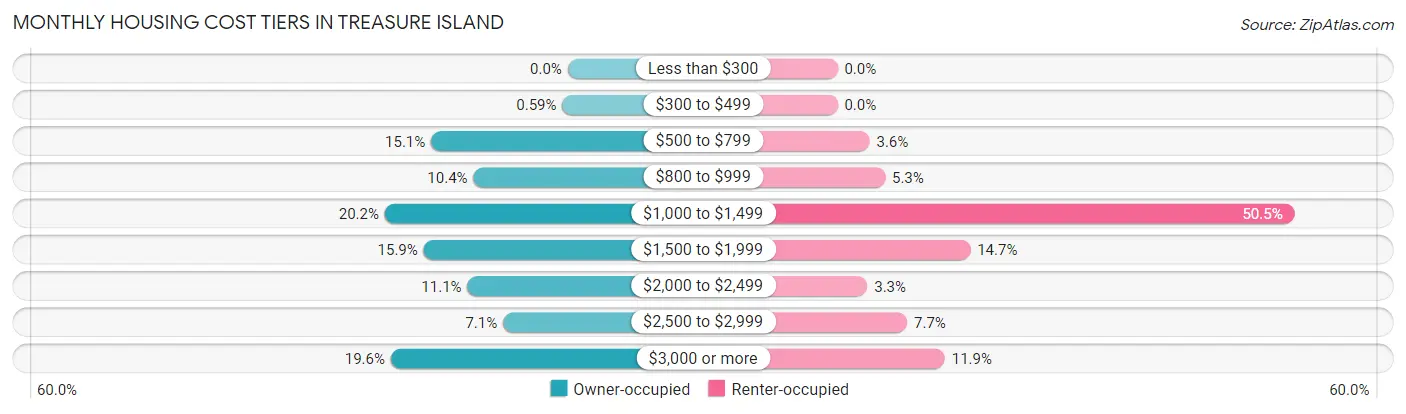
| Monthly Cost | Owner-occupied | Renter-occupied |
| Less than $300 | 0 (0.0%) | 0 (0.0%) |
| $300 to $499 | 17 (0.6%) | 0 (0.0%) |
| $500 to $799 | 433 (15.1%) | 29 (3.5%) |
| $800 to $999 | 299 (10.4%) | 43 (5.3%) |
| $1,000 to $1,499 | 580 (20.2%) | 413 (50.5%) |
| $1,500 to $1,999 | 457 (15.9%) | 120 (14.7%) |
| $2,000 to $2,499 | 318 (11.1%) | 27 (3.3%) |
| $2,500 to $2,999 | 205 (7.1%) | 63 (7.7%) |
| $3,000 or more | 561 (19.6%) | 97 (11.9%) |
| Total | 2,870 (100.0%) | 818 (100.0%) |
Physical Housing Characteristics in Treasure Island
Housing Structures in Treasure Island
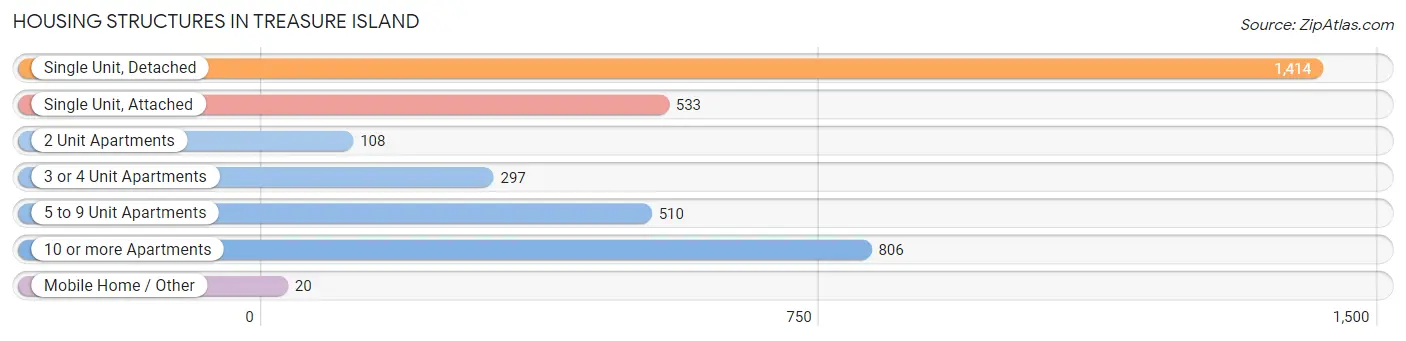
| Structure Type | # Housing Units | % Housing Units |
| Single Unit, Detached | 1,414 | 38.3% |
| Single Unit, Attached | 533 | 14.4% |
| 2 Unit Apartments | 108 | 2.9% |
| 3 or 4 Unit Apartments | 297 | 8.1% |
| 5 to 9 Unit Apartments | 510 | 13.8% |
| 10 or more Apartments | 806 | 21.8% |
| Mobile Home / Other | 20 | 0.5% |
| Total | 3,688 | 100.0% |
Housing Structures by Occupancy in Treasure Island
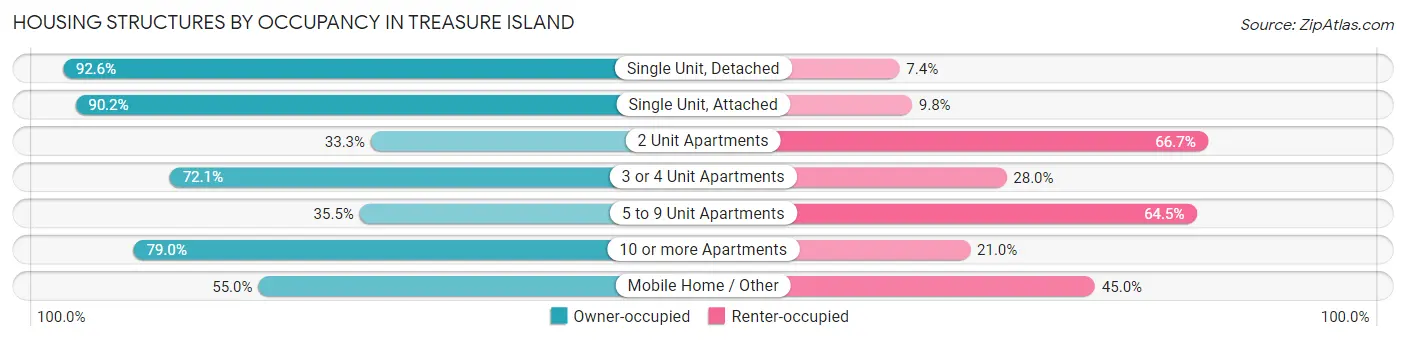
| Structure Type | Owner-occupied | Renter-occupied |
| Single Unit, Detached | 1,310 (92.6%) | 104 (7.4%) |
| Single Unit, Attached | 481 (90.2%) | 52 (9.8%) |
| 2 Unit Apartments | 36 (33.3%) | 72 (66.7%) |
| 3 or 4 Unit Apartments | 214 (72.1%) | 83 (28.0%) |
| 5 to 9 Unit Apartments | 181 (35.5%) | 329 (64.5%) |
| 10 or more Apartments | 637 (79.0%) | 169 (21.0%) |
| Mobile Home / Other | 11 (55.0%) | 9 (45.0%) |
| Total | 2,870 (77.8%) | 818 (22.2%) |
Housing Structures by Number of Rooms in Treasure Island
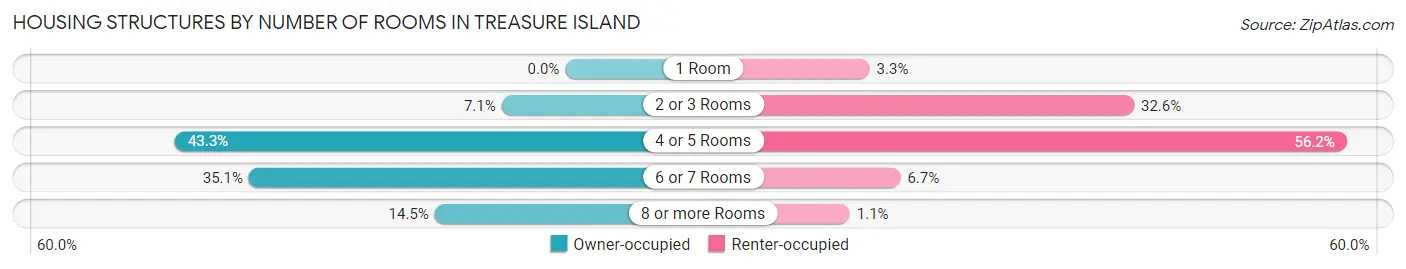
| Number of Rooms | Owner-occupied | Renter-occupied |
| 1 Room | 0 (0.0%) | 27 (3.3%) |
| 2 or 3 Rooms | 203 (7.1%) | 267 (32.6%) |
| 4 or 5 Rooms | 1,243 (43.3%) | 460 (56.2%) |
| 6 or 7 Rooms | 1,008 (35.1%) | 55 (6.7%) |
| 8 or more Rooms | 416 (14.5%) | 9 (1.1%) |
| Total | 2,870 (100.0%) | 818 (100.0%) |
Housing Structure by Heating Type in Treasure Island
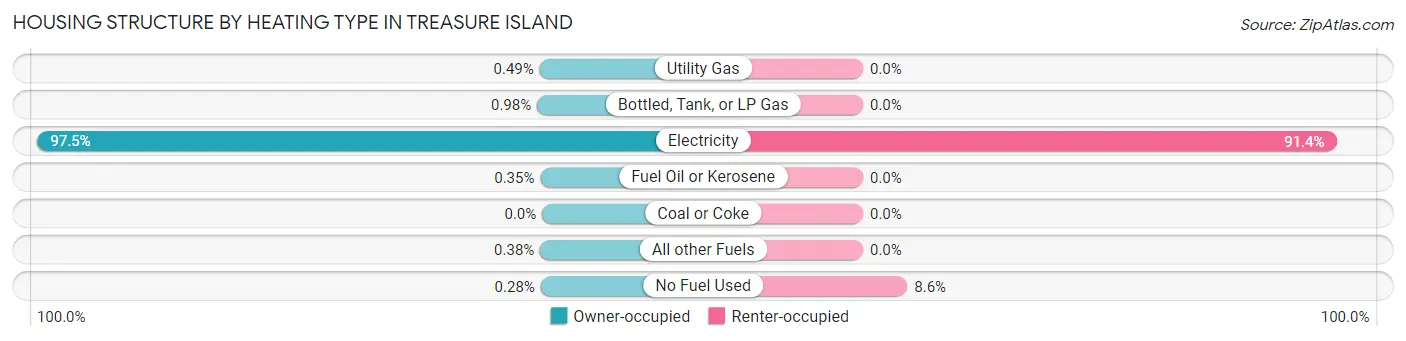
| Heating Type | Owner-occupied | Renter-occupied |
| Utility Gas | 14 (0.5%) | 0 (0.0%) |
| Bottled, Tank, or LP Gas | 28 (1.0%) | 0 (0.0%) |
| Electricity | 2,799 (97.5%) | 748 (91.4%) |
| Fuel Oil or Kerosene | 10 (0.4%) | 0 (0.0%) |
| Coal or Coke | 0 (0.0%) | 0 (0.0%) |
| All other Fuels | 11 (0.4%) | 0 (0.0%) |
| No Fuel Used | 8 (0.3%) | 70 (8.6%) |
| Total | 2,870 (100.0%) | 818 (100.0%) |
Household Vehicle Usage in Treasure Island
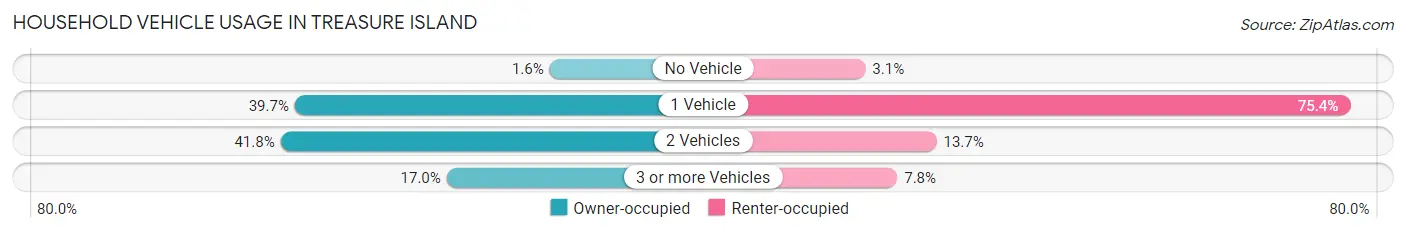
| Vehicles per Household | Owner-occupied | Renter-occupied |
| No Vehicle | 46 (1.6%) | 25 (3.1%) |
| 1 Vehicle | 1,138 (39.7%) | 617 (75.4%) |
| 2 Vehicles | 1,199 (41.8%) | 112 (13.7%) |
| 3 or more Vehicles | 487 (17.0%) | 64 (7.8%) |
| Total | 2,870 (100.0%) | 818 (100.0%) |
Real Estate & Mortgages in Treasure Island
Real Estate and Mortgage Overview in Treasure Island
| Characteristic | Without Mortgage | With Mortgage |
| Housing Units | 1,591 | 1,279 |
| Median Property Value | $498,000 | $494,800 |
| Median Household Income | $90,179 | $641 |
| Monthly Housing Costs | $1,045 | $561 |
| Real Estate Taxes | $4,408 | $59 |
Property Value by Mortgage Status in Treasure Island
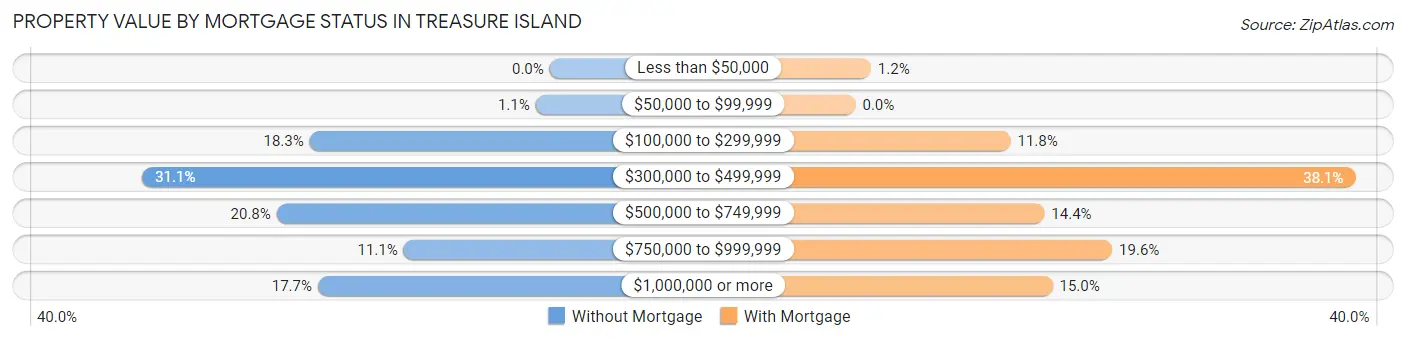
| Property Value | Without Mortgage | With Mortgage |
| Less than $50,000 | 0 (0.0%) | 15 (1.2%) |
| $50,000 to $99,999 | 17 (1.1%) | 0 (0.0%) |
| $100,000 to $299,999 | 291 (18.3%) | 151 (11.8%) |
| $300,000 to $499,999 | 494 (31.0%) | 487 (38.1%) |
| $500,000 to $749,999 | 331 (20.8%) | 184 (14.4%) |
| $750,000 to $999,999 | 177 (11.1%) | 250 (19.6%) |
| $1,000,000 or more | 281 (17.7%) | 192 (15.0%) |
| Total | 1,591 (100.0%) | 1,279 (100.0%) |
Household Income by Mortgage Status in Treasure Island
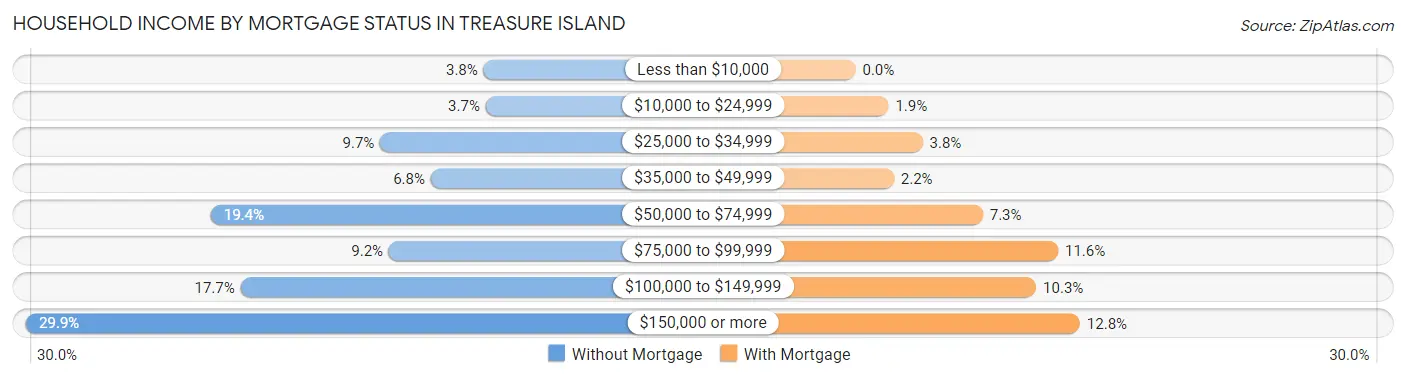
| Household Income | Without Mortgage | With Mortgage |
| Less than $10,000 | 60 (3.8%) | 0 (0.0%) |
| $10,000 to $24,999 | 58 (3.6%) | 24 (1.9%) |
| $25,000 to $34,999 | 154 (9.7%) | 49 (3.8%) |
| $35,000 to $49,999 | 108 (6.8%) | 28 (2.2%) |
| $50,000 to $74,999 | 308 (19.4%) | 93 (7.3%) |
| $75,000 to $99,999 | 146 (9.2%) | 148 (11.6%) |
| $100,000 to $149,999 | 281 (17.7%) | 132 (10.3%) |
| $150,000 or more | 476 (29.9%) | 164 (12.8%) |
| Total | 1,591 (100.0%) | 1,279 (100.0%) |
Property Value to Household Income Ratio in Treasure Island
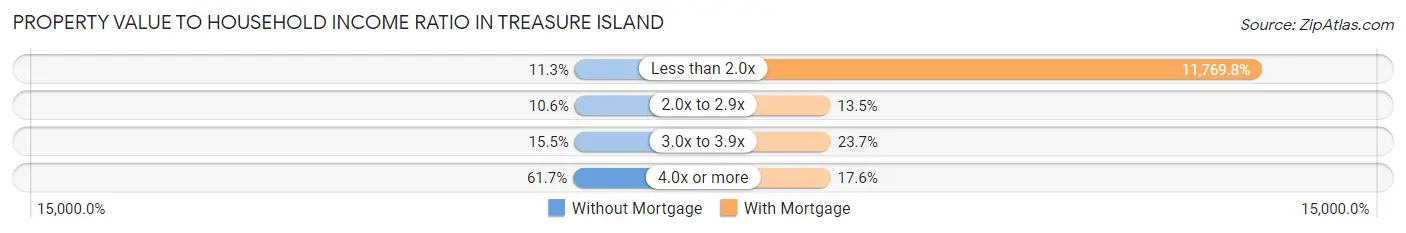
| Value-to-Income Ratio | Without Mortgage | With Mortgage |
| Less than 2.0x | 180 (11.3%) | 150,536 (11,769.8%) |
| 2.0x to 2.9x | 168 (10.6%) | 172 (13.5%) |
| 3.0x to 3.9x | 247 (15.5%) | 303 (23.7%) |
| 4.0x or more | 981 (61.7%) | 225 (17.6%) |
| Total | 1,591 (100.0%) | 1,279 (100.0%) |
Real Estate Taxes by Mortgage Status in Treasure Island
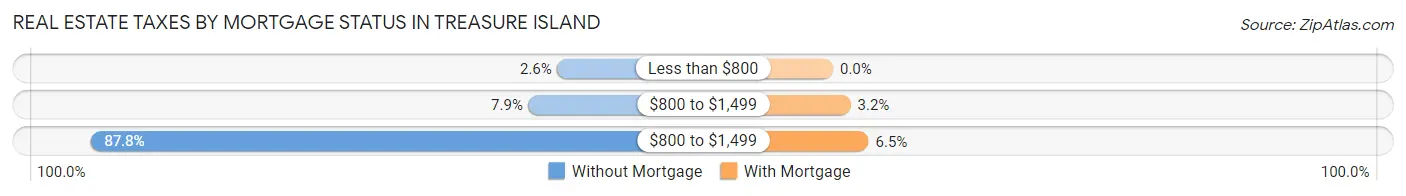
| Property Taxes | Without Mortgage | With Mortgage |
| Less than $800 | 42 (2.6%) | 0 (0.0%) |
| $800 to $1,499 | 126 (7.9%) | 41 (3.2%) |
| $800 to $1,499 | 1,397 (87.8%) | 83 (6.5%) |
| Total | 1,591 (100.0%) | 1,279 (100.0%) |
Health & Disability in Treasure Island
Health Insurance Coverage by Age in Treasure Island
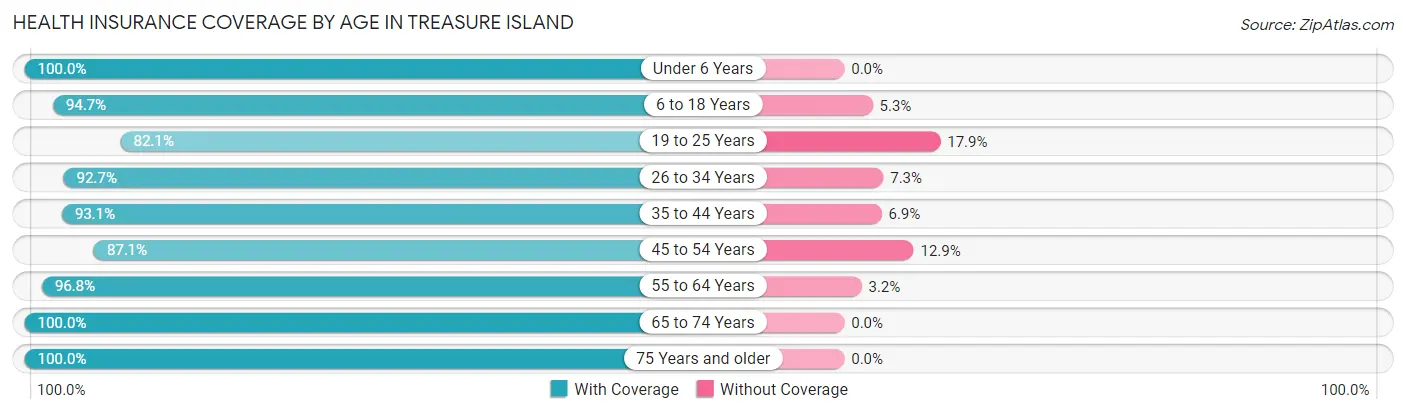
| Age Bracket | With Coverage | Without Coverage |
| Under 6 Years | 39 (100.0%) | 0 (0.0%) |
| 6 to 18 Years | 233 (94.7%) | 13 (5.3%) |
| 19 to 25 Years | 133 (82.1%) | 29 (17.9%) |
| 26 to 34 Years | 472 (92.7%) | 37 (7.3%) |
| 35 to 44 Years | 268 (93.1%) | 20 (6.9%) |
| 45 to 54 Years | 775 (87.1%) | 115 (12.9%) |
| 55 to 64 Years | 1,479 (96.8%) | 49 (3.2%) |
| 65 to 74 Years | 1,889 (100.0%) | 0 (0.0%) |
| 75 Years and older | 1,029 (100.0%) | 0 (0.0%) |
| Total | 6,317 (96.0%) | 263 (4.0%) |
Health Insurance Coverage by Citizenship Status in Treasure Island
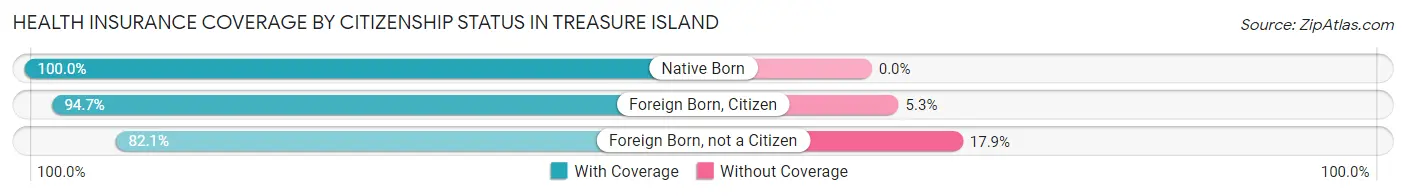
| Citizenship Status | With Coverage | Without Coverage |
| Native Born | 39 (100.0%) | 0 (0.0%) |
| Foreign Born, Citizen | 233 (94.7%) | 13 (5.3%) |
| Foreign Born, not a Citizen | 133 (82.1%) | 29 (17.9%) |
Health Insurance Coverage by Household Income in Treasure Island
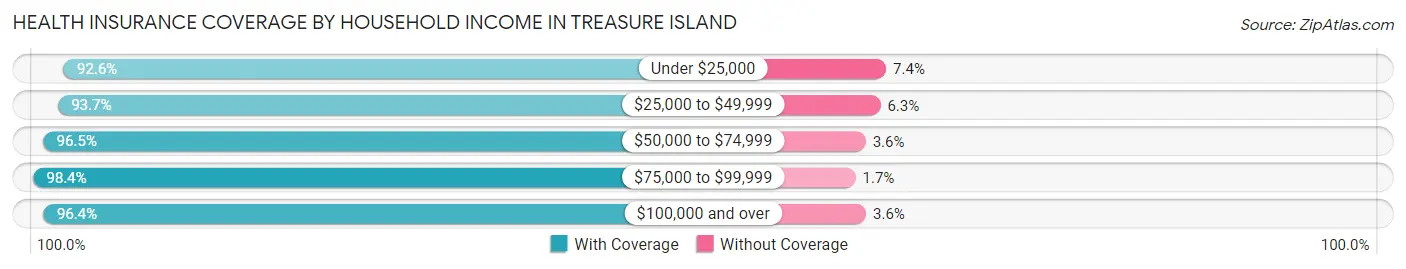
| Household Income | With Coverage | Without Coverage |
| Under $25,000 | 377 (92.6%) | 30 (7.4%) |
| $25,000 to $49,999 | 817 (93.7%) | 55 (6.3%) |
| $50,000 to $74,999 | 787 (96.5%) | 29 (3.5%) |
| $75,000 to $99,999 | 655 (98.4%) | 11 (1.7%) |
| $100,000 and over | 3,681 (96.4%) | 138 (3.6%) |
Public vs Private Health Insurance Coverage by Age in Treasure Island
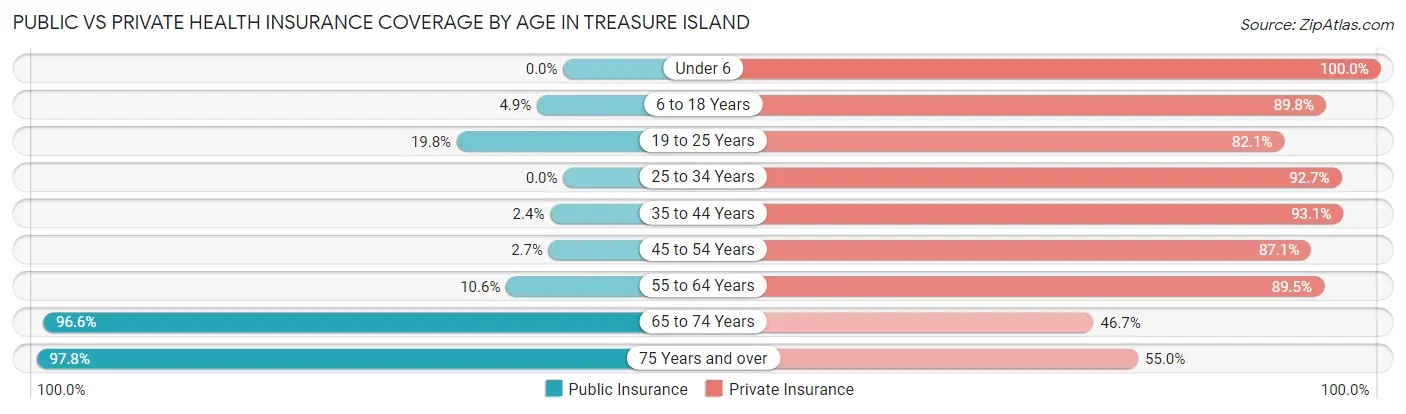
| Age Bracket | Public Insurance | Private Insurance |
| Under 6 | 0 (0.0%) | 39 (100.0%) |
| 6 to 18 Years | 12 (4.9%) | 221 (89.8%) |
| 19 to 25 Years | 32 (19.8%) | 133 (82.1%) |
| 25 to 34 Years | 0 (0.0%) | 472 (92.7%) |
| 35 to 44 Years | 7 (2.4%) | 268 (93.1%) |
| 45 to 54 Years | 24 (2.7%) | 775 (87.1%) |
| 55 to 64 Years | 162 (10.6%) | 1,367 (89.5%) |
| 65 to 74 Years | 1,824 (96.6%) | 883 (46.7%) |
| 75 Years and over | 1,006 (97.8%) | 566 (55.0%) |
| Total | 3,067 (46.6%) | 4,724 (71.8%) |
Disability Status by Sex by Age in Treasure Island
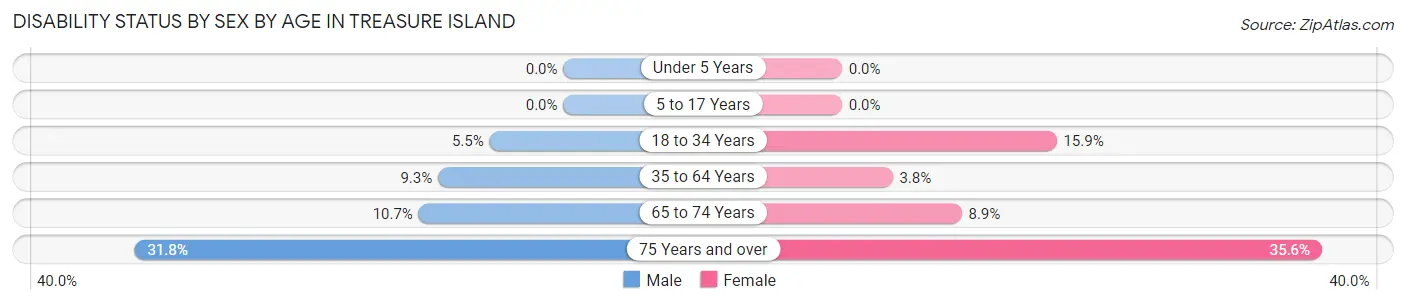
| Age Bracket | Male | Female |
| Under 5 Years | 0 (0.0%) | 0 (0.0%) |
| 5 to 17 Years | 0 (0.0%) | 0 (0.0%) |
| 18 to 34 Years | 25 (5.5%) | 40 (15.9%) |
| 35 to 64 Years | 123 (9.3%) | 52 (3.8%) |
| 65 to 74 Years | 70 (10.7%) | 110 (8.9%) |
| 75 Years and over | 199 (31.8%) | 144 (35.6%) |
Disability Class by Sex by Age in Treasure Island
Disability Class: Hearing Difficulty
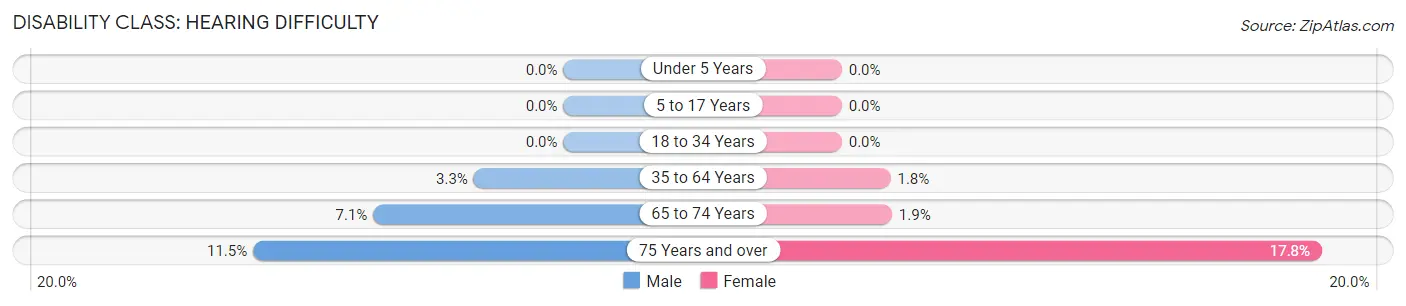
| Age Bracket | Male | Female |
| Under 5 Years | 0 (0.0%) | 0 (0.0%) |
| 5 to 17 Years | 0 (0.0%) | 0 (0.0%) |
| 18 to 34 Years | 0 (0.0%) | 0 (0.0%) |
| 35 to 64 Years | 44 (3.3%) | 25 (1.8%) |
| 65 to 74 Years | 46 (7.1%) | 23 (1.9%) |
| 75 Years and over | 72 (11.5%) | 72 (17.8%) |
Disability Class: Vision Difficulty
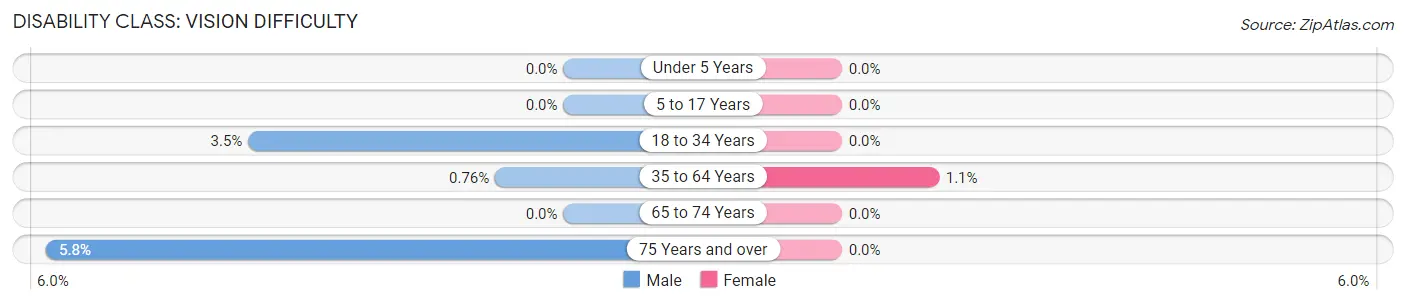
| Age Bracket | Male | Female |
| Under 5 Years | 0 (0.0%) | 0 (0.0%) |
| 5 to 17 Years | 0 (0.0%) | 0 (0.0%) |
| 18 to 34 Years | 16 (3.5%) | 0 (0.0%) |
| 35 to 64 Years | 10 (0.8%) | 15 (1.1%) |
| 65 to 74 Years | 0 (0.0%) | 0 (0.0%) |
| 75 Years and over | 36 (5.8%) | 0 (0.0%) |
Disability Class: Cognitive Difficulty
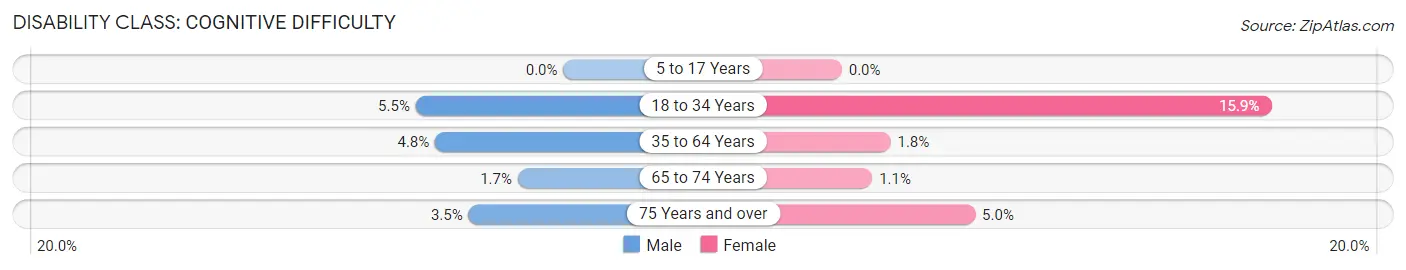
| Age Bracket | Male | Female |
| 5 to 17 Years | 0 (0.0%) | 0 (0.0%) |
| 18 to 34 Years | 25 (5.5%) | 40 (15.9%) |
| 35 to 64 Years | 63 (4.8%) | 25 (1.8%) |
| 65 to 74 Years | 11 (1.7%) | 14 (1.1%) |
| 75 Years and over | 22 (3.5%) | 20 (5.0%) |
Disability Class: Ambulatory Difficulty
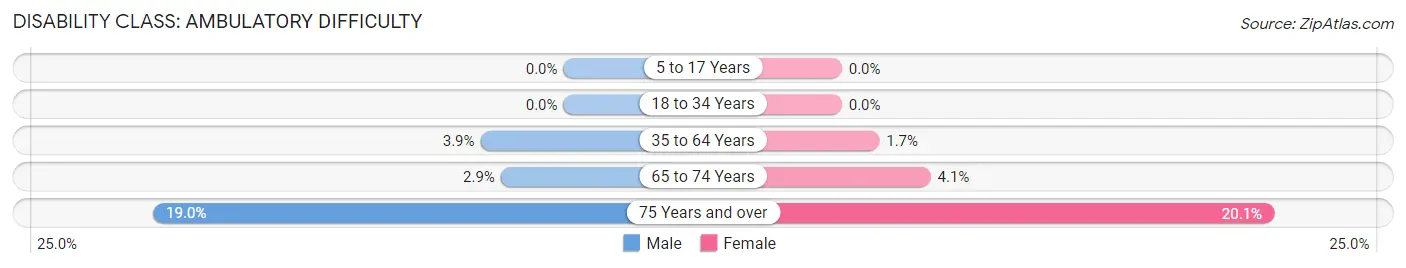
| Age Bracket | Male | Female |
| 5 to 17 Years | 0 (0.0%) | 0 (0.0%) |
| 18 to 34 Years | 0 (0.0%) | 0 (0.0%) |
| 35 to 64 Years | 51 (3.8%) | 24 (1.7%) |
| 65 to 74 Years | 19 (2.9%) | 51 (4.1%) |
| 75 Years and over | 119 (19.0%) | 81 (20.1%) |
Disability Class: Self-Care Difficulty
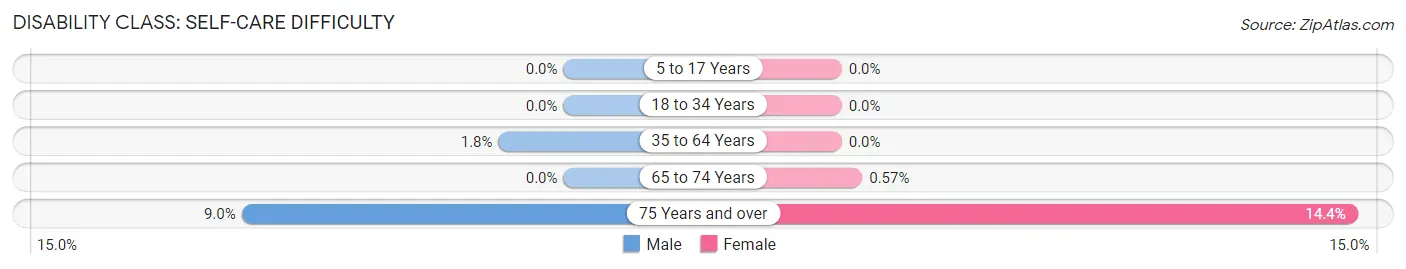
| Age Bracket | Male | Female |
| 5 to 17 Years | 0 (0.0%) | 0 (0.0%) |
| 18 to 34 Years | 0 (0.0%) | 0 (0.0%) |
| 35 to 64 Years | 24 (1.8%) | 0 (0.0%) |
| 65 to 74 Years | 0 (0.0%) | 7 (0.6%) |
| 75 Years and over | 56 (9.0%) | 58 (14.4%) |
Technology Access in Treasure Island
Computing Device Access in Treasure Island
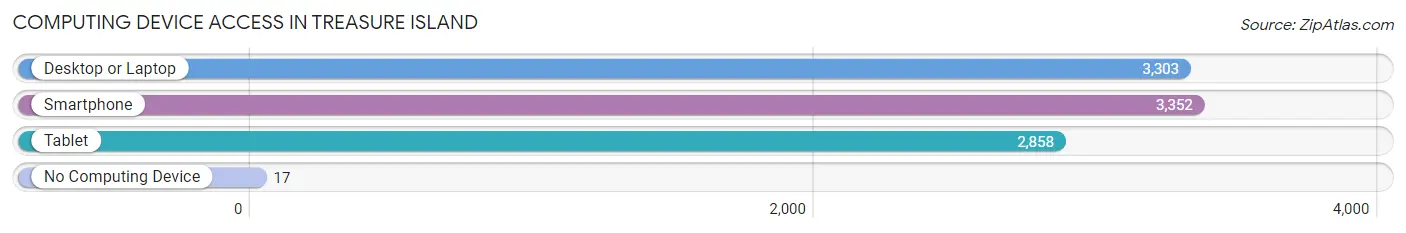
| Device Type | # Households | % Households |
| Desktop or Laptop | 3,303 | 89.6% |
| Smartphone | 3,352 | 90.9% |
| Tablet | 2,858 | 77.5% |
| No Computing Device | 17 | 0.5% |
| Total | 3,688 | 100.0% |
Internet Access in Treasure Island
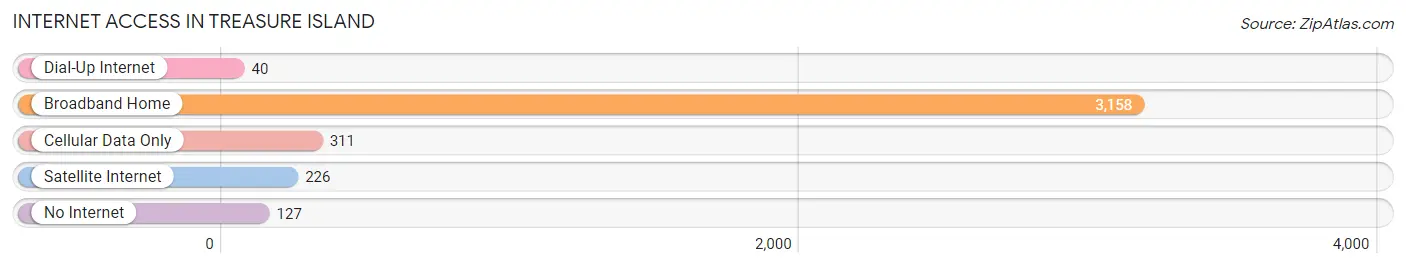
| Internet Type | # Households | % Households |
| Dial-Up Internet | 40 | 1.1% |
| Broadband Home | 3,158 | 85.6% |
| Cellular Data Only | 311 | 8.4% |
| Satellite Internet | 226 | 6.1% |
| No Internet | 127 | 3.4% |
| Total | 3,688 | 100.0% |
Treasure Island Summary
Treasure Island is a city located in Pinellas County, Florida, United States. It is situated on a barrier island between the Gulf of Mexico and Boca Ciega Bay. The city is known for its white sand beaches and its laid-back atmosphere. As of the 2010 census, the population of Treasure Island was 6,705.
Geography
Treasure Island is located at 27°45'25" North, 82°47'30" West (27.756944, -82.791667). It is situated on a barrier island between the Gulf of Mexico and Boca Ciega Bay. The city is bordered by Madeira Beach to the east and St. Pete Beach to the south. The city covers an area of 2.2 square miles, of which 0.9 square miles is land and 1.3 square miles is water.
History
Treasure Island was first settled in the late 19th century by a group of fishermen who built a small fishing village on the island. The island was named after a local legend of buried treasure. In the early 20th century, the island was developed as a resort destination. The first hotel was built in 1915 and the island was incorporated as a city in 1950.
Economy
Treasure Island’s economy is largely based on tourism. The city is home to several hotels, restaurants, and other tourist attractions. The city also has a thriving real estate market, with many beachfront properties available for purchase.
Demographics
As of the 2010 census, the population of Treasure Island was 6,705. The racial makeup of the city was 94.2% White, 2.2% African American, 0.4% Native American, 1.2% Asian, 0.1% Pacific Islander, 0.9% from other races, and 0.9% from two or more races. Hispanic or Latino of any race were 4.2% of the population.
The median income for a household in the city was $50,945, and the median income for a family was $60,945. The per capita income for the city was $30,945. About 5.2% of families and 7.2% of the population were below the poverty line, including 8.2% of those under age 18 and 4.2% of those age 65 or over.
Conclusion
Treasure Island is a city located in Pinellas County, Florida, United States. It is situated on a barrier island between the Gulf of Mexico and Boca Ciega Bay. The city is known for its white sand beaches and its laid-back atmosphere. The economy of Treasure Island is largely based on tourism, with many hotels, restaurants, and other tourist attractions. As of the 2010 census, the population of Treasure Island was 6,705, with a median household income of $50,945.
Common Questions
What is the Total Population of Treasure Island?
Total Population of Treasure Island is 6,590.
What is the Total Male Population of Treasure Island?
Total Male Population of Treasure Island is 3,203.
What is the Total Female Population of Treasure Island?
Total Female Population of Treasure Island is 3,387.
What is the Ratio of Males per 100 Females in Treasure Island?
There are 94.57 Males per 100 Females in Treasure Island.
What is the Ratio of Females per 100 Males in Treasure Island?
There are 105.74 Females per 100 Males in Treasure Island.
What is the Median Population Age in Treasure Island?
Median Population Age in Treasure Island is 63.0 Years.
What is the Average Family Size in Treasure Island
Average Family Size in Treasure Island is 2.3 People.
What is the Average Household Size in Treasure Island
Average Household Size in Treasure Island is 1.8 People.
What is Per Capita Income in Treasure Island?
Per Capita income in Treasure Island is $79,685.
What is the Median Family Income in Treasure Island?
Median Family Income in Treasure Island is $145,536.
What is the Median Household income in Treasure Island?
Median Household Income in Treasure Island is $87,941.
What is Income or Wage Gap in Treasure Island?
Income or Wage Gap in Treasure Island is 33.9%.
Women in Treasure Island earn 66.1 cents for every dollar earned by a man.
What is Family Income Deficit in Treasure Island?
Family Income Deficit in Treasure Island is $9,306.
Families that are below poverty line in Treasure Island earn $9,306 less on average than the poverty threshold level.
What is Inequality or Gini Index in Treasure Island?
Inequality or Gini Index in Treasure Island is 0.49.
How Large is the Labor Force in Treasure Island?
There are 3,069 People in the Labor Forcein in Treasure Island.
What is the Percentage of People in the Labor Force in Treasure Island?
48.0% of People are in the Labor Force in Treasure Island.
What is the Unemployment Rate in Treasure Island?
Unemployment Rate in Treasure Island is 5.5%.