Scotch-Irish vs Haitian Family Households with Children
COMPARE
Scotch-Irish
Haitian
Family Households with Children
Family Households with Children Comparison
Scotch-Irish
Haitians
26.8%
FAMILY HOUSEHOLDS WITH CHILDREN
1.4/ 100
METRIC RATING
256th/ 347
METRIC RANK
27.2%
FAMILY HOUSEHOLDS WITH CHILDREN
19.8/ 100
METRIC RATING
207th/ 347
METRIC RANK
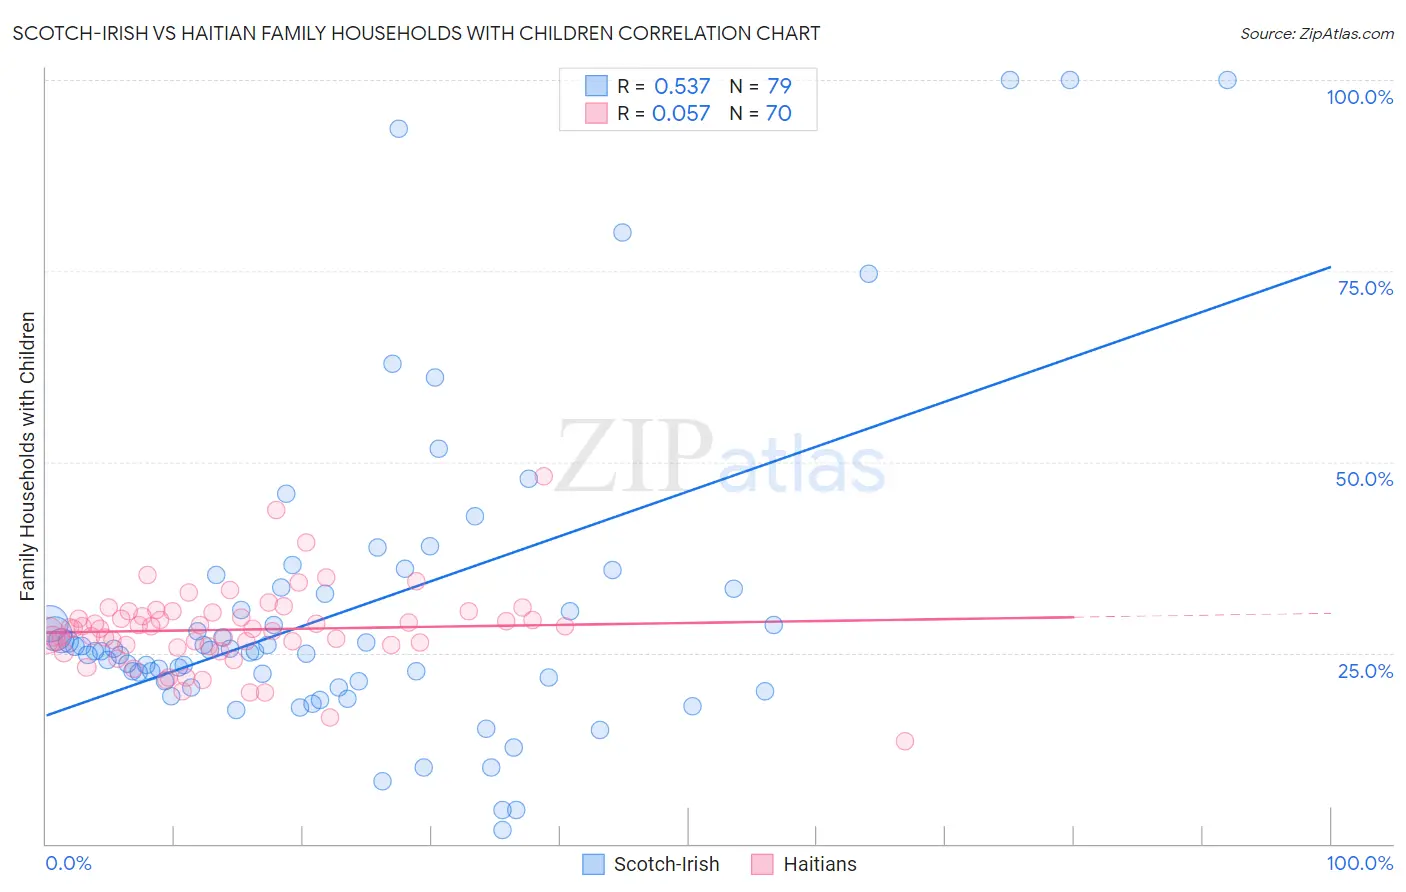
Scotch-Irish vs Haitian Family Households with Children Correlation Chart
The statistical analysis conducted on geographies consisting of 548,065,437 people shows a substantial positive correlation between the proportion of Scotch-Irish and percentage of family households with children in the United States with a correlation coefficient (R) of 0.537 and weighted average of 26.8%. Similarly, the statistical analysis conducted on geographies consisting of 287,598,157 people shows a slight positive correlation between the proportion of Haitians and percentage of family households with children in the United States with a correlation coefficient (R) of 0.057 and weighted average of 27.2%, a difference of 1.6%.
Family Households with Children Correlation Summary
| Measurement | Scotch-Irish | Haitian |
| Minimum | 1.9% | 13.4% |
| Maximum | 100.0% | 48.2% |
| Range | 98.1% | 34.8% |
| Mean | 30.8% | 28.0% |
| Median | 25.3% | 28.2% |
| Interquartile 25% (IQ1) | 21.2% | 26.0% |
| Interquartile 75% (IQ3) | 33.3% | 30.2% |
| Interquartile Range (IQR) | 12.1% | 4.2% |
| Standard Deviation (Sample) | 20.6% | 5.3% |
| Standard Deviation (Population) | 20.5% | 5.3% |
Similar Demographics by Family Households with Children
Demographics Similar to Scotch-Irish by Family Households with Children
In terms of family households with children, the demographic groups most similar to Scotch-Irish are German Russian (26.8%, a difference of 0.010%), Immigrants from Scotland (26.8%, a difference of 0.020%), Italian (26.8%, a difference of 0.050%), Slavic (26.8%, a difference of 0.050%), and Immigrants from Cuba (26.8%, a difference of 0.050%).
| Demographics | Rating | Rank | Family Households with Children |
| Immigrants | Eastern Europe | 2.1 /100 | #249 | Tragic 26.9% |
| Belgians | 2.1 /100 | #250 | Tragic 26.9% |
| Immigrants | Bosnia and Herzegovina | 1.9 /100 | #251 | Tragic 26.8% |
| Irish | 1.8 /100 | #252 | Tragic 26.8% |
| Italians | 1.5 /100 | #253 | Tragic 26.8% |
| Immigrants | Scotland | 1.5 /100 | #254 | Tragic 26.8% |
| German Russians | 1.5 /100 | #255 | Tragic 26.8% |
| Scotch-Irish | 1.4 /100 | #256 | Tragic 26.8% |
| Slavs | 1.3 /100 | #257 | Tragic 26.8% |
| Immigrants | Cuba | 1.3 /100 | #258 | Tragic 26.8% |
| Immigrants | Lithuania | 1.2 /100 | #259 | Tragic 26.8% |
| Immigrants | Jamaica | 1.2 /100 | #260 | Tragic 26.8% |
| Immigrants | Belarus | 1.1 /100 | #261 | Tragic 26.8% |
| Immigrants | Russia | 1.0 /100 | #262 | Tragic 26.8% |
| Immigrants | North Macedonia | 1.0 /100 | #263 | Tragic 26.7% |
Demographics Similar to Haitians by Family Households with Children
In terms of family households with children, the demographic groups most similar to Haitians are Immigrants from Micronesia (27.2%, a difference of 0.010%), Immigrants from Haiti (27.2%, a difference of 0.020%), Immigrants from Sudan (27.3%, a difference of 0.060%), Kiowa (27.3%, a difference of 0.080%), and American (27.3%, a difference of 0.10%).
| Demographics | Rating | Rank | Family Households with Children |
| Immigrants | Congo | 28.7 /100 | #200 | Fair 27.3% |
| Bhutanese | 25.1 /100 | #201 | Fair 27.3% |
| Americans | 22.8 /100 | #202 | Fair 27.3% |
| Kiowa | 22.2 /100 | #203 | Fair 27.3% |
| Immigrants | Sudan | 21.6 /100 | #204 | Fair 27.3% |
| Immigrants | Haiti | 20.3 /100 | #205 | Fair 27.2% |
| Immigrants | Micronesia | 20.2 /100 | #206 | Fair 27.2% |
| Haitians | 19.8 /100 | #207 | Poor 27.2% |
| Immigrants | Poland | 16.4 /100 | #208 | Poor 27.2% |
| Dutch West Indians | 15.8 /100 | #209 | Poor 27.2% |
| Immigrants | Ukraine | 14.4 /100 | #210 | Poor 27.2% |
| Welsh | 14.2 /100 | #211 | Poor 27.2% |
| Immigrants | Dominica | 13.9 /100 | #212 | Poor 27.2% |
| Okinawans | 13.7 /100 | #213 | Poor 27.2% |
| Africans | 13.0 /100 | #214 | Poor 27.2% |