French vs Luxembourger Male Disability

COMPARE

French
Race
Ancestry
AfghanAfricanAlaska NativeAlaskan AthabascanAlbanianAleutAlsatianAmericanApacheArabArapahoArgentineanArmenianAssyrian/Chaldean/SyriacAustralianAustrianBahamianBangladeshiBarbadianBasqueBelgianBelizeanBermudanBhutaneseBlackfeetBolivianBrazilianBritishBritish West IndianBulgarianBurmeseCajunCambodianCanadianCape VerdeanCarpatho RusynCelticCentral AmericanCentral American IndianCherokeeCheyenneChickasawChileanChineseChippewaChoctawColombianColvilleComancheCosta RicanCreeCreekCroatianCrowCubanCypriotCzechCzechoslovakianDanishDelawareDominicanDutchDutch West IndianEastern EuropeanEcuadorianEgyptianEnglishEstonianEthiopianEuropeanFijianFilipinoFinnishFrenchFrench American IndianFrench CanadianGermanGerman RussianGhanaianGreekGuamanian/ChamorroGuatemalanGuyaneseHaitianHmongHonduranHopiHoumaHungarianIcelanderIndian (Asian)IndonesianInupiatIranianIraqiIrishIroquoisIsraeliItalianJamaicanJapaneseJordanianKenyanKiowaKoreanLaotianLatvianLebaneseLiberianLithuanianLumbeeMacedonianMalaysianMalteseMarshalleseMenomineeMexicanMexican American IndianMongolianMoroccanNative HawaiianNavajoNepaleseNew ZealanderNicaraguanNigerianNorthern EuropeanNorwegianOkinawanOsageOttawaPaiutePakistaniPalestinianPanamanianParaguayanPennsylvania GermanPeruvianPimaPolishPortuguesePotawatomiPuebloPuerto RicanPuget Sound SalishRomanianRussianSalvadoranSamoanScandinavianScotch-IrishScottishSeminoleSenegaleseSerbianShoshoneSierra LeoneanSiouxSlavicSlovakSloveneSomaliSouth AfricanSouth AmericanSouth American IndianSoviet UnionSpaniardSpanishSpanish AmericanSpanish American IndianSri LankanSubsaharan AfricanSudaneseSwedishSwissSyrianTaiwaneseThaiTlingit-HaidaTohono O'OdhamTonganTrinidadian and TobagonianTsimshianTurkishU.S. Virgin IslanderUgandanUkrainianUruguayanUteVenezuelanVietnameseWelshWest IndianYakamaYaquiYugoslavianYumanYup'ikZimbabwean
Immigration
NonimmigrantsImmigrantsAfghanistanAfricaAlbaniaArgentinaArmeniaAsiaAustraliaAustriaBahamasBangladeshBarbadosBelarusBelgiumBelizeBoliviaBosnia and HerzegovinaBrazilBulgariaBurma/MyanmarCabo VerdeCambodiaCameroonCanadaCaribbeanCentral AmericaChileChinaColombiaCongoCosta RicaCroatiaCubaCzechoslovakiaDenmarkDominicaDominican RepublicEastern AfricaEastern AsiaEastern EuropeEcuadorEgyptEl SalvadorEnglandEritreaEthiopiaEuropeFijiFranceGermanyGhanaGreeceGrenadaGuatemalaGuyanaHaitiHondurasHong KongHungaryIndiaIndonesiaIranIraqIrelandIsraelItalyJamaicaJapanJordanKazakhstanKenyaKoreaKuwaitLaosLatin AmericaLatviaLebanonLiberiaLithuaniaMalaysiaMexicoMicronesiaMiddle AfricaMoldovaMoroccoNepalNetherlandsNicaraguaNigeriaNorth AmericaNorth MacedoniaNorthern AfricaNorthern EuropeNorwayOceaniaPakistanPanamaPeruPhilippinesPolandPortugalRomaniaRussiaSaudi ArabiaScotlandSenegalSerbiaSierra LeoneSingaporeSomaliaSouth AfricaSouth AmericaSouth Central AsiaSouth Eastern AsiaSouthern EuropeSpainSri LankaSt. Vincent and the GrenadinesSudanSwedenSwitzerlandSyriaTaiwanThailandTrinidad and TobagoTurkeyUgandaUkraineUruguayUzbekistanVenezuelaVietnamWest IndiesWestern AfricaWestern AsiaWestern EuropeYemenZaireZimbabweAzores
Luxembourger
Race
Ancestry
AfghanAfricanAlaska NativeAlaskan AthabascanAlbanianAleutAlsatianAmericanApacheArabArapahoArgentineanArmenianAssyrian/Chaldean/SyriacAustralianAustrianBahamianBangladeshiBarbadianBasqueBelgianBelizeanBermudanBhutaneseBlackfeetBolivianBrazilianBritishBritish West IndianBulgarianBurmeseCajunCambodianCanadianCape VerdeanCarpatho RusynCelticCentral AmericanCentral American IndianCherokeeCheyenneChickasawChileanChineseChippewaChoctawColombianColvilleComancheCosta RicanCreeCreekCroatianCrowCubanCypriotCzechCzechoslovakianDanishDelawareDominicanDutchDutch West IndianEastern EuropeanEcuadorianEgyptianEnglishEstonianEthiopianEuropeanFijianFilipinoFinnishFrench American IndianFrench CanadianGermanGerman RussianGhanaianGreekGuamanian/ChamorroGuatemalanGuyaneseHaitianHmongHonduranHopiHoumaHungarianIcelanderIndian (Asian)IndonesianInupiatIranianIraqiIrishIroquoisIsraeliItalianJamaicanJapaneseJordanianKenyanKiowaKoreanLaotianLatvianLebaneseLiberianLithuanianLumbeeLuxembourgerMacedonianMalaysianMalteseMarshalleseMenomineeMexicanMexican American IndianMongolianMoroccanNative HawaiianNavajoNepaleseNew ZealanderNicaraguanNigerianNorthern EuropeanNorwegianOkinawanOsageOttawaPaiutePakistaniPalestinianPanamanianParaguayanPennsylvania GermanPeruvianPimaPolishPortuguesePotawatomiPuebloPuerto RicanPuget Sound SalishRomanianRussianSalvadoranSamoanScandinavianScotch-IrishScottishSeminoleSenegaleseSerbianShoshoneSierra LeoneanSiouxSlavicSlovakSloveneSomaliSouth AfricanSouth AmericanSouth American IndianSoviet UnionSpaniardSpanishSpanish AmericanSpanish American IndianSri LankanSubsaharan AfricanSudaneseSwedishSwissSyrianTaiwaneseThaiTlingit-HaidaTohono O'OdhamTonganTrinidadian and TobagonianTsimshianTurkishU.S. Virgin IslanderUgandanUkrainianUruguayanUteVenezuelanVietnameseWelshWest IndianYakamaYaquiYugoslavianYumanYup'ikZimbabwean
Immigration
NonimmigrantsImmigrantsAfghanistanAfricaAlbaniaArgentinaArmeniaAsiaAustraliaAustriaBahamasBangladeshBarbadosBelarusBelgiumBelizeBoliviaBosnia and HerzegovinaBrazilBulgariaBurma/MyanmarCabo VerdeCambodiaCameroonCanadaCaribbeanCentral AmericaChileChinaColombiaCongoCosta RicaCroatiaCubaCzechoslovakiaDenmarkDominicaDominican RepublicEastern AfricaEastern AsiaEastern EuropeEcuadorEgyptEl SalvadorEnglandEritreaEthiopiaEuropeFijiFranceGermanyGhanaGreeceGrenadaGuatemalaGuyanaHaitiHondurasHong KongHungaryIndiaIndonesiaIranIraqIrelandIsraelItalyJamaicaJapanJordanKazakhstanKenyaKoreaKuwaitLaosLatin AmericaLatviaLebanonLiberiaLithuaniaMalaysiaMexicoMicronesiaMiddle AfricaMoldovaMoroccoNepalNetherlandsNicaraguaNigeriaNorth AmericaNorth MacedoniaNorthern AfricaNorthern EuropeNorwayOceaniaPakistanPanamaPeruPhilippinesPolandPortugalRomaniaRussiaSaudi ArabiaScotlandSenegalSerbiaSierra LeoneSingaporeSomaliaSouth AfricaSouth AmericaSouth Central AsiaSouth Eastern AsiaSouthern EuropeSpainSri LankaSt. Vincent and the GrenadinesSudanSwedenSwitzerlandSyriaTaiwanThailandTrinidad and TobagoTurkeyUgandaUkraineUruguayUzbekistanVenezuelaVietnamWest IndiesWestern AfricaWestern AsiaWestern EuropeYemenZaireZimbabweAzores
Male Disability
Income
Poverty
Unemployment
Labor Participation
Family Structure
Vehicle Availability
Education Level
Disability

Male Disability Comparison

French

Luxembourgers

Tragic
Good
13.0%
MALE DISABILITY
0.0/ 100
METRIC RATING
301st/ 347
METRIC RANK
11.1%
MALE DISABILITY
61.9/ 100
METRIC RATING
165th/ 347
METRIC RANK

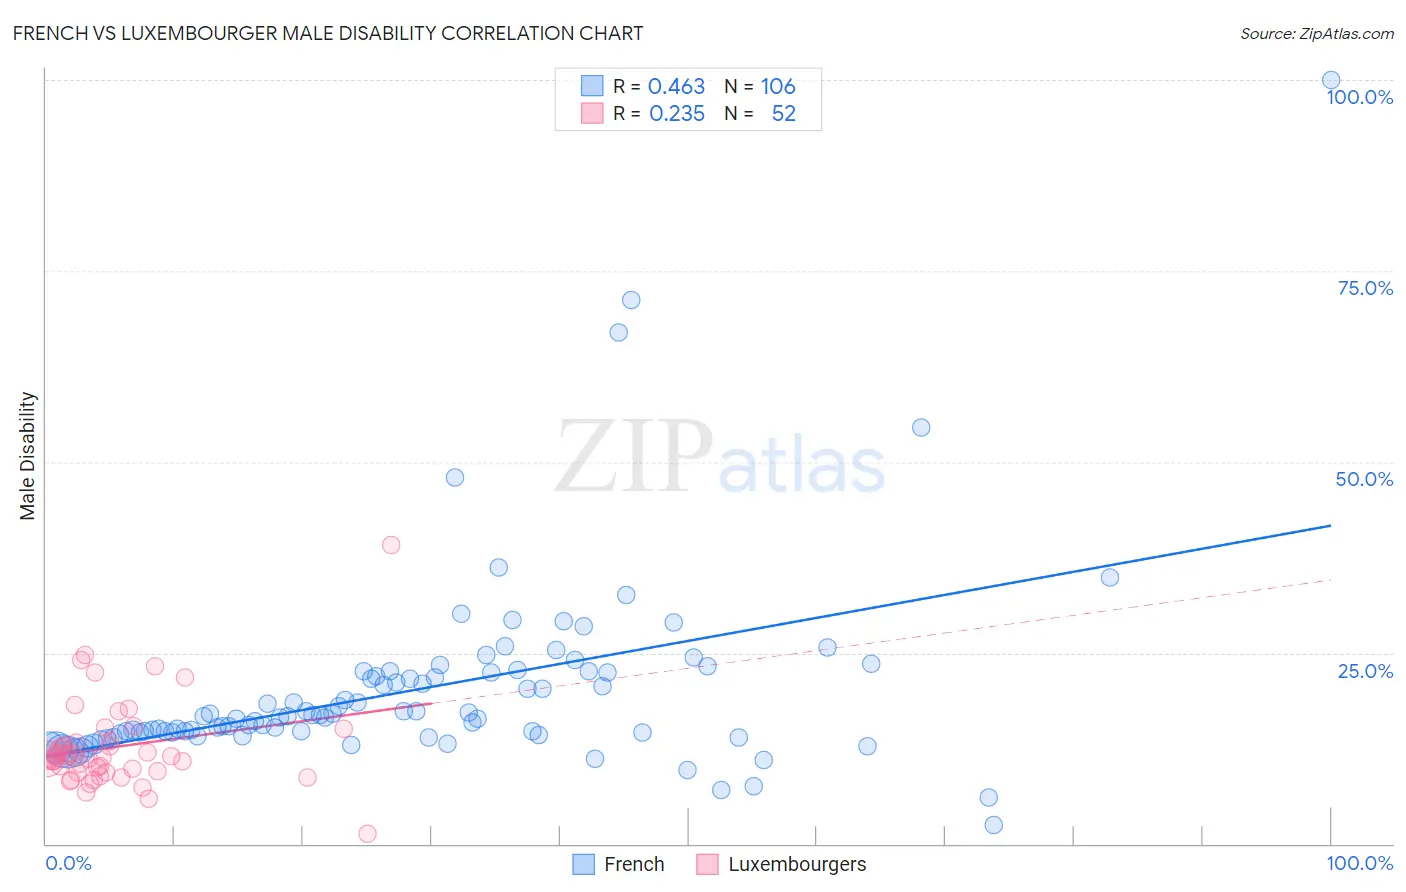
French vs Luxembourger Male Disability Correlation Chart

The statistical analysis conducted on geographies consisting of 572,141,225 people shows a moderate positive correlation between the proportion of French and percentage of males with a disability in the United States with a correlation coefficient (R) of 0.463 and weighted average of 13.0%. Similarly, the statistical analysis conducted on geographies consisting of 144,678,542 people shows a weak positive correlation between the proportion of Luxembourgers and percentage of males with a disability in the United States with a correlation coefficient (R) of 0.235 and weighted average of 11.1%, a difference of 17.1%.
French vs Luxembourger Male Disability

Male Disability Correlation Summary

MeasurementFrenchLuxembourger
Minimum2.5%1.4%
Maximum100.0%39.1%
Range97.5%37.8%
Mean20.1%12.7%
Median16.6%11.3%
Interquartile 25% (IQ1)14.3%9.4%
Interquartile 75% (IQ3)22.4%13.3%
Interquartile Range (IQR)8.1%3.9%
Standard Deviation (Sample)12.8%6.0%
Standard Deviation (Population)12.8%5.9%

Similar Demographics by Male Disability

Demographics Similar to French by Male Disability

In terms of male disability, the demographic groups most similar to French are Cheyenne (13.0%, a difference of 0.040%), Celtic (13.0%, a difference of 0.13%), Pennsylvania German (13.0%, a difference of 0.48%), Crow (13.1%, a difference of 0.58%), and Inupiat (13.0%, a difference of 0.69%).
DemographicsRating | RankMale Disability
Marshallese
0.0
/100
|
#294
Tragic
12.9%
Immigrants | Micronesia
0.0
/100
|
#295
Tragic
12.9%
Immigrants | Nonimmigrants
0.0
/100
|
#296
Tragic
12.9%
Inupiat
0.0
/100
|
#297
Tragic
13.0%
Pennsylvania Germans
0.0
/100
|
#298
Tragic
13.0%
Celtics
0.0
/100
|
#299
Tragic
13.0%
Cheyenne
0.0
/100
|
#300
Tragic
13.0%
French
0.0
/100
|
#301
Tragic
13.0%
Crow
0.0
/100
|
#302
Tragic
13.1%
Scotch-Irish
0.0
/100
|
#303
Tragic
13.2%
Blacks/African Americans
0.0
/100
|
#304
Tragic
13.2%
French Canadians
0.0
/100
|
#305
Tragic
13.3%
Spanish Americans
0.0
/100
|
#306
Tragic
13.3%
Arapaho
0.0
/100
|
#307
Tragic
13.3%
French American Indians
0.0
/100
|
#308
Tragic
13.4%

Demographics Similar to Luxembourgers by Male Disability

In terms of male disability, the demographic groups most similar to Luxembourgers are Immigrants from Hungary (11.1%, a difference of 0.040%), British West Indian (11.1%, a difference of 0.050%), Immigrants from Kenya (11.1%, a difference of 0.11%), Immigrants from Haiti (11.1%, a difference of 0.20%), and Immigrants from West Indies (11.1%, a difference of 0.23%).
DemographicsRating | RankMale Disability
Latvians
68.1
/100
|
#158
Good
11.1%
Guatemalans
67.2
/100
|
#159
Good
11.1%
Albanians
66.5
/100
|
#160
Good
11.1%
Immigrants | West Indies
65.7
/100
|
#161
Good
11.1%
Immigrants | Haiti
65.3
/100
|
#162
Good
11.1%
Immigrants | Kenya
63.8
/100
|
#163
Good
11.1%
British West Indians
62.8
/100
|
#164
Good
11.1%
Luxembourgers
61.9
/100
|
#165
Good
11.1%
Immigrants | Hungary
61.2
/100
|
#166
Good
11.1%
Immigrants | Southern Europe
54.4
/100
|
#167
Average
11.2%
Immigrants | Latin America
54.0
/100
|
#168
Average
11.2%
Barbadians
53.4
/100
|
#169
Average
11.2%
New Zealanders
52.9
/100
|
#170
Average
11.2%
Haitians
52.5
/100
|
#171
Average
11.2%
Romanians
50.7
/100
|
#172
Average
11.2%