Bethlehem, WV
Bethlehem Map
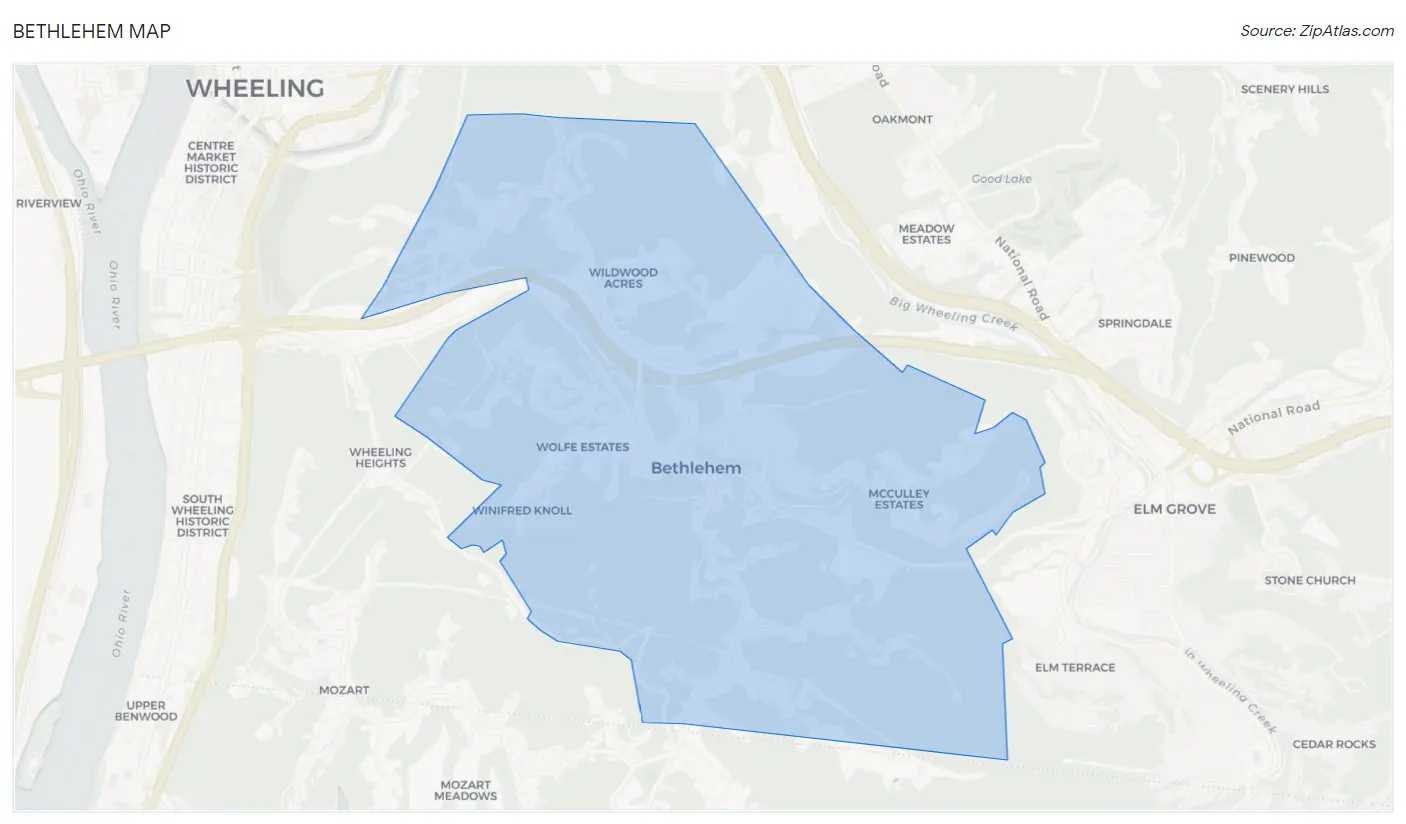
Bethlehem Overview
2,577
TOTAL POPULATION
1,274
MALE POPULATION
1,303
FEMALE POPULATION
97.77
MALES / 100 FEMALES
102.28
FEMALES / 100 MALES
42.3
MEDIAN AGE
2.9
AVG FAMILY SIZE
2.4
AVG HOUSEHOLD SIZE
$39,413
PER CAPITA INCOME
$101,719
AVG FAMILY INCOME
$85,150
AVG HOUSEHOLD INCOME
32.8%
WAGE / INCOME GAP [ % ]
67.2¢/ $1
WAGE / INCOME GAP [ $ ]
0.35
INEQUALITY / GINI INDEX
1,291
LABOR FORCE [ PEOPLE ]
63.3%
PERCENT IN LABOR FORCE
2.8%
UNEMPLOYMENT RATE
Bethlehem Area Codes
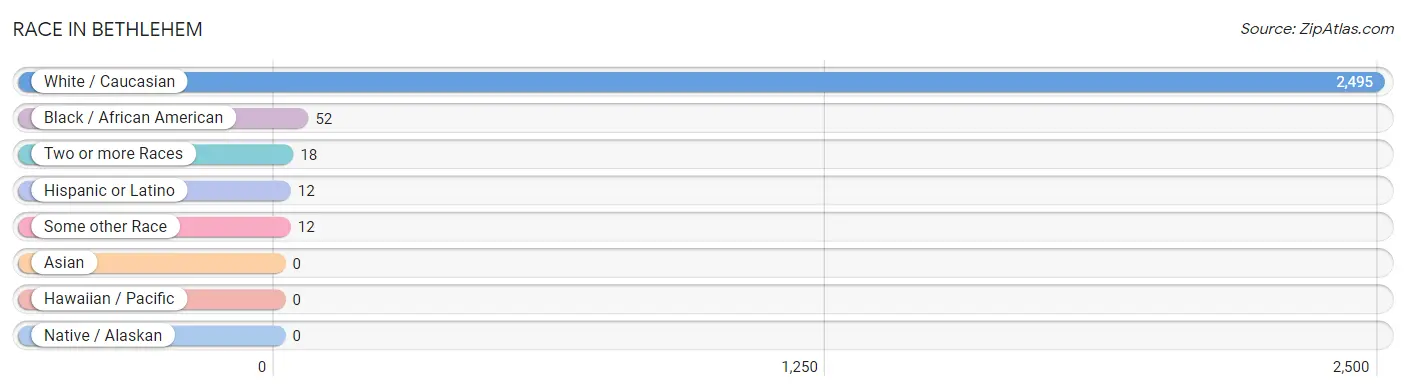
Race in Bethlehem
The most populous races in Bethlehem are White / Caucasian (2,495 | 96.8%), Black / African American (52 | 2.0%), and Two or more Races (18 | 0.7%).
| Race | # Population | % Population |
| Asian | 0 | 0.0% |
| Black / African American | 52 | 2.0% |
| Hawaiian / Pacific | 0 | 0.0% |
| Hispanic or Latino | 12 | 0.5% |
| Native / Alaskan | 0 | 0.0% |
| White / Caucasian | 2,495 | 96.8% |
| Two or more Races | 18 | 0.7% |
| Some other Race | 12 | 0.5% |
| Total | 2,577 | 100.0% |
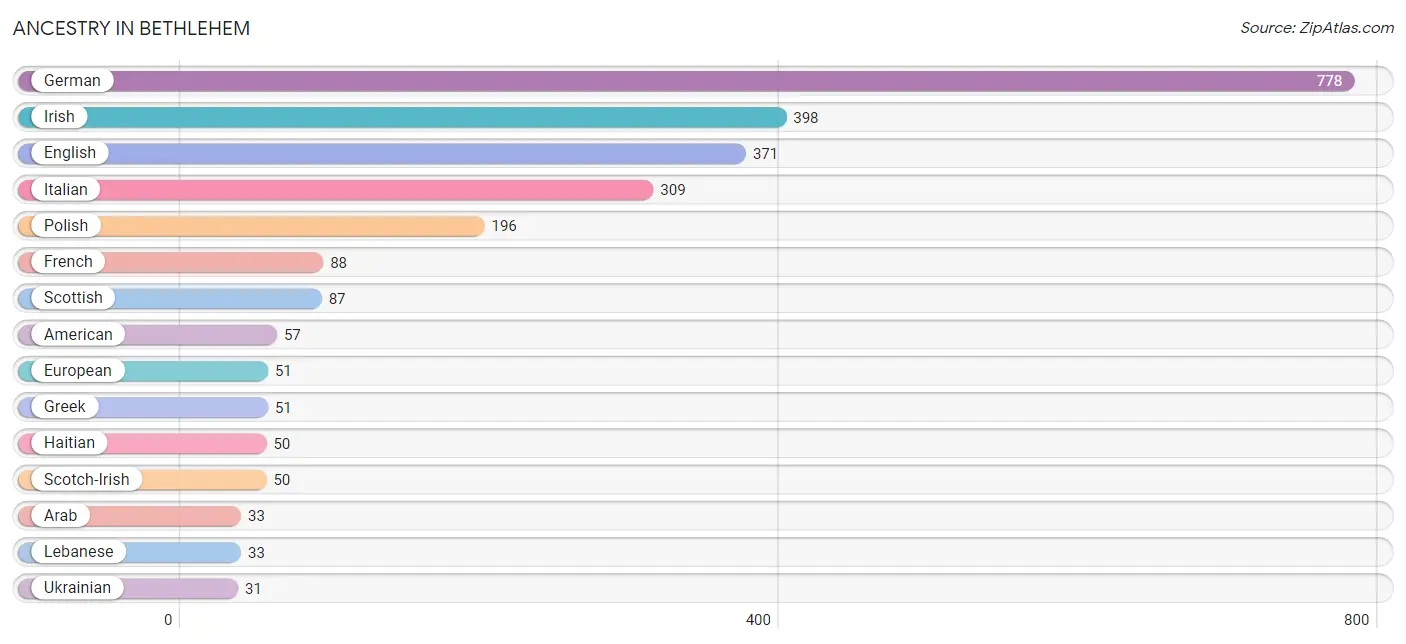
Ancestry in Bethlehem
The most populous ancestries reported in Bethlehem are German (778 | 30.2%), Irish (398 | 15.4%), English (371 | 14.4%), Italian (309 | 12.0%), and Polish (196 | 7.6%), together accounting for 79.6% of all Bethlehem residents.
| Ancestry | # Population | % Population |
| American | 57 | 2.2% |
| Arab | 33 | 1.3% |
| British | 21 | 0.8% |
| Canadian | 5 | 0.2% |
| Croatian | 3 | 0.1% |
| Czech | 17 | 0.7% |
| Dutch | 29 | 1.1% |
| Eastern European | 7 | 0.3% |
| English | 371 | 14.4% |
| European | 51 | 2.0% |
| French | 88 | 3.4% |
| German | 778 | 30.2% |
| Greek | 51 | 2.0% |
| Haitian | 50 | 1.9% |
| Hungarian | 10 | 0.4% |
| Irish | 398 | 15.4% |
| Italian | 309 | 12.0% |
| Lebanese | 33 | 1.3% |
| Lithuanian | 6 | 0.2% |
| Mexican | 6 | 0.2% |
| Polish | 196 | 7.6% |
| Puerto Rican | 6 | 0.2% |
| Scandinavian | 7 | 0.3% |
| Scotch-Irish | 50 | 1.9% |
| Scottish | 87 | 3.4% |
| Slovak | 17 | 0.7% |
| Ukrainian | 31 | 1.2% |
| Welsh | 5 | 0.2% | View All 28 Rows |
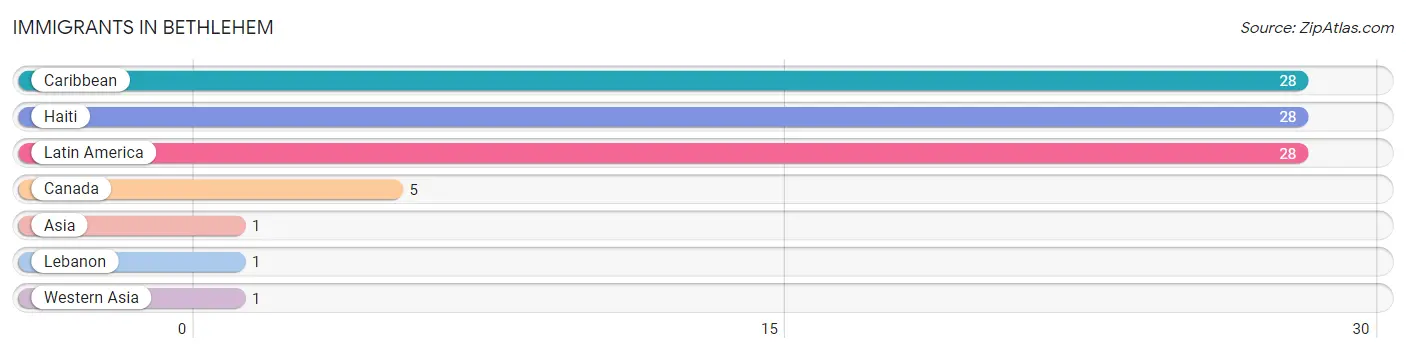
Immigrants in Bethlehem
The most numerous immigrant groups reported in Bethlehem came from Caribbean (28 | 1.1%), Haiti (28 | 1.1%), Latin America (28 | 1.1%), Canada (5 | 0.2%), and Asia (1 | 0.0%), together accounting for 3.5% of all Bethlehem residents.
| Immigration Origin | # Population | % Population |
| Asia | 1 | 0.0% |
| Canada | 5 | 0.2% |
| Caribbean | 28 | 1.1% |
| Haiti | 28 | 1.1% |
| Latin America | 28 | 1.1% |
| Lebanon | 1 | 0.0% |
| Western Asia | 1 | 0.0% | View All 7 Rows |
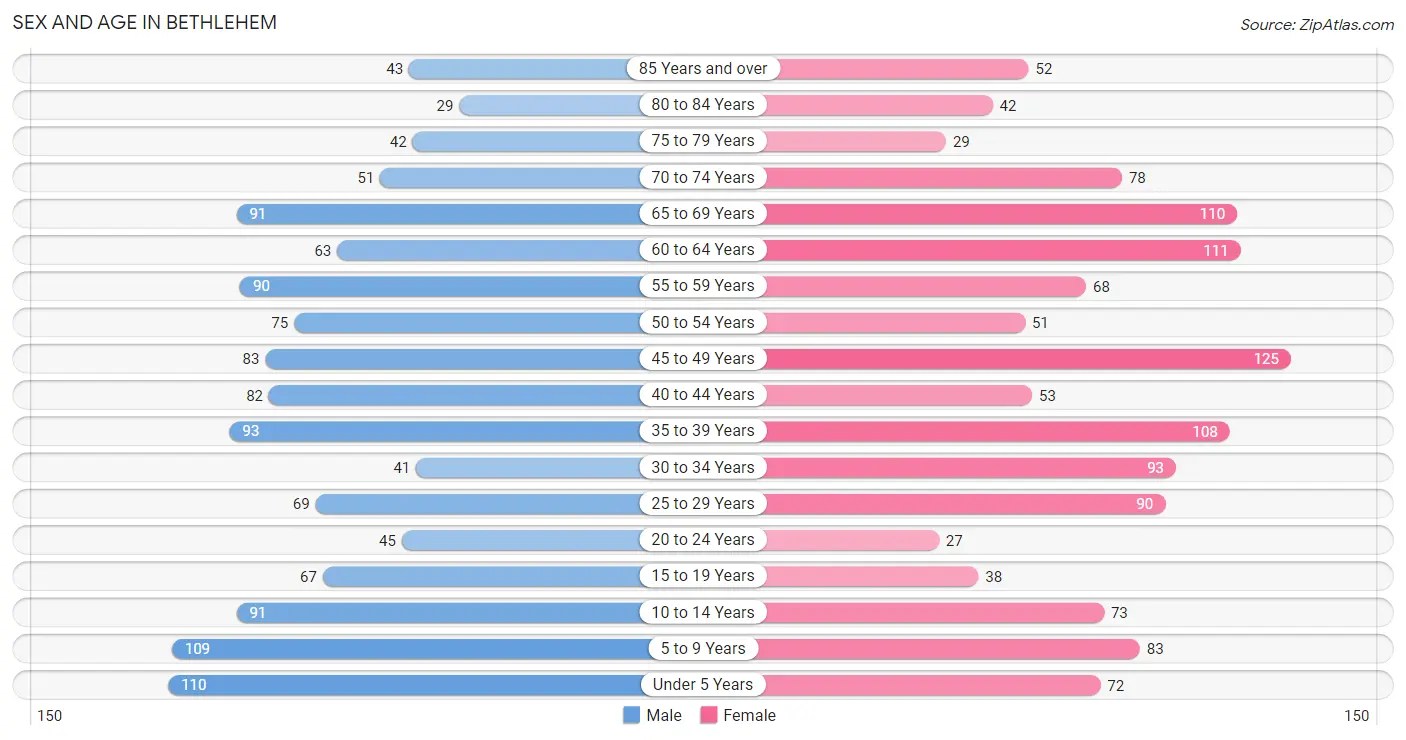
Sex and Age in Bethlehem
Sex and Age in Bethlehem
The most populous age groups in Bethlehem are Under 5 Years (110 | 8.6%) for men and 45 to 49 Years (125 | 9.6%) for women.
| Age Bracket | Male | Female |
| Under 5 Years | 110 (8.6%) | 72 (5.5%) |
| 5 to 9 Years | 109 (8.6%) | 83 (6.4%) |
| 10 to 14 Years | 91 (7.1%) | 73 (5.6%) |
| 15 to 19 Years | 67 (5.3%) | 38 (2.9%) |
| 20 to 24 Years | 45 (3.5%) | 27 (2.1%) |
| 25 to 29 Years | 69 (5.4%) | 90 (6.9%) |
| 30 to 34 Years | 41 (3.2%) | 93 (7.1%) |
| 35 to 39 Years | 93 (7.3%) | 108 (8.3%) |
| 40 to 44 Years | 82 (6.4%) | 53 (4.1%) |
| 45 to 49 Years | 83 (6.5%) | 125 (9.6%) |
| 50 to 54 Years | 75 (5.9%) | 51 (3.9%) |
| 55 to 59 Years | 90 (7.1%) | 68 (5.2%) |
| 60 to 64 Years | 63 (5.0%) | 111 (8.5%) |
| 65 to 69 Years | 91 (7.1%) | 110 (8.4%) |
| 70 to 74 Years | 51 (4.0%) | 78 (6.0%) |
| 75 to 79 Years | 42 (3.3%) | 29 (2.2%) |
| 80 to 84 Years | 29 (2.3%) | 42 (3.2%) |
| 85 Years and over | 43 (3.4%) | 52 (4.0%) |
| Total | 1,274 (100.0%) | 1,303 (100.0%) |
Families and Households in Bethlehem
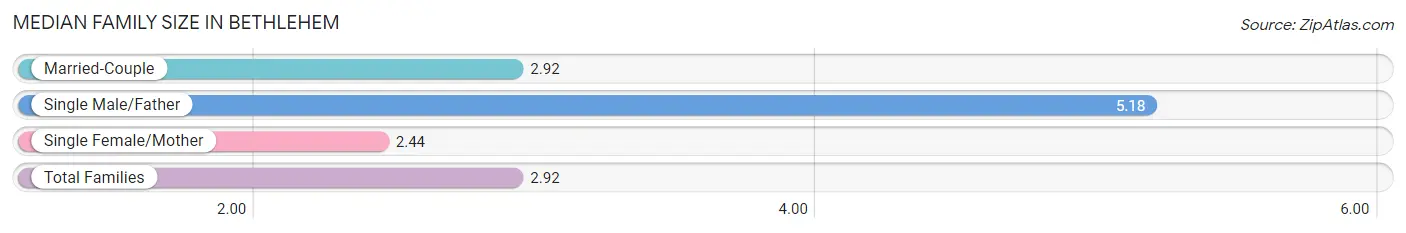
Median Family Size in Bethlehem
The median family size in Bethlehem is 2.92 persons per family, with single male/father families (17 | 2.2%) accounting for the largest median family size of 5.18 persons per family. On the other hand, single female/mother families (78 | 10.2%) represent the smallest median family size with 2.44 persons per family.
| Family Type | # Families | Family Size |
| Married-Couple | 671 (87.6%) | 2.92 |
| Single Male/Father | 17 (2.2%) | 5.18 |
| Single Female/Mother | 78 (10.2%) | 2.44 |
| Total Families | 766 (100.0%) | 2.92 |
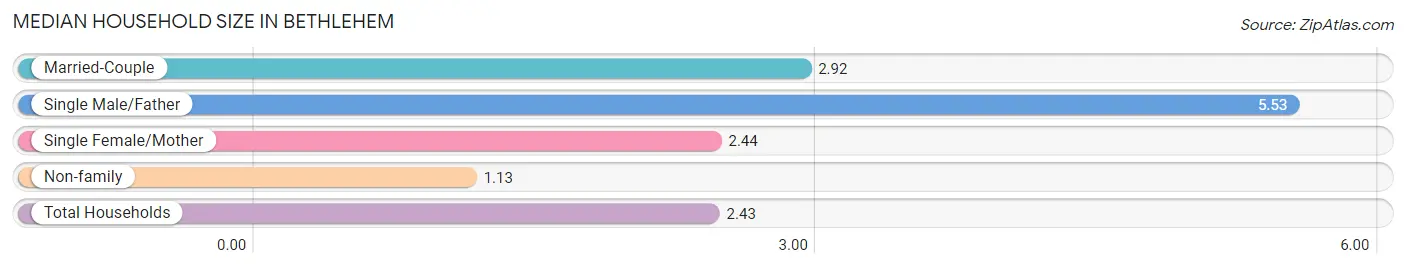
Median Household Size in Bethlehem
The median household size in Bethlehem is 2.43 persons per household, with single male/father households (17 | 1.6%) accounting for the largest median household size of 5.53 persons per household. non-family households (295 | 27.8%) represent the smallest median household size with 1.13 persons per household.
| Household Type | # Households | Household Size |
| Married-Couple | 671 (63.2%) | 2.92 |
| Single Male/Father | 17 (1.6%) | 5.53 |
| Single Female/Mother | 78 (7.3%) | 2.44 |
| Non-family | 295 (27.8%) | 1.13 |
| Total Households | 1,061 (100.0%) | 2.43 |
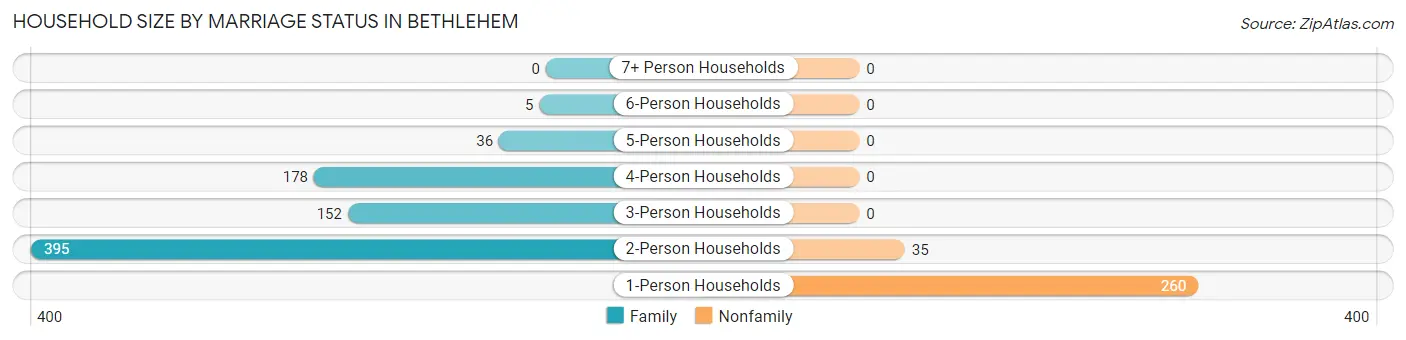
Household Size by Marriage Status in Bethlehem
Out of a total of 1,061 households in Bethlehem, 766 (72.2%) are family households, while 295 (27.8%) are nonfamily households. The most numerous type of family households are 2-person households, comprising 395, and the most common type of nonfamily households are 1-person households, comprising 260.
| Household Size | Family Households | Nonfamily Households |
| 1-Person Households | - | 260 (24.5%) |
| 2-Person Households | 395 (37.2%) | 35 (3.3%) |
| 3-Person Households | 152 (14.3%) | 0 (0.0%) |
| 4-Person Households | 178 (16.8%) | 0 (0.0%) |
| 5-Person Households | 36 (3.4%) | 0 (0.0%) |
| 6-Person Households | 5 (0.5%) | 0 (0.0%) |
| 7+ Person Households | 0 (0.0%) | 0 (0.0%) |
| Total | 766 (72.2%) | 295 (27.8%) |
Female Fertility in Bethlehem
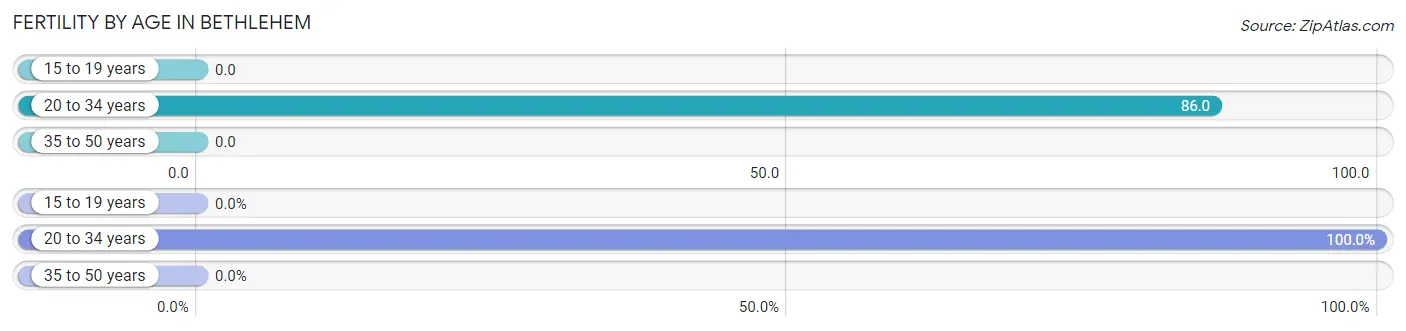
Fertility by Age in Bethlehem
Average fertility rate in Bethlehem is 34.0 births per 1,000 women. Women in the age bracket of 20 to 34 years have the highest fertility rate with 86.0 births per 1,000 women. Women in the age bracket of 20 to 34 years acount for 100.0% of all women with births.
| Age Bracket | Women with Births | Births / 1,000 Women |
| 15 to 19 years | 0 (0.0%) | 0.0 |
| 20 to 34 years | 18 (100.0%) | 86.0 |
| 35 to 50 years | 0 (0.0%) | 0.0 |
| Total | 18 (100.0%) | 34.0 |
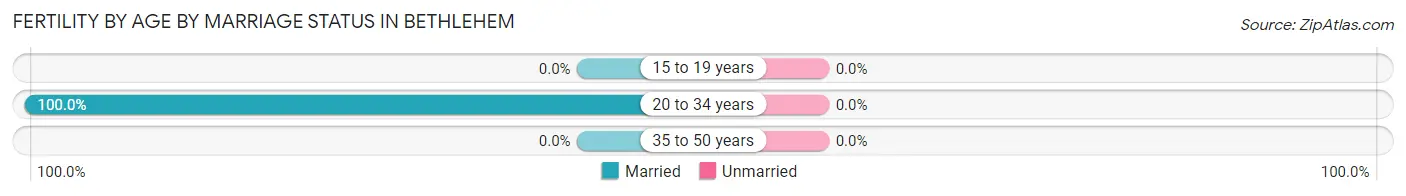
Fertility by Age by Marriage Status in Bethlehem
| Age Bracket | Married | Unmarried |
| 15 to 19 years | 0 (0.0%) | 0 (0.0%) |
| 20 to 34 years | 18 (100.0%) | 0 (0.0%) |
| 35 to 50 years | 0 (0.0%) | 0 (0.0%) |
| Total | 18 (100.0%) | 0 (0.0%) |
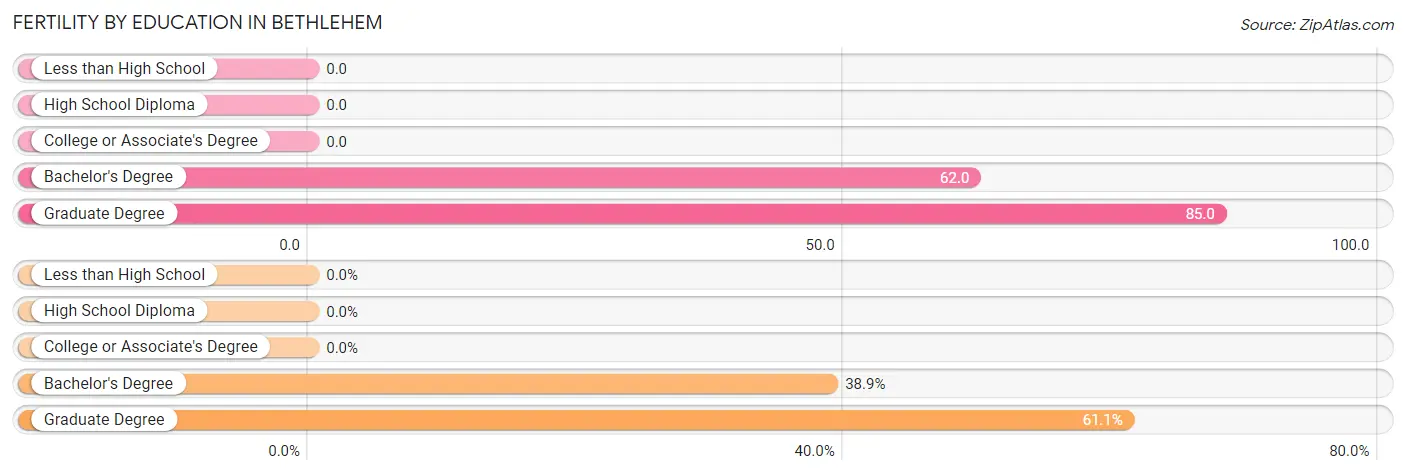
Fertility by Education in Bethlehem
| Educational Attainment | Women with Births | Births / 1,000 Women |
| Less than High School | 0 (0.0%) | 0.0 |
| High School Diploma | 0 (0.0%) | 0.0 |
| College or Associate's Degree | 0 (0.0%) | 0.0 |
| Bachelor's Degree | 7 (38.9%) | 62.0 |
| Graduate Degree | 11 (61.1%) | 85.0 |
| Total | 18 (100.0%) | 34.0 |
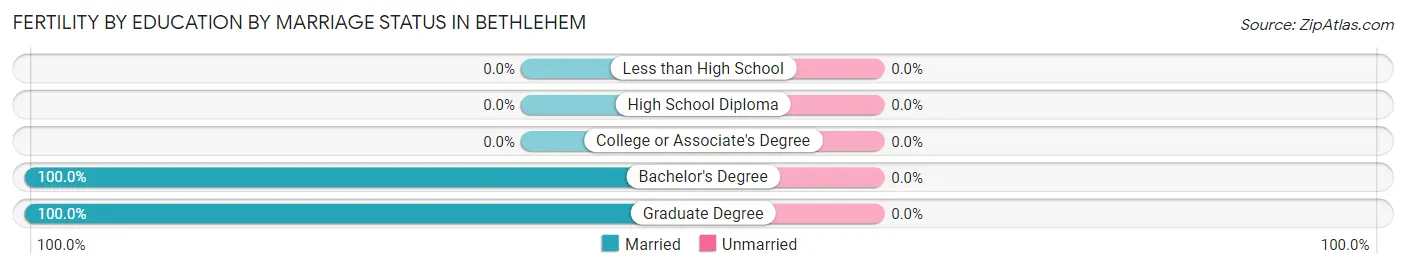
Fertility by Education by Marriage Status in Bethlehem
| Educational Attainment | Married | Unmarried |
| Less than High School | 0 (0.0%) | 0 (0.0%) |
| High School Diploma | 0 (0.0%) | 0 (0.0%) |
| College or Associate's Degree | 0 (0.0%) | 0 (0.0%) |
| Bachelor's Degree | 7 (100.0%) | 0 (0.0%) |
| Graduate Degree | 11 (100.0%) | 0 (0.0%) |
| Total | 18 (100.0%) | 0 (0.0%) |
Income in Bethlehem
Income Overview in Bethlehem
Per Capita Income in Bethlehem is $39,413, while median incomes of families and households are $101,719 and $85,150 respectively.
| Characteristic | Number | Measure |
| Per Capita Income | 2,577 | $39,413 |
| Median Family Income | 766 | $101,719 |
| Mean Family Income | 766 | $108,137 |
| Median Household Income | 1,061 | $85,150 |
| Mean Household Income | 1,061 | $93,506 |
| Income Deficit | 766 | $0 |
| Wage / Income Gap (%) | 2,577 | 32.78% |
| Wage / Income Gap ($) | 2,577 | 67.22¢ per $1 |
| Gini / Inequality Index | 2,577 | 0.35 |
Earnings by Sex in Bethlehem
Average Earnings in Bethlehem are $47,363, $61,607 for men and $41,411 for women, a difference of 32.8%.
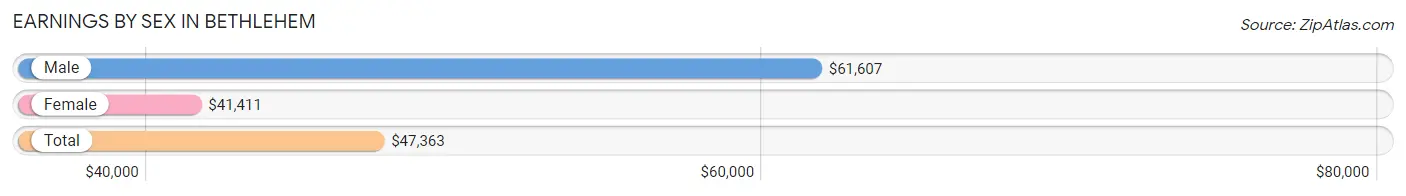
| Sex | Number | Average Earnings |
| Male | 707 (52.2%) | $61,607 |
| Female | 647 (47.8%) | $41,411 |
| Total | 1,354 (100.0%) | $47,363 |
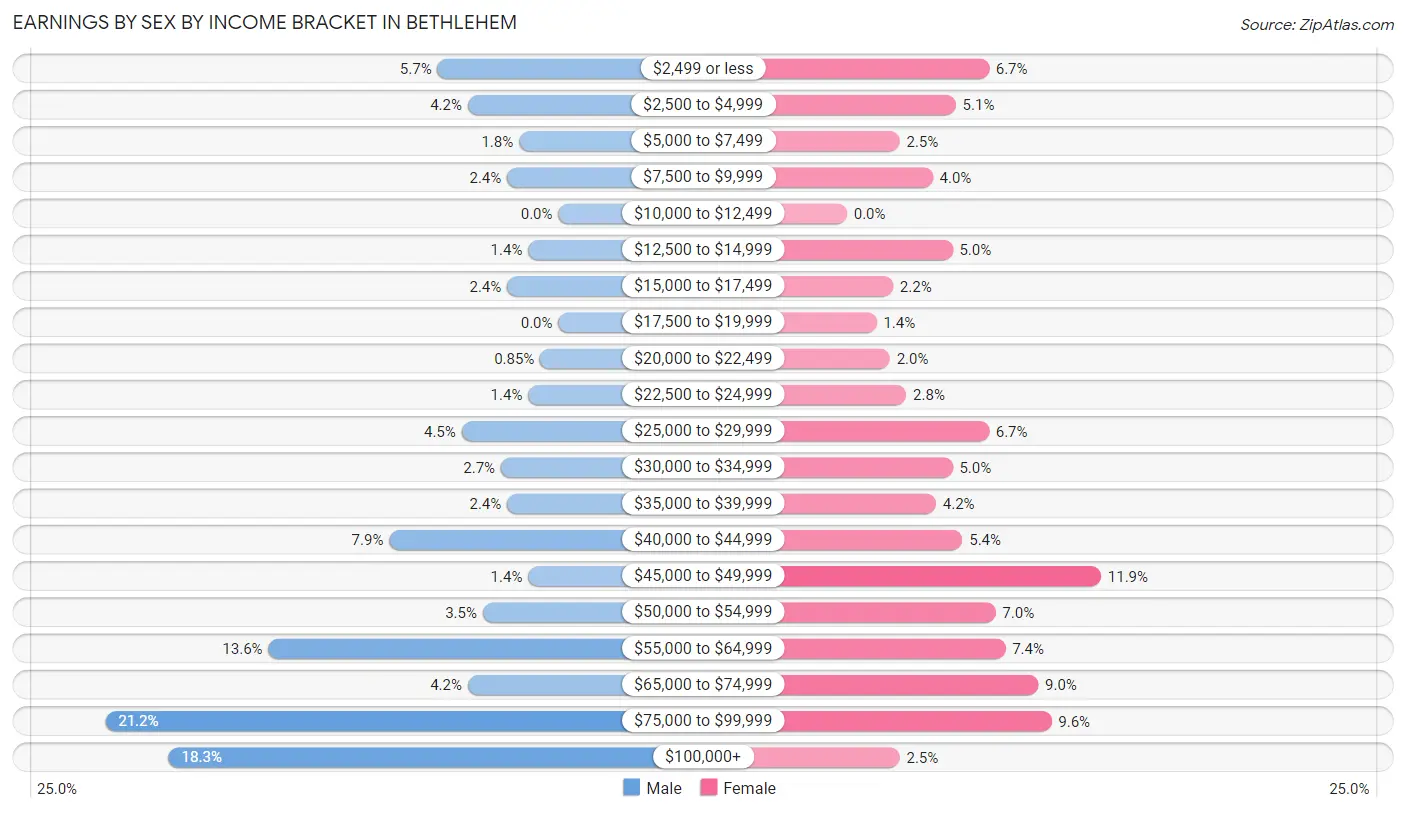
Earnings by Sex by Income Bracket in Bethlehem
The most common earnings brackets in Bethlehem are $75,000 to $99,999 for men (150 | 21.2%) and $45,000 to $49,999 for women (77 | 11.9%).
| Income | Male | Female |
| $2,499 or less | 40 (5.7%) | 43 (6.7%) |
| $2,500 to $4,999 | 30 (4.2%) | 33 (5.1%) |
| $5,000 to $7,499 | 13 (1.8%) | 16 (2.5%) |
| $7,500 to $9,999 | 17 (2.4%) | 26 (4.0%) |
| $10,000 to $12,499 | 0 (0.0%) | 0 (0.0%) |
| $12,500 to $14,999 | 10 (1.4%) | 32 (5.0%) |
| $15,000 to $17,499 | 17 (2.4%) | 14 (2.2%) |
| $17,500 to $19,999 | 0 (0.0%) | 9 (1.4%) |
| $20,000 to $22,499 | 6 (0.9%) | 13 (2.0%) |
| $22,500 to $24,999 | 10 (1.4%) | 18 (2.8%) |
| $25,000 to $29,999 | 32 (4.5%) | 43 (6.7%) |
| $30,000 to $34,999 | 19 (2.7%) | 32 (5.0%) |
| $35,000 to $39,999 | 17 (2.4%) | 27 (4.2%) |
| $40,000 to $44,999 | 56 (7.9%) | 35 (5.4%) |
| $45,000 to $49,999 | 10 (1.4%) | 77 (11.9%) |
| $50,000 to $54,999 | 25 (3.5%) | 45 (7.0%) |
| $55,000 to $64,999 | 96 (13.6%) | 48 (7.4%) |
| $65,000 to $74,999 | 30 (4.2%) | 58 (9.0%) |
| $75,000 to $99,999 | 150 (21.2%) | 62 (9.6%) |
| $100,000+ | 129 (18.2%) | 16 (2.5%) |
| Total | 707 (100.0%) | 647 (100.0%) |
Earnings by Sex by Educational Attainment in Bethlehem
Average earnings in Bethlehem are $65,000 for men and $43,125 for women, a difference of 33.7%. Men with an educational attainment of bachelor's degree enjoy the highest average annual earnings of $74,779, while those with high school diploma education earn the least with $46,458. Women with an educational attainment of graduate degree earn the most with the average annual earnings of $63,438, while those with high school diploma education have the smallest earnings of $23,571.
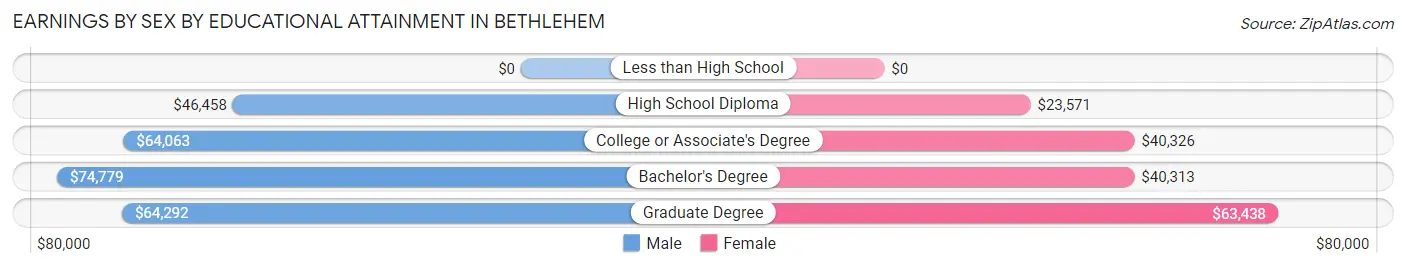
| Educational Attainment | Male Income | Female Income |
| Less than High School | - | - |
| High School Diploma | $46,458 | $23,571 |
| College or Associate's Degree | $64,063 | $40,326 |
| Bachelor's Degree | $74,779 | $40,313 |
| Graduate Degree | $64,292 | $63,438 |
| Total | $65,000 | $43,125 |
Family Income in Bethlehem
Family Income Brackets in Bethlehem
According to the Bethlehem family income data, there are 205 families falling into the $100,000 to $149,999 income range, which is the most common income bracket and makes up 26.8% of all families.
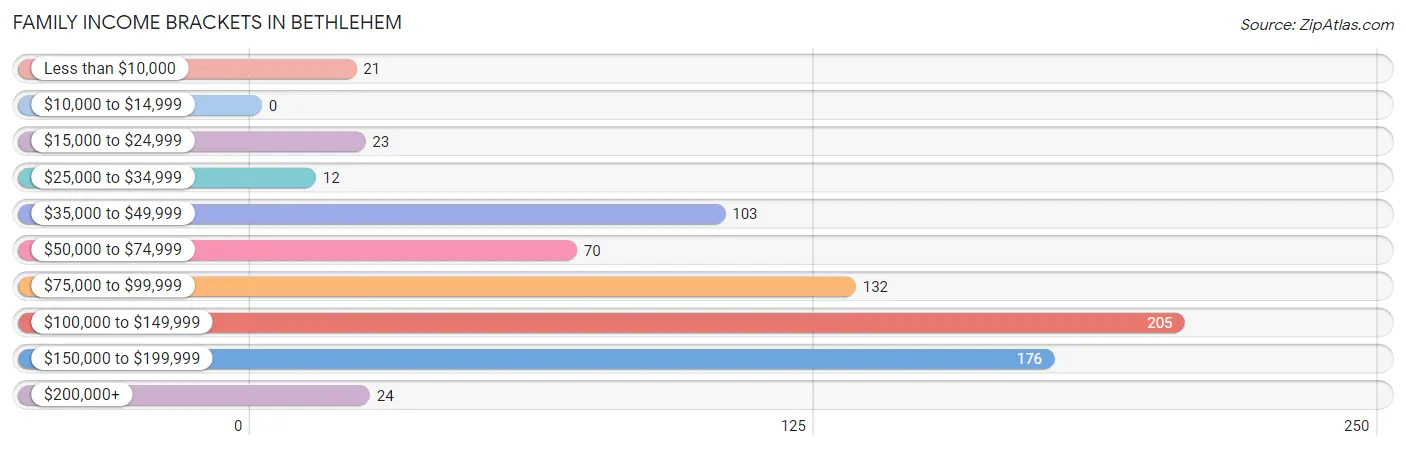
| Income Bracket | # Families | % Families |
| Less than $10,000 | 21 | 2.7% |
| $10,000 to $14,999 | 0 | 0.0% |
| $15,000 to $24,999 | 23 | 3.0% |
| $25,000 to $34,999 | 12 | 1.6% |
| $35,000 to $49,999 | 103 | 13.4% |
| $50,000 to $74,999 | 70 | 9.1% |
| $75,000 to $99,999 | 132 | 17.2% |
| $100,000 to $149,999 | 205 | 26.8% |
| $150,000 to $199,999 | 176 | 23.0% |
| $200,000+ | 24 | 3.1% |
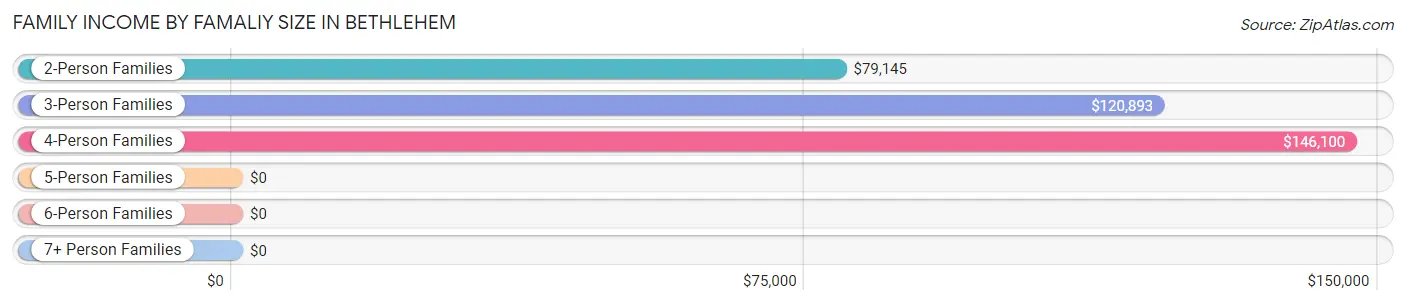
Family Income by Famaliy Size in Bethlehem
4-person families (172 | 22.5%) account for the highest median family income in Bethlehem with $146,100 per family, while 3-person families (158 | 20.6%) have the highest median income of $40,298 per family member.
| Income Bracket | # Families | Median Income |
| 2-Person Families | 395 (51.6%) | $79,145 |
| 3-Person Families | 158 (20.6%) | $120,893 |
| 4-Person Families | 172 (22.5%) | $146,100 |
| 5-Person Families | 36 (4.7%) | $0 |
| 6-Person Families | 5 (0.6%) | $0 |
| 7+ Person Families | 0 (0.0%) | $0 |
| Total | 766 (100.0%) | $101,719 |
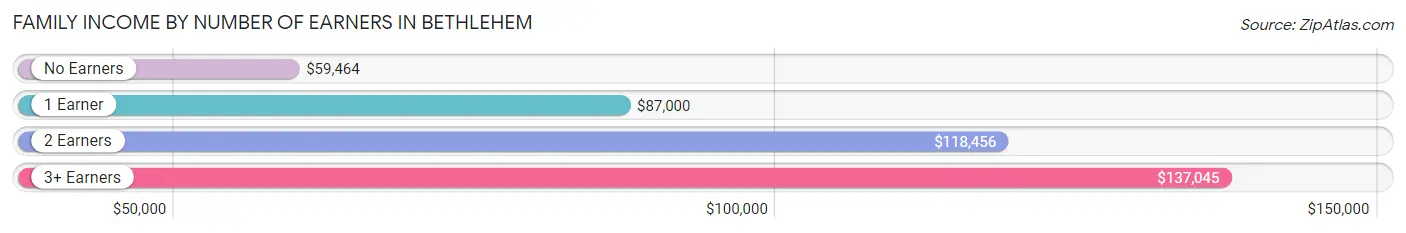
Family Income by Number of Earners in Bethlehem
The median family income in Bethlehem is $101,719, with families comprising 3+ earners (68) having the highest median family income of $137,045, while families with no earners (163) have the lowest median family income of $59,464, accounting for 8.9% and 21.3% of families, respectively.
| Number of Earners | # Families | Median Income |
| No Earners | 163 (21.3%) | $59,464 |
| 1 Earner | 172 (22.5%) | $87,000 |
| 2 Earners | 363 (47.4%) | $118,456 |
| 3+ Earners | 68 (8.9%) | $137,045 |
| Total | 766 (100.0%) | $101,719 |
Household Income in Bethlehem
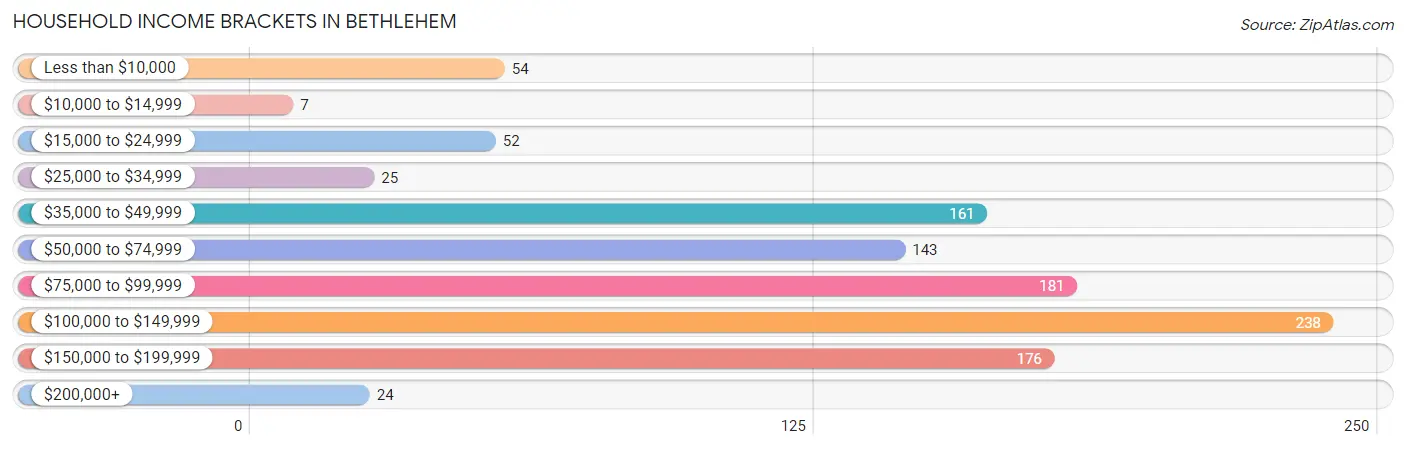
Household Income Brackets in Bethlehem
With 238 households falling in the category, the $100,000 to $149,999 income range is the most frequent in Bethlehem, accounting for 22.4% of all households. In contrast, only 7 households (0.7%) fall into the $10,000 to $14,999 income bracket, making it the least populous group.
| Income Bracket | # Households | % Households |
| Less than $10,000 | 54 | 5.1% |
| $10,000 to $14,999 | 7 | 0.7% |
| $15,000 to $24,999 | 52 | 4.9% |
| $25,000 to $34,999 | 25 | 2.4% |
| $35,000 to $49,999 | 161 | 15.2% |
| $50,000 to $74,999 | 143 | 13.5% |
| $75,000 to $99,999 | 181 | 17.1% |
| $100,000 to $149,999 | 238 | 22.4% |
| $150,000 to $199,999 | 176 | 16.6% |
| $200,000+ | 24 | 2.3% |
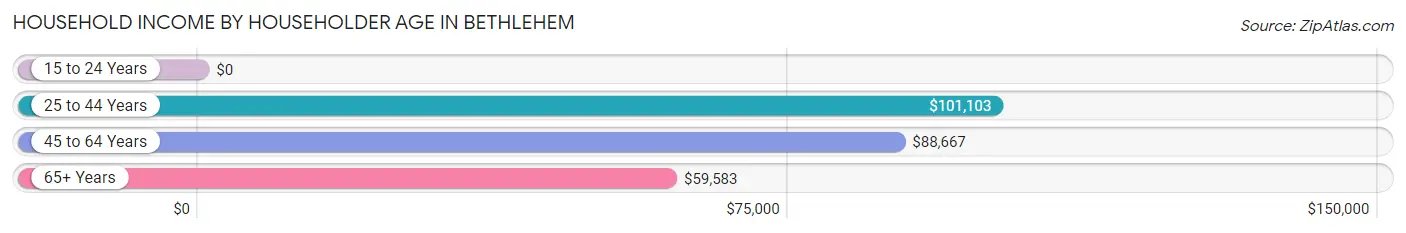
Household Income by Householder Age in Bethlehem
The median household income in Bethlehem is $85,150, with the highest median household income of $101,103 found in the 25 to 44 years age bracket for the primary householder. A total of 287 households (27.1%) fall into this category.
| Income Bracket | # Households | Median Income |
| 15 to 24 Years | 0 (0.0%) | $0 |
| 25 to 44 Years | 287 (27.1%) | $101,103 |
| 45 to 64 Years | 408 (38.5%) | $88,667 |
| 65+ Years | 366 (34.5%) | $59,583 |
| Total | 1,061 (100.0%) | $85,150 |
Poverty in Bethlehem
Income Below Poverty by Sex and Age in Bethlehem
With 6.2% poverty level for males and 6.4% for females among the residents of Bethlehem, 12 to 14 year old males and 18 to 24 year old females are the most vulnerable to poverty, with 9 males (17.3%) and 13 females (44.8%) in their respective age groups living below the poverty level.
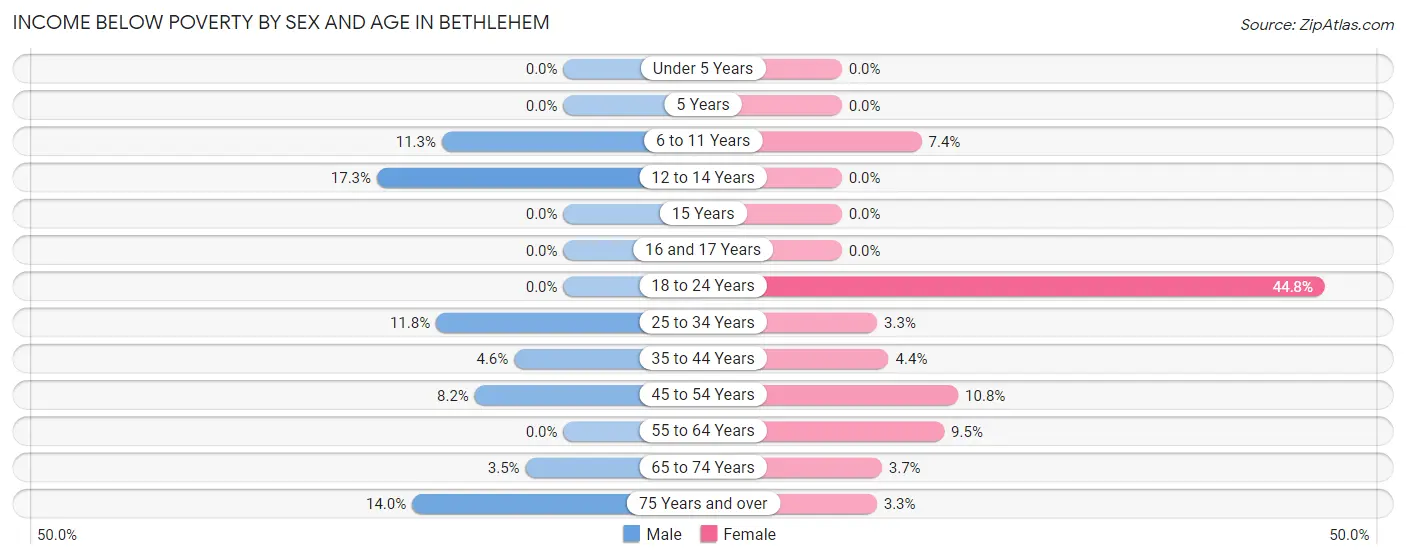
| Age Bracket | Male | Female |
| Under 5 Years | 0 (0.0%) | 0 (0.0%) |
| 5 Years | 0 (0.0%) | 0 (0.0%) |
| 6 to 11 Years | 15 (11.3%) | 10 (7.4%) |
| 12 to 14 Years | 9 (17.3%) | 0 (0.0%) |
| 15 Years | 0 (0.0%) | 0 (0.0%) |
| 16 and 17 Years | 0 (0.0%) | 0 (0.0%) |
| 18 to 24 Years | 0 (0.0%) | 13 (44.8%) |
| 25 to 34 Years | 13 (11.8%) | 6 (3.3%) |
| 35 to 44 Years | 8 (4.6%) | 7 (4.3%) |
| 45 to 54 Years | 13 (8.2%) | 19 (10.8%) |
| 55 to 64 Years | 0 (0.0%) | 17 (9.5%) |
| 65 to 74 Years | 5 (3.5%) | 7 (3.7%) |
| 75 Years and over | 16 (14.0%) | 4 (3.3%) |
| Total | 79 (6.2%) | 83 (6.4%) |
Income Above Poverty by Sex and Age in Bethlehem
According to the poverty statistics in Bethlehem, males aged under 5 years and females aged under 5 years are the age groups that are most secure financially, with 100.0% of males and 100.0% of females in these age groups living above the poverty line.
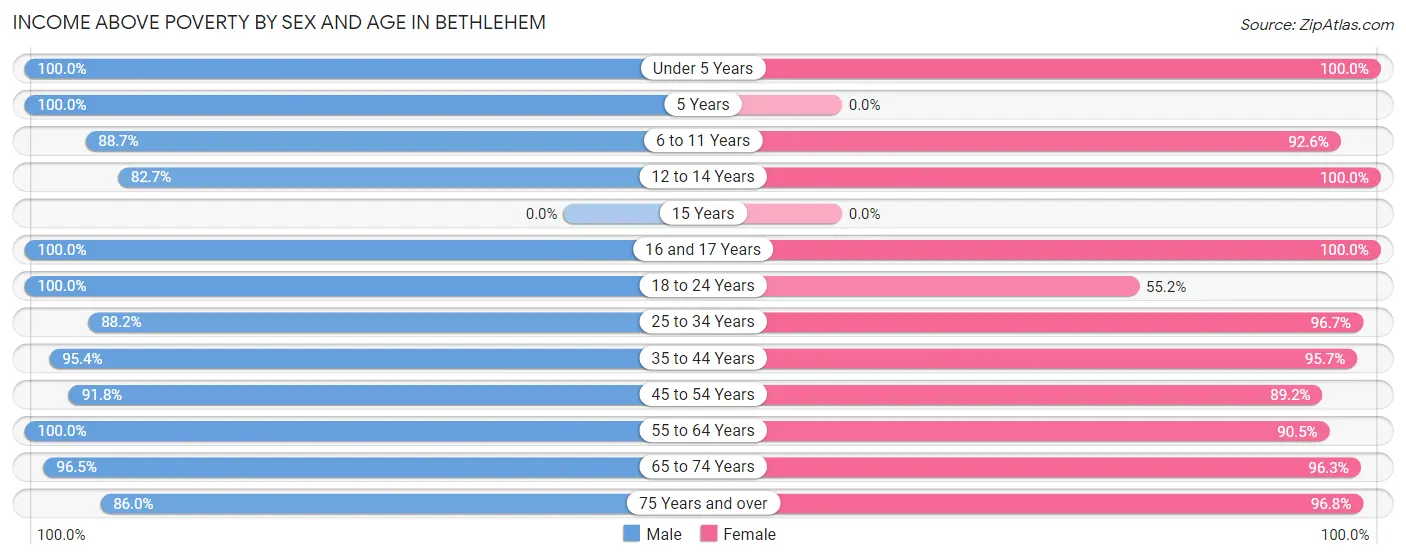
| Age Bracket | Male | Female |
| Under 5 Years | 110 (100.0%) | 72 (100.0%) |
| 5 Years | 15 (100.0%) | 0 (0.0%) |
| 6 to 11 Years | 118 (88.7%) | 125 (92.6%) |
| 12 to 14 Years | 43 (82.7%) | 21 (100.0%) |
| 15 Years | 0 (0.0%) | 0 (0.0%) |
| 16 and 17 Years | 54 (100.0%) | 36 (100.0%) |
| 18 to 24 Years | 58 (100.0%) | 16 (55.2%) |
| 25 to 34 Years | 97 (88.2%) | 177 (96.7%) |
| 35 to 44 Years | 167 (95.4%) | 154 (95.7%) |
| 45 to 54 Years | 145 (91.8%) | 157 (89.2%) |
| 55 to 64 Years | 153 (100.0%) | 162 (90.5%) |
| 65 to 74 Years | 137 (96.5%) | 181 (96.3%) |
| 75 Years and over | 98 (86.0%) | 119 (96.8%) |
| Total | 1,195 (93.8%) | 1,220 (93.6%) |
Income Below Poverty Among Married-Couple Families in Bethlehem
The poverty statistics for married-couple families in Bethlehem show that 4.2% or 28 of the total 671 families live below the poverty line. Families with 3 or 4 children have the highest poverty rate of 17.1%, comprising of 6 families. On the other hand, families with 1 or 2 children have the lowest poverty rate of 3.4%, which includes 8 families.
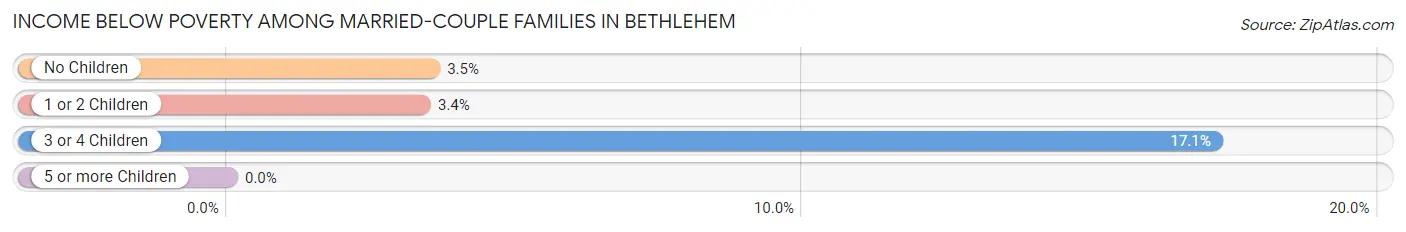
| Children | Above Poverty | Below Poverty |
| No Children | 384 (96.5%) | 14 (3.5%) |
| 1 or 2 Children | 230 (96.6%) | 8 (3.4%) |
| 3 or 4 Children | 29 (82.9%) | 6 (17.1%) |
| 5 or more Children | 0 (0.0%) | 0 (0.0%) |
| Total | 643 (95.8%) | 28 (4.2%) |
Income Below Poverty Among Single-Parent Households in Bethlehem
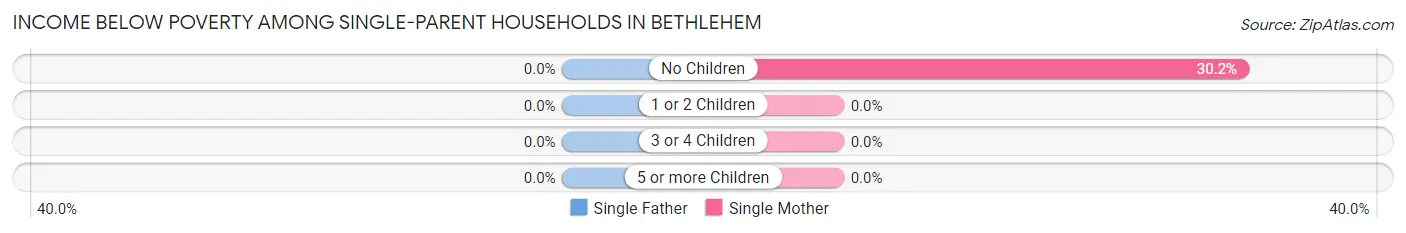
| Children | Single Father | Single Mother |
| No Children | 0 (0.0%) | 16 (30.2%) |
| 1 or 2 Children | 0 (0.0%) | 0 (0.0%) |
| 3 or 4 Children | 0 (0.0%) | 0 (0.0%) |
| 5 or more Children | 0 (0.0%) | 0 (0.0%) |
| Total | 0 (0.0%) | 16 (20.5%) |
Income Below Poverty Among Married-Couple vs Single-Parent Households in Bethlehem
The poverty data for Bethlehem shows that 28 of the married-couple family households (4.2%) and 16 of the single-parent households (16.8%) are living below the poverty level. Within the married-couple family households, those with 3 or 4 children have the highest poverty rate, with 6 households (17.1%) falling below the poverty line. Among the single-parent households, those with no children have the highest poverty rate, with 16 household (30.2%) living below poverty.
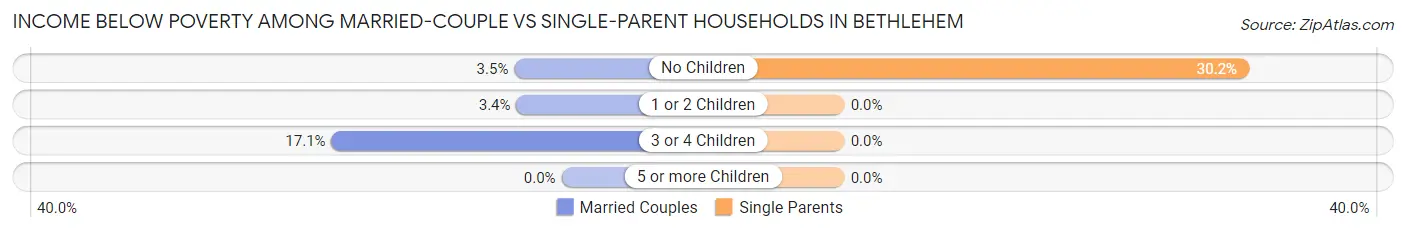
| Children | Married-Couple Families | Single-Parent Households |
| No Children | 14 (3.5%) | 16 (30.2%) |
| 1 or 2 Children | 8 (3.4%) | 0 (0.0%) |
| 3 or 4 Children | 6 (17.1%) | 0 (0.0%) |
| 5 or more Children | 0 (0.0%) | 0 (0.0%) |
| Total | 28 (4.2%) | 16 (16.8%) |
Employment Characteristics in Bethlehem
Employment by Class of Employer in Bethlehem
Among the 1,219 employed individuals in Bethlehem, private company employees (809 | 66.4%), local government employees (142 | 11.7%), and not-for-profit organizations (115 | 9.4%) make up the most common classes of employment.
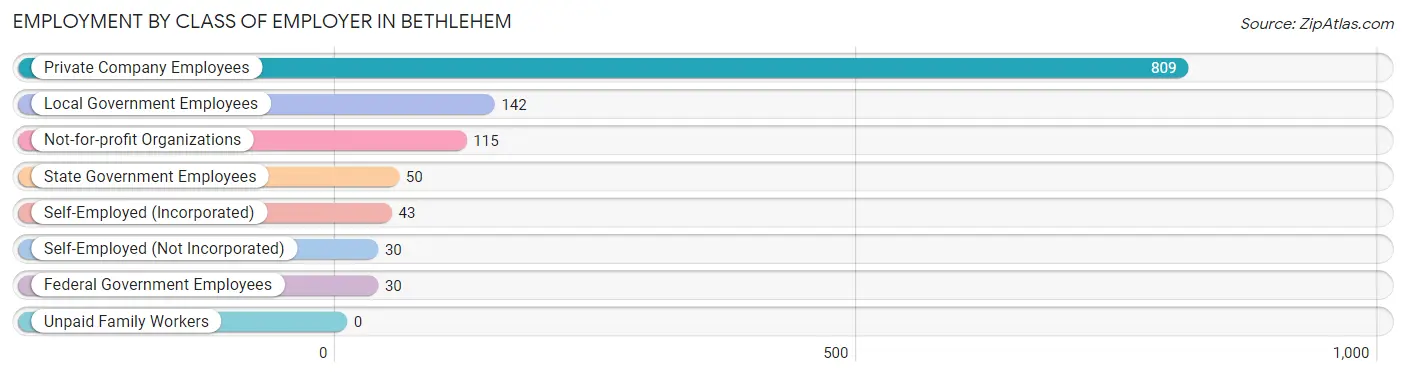
| Employer Class | # Employees | % Employees |
| Private Company Employees | 809 | 66.4% |
| Self-Employed (Incorporated) | 43 | 3.5% |
| Self-Employed (Not Incorporated) | 30 | 2.5% |
| Not-for-profit Organizations | 115 | 9.4% |
| Local Government Employees | 142 | 11.7% |
| State Government Employees | 50 | 4.1% |
| Federal Government Employees | 30 | 2.5% |
| Unpaid Family Workers | 0 | 0.0% |
| Total | 1,219 | 100.0% |
Employment Status by Age in Bethlehem
According to the labor force statistics for Bethlehem, out of the total population over 16 years of age (2,039), 63.3% or 1,291 individuals are in the labor force, with 2.8% or 36 of them unemployed. The age group with the highest labor force participation rate is 20 to 24 years, with 87.5% or 63 individuals in the labor force. Within the labor force, the 20 to 24 years age range has the highest percentage of unemployed individuals, with 22.2% or 14 of them being unemployed.
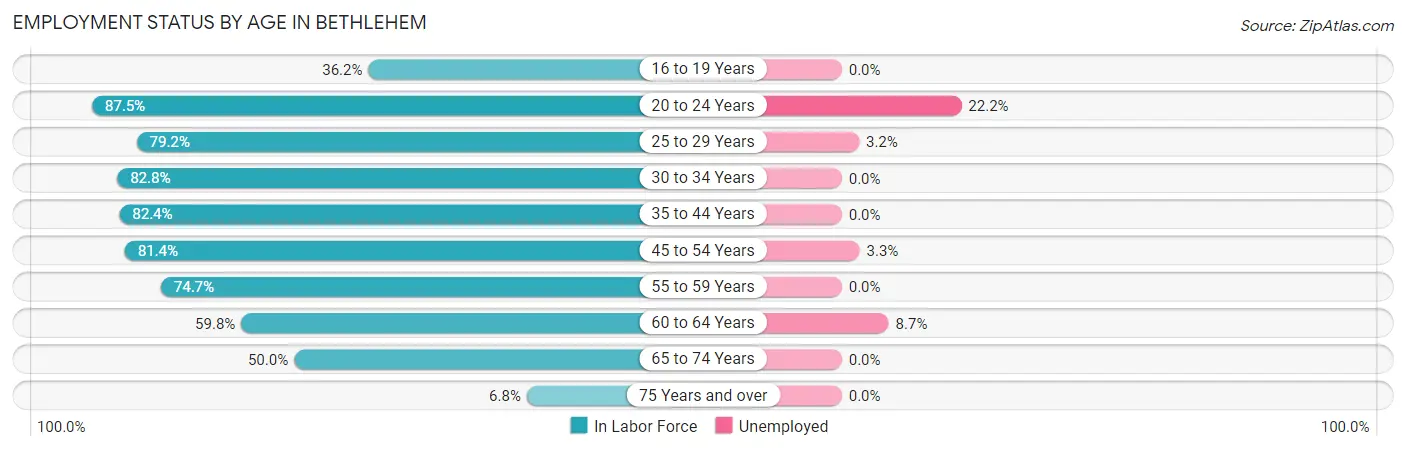
| Age Bracket | In Labor Force | Unemployed |
| 16 to 19 Years | 38 (36.2%) | 0 (0.0%) |
| 20 to 24 Years | 63 (87.5%) | 14 (22.2%) |
| 25 to 29 Years | 126 (79.2%) | 4 (3.2%) |
| 30 to 34 Years | 111 (82.8%) | 0 (0.0%) |
| 35 to 44 Years | 277 (82.4%) | 0 (0.0%) |
| 45 to 54 Years | 272 (81.4%) | 9 (3.3%) |
| 55 to 59 Years | 118 (74.7%) | 0 (0.0%) |
| 60 to 64 Years | 104 (59.8%) | 9 (8.7%) |
| 65 to 74 Years | 165 (50.0%) | 0 (0.0%) |
| 75 Years and over | 16 (6.8%) | 0 (0.0%) |
| Total | 1,291 (63.3%) | 36 (2.8%) |
Employment Status by Educational Attainment in Bethlehem
According to labor force statistics for Bethlehem, 77.8% of individuals (1,008) out of the total population between 25 and 64 years of age (1,295) are in the labor force, with 2.2% or 22 of them being unemployed. The group with the highest labor force participation rate are those with the educational attainment of less than high school, with 100.0% or 10 individuals in the labor force. Within the labor force, individuals with less than high school education have the highest percentage of unemployment, with 40.0% or 4 of them being unemployed.
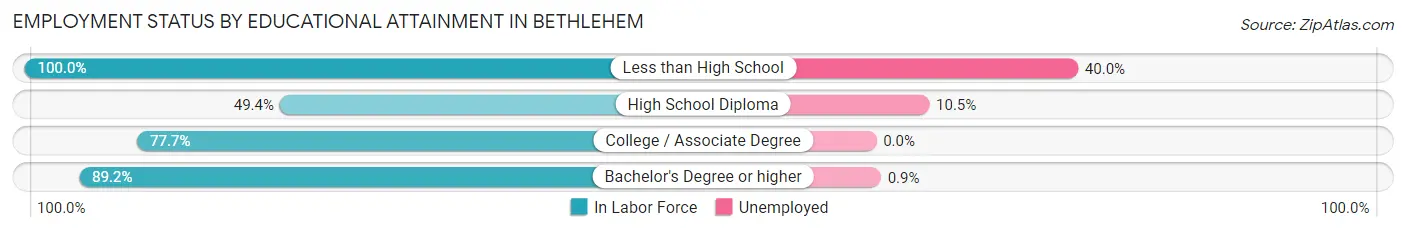
| Educational Attainment | In Labor Force | Unemployed |
| Less than High School | 10 (100.0%) | 4 (40.0%) |
| High School Diploma | 124 (49.4%) | 26 (10.5%) |
| College / Associate Degree | 328 (77.7%) | 0 (0.0%) |
| Bachelor's Degree or higher | 546 (89.2%) | 6 (0.9%) |
| Total | 1,008 (77.8%) | 28 (2.2%) |
Employment Occupations by Sex in Bethlehem
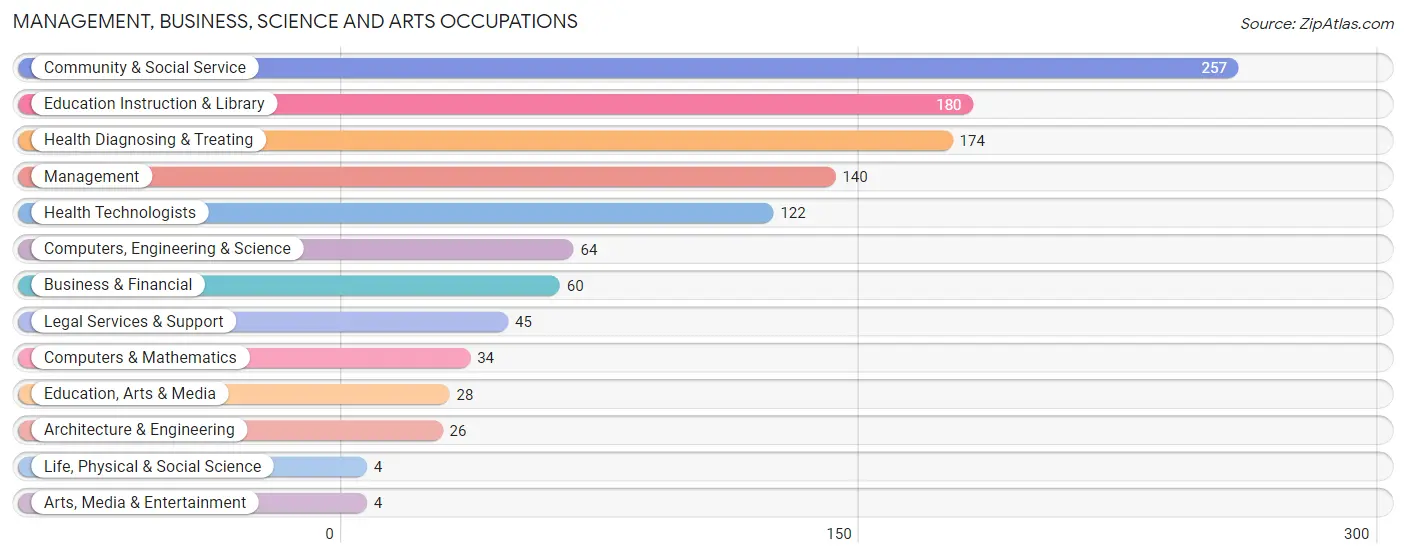
Management, Business, Science and Arts Occupations
The most common Management, Business, Science and Arts occupations in Bethlehem are Community & Social Service (257 | 20.5%), Education Instruction & Library (180 | 14.3%), Health Diagnosing & Treating (174 | 13.9%), Management (140 | 11.2%), and Health Technologists (122 | 9.7%).
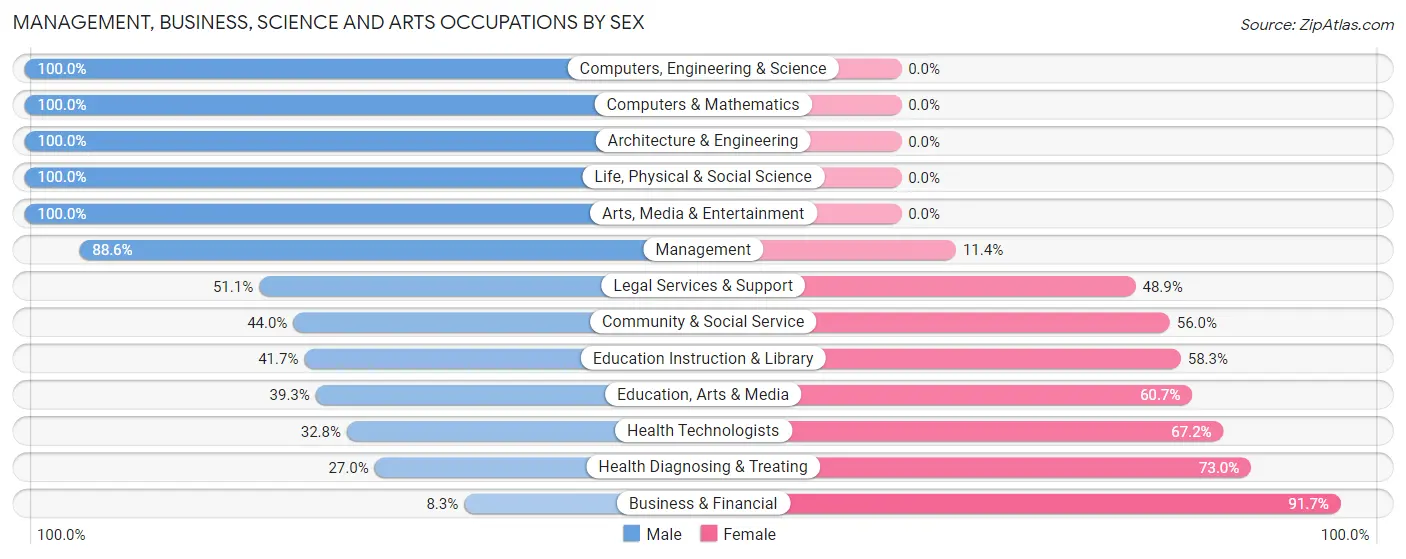
Management, Business, Science and Arts Occupations by Sex
Within the Management, Business, Science and Arts occupations in Bethlehem, the most male-oriented occupations are Computers, Engineering & Science (100.0%), Computers & Mathematics (100.0%), and Architecture & Engineering (100.0%), while the most female-oriented occupations are Business & Financial (91.7%), Health Diagnosing & Treating (73.0%), and Health Technologists (67.2%).
| Occupation | Male | Female |
| Management | 124 (88.6%) | 16 (11.4%) |
| Business & Financial | 5 (8.3%) | 55 (91.7%) |
| Computers, Engineering & Science | 64 (100.0%) | 0 (0.0%) |
| Computers & Mathematics | 34 (100.0%) | 0 (0.0%) |
| Architecture & Engineering | 26 (100.0%) | 0 (0.0%) |
| Life, Physical & Social Science | 4 (100.0%) | 0 (0.0%) |
| Community & Social Service | 113 (44.0%) | 144 (56.0%) |
| Education, Arts & Media | 11 (39.3%) | 17 (60.7%) |
| Legal Services & Support | 23 (51.1%) | 22 (48.9%) |
| Education Instruction & Library | 75 (41.7%) | 105 (58.3%) |
| Arts, Media & Entertainment | 4 (100.0%) | 0 (0.0%) |
| Health Diagnosing & Treating | 47 (27.0%) | 127 (73.0%) |
| Health Technologists | 40 (32.8%) | 82 (67.2%) |
| Total (Category) | 353 (50.8%) | 342 (49.2%) |
| Total (Overall) | 646 (51.5%) | 608 (48.5%) |
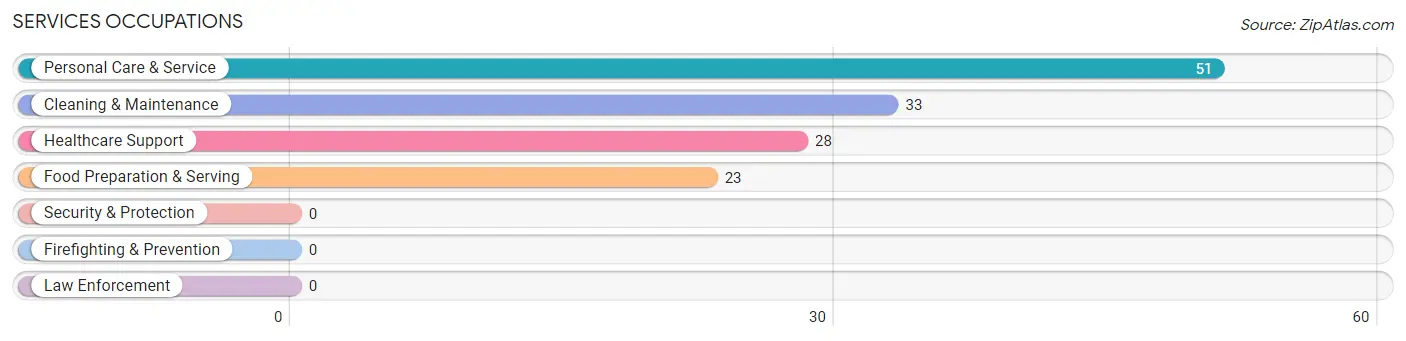
Services Occupations
The most common Services occupations in Bethlehem are Personal Care & Service (51 | 4.1%), Cleaning & Maintenance (33 | 2.6%), Healthcare Support (28 | 2.2%), and Food Preparation & Serving (23 | 1.8%).
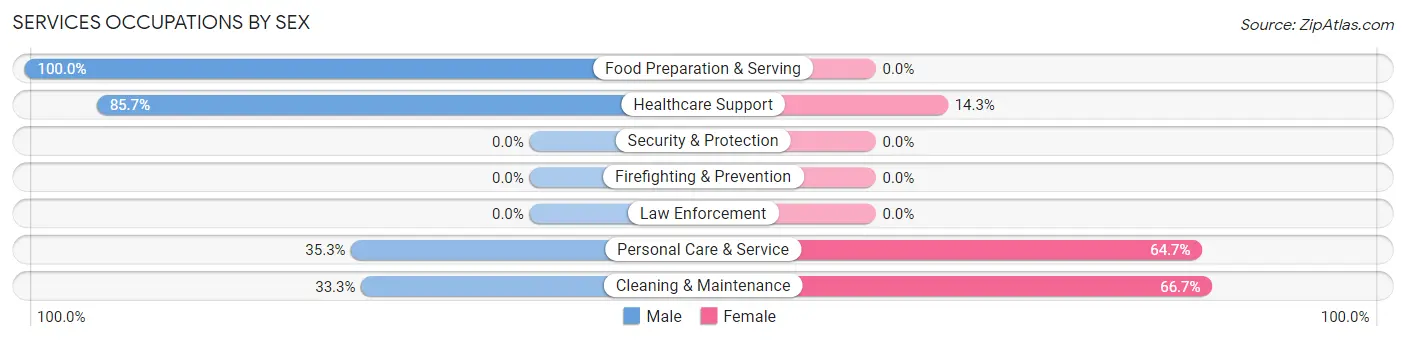
Services Occupations by Sex
Within the Services occupations in Bethlehem, the most male-oriented occupations are Food Preparation & Serving (100.0%), Healthcare Support (85.7%), and Personal Care & Service (35.3%), while the most female-oriented occupations are Cleaning & Maintenance (66.7%), Personal Care & Service (64.7%), and Healthcare Support (14.3%).
| Occupation | Male | Female |
| Healthcare Support | 24 (85.7%) | 4 (14.3%) |
| Security & Protection | 0 (0.0%) | 0 (0.0%) |
| Firefighting & Prevention | 0 (0.0%) | 0 (0.0%) |
| Law Enforcement | 0 (0.0%) | 0 (0.0%) |
| Food Preparation & Serving | 23 (100.0%) | 0 (0.0%) |
| Cleaning & Maintenance | 11 (33.3%) | 22 (66.7%) |
| Personal Care & Service | 18 (35.3%) | 33 (64.7%) |
| Total (Category) | 76 (56.3%) | 59 (43.7%) |
| Total (Overall) | 646 (51.5%) | 608 (48.5%) |
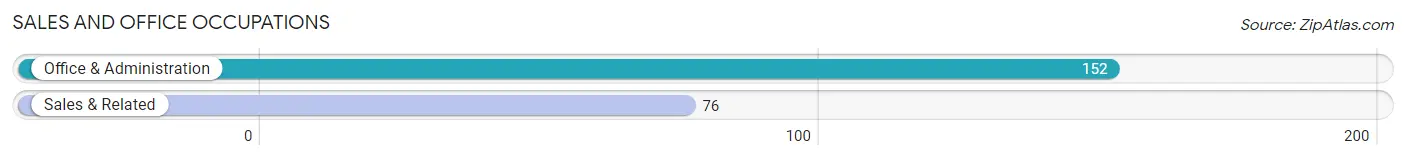
Sales and Office Occupations
The most common Sales and Office occupations in Bethlehem are Office & Administration (152 | 12.1%), and Sales & Related (76 | 6.1%).
Sales and Office Occupations by Sex
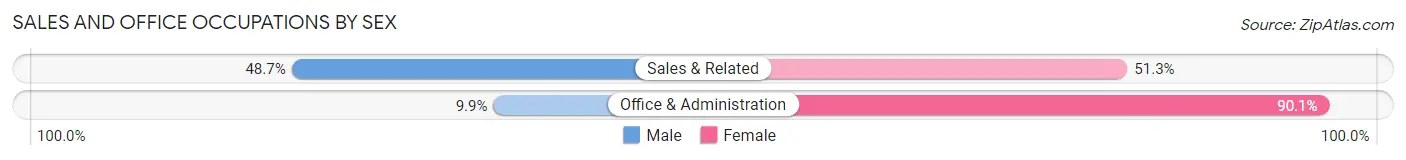
| Occupation | Male | Female |
| Sales & Related | 37 (48.7%) | 39 (51.3%) |
| Office & Administration | 15 (9.9%) | 137 (90.1%) |
| Total (Category) | 52 (22.8%) | 176 (77.2%) |
| Total (Overall) | 646 (51.5%) | 608 (48.5%) |
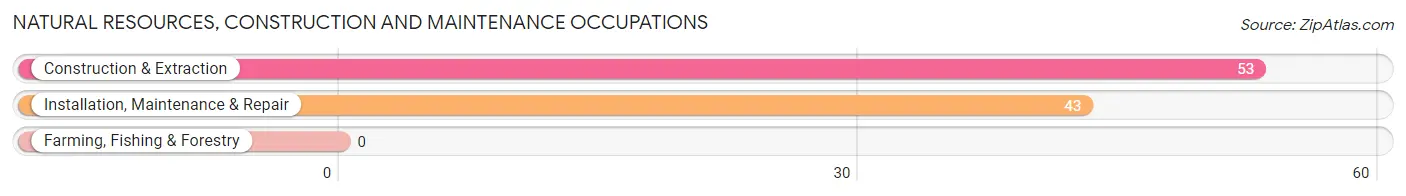
Natural Resources, Construction and Maintenance Occupations
The most common Natural Resources, Construction and Maintenance occupations in Bethlehem are Construction & Extraction (53 | 4.2%), and Installation, Maintenance & Repair (43 | 3.4%).
Natural Resources, Construction and Maintenance Occupations by Sex
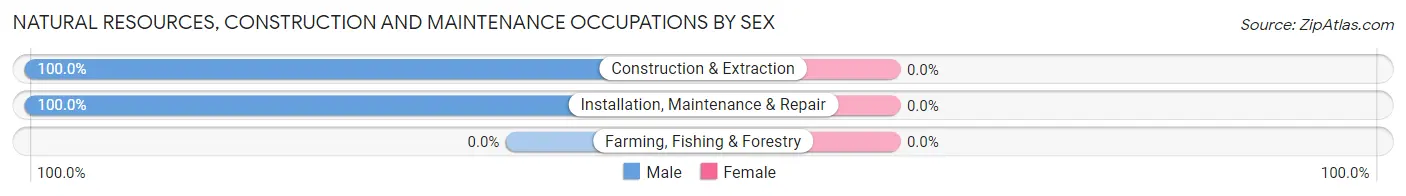
| Occupation | Male | Female |
| Farming, Fishing & Forestry | 0 (0.0%) | 0 (0.0%) |
| Construction & Extraction | 53 (100.0%) | 0 (0.0%) |
| Installation, Maintenance & Repair | 43 (100.0%) | 0 (0.0%) |
| Total (Category) | 96 (100.0%) | 0 (0.0%) |
| Total (Overall) | 646 (51.5%) | 608 (48.5%) |
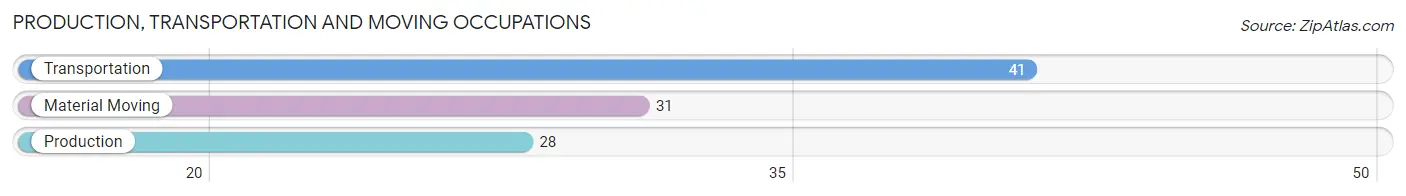
Production, Transportation and Moving Occupations
The most common Production, Transportation and Moving occupations in Bethlehem are Transportation (41 | 3.3%), Material Moving (31 | 2.5%), and Production (28 | 2.2%).
Production, Transportation and Moving Occupations by Sex
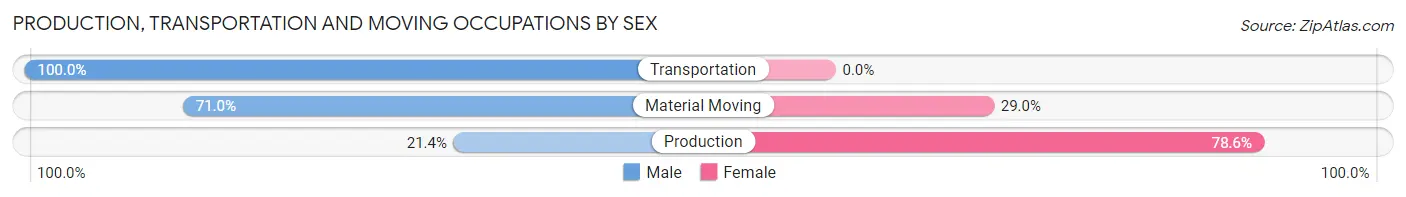
| Occupation | Male | Female |
| Production | 6 (21.4%) | 22 (78.6%) |
| Transportation | 41 (100.0%) | 0 (0.0%) |
| Material Moving | 22 (71.0%) | 9 (29.0%) |
| Total (Category) | 69 (69.0%) | 31 (31.0%) |
| Total (Overall) | 646 (51.5%) | 608 (48.5%) |
Employment Industries by Sex in Bethlehem
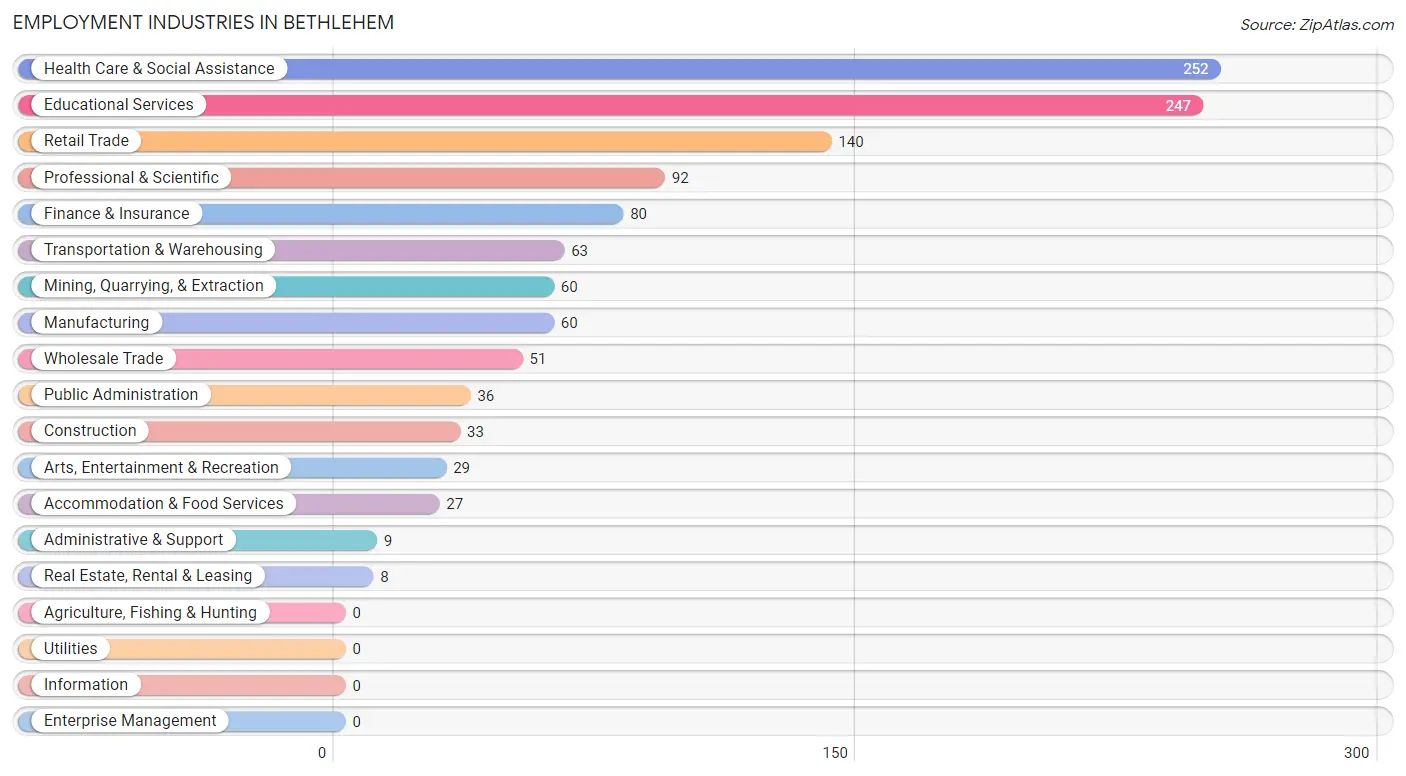
Employment Industries in Bethlehem
The major employment industries in Bethlehem include Health Care & Social Assistance (252 | 20.1%), Educational Services (247 | 19.7%), Retail Trade (140 | 11.2%), Professional & Scientific (92 | 7.3%), and Finance & Insurance (80 | 6.4%).
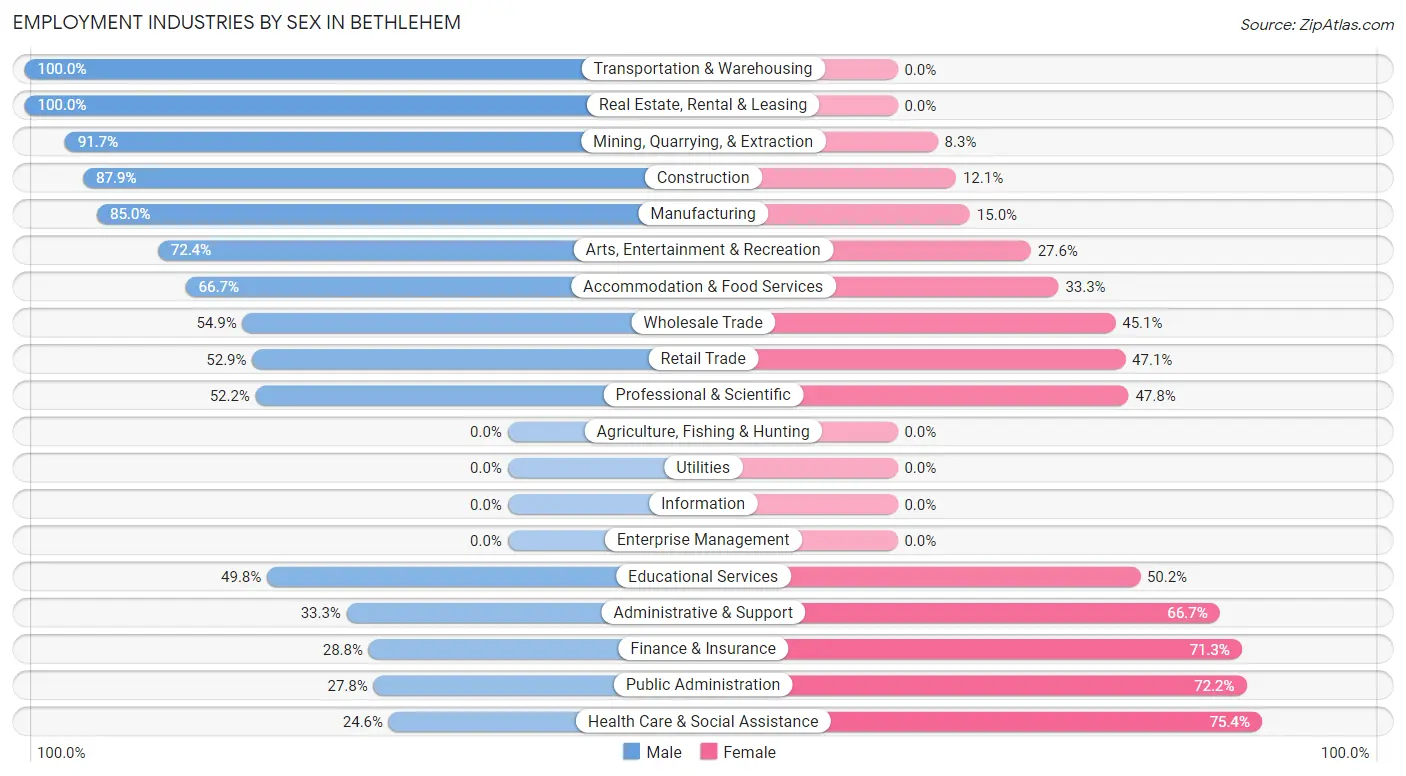
Employment Industries by Sex in Bethlehem
The Bethlehem industries that see more men than women are Transportation & Warehousing (100.0%), Real Estate, Rental & Leasing (100.0%), and Mining, Quarrying, & Extraction (91.7%), whereas the industries that tend to have a higher number of women are Health Care & Social Assistance (75.4%), Public Administration (72.2%), and Finance & Insurance (71.3%).
| Industry | Male | Female |
| Agriculture, Fishing & Hunting | 0 (0.0%) | 0 (0.0%) |
| Mining, Quarrying, & Extraction | 55 (91.7%) | 5 (8.3%) |
| Construction | 29 (87.9%) | 4 (12.1%) |
| Manufacturing | 51 (85.0%) | 9 (15.0%) |
| Wholesale Trade | 28 (54.9%) | 23 (45.1%) |
| Retail Trade | 74 (52.9%) | 66 (47.1%) |
| Transportation & Warehousing | 63 (100.0%) | 0 (0.0%) |
| Utilities | 0 (0.0%) | 0 (0.0%) |
| Information | 0 (0.0%) | 0 (0.0%) |
| Finance & Insurance | 23 (28.7%) | 57 (71.3%) |
| Real Estate, Rental & Leasing | 8 (100.0%) | 0 (0.0%) |
| Professional & Scientific | 48 (52.2%) | 44 (47.8%) |
| Enterprise Management | 0 (0.0%) | 0 (0.0%) |
| Administrative & Support | 3 (33.3%) | 6 (66.7%) |
| Educational Services | 123 (49.8%) | 124 (50.2%) |
| Health Care & Social Assistance | 62 (24.6%) | 190 (75.4%) |
| Arts, Entertainment & Recreation | 21 (72.4%) | 8 (27.6%) |
| Accommodation & Food Services | 18 (66.7%) | 9 (33.3%) |
| Public Administration | 10 (27.8%) | 26 (72.2%) |
| Total | 646 (51.5%) | 608 (48.5%) |
Education in Bethlehem
School Enrollment in Bethlehem
The most common levels of schooling among the 562 students in Bethlehem are elementary school (202 | 35.9%), high school (122 | 21.7%), and middle school (115 | 20.5%).
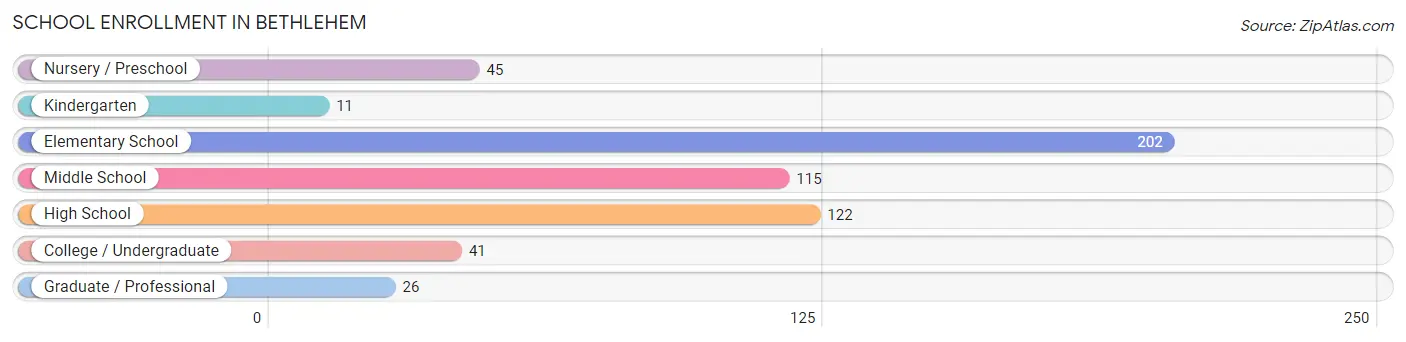
| School Level | # Students | % Students |
| Nursery / Preschool | 45 | 8.0% |
| Kindergarten | 11 | 2.0% |
| Elementary School | 202 | 35.9% |
| Middle School | 115 | 20.5% |
| High School | 122 | 21.7% |
| College / Undergraduate | 41 | 7.3% |
| Graduate / Professional | 26 | 4.6% |
| Total | 562 | 100.0% |
School Enrollment by Age by Funding Source in Bethlehem
Out of a total of 562 students who are enrolled in schools in Bethlehem, 148 (26.3%) attend a private institution, while the remaining 414 (73.7%) are enrolled in public schools. The age group of 3 to 4 year olds has the highest likelihood of being enrolled in private schools, with 32 (78.0% in the age bracket) enrolled. Conversely, the age group of 20 to 24 year olds has the lowest likelihood of being enrolled in a private school, with 27 (100.0% in the age bracket) attending a public institution.
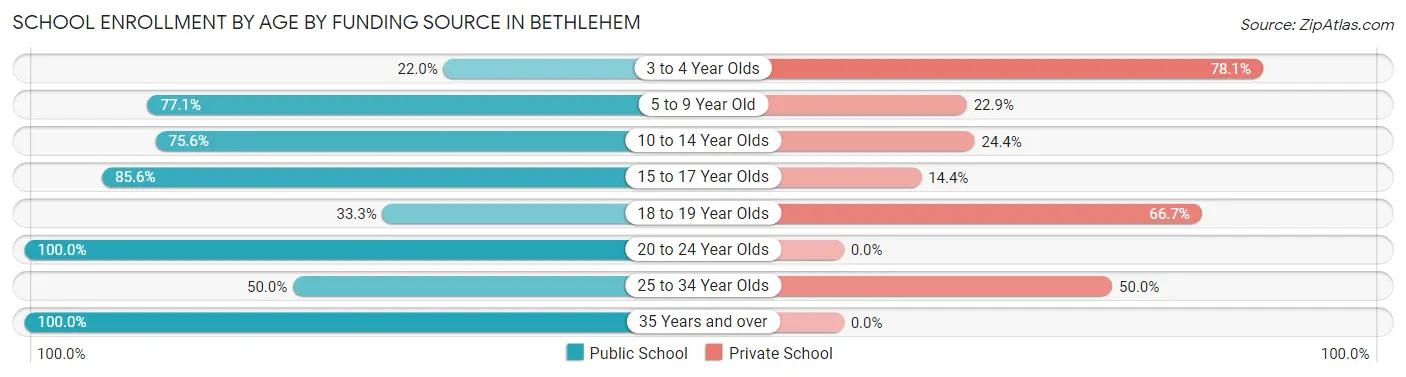
| Age Bracket | Public School | Private School |
| 3 to 4 Year Olds | 9 (22.0%) | 32 (78.0%) |
| 5 to 9 Year Old | 148 (77.1%) | 44 (22.9%) |
| 10 to 14 Year Olds | 124 (75.6%) | 40 (24.4%) |
| 15 to 17 Year Olds | 77 (85.6%) | 13 (14.4%) |
| 18 to 19 Year Olds | 5 (33.3%) | 10 (66.7%) |
| 20 to 24 Year Olds | 27 (100.0%) | 0 (0.0%) |
| 25 to 34 Year Olds | 9 (50.0%) | 9 (50.0%) |
| 35 Years and over | 15 (100.0%) | 0 (0.0%) |
| Total | 414 (73.7%) | 148 (26.3%) |
Educational Attainment by Field of Study in Bethlehem
Education (187 | 19.6%), science & technology (170 | 17.8%), business (142 | 14.8%), arts & humanities (74 | 7.7%), and communications (60 | 6.3%) are the most common fields of study among 956 individuals in Bethlehem who have obtained a bachelor's degree or higher.
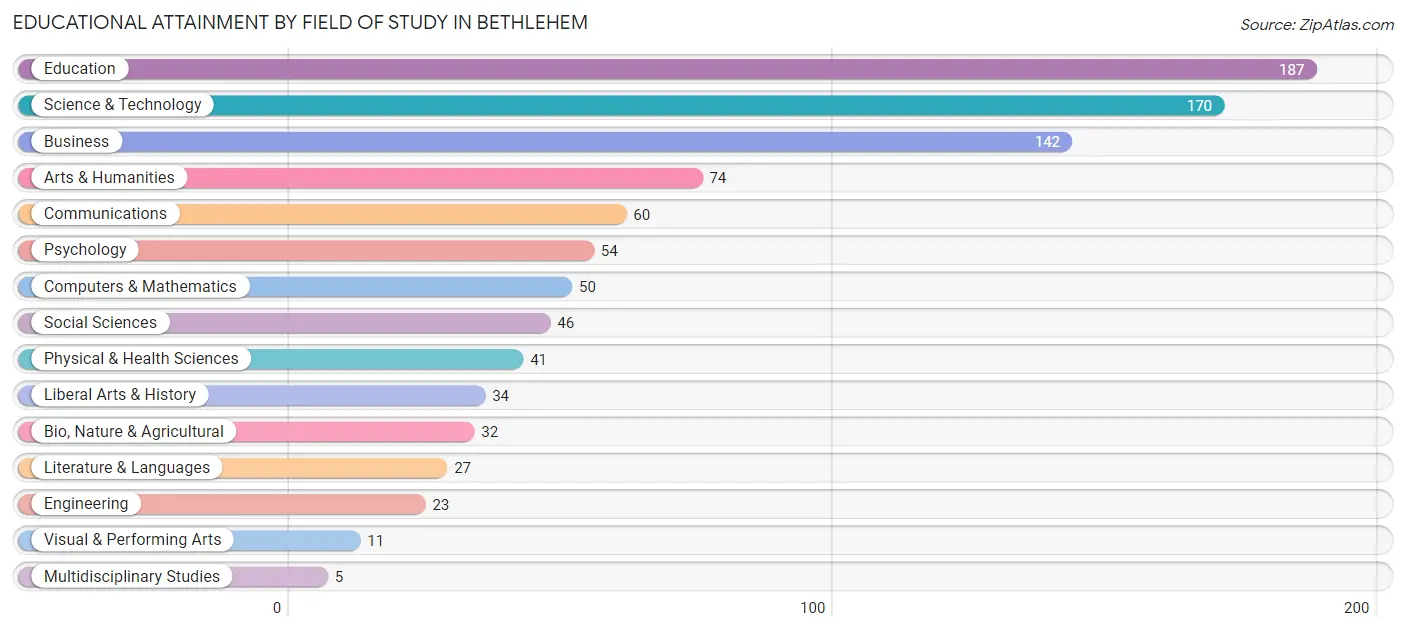
| Field of Study | # Graduates | % Graduates |
| Computers & Mathematics | 50 | 5.2% |
| Bio, Nature & Agricultural | 32 | 3.4% |
| Physical & Health Sciences | 41 | 4.3% |
| Psychology | 54 | 5.7% |
| Social Sciences | 46 | 4.8% |
| Engineering | 23 | 2.4% |
| Multidisciplinary Studies | 5 | 0.5% |
| Science & Technology | 170 | 17.8% |
| Business | 142 | 14.8% |
| Education | 187 | 19.6% |
| Literature & Languages | 27 | 2.8% |
| Liberal Arts & History | 34 | 3.6% |
| Visual & Performing Arts | 11 | 1.1% |
| Communications | 60 | 6.3% |
| Arts & Humanities | 74 | 7.7% |
| Total | 956 | 100.0% |
Transportation & Commute in Bethlehem
Vehicle Availability by Sex in Bethlehem
The most prevalent vehicle ownership categories in Bethlehem are males with 2 vehicles (367, accounting for 58.0%) and females with 2 vehicles (291, making up 62.6%).
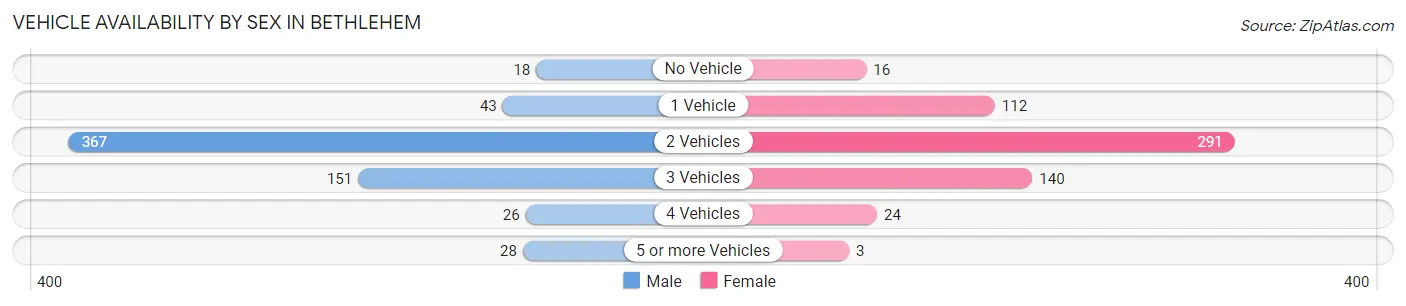
| Vehicles Available | Male | Female |
| No Vehicle | 18 (2.8%) | 16 (2.7%) |
| 1 Vehicle | 43 (6.8%) | 112 (19.1%) |
| 2 Vehicles | 367 (58.0%) | 291 (49.7%) |
| 3 Vehicles | 151 (23.8%) | 140 (23.9%) |
| 4 Vehicles | 26 (4.1%) | 24 (4.1%) |
| 5 or more Vehicles | 28 (4.4%) | 3 (0.5%) |
| Total | 633 (100.0%) | 586 (100.0%) |
Commute Time in Bethlehem
The most frequently occuring commute durations in Bethlehem are 10 to 14 minutes (283 commuters, 25.2%), 5 to 9 minutes (217 commuters, 19.3%), and 15 to 19 minutes (211 commuters, 18.8%).
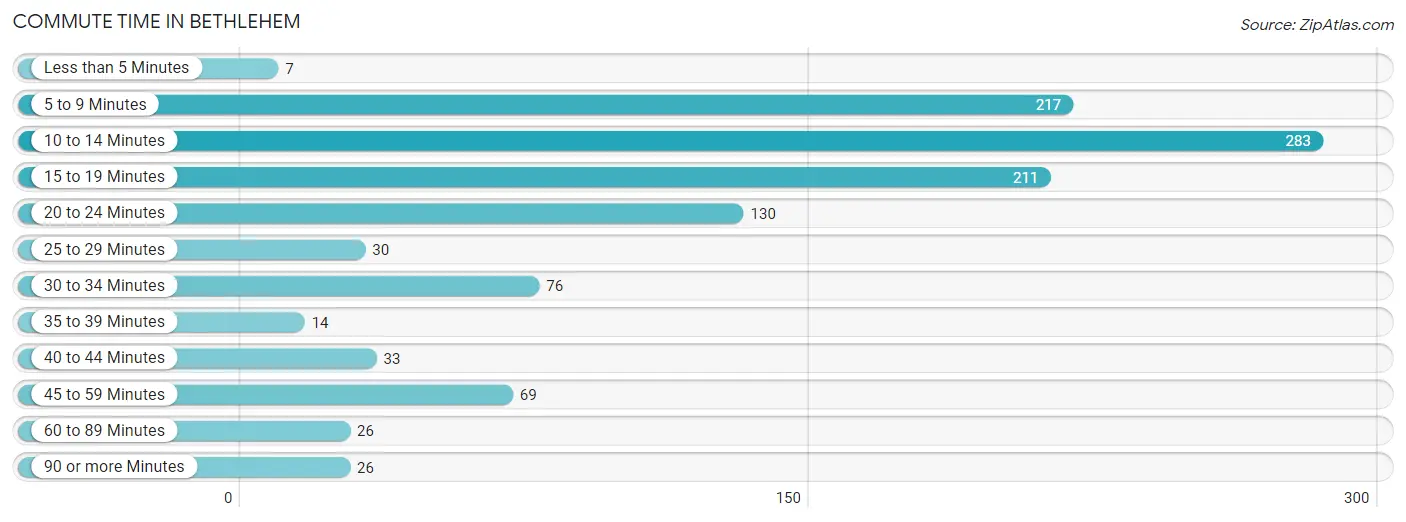
| Commute Time | # Commuters | % Commuters |
| Less than 5 Minutes | 7 | 0.6% |
| 5 to 9 Minutes | 217 | 19.3% |
| 10 to 14 Minutes | 283 | 25.2% |
| 15 to 19 Minutes | 211 | 18.8% |
| 20 to 24 Minutes | 130 | 11.6% |
| 25 to 29 Minutes | 30 | 2.7% |
| 30 to 34 Minutes | 76 | 6.8% |
| 35 to 39 Minutes | 14 | 1.3% |
| 40 to 44 Minutes | 33 | 2.9% |
| 45 to 59 Minutes | 69 | 6.1% |
| 60 to 89 Minutes | 26 | 2.3% |
| 90 or more Minutes | 26 | 2.3% |
Commute Time by Sex in Bethlehem
The most common commute times in Bethlehem are 5 to 9 minutes (101 commuters, 17.0%) for males and 10 to 14 minutes (182 commuters, 34.5%) for females.
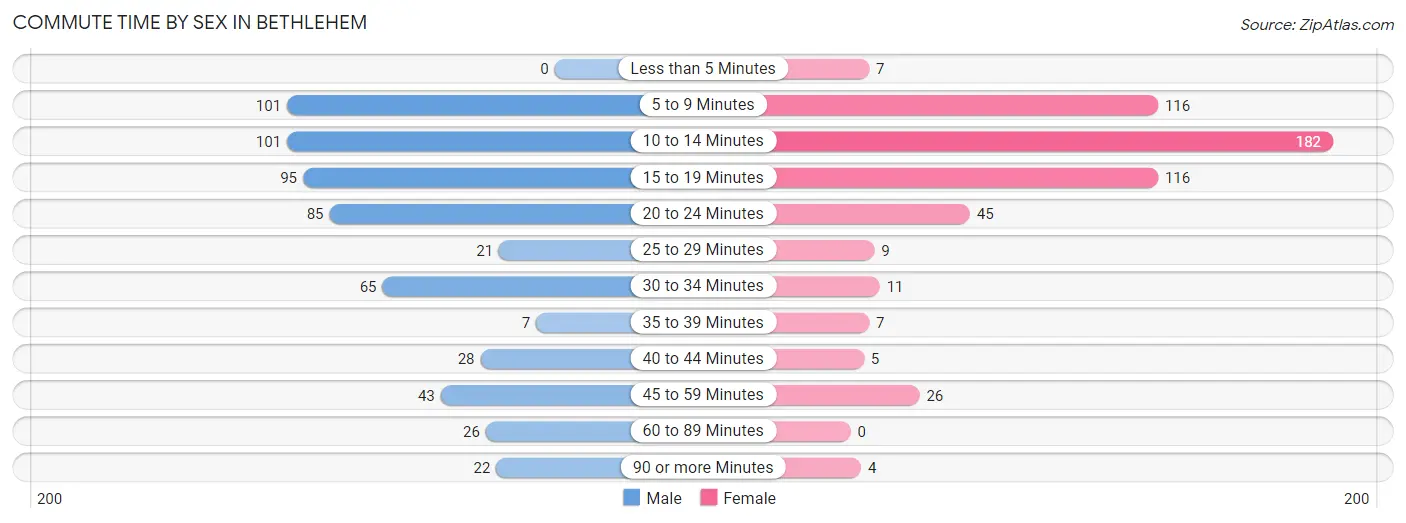
| Commute Time | Male | Female |
| Less than 5 Minutes | 0 (0.0%) | 7 (1.3%) |
| 5 to 9 Minutes | 101 (17.0%) | 116 (22.0%) |
| 10 to 14 Minutes | 101 (17.0%) | 182 (34.5%) |
| 15 to 19 Minutes | 95 (16.0%) | 116 (22.0%) |
| 20 to 24 Minutes | 85 (14.3%) | 45 (8.5%) |
| 25 to 29 Minutes | 21 (3.5%) | 9 (1.7%) |
| 30 to 34 Minutes | 65 (10.9%) | 11 (2.1%) |
| 35 to 39 Minutes | 7 (1.2%) | 7 (1.3%) |
| 40 to 44 Minutes | 28 (4.7%) | 5 (0.9%) |
| 45 to 59 Minutes | 43 (7.2%) | 26 (4.9%) |
| 60 to 89 Minutes | 26 (4.4%) | 0 (0.0%) |
| 90 or more Minutes | 22 (3.7%) | 4 (0.8%) |
Time of Departure to Work by Sex in Bethlehem
The most frequent times of departure to work in Bethlehem are 6:30 AM to 6:59 AM (132, 22.2%) for males and 7:30 AM to 7:59 AM (228, 43.2%) for females.
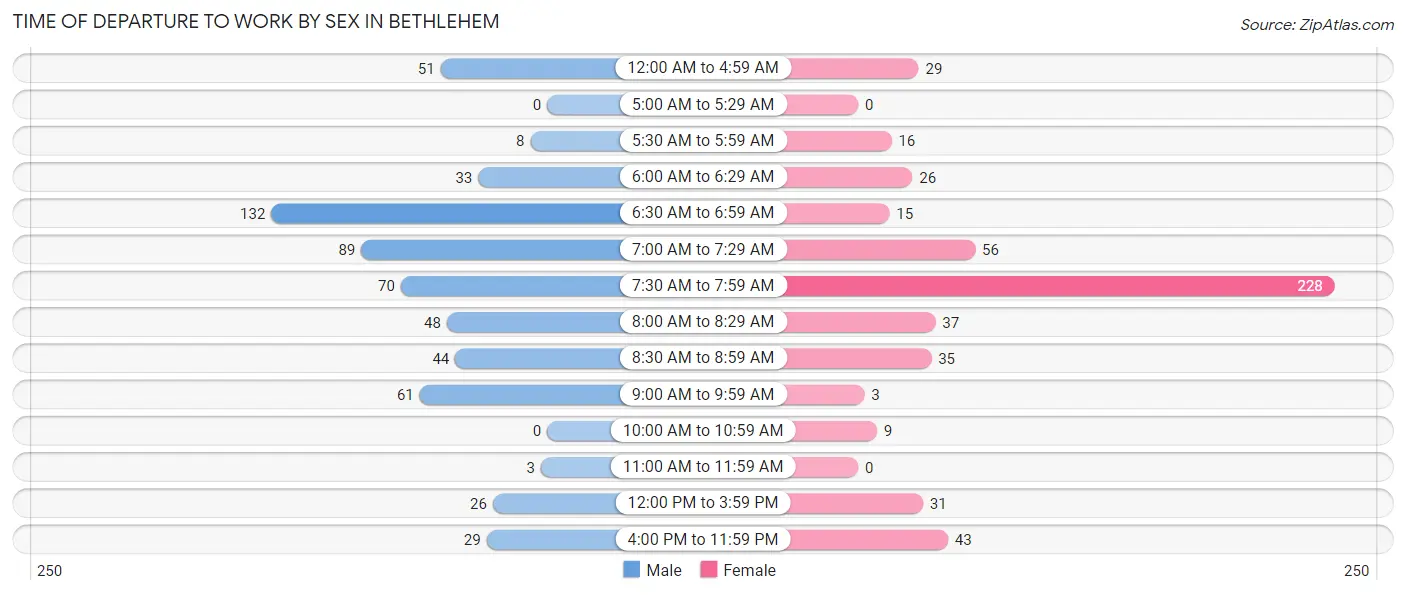
| Time of Departure | Male | Female |
| 12:00 AM to 4:59 AM | 51 (8.6%) | 29 (5.5%) |
| 5:00 AM to 5:29 AM | 0 (0.0%) | 0 (0.0%) |
| 5:30 AM to 5:59 AM | 8 (1.3%) | 16 (3.0%) |
| 6:00 AM to 6:29 AM | 33 (5.6%) | 26 (4.9%) |
| 6:30 AM to 6:59 AM | 132 (22.2%) | 15 (2.8%) |
| 7:00 AM to 7:29 AM | 89 (15.0%) | 56 (10.6%) |
| 7:30 AM to 7:59 AM | 70 (11.8%) | 228 (43.2%) |
| 8:00 AM to 8:29 AM | 48 (8.1%) | 37 (7.0%) |
| 8:30 AM to 8:59 AM | 44 (7.4%) | 35 (6.6%) |
| 9:00 AM to 9:59 AM | 61 (10.3%) | 3 (0.6%) |
| 10:00 AM to 10:59 AM | 0 (0.0%) | 9 (1.7%) |
| 11:00 AM to 11:59 AM | 3 (0.5%) | 0 (0.0%) |
| 12:00 PM to 3:59 PM | 26 (4.4%) | 31 (5.9%) |
| 4:00 PM to 11:59 PM | 29 (4.9%) | 43 (8.1%) |
| Total | 594 (100.0%) | 528 (100.0%) |
Housing Occupancy in Bethlehem
Occupancy by Ownership in Bethlehem
Of the total 1,061 dwellings in Bethlehem, owner-occupied units account for 912 (86.0%), while renter-occupied units make up 149 (14.0%).
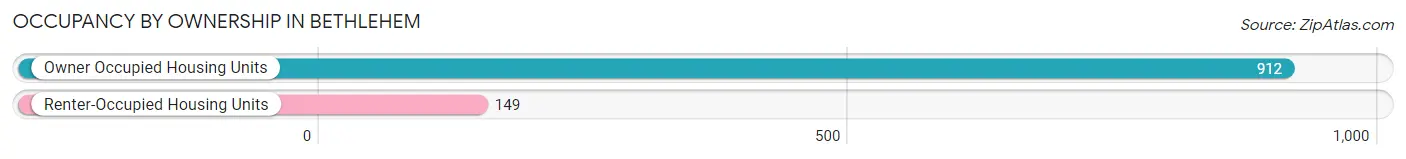
| Occupancy | # Housing Units | % Housing Units |
| Owner Occupied Housing Units | 912 | 86.0% |
| Renter-Occupied Housing Units | 149 | 14.0% |
| Total Occupied Housing Units | 1,061 | 100.0% |
Occupancy by Household Size in Bethlehem
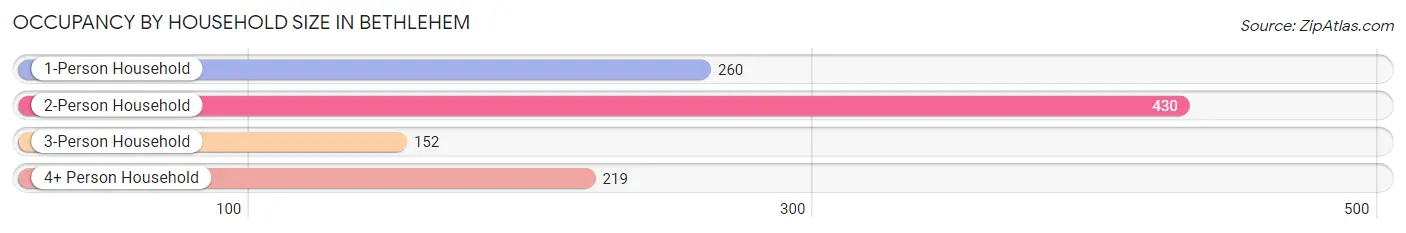
| Household Size | # Housing Units | % Housing Units |
| 1-Person Household | 260 | 24.5% |
| 2-Person Household | 430 | 40.5% |
| 3-Person Household | 152 | 14.3% |
| 4+ Person Household | 219 | 20.6% |
| Total Housing Units | 1,061 | 100.0% |
Occupancy by Ownership by Household Size in Bethlehem
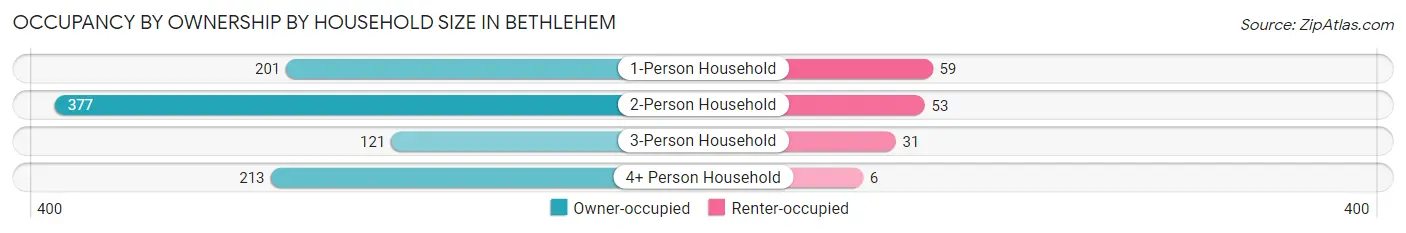
| Household Size | Owner-occupied | Renter-occupied |
| 1-Person Household | 201 (77.3%) | 59 (22.7%) |
| 2-Person Household | 377 (87.7%) | 53 (12.3%) |
| 3-Person Household | 121 (79.6%) | 31 (20.4%) |
| 4+ Person Household | 213 (97.3%) | 6 (2.7%) |
| Total Housing Units | 912 (86.0%) | 149 (14.0%) |
Occupancy by Educational Attainment in Bethlehem
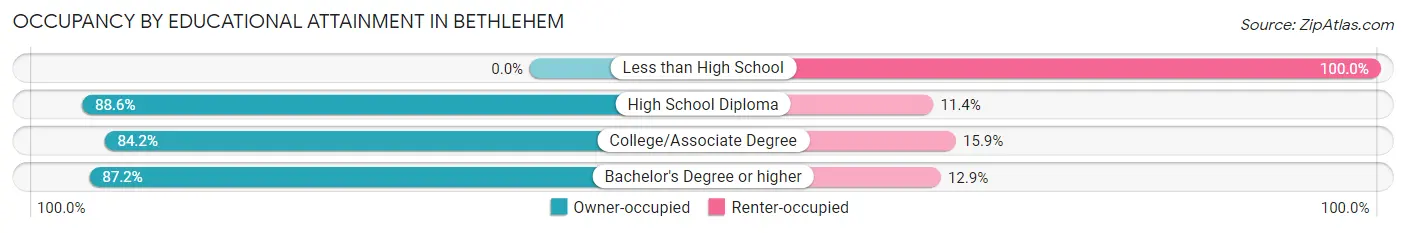
| Household Size | Owner-occupied | Renter-occupied |
| Less than High School | 0 (0.0%) | 6 (100.0%) |
| High School Diploma | 179 (88.6%) | 23 (11.4%) |
| College/Associate Degree | 292 (84.2%) | 55 (15.9%) |
| Bachelor's Degree or higher | 441 (87.2%) | 65 (12.9%) |
Occupancy by Age of Householder in Bethlehem
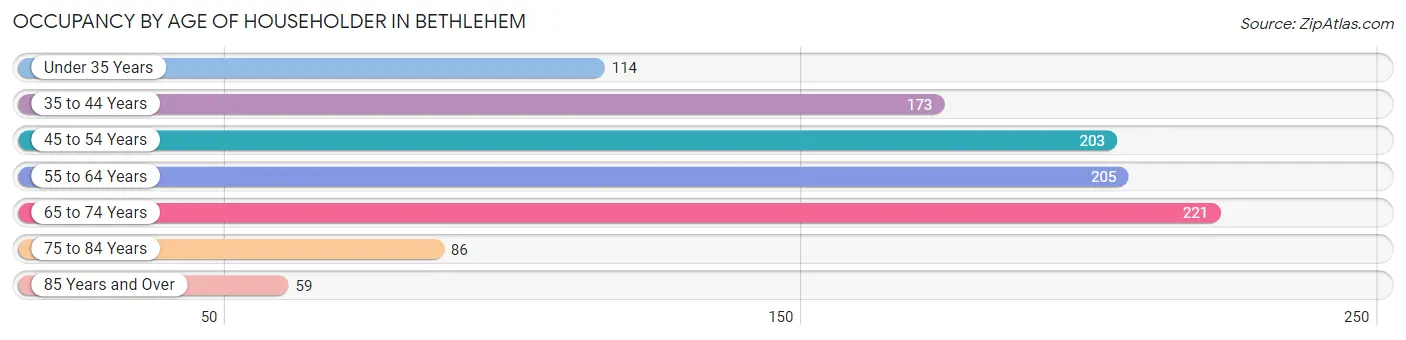
| Age Bracket | # Households | % Households |
| Under 35 Years | 114 | 10.7% |
| 35 to 44 Years | 173 | 16.3% |
| 45 to 54 Years | 203 | 19.1% |
| 55 to 64 Years | 205 | 19.3% |
| 65 to 74 Years | 221 | 20.8% |
| 75 to 84 Years | 86 | 8.1% |
| 85 Years and Over | 59 | 5.6% |
| Total | 1,061 | 100.0% |
Housing Finances in Bethlehem
Median Income by Occupancy in Bethlehem
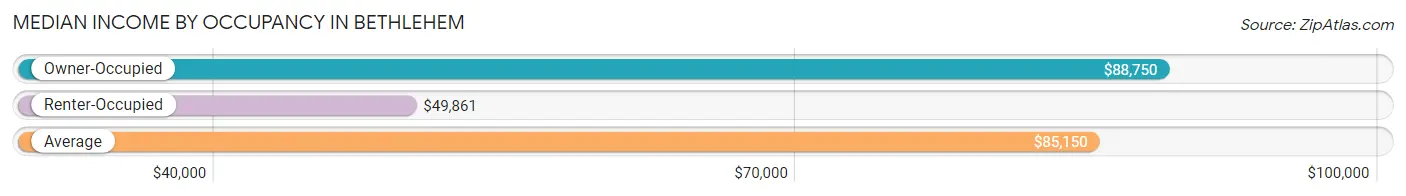
| Occupancy Type | # Households | Median Income |
| Owner-Occupied | 912 (86.0%) | $88,750 |
| Renter-Occupied | 149 (14.0%) | $49,861 |
| Average | 1,061 (100.0%) | $85,150 |
Occupancy by Householder Income Bracket in Bethlehem
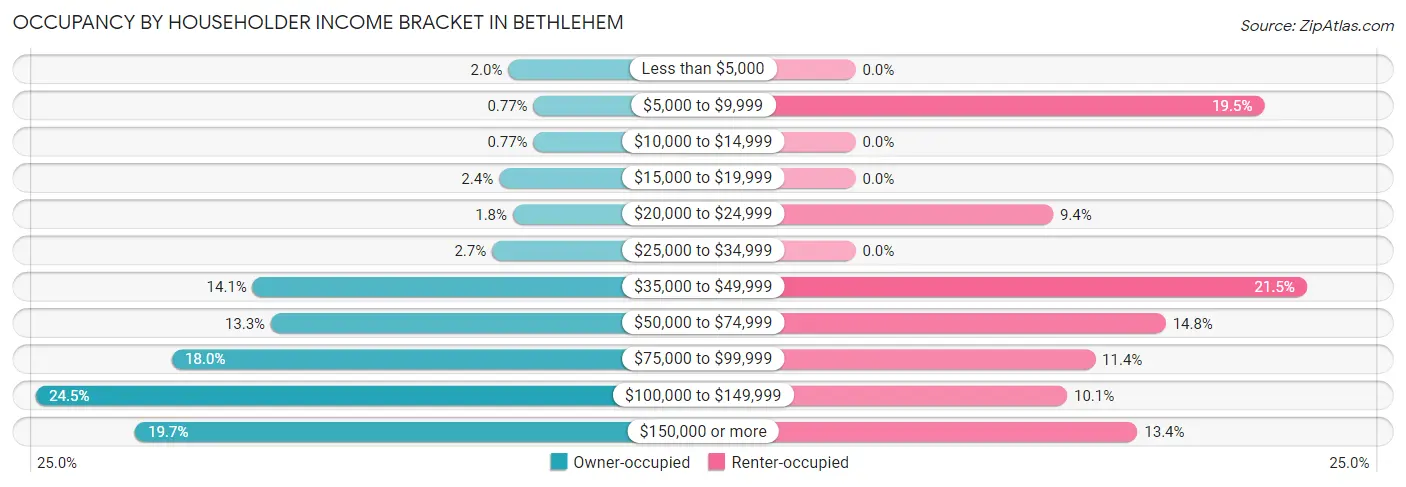
| Income Bracket | Owner-occupied | Renter-occupied |
| Less than $5,000 | 18 (2.0%) | 0 (0.0%) |
| $5,000 to $9,999 | 7 (0.8%) | 29 (19.5%) |
| $10,000 to $14,999 | 7 (0.8%) | 0 (0.0%) |
| $15,000 to $19,999 | 22 (2.4%) | 0 (0.0%) |
| $20,000 to $24,999 | 16 (1.8%) | 14 (9.4%) |
| $25,000 to $34,999 | 25 (2.7%) | 0 (0.0%) |
| $35,000 to $49,999 | 129 (14.1%) | 32 (21.5%) |
| $50,000 to $74,999 | 121 (13.3%) | 22 (14.8%) |
| $75,000 to $99,999 | 164 (18.0%) | 17 (11.4%) |
| $100,000 to $149,999 | 223 (24.4%) | 15 (10.1%) |
| $150,000 or more | 180 (19.7%) | 20 (13.4%) |
| Total | 912 (100.0%) | 149 (100.0%) |
Monthly Housing Cost Tiers in Bethlehem
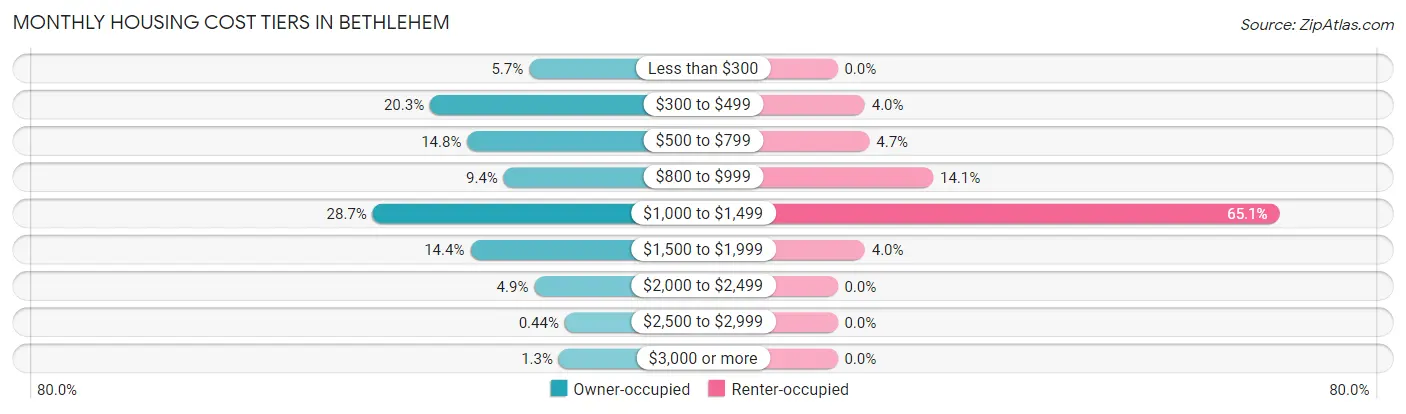
| Monthly Cost | Owner-occupied | Renter-occupied |
| Less than $300 | 52 (5.7%) | 0 (0.0%) |
| $300 to $499 | 185 (20.3%) | 6 (4.0%) |
| $500 to $799 | 135 (14.8%) | 7 (4.7%) |
| $800 to $999 | 86 (9.4%) | 21 (14.1%) |
| $1,000 to $1,499 | 262 (28.7%) | 97 (65.1%) |
| $1,500 to $1,999 | 131 (14.4%) | 6 (4.0%) |
| $2,000 to $2,499 | 45 (4.9%) | 0 (0.0%) |
| $2,500 to $2,999 | 4 (0.4%) | 0 (0.0%) |
| $3,000 or more | 12 (1.3%) | 0 (0.0%) |
| Total | 912 (100.0%) | 149 (100.0%) |
Physical Housing Characteristics in Bethlehem
Housing Structures in Bethlehem
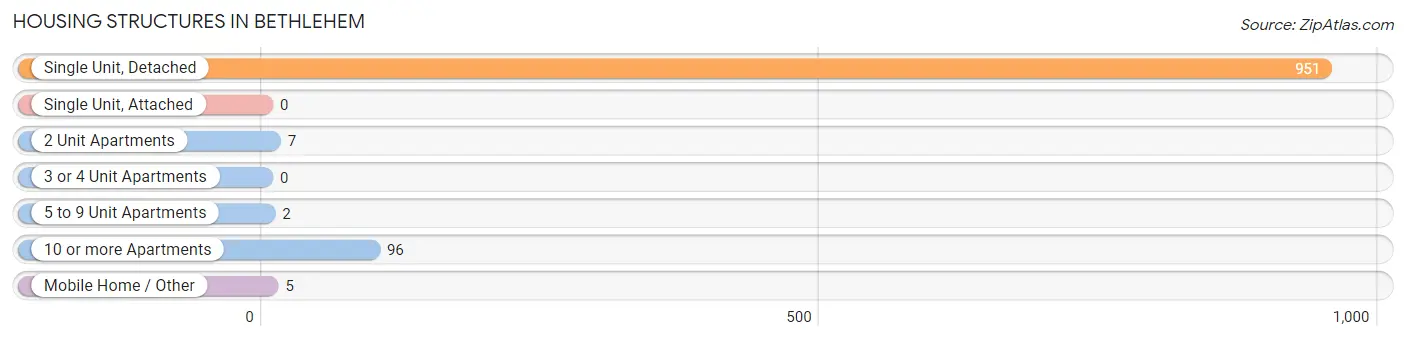
| Structure Type | # Housing Units | % Housing Units |
| Single Unit, Detached | 951 | 89.6% |
| Single Unit, Attached | 0 | 0.0% |
| 2 Unit Apartments | 7 | 0.7% |
| 3 or 4 Unit Apartments | 0 | 0.0% |
| 5 to 9 Unit Apartments | 2 | 0.2% |
| 10 or more Apartments | 96 | 9.0% |
| Mobile Home / Other | 5 | 0.5% |
| Total | 1,061 | 100.0% |
Housing Structures by Occupancy in Bethlehem
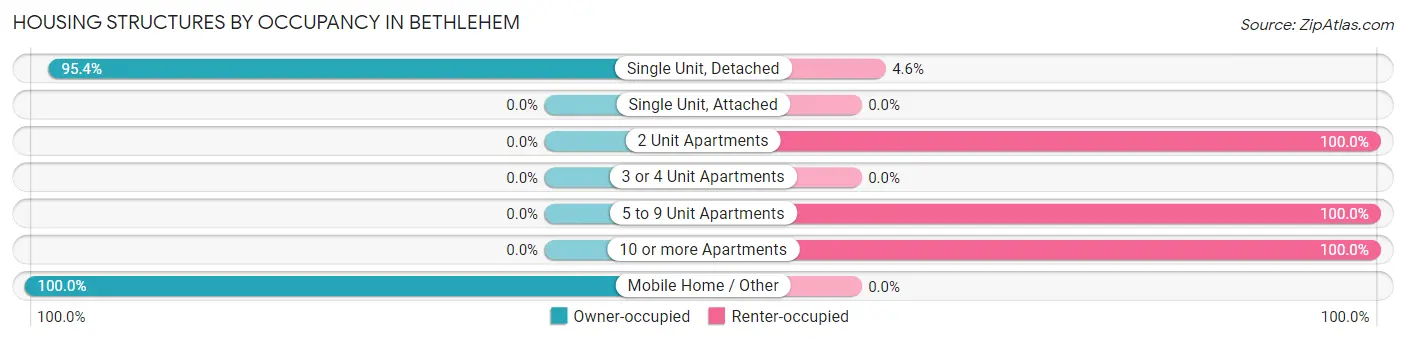
| Structure Type | Owner-occupied | Renter-occupied |
| Single Unit, Detached | 907 (95.4%) | 44 (4.6%) |
| Single Unit, Attached | 0 (0.0%) | 0 (0.0%) |
| 2 Unit Apartments | 0 (0.0%) | 7 (100.0%) |
| 3 or 4 Unit Apartments | 0 (0.0%) | 0 (0.0%) |
| 5 to 9 Unit Apartments | 0 (0.0%) | 2 (100.0%) |
| 10 or more Apartments | 0 (0.0%) | 96 (100.0%) |
| Mobile Home / Other | 5 (100.0%) | 0 (0.0%) |
| Total | 912 (86.0%) | 149 (14.0%) |
Housing Structures by Number of Rooms in Bethlehem
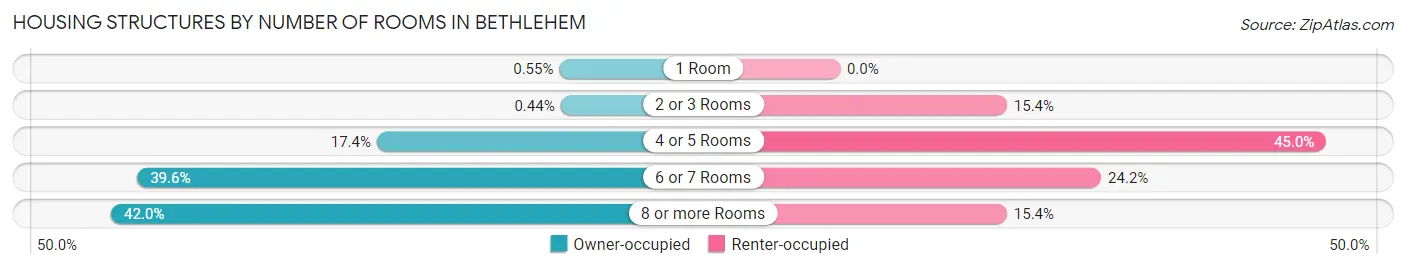
| Number of Rooms | Owner-occupied | Renter-occupied |
| 1 Room | 5 (0.5%) | 0 (0.0%) |
| 2 or 3 Rooms | 4 (0.4%) | 23 (15.4%) |
| 4 or 5 Rooms | 159 (17.4%) | 67 (45.0%) |
| 6 or 7 Rooms | 361 (39.6%) | 36 (24.2%) |
| 8 or more Rooms | 383 (42.0%) | 23 (15.4%) |
| Total | 912 (100.0%) | 149 (100.0%) |
Housing Structure by Heating Type in Bethlehem
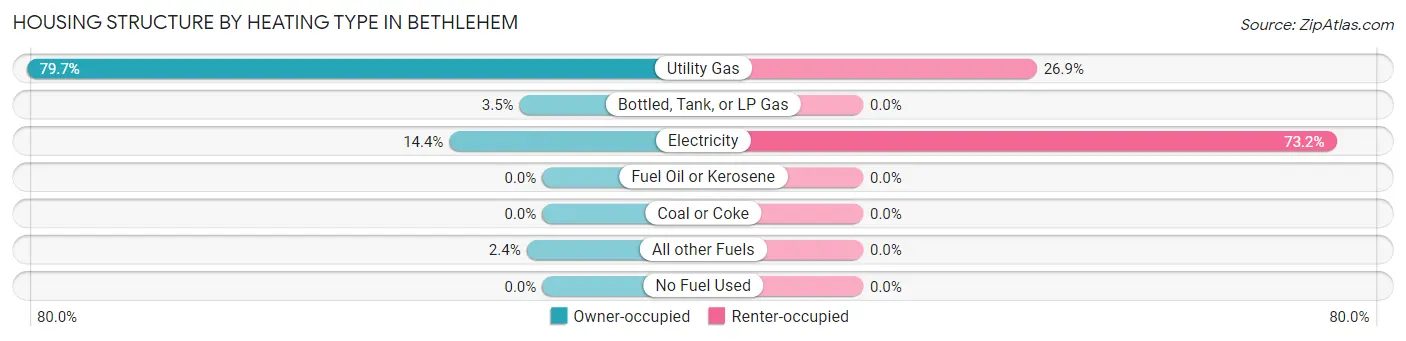
| Heating Type | Owner-occupied | Renter-occupied |
| Utility Gas | 727 (79.7%) | 40 (26.9%) |
| Bottled, Tank, or LP Gas | 32 (3.5%) | 0 (0.0%) |
| Electricity | 131 (14.4%) | 109 (73.2%) |
| Fuel Oil or Kerosene | 0 (0.0%) | 0 (0.0%) |
| Coal or Coke | 0 (0.0%) | 0 (0.0%) |
| All other Fuels | 22 (2.4%) | 0 (0.0%) |
| No Fuel Used | 0 (0.0%) | 0 (0.0%) |
| Total | 912 (100.0%) | 149 (100.0%) |
Household Vehicle Usage in Bethlehem
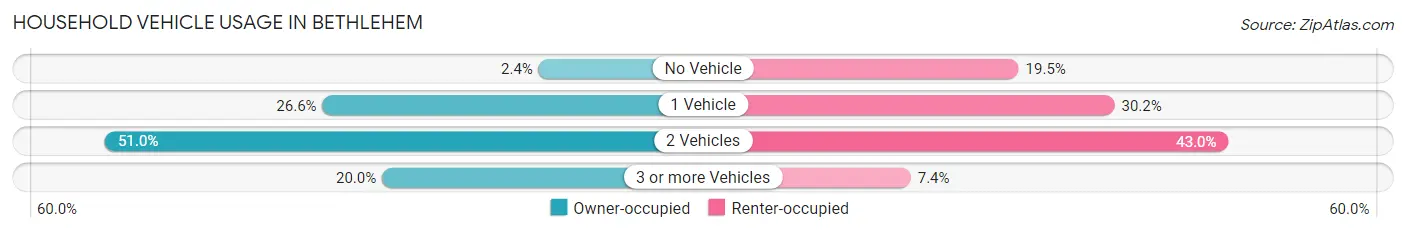
| Vehicles per Household | Owner-occupied | Renter-occupied |
| No Vehicle | 22 (2.4%) | 29 (19.5%) |
| 1 Vehicle | 243 (26.6%) | 45 (30.2%) |
| 2 Vehicles | 465 (51.0%) | 64 (42.9%) |
| 3 or more Vehicles | 182 (20.0%) | 11 (7.4%) |
| Total | 912 (100.0%) | 149 (100.0%) |
Real Estate & Mortgages in Bethlehem
Real Estate and Mortgage Overview in Bethlehem
| Characteristic | Without Mortgage | With Mortgage |
| Housing Units | 348 | 564 |
| Median Property Value | $174,300 | $200,000 |
| Median Household Income | $63,214 | $138 |
| Monthly Housing Costs | $446 | $12 |
| Real Estate Taxes | $1,151 | $3 |
Property Value by Mortgage Status in Bethlehem
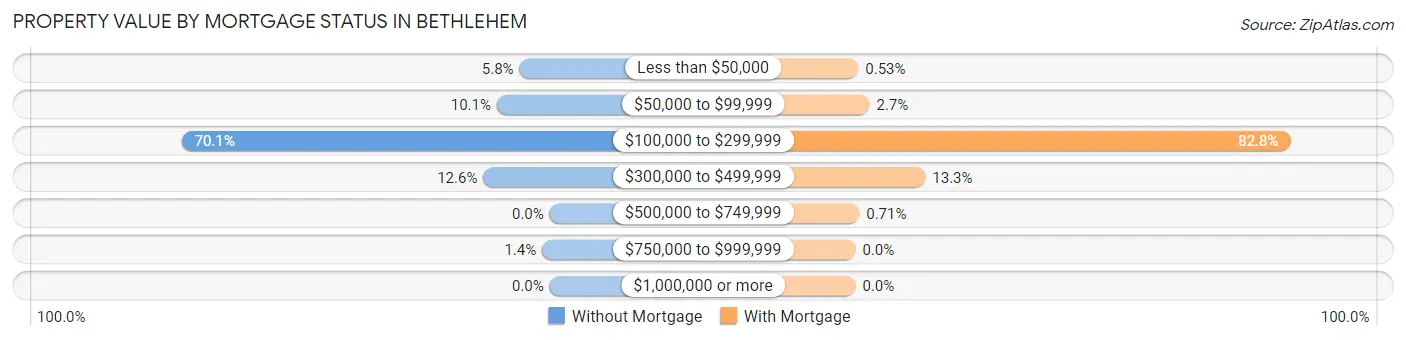
| Property Value | Without Mortgage | With Mortgage |
| Less than $50,000 | 20 (5.8%) | 3 (0.5%) |
| $50,000 to $99,999 | 35 (10.1%) | 15 (2.7%) |
| $100,000 to $299,999 | 244 (70.1%) | 467 (82.8%) |
| $300,000 to $499,999 | 44 (12.6%) | 75 (13.3%) |
| $500,000 to $749,999 | 0 (0.0%) | 4 (0.7%) |
| $750,000 to $999,999 | 5 (1.4%) | 0 (0.0%) |
| $1,000,000 or more | 0 (0.0%) | 0 (0.0%) |
| Total | 348 (100.0%) | 564 (100.0%) |
Household Income by Mortgage Status in Bethlehem
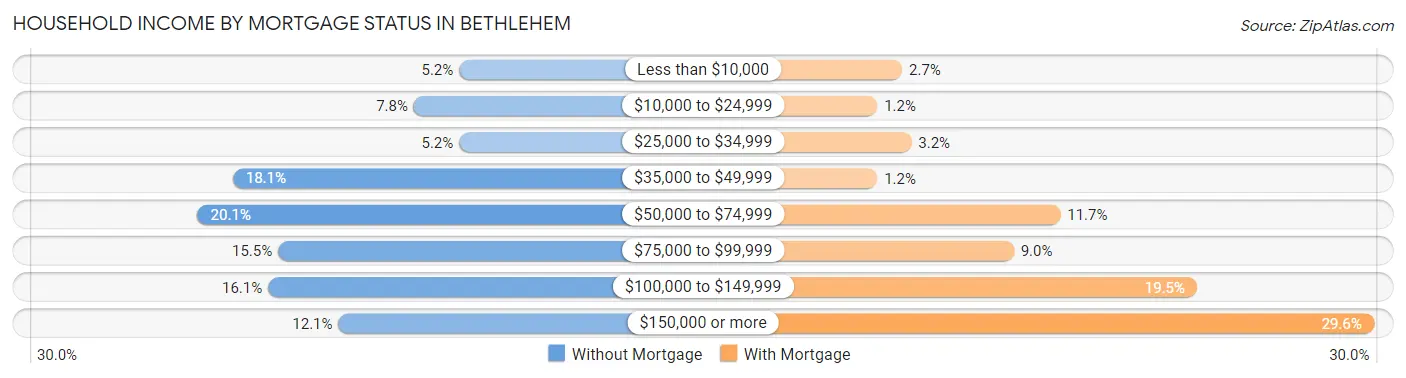
| Household Income | Without Mortgage | With Mortgage |
| Less than $10,000 | 18 (5.2%) | 15 (2.7%) |
| $10,000 to $24,999 | 27 (7.8%) | 7 (1.2%) |
| $25,000 to $34,999 | 18 (5.2%) | 18 (3.2%) |
| $35,000 to $49,999 | 63 (18.1%) | 7 (1.2%) |
| $50,000 to $74,999 | 70 (20.1%) | 66 (11.7%) |
| $75,000 to $99,999 | 54 (15.5%) | 51 (9.0%) |
| $100,000 to $149,999 | 56 (16.1%) | 110 (19.5%) |
| $150,000 or more | 42 (12.1%) | 167 (29.6%) |
| Total | 348 (100.0%) | 564 (100.0%) |
Property Value to Household Income Ratio in Bethlehem
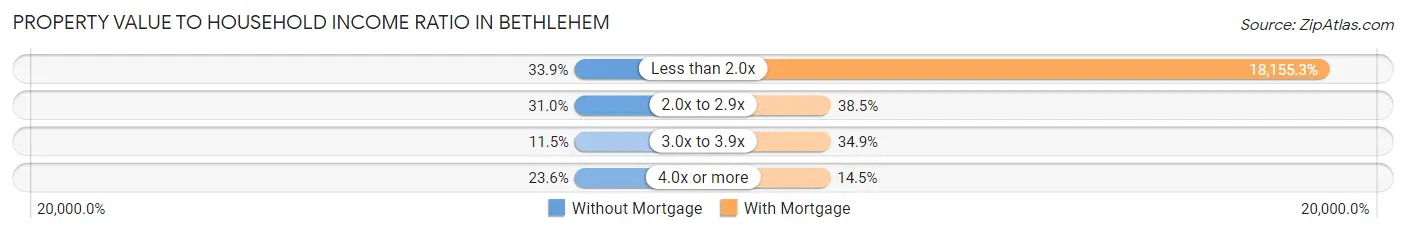
| Value-to-Income Ratio | Without Mortgage | With Mortgage |
| Less than 2.0x | 118 (33.9%) | 102,396 (18,155.3%) |
| 2.0x to 2.9x | 108 (31.0%) | 217 (38.5%) |
| 3.0x to 3.9x | 40 (11.5%) | 197 (34.9%) |
| 4.0x or more | 82 (23.6%) | 82 (14.5%) |
| Total | 348 (100.0%) | 564 (100.0%) |
Real Estate Taxes by Mortgage Status in Bethlehem
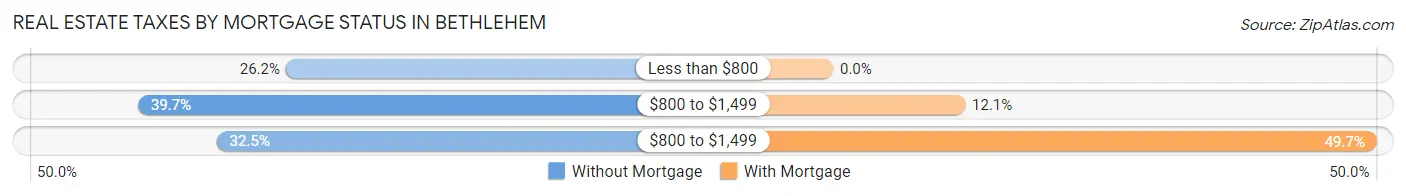
| Property Taxes | Without Mortgage | With Mortgage |
| Less than $800 | 91 (26.2%) | 0 (0.0%) |
| $800 to $1,499 | 138 (39.7%) | 68 (12.1%) |
| $800 to $1,499 | 113 (32.5%) | 280 (49.6%) |
| Total | 348 (100.0%) | 564 (100.0%) |
Health & Disability in Bethlehem
Health Insurance Coverage by Age in Bethlehem
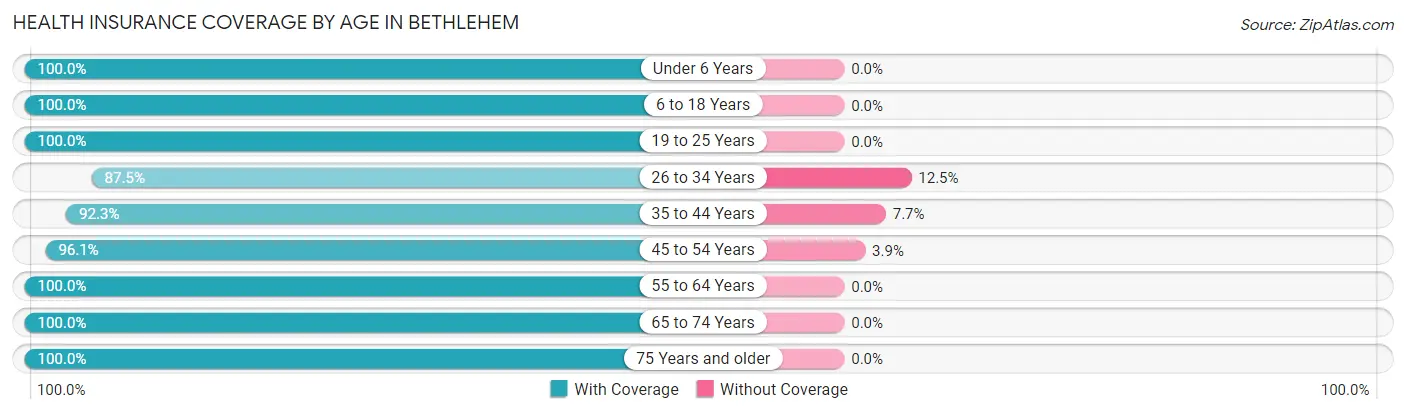
| Age Bracket | With Coverage | Without Coverage |
| Under 6 Years | 197 (100.0%) | 0 (0.0%) |
| 6 to 18 Years | 441 (100.0%) | 0 (0.0%) |
| 19 to 25 Years | 114 (100.0%) | 0 (0.0%) |
| 26 to 34 Years | 224 (87.5%) | 32 (12.5%) |
| 35 to 44 Years | 310 (92.3%) | 26 (7.7%) |
| 45 to 54 Years | 321 (96.1%) | 13 (3.9%) |
| 55 to 64 Years | 332 (100.0%) | 0 (0.0%) |
| 65 to 74 Years | 330 (100.0%) | 0 (0.0%) |
| 75 Years and older | 237 (100.0%) | 0 (0.0%) |
| Total | 2,506 (97.2%) | 71 (2.8%) |
Health Insurance Coverage by Citizenship Status in Bethlehem
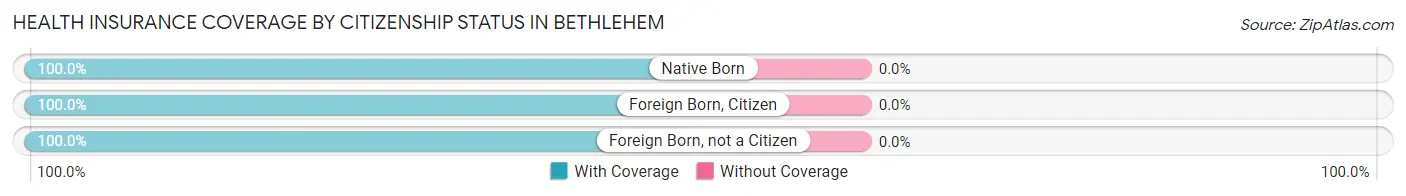
| Citizenship Status | With Coverage | Without Coverage |
| Native Born | 197 (100.0%) | 0 (0.0%) |
| Foreign Born, Citizen | 441 (100.0%) | 0 (0.0%) |
| Foreign Born, not a Citizen | 114 (100.0%) | 0 (0.0%) |
Health Insurance Coverage by Household Income in Bethlehem
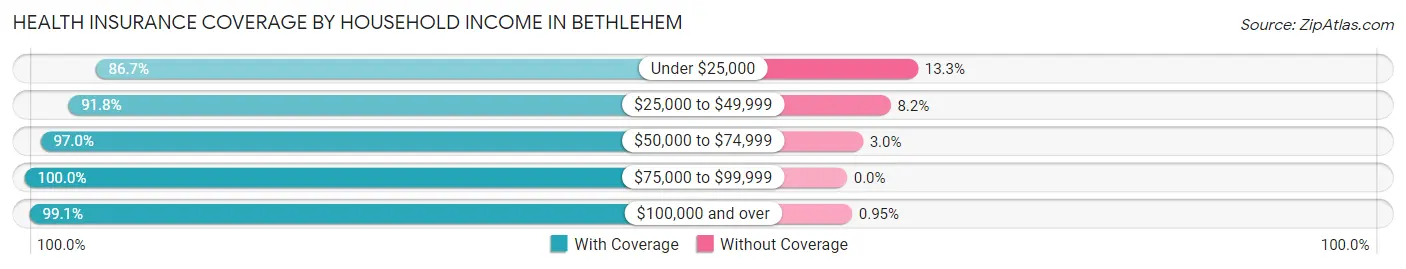
| Household Income | With Coverage | Without Coverage |
| Under $25,000 | 163 (86.7%) | 25 (13.3%) |
| $25,000 to $49,999 | 292 (91.8%) | 26 (8.2%) |
| $50,000 to $74,999 | 228 (97.0%) | 7 (3.0%) |
| $75,000 to $99,999 | 465 (100.0%) | 0 (0.0%) |
| $100,000 and over | 1,358 (99.1%) | 13 (0.9%) |
Public vs Private Health Insurance Coverage by Age in Bethlehem
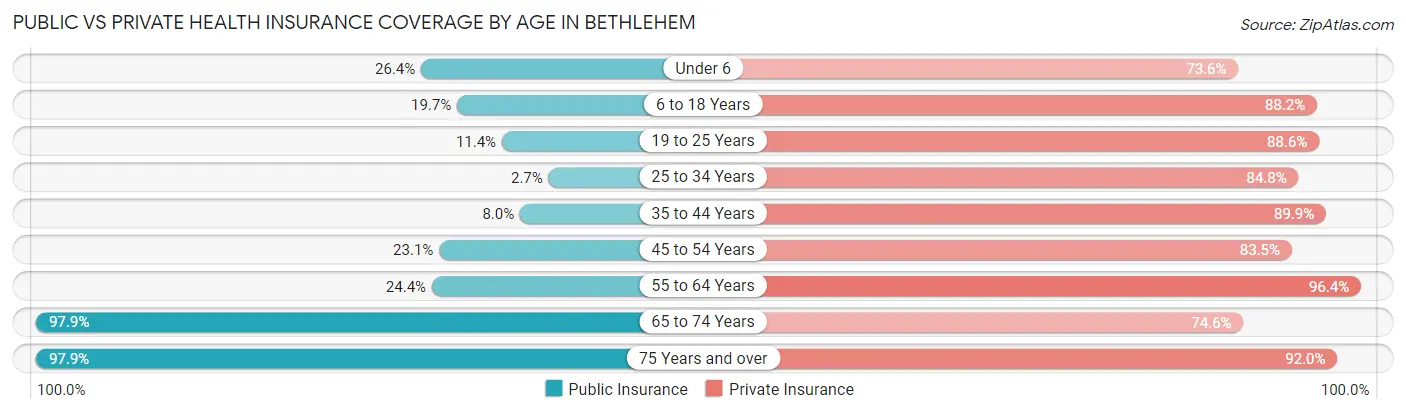
| Age Bracket | Public Insurance | Private Insurance |
| Under 6 | 52 (26.4%) | 145 (73.6%) |
| 6 to 18 Years | 87 (19.7%) | 389 (88.2%) |
| 19 to 25 Years | 13 (11.4%) | 101 (88.6%) |
| 25 to 34 Years | 7 (2.7%) | 217 (84.8%) |
| 35 to 44 Years | 27 (8.0%) | 302 (89.9%) |
| 45 to 54 Years | 77 (23.1%) | 279 (83.5%) |
| 55 to 64 Years | 81 (24.4%) | 320 (96.4%) |
| 65 to 74 Years | 323 (97.9%) | 246 (74.6%) |
| 75 Years and over | 232 (97.9%) | 218 (92.0%) |
| Total | 899 (34.9%) | 2,217 (86.0%) |
Disability Status by Sex by Age in Bethlehem
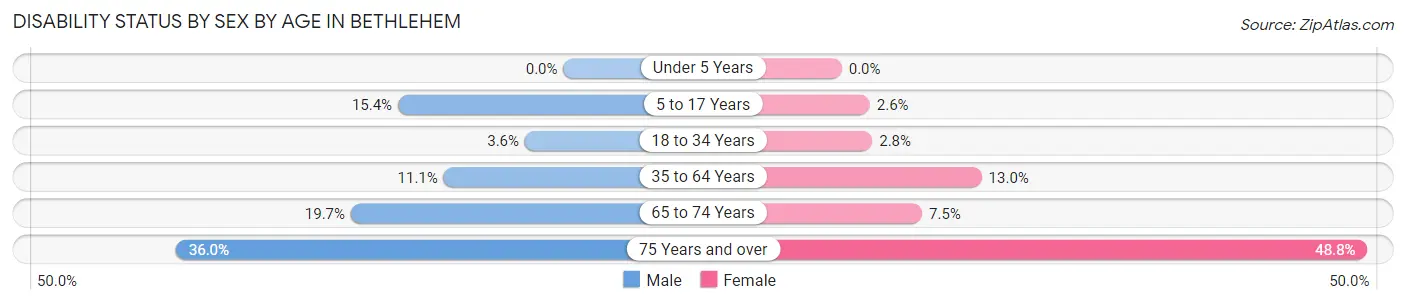
| Age Bracket | Male | Female |
| Under 5 Years | 0 (0.0%) | 0 (0.0%) |
| 5 to 17 Years | 39 (15.3%) | 5 (2.6%) |
| 18 to 34 Years | 6 (3.6%) | 6 (2.8%) |
| 35 to 64 Years | 54 (11.1%) | 67 (13.0%) |
| 65 to 74 Years | 28 (19.7%) | 14 (7.4%) |
| 75 Years and over | 41 (36.0%) | 60 (48.8%) |
Disability Class by Sex by Age in Bethlehem
Disability Class: Hearing Difficulty
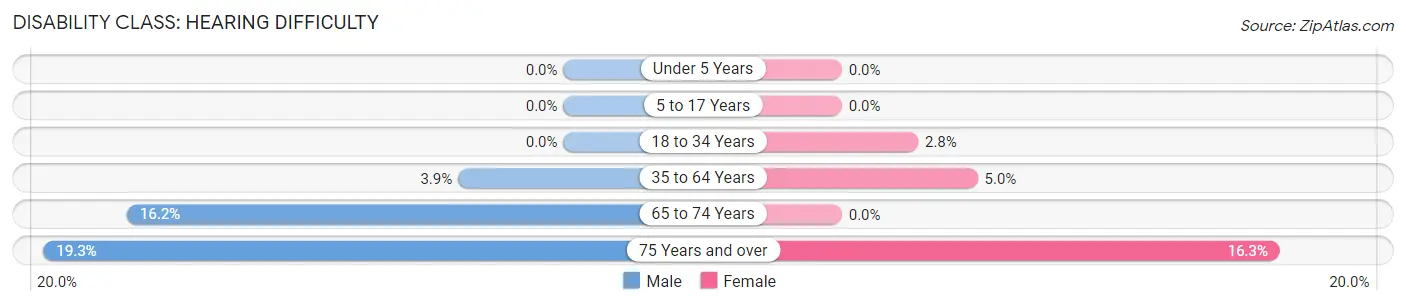
| Age Bracket | Male | Female |
| Under 5 Years | 0 (0.0%) | 0 (0.0%) |
| 5 to 17 Years | 0 (0.0%) | 0 (0.0%) |
| 18 to 34 Years | 0 (0.0%) | 6 (2.8%) |
| 35 to 64 Years | 19 (3.9%) | 26 (5.0%) |
| 65 to 74 Years | 23 (16.2%) | 0 (0.0%) |
| 75 Years and over | 22 (19.3%) | 20 (16.3%) |
Disability Class: Vision Difficulty
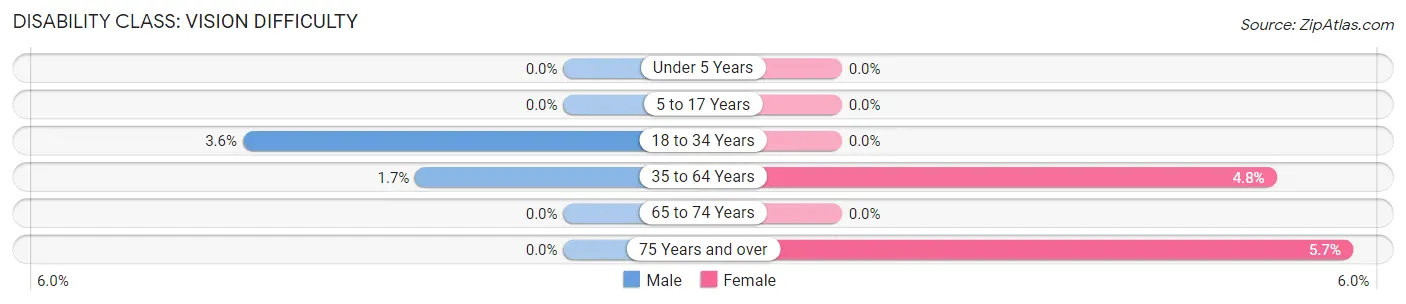
| Age Bracket | Male | Female |
| Under 5 Years | 0 (0.0%) | 0 (0.0%) |
| 5 to 17 Years | 0 (0.0%) | 0 (0.0%) |
| 18 to 34 Years | 6 (3.6%) | 0 (0.0%) |
| 35 to 64 Years | 8 (1.7%) | 25 (4.8%) |
| 65 to 74 Years | 0 (0.0%) | 0 (0.0%) |
| 75 Years and over | 0 (0.0%) | 7 (5.7%) |
Disability Class: Cognitive Difficulty
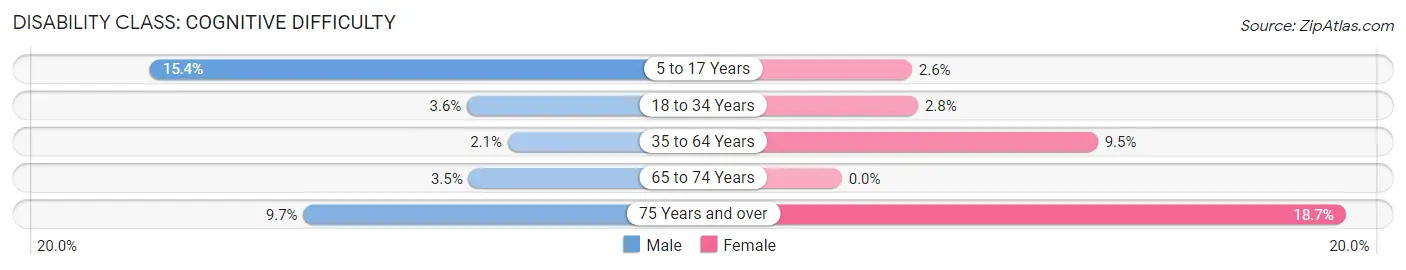
| Age Bracket | Male | Female |
| 5 to 17 Years | 39 (15.3%) | 5 (2.6%) |
| 18 to 34 Years | 6 (3.6%) | 6 (2.8%) |
| 35 to 64 Years | 10 (2.1%) | 49 (9.5%) |
| 65 to 74 Years | 5 (3.5%) | 0 (0.0%) |
| 75 Years and over | 11 (9.7%) | 23 (18.7%) |
Disability Class: Ambulatory Difficulty
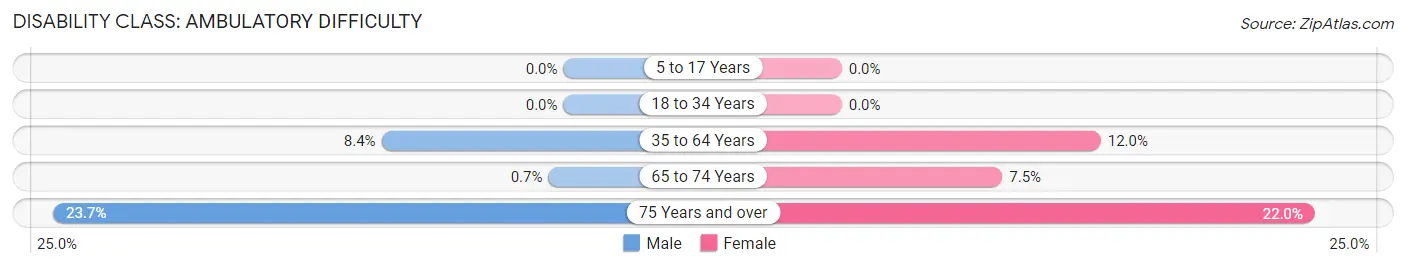
| Age Bracket | Male | Female |
| 5 to 17 Years | 0 (0.0%) | 0 (0.0%) |
| 18 to 34 Years | 0 (0.0%) | 0 (0.0%) |
| 35 to 64 Years | 41 (8.4%) | 62 (12.0%) |
| 65 to 74 Years | 1 (0.7%) | 14 (7.4%) |
| 75 Years and over | 27 (23.7%) | 27 (22.0%) |
Disability Class: Self-Care Difficulty
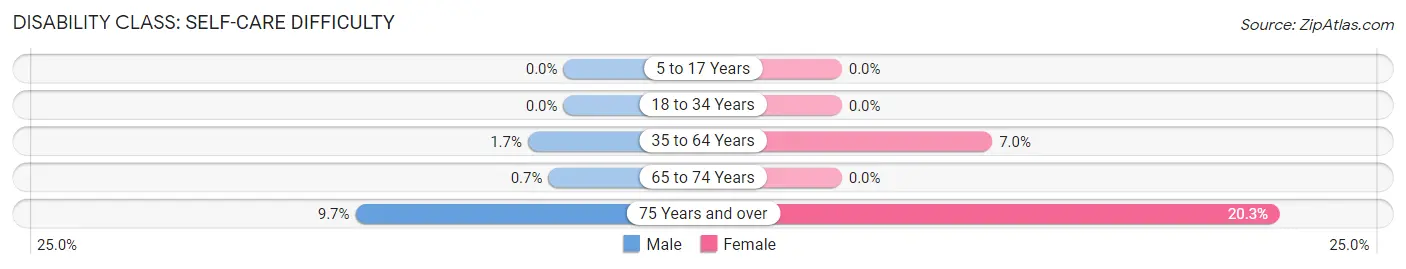
| Age Bracket | Male | Female |
| 5 to 17 Years | 0 (0.0%) | 0 (0.0%) |
| 18 to 34 Years | 0 (0.0%) | 0 (0.0%) |
| 35 to 64 Years | 8 (1.7%) | 36 (7.0%) |
| 65 to 74 Years | 1 (0.7%) | 0 (0.0%) |
| 75 Years and over | 11 (9.7%) | 25 (20.3%) |
Technology Access in Bethlehem
Computing Device Access in Bethlehem
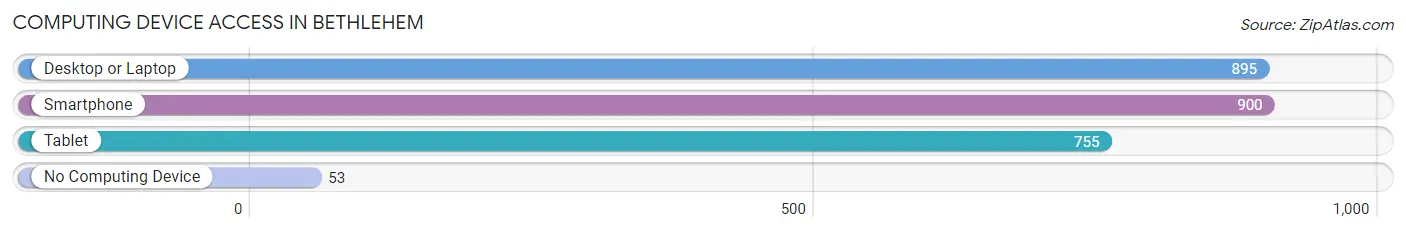
| Device Type | # Households | % Households |
| Desktop or Laptop | 895 | 84.4% |
| Smartphone | 900 | 84.8% |
| Tablet | 755 | 71.2% |
| No Computing Device | 53 | 5.0% |
| Total | 1,061 | 100.0% |
Internet Access in Bethlehem
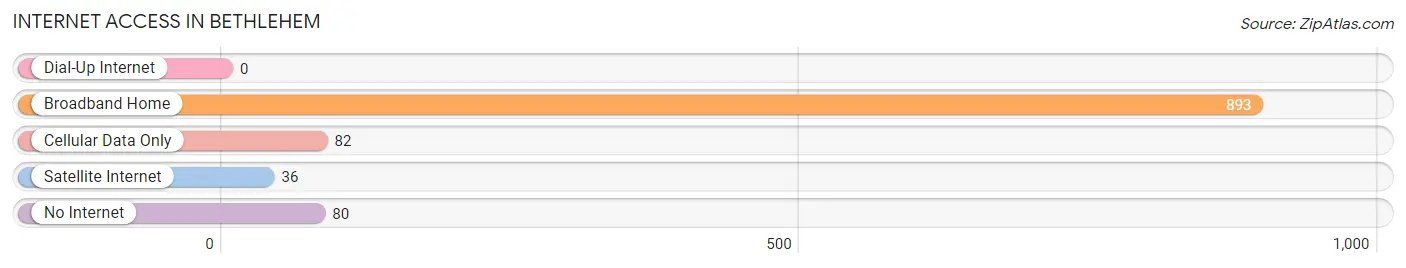
| Internet Type | # Households | % Households |
| Dial-Up Internet | 0 | 0.0% |
| Broadband Home | 893 | 84.2% |
| Cellular Data Only | 82 | 7.7% |
| Satellite Internet | 36 | 3.4% |
| No Internet | 80 | 7.5% |
| Total | 1,061 | 100.0% |
Bethlehem Summary
Bethlehem is a small town located in the Appalachian Mountains of West Virginia. It is situated in the northern part of the state, in the county of Barbour. The town was founded in 1817 and has a population of approximately 1,000 people.
Geography
Bethlehem is located in the northern part of West Virginia, in the county of Barbour. It is situated in the Appalachian Mountains, and is surrounded by the Allegheny Mountains to the east and the Monongahela National Forest to the west. The town is located at an elevation of 1,400 feet above sea level. The climate in Bethlehem is humid continental, with hot summers and cold winters.
Economy
The economy of Bethlehem is largely based on agriculture and tourism. The town is home to several small farms, which produce a variety of crops, including corn, soybeans, and hay. The town also has a few small businesses, including a grocery store, a hardware store, and a few restaurants. Tourism is also an important part of the local economy, as the town is located near several popular outdoor recreation areas, including the Monongahela National Forest and the Allegheny Mountains.
Demographics
As of the 2010 census, the population of Bethlehem was 1,000 people. The racial makeup of the town was 97.2% White, 0.7% African American, 0.3% Native American, 0.2% Asian, and 1.6% from other races. The median household income was $25,000, and the median family income was $30,000. The per capita income was $14,000.
History
Bethlehem was founded in 1817 by a group of settlers from Pennsylvania. The town was named after the biblical town of Bethlehem, and was originally intended to be a religious community. The town grew slowly over the years, and by the early 1900s, it had become a popular tourist destination. The town was also home to several small businesses, including a sawmill, a gristmill, and a general store.
In the late 20th century, Bethlehem began to experience a decline in population as many of its residents moved away in search of better economic opportunities. However, the town has seen a resurgence in recent years, as more people have moved to the area in search of a rural lifestyle. Today, Bethlehem is a small but vibrant community, with a strong sense of community and a commitment to preserving its history and culture.
Common Questions
What is the Total Population of Bethlehem?
Total Population of Bethlehem is 2,577.
What is the Total Male Population of Bethlehem?
Total Male Population of Bethlehem is 1,274.
What is the Total Female Population of Bethlehem?
Total Female Population of Bethlehem is 1,303.
What is the Ratio of Males per 100 Females in Bethlehem?
There are 97.77 Males per 100 Females in Bethlehem.
What is the Ratio of Females per 100 Males in Bethlehem?
There are 102.28 Females per 100 Males in Bethlehem.
What is the Median Population Age in Bethlehem?
Median Population Age in Bethlehem is 42.3 Years.
What is the Average Family Size in Bethlehem
Average Family Size in Bethlehem is 2.9 People.
What is the Average Household Size in Bethlehem
Average Household Size in Bethlehem is 2.4 People.
What is Per Capita Income in Bethlehem?
Per Capita income in Bethlehem is $39,413.
What is the Median Family Income in Bethlehem?
Median Family Income in Bethlehem is $101,719.
What is the Median Household income in Bethlehem?
Median Household Income in Bethlehem is $85,150.
What is Income or Wage Gap in Bethlehem?
Income or Wage Gap in Bethlehem is 32.8%.
Women in Bethlehem earn 67.2 cents for every dollar earned by a man.
What is Inequality or Gini Index in Bethlehem?
Inequality or Gini Index in Bethlehem is 0.35.
How Large is the Labor Force in Bethlehem?
There are 1,291 People in the Labor Forcein in Bethlehem.
What is the Percentage of People in the Labor Force in Bethlehem?
63.3% of People are in the Labor Force in Bethlehem.
What is the Unemployment Rate in Bethlehem?
Unemployment Rate in Bethlehem is 2.8%.