Pea Ridge, WV
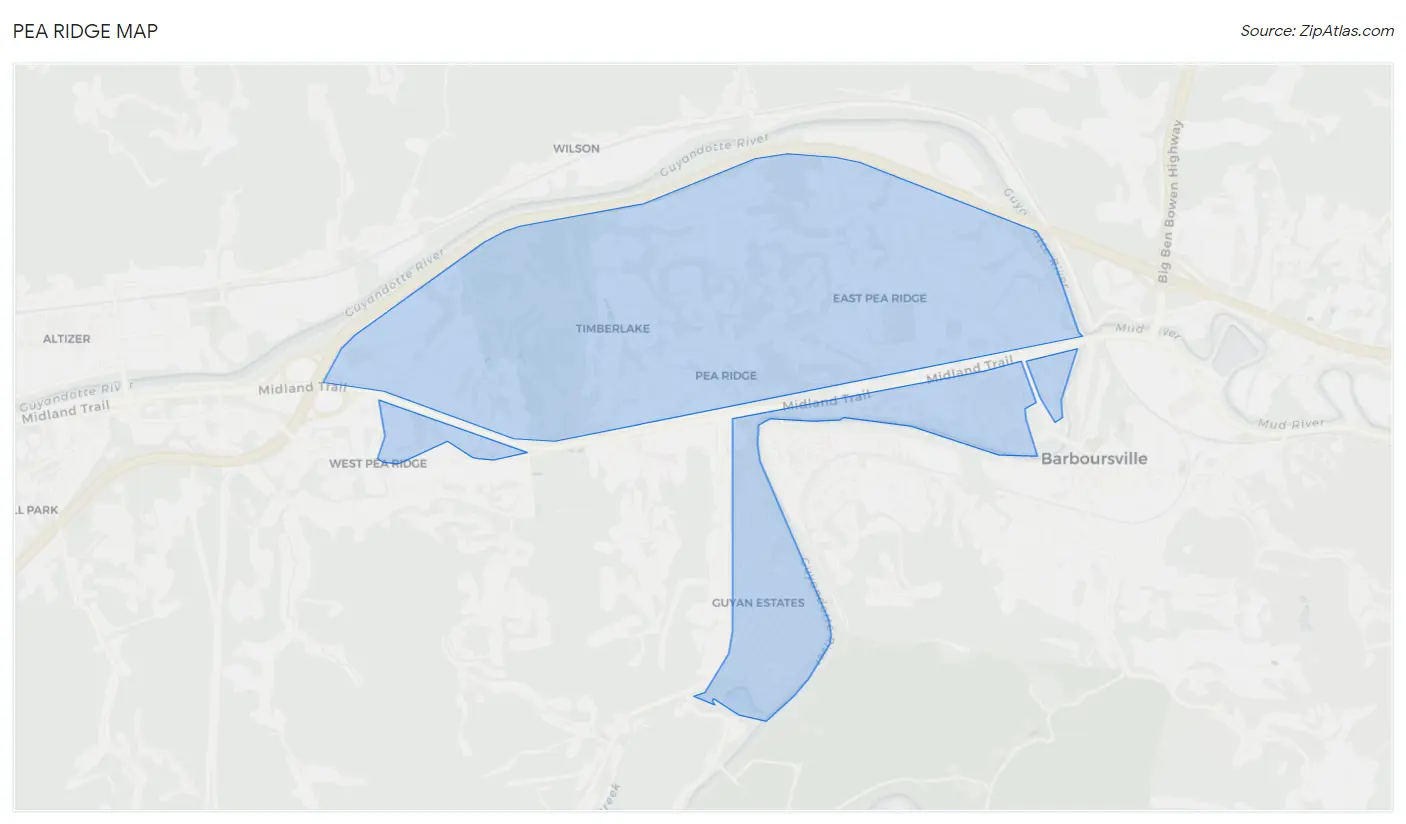
Pea Ridge Map
Pea Ridge Overview
6,884
TOTAL POPULATION
3,491
MALE POPULATION
3,393
FEMALE POPULATION
102.89
MALES / 100 FEMALES
97.19
FEMALES / 100 MALES
37.3
MEDIAN AGE
3.0
AVG FAMILY SIZE
2.1
AVG HOUSEHOLD SIZE
$39,639
PER CAPITA INCOME
$90,363
AVG FAMILY INCOME
$57,863
AVG HOUSEHOLD INCOME
19.5%
WAGE / INCOME GAP [ % ]
80.5¢/ $1
WAGE / INCOME GAP [ $ ]
0.49
INEQUALITY / GINI INDEX
3,643
LABOR FORCE [ PEOPLE ]
63.7%
PERCENT IN LABOR FORCE
3.4%
UNEMPLOYMENT RATE
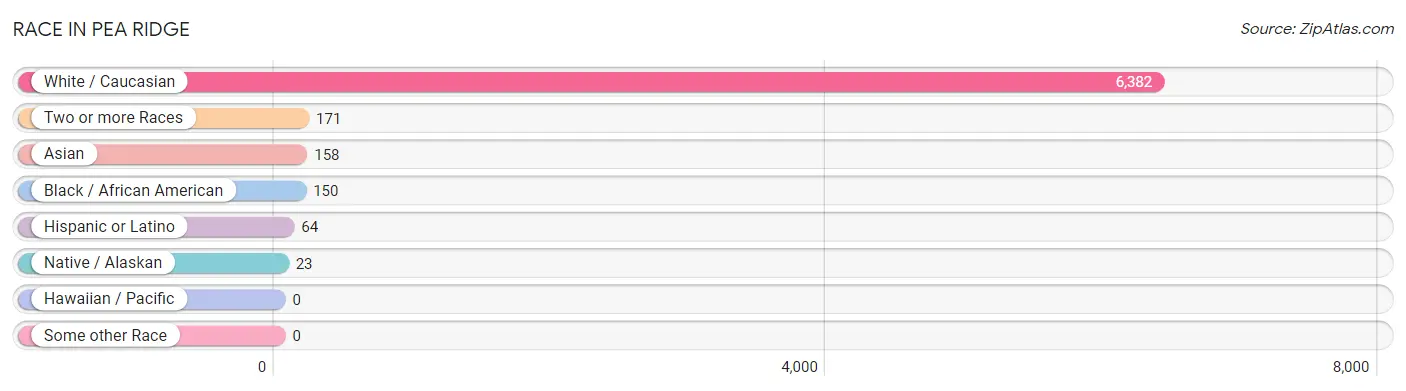
Race in Pea Ridge
The most populous races in Pea Ridge are White / Caucasian (6,382 | 92.7%), Two or more Races (171 | 2.5%), and Asian (158 | 2.3%).
| Race | # Population | % Population |
| Asian | 158 | 2.3% |
| Black / African American | 150 | 2.2% |
| Hawaiian / Pacific | 0 | 0.0% |
| Hispanic or Latino | 64 | 0.9% |
| Native / Alaskan | 23 | 0.3% |
| White / Caucasian | 6,382 | 92.7% |
| Two or more Races | 171 | 2.5% |
| Some other Race | 0 | 0.0% |
| Total | 6,884 | 100.0% |
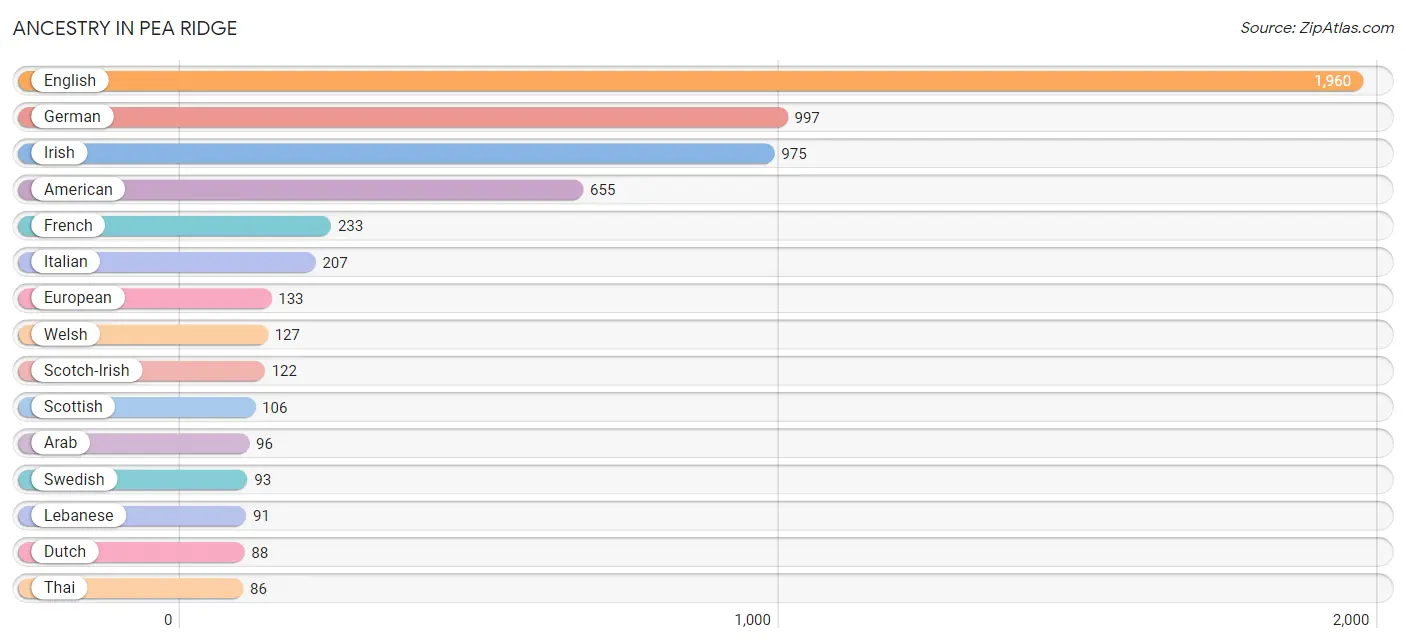
Ancestry in Pea Ridge
The most populous ancestries reported in Pea Ridge are English (1,960 | 28.5%), German (997 | 14.5%), Irish (975 | 14.2%), American (655 | 9.5%), and French (233 | 3.4%), together accounting for 70.0% of all Pea Ridge residents.
| Ancestry | # Population | % Population |
| American | 655 | 9.5% |
| Arab | 96 | 1.4% |
| British | 41 | 0.6% |
| Cherokee | 25 | 0.4% |
| Choctaw | 23 | 0.3% |
| Dutch | 88 | 1.3% |
| Eastern European | 24 | 0.4% |
| English | 1,960 | 28.5% |
| European | 133 | 1.9% |
| Finnish | 53 | 0.8% |
| French | 233 | 3.4% |
| German | 997 | 14.5% |
| Greek | 12 | 0.2% |
| Hungarian | 83 | 1.2% |
| Irish | 975 | 14.2% |
| Italian | 207 | 3.0% |
| Lebanese | 91 | 1.3% |
| Mexican | 64 | 0.9% |
| Norwegian | 20 | 0.3% |
| Pakistani | 31 | 0.4% |
| Polish | 39 | 0.6% |
| Scandinavian | 46 | 0.7% |
| Scotch-Irish | 122 | 1.8% |
| Scottish | 106 | 1.5% |
| Swedish | 93 | 1.3% |
| Syrian | 57 | 0.8% |
| Thai | 86 | 1.3% |
| Vietnamese | 29 | 0.4% |
| Welsh | 127 | 1.8% | View All 29 Rows |
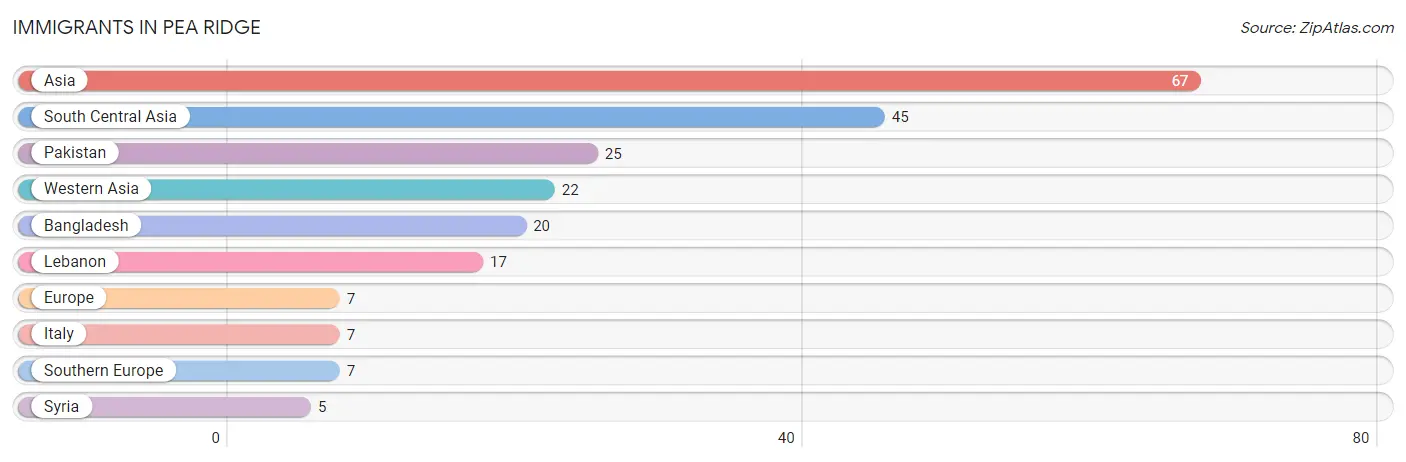
Immigrants in Pea Ridge
The most numerous immigrant groups reported in Pea Ridge came from Asia (67 | 1.0%), South Central Asia (45 | 0.6%), Pakistan (25 | 0.4%), Western Asia (22 | 0.3%), and Bangladesh (20 | 0.3%), together accounting for 2.6% of all Pea Ridge residents.
| Immigration Origin | # Population | % Population |
| Asia | 67 | 1.0% |
| Bangladesh | 20 | 0.3% |
| Europe | 7 | 0.1% |
| Italy | 7 | 0.1% |
| Lebanon | 17 | 0.3% |
| Pakistan | 25 | 0.4% |
| South Central Asia | 45 | 0.6% |
| Southern Europe | 7 | 0.1% |
| Syria | 5 | 0.1% |
| Western Asia | 22 | 0.3% | View All 10 Rows |
Sex and Age in Pea Ridge
Sex and Age in Pea Ridge
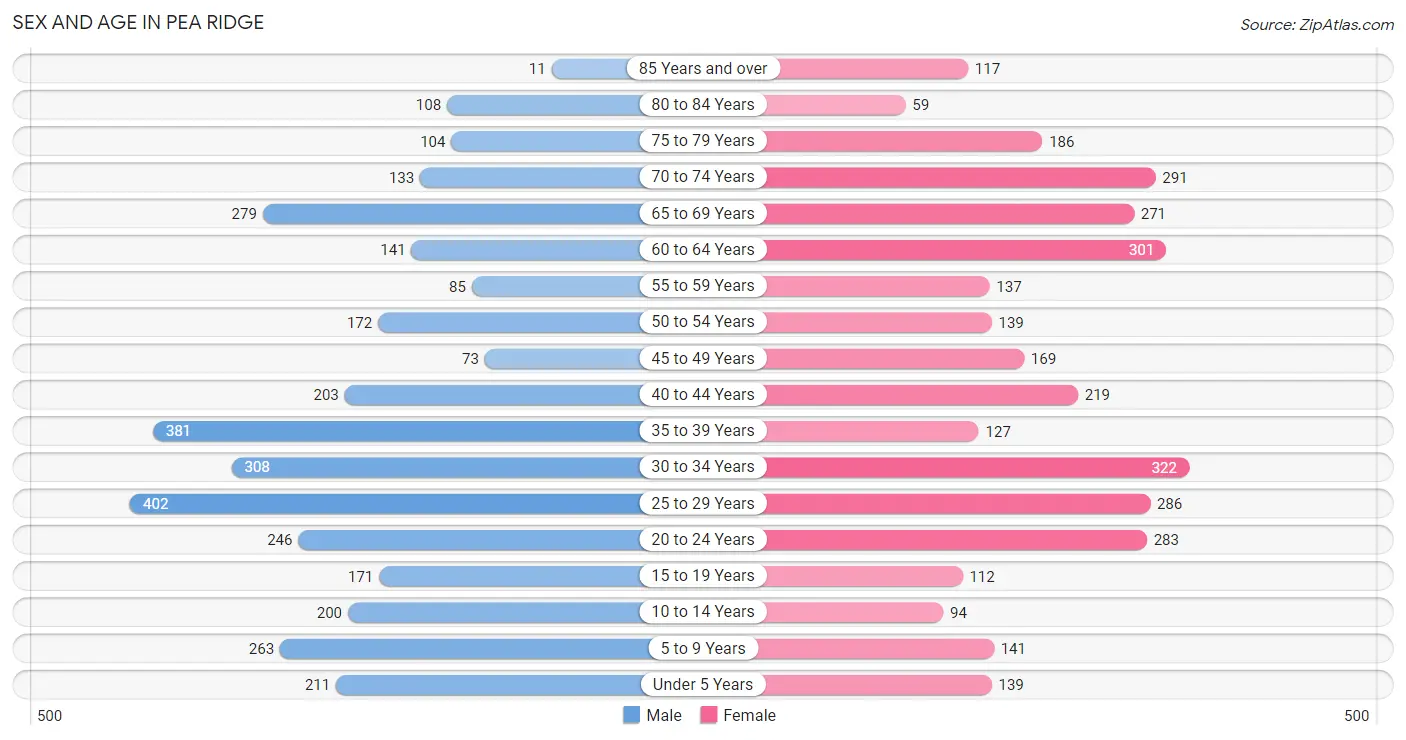
The most populous age groups in Pea Ridge are 25 to 29 Years (402 | 11.5%) for men and 30 to 34 Years (322 | 9.5%) for women.
| Age Bracket | Male | Female |
| Under 5 Years | 211 (6.0%) | 139 (4.1%) |
| 5 to 9 Years | 263 (7.5%) | 141 (4.2%) |
| 10 to 14 Years | 200 (5.7%) | 94 (2.8%) |
| 15 to 19 Years | 171 (4.9%) | 112 (3.3%) |
| 20 to 24 Years | 246 (7.0%) | 283 (8.3%) |
| 25 to 29 Years | 402 (11.5%) | 286 (8.4%) |
| 30 to 34 Years | 308 (8.8%) | 322 (9.5%) |
| 35 to 39 Years | 381 (10.9%) | 127 (3.7%) |
| 40 to 44 Years | 203 (5.8%) | 219 (6.5%) |
| 45 to 49 Years | 73 (2.1%) | 169 (5.0%) |
| 50 to 54 Years | 172 (4.9%) | 139 (4.1%) |
| 55 to 59 Years | 85 (2.4%) | 137 (4.0%) |
| 60 to 64 Years | 141 (4.0%) | 301 (8.9%) |
| 65 to 69 Years | 279 (8.0%) | 271 (8.0%) |
| 70 to 74 Years | 133 (3.8%) | 291 (8.6%) |
| 75 to 79 Years | 104 (3.0%) | 186 (5.5%) |
| 80 to 84 Years | 108 (3.1%) | 59 (1.7%) |
| 85 Years and over | 11 (0.3%) | 117 (3.5%) |
| Total | 3,491 (100.0%) | 3,393 (100.0%) |
Families and Households in Pea Ridge
Median Family Size in Pea Ridge
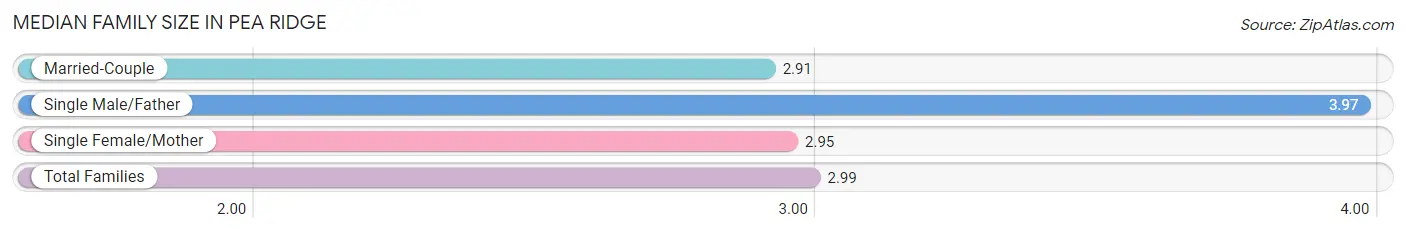
The median family size in Pea Ridge is 2.99 persons per family, with single male/father families (116 | 6.9%) accounting for the largest median family size of 3.97 persons per family. On the other hand, married-couple families (1,295 | 76.6%) represent the smallest median family size with 2.91 persons per family.
| Family Type | # Families | Family Size |
| Married-Couple | 1,295 (76.6%) | 2.91 |
| Single Male/Father | 116 (6.9%) | 3.97 |
| Single Female/Mother | 279 (16.5%) | 2.95 |
| Total Families | 1,690 (100.0%) | 2.99 |
Median Household Size in Pea Ridge
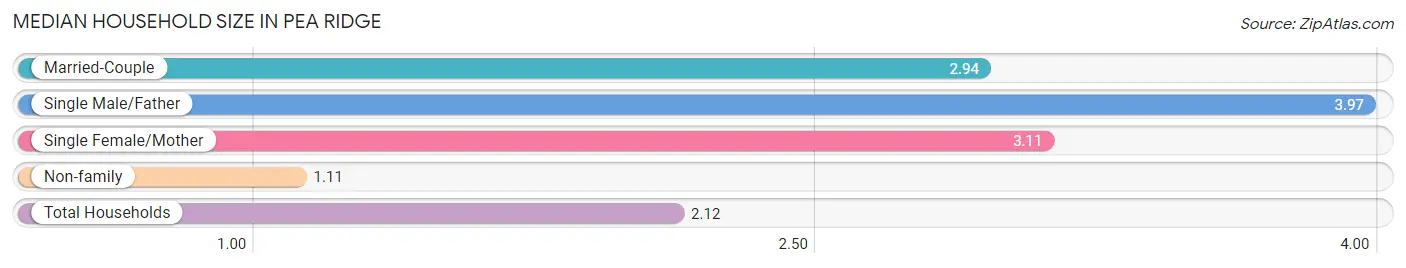
The median household size in Pea Ridge is 2.12 persons per household, with single male/father households (116 | 3.6%) accounting for the largest median household size of 3.97 persons per household. non-family households (1,535 | 47.6%) represent the smallest median household size with 1.11 persons per household.
| Household Type | # Households | Household Size |
| Married-Couple | 1,295 (40.2%) | 2.94 |
| Single Male/Father | 116 (3.6%) | 3.97 |
| Single Female/Mother | 279 (8.6%) | 3.11 |
| Non-family | 1,535 (47.6%) | 1.11 |
| Total Households | 3,225 (100.0%) | 2.12 |
Household Size by Marriage Status in Pea Ridge
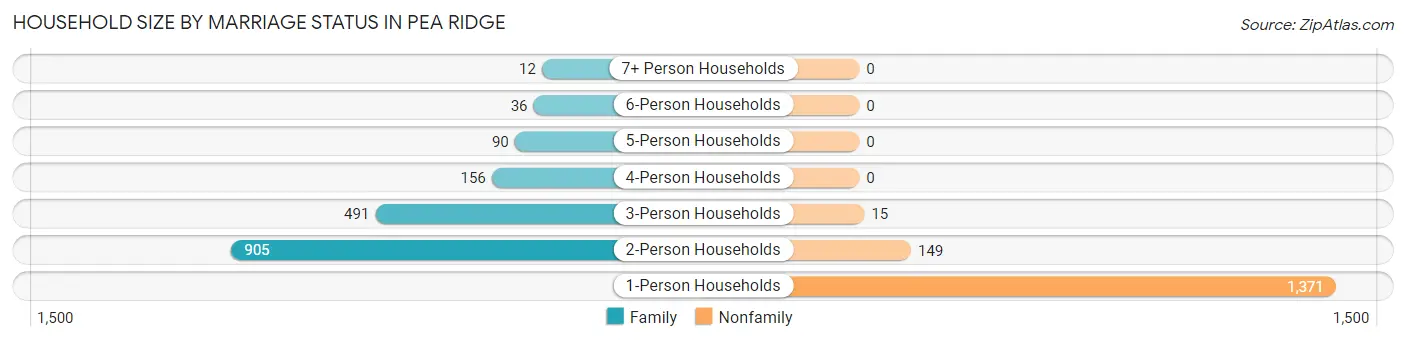
Out of a total of 3,225 households in Pea Ridge, 1,690 (52.4%) are family households, while 1,535 (47.6%) are nonfamily households. The most numerous type of family households are 2-person households, comprising 905, and the most common type of nonfamily households are 1-person households, comprising 1,371.
| Household Size | Family Households | Nonfamily Households |
| 1-Person Households | - | 1,371 (42.5%) |
| 2-Person Households | 905 (28.1%) | 149 (4.6%) |
| 3-Person Households | 491 (15.2%) | 15 (0.5%) |
| 4-Person Households | 156 (4.8%) | 0 (0.0%) |
| 5-Person Households | 90 (2.8%) | 0 (0.0%) |
| 6-Person Households | 36 (1.1%) | 0 (0.0%) |
| 7+ Person Households | 12 (0.4%) | 0 (0.0%) |
| Total | 1,690 (52.4%) | 1,535 (47.6%) |
Female Fertility in Pea Ridge
Fertility by Age in Pea Ridge
Average fertility rate in Pea Ridge is 78.0 births per 1,000 women. Women in the age bracket of 20 to 34 years have the highest fertility rate with 111.0 births per 1,000 women. Women in the age bracket of 20 to 34 years acount for 83.9% of all women with births.
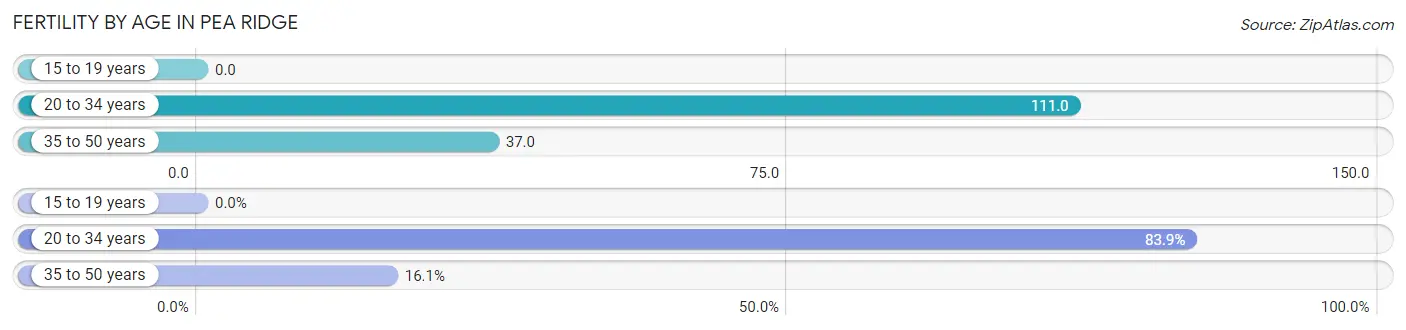
| Age Bracket | Women with Births | Births / 1,000 Women |
| 15 to 19 years | 0 (0.0%) | 0.0 |
| 20 to 34 years | 99 (83.9%) | 111.0 |
| 35 to 50 years | 19 (16.1%) | 37.0 |
| Total | 118 (100.0%) | 78.0 |
Fertility by Age by Marriage Status in Pea Ridge
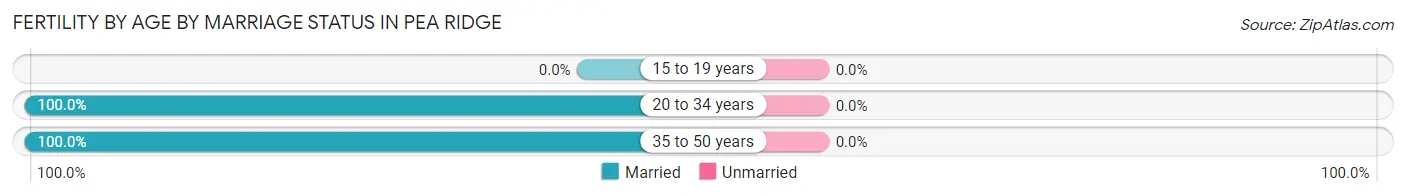
| Age Bracket | Married | Unmarried |
| 15 to 19 years | 0 (0.0%) | 0 (0.0%) |
| 20 to 34 years | 99 (100.0%) | 0 (0.0%) |
| 35 to 50 years | 19 (100.0%) | 0 (0.0%) |
| Total | 118 (100.0%) | 0 (0.0%) |
Fertility by Education in Pea Ridge
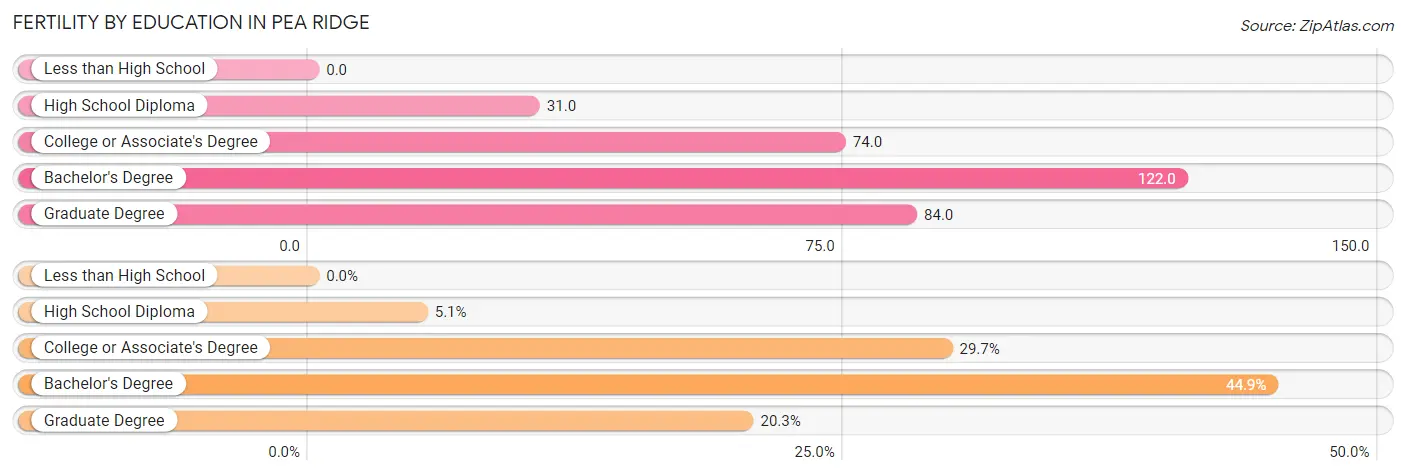
| Educational Attainment | Women with Births | Births / 1,000 Women |
| Less than High School | 0 (0.0%) | 0.0 |
| High School Diploma | 6 (5.1%) | 31.0 |
| College or Associate's Degree | 35 (29.7%) | 74.0 |
| Bachelor's Degree | 53 (44.9%) | 122.0 |
| Graduate Degree | 24 (20.3%) | 84.0 |
| Total | 118 (100.0%) | 78.0 |
Fertility by Education by Marriage Status in Pea Ridge
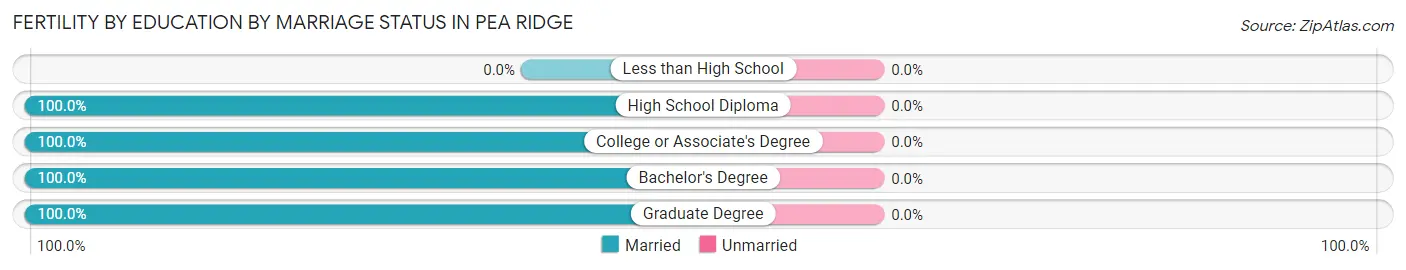
| Educational Attainment | Married | Unmarried |
| Less than High School | 0 (0.0%) | 0 (0.0%) |
| High School Diploma | 6 (100.0%) | 0 (0.0%) |
| College or Associate's Degree | 35 (100.0%) | 0 (0.0%) |
| Bachelor's Degree | 53 (100.0%) | 0 (0.0%) |
| Graduate Degree | 24 (100.0%) | 0 (0.0%) |
| Total | 118 (100.0%) | 0 (0.0%) |
Income in Pea Ridge
Income Overview in Pea Ridge
Per Capita Income in Pea Ridge is $39,639, while median incomes of families and households are $90,363 and $57,863 respectively.
| Characteristic | Number | Measure |
| Per Capita Income | 6,884 | $39,639 |
| Median Family Income | 1,690 | $90,363 |
| Mean Family Income | 1,690 | $105,459 |
| Median Household Income | 3,225 | $57,863 |
| Mean Household Income | 3,225 | $83,028 |
| Income Deficit | 1,690 | $0 |
| Wage / Income Gap (%) | 6,884 | 19.54% |
| Wage / Income Gap ($) | 6,884 | 80.46¢ per $1 |
| Gini / Inequality Index | 6,884 | 0.49 |
Earnings by Sex in Pea Ridge
Average Earnings in Pea Ridge are $34,668, $36,250 for men and $29,167 for women, a difference of 19.5%.
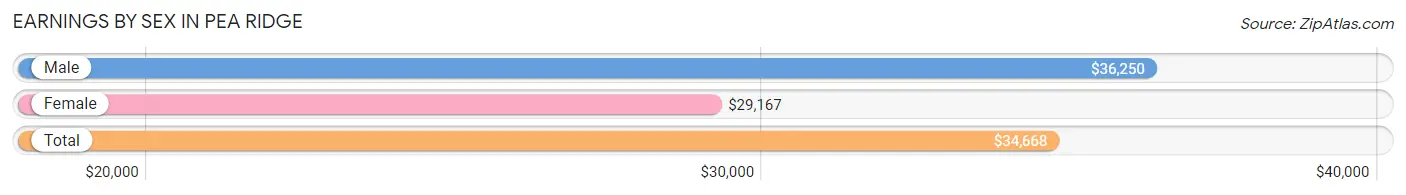
| Sex | Number | Average Earnings |
| Male | 2,082 (54.8%) | $36,250 |
| Female | 1,718 (45.2%) | $29,167 |
| Total | 3,800 (100.0%) | $34,668 |
Earnings by Sex by Income Bracket in Pea Ridge
The most common earnings brackets in Pea Ridge are $100,000+ for men (331 | 15.9%) and $25,000 to $29,999 for women (234 | 13.6%).
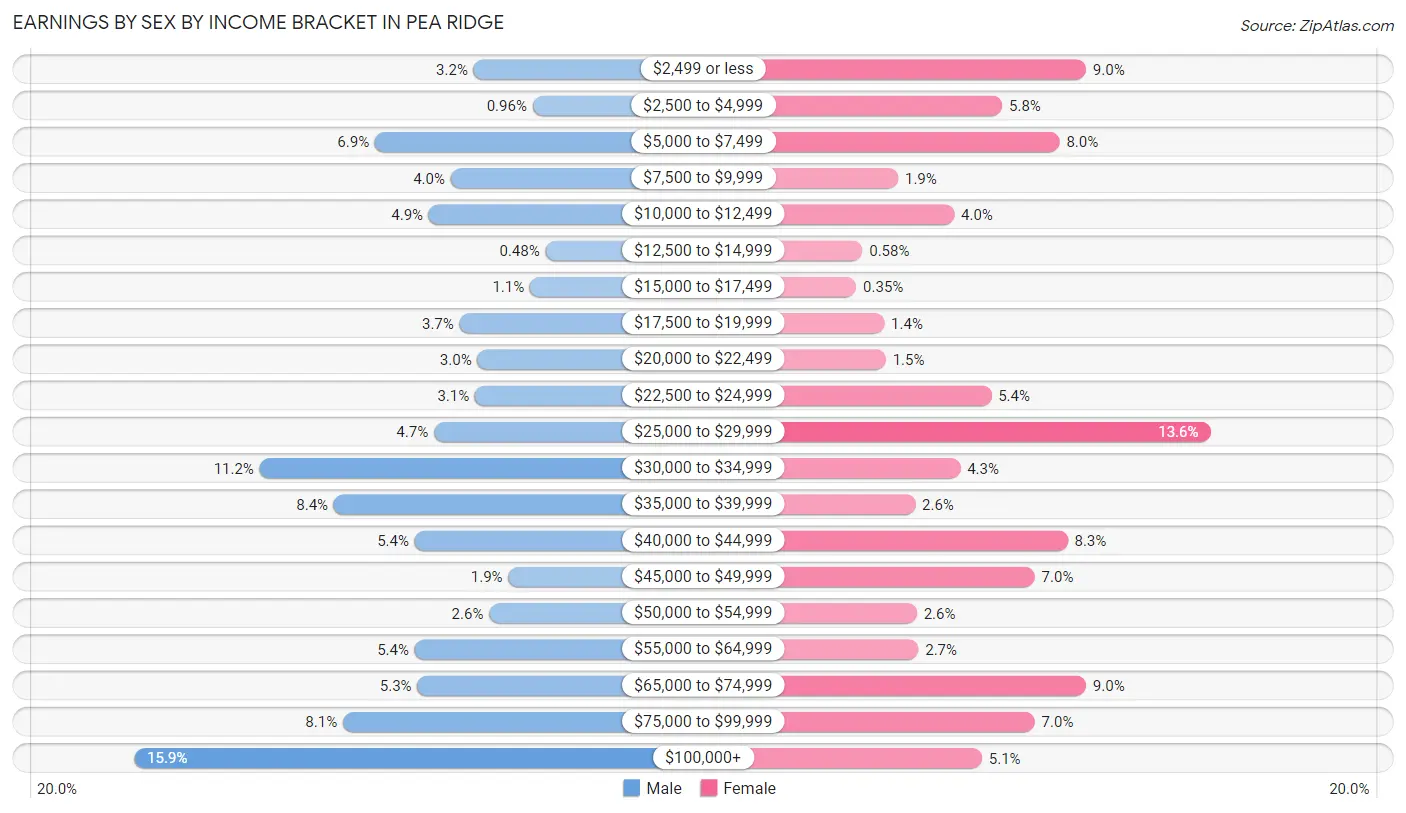
| Income | Male | Female |
| $2,499 or less | 66 (3.2%) | 154 (9.0%) |
| $2,500 to $4,999 | 20 (1.0%) | 100 (5.8%) |
| $5,000 to $7,499 | 143 (6.9%) | 137 (8.0%) |
| $7,500 to $9,999 | 84 (4.0%) | 33 (1.9%) |
| $10,000 to $12,499 | 101 (4.9%) | 69 (4.0%) |
| $12,500 to $14,999 | 10 (0.5%) | 10 (0.6%) |
| $15,000 to $17,499 | 22 (1.1%) | 6 (0.4%) |
| $17,500 to $19,999 | 77 (3.7%) | 24 (1.4%) |
| $20,000 to $22,499 | 63 (3.0%) | 25 (1.5%) |
| $22,500 to $24,999 | 65 (3.1%) | 93 (5.4%) |
| $25,000 to $29,999 | 97 (4.7%) | 234 (13.6%) |
| $30,000 to $34,999 | 233 (11.2%) | 73 (4.3%) |
| $35,000 to $39,999 | 175 (8.4%) | 44 (2.6%) |
| $40,000 to $44,999 | 112 (5.4%) | 142 (8.3%) |
| $45,000 to $49,999 | 39 (1.9%) | 121 (7.0%) |
| $50,000 to $54,999 | 54 (2.6%) | 45 (2.6%) |
| $55,000 to $64,999 | 112 (5.4%) | 46 (2.7%) |
| $65,000 to $74,999 | 110 (5.3%) | 154 (9.0%) |
| $75,000 to $99,999 | 168 (8.1%) | 121 (7.0%) |
| $100,000+ | 331 (15.9%) | 87 (5.1%) |
| Total | 2,082 (100.0%) | 1,718 (100.0%) |
Earnings by Sex by Educational Attainment in Pea Ridge
Average earnings in Pea Ridge are $40,592 for men and $36,063 for women, a difference of 11.2%. Men with an educational attainment of graduate degree enjoy the highest average annual earnings of $115,430, while those with college or associate's degree education earn the least with $34,300. Women with an educational attainment of graduate degree earn the most with the average annual earnings of $61,750, while those with college or associate's degree education have the smallest earnings of $27,215.
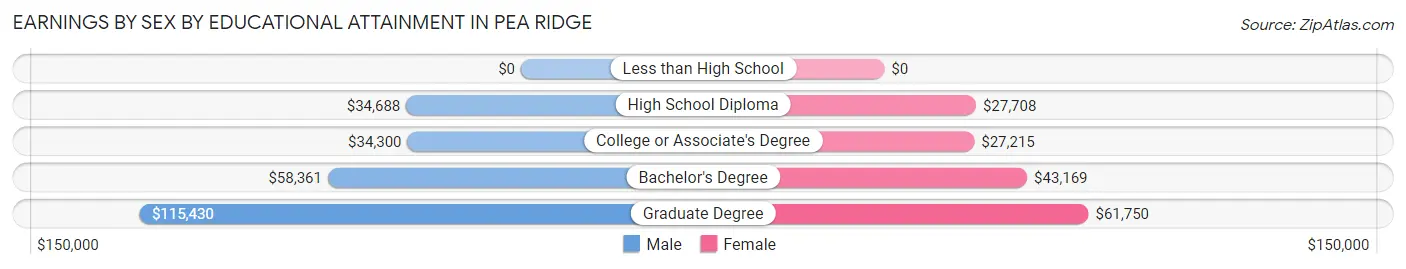
| Educational Attainment | Male Income | Female Income |
| Less than High School | - | - |
| High School Diploma | $34,688 | $27,708 |
| College or Associate's Degree | $34,300 | $27,215 |
| Bachelor's Degree | $58,361 | $43,169 |
| Graduate Degree | $115,430 | $61,750 |
| Total | $40,592 | $36,063 |
Family Income in Pea Ridge
Family Income Brackets in Pea Ridge
According to the Pea Ridge family income data, there are 433 families falling into the $100,000 to $149,999 income range, which is the most common income bracket and makes up 25.6% of all families. Conversely, the $10,000 to $14,999 income bracket is the least frequent group with only 24 families (1.4%) belonging to this category.
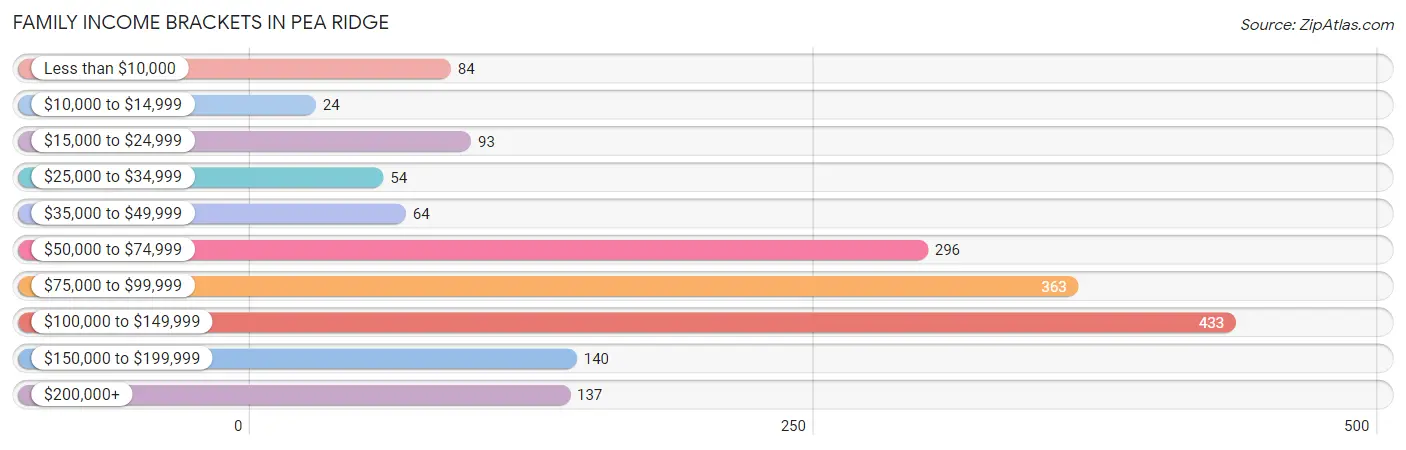
| Income Bracket | # Families | % Families |
| Less than $10,000 | 84 | 5.0% |
| $10,000 to $14,999 | 24 | 1.4% |
| $15,000 to $24,999 | 93 | 5.5% |
| $25,000 to $34,999 | 54 | 3.2% |
| $35,000 to $49,999 | 64 | 3.8% |
| $50,000 to $74,999 | 296 | 17.5% |
| $75,000 to $99,999 | 363 | 21.5% |
| $100,000 to $149,999 | 433 | 25.6% |
| $150,000 to $199,999 | 140 | 8.3% |
| $200,000+ | 137 | 8.1% |
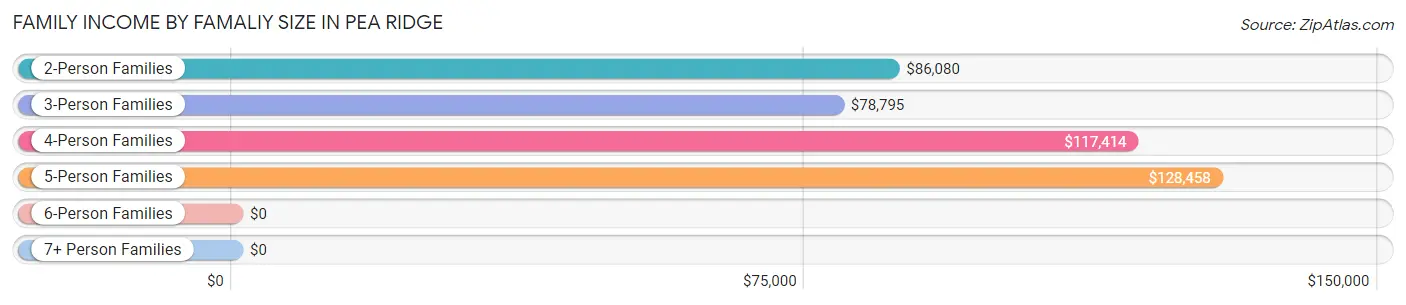
Family Income by Famaliy Size in Pea Ridge
5-person families (118 | 7.0%) account for the highest median family income in Pea Ridge with $128,458 per family, while 2-person families (941 | 55.7%) have the highest median income of $43,040 per family member.
| Income Bracket | # Families | Median Income |
| 2-Person Families | 941 (55.7%) | $86,080 |
| 3-Person Families | 455 (26.9%) | $78,795 |
| 4-Person Families | 164 (9.7%) | $117,414 |
| 5-Person Families | 118 (7.0%) | $128,458 |
| 6-Person Families | 0 (0.0%) | $0 |
| 7+ Person Families | 12 (0.7%) | $0 |
| Total | 1,690 (100.0%) | $90,363 |
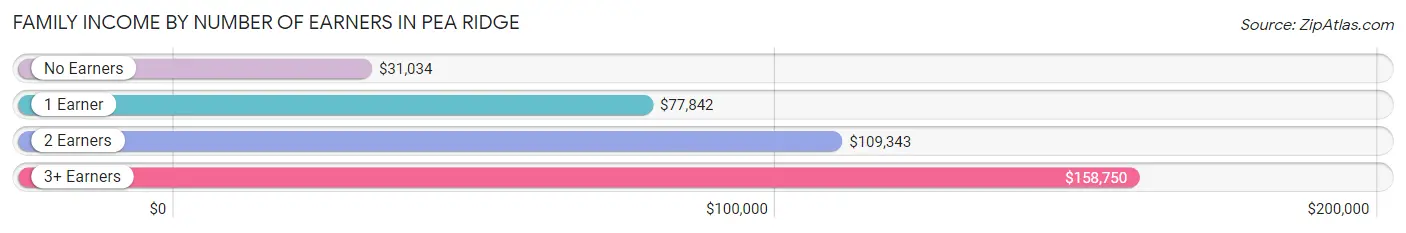
Family Income by Number of Earners in Pea Ridge
The median family income in Pea Ridge is $90,363, with families comprising 3+ earners (101) having the highest median family income of $158,750, while families with no earners (266) have the lowest median family income of $31,034, accounting for 6.0% and 15.7% of families, respectively.
| Number of Earners | # Families | Median Income |
| No Earners | 266 (15.7%) | $31,034 |
| 1 Earner | 598 (35.4%) | $77,842 |
| 2 Earners | 725 (42.9%) | $109,343 |
| 3+ Earners | 101 (6.0%) | $158,750 |
| Total | 1,690 (100.0%) | $90,363 |
Household Income in Pea Ridge
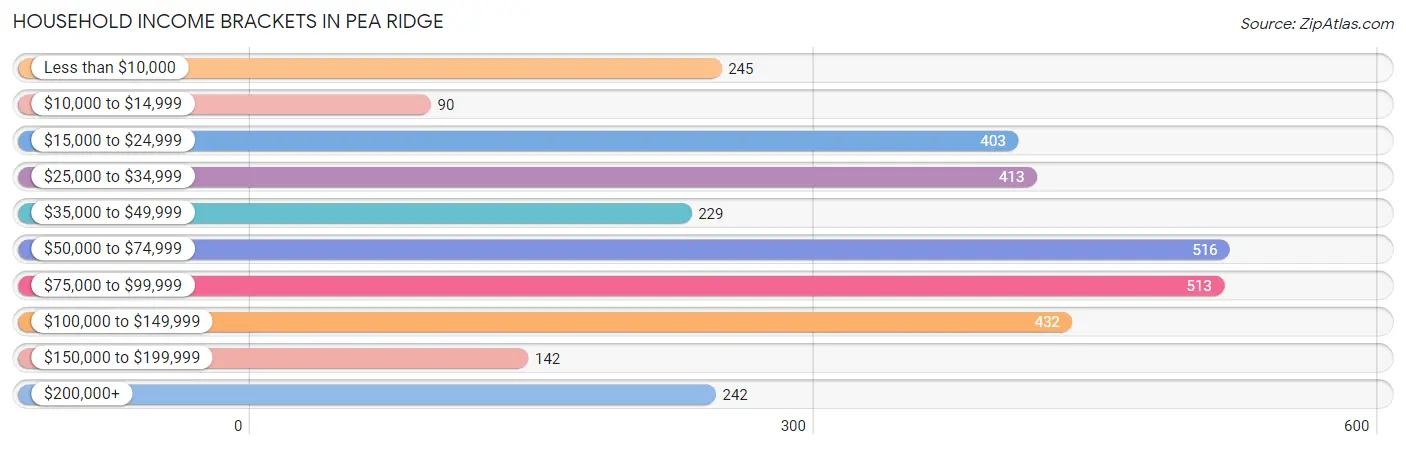
Household Income Brackets in Pea Ridge
With 516 households falling in the category, the $50,000 to $74,999 income range is the most frequent in Pea Ridge, accounting for 16.0% of all households. In contrast, only 90 households (2.8%) fall into the $10,000 to $14,999 income bracket, making it the least populous group.
| Income Bracket | # Households | % Households |
| Less than $10,000 | 245 | 7.6% |
| $10,000 to $14,999 | 90 | 2.8% |
| $15,000 to $24,999 | 403 | 12.5% |
| $25,000 to $34,999 | 413 | 12.8% |
| $35,000 to $49,999 | 229 | 7.1% |
| $50,000 to $74,999 | 516 | 16.0% |
| $75,000 to $99,999 | 513 | 15.9% |
| $100,000 to $149,999 | 432 | 13.4% |
| $150,000 to $199,999 | 142 | 4.4% |
| $200,000+ | 242 | 7.5% |
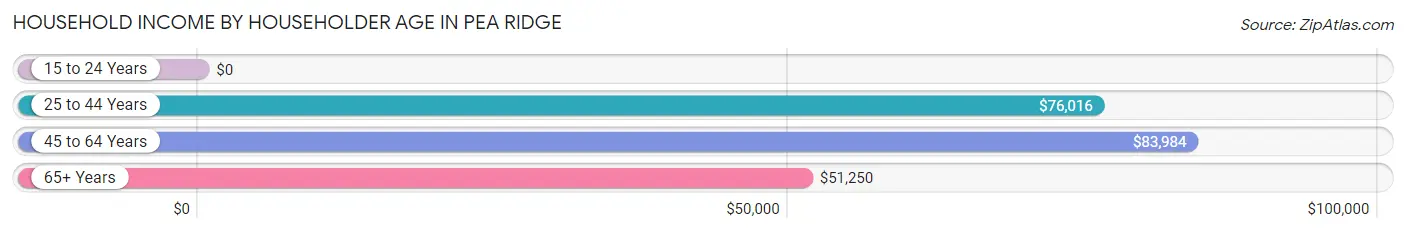
Household Income by Householder Age in Pea Ridge
The median household income in Pea Ridge is $57,863, with the highest median household income of $83,984 found in the 45 to 64 years age bracket for the primary householder. A total of 638 households (19.8%) fall into this category. Meanwhile, the 15 to 24 years age bracket for the primary householder has the lowest median household income of $0, with 235 households (7.3%) in this group.
| Income Bracket | # Households | Median Income |
| 15 to 24 Years | 235 (7.3%) | $0 |
| 25 to 44 Years | 1,244 (38.6%) | $76,016 |
| 45 to 64 Years | 638 (19.8%) | $83,984 |
| 65+ Years | 1,108 (34.4%) | $51,250 |
| Total | 3,225 (100.0%) | $57,863 |
Poverty in Pea Ridge
Income Below Poverty by Sex and Age in Pea Ridge
With 9.9% poverty level for males and 13.7% for females among the residents of Pea Ridge, 15 year old males and 18 to 24 year old females are the most vulnerable to poverty, with 32 males (61.5%) and 204 females (65.2%) in their respective age groups living below the poverty level.
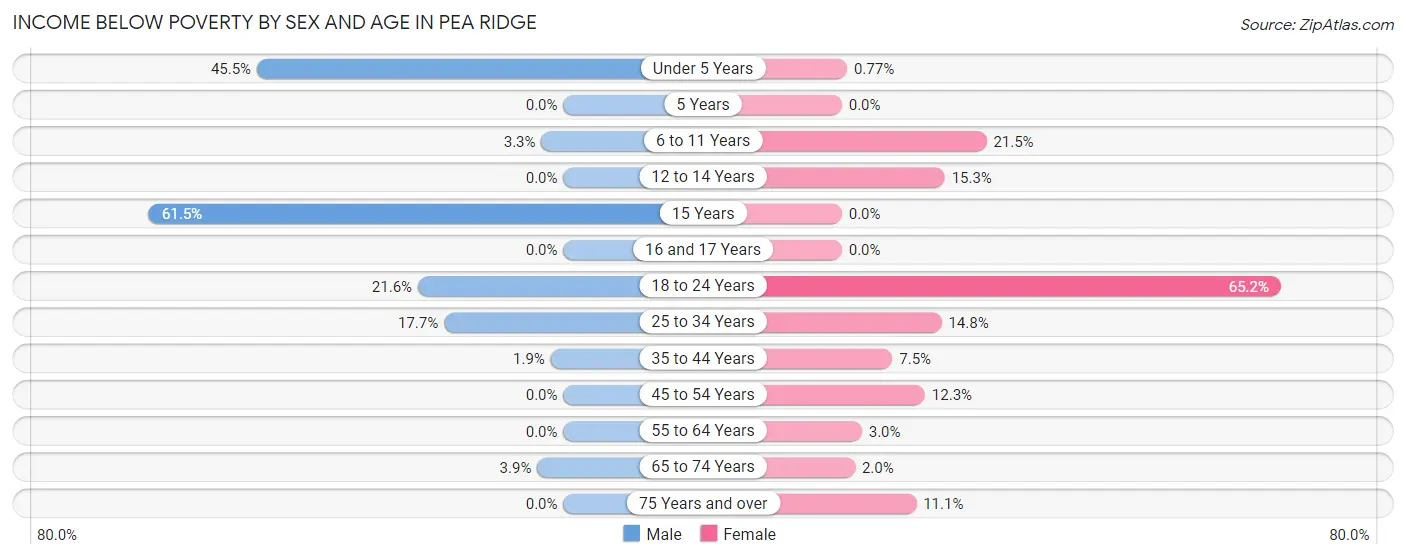
| Age Bracket | Male | Female |
| Under 5 Years | 96 (45.5%) | 1 (0.8%) |
| 5 Years | 0 (0.0%) | 0 (0.0%) |
| 6 to 11 Years | 11 (3.3%) | 29 (21.5%) |
| 12 to 14 Years | 0 (0.0%) | 11 (15.3%) |
| 15 Years | 32 (61.5%) | 0 (0.0%) |
| 16 and 17 Years | 0 (0.0%) | 0 (0.0%) |
| 18 to 24 Years | 54 (21.6%) | 204 (65.2%) |
| 25 to 34 Years | 124 (17.7%) | 90 (14.8%) |
| 35 to 44 Years | 11 (1.9%) | 26 (7.5%) |
| 45 to 54 Years | 0 (0.0%) | 38 (12.3%) |
| 55 to 64 Years | 0 (0.0%) | 13 (3.0%) |
| 65 to 74 Years | 16 (3.9%) | 11 (2.0%) |
| 75 Years and over | 0 (0.0%) | 39 (11.1%) |
| Total | 344 (9.9%) | 462 (13.7%) |
Income Above Poverty by Sex and Age in Pea Ridge
According to the poverty statistics in Pea Ridge, males aged 12 to 14 years and females aged 5 years are the age groups that are most secure financially, with 100.0% of males and 100.0% of females in these age groups living above the poverty line.
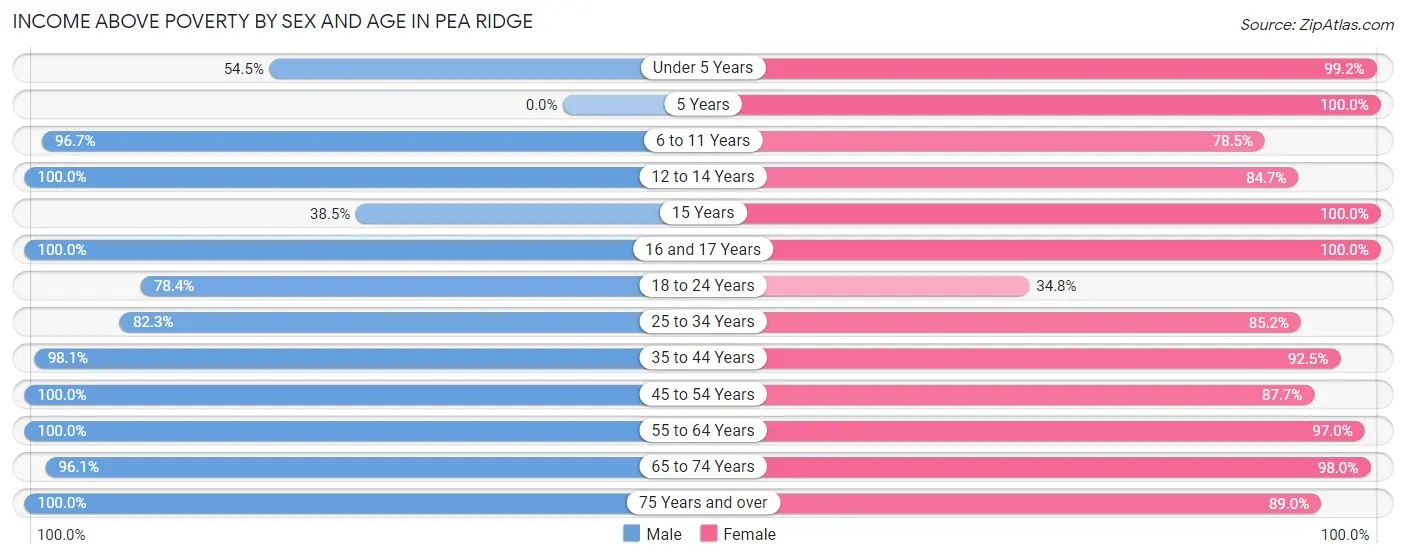
| Age Bracket | Male | Female |
| Under 5 Years | 115 (54.5%) | 129 (99.2%) |
| 5 Years | 0 (0.0%) | 28 (100.0%) |
| 6 to 11 Years | 326 (96.7%) | 106 (78.5%) |
| 12 to 14 Years | 126 (100.0%) | 61 (84.7%) |
| 15 Years | 20 (38.5%) | 65 (100.0%) |
| 16 and 17 Years | 115 (100.0%) | 17 (100.0%) |
| 18 to 24 Years | 196 (78.4%) | 109 (34.8%) |
| 25 to 34 Years | 576 (82.3%) | 518 (85.2%) |
| 35 to 44 Years | 573 (98.1%) | 320 (92.5%) |
| 45 to 54 Years | 245 (100.0%) | 270 (87.7%) |
| 55 to 64 Years | 216 (100.0%) | 425 (97.0%) |
| 65 to 74 Years | 396 (96.1%) | 551 (98.0%) |
| 75 Years and over | 214 (100.0%) | 314 (88.9%) |
| Total | 3,118 (90.1%) | 2,913 (86.3%) |
Income Below Poverty Among Married-Couple Families in Pea Ridge
The poverty statistics for married-couple families in Pea Ridge show that 4.7% or 61 of the total 1,295 families live below the poverty line. Families with 1 or 2 children have the highest poverty rate of 6.9%, comprising of 25 families. On the other hand, families with 3 or 4 children have the lowest poverty rate of 0.0%, which includes 0 families.
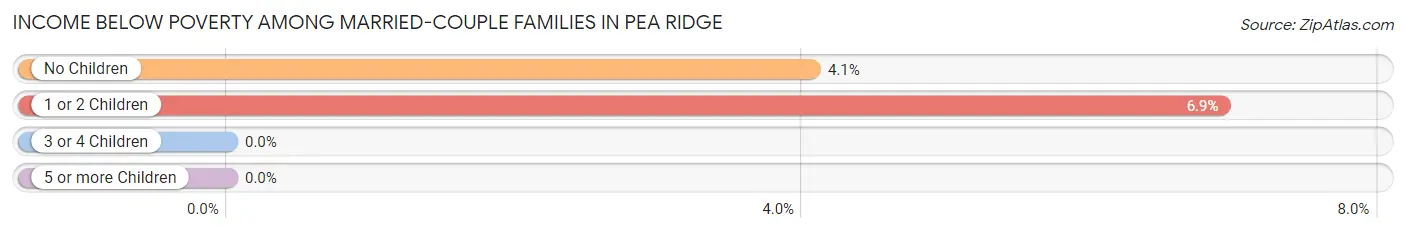
| Children | Above Poverty | Below Poverty |
| No Children | 850 (95.9%) | 36 (4.1%) |
| 1 or 2 Children | 337 (93.1%) | 25 (6.9%) |
| 3 or 4 Children | 47 (100.0%) | 0 (0.0%) |
| 5 or more Children | 0 (0.0%) | 0 (0.0%) |
| Total | 1,234 (95.3%) | 61 (4.7%) |
Income Below Poverty Among Single-Parent Households in Pea Ridge
According to the poverty data in Pea Ridge, 33.6% or 39 single-father households and 21.5% or 60 single-mother households are living below the poverty line. Among single-father households, those with 1 or 2 children have the highest poverty rate, with 39 households (38.6%) experiencing poverty. Likewise, among single-mother households, those with 3 or 4 children have the highest poverty rate, with 36 households (81.8%) falling below the poverty line.
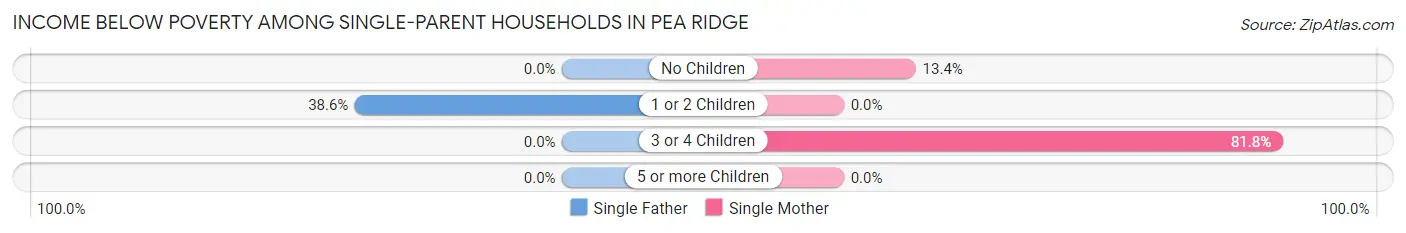
| Children | Single Father | Single Mother |
| No Children | 0 (0.0%) | 24 (13.4%) |
| 1 or 2 Children | 39 (38.6%) | 0 (0.0%) |
| 3 or 4 Children | 0 (0.0%) | 36 (81.8%) |
| 5 or more Children | 0 (0.0%) | 0 (0.0%) |
| Total | 39 (33.6%) | 60 (21.5%) |
Income Below Poverty Among Married-Couple vs Single-Parent Households in Pea Ridge
The poverty data for Pea Ridge shows that 61 of the married-couple family households (4.7%) and 99 of the single-parent households (25.1%) are living below the poverty level. Within the married-couple family households, those with 1 or 2 children have the highest poverty rate, with 25 households (6.9%) falling below the poverty line. Among the single-parent households, those with 3 or 4 children have the highest poverty rate, with 36 household (61.0%) living below poverty.
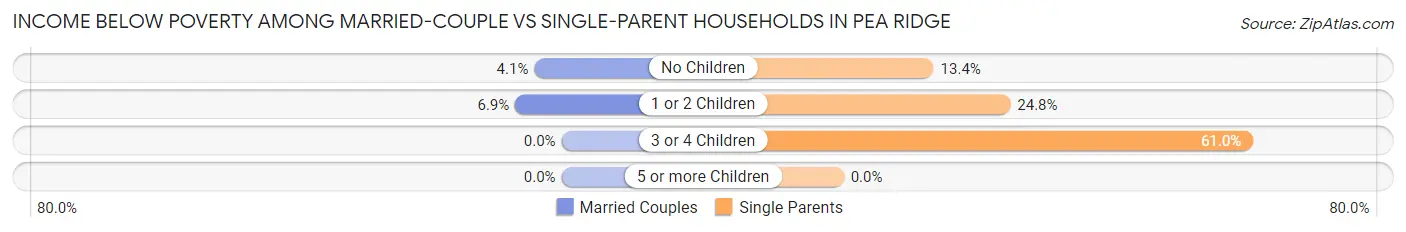
| Children | Married-Couple Families | Single-Parent Households |
| No Children | 36 (4.1%) | 24 (13.4%) |
| 1 or 2 Children | 25 (6.9%) | 39 (24.8%) |
| 3 or 4 Children | 0 (0.0%) | 36 (61.0%) |
| 5 or more Children | 0 (0.0%) | 0 (0.0%) |
| Total | 61 (4.7%) | 99 (25.1%) |
Employment Characteristics in Pea Ridge
Employment by Class of Employer in Pea Ridge
Among the 3,451 employed individuals in Pea Ridge, private company employees (2,097 | 60.8%), state government employees (495 | 14.3%), and not-for-profit organizations (456 | 13.2%) make up the most common classes of employment.
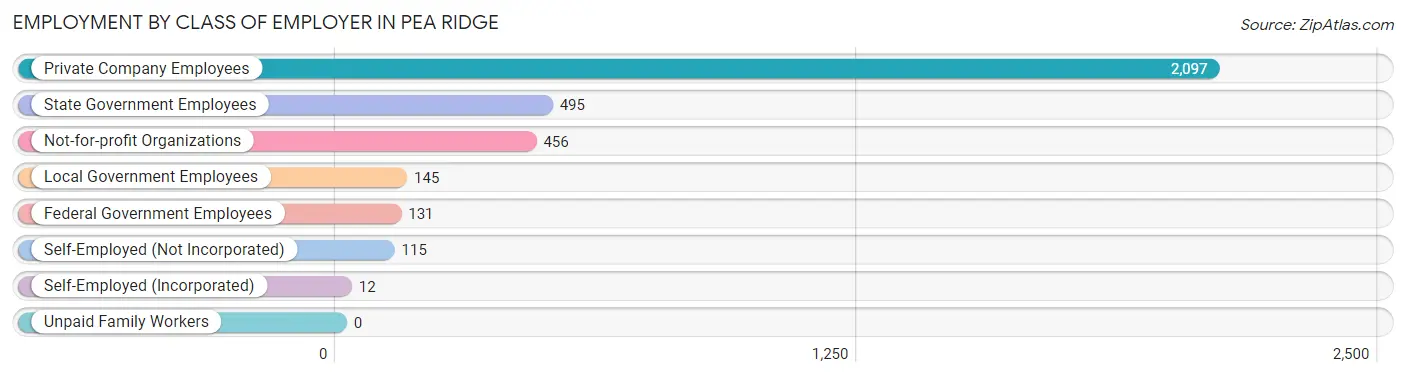
| Employer Class | # Employees | % Employees |
| Private Company Employees | 2,097 | 60.8% |
| Self-Employed (Incorporated) | 12 | 0.4% |
| Self-Employed (Not Incorporated) | 115 | 3.3% |
| Not-for-profit Organizations | 456 | 13.2% |
| Local Government Employees | 145 | 4.2% |
| State Government Employees | 495 | 14.3% |
| Federal Government Employees | 131 | 3.8% |
| Unpaid Family Workers | 0 | 0.0% |
| Total | 3,451 | 100.0% |
Employment Status by Age in Pea Ridge
According to the labor force statistics for Pea Ridge, out of the total population over 16 years of age (5,719), 63.7% or 3,643 individuals are in the labor force, with 3.4% or 124 of them unemployed. The age group with the highest labor force participation rate is 25 to 29 years, with 89.1% or 613 individuals in the labor force. Within the labor force, the 16 to 19 years age range has the highest percentage of unemployed individuals, with 15.3% or 9 of them being unemployed.
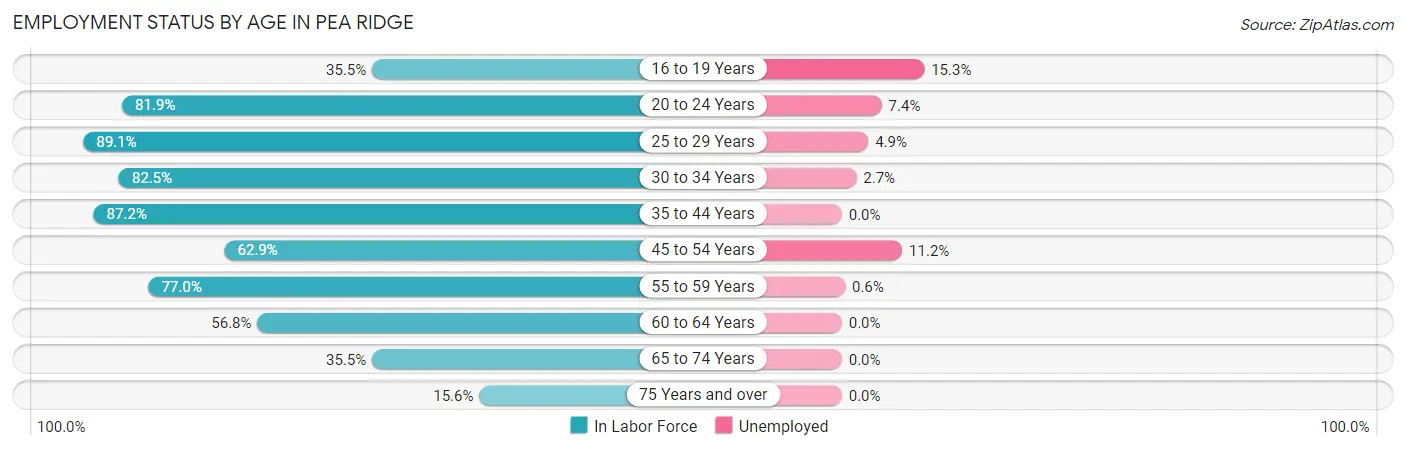
| Age Bracket | In Labor Force | Unemployed |
| 16 to 19 Years | 59 (35.5%) | 9 (15.3%) |
| 20 to 24 Years | 433 (81.9%) | 32 (7.4%) |
| 25 to 29 Years | 613 (89.1%) | 30 (4.9%) |
| 30 to 34 Years | 520 (82.5%) | 14 (2.7%) |
| 35 to 44 Years | 811 (87.2%) | 0 (0.0%) |
| 45 to 54 Years | 348 (62.9%) | 39 (11.2%) |
| 55 to 59 Years | 171 (77.0%) | 1 (0.6%) |
| 60 to 64 Years | 251 (56.8%) | 0 (0.0%) |
| 65 to 74 Years | 346 (35.5%) | 0 (0.0%) |
| 75 Years and over | 91 (15.6%) | 0 (0.0%) |
| Total | 3,643 (63.7%) | 124 (3.4%) |
Employment Status by Educational Attainment in Pea Ridge
According to labor force statistics for Pea Ridge, 78.3% of individuals (2,713) out of the total population between 25 and 64 years of age (3,465) are in the labor force, with 3.1% or 84 of them being unemployed. The group with the highest labor force participation rate are those with the educational attainment of college / associate degree, with 86.9% or 1,078 individuals in the labor force. Within the labor force, individuals with high school diploma education have the highest percentage of unemployment, with 5.4% or 16 of them being unemployed.
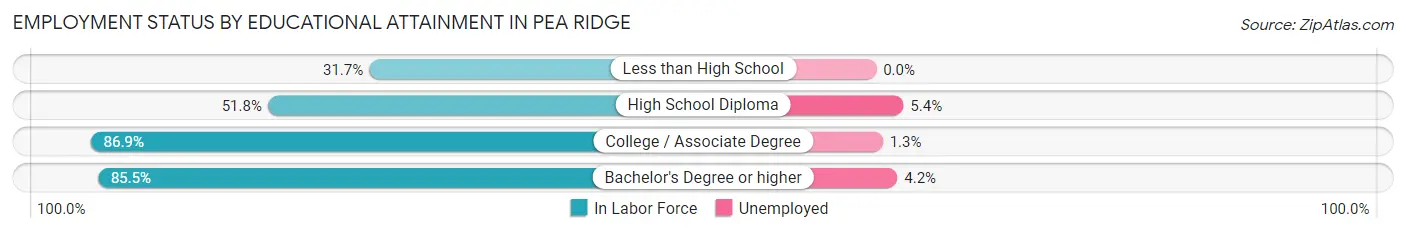
| Educational Attainment | In Labor Force | Unemployed |
| Less than High School | 44 (31.7%) | 0 (0.0%) |
| High School Diploma | 294 (51.8%) | 31 (5.4%) |
| College / Associate Degree | 1,078 (86.9%) | 16 (1.3%) |
| Bachelor's Degree or higher | 1,297 (85.5%) | 64 (4.2%) |
| Total | 2,713 (78.3%) | 107 (3.1%) |
Employment Occupations by Sex in Pea Ridge
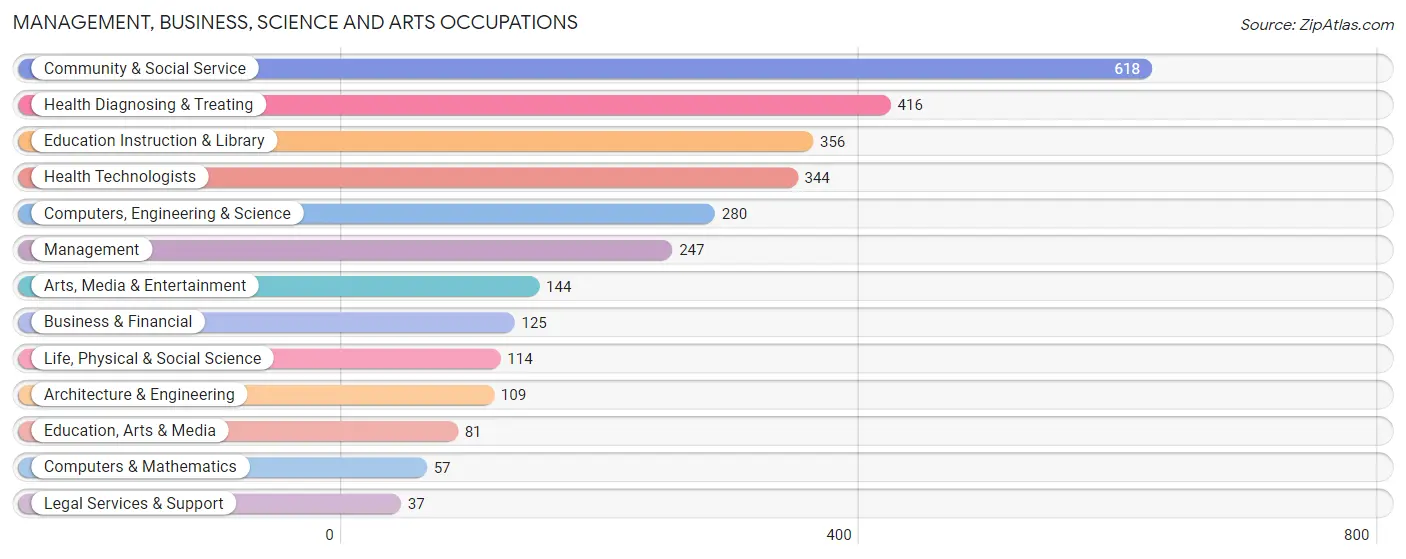
Management, Business, Science and Arts Occupations
The most common Management, Business, Science and Arts occupations in Pea Ridge are Community & Social Service (618 | 17.6%), Health Diagnosing & Treating (416 | 11.8%), Education Instruction & Library (356 | 10.1%), Health Technologists (344 | 9.8%), and Computers, Engineering & Science (280 | 8.0%).
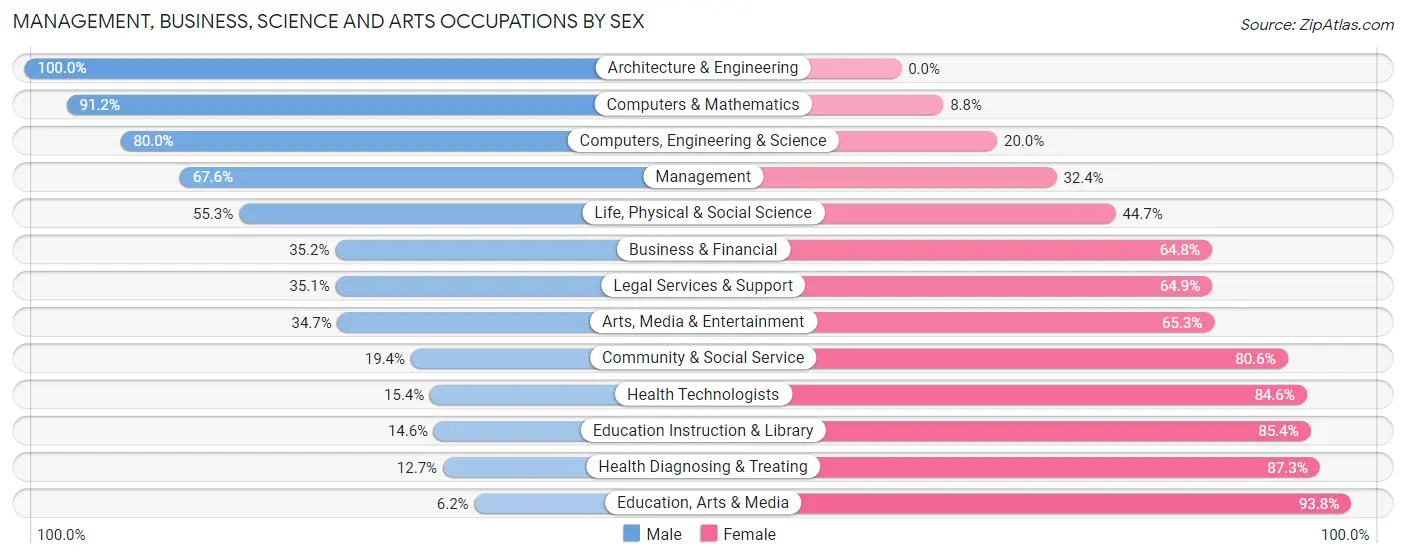
Management, Business, Science and Arts Occupations by Sex
Within the Management, Business, Science and Arts occupations in Pea Ridge, the most male-oriented occupations are Architecture & Engineering (100.0%), Computers & Mathematics (91.2%), and Computers, Engineering & Science (80.0%), while the most female-oriented occupations are Education, Arts & Media (93.8%), Health Diagnosing & Treating (87.3%), and Education Instruction & Library (85.4%).
| Occupation | Male | Female |
| Management | 167 (67.6%) | 80 (32.4%) |
| Business & Financial | 44 (35.2%) | 81 (64.8%) |
| Computers, Engineering & Science | 224 (80.0%) | 56 (20.0%) |
| Computers & Mathematics | 52 (91.2%) | 5 (8.8%) |
| Architecture & Engineering | 109 (100.0%) | 0 (0.0%) |
| Life, Physical & Social Science | 63 (55.3%) | 51 (44.7%) |
| Community & Social Service | 120 (19.4%) | 498 (80.6%) |
| Education, Arts & Media | 5 (6.2%) | 76 (93.8%) |
| Legal Services & Support | 13 (35.1%) | 24 (64.9%) |
| Education Instruction & Library | 52 (14.6%) | 304 (85.4%) |
| Arts, Media & Entertainment | 50 (34.7%) | 94 (65.3%) |
| Health Diagnosing & Treating | 53 (12.7%) | 363 (87.3%) |
| Health Technologists | 53 (15.4%) | 291 (84.6%) |
| Total (Category) | 608 (36.1%) | 1,078 (63.9%) |
| Total (Overall) | 1,971 (56.0%) | 1,547 (44.0%) |
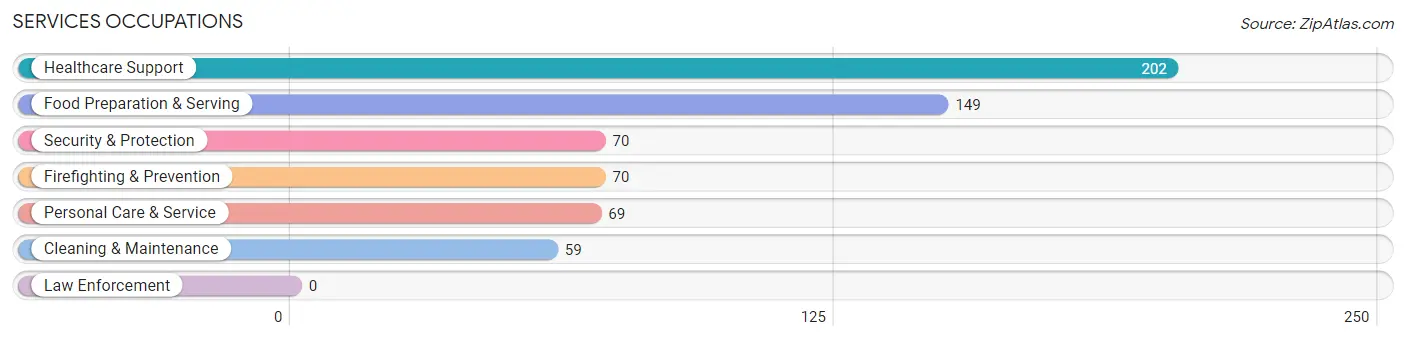
Services Occupations
The most common Services occupations in Pea Ridge are Healthcare Support (202 | 5.7%), Food Preparation & Serving (149 | 4.2%), Security & Protection (70 | 2.0%), Firefighting & Prevention (70 | 2.0%), and Personal Care & Service (69 | 2.0%).
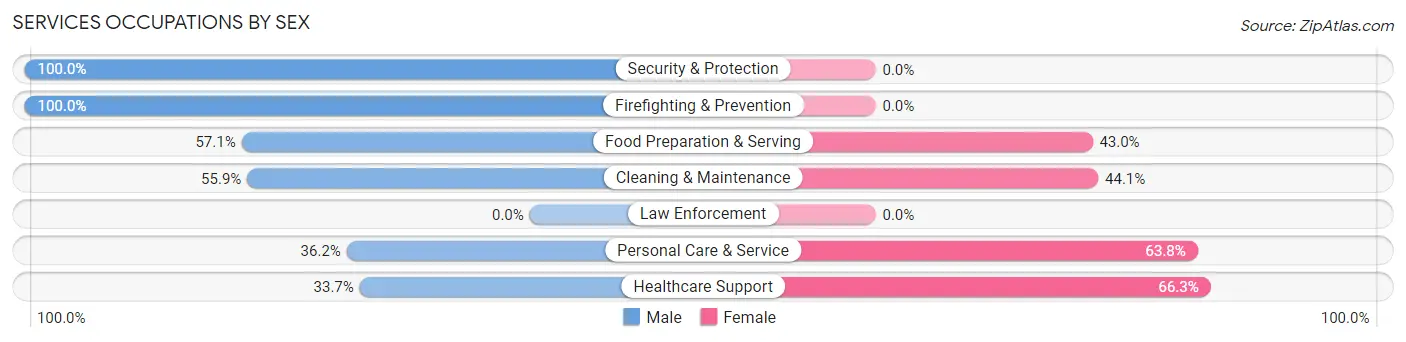
Services Occupations by Sex
Within the Services occupations in Pea Ridge, the most male-oriented occupations are Security & Protection (100.0%), Firefighting & Prevention (100.0%), and Food Preparation & Serving (57.1%), while the most female-oriented occupations are Healthcare Support (66.3%), Personal Care & Service (63.8%), and Cleaning & Maintenance (44.1%).
| Occupation | Male | Female |
| Healthcare Support | 68 (33.7%) | 134 (66.3%) |
| Security & Protection | 70 (100.0%) | 0 (0.0%) |
| Firefighting & Prevention | 70 (100.0%) | 0 (0.0%) |
| Law Enforcement | 0 (0.0%) | 0 (0.0%) |
| Food Preparation & Serving | 85 (57.1%) | 64 (42.9%) |
| Cleaning & Maintenance | 33 (55.9%) | 26 (44.1%) |
| Personal Care & Service | 25 (36.2%) | 44 (63.8%) |
| Total (Category) | 281 (51.2%) | 268 (48.8%) |
| Total (Overall) | 1,971 (56.0%) | 1,547 (44.0%) |
Sales and Office Occupations
The most common Sales and Office occupations in Pea Ridge are Sales & Related (453 | 12.9%), and Office & Administration (313 | 8.9%).

Sales and Office Occupations by Sex

| Occupation | Male | Female |
| Sales & Related | 406 (89.6%) | 47 (10.4%) |
| Office & Administration | 180 (57.5%) | 133 (42.5%) |
| Total (Category) | 586 (76.5%) | 180 (23.5%) |
| Total (Overall) | 1,971 (56.0%) | 1,547 (44.0%) |
Natural Resources, Construction and Maintenance Occupations
The most common Natural Resources, Construction and Maintenance occupations in Pea Ridge are Construction & Extraction (86 | 2.4%), and Installation, Maintenance & Repair (84 | 2.4%).
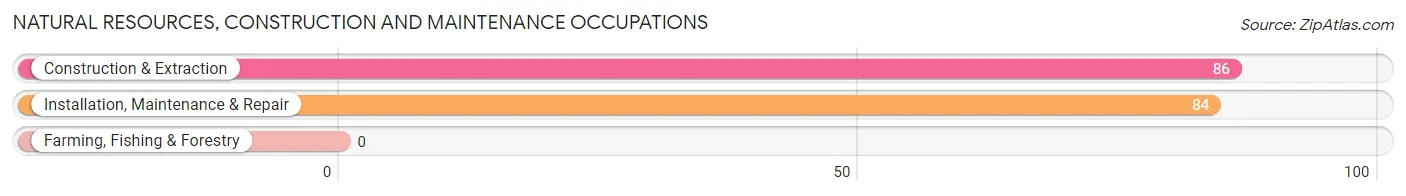
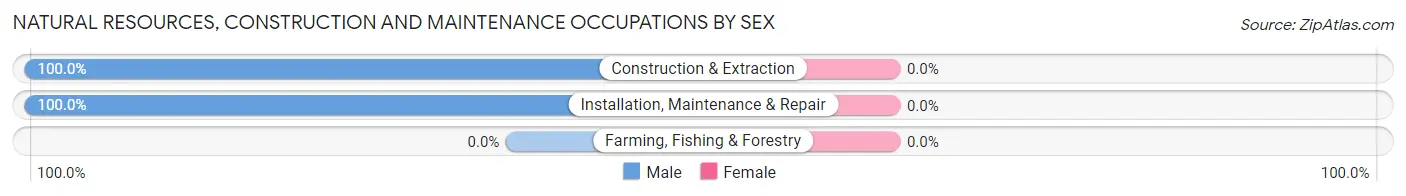
Natural Resources, Construction and Maintenance Occupations by Sex
| Occupation | Male | Female |
| Farming, Fishing & Forestry | 0 (0.0%) | 0 (0.0%) |
| Construction & Extraction | 86 (100.0%) | 0 (0.0%) |
| Installation, Maintenance & Repair | 84 (100.0%) | 0 (0.0%) |
| Total (Category) | 170 (100.0%) | 0 (0.0%) |
| Total (Overall) | 1,971 (56.0%) | 1,547 (44.0%) |
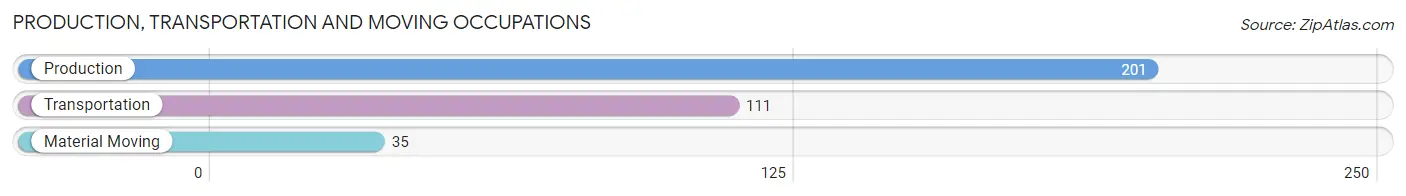
Production, Transportation and Moving Occupations
The most common Production, Transportation and Moving occupations in Pea Ridge are Production (201 | 5.7%), Transportation (111 | 3.2%), and Material Moving (35 | 1.0%).
Production, Transportation and Moving Occupations by Sex
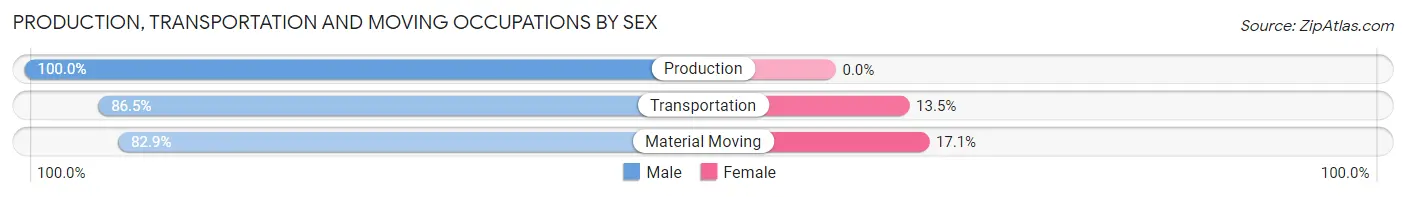
| Occupation | Male | Female |
| Production | 201 (100.0%) | 0 (0.0%) |
| Transportation | 96 (86.5%) | 15 (13.5%) |
| Material Moving | 29 (82.9%) | 6 (17.1%) |
| Total (Category) | 326 (94.0%) | 21 (6.0%) |
| Total (Overall) | 1,971 (56.0%) | 1,547 (44.0%) |
Employment Industries by Sex in Pea Ridge
Employment Industries in Pea Ridge
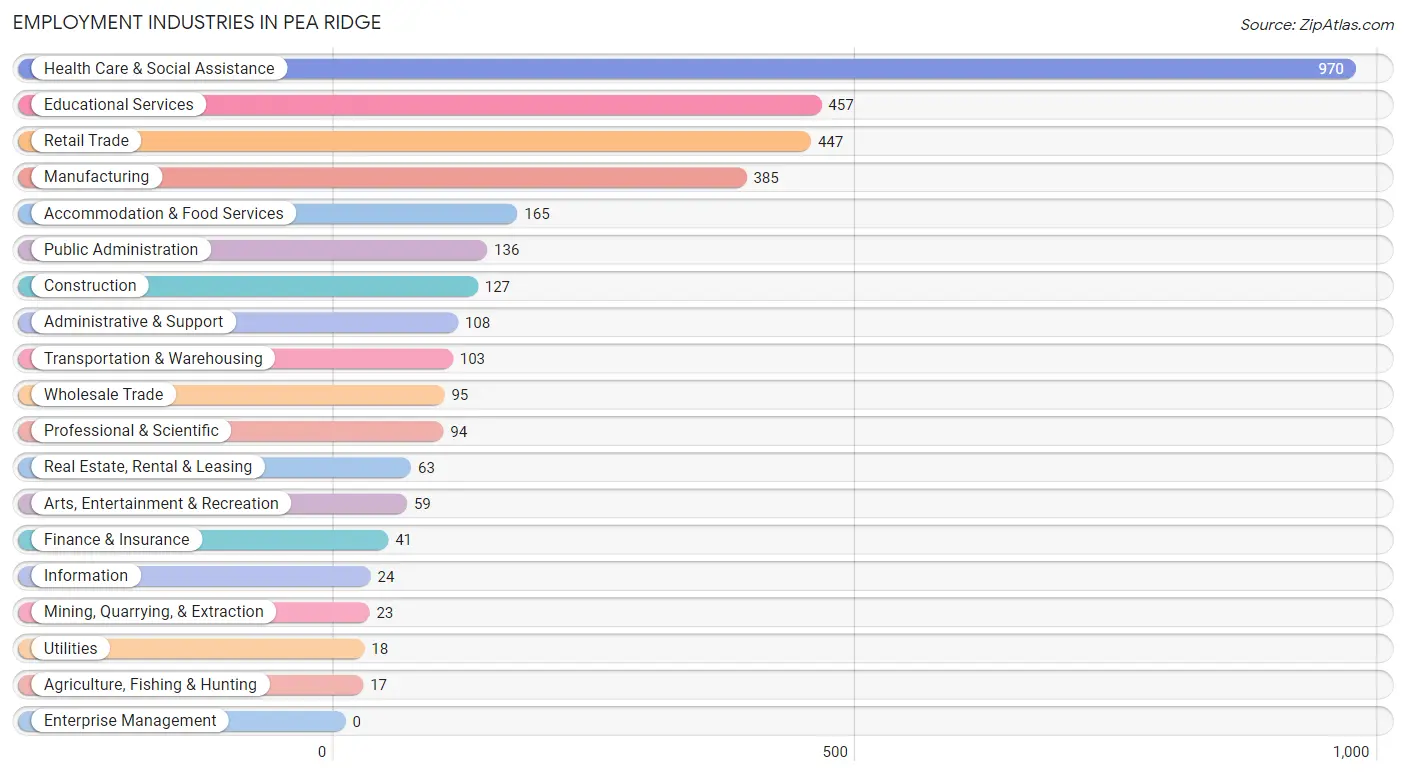
The major employment industries in Pea Ridge include Health Care & Social Assistance (970 | 27.6%), Educational Services (457 | 13.0%), Retail Trade (447 | 12.7%), Manufacturing (385 | 10.9%), and Accommodation & Food Services (165 | 4.7%).
Employment Industries by Sex in Pea Ridge
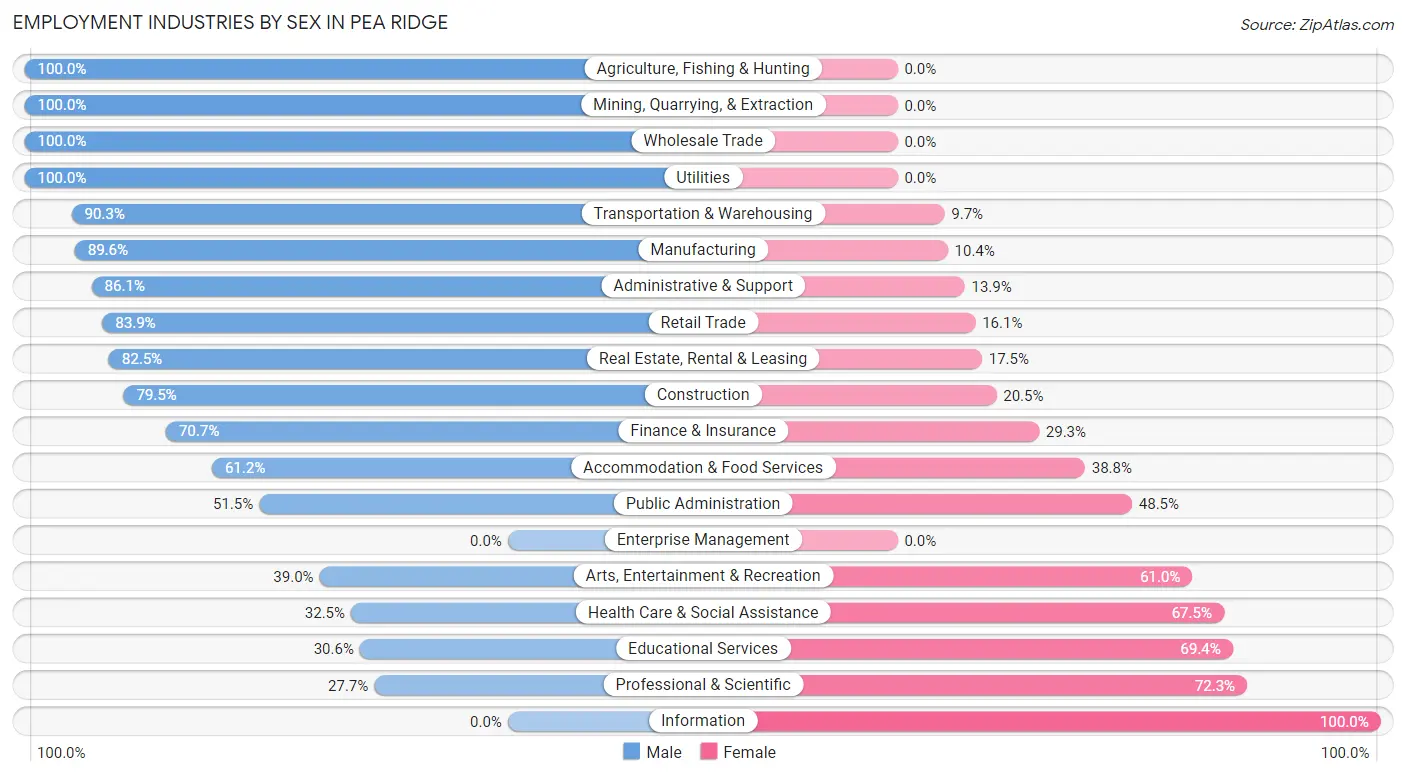
The Pea Ridge industries that see more men than women are Agriculture, Fishing & Hunting (100.0%), Mining, Quarrying, & Extraction (100.0%), and Wholesale Trade (100.0%), whereas the industries that tend to have a higher number of women are Information (100.0%), Professional & Scientific (72.3%), and Educational Services (69.4%).
| Industry | Male | Female |
| Agriculture, Fishing & Hunting | 17 (100.0%) | 0 (0.0%) |
| Mining, Quarrying, & Extraction | 23 (100.0%) | 0 (0.0%) |
| Construction | 101 (79.5%) | 26 (20.5%) |
| Manufacturing | 345 (89.6%) | 40 (10.4%) |
| Wholesale Trade | 95 (100.0%) | 0 (0.0%) |
| Retail Trade | 375 (83.9%) | 72 (16.1%) |
| Transportation & Warehousing | 93 (90.3%) | 10 (9.7%) |
| Utilities | 18 (100.0%) | 0 (0.0%) |
| Information | 0 (0.0%) | 24 (100.0%) |
| Finance & Insurance | 29 (70.7%) | 12 (29.3%) |
| Real Estate, Rental & Leasing | 52 (82.5%) | 11 (17.5%) |
| Professional & Scientific | 26 (27.7%) | 68 (72.3%) |
| Enterprise Management | 0 (0.0%) | 0 (0.0%) |
| Administrative & Support | 93 (86.1%) | 15 (13.9%) |
| Educational Services | 140 (30.6%) | 317 (69.4%) |
| Health Care & Social Assistance | 315 (32.5%) | 655 (67.5%) |
| Arts, Entertainment & Recreation | 23 (39.0%) | 36 (61.0%) |
| Accommodation & Food Services | 101 (61.2%) | 64 (38.8%) |
| Public Administration | 70 (51.5%) | 66 (48.5%) |
| Total | 1,971 (56.0%) | 1,547 (44.0%) |
Education in Pea Ridge
School Enrollment in Pea Ridge
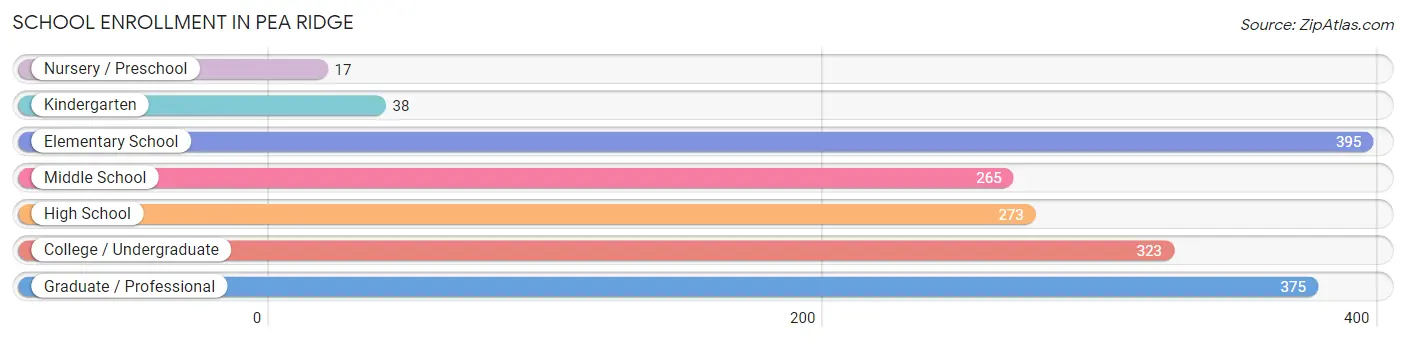
The most common levels of schooling among the 1,686 students in Pea Ridge are elementary school (395 | 23.4%), graduate / professional (375 | 22.2%), and college / undergraduate (323 | 19.2%).
| School Level | # Students | % Students |
| Nursery / Preschool | 17 | 1.0% |
| Kindergarten | 38 | 2.2% |
| Elementary School | 395 | 23.4% |
| Middle School | 265 | 15.7% |
| High School | 273 | 16.2% |
| College / Undergraduate | 323 | 19.2% |
| Graduate / Professional | 375 | 22.2% |
| Total | 1,686 | 100.0% |
School Enrollment by Age by Funding Source in Pea Ridge
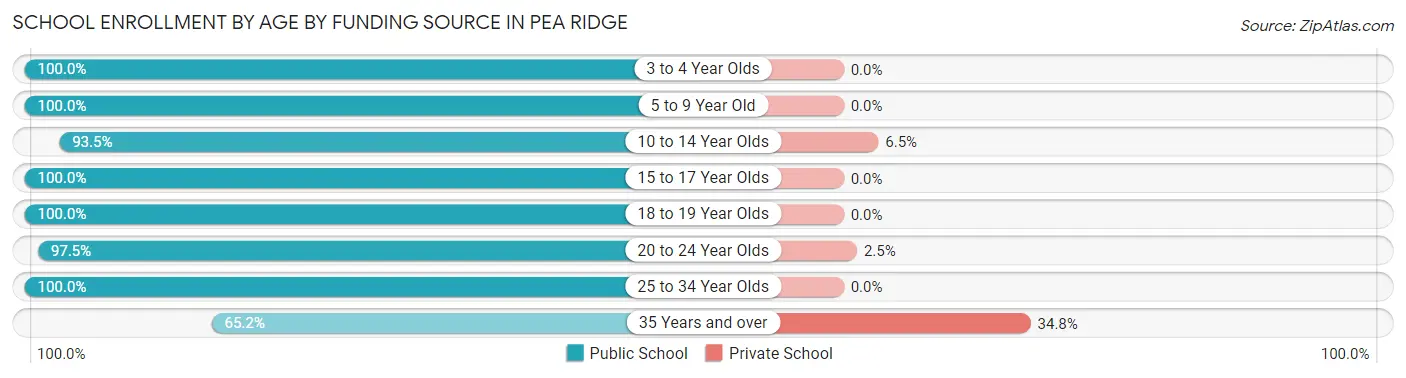
Out of a total of 1,686 students who are enrolled in schools in Pea Ridge, 111 (6.6%) attend a private institution, while the remaining 1,575 (93.4%) are enrolled in public schools. The age group of 35 years and over has the highest likelihood of being enrolled in private schools, with 86 (34.8% in the age bracket) enrolled. Conversely, the age group of 3 to 4 year olds has the lowest likelihood of being enrolled in a private school, with 17 (100.0% in the age bracket) attending a public institution.
| Age Bracket | Public School | Private School |
| 3 to 4 Year Olds | 17 (100.0%) | 0 (0.0%) |
| 5 to 9 Year Old | 404 (100.0%) | 0 (0.0%) |
| 10 to 14 Year Olds | 275 (93.5%) | 19 (6.5%) |
| 15 to 17 Year Olds | 249 (100.0%) | 0 (0.0%) |
| 18 to 19 Year Olds | 34 (100.0%) | 0 (0.0%) |
| 20 to 24 Year Olds | 236 (97.5%) | 6 (2.5%) |
| 25 to 34 Year Olds | 199 (100.0%) | 0 (0.0%) |
| 35 Years and over | 161 (65.2%) | 86 (34.8%) |
| Total | 1,575 (93.4%) | 111 (6.6%) |
Educational Attainment by Field of Study in Pea Ridge
Business (396 | 17.9%), education (389 | 17.5%), social sciences (267 | 12.0%), science & technology (267 | 12.0%), and psychology (222 | 10.0%) are the most common fields of study among 2,217 individuals in Pea Ridge who have obtained a bachelor's degree or higher.
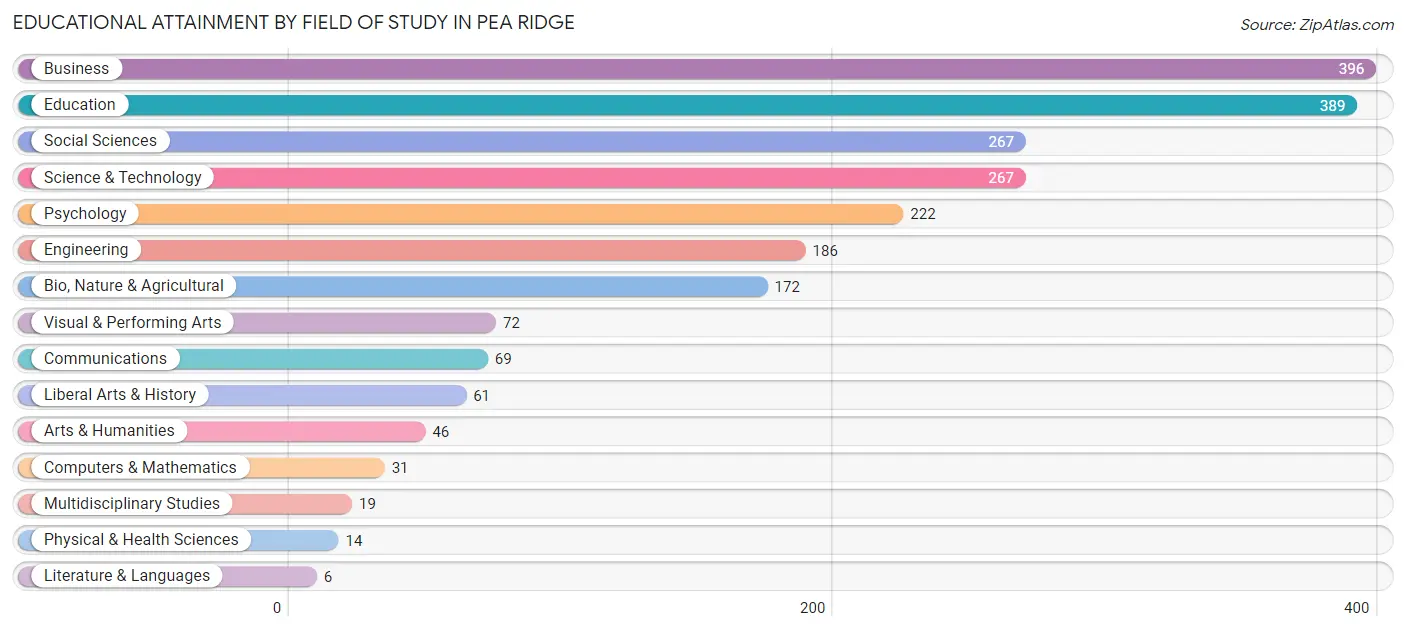
| Field of Study | # Graduates | % Graduates |
| Computers & Mathematics | 31 | 1.4% |
| Bio, Nature & Agricultural | 172 | 7.8% |
| Physical & Health Sciences | 14 | 0.6% |
| Psychology | 222 | 10.0% |
| Social Sciences | 267 | 12.0% |
| Engineering | 186 | 8.4% |
| Multidisciplinary Studies | 19 | 0.9% |
| Science & Technology | 267 | 12.0% |
| Business | 396 | 17.9% |
| Education | 389 | 17.5% |
| Literature & Languages | 6 | 0.3% |
| Liberal Arts & History | 61 | 2.8% |
| Visual & Performing Arts | 72 | 3.3% |
| Communications | 69 | 3.1% |
| Arts & Humanities | 46 | 2.1% |
| Total | 2,217 | 100.0% |
Transportation & Commute in Pea Ridge
Vehicle Availability by Sex in Pea Ridge
The most prevalent vehicle ownership categories in Pea Ridge are males with 2 vehicles (829, accounting for 43.5%) and females with 2 vehicles (711, making up 53.6%).
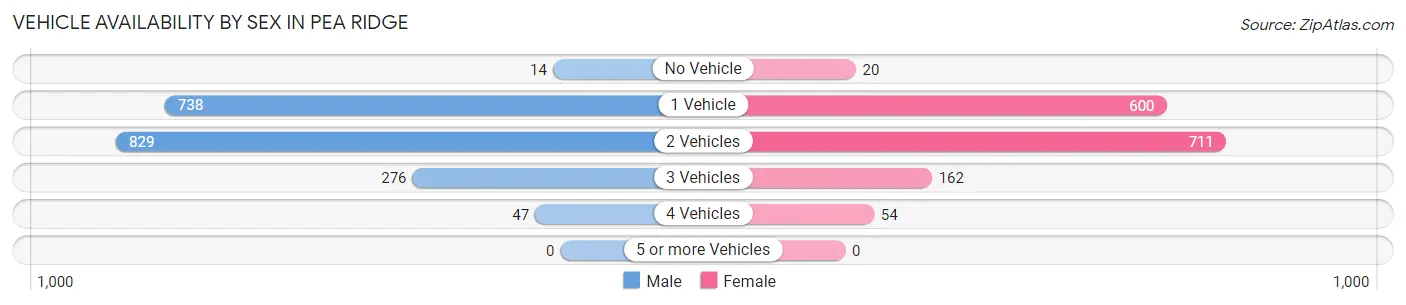
| Vehicles Available | Male | Female |
| No Vehicle | 14 (0.7%) | 20 (1.3%) |
| 1 Vehicle | 738 (38.8%) | 600 (38.8%) |
| 2 Vehicles | 829 (43.5%) | 711 (46.0%) |
| 3 Vehicles | 276 (14.5%) | 162 (10.5%) |
| 4 Vehicles | 47 (2.5%) | 54 (3.5%) |
| 5 or more Vehicles | 0 (0.0%) | 0 (0.0%) |
| Total | 1,904 (100.0%) | 1,547 (100.0%) |
Commute Time in Pea Ridge
The most frequently occuring commute durations in Pea Ridge are 15 to 19 minutes (1,098 commuters, 32.8%), 10 to 14 minutes (645 commuters, 19.3%), and 20 to 24 minutes (439 commuters, 13.1%).
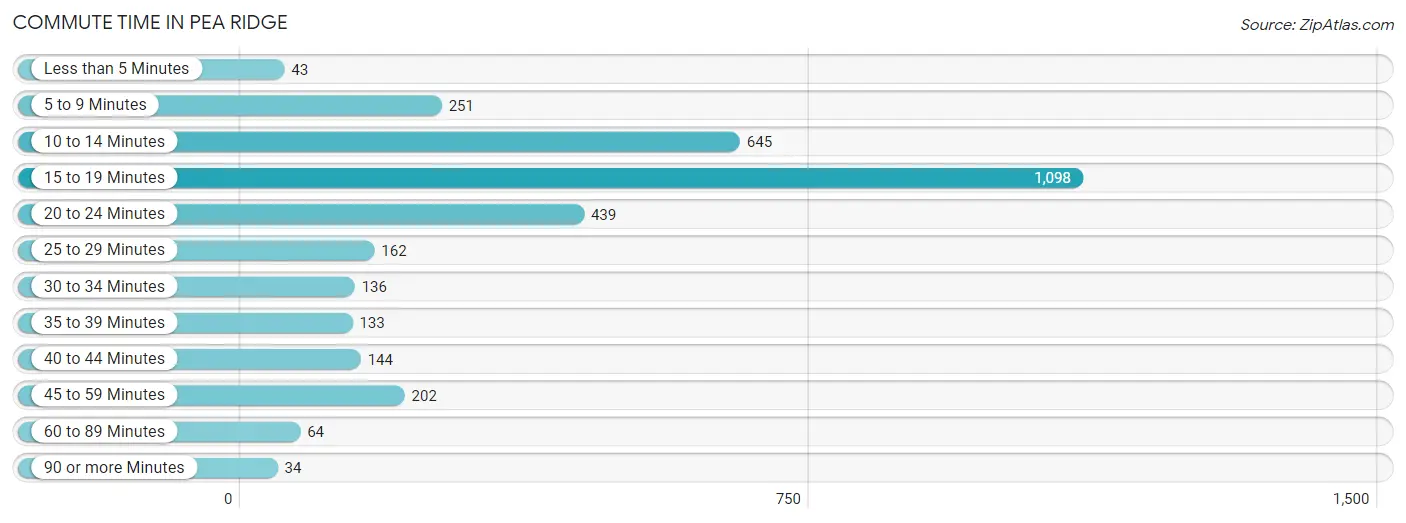
| Commute Time | # Commuters | % Commuters |
| Less than 5 Minutes | 43 | 1.3% |
| 5 to 9 Minutes | 251 | 7.5% |
| 10 to 14 Minutes | 645 | 19.3% |
| 15 to 19 Minutes | 1,098 | 32.8% |
| 20 to 24 Minutes | 439 | 13.1% |
| 25 to 29 Minutes | 162 | 4.8% |
| 30 to 34 Minutes | 136 | 4.1% |
| 35 to 39 Minutes | 133 | 4.0% |
| 40 to 44 Minutes | 144 | 4.3% |
| 45 to 59 Minutes | 202 | 6.0% |
| 60 to 89 Minutes | 64 | 1.9% |
| 90 or more Minutes | 34 | 1.0% |
Commute Time by Sex in Pea Ridge
The most common commute times in Pea Ridge are 15 to 19 minutes (528 commuters, 27.9%) for males and 15 to 19 minutes (570 commuters, 39.0%) for females.
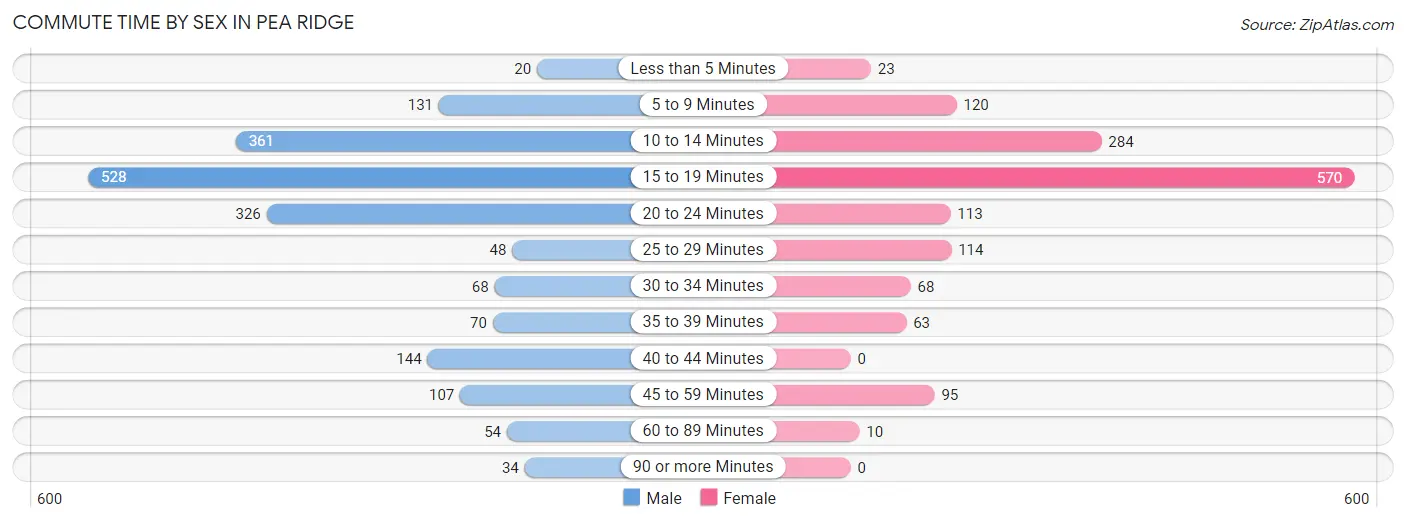
| Commute Time | Male | Female |
| Less than 5 Minutes | 20 (1.1%) | 23 (1.6%) |
| 5 to 9 Minutes | 131 (6.9%) | 120 (8.2%) |
| 10 to 14 Minutes | 361 (19.1%) | 284 (19.5%) |
| 15 to 19 Minutes | 528 (27.9%) | 570 (39.0%) |
| 20 to 24 Minutes | 326 (17.2%) | 113 (7.7%) |
| 25 to 29 Minutes | 48 (2.5%) | 114 (7.8%) |
| 30 to 34 Minutes | 68 (3.6%) | 68 (4.7%) |
| 35 to 39 Minutes | 70 (3.7%) | 63 (4.3%) |
| 40 to 44 Minutes | 144 (7.6%) | 0 (0.0%) |
| 45 to 59 Minutes | 107 (5.7%) | 95 (6.5%) |
| 60 to 89 Minutes | 54 (2.9%) | 10 (0.7%) |
| 90 or more Minutes | 34 (1.8%) | 0 (0.0%) |
Time of Departure to Work by Sex in Pea Ridge
The most frequent times of departure to work in Pea Ridge are 7:30 AM to 7:59 AM (315, 16.7%) for males and 12:00 PM to 3:59 PM (257, 17.6%) for females.
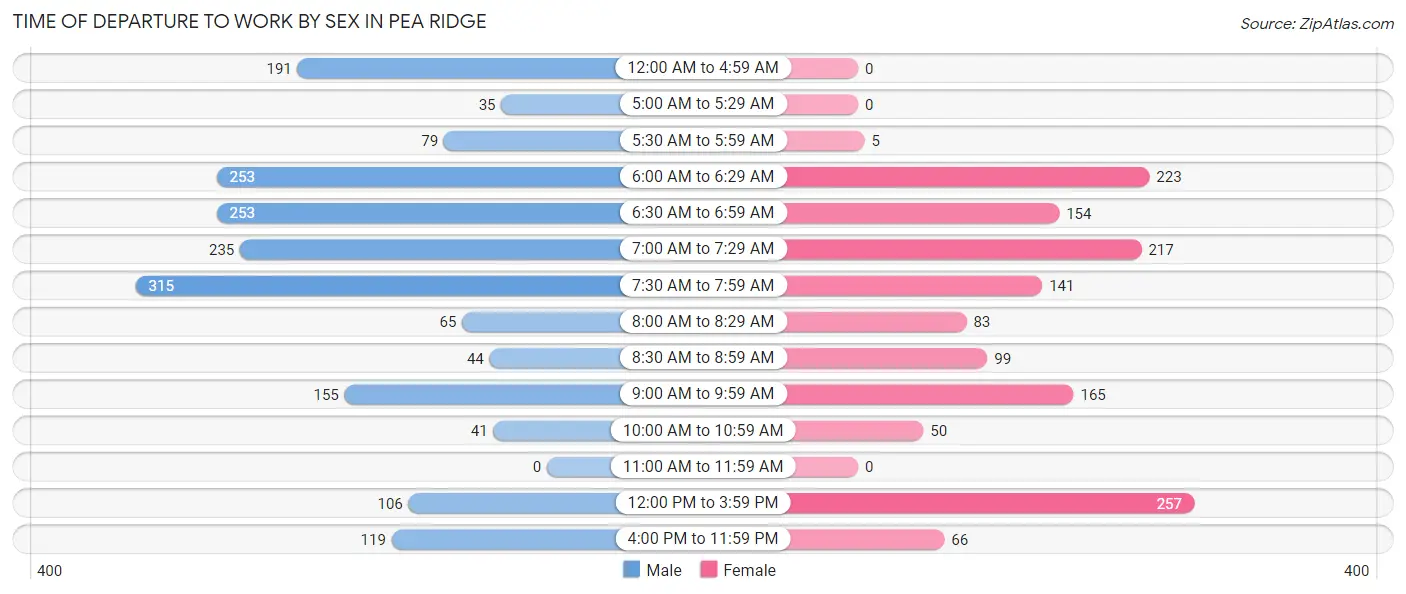
| Time of Departure | Male | Female |
| 12:00 AM to 4:59 AM | 191 (10.1%) | 0 (0.0%) |
| 5:00 AM to 5:29 AM | 35 (1.8%) | 0 (0.0%) |
| 5:30 AM to 5:59 AM | 79 (4.2%) | 5 (0.3%) |
| 6:00 AM to 6:29 AM | 253 (13.4%) | 223 (15.3%) |
| 6:30 AM to 6:59 AM | 253 (13.4%) | 154 (10.5%) |
| 7:00 AM to 7:29 AM | 235 (12.4%) | 217 (14.9%) |
| 7:30 AM to 7:59 AM | 315 (16.7%) | 141 (9.7%) |
| 8:00 AM to 8:29 AM | 65 (3.4%) | 83 (5.7%) |
| 8:30 AM to 8:59 AM | 44 (2.3%) | 99 (6.8%) |
| 9:00 AM to 9:59 AM | 155 (8.2%) | 165 (11.3%) |
| 10:00 AM to 10:59 AM | 41 (2.2%) | 50 (3.4%) |
| 11:00 AM to 11:59 AM | 0 (0.0%) | 0 (0.0%) |
| 12:00 PM to 3:59 PM | 106 (5.6%) | 257 (17.6%) |
| 4:00 PM to 11:59 PM | 119 (6.3%) | 66 (4.5%) |
| Total | 1,891 (100.0%) | 1,460 (100.0%) |
Housing Occupancy in Pea Ridge
Occupancy by Ownership in Pea Ridge
Of the total 3,225 dwellings in Pea Ridge, owner-occupied units account for 2,032 (63.0%), while renter-occupied units make up 1,193 (37.0%).
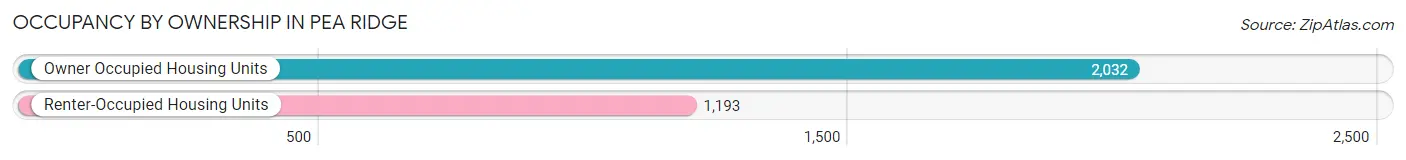
| Occupancy | # Housing Units | % Housing Units |
| Owner Occupied Housing Units | 2,032 | 63.0% |
| Renter-Occupied Housing Units | 1,193 | 37.0% |
| Total Occupied Housing Units | 3,225 | 100.0% |
Occupancy by Household Size in Pea Ridge
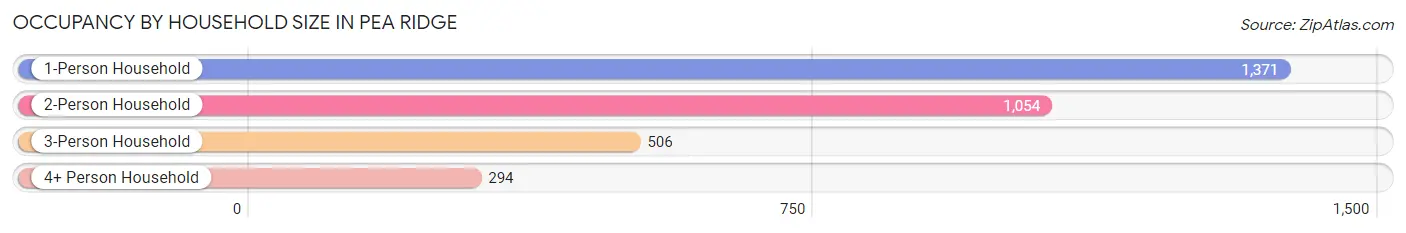
| Household Size | # Housing Units | % Housing Units |
| 1-Person Household | 1,371 | 42.5% |
| 2-Person Household | 1,054 | 32.7% |
| 3-Person Household | 506 | 15.7% |
| 4+ Person Household | 294 | 9.1% |
| Total Housing Units | 3,225 | 100.0% |
Occupancy by Ownership by Household Size in Pea Ridge
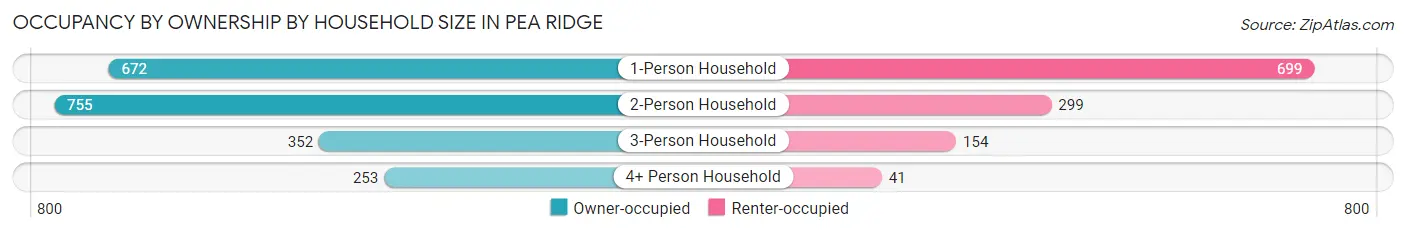
| Household Size | Owner-occupied | Renter-occupied |
| 1-Person Household | 672 (49.0%) | 699 (51.0%) |
| 2-Person Household | 755 (71.6%) | 299 (28.4%) |
| 3-Person Household | 352 (69.6%) | 154 (30.4%) |
| 4+ Person Household | 253 (86.1%) | 41 (14.0%) |
| Total Housing Units | 2,032 (63.0%) | 1,193 (37.0%) |
Occupancy by Educational Attainment in Pea Ridge
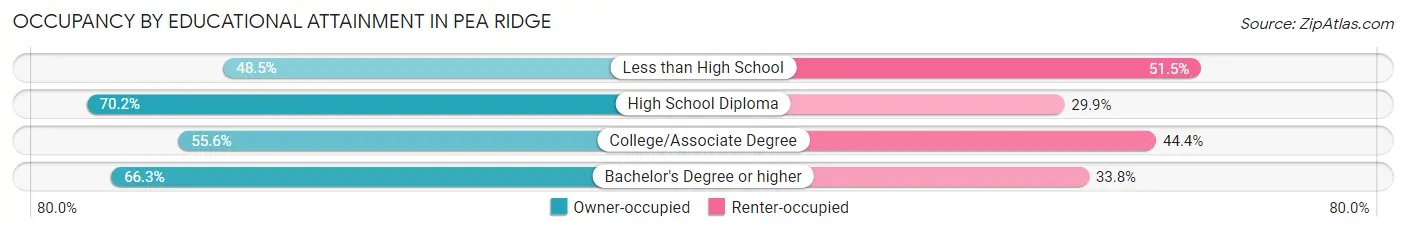
| Household Size | Owner-occupied | Renter-occupied |
| Less than High School | 63 (48.5%) | 67 (51.5%) |
| High School Diploma | 383 (70.2%) | 163 (29.8%) |
| College/Associate Degree | 536 (55.6%) | 428 (44.4%) |
| Bachelor's Degree or higher | 1,050 (66.2%) | 535 (33.8%) |
Occupancy by Age of Householder in Pea Ridge
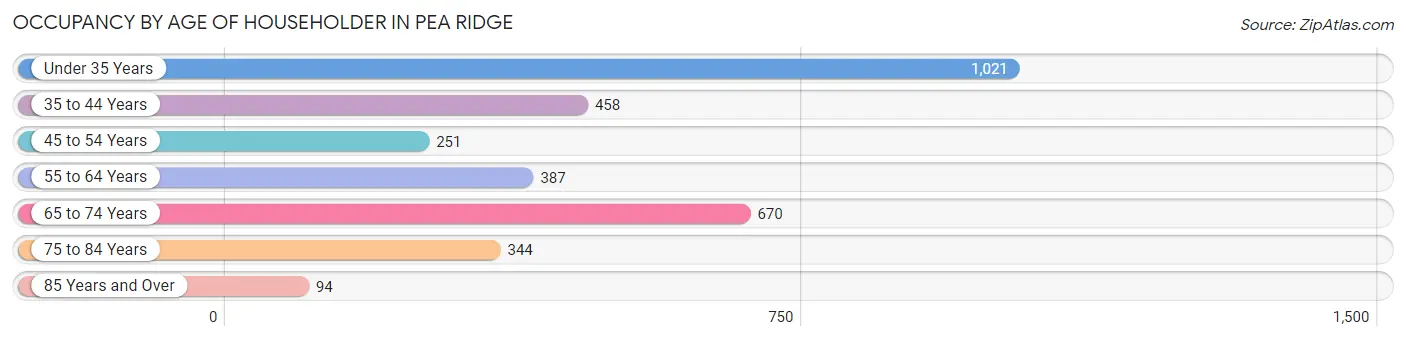
| Age Bracket | # Households | % Households |
| Under 35 Years | 1,021 | 31.7% |
| 35 to 44 Years | 458 | 14.2% |
| 45 to 54 Years | 251 | 7.8% |
| 55 to 64 Years | 387 | 12.0% |
| 65 to 74 Years | 670 | 20.8% |
| 75 to 84 Years | 344 | 10.7% |
| 85 Years and Over | 94 | 2.9% |
| Total | 3,225 | 100.0% |
Housing Finances in Pea Ridge
Median Income by Occupancy in Pea Ridge
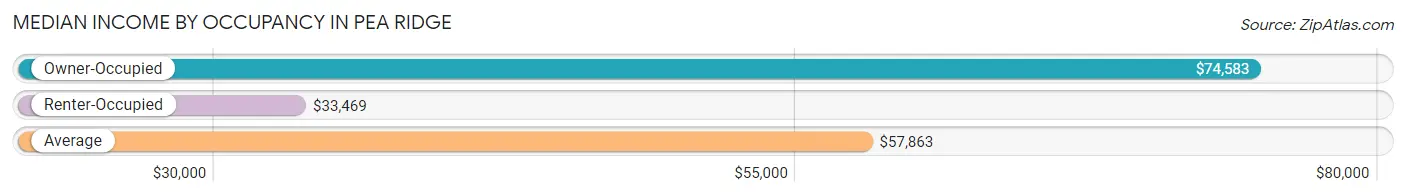
| Occupancy Type | # Households | Median Income |
| Owner-Occupied | 2,032 (63.0%) | $74,583 |
| Renter-Occupied | 1,193 (37.0%) | $33,469 |
| Average | 3,225 (100.0%) | $57,863 |
Occupancy by Householder Income Bracket in Pea Ridge
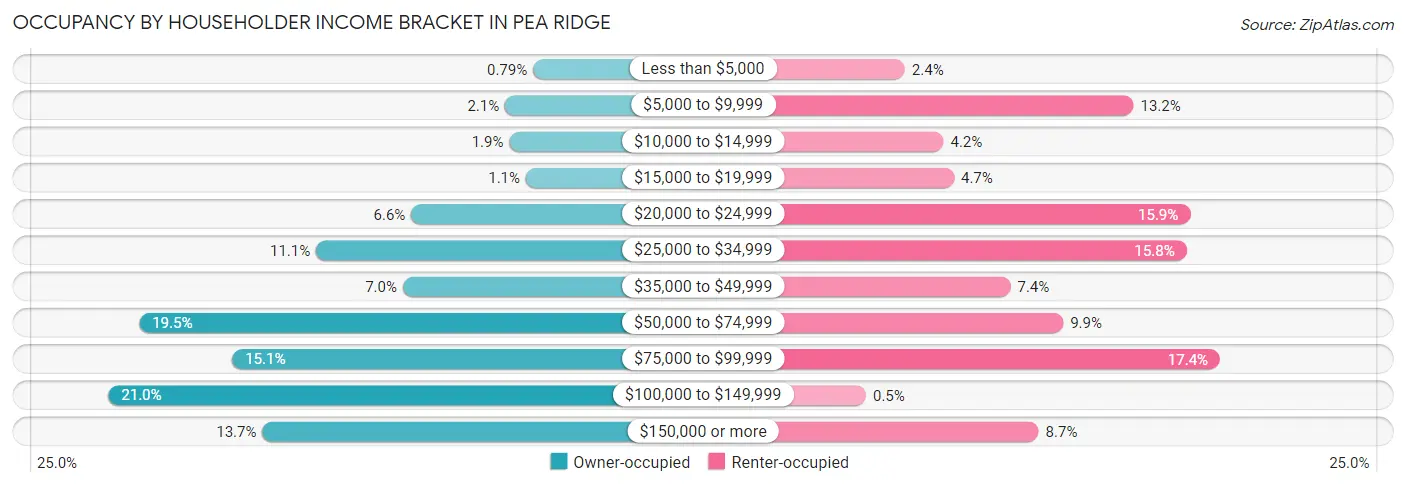
| Income Bracket | Owner-occupied | Renter-occupied |
| Less than $5,000 | 16 (0.8%) | 28 (2.4%) |
| $5,000 to $9,999 | 43 (2.1%) | 158 (13.2%) |
| $10,000 to $14,999 | 39 (1.9%) | 50 (4.2%) |
| $15,000 to $19,999 | 23 (1.1%) | 56 (4.7%) |
| $20,000 to $24,999 | 134 (6.6%) | 190 (15.9%) |
| $25,000 to $34,999 | 226 (11.1%) | 188 (15.8%) |
| $35,000 to $49,999 | 142 (7.0%) | 88 (7.4%) |
| $50,000 to $74,999 | 397 (19.5%) | 118 (9.9%) |
| $75,000 to $99,999 | 307 (15.1%) | 207 (17.3%) |
| $100,000 to $149,999 | 427 (21.0%) | 6 (0.5%) |
| $150,000 or more | 278 (13.7%) | 104 (8.7%) |
| Total | 2,032 (100.0%) | 1,193 (100.0%) |
Monthly Housing Cost Tiers in Pea Ridge
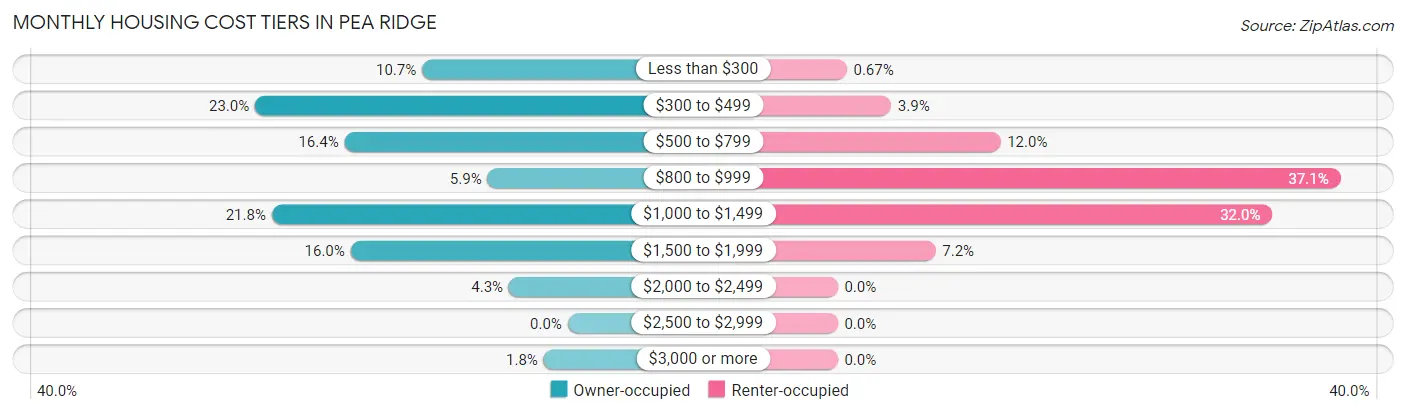
| Monthly Cost | Owner-occupied | Renter-occupied |
| Less than $300 | 218 (10.7%) | 8 (0.7%) |
| $300 to $499 | 468 (23.0%) | 47 (3.9%) |
| $500 to $799 | 334 (16.4%) | 143 (12.0%) |
| $800 to $999 | 120 (5.9%) | 442 (37.0%) |
| $1,000 to $1,499 | 443 (21.8%) | 382 (32.0%) |
| $1,500 to $1,999 | 325 (16.0%) | 86 (7.2%) |
| $2,000 to $2,499 | 88 (4.3%) | 0 (0.0%) |
| $2,500 to $2,999 | 0 (0.0%) | 0 (0.0%) |
| $3,000 or more | 36 (1.8%) | 0 (0.0%) |
| Total | 2,032 (100.0%) | 1,193 (100.0%) |
Physical Housing Characteristics in Pea Ridge
Housing Structures in Pea Ridge
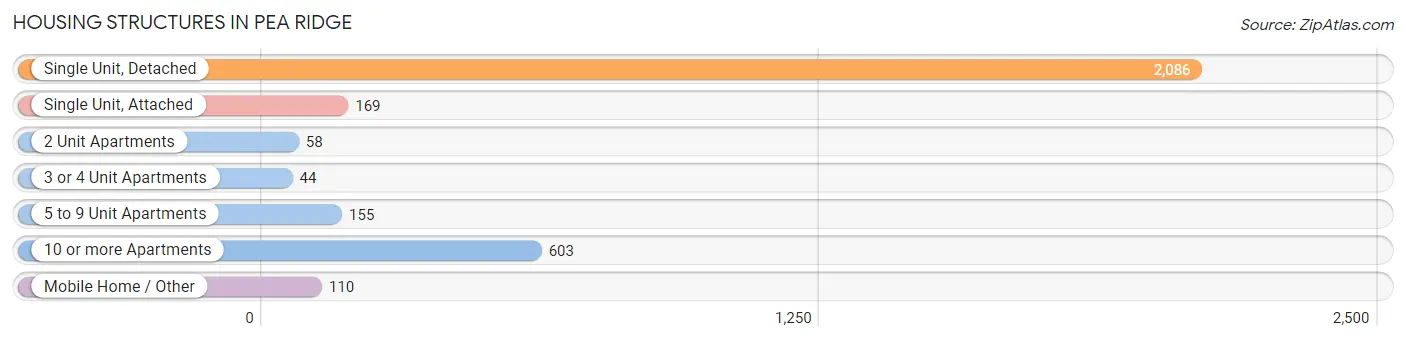
| Structure Type | # Housing Units | % Housing Units |
| Single Unit, Detached | 2,086 | 64.7% |
| Single Unit, Attached | 169 | 5.2% |
| 2 Unit Apartments | 58 | 1.8% |
| 3 or 4 Unit Apartments | 44 | 1.4% |
| 5 to 9 Unit Apartments | 155 | 4.8% |
| 10 or more Apartments | 603 | 18.7% |
| Mobile Home / Other | 110 | 3.4% |
| Total | 3,225 | 100.0% |
Housing Structures by Occupancy in Pea Ridge
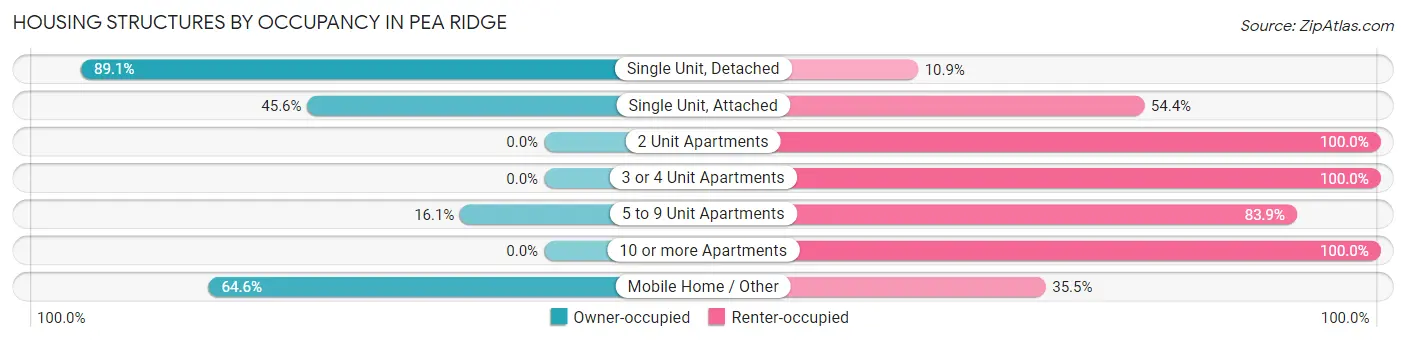
| Structure Type | Owner-occupied | Renter-occupied |
| Single Unit, Detached | 1,859 (89.1%) | 227 (10.9%) |
| Single Unit, Attached | 77 (45.6%) | 92 (54.4%) |
| 2 Unit Apartments | 0 (0.0%) | 58 (100.0%) |
| 3 or 4 Unit Apartments | 0 (0.0%) | 44 (100.0%) |
| 5 to 9 Unit Apartments | 25 (16.1%) | 130 (83.9%) |
| 10 or more Apartments | 0 (0.0%) | 603 (100.0%) |
| Mobile Home / Other | 71 (64.5%) | 39 (35.4%) |
| Total | 2,032 (63.0%) | 1,193 (37.0%) |
Housing Structures by Number of Rooms in Pea Ridge
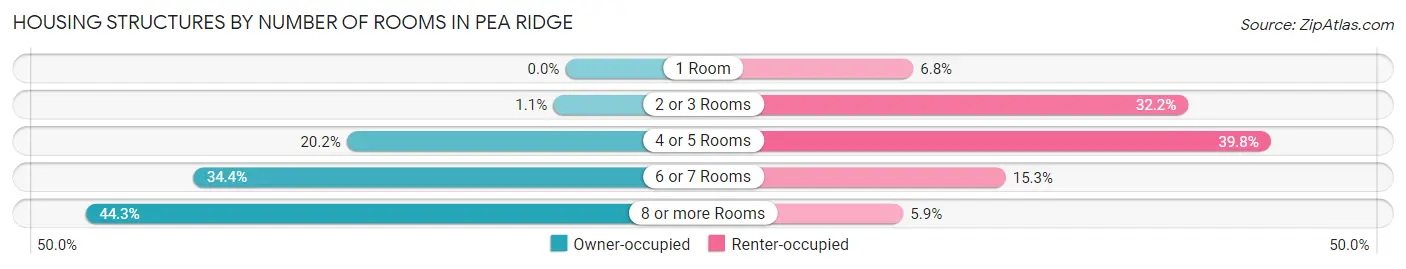
| Number of Rooms | Owner-occupied | Renter-occupied |
| 1 Room | 0 (0.0%) | 81 (6.8%) |
| 2 or 3 Rooms | 23 (1.1%) | 384 (32.2%) |
| 4 or 5 Rooms | 411 (20.2%) | 475 (39.8%) |
| 6 or 7 Rooms | 698 (34.4%) | 183 (15.3%) |
| 8 or more Rooms | 900 (44.3%) | 70 (5.9%) |
| Total | 2,032 (100.0%) | 1,193 (100.0%) |
Housing Structure by Heating Type in Pea Ridge
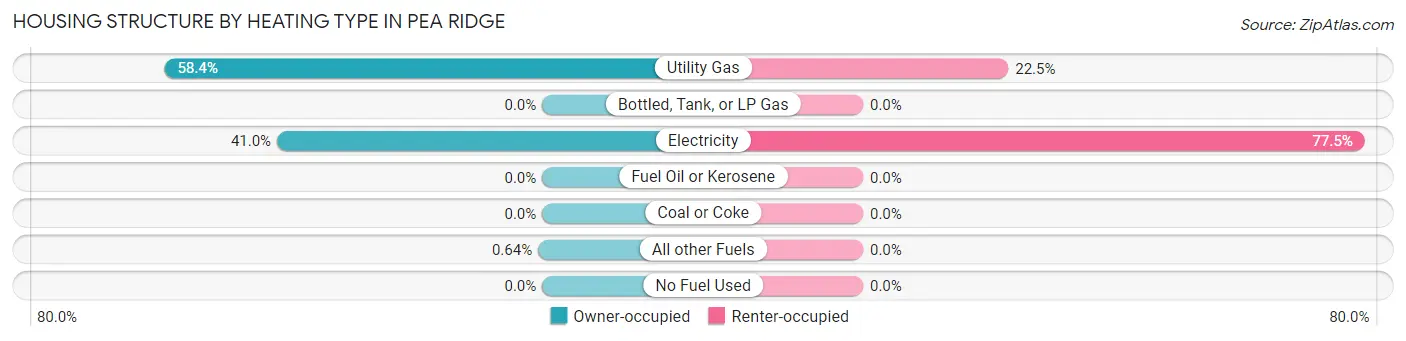
| Heating Type | Owner-occupied | Renter-occupied |
| Utility Gas | 1,186 (58.4%) | 268 (22.5%) |
| Bottled, Tank, or LP Gas | 0 (0.0%) | 0 (0.0%) |
| Electricity | 833 (41.0%) | 925 (77.5%) |
| Fuel Oil or Kerosene | 0 (0.0%) | 0 (0.0%) |
| Coal or Coke | 0 (0.0%) | 0 (0.0%) |
| All other Fuels | 13 (0.6%) | 0 (0.0%) |
| No Fuel Used | 0 (0.0%) | 0 (0.0%) |
| Total | 2,032 (100.0%) | 1,193 (100.0%) |
Household Vehicle Usage in Pea Ridge
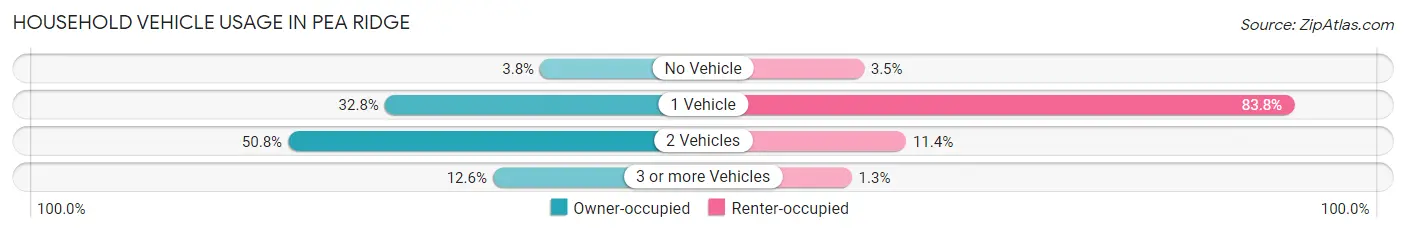
| Vehicles per Household | Owner-occupied | Renter-occupied |
| No Vehicle | 77 (3.8%) | 42 (3.5%) |
| 1 Vehicle | 666 (32.8%) | 1,000 (83.8%) |
| 2 Vehicles | 1,033 (50.8%) | 136 (11.4%) |
| 3 or more Vehicles | 256 (12.6%) | 15 (1.3%) |
| Total | 2,032 (100.0%) | 1,193 (100.0%) |
Real Estate & Mortgages in Pea Ridge
Real Estate and Mortgage Overview in Pea Ridge
| Characteristic | Without Mortgage | With Mortgage |
| Housing Units | 968 | 1,064 |
| Median Property Value | $144,500 | $179,200 |
| Median Household Income | $38,600 | $208 |
| Monthly Housing Costs | $376 | $36 |
| Real Estate Taxes | $878 | $0 |
Property Value by Mortgage Status in Pea Ridge
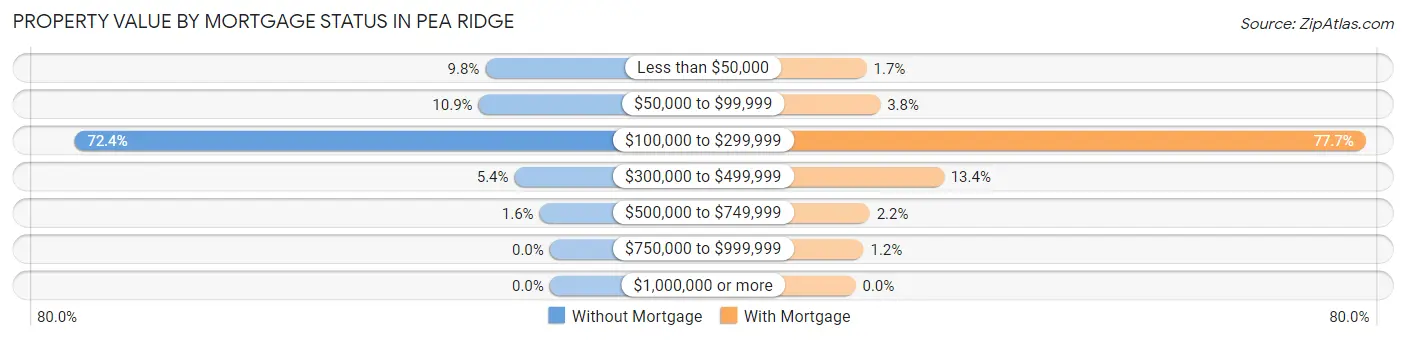
| Property Value | Without Mortgage | With Mortgage |
| Less than $50,000 | 95 (9.8%) | 18 (1.7%) |
| $50,000 to $99,999 | 105 (10.8%) | 40 (3.8%) |
| $100,000 to $299,999 | 701 (72.4%) | 827 (77.7%) |
| $300,000 to $499,999 | 52 (5.4%) | 143 (13.4%) |
| $500,000 to $749,999 | 15 (1.5%) | 23 (2.2%) |
| $750,000 to $999,999 | 0 (0.0%) | 13 (1.2%) |
| $1,000,000 or more | 0 (0.0%) | 0 (0.0%) |
| Total | 968 (100.0%) | 1,064 (100.0%) |
Household Income by Mortgage Status in Pea Ridge
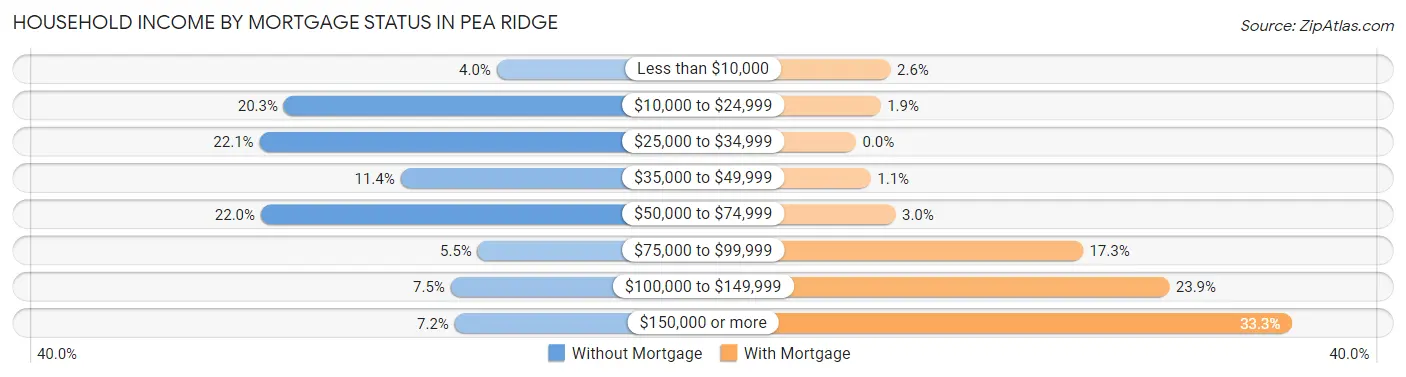
| Household Income | Without Mortgage | With Mortgage |
| Less than $10,000 | 39 (4.0%) | 28 (2.6%) |
| $10,000 to $24,999 | 196 (20.3%) | 20 (1.9%) |
| $25,000 to $34,999 | 214 (22.1%) | 0 (0.0%) |
| $35,000 to $49,999 | 110 (11.4%) | 12 (1.1%) |
| $50,000 to $74,999 | 213 (22.0%) | 32 (3.0%) |
| $75,000 to $99,999 | 53 (5.5%) | 184 (17.3%) |
| $100,000 to $149,999 | 73 (7.5%) | 254 (23.9%) |
| $150,000 or more | 70 (7.2%) | 354 (33.3%) |
| Total | 968 (100.0%) | 1,064 (100.0%) |
Property Value to Household Income Ratio in Pea Ridge
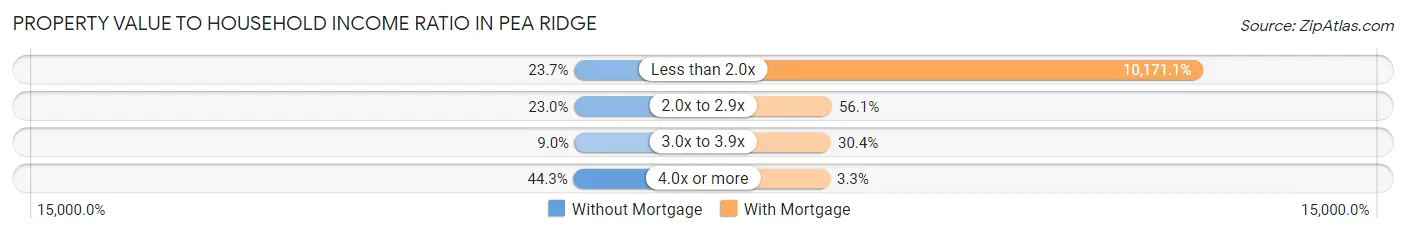
| Value-to-Income Ratio | Without Mortgage | With Mortgage |
| Less than 2.0x | 229 (23.7%) | 108,220 (10,171.0%) |
| 2.0x to 2.9x | 223 (23.0%) | 597 (56.1%) |
| 3.0x to 3.9x | 87 (9.0%) | 323 (30.4%) |
| 4.0x or more | 429 (44.3%) | 35 (3.3%) |
| Total | 968 (100.0%) | 1,064 (100.0%) |
Real Estate Taxes by Mortgage Status in Pea Ridge
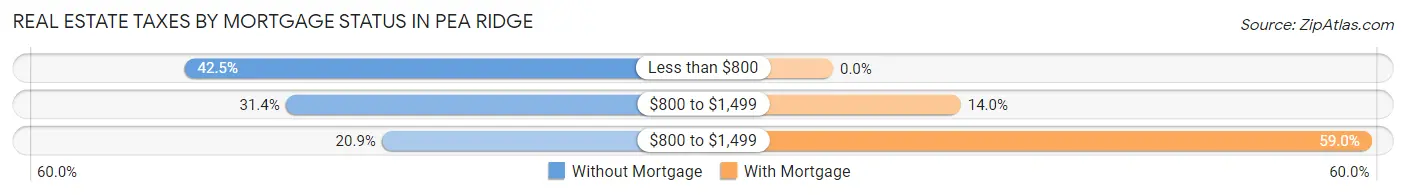
| Property Taxes | Without Mortgage | With Mortgage |
| Less than $800 | 411 (42.5%) | 0 (0.0%) |
| $800 to $1,499 | 304 (31.4%) | 149 (14.0%) |
| $800 to $1,499 | 202 (20.9%) | 628 (59.0%) |
| Total | 968 (100.0%) | 1,064 (100.0%) |
Health & Disability in Pea Ridge
Health Insurance Coverage by Age in Pea Ridge
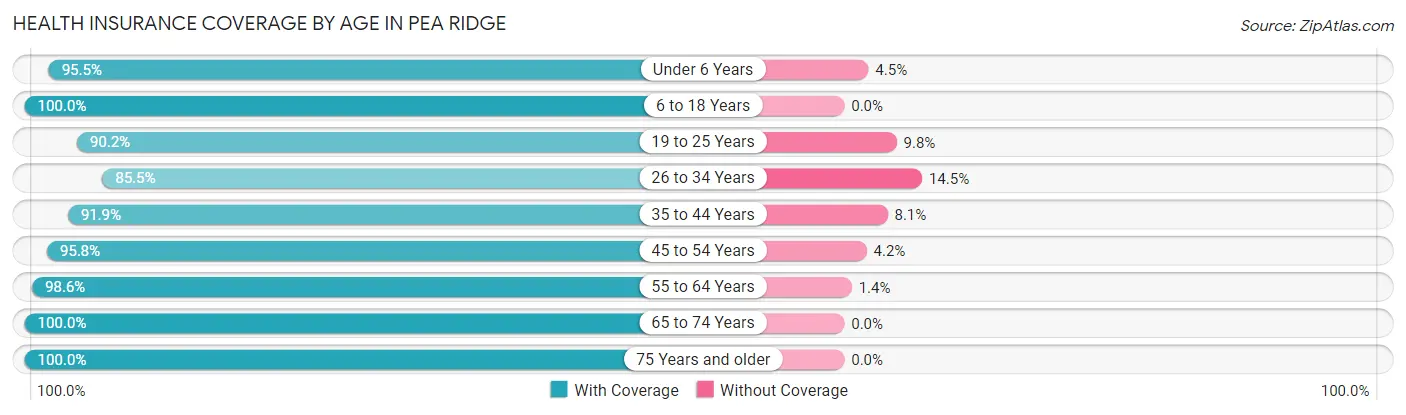
| Age Bracket | With Coverage | Without Coverage |
| Under 6 Years | 361 (95.5%) | 17 (4.5%) |
| 6 to 18 Years | 949 (100.0%) | 0 (0.0%) |
| 19 to 25 Years | 721 (90.2%) | 78 (9.8%) |
| 26 to 34 Years | 891 (85.5%) | 151 (14.5%) |
| 35 to 44 Years | 855 (91.9%) | 75 (8.1%) |
| 45 to 54 Years | 530 (95.8%) | 23 (4.2%) |
| 55 to 64 Years | 645 (98.6%) | 9 (1.4%) |
| 65 to 74 Years | 974 (100.0%) | 0 (0.0%) |
| 75 Years and older | 567 (100.0%) | 0 (0.0%) |
| Total | 6,493 (94.8%) | 353 (5.2%) |
Health Insurance Coverage by Citizenship Status in Pea Ridge
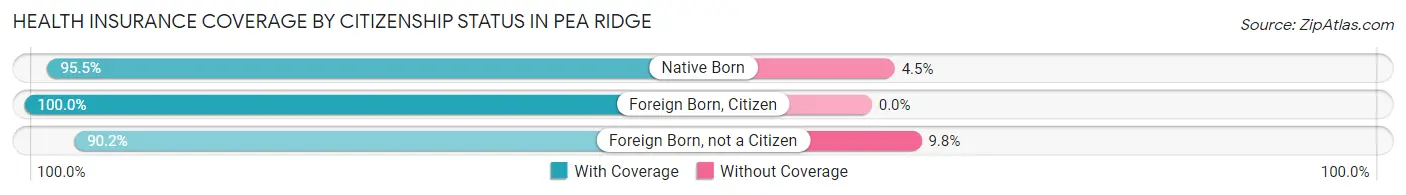
| Citizenship Status | With Coverage | Without Coverage |
| Native Born | 361 (95.5%) | 17 (4.5%) |
| Foreign Born, Citizen | 949 (100.0%) | 0 (0.0%) |
| Foreign Born, not a Citizen | 721 (90.2%) | 78 (9.8%) |
Health Insurance Coverage by Household Income in Pea Ridge
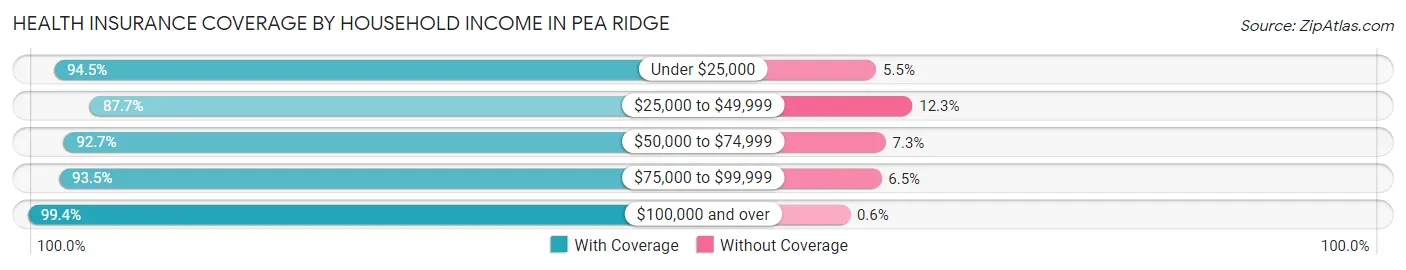
| Household Income | With Coverage | Without Coverage |
| Under $25,000 | 1,082 (94.5%) | 63 (5.5%) |
| $25,000 to $49,999 | 894 (87.7%) | 125 (12.3%) |
| $50,000 to $74,999 | 956 (92.7%) | 75 (7.3%) |
| $75,000 to $99,999 | 1,083 (93.5%) | 75 (6.5%) |
| $100,000 and over | 2,478 (99.4%) | 15 (0.6%) |
Public vs Private Health Insurance Coverage by Age in Pea Ridge
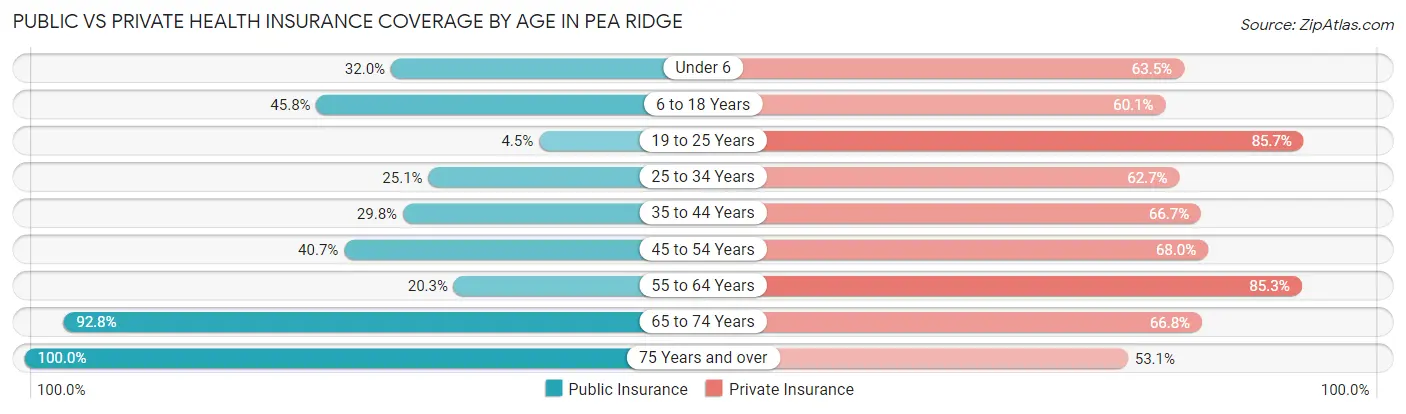
| Age Bracket | Public Insurance | Private Insurance |
| Under 6 | 121 (32.0%) | 240 (63.5%) |
| 6 to 18 Years | 435 (45.8%) | 570 (60.1%) |
| 19 to 25 Years | 36 (4.5%) | 685 (85.7%) |
| 25 to 34 Years | 261 (25.1%) | 653 (62.7%) |
| 35 to 44 Years | 277 (29.8%) | 620 (66.7%) |
| 45 to 54 Years | 225 (40.7%) | 376 (68.0%) |
| 55 to 64 Years | 133 (20.3%) | 558 (85.3%) |
| 65 to 74 Years | 904 (92.8%) | 651 (66.8%) |
| 75 Years and over | 567 (100.0%) | 301 (53.1%) |
| Total | 2,959 (43.2%) | 4,654 (68.0%) |
Disability Status by Sex by Age in Pea Ridge
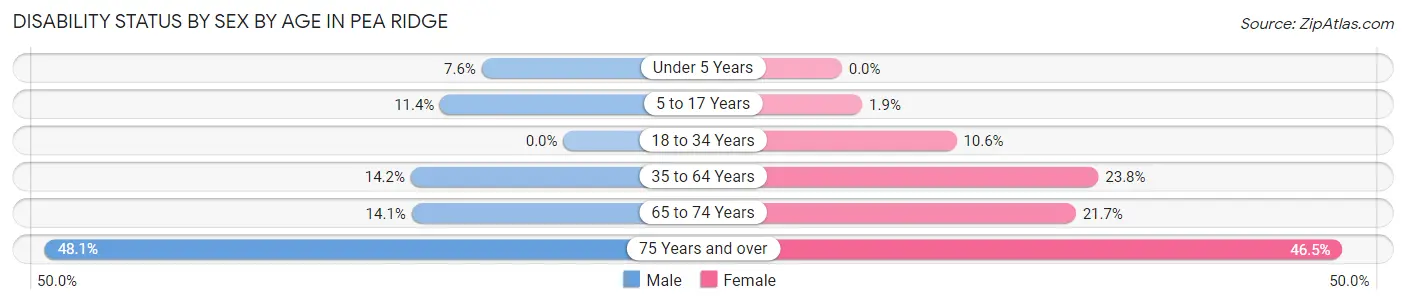
| Age Bracket | Male | Female |
| Under 5 Years | 16 (7.6%) | 0 (0.0%) |
| 5 to 17 Years | 72 (11.4%) | 6 (1.9%) |
| 18 to 34 Years | 0 (0.0%) | 98 (10.6%) |
| 35 to 64 Years | 148 (14.2%) | 260 (23.8%) |
| 65 to 74 Years | 58 (14.1%) | 122 (21.7%) |
| 75 Years and over | 103 (48.1%) | 164 (46.5%) |
Disability Class by Sex by Age in Pea Ridge
Disability Class: Hearing Difficulty
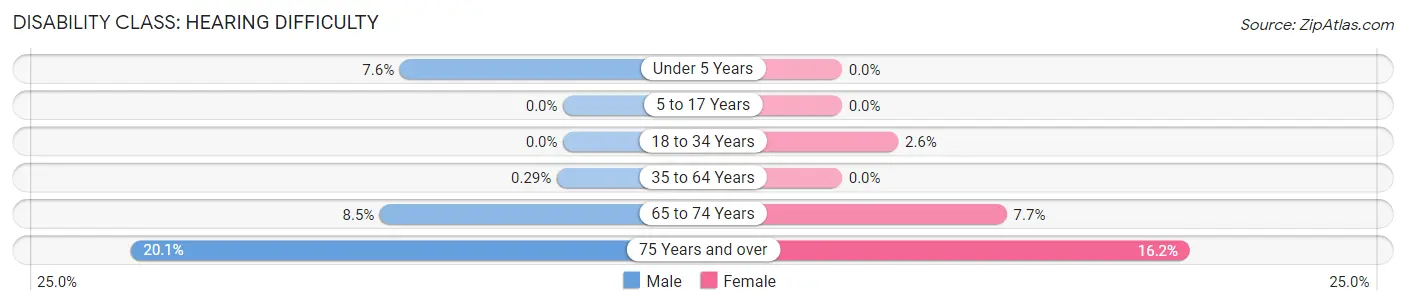
| Age Bracket | Male | Female |
| Under 5 Years | 16 (7.6%) | 0 (0.0%) |
| 5 to 17 Years | 0 (0.0%) | 0 (0.0%) |
| 18 to 34 Years | 0 (0.0%) | 24 (2.6%) |
| 35 to 64 Years | 3 (0.3%) | 0 (0.0%) |
| 65 to 74 Years | 35 (8.5%) | 43 (7.6%) |
| 75 Years and over | 43 (20.1%) | 57 (16.2%) |
Disability Class: Vision Difficulty
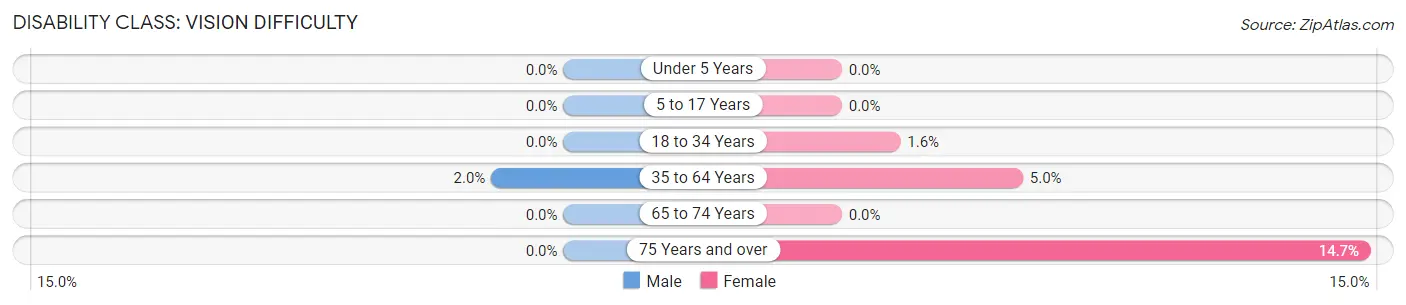
| Age Bracket | Male | Female |
| Under 5 Years | 0 (0.0%) | 0 (0.0%) |
| 5 to 17 Years | 0 (0.0%) | 0 (0.0%) |
| 18 to 34 Years | 0 (0.0%) | 15 (1.6%) |
| 35 to 64 Years | 21 (2.0%) | 55 (5.0%) |
| 65 to 74 Years | 0 (0.0%) | 0 (0.0%) |
| 75 Years and over | 0 (0.0%) | 52 (14.7%) |
Disability Class: Cognitive Difficulty
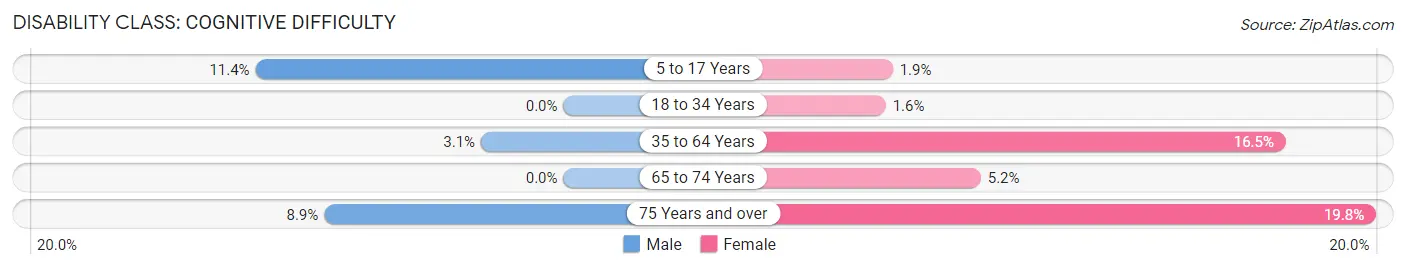
| Age Bracket | Male | Female |
| 5 to 17 Years | 72 (11.4%) | 6 (1.9%) |
| 18 to 34 Years | 0 (0.0%) | 15 (1.6%) |
| 35 to 64 Years | 32 (3.1%) | 180 (16.5%) |
| 65 to 74 Years | 0 (0.0%) | 29 (5.2%) |
| 75 Years and over | 19 (8.9%) | 70 (19.8%) |
Disability Class: Ambulatory Difficulty
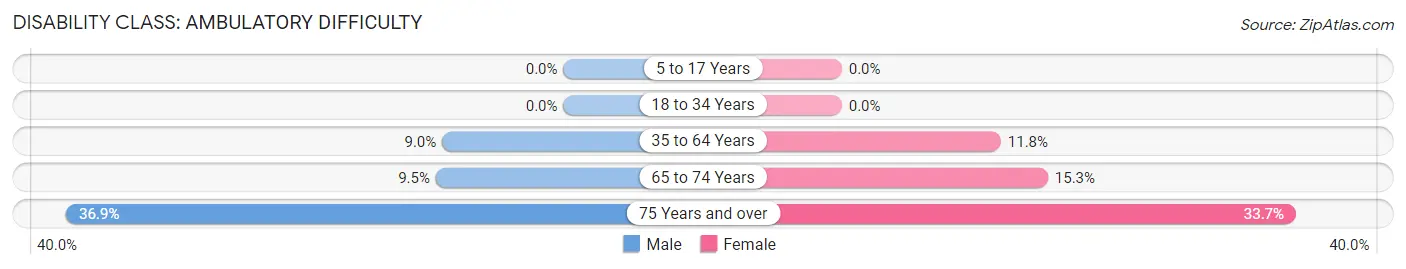
| Age Bracket | Male | Female |
| 5 to 17 Years | 0 (0.0%) | 0 (0.0%) |
| 18 to 34 Years | 0 (0.0%) | 0 (0.0%) |
| 35 to 64 Years | 94 (9.0%) | 129 (11.8%) |
| 65 to 74 Years | 39 (9.5%) | 86 (15.3%) |
| 75 Years and over | 79 (36.9%) | 119 (33.7%) |
Disability Class: Self-Care Difficulty
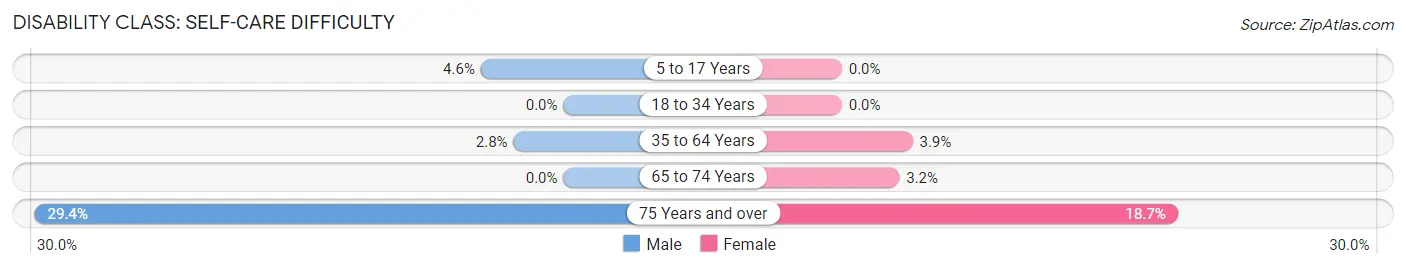
| Age Bracket | Male | Female |
| 5 to 17 Years | 29 (4.6%) | 0 (0.0%) |
| 18 to 34 Years | 0 (0.0%) | 0 (0.0%) |
| 35 to 64 Years | 29 (2.8%) | 43 (3.9%) |
| 65 to 74 Years | 0 (0.0%) | 18 (3.2%) |
| 75 Years and over | 63 (29.4%) | 66 (18.7%) |
Technology Access in Pea Ridge
Computing Device Access in Pea Ridge
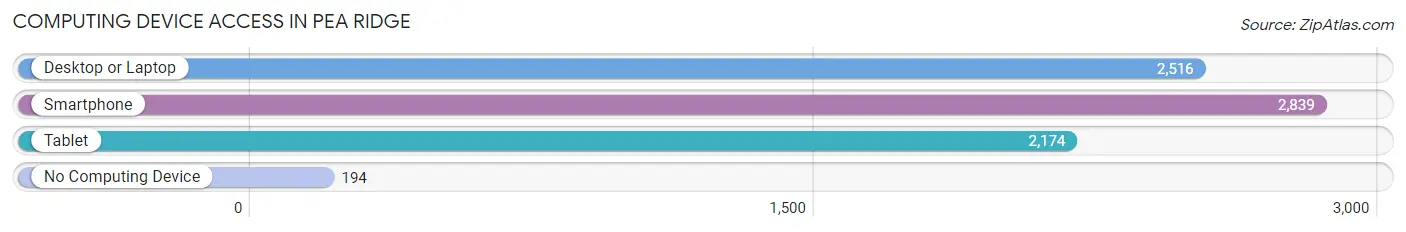
| Device Type | # Households | % Households |
| Desktop or Laptop | 2,516 | 78.0% |
| Smartphone | 2,839 | 88.0% |
| Tablet | 2,174 | 67.4% |
| No Computing Device | 194 | 6.0% |
| Total | 3,225 | 100.0% |
Internet Access in Pea Ridge
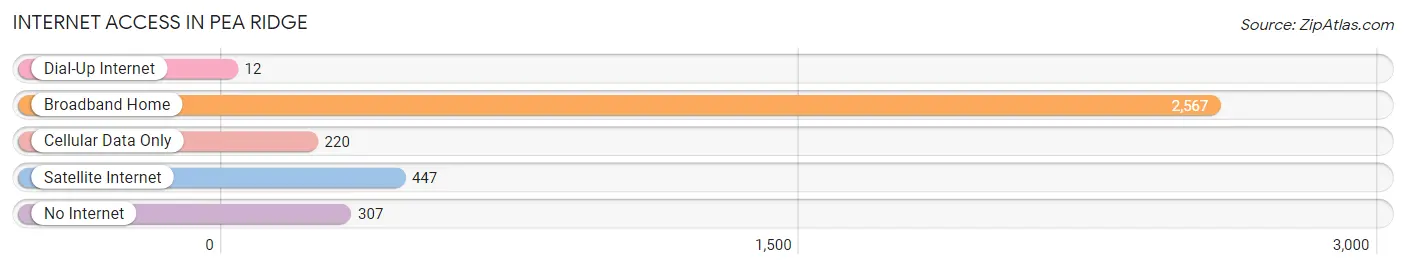
| Internet Type | # Households | % Households |
| Dial-Up Internet | 12 | 0.4% |
| Broadband Home | 2,567 | 79.6% |
| Cellular Data Only | 220 | 6.8% |
| Satellite Internet | 447 | 13.9% |
| No Internet | 307 | 9.5% |
| Total | 3,225 | 100.0% |
Pea Ridge Summary
Pea Ridge, West Virginia is a small unincorporated community located in the eastern part of the state, in the Appalachian Mountains. It is situated in the northern part of Greenbrier County, near the border of Pocahontas County. The community is located along the Greenbrier River, and is surrounded by the Monongahela National Forest.
History
Pea Ridge was first settled in the late 1700s by a group of settlers from Pennsylvania. The community was named after the nearby ridge, which was covered in wild peas. The first settlers were primarily farmers, and the area was known for its fertile soil and abundant wildlife.
In the early 1800s, the area was home to a number of small businesses, including a grist mill, a sawmill, and a tannery. The community also had a post office, which was established in 1845.
In the late 1800s, the area was home to a number of coal mines, which provided employment for many of the residents. The coal industry was the primary source of income for the community until the early 1900s, when the mines began to close.
Geography
Pea Ridge is located in the Appalachian Mountains, in the northern part of Greenbrier County. The community is situated along the Greenbrier River, and is surrounded by the Monongahela National Forest. The area is known for its rolling hills and lush forests.
The climate in Pea Ridge is temperate, with hot summers and cold winters. The average annual temperature is around 50 degrees Fahrenheit. The average annual precipitation is around 40 inches.
Economy
The economy of Pea Ridge is largely based on tourism. The area is home to a number of outdoor recreation activities, including fishing, hunting, camping, and hiking. The community is also home to a number of small businesses, including restaurants, stores, and lodging.
Demographics
As of the 2010 census, the population of Pea Ridge was 1,072. The racial makeup of the community was 97.3% White, 0.7% African American, 0.2% Native American, 0.2% Asian, and 1.6% from other races. The median household income was $30,938, and the median family income was $37,500.
Conclusion
Pea Ridge, West Virginia is a small unincorporated community located in the Appalachian Mountains. The area is known for its rolling hills and lush forests, and is home to a number of outdoor recreation activities. The economy of the community is largely based on tourism, and the population is primarily White.
Common Questions
What is the Total Population of Pea Ridge?
Total Population of Pea Ridge is 6,884.
What is the Total Male Population of Pea Ridge?
Total Male Population of Pea Ridge is 3,491.
What is the Total Female Population of Pea Ridge?
Total Female Population of Pea Ridge is 3,393.
What is the Ratio of Males per 100 Females in Pea Ridge?
There are 102.89 Males per 100 Females in Pea Ridge.
What is the Ratio of Females per 100 Males in Pea Ridge?
There are 97.19 Females per 100 Males in Pea Ridge.
What is the Median Population Age in Pea Ridge?
Median Population Age in Pea Ridge is 37.3 Years.
What is the Average Family Size in Pea Ridge
Average Family Size in Pea Ridge is 3.0 People.
What is the Average Household Size in Pea Ridge
Average Household Size in Pea Ridge is 2.1 People.
What is Per Capita Income in Pea Ridge?
Per Capita income in Pea Ridge is $39,639.
What is the Median Family Income in Pea Ridge?
Median Family Income in Pea Ridge is $90,363.
What is the Median Household income in Pea Ridge?
Median Household Income in Pea Ridge is $57,863.
What is Income or Wage Gap in Pea Ridge?
Income or Wage Gap in Pea Ridge is 19.5%.
Women in Pea Ridge earn 80.5 cents for every dollar earned by a man.
What is Inequality or Gini Index in Pea Ridge?
Inequality or Gini Index in Pea Ridge is 0.49.
How Large is the Labor Force in Pea Ridge?
There are 3,643 People in the Labor Forcein in Pea Ridge.
What is the Percentage of People in the Labor Force in Pea Ridge?
63.7% of People are in the Labor Force in Pea Ridge.
What is the Unemployment Rate in Pea Ridge?
Unemployment Rate in Pea Ridge is 3.4%.