Hooverson Heights, WV
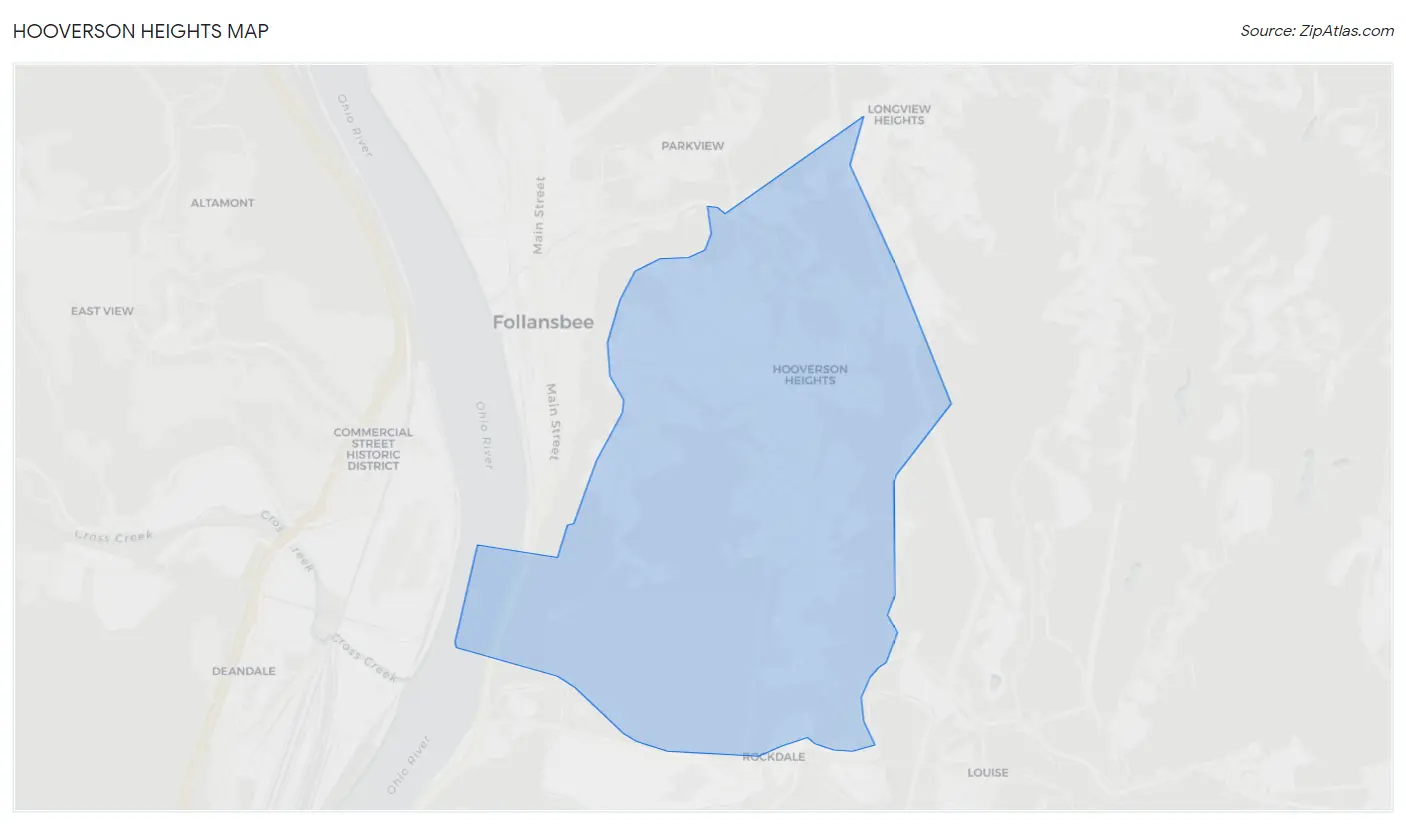
Hooverson Heights Map
Hooverson Heights Overview
2,329
TOTAL POPULATION
1,069
MALE POPULATION
1,260
FEMALE POPULATION
84.84
MALES / 100 FEMALES
117.87
FEMALES / 100 MALES
58.3
MEDIAN AGE
2.5
AVG FAMILY SIZE
2.1
AVG HOUSEHOLD SIZE
$30,381
PER CAPITA INCOME
$79,688
AVG FAMILY INCOME
$55,588
AVG HOUSEHOLD INCOME
0.9%
WAGE / INCOME GAP [ % ]
99.1¢/ $1
WAGE / INCOME GAP [ $ ]
0.36
INEQUALITY / GINI INDEX
1,018
LABOR FORCE [ PEOPLE ]
50.6%
PERCENT IN LABOR FORCE
3.2%
UNEMPLOYMENT RATE
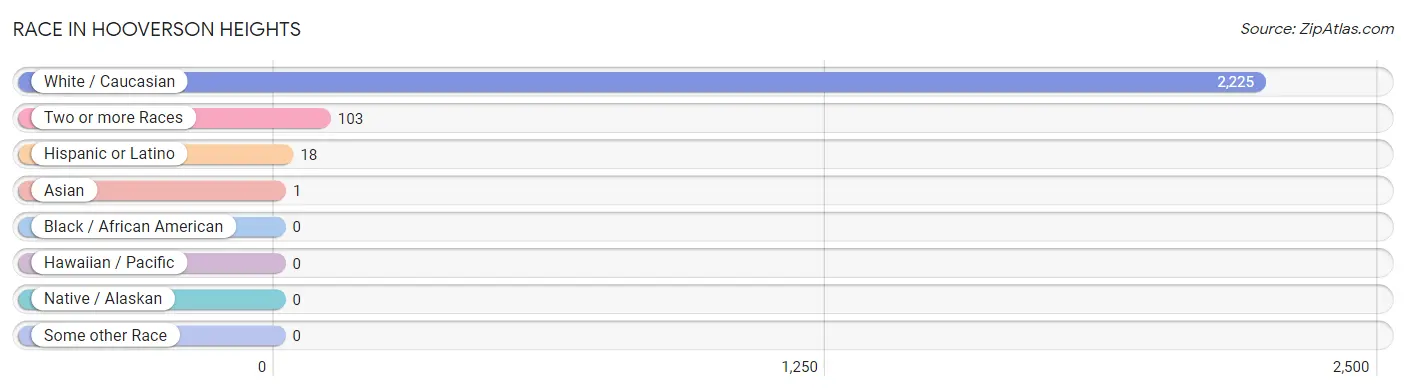
Race in Hooverson Heights
The most populous races in Hooverson Heights are White / Caucasian (2,225 | 95.5%), Two or more Races (103 | 4.4%), and Hispanic or Latino (18 | 0.8%).
| Race | # Population | % Population |
| Asian | 1 | 0.0% |
| Black / African American | 0 | 0.0% |
| Hawaiian / Pacific | 0 | 0.0% |
| Hispanic or Latino | 18 | 0.8% |
| Native / Alaskan | 0 | 0.0% |
| White / Caucasian | 2,225 | 95.5% |
| Two or more Races | 103 | 4.4% |
| Some other Race | 0 | 0.0% |
| Total | 2,329 | 100.0% |
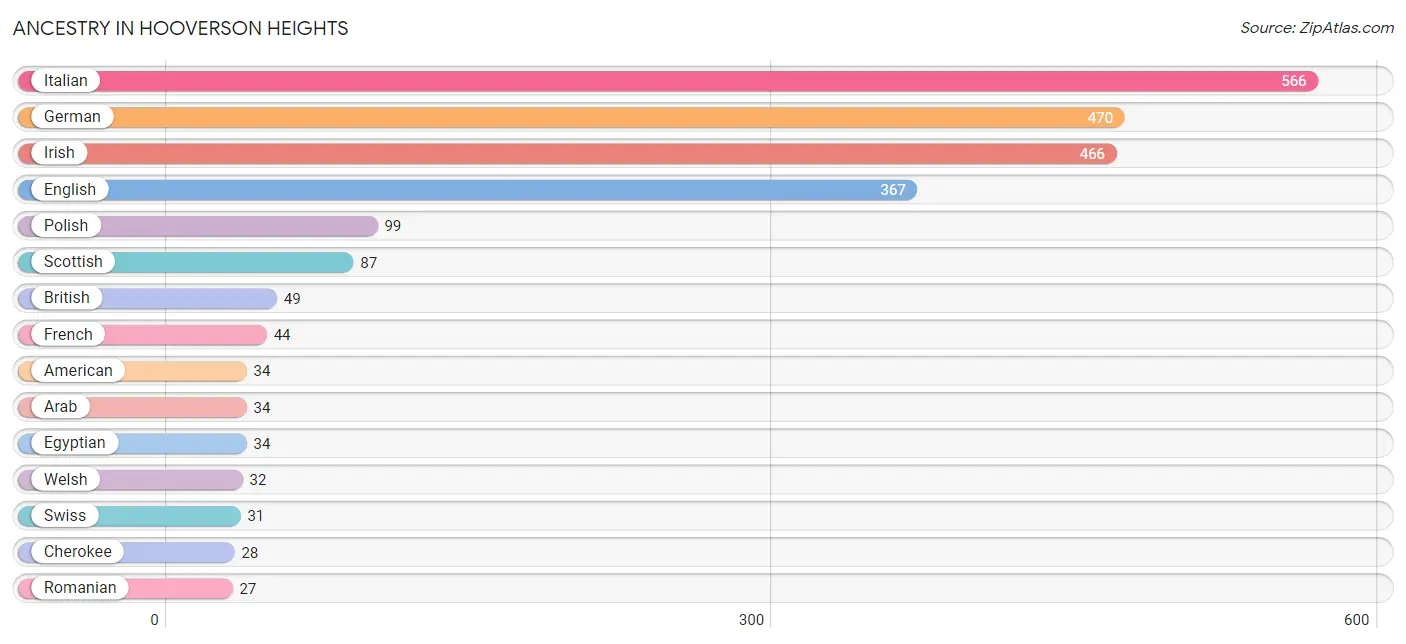
Ancestry in Hooverson Heights
The most populous ancestries reported in Hooverson Heights are Italian (566 | 24.3%), German (470 | 20.2%), Irish (466 | 20.0%), English (367 | 15.8%), and Polish (99 | 4.3%), together accounting for 84.5% of all Hooverson Heights residents.
| Ancestry | # Population | % Population |
| American | 34 | 1.5% |
| Arab | 34 | 1.5% |
| Blackfeet | 2 | 0.1% |
| British | 49 | 2.1% |
| Celtic | 2 | 0.1% |
| Central American | 8 | 0.3% |
| Cherokee | 28 | 1.2% |
| Costa Rican | 8 | 0.3% |
| Croatian | 18 | 0.8% |
| Dutch | 6 | 0.3% |
| Eastern European | 24 | 1.0% |
| Egyptian | 34 | 1.5% |
| English | 367 | 15.8% |
| European | 16 | 0.7% |
| Fijian | 10 | 0.4% |
| French | 44 | 1.9% |
| German | 470 | 20.2% |
| Hungarian | 7 | 0.3% |
| Irish | 466 | 20.0% |
| Italian | 566 | 24.3% |
| Korean | 1 | 0.0% |
| Mexican | 10 | 0.4% |
| Northern European | 11 | 0.5% |
| Pennsylvania German | 24 | 1.0% |
| Pima | 10 | 0.4% |
| Polish | 99 | 4.3% |
| Portuguese | 13 | 0.6% |
| Romanian | 27 | 1.2% |
| Scottish | 87 | 3.7% |
| Subsaharan African | 16 | 0.7% |
| Swedish | 16 | 0.7% |
| Swiss | 31 | 1.3% |
| Welsh | 32 | 1.4% | View All 33 Rows |
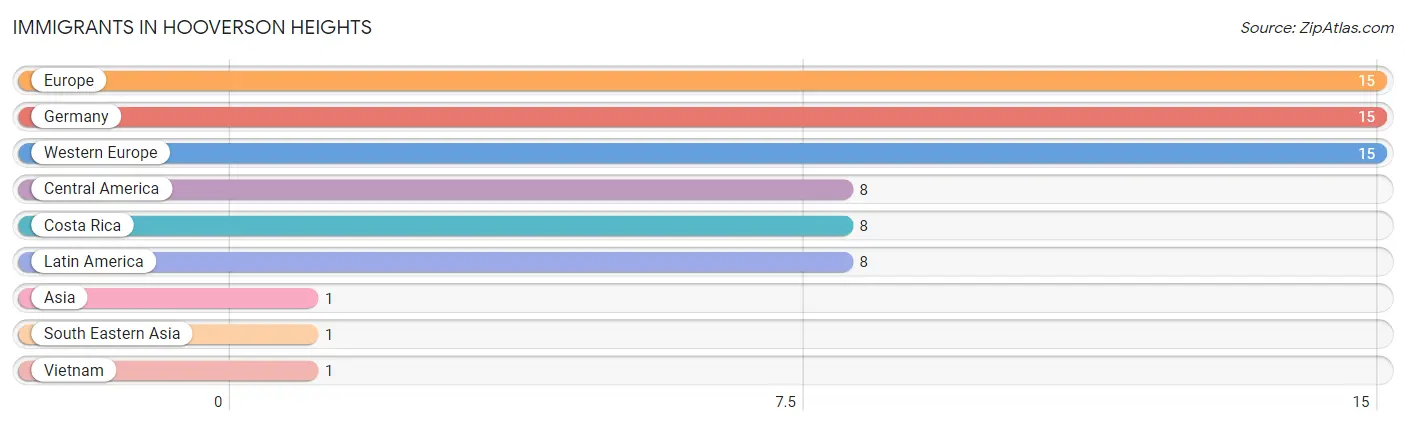
Immigrants in Hooverson Heights
The most numerous immigrant groups reported in Hooverson Heights came from Europe (15 | 0.6%), Germany (15 | 0.6%), Western Europe (15 | 0.6%), Central America (8 | 0.3%), and Costa Rica (8 | 0.3%), together accounting for 2.6% of all Hooverson Heights residents.
| Immigration Origin | # Population | % Population |
| Asia | 1 | 0.0% |
| Central America | 8 | 0.3% |
| Costa Rica | 8 | 0.3% |
| Europe | 15 | 0.6% |
| Germany | 15 | 0.6% |
| Latin America | 8 | 0.3% |
| South Eastern Asia | 1 | 0.0% |
| Vietnam | 1 | 0.0% |
| Western Europe | 15 | 0.6% | View All 9 Rows |
Sex and Age in Hooverson Heights
Sex and Age in Hooverson Heights
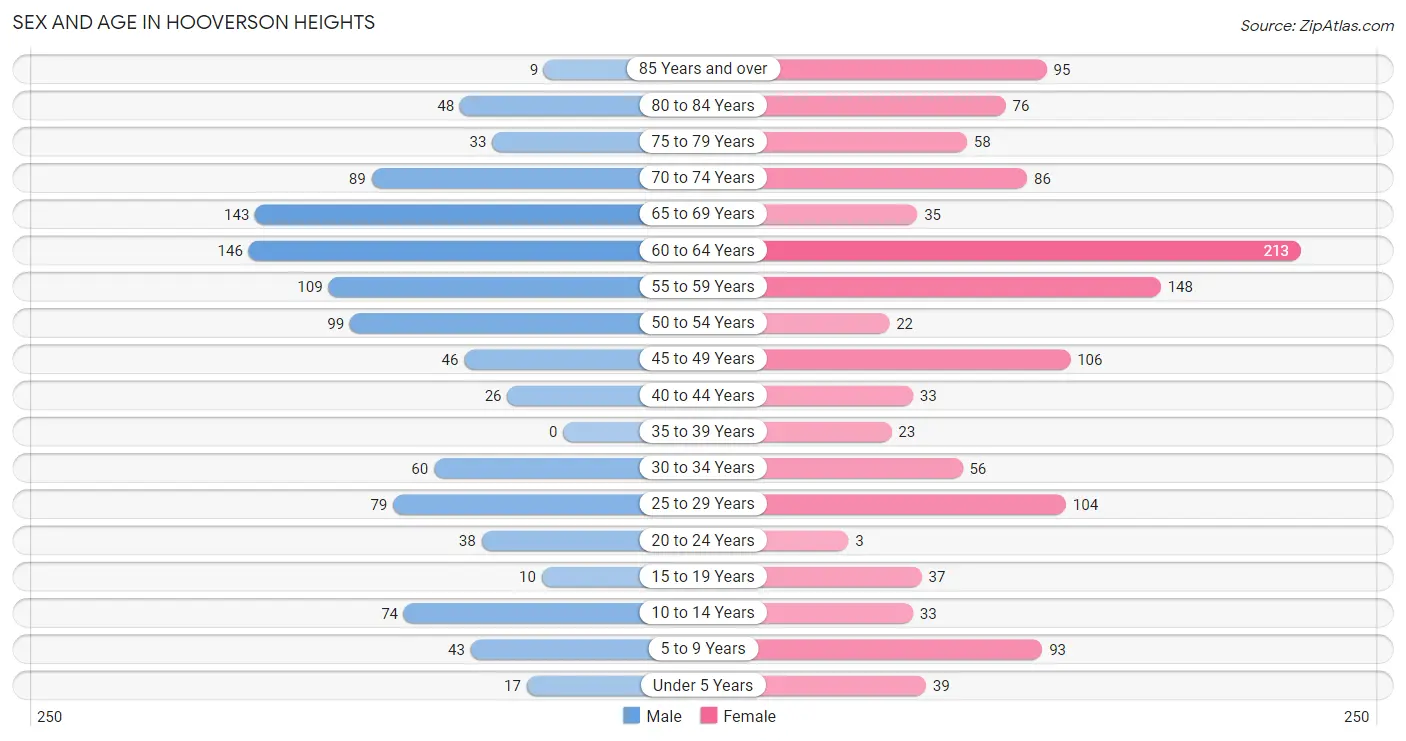
The most populous age groups in Hooverson Heights are 60 to 64 Years (146 | 13.7%) for men and 60 to 64 Years (213 | 16.9%) for women.
| Age Bracket | Male | Female |
| Under 5 Years | 17 (1.6%) | 39 (3.1%) |
| 5 to 9 Years | 43 (4.0%) | 93 (7.4%) |
| 10 to 14 Years | 74 (6.9%) | 33 (2.6%) |
| 15 to 19 Years | 10 (0.9%) | 37 (2.9%) |
| 20 to 24 Years | 38 (3.5%) | 3 (0.2%) |
| 25 to 29 Years | 79 (7.4%) | 104 (8.3%) |
| 30 to 34 Years | 60 (5.6%) | 56 (4.4%) |
| 35 to 39 Years | 0 (0.0%) | 23 (1.8%) |
| 40 to 44 Years | 26 (2.4%) | 33 (2.6%) |
| 45 to 49 Years | 46 (4.3%) | 106 (8.4%) |
| 50 to 54 Years | 99 (9.3%) | 22 (1.8%) |
| 55 to 59 Years | 109 (10.2%) | 148 (11.7%) |
| 60 to 64 Years | 146 (13.7%) | 213 (16.9%) |
| 65 to 69 Years | 143 (13.4%) | 35 (2.8%) |
| 70 to 74 Years | 89 (8.3%) | 86 (6.8%) |
| 75 to 79 Years | 33 (3.1%) | 58 (4.6%) |
| 80 to 84 Years | 48 (4.5%) | 76 (6.0%) |
| 85 Years and over | 9 (0.8%) | 95 (7.5%) |
| Total | 1,069 (100.0%) | 1,260 (100.0%) |
Families and Households in Hooverson Heights
Median Family Size in Hooverson Heights
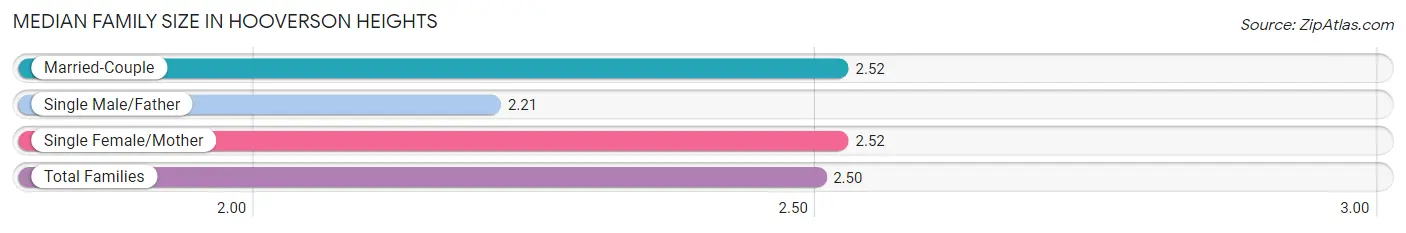
The median family size in Hooverson Heights is 2.50 persons per family, with married-couple families (535 | 87.8%) accounting for the largest median family size of 2.52 persons per family. On the other hand, single male/father families (47 | 7.7%) represent the smallest median family size with 2.21 persons per family.
| Family Type | # Families | Family Size |
| Married-Couple | 535 (87.8%) | 2.52 |
| Single Male/Father | 47 (7.7%) | 2.21 |
| Single Female/Mother | 27 (4.4%) | 2.52 |
| Total Families | 609 (100.0%) | 2.50 |
Median Household Size in Hooverson Heights
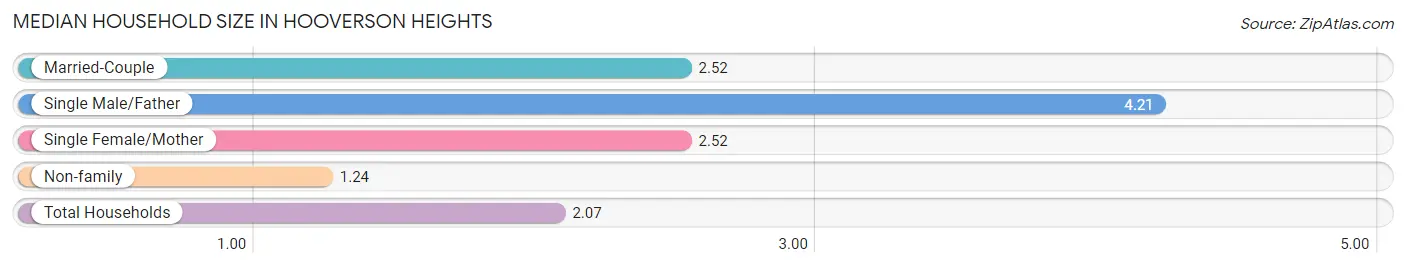
The median household size in Hooverson Heights is 2.07 persons per household, with single male/father households (47 | 4.5%) accounting for the largest median household size of 4.21 persons per household. non-family households (425 | 41.1%) represent the smallest median household size with 1.24 persons per household.
| Household Type | # Households | Household Size |
| Married-Couple | 535 (51.7%) | 2.52 |
| Single Male/Father | 47 (4.5%) | 4.21 |
| Single Female/Mother | 27 (2.6%) | 2.52 |
| Non-family | 425 (41.1%) | 1.24 |
| Total Households | 1,034 (100.0%) | 2.07 |
Household Size by Marriage Status in Hooverson Heights
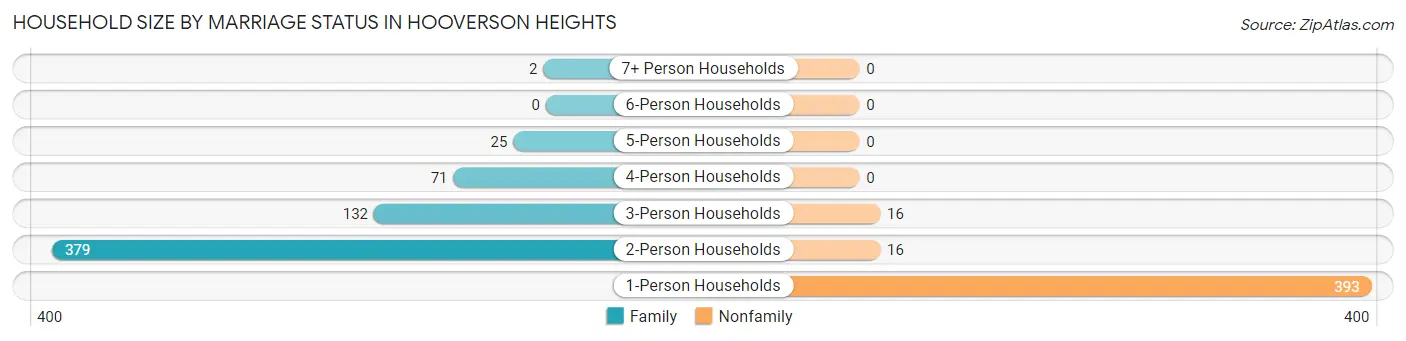
Out of a total of 1,034 households in Hooverson Heights, 609 (58.9%) are family households, while 425 (41.1%) are nonfamily households. The most numerous type of family households are 2-person households, comprising 379, and the most common type of nonfamily households are 1-person households, comprising 393.
| Household Size | Family Households | Nonfamily Households |
| 1-Person Households | - | 393 (38.0%) |
| 2-Person Households | 379 (36.6%) | 16 (1.5%) |
| 3-Person Households | 132 (12.8%) | 16 (1.5%) |
| 4-Person Households | 71 (6.9%) | 0 (0.0%) |
| 5-Person Households | 25 (2.4%) | 0 (0.0%) |
| 6-Person Households | 0 (0.0%) | 0 (0.0%) |
| 7+ Person Households | 2 (0.2%) | 0 (0.0%) |
| Total | 609 (58.9%) | 425 (41.1%) |
Female Fertility in Hooverson Heights
Fertility by Age in Hooverson Heights
| Age Bracket | Women with Births | Births / 1,000 Women |
| 15 to 19 years | 0 (0.0%) | 0.0 |
| 20 to 34 years | 0 (0.0%) | 0.0 |
| 35 to 50 years | 0 (0.0%) | 0.0 |
| Total | 0 (0.0%) | 0.0 |
Fertility by Age by Marriage Status in Hooverson Heights
| Age Bracket | Married | Unmarried |
| 15 to 19 years | 0 (0.0%) | 0 (0.0%) |
| 20 to 34 years | 0 (0.0%) | 0 (0.0%) |
| 35 to 50 years | 0 (0.0%) | 0 (0.0%) |
| Total | 0 (0.0%) | 0 (0.0%) |
Fertility by Education in Hooverson Heights
| Educational Attainment | Women with Births | Births / 1,000 Women |
| Less than High School | 0 (0.0%) | 0.0 |
| High School Diploma | 0 (0.0%) | 0.0 |
| College or Associate's Degree | 0 (0.0%) | 0.0 |
| Bachelor's Degree | 0 (0.0%) | 0.0 |
| Graduate Degree | 0 (0.0%) | 0.0 |
| Total | 0 (0.0%) | 0.0 |
Fertility by Education by Marriage Status in Hooverson Heights
| Educational Attainment | Married | Unmarried |
| Less than High School | 0 (0.0%) | 0 (0.0%) |
| High School Diploma | 0 (0.0%) | 0 (0.0%) |
| College or Associate's Degree | 0 (0.0%) | 0 (0.0%) |
| Bachelor's Degree | 0 (0.0%) | 0 (0.0%) |
| Graduate Degree | 0 (0.0%) | 0 (0.0%) |
| Total | 0 (0.0%) | 0 (0.0%) |
Income in Hooverson Heights
Income Overview in Hooverson Heights
Per Capita Income in Hooverson Heights is $30,381, while median incomes of families and households are $79,688 and $55,588 respectively.
| Characteristic | Number | Measure |
| Per Capita Income | 2,329 | $30,381 |
| Median Family Income | 609 | $79,688 |
| Mean Family Income | 609 | $81,664 |
| Median Household Income | 1,034 | $55,588 |
| Mean Household Income | 1,034 | $63,471 |
| Income Deficit | 609 | $0 |
| Wage / Income Gap (%) | 2,329 | 0.88% |
| Wage / Income Gap ($) | 2,329 | 99.12¢ per $1 |
| Gini / Inequality Index | 2,329 | 0.36 |
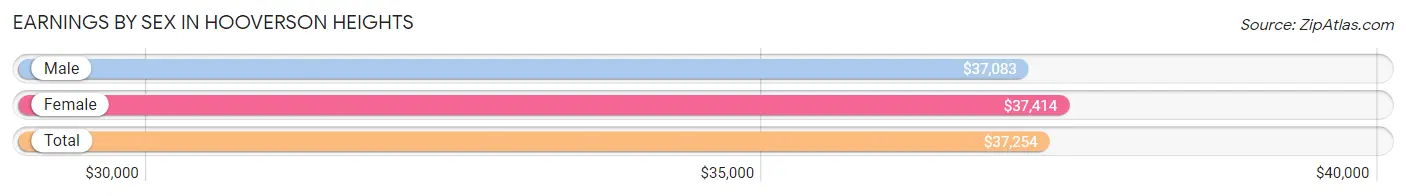
Earnings by Sex in Hooverson Heights
Average Earnings in Hooverson Heights are $37,254, $37,083 for men and $37,414 for women, a difference of 0.9%.
| Sex | Number | Average Earnings |
| Male | 609 (59.7%) | $37,083 |
| Female | 412 (40.4%) | $37,414 |
| Total | 1,021 (100.0%) | $37,254 |
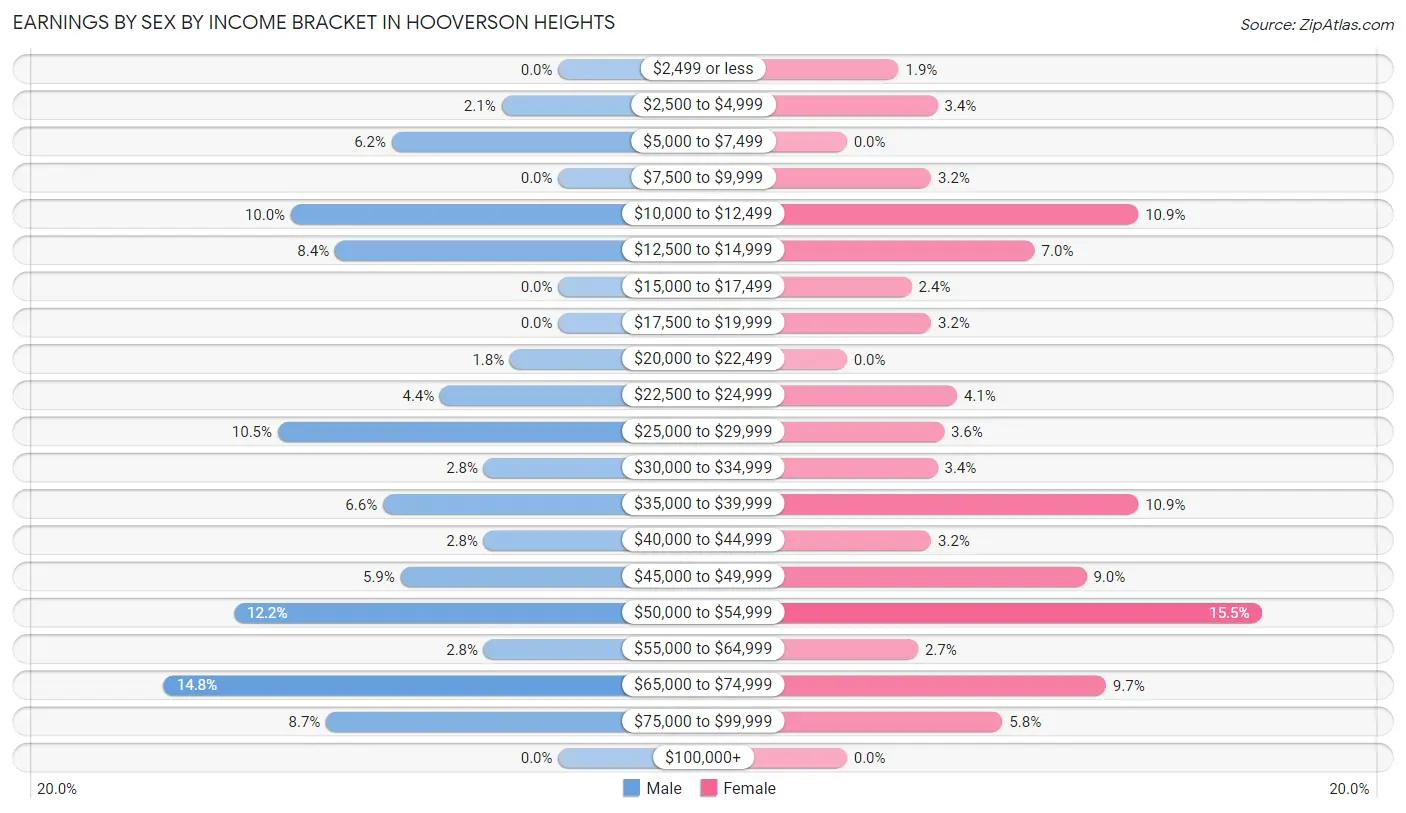
Earnings by Sex by Income Bracket in Hooverson Heights
The most common earnings brackets in Hooverson Heights are $65,000 to $74,999 for men (90 | 14.8%) and $50,000 to $54,999 for women (64 | 15.5%).
| Income | Male | Female |
| $2,499 or less | 0 (0.0%) | 8 (1.9%) |
| $2,500 to $4,999 | 13 (2.1%) | 14 (3.4%) |
| $5,000 to $7,499 | 38 (6.2%) | 0 (0.0%) |
| $7,500 to $9,999 | 0 (0.0%) | 13 (3.2%) |
| $10,000 to $12,499 | 61 (10.0%) | 45 (10.9%) |
| $12,500 to $14,999 | 51 (8.4%) | 29 (7.0%) |
| $15,000 to $17,499 | 0 (0.0%) | 10 (2.4%) |
| $17,500 to $19,999 | 0 (0.0%) | 13 (3.2%) |
| $20,000 to $22,499 | 11 (1.8%) | 0 (0.0%) |
| $22,500 to $24,999 | 27 (4.4%) | 17 (4.1%) |
| $25,000 to $29,999 | 64 (10.5%) | 15 (3.6%) |
| $30,000 to $34,999 | 17 (2.8%) | 14 (3.4%) |
| $35,000 to $39,999 | 40 (6.6%) | 45 (10.9%) |
| $40,000 to $44,999 | 17 (2.8%) | 13 (3.2%) |
| $45,000 to $49,999 | 36 (5.9%) | 37 (9.0%) |
| $50,000 to $54,999 | 74 (12.1%) | 64 (15.5%) |
| $55,000 to $64,999 | 17 (2.8%) | 11 (2.7%) |
| $65,000 to $74,999 | 90 (14.8%) | 40 (9.7%) |
| $75,000 to $99,999 | 53 (8.7%) | 24 (5.8%) |
| $100,000+ | 0 (0.0%) | 0 (0.0%) |
| Total | 609 (100.0%) | 412 (100.0%) |
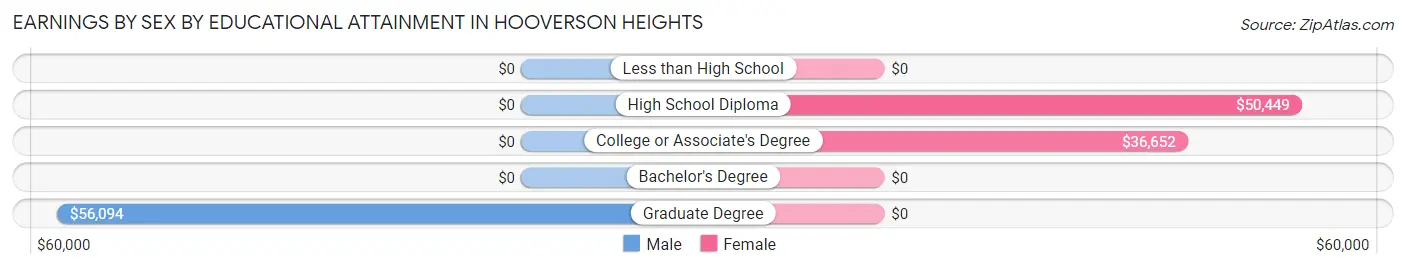
Earnings by Sex by Educational Attainment in Hooverson Heights
Average earnings in Hooverson Heights are $38,269 for men and $38,203 for women, a difference of 0.2%. Men with an educational attainment of graduate degree enjoy the highest average annual earnings of $56,094, while those with graduate degree education earn the least with $56,094. Women with an educational attainment of high school diploma earn the most with the average annual earnings of $50,449, while those with college or associate's degree education have the smallest earnings of $36,652.
| Educational Attainment | Male Income | Female Income |
| Less than High School | - | - |
| High School Diploma | - | - |
| College or Associate's Degree | - | - |
| Bachelor's Degree | - | - |
| Graduate Degree | $56,094 | $0 |
| Total | $38,269 | $38,203 |
Family Income in Hooverson Heights
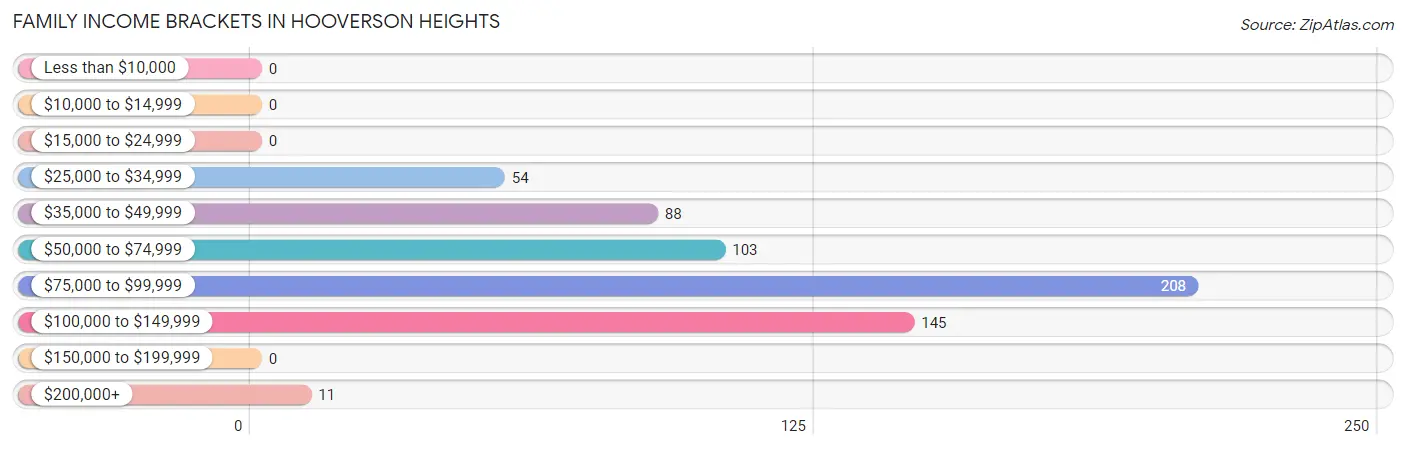
Family Income Brackets in Hooverson Heights
According to the Hooverson Heights family income data, there are 208 families falling into the $75,000 to $99,999 income range, which is the most common income bracket and makes up 34.2% of all families.
| Income Bracket | # Families | % Families |
| Less than $10,000 | 0 | 0.0% |
| $10,000 to $14,999 | 0 | 0.0% |
| $15,000 to $24,999 | 0 | 0.0% |
| $25,000 to $34,999 | 54 | 8.9% |
| $35,000 to $49,999 | 88 | 14.4% |
| $50,000 to $74,999 | 103 | 16.9% |
| $75,000 to $99,999 | 208 | 34.2% |
| $100,000 to $149,999 | 145 | 23.8% |
| $150,000 to $199,999 | 0 | 0.0% |
| $200,000+ | 11 | 1.8% |
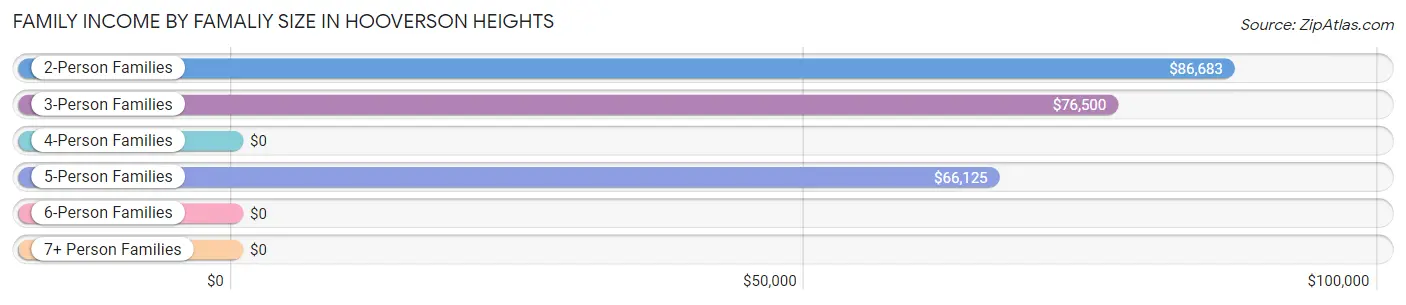
Family Income by Famaliy Size in Hooverson Heights
2-person families (413 | 67.8%) account for the highest median family income in Hooverson Heights with $86,683 per family, while 2-person families (413 | 67.8%) have the highest median income of $43,342 per family member.
| Income Bracket | # Families | Median Income |
| 2-Person Families | 413 (67.8%) | $86,683 |
| 3-Person Families | 132 (21.7%) | $76,500 |
| 4-Person Families | 37 (6.1%) | $0 |
| 5-Person Families | 25 (4.1%) | $66,125 |
| 6-Person Families | 0 (0.0%) | $0 |
| 7+ Person Families | 2 (0.3%) | $0 |
| Total | 609 (100.0%) | $79,688 |
Family Income by Number of Earners in Hooverson Heights

| Number of Earners | # Families | Median Income |
| No Earners | 88 (14.4%) | $72,727 |
| 1 Earner | 264 (43.3%) | $66,048 |
| 2 Earners | 242 (39.7%) | $96,689 |
| 3+ Earners | 15 (2.5%) | $0 |
| Total | 609 (100.0%) | $79,688 |
Household Income in Hooverson Heights
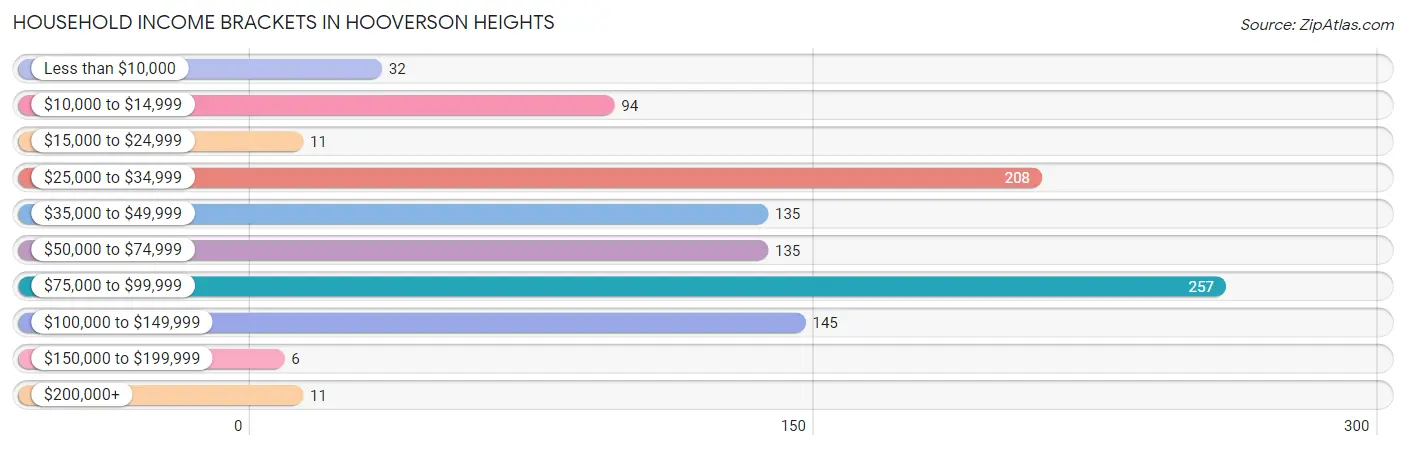
Household Income Brackets in Hooverson Heights
With 257 households falling in the category, the $75,000 to $99,999 income range is the most frequent in Hooverson Heights, accounting for 24.8% of all households. In contrast, only 6 households (0.6%) fall into the $150,000 to $199,999 income bracket, making it the least populous group.
| Income Bracket | # Households | % Households |
| Less than $10,000 | 32 | 3.1% |
| $10,000 to $14,999 | 94 | 9.1% |
| $15,000 to $24,999 | 11 | 1.1% |
| $25,000 to $34,999 | 208 | 20.1% |
| $35,000 to $49,999 | 135 | 13.1% |
| $50,000 to $74,999 | 135 | 13.1% |
| $75,000 to $99,999 | 257 | 24.9% |
| $100,000 to $149,999 | 145 | 14.0% |
| $150,000 to $199,999 | 6 | 0.6% |
| $200,000+ | 11 | 1.1% |
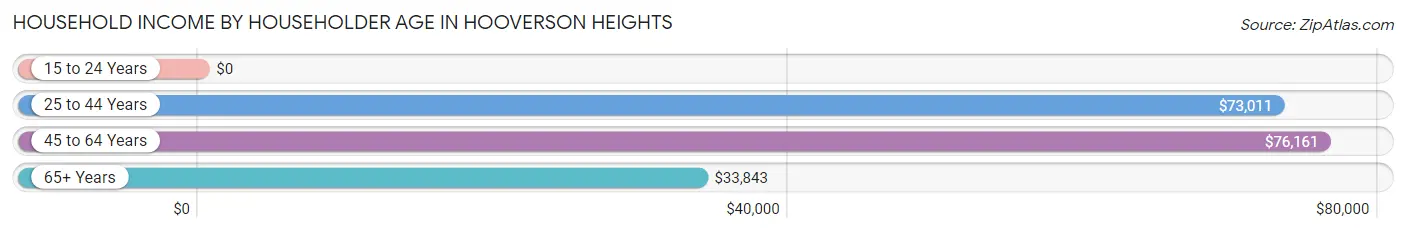
Household Income by Householder Age in Hooverson Heights
The median household income in Hooverson Heights is $55,588, with the highest median household income of $76,161 found in the 45 to 64 years age bracket for the primary householder. A total of 493 households (47.7%) fall into this category. Meanwhile, the 15 to 24 years age bracket for the primary householder has the lowest median household income of $0, with 17 households (1.6%) in this group.
| Income Bracket | # Households | Median Income |
| 15 to 24 Years | 17 (1.6%) | $0 |
| 25 to 44 Years | 169 (16.3%) | $73,011 |
| 45 to 64 Years | 493 (47.7%) | $76,161 |
| 65+ Years | 355 (34.3%) | $33,843 |
| Total | 1,034 (100.0%) | $55,588 |
Poverty in Hooverson Heights
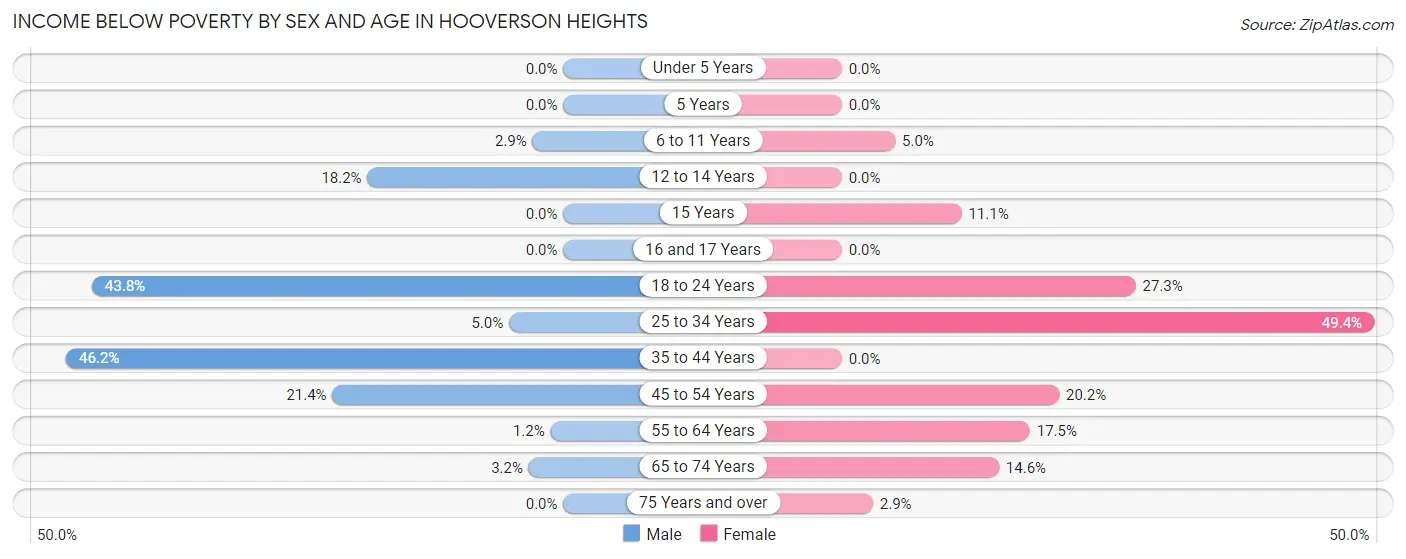
Income Below Poverty by Sex and Age in Hooverson Heights
With 8.4% poverty level for males and 17.5% for females among the residents of Hooverson Heights, 35 to 44 year old males and 25 to 34 year old females are the most vulnerable to poverty, with 12 males (46.2%) and 79 females (49.4%) in their respective age groups living below the poverty level.
| Age Bracket | Male | Female |
| Under 5 Years | 0 (0.0%) | 0 (0.0%) |
| 5 Years | 0 (0.0%) | 0 (0.0%) |
| 6 to 11 Years | 2 (2.9%) | 5 (5.0%) |
| 12 to 14 Years | 2 (18.2%) | 0 (0.0%) |
| 15 Years | 0 (0.0%) | 2 (11.1%) |
| 16 and 17 Years | 0 (0.0%) | 0 (0.0%) |
| 18 to 24 Years | 21 (43.8%) | 3 (27.3%) |
| 25 to 34 Years | 7 (5.0%) | 79 (49.4%) |
| 35 to 44 Years | 12 (46.2%) | 0 (0.0%) |
| 45 to 54 Years | 30 (21.4%) | 25 (20.2%) |
| 55 to 64 Years | 3 (1.2%) | 63 (17.4%) |
| 65 to 74 Years | 7 (3.2%) | 14 (14.6%) |
| 75 Years and over | 0 (0.0%) | 4 (2.9%) |
| Total | 84 (8.4%) | 195 (17.5%) |
Income Above Poverty by Sex and Age in Hooverson Heights
According to the poverty statistics in Hooverson Heights, males aged under 5 years and females aged under 5 years are the age groups that are most secure financially, with 100.0% of males and 100.0% of females in these age groups living above the poverty line.
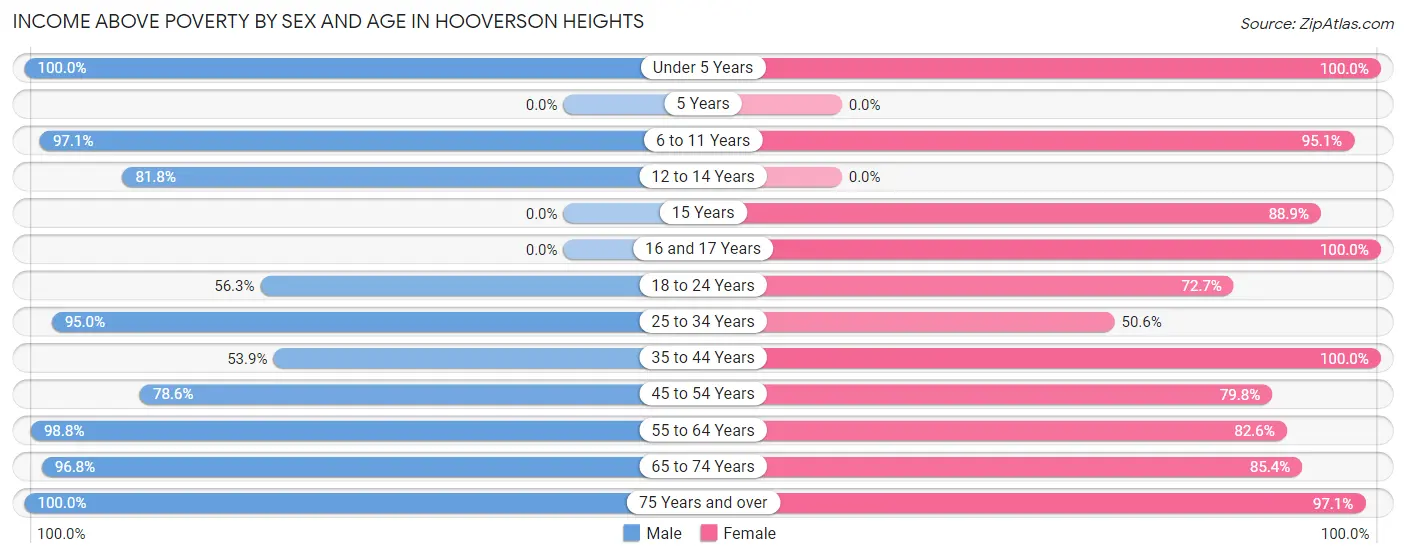
| Age Bracket | Male | Female |
| Under 5 Years | 17 (100.0%) | 39 (100.0%) |
| 5 Years | 0 (0.0%) | 0 (0.0%) |
| 6 to 11 Years | 68 (97.1%) | 96 (95.1%) |
| 12 to 14 Years | 9 (81.8%) | 0 (0.0%) |
| 15 Years | 0 (0.0%) | 16 (88.9%) |
| 16 and 17 Years | 0 (0.0%) | 11 (100.0%) |
| 18 to 24 Years | 27 (56.2%) | 8 (72.7%) |
| 25 to 34 Years | 132 (95.0%) | 81 (50.6%) |
| 35 to 44 Years | 14 (53.8%) | 56 (100.0%) |
| 45 to 54 Years | 110 (78.6%) | 99 (79.8%) |
| 55 to 64 Years | 249 (98.8%) | 298 (82.6%) |
| 65 to 74 Years | 211 (96.8%) | 82 (85.4%) |
| 75 Years and over | 78 (100.0%) | 135 (97.1%) |
| Total | 915 (91.6%) | 921 (82.5%) |
Income Below Poverty Among Married-Couple Families in Hooverson Heights
The poverty statistics for married-couple families in Hooverson Heights show that 0.4% or 2 of the total 535 families live below the poverty line. Families with 5 or more children have the highest poverty rate of 100.0%, comprising of 2 families. On the other hand, families with no children have the lowest poverty rate of 0.0%, which includes 0 families.
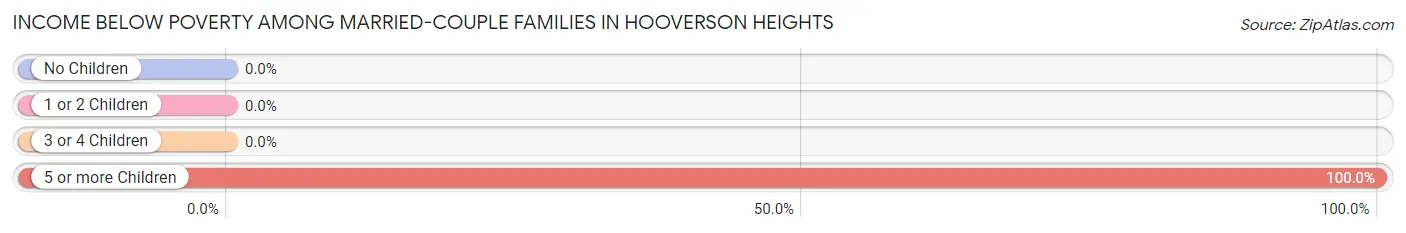
| Children | Above Poverty | Below Poverty |
| No Children | 449 (100.0%) | 0 (0.0%) |
| 1 or 2 Children | 59 (100.0%) | 0 (0.0%) |
| 3 or 4 Children | 25 (100.0%) | 0 (0.0%) |
| 5 or more Children | 0 (0.0%) | 2 (100.0%) |
| Total | 533 (99.6%) | 2 (0.4%) |
Income Below Poverty Among Single-Parent Households in Hooverson Heights
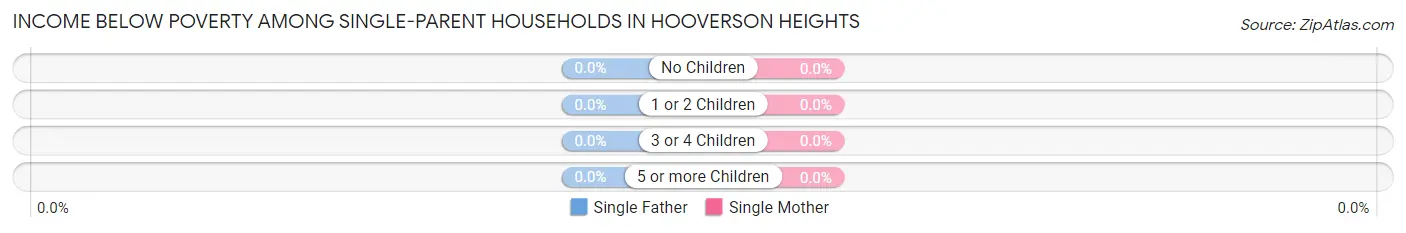
| Children | Single Father | Single Mother |
| No Children | 0 (0.0%) | 0 (0.0%) |
| 1 or 2 Children | 0 (0.0%) | 0 (0.0%) |
| 3 or 4 Children | 0 (0.0%) | 0 (0.0%) |
| 5 or more Children | 0 (0.0%) | 0 (0.0%) |
| Total | 0 (0.0%) | 0 (0.0%) |
Income Below Poverty Among Married-Couple vs Single-Parent Households in Hooverson Heights
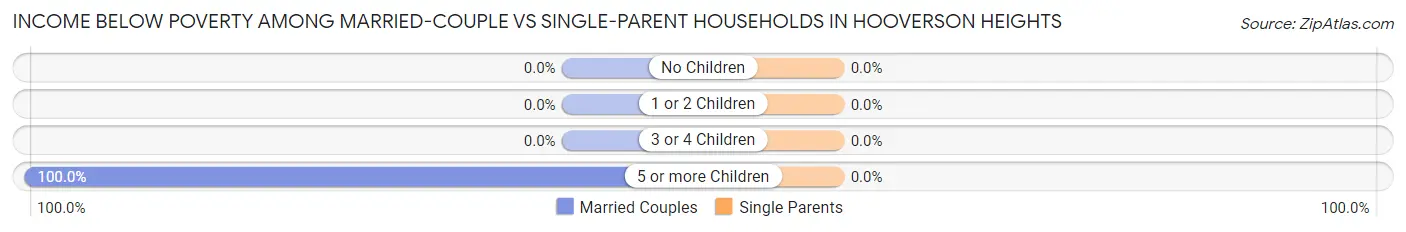
| Children | Married-Couple Families | Single-Parent Households |
| No Children | 0 (0.0%) | 0 (0.0%) |
| 1 or 2 Children | 0 (0.0%) | 0 (0.0%) |
| 3 or 4 Children | 0 (0.0%) | 0 (0.0%) |
| 5 or more Children | 2 (100.0%) | 0 (0.0%) |
| Total | 2 (0.4%) | 0 (0.0%) |
Employment Characteristics in Hooverson Heights
Employment by Class of Employer in Hooverson Heights
Among the 986 employed individuals in Hooverson Heights, private company employees (594 | 60.2%), local government employees (156 | 15.8%), and state government employees (74 | 7.5%) make up the most common classes of employment.
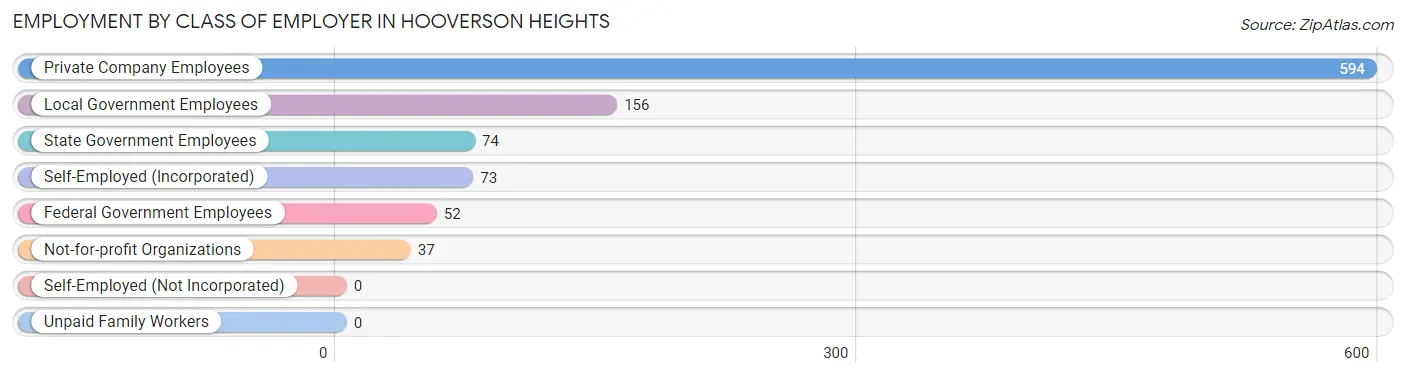
| Employer Class | # Employees | % Employees |
| Private Company Employees | 594 | 60.2% |
| Self-Employed (Incorporated) | 73 | 7.4% |
| Self-Employed (Not Incorporated) | 0 | 0.0% |
| Not-for-profit Organizations | 37 | 3.7% |
| Local Government Employees | 156 | 15.8% |
| State Government Employees | 74 | 7.5% |
| Federal Government Employees | 52 | 5.3% |
| Unpaid Family Workers | 0 | 0.0% |
| Total | 986 | 100.0% |
Employment Status by Age in Hooverson Heights
According to the labor force statistics for Hooverson Heights, out of the total population over 16 years of age (2,012), 50.6% or 1,018 individuals are in the labor force, with 3.2% or 33 of them unemployed. The age group with the highest labor force participation rate is 30 to 34 years, with 87.1% or 101 individuals in the labor force. Within the labor force, the 55 to 59 years age range has the highest percentage of unemployed individuals, with 11.0% or 19 of them being unemployed.
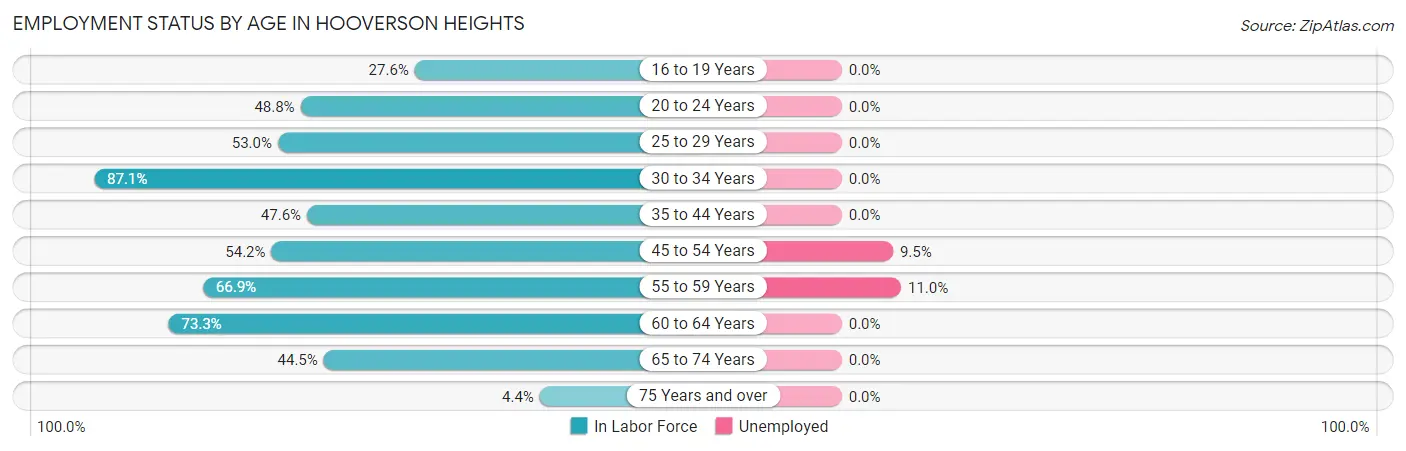
| Age Bracket | In Labor Force | Unemployed |
| 16 to 19 Years | 8 (27.6%) | 0 (0.0%) |
| 20 to 24 Years | 20 (48.8%) | 0 (0.0%) |
| 25 to 29 Years | 97 (53.0%) | 0 (0.0%) |
| 30 to 34 Years | 101 (87.1%) | 0 (0.0%) |
| 35 to 44 Years | 39 (47.6%) | 0 (0.0%) |
| 45 to 54 Years | 148 (54.2%) | 14 (9.5%) |
| 55 to 59 Years | 172 (66.9%) | 19 (11.0%) |
| 60 to 64 Years | 263 (73.3%) | 0 (0.0%) |
| 65 to 74 Years | 157 (44.5%) | 0 (0.0%) |
| 75 Years and over | 14 (4.4%) | 0 (0.0%) |
| Total | 1,018 (50.6%) | 33 (3.2%) |
Employment Status by Educational Attainment in Hooverson Heights
According to labor force statistics for Hooverson Heights, 64.6% of individuals (820) out of the total population between 25 and 64 years of age (1,270) are in the labor force, with 4.0% or 33 of them being unemployed. The group with the highest labor force participation rate are those with the educational attainment of bachelor's degree or higher, with 87.1% or 183 individuals in the labor force. Within the labor force, individuals with less than high school education have the highest percentage of unemployment, with 35.0% or 14 of them being unemployed.
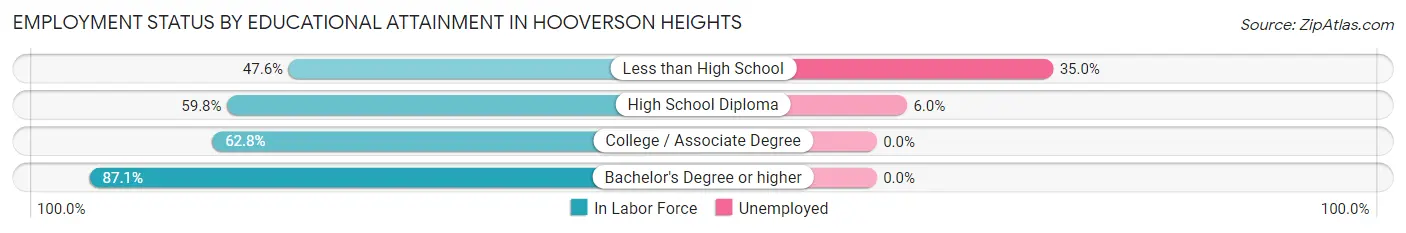
| Educational Attainment | In Labor Force | Unemployed |
| Less than High School | 40 (47.6%) | 29 (35.0%) |
| High School Diploma | 315 (59.8%) | 32 (6.0%) |
| College / Associate Degree | 282 (62.8%) | 0 (0.0%) |
| Bachelor's Degree or higher | 183 (87.1%) | 0 (0.0%) |
| Total | 820 (64.6%) | 51 (4.0%) |
Employment Occupations by Sex in Hooverson Heights
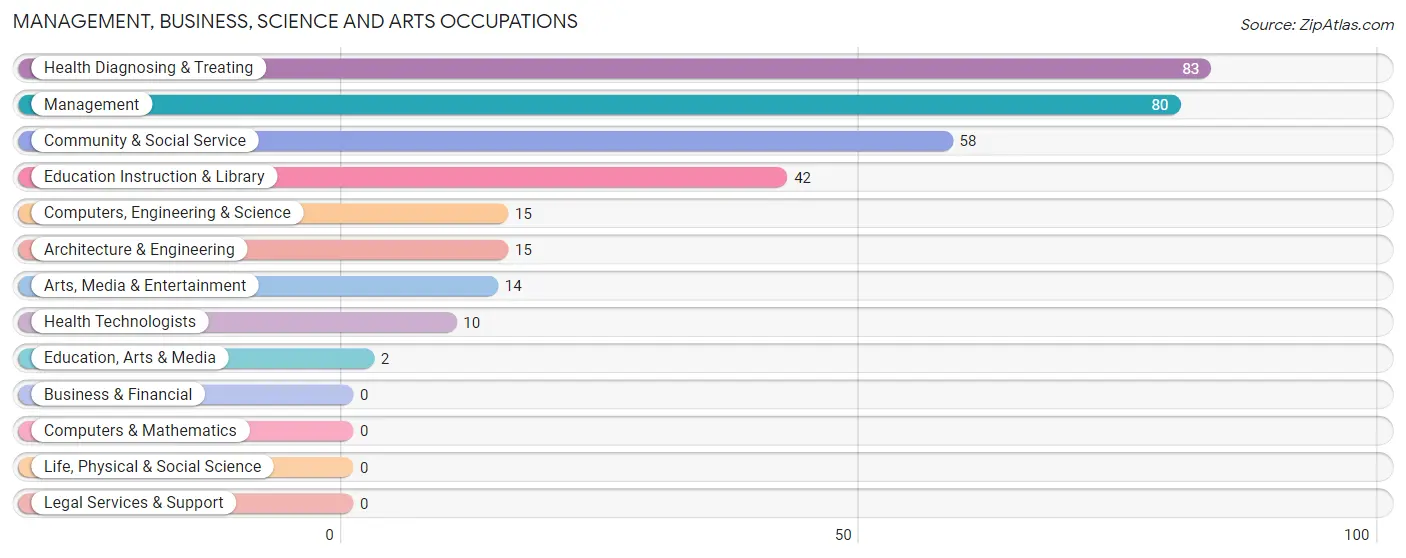
Management, Business, Science and Arts Occupations
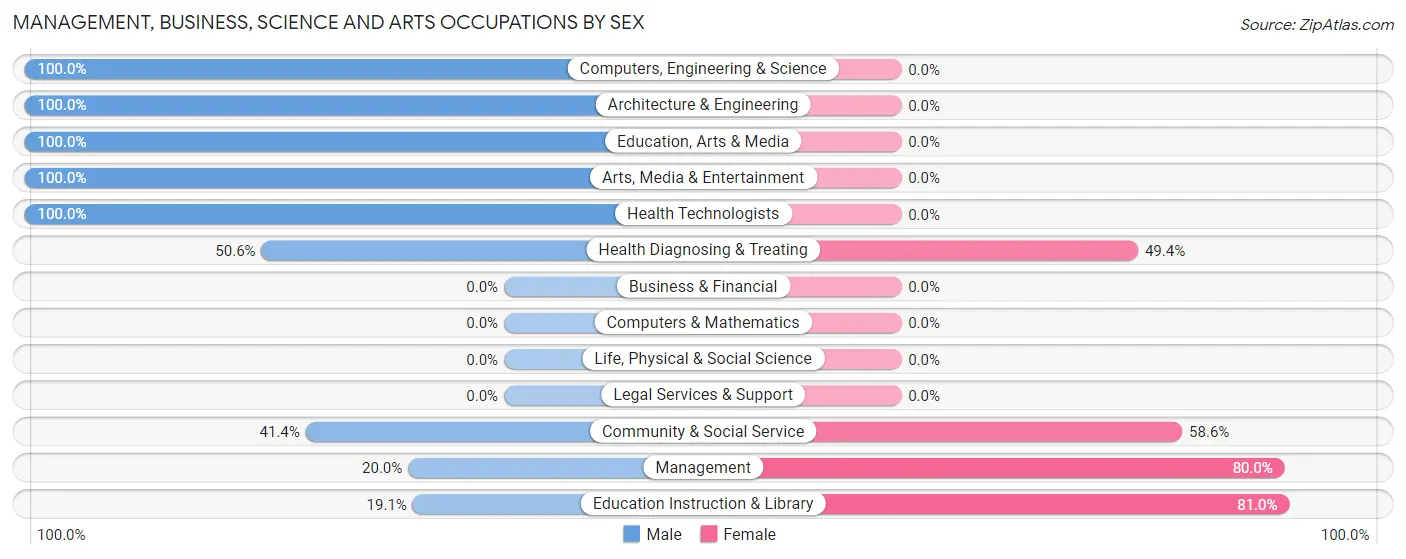
The most common Management, Business, Science and Arts occupations in Hooverson Heights are Health Diagnosing & Treating (83 | 8.4%), Management (80 | 8.1%), Community & Social Service (58 | 5.9%), Education Instruction & Library (42 | 4.3%), and Computers, Engineering & Science (15 | 1.5%).
Management, Business, Science and Arts Occupations by Sex
Within the Management, Business, Science and Arts occupations in Hooverson Heights, the most male-oriented occupations are Computers, Engineering & Science (100.0%), Architecture & Engineering (100.0%), and Education, Arts & Media (100.0%), while the most female-oriented occupations are Education Instruction & Library (80.9%), Management (80.0%), and Community & Social Service (58.6%).
| Occupation | Male | Female |
| Management | 16 (20.0%) | 64 (80.0%) |
| Business & Financial | 0 (0.0%) | 0 (0.0%) |
| Computers, Engineering & Science | 15 (100.0%) | 0 (0.0%) |
| Computers & Mathematics | 0 (0.0%) | 0 (0.0%) |
| Architecture & Engineering | 15 (100.0%) | 0 (0.0%) |
| Life, Physical & Social Science | 0 (0.0%) | 0 (0.0%) |
| Community & Social Service | 24 (41.4%) | 34 (58.6%) |
| Education, Arts & Media | 2 (100.0%) | 0 (0.0%) |
| Legal Services & Support | 0 (0.0%) | 0 (0.0%) |
| Education Instruction & Library | 8 (19.1%) | 34 (80.9%) |
| Arts, Media & Entertainment | 14 (100.0%) | 0 (0.0%) |
| Health Diagnosing & Treating | 42 (50.6%) | 41 (49.4%) |
| Health Technologists | 10 (100.0%) | 0 (0.0%) |
| Total (Category) | 97 (41.1%) | 139 (58.9%) |
| Total (Overall) | 585 (59.3%) | 401 (40.7%) |
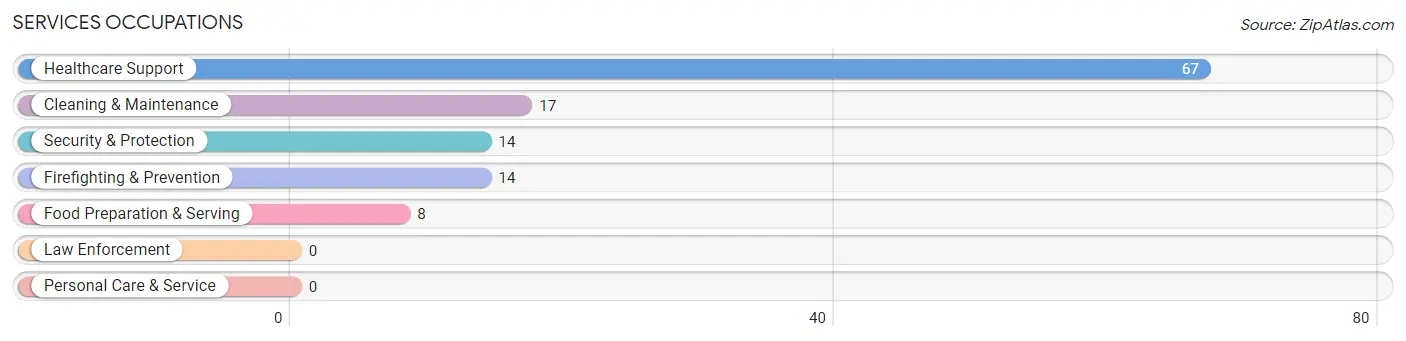
Services Occupations
The most common Services occupations in Hooverson Heights are Healthcare Support (67 | 6.8%), Cleaning & Maintenance (17 | 1.7%), Security & Protection (14 | 1.4%), Firefighting & Prevention (14 | 1.4%), and Food Preparation & Serving (8 | 0.8%).
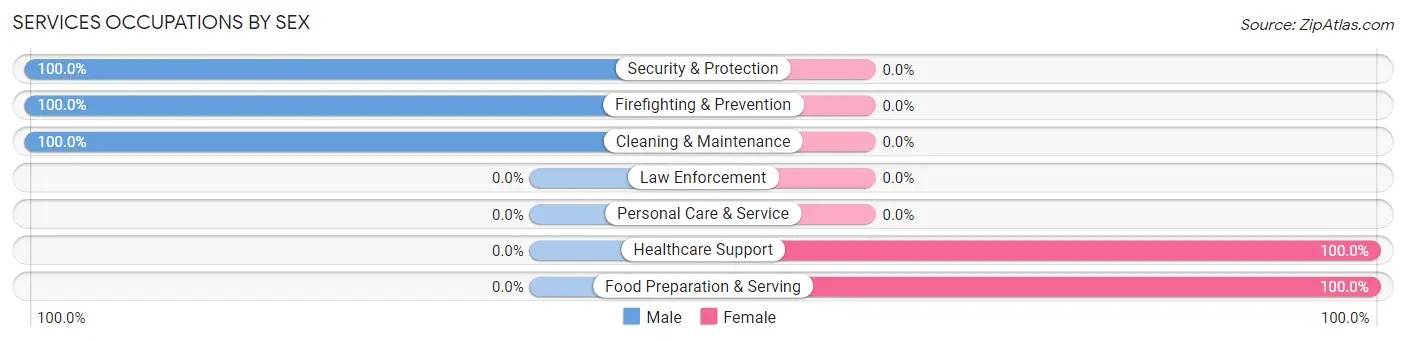
Services Occupations by Sex
Within the Services occupations in Hooverson Heights, the most male-oriented occupations are Security & Protection (100.0%), Firefighting & Prevention (100.0%), and Cleaning & Maintenance (100.0%), while the most female-oriented occupations are Healthcare Support (100.0%), and Food Preparation & Serving (100.0%).
| Occupation | Male | Female |
| Healthcare Support | 0 (0.0%) | 67 (100.0%) |
| Security & Protection | 14 (100.0%) | 0 (0.0%) |
| Firefighting & Prevention | 14 (100.0%) | 0 (0.0%) |
| Law Enforcement | 0 (0.0%) | 0 (0.0%) |
| Food Preparation & Serving | 0 (0.0%) | 8 (100.0%) |
| Cleaning & Maintenance | 17 (100.0%) | 0 (0.0%) |
| Personal Care & Service | 0 (0.0%) | 0 (0.0%) |
| Total (Category) | 31 (29.2%) | 75 (70.8%) |
| Total (Overall) | 585 (59.3%) | 401 (40.7%) |
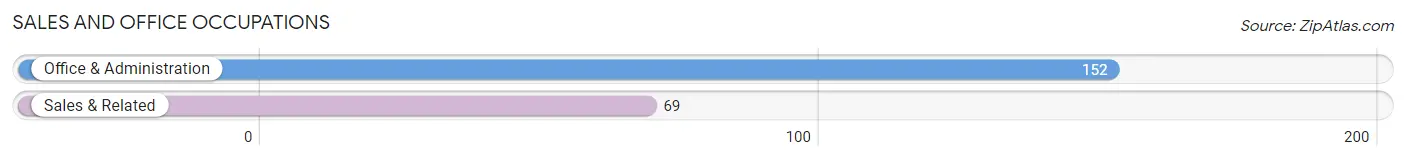
Sales and Office Occupations
The most common Sales and Office occupations in Hooverson Heights are Office & Administration (152 | 15.4%), and Sales & Related (69 | 7.0%).
Sales and Office Occupations by Sex
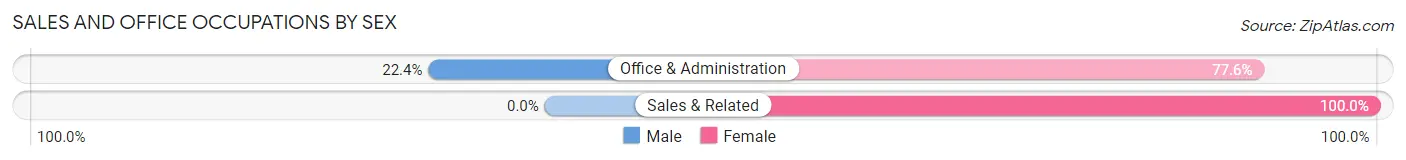
| Occupation | Male | Female |
| Sales & Related | 0 (0.0%) | 69 (100.0%) |
| Office & Administration | 34 (22.4%) | 118 (77.6%) |
| Total (Category) | 34 (15.4%) | 187 (84.6%) |
| Total (Overall) | 585 (59.3%) | 401 (40.7%) |
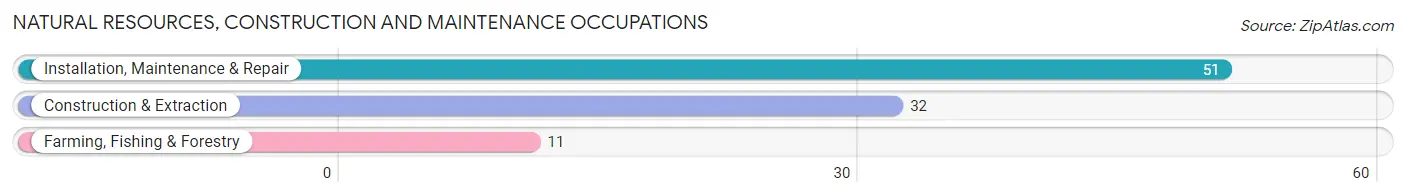
Natural Resources, Construction and Maintenance Occupations
The most common Natural Resources, Construction and Maintenance occupations in Hooverson Heights are Installation, Maintenance & Repair (51 | 5.2%), Construction & Extraction (32 | 3.3%), and Farming, Fishing & Forestry (11 | 1.1%).
Natural Resources, Construction and Maintenance Occupations by Sex
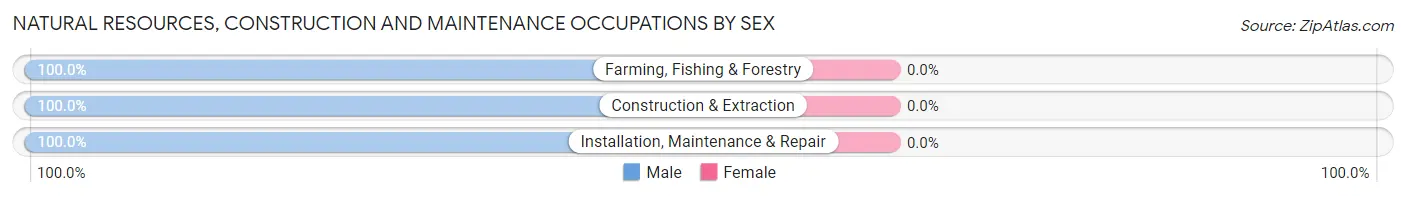
| Occupation | Male | Female |
| Farming, Fishing & Forestry | 11 (100.0%) | 0 (0.0%) |
| Construction & Extraction | 32 (100.0%) | 0 (0.0%) |
| Installation, Maintenance & Repair | 51 (100.0%) | 0 (0.0%) |
| Total (Category) | 94 (100.0%) | 0 (0.0%) |
| Total (Overall) | 585 (59.3%) | 401 (40.7%) |
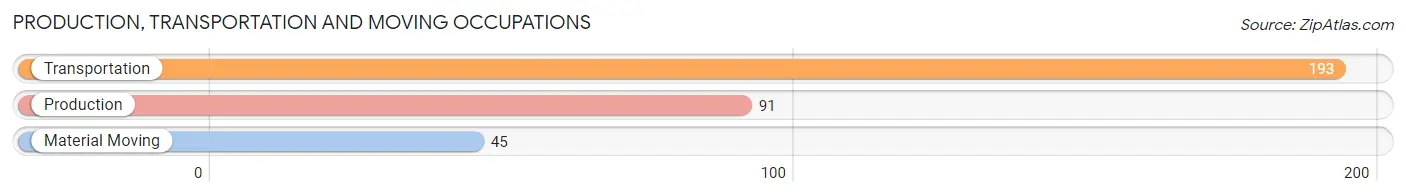
Production, Transportation and Moving Occupations
The most common Production, Transportation and Moving occupations in Hooverson Heights are Transportation (193 | 19.6%), Production (91 | 9.2%), and Material Moving (45 | 4.6%).
Production, Transportation and Moving Occupations by Sex
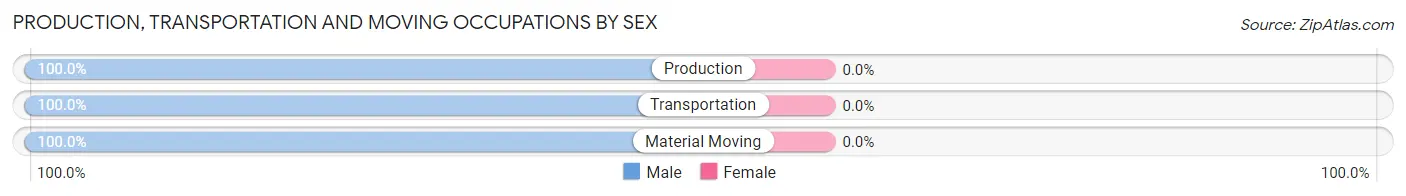
| Occupation | Male | Female |
| Production | 91 (100.0%) | 0 (0.0%) |
| Transportation | 193 (100.0%) | 0 (0.0%) |
| Material Moving | 45 (100.0%) | 0 (0.0%) |
| Total (Category) | 329 (100.0%) | 0 (0.0%) |
| Total (Overall) | 585 (59.3%) | 401 (40.7%) |
Employment Industries by Sex in Hooverson Heights
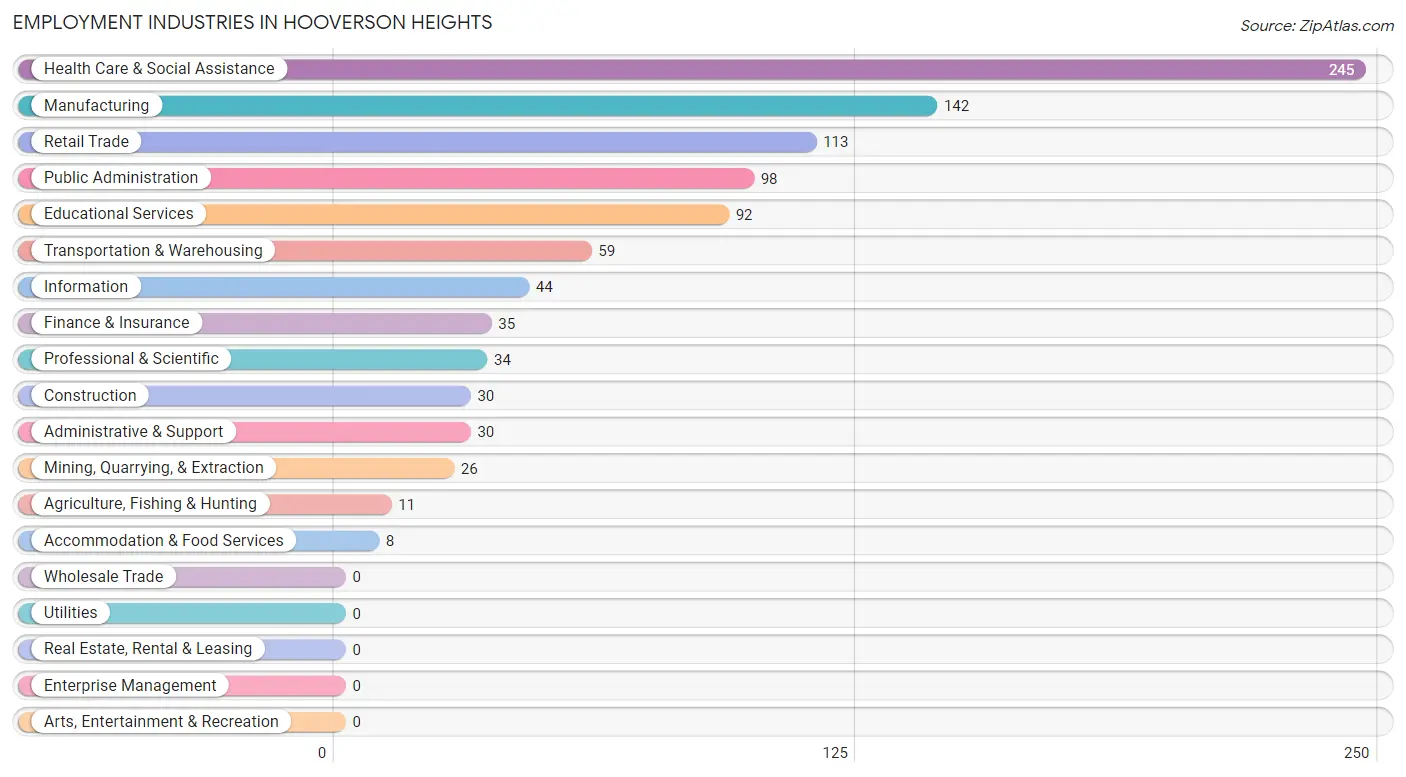
Employment Industries in Hooverson Heights
The major employment industries in Hooverson Heights include Health Care & Social Assistance (245 | 24.8%), Manufacturing (142 | 14.4%), Retail Trade (113 | 11.5%), Public Administration (98 | 9.9%), and Educational Services (92 | 9.3%).
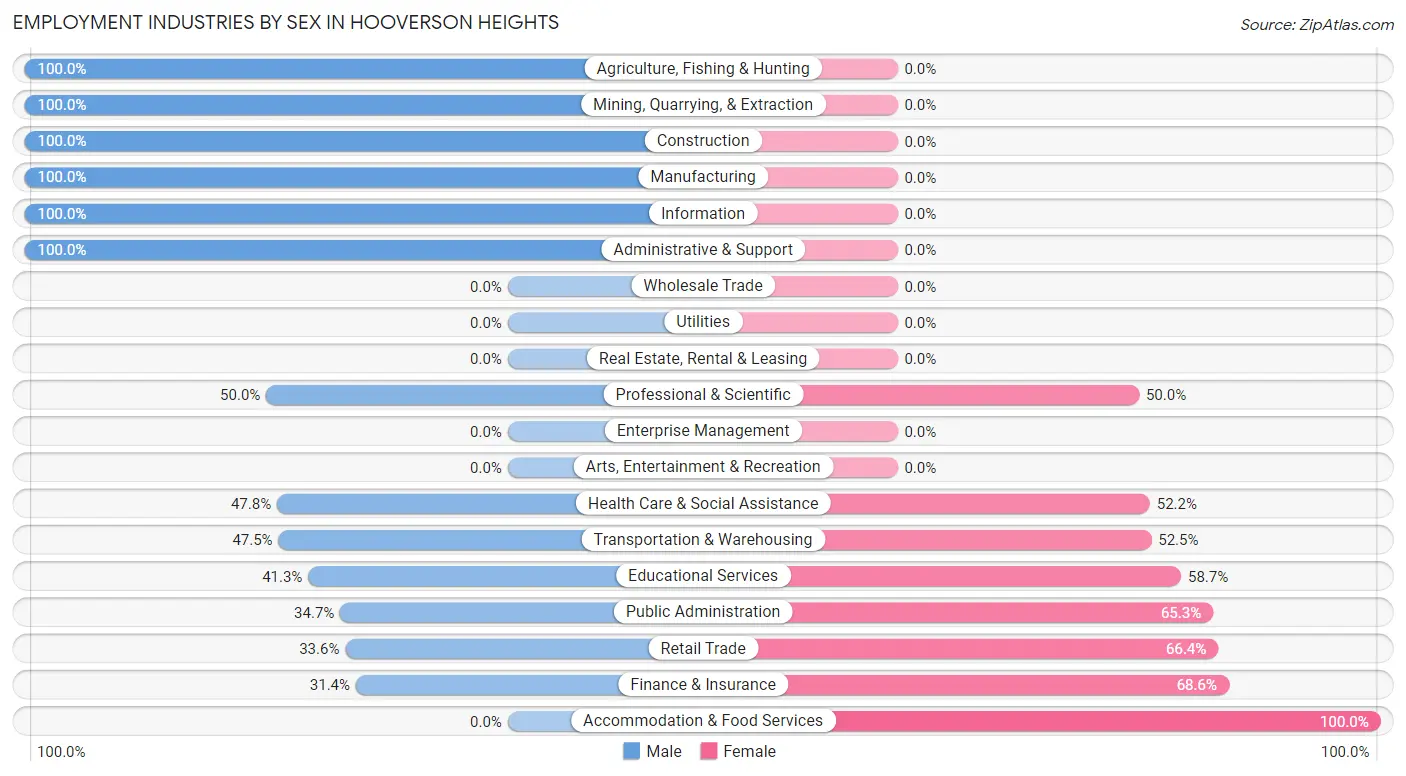
Employment Industries by Sex in Hooverson Heights
The Hooverson Heights industries that see more men than women are Agriculture, Fishing & Hunting (100.0%), Mining, Quarrying, & Extraction (100.0%), and Construction (100.0%), whereas the industries that tend to have a higher number of women are Accommodation & Food Services (100.0%), Finance & Insurance (68.6%), and Retail Trade (66.4%).
| Industry | Male | Female |
| Agriculture, Fishing & Hunting | 11 (100.0%) | 0 (0.0%) |
| Mining, Quarrying, & Extraction | 26 (100.0%) | 0 (0.0%) |
| Construction | 30 (100.0%) | 0 (0.0%) |
| Manufacturing | 142 (100.0%) | 0 (0.0%) |
| Wholesale Trade | 0 (0.0%) | 0 (0.0%) |
| Retail Trade | 38 (33.6%) | 75 (66.4%) |
| Transportation & Warehousing | 28 (47.5%) | 31 (52.5%) |
| Utilities | 0 (0.0%) | 0 (0.0%) |
| Information | 44 (100.0%) | 0 (0.0%) |
| Finance & Insurance | 11 (31.4%) | 24 (68.6%) |
| Real Estate, Rental & Leasing | 0 (0.0%) | 0 (0.0%) |
| Professional & Scientific | 17 (50.0%) | 17 (50.0%) |
| Enterprise Management | 0 (0.0%) | 0 (0.0%) |
| Administrative & Support | 30 (100.0%) | 0 (0.0%) |
| Educational Services | 38 (41.3%) | 54 (58.7%) |
| Health Care & Social Assistance | 117 (47.8%) | 128 (52.2%) |
| Arts, Entertainment & Recreation | 0 (0.0%) | 0 (0.0%) |
| Accommodation & Food Services | 0 (0.0%) | 8 (100.0%) |
| Public Administration | 34 (34.7%) | 64 (65.3%) |
| Total | 585 (59.3%) | 401 (40.7%) |
Education in Hooverson Heights
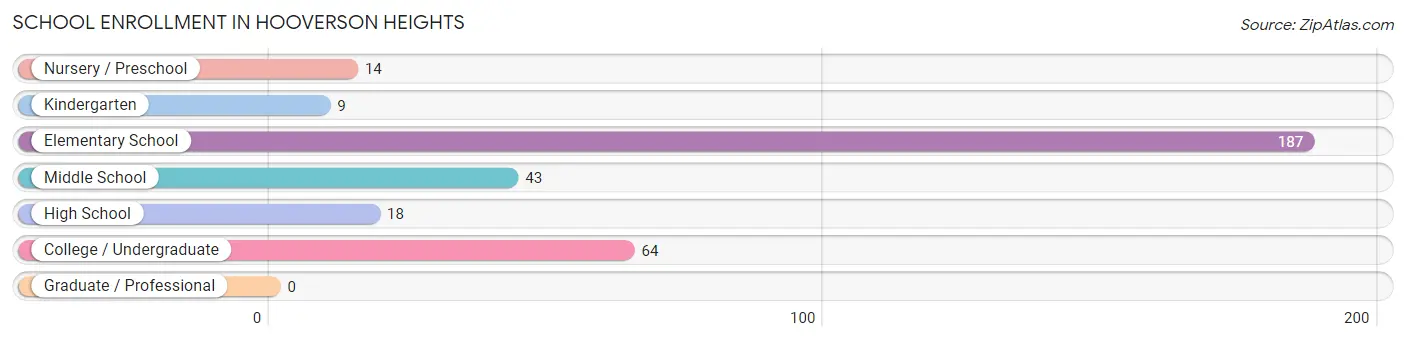
School Enrollment in Hooverson Heights
The most common levels of schooling among the 335 students in Hooverson Heights are elementary school (187 | 55.8%), college / undergraduate (64 | 19.1%), and middle school (43 | 12.8%).
| School Level | # Students | % Students |
| Nursery / Preschool | 14 | 4.2% |
| Kindergarten | 9 | 2.7% |
| Elementary School | 187 | 55.8% |
| Middle School | 43 | 12.8% |
| High School | 18 | 5.4% |
| College / Undergraduate | 64 | 19.1% |
| Graduate / Professional | 0 | 0.0% |
| Total | 335 | 100.0% |
School Enrollment by Age by Funding Source in Hooverson Heights
Out of a total of 335 students who are enrolled in schools in Hooverson Heights, 11 (3.3%) attend a private institution, while the remaining 324 (96.7%) are enrolled in public schools. The age group of 10 to 14 year olds has the highest likelihood of being enrolled in private schools, with 11 (10.3% in the age bracket) enrolled. Conversely, the age group of 5 to 9 year old has the lowest likelihood of being enrolled in a private school, with 136 (100.0% in the age bracket) attending a public institution.
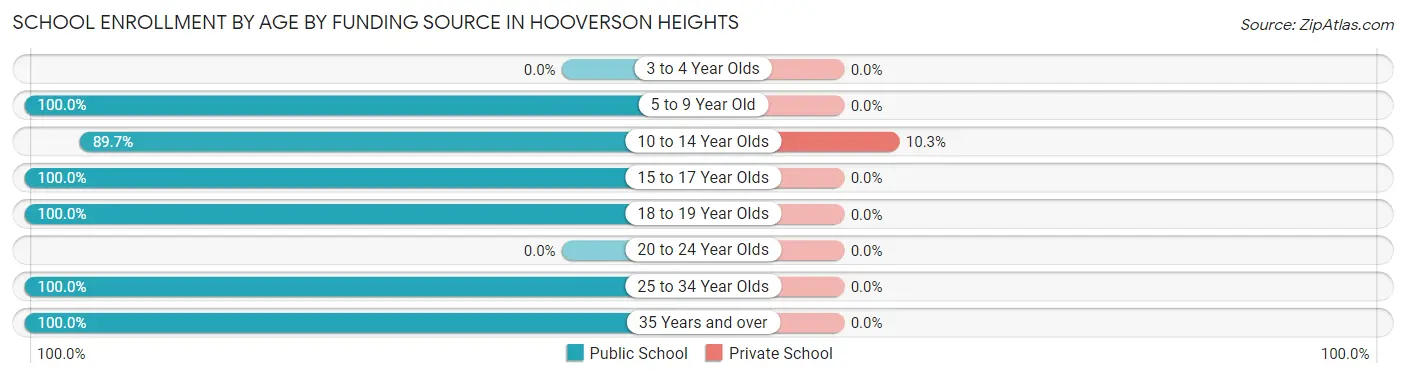
| Age Bracket | Public School | Private School |
| 3 to 4 Year Olds | 0 (0.0%) | 0 (0.0%) |
| 5 to 9 Year Old | 136 (100.0%) | 0 (0.0%) |
| 10 to 14 Year Olds | 96 (89.7%) | 11 (10.3%) |
| 15 to 17 Year Olds | 18 (100.0%) | 0 (0.0%) |
| 18 to 19 Year Olds | 10 (100.0%) | 0 (0.0%) |
| 20 to 24 Year Olds | 0 (0.0%) | 0 (0.0%) |
| 25 to 34 Year Olds | 59 (100.0%) | 0 (0.0%) |
| 35 Years and over | 5 (100.0%) | 0 (0.0%) |
| Total | 324 (96.7%) | 11 (3.3%) |
Educational Attainment by Field of Study in Hooverson Heights
Education (104 | 33.7%), business (60 | 19.4%), engineering (52 | 16.8%), science & technology (27 | 8.7%), and bio, nature & agricultural (21 | 6.8%) are the most common fields of study among 309 individuals in Hooverson Heights who have obtained a bachelor's degree or higher.
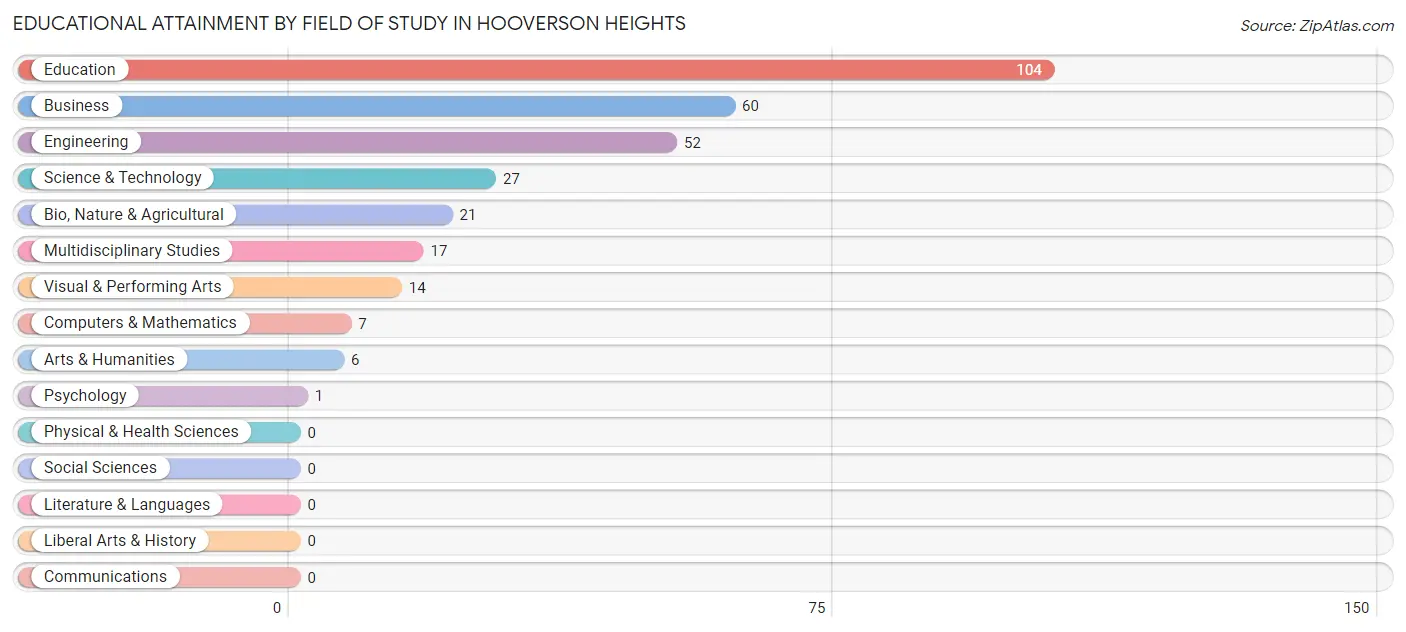
| Field of Study | # Graduates | % Graduates |
| Computers & Mathematics | 7 | 2.3% |
| Bio, Nature & Agricultural | 21 | 6.8% |
| Physical & Health Sciences | 0 | 0.0% |
| Psychology | 1 | 0.3% |
| Social Sciences | 0 | 0.0% |
| Engineering | 52 | 16.8% |
| Multidisciplinary Studies | 17 | 5.5% |
| Science & Technology | 27 | 8.7% |
| Business | 60 | 19.4% |
| Education | 104 | 33.7% |
| Literature & Languages | 0 | 0.0% |
| Liberal Arts & History | 0 | 0.0% |
| Visual & Performing Arts | 14 | 4.5% |
| Communications | 0 | 0.0% |
| Arts & Humanities | 6 | 1.9% |
| Total | 309 | 100.0% |
Transportation & Commute in Hooverson Heights
Vehicle Availability by Sex in Hooverson Heights
The most prevalent vehicle ownership categories in Hooverson Heights are males with 2 vehicles (381, accounting for 65.1%) and females with 2 vehicles (211, making up 95.0%).
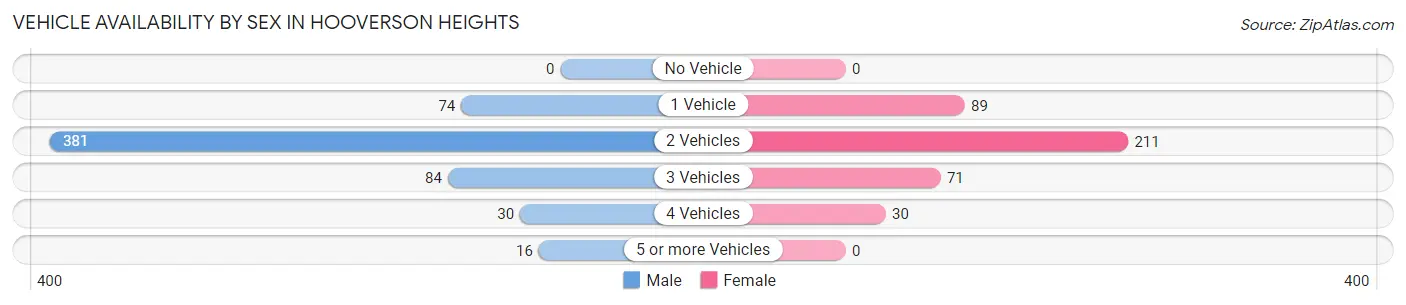
| Vehicles Available | Male | Female |
| No Vehicle | 0 (0.0%) | 0 (0.0%) |
| 1 Vehicle | 74 (12.7%) | 89 (22.2%) |
| 2 Vehicles | 381 (65.1%) | 211 (52.6%) |
| 3 Vehicles | 84 (14.4%) | 71 (17.7%) |
| 4 Vehicles | 30 (5.1%) | 30 (7.5%) |
| 5 or more Vehicles | 16 (2.7%) | 0 (0.0%) |
| Total | 585 (100.0%) | 401 (100.0%) |
Commute Time in Hooverson Heights
The most frequently occuring commute durations in Hooverson Heights are 10 to 14 minutes (198 commuters, 23.5%), 20 to 24 minutes (152 commuters, 18.0%), and 5 to 9 minutes (132 commuters, 15.7%).
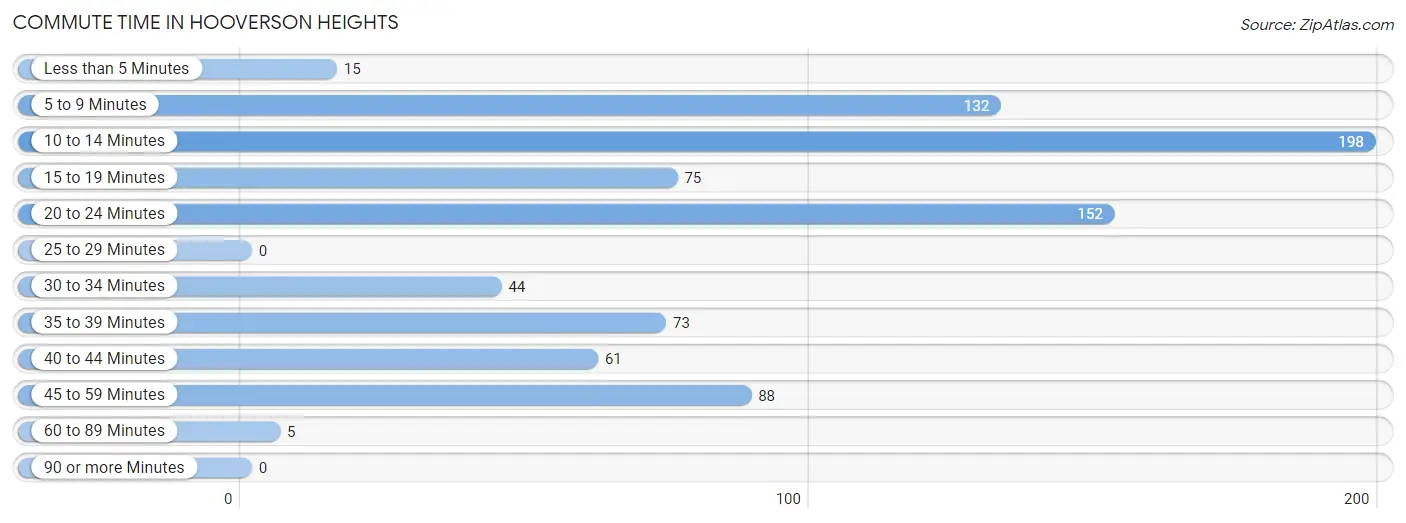
| Commute Time | # Commuters | % Commuters |
| Less than 5 Minutes | 15 | 1.8% |
| 5 to 9 Minutes | 132 | 15.7% |
| 10 to 14 Minutes | 198 | 23.5% |
| 15 to 19 Minutes | 75 | 8.9% |
| 20 to 24 Minutes | 152 | 18.0% |
| 25 to 29 Minutes | 0 | 0.0% |
| 30 to 34 Minutes | 44 | 5.2% |
| 35 to 39 Minutes | 73 | 8.7% |
| 40 to 44 Minutes | 61 | 7.2% |
| 45 to 59 Minutes | 88 | 10.4% |
| 60 to 89 Minutes | 5 | 0.6% |
| 90 or more Minutes | 0 | 0.0% |
Commute Time by Sex in Hooverson Heights
The most common commute times in Hooverson Heights are 10 to 14 minutes (102 commuters, 20.1%) for males and 10 to 14 minutes (96 commuters, 28.7%) for females.
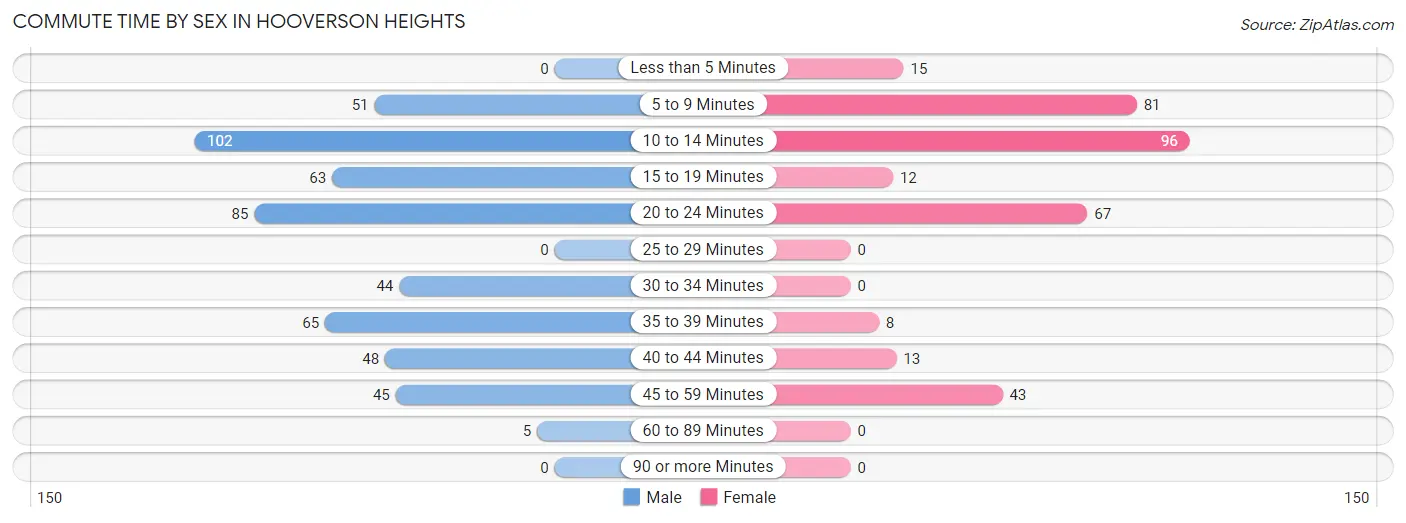
| Commute Time | Male | Female |
| Less than 5 Minutes | 0 (0.0%) | 15 (4.5%) |
| 5 to 9 Minutes | 51 (10.0%) | 81 (24.2%) |
| 10 to 14 Minutes | 102 (20.1%) | 96 (28.7%) |
| 15 to 19 Minutes | 63 (12.4%) | 12 (3.6%) |
| 20 to 24 Minutes | 85 (16.7%) | 67 (20.0%) |
| 25 to 29 Minutes | 0 (0.0%) | 0 (0.0%) |
| 30 to 34 Minutes | 44 (8.7%) | 0 (0.0%) |
| 35 to 39 Minutes | 65 (12.8%) | 8 (2.4%) |
| 40 to 44 Minutes | 48 (9.5%) | 13 (3.9%) |
| 45 to 59 Minutes | 45 (8.9%) | 43 (12.8%) |
| 60 to 89 Minutes | 5 (1.0%) | 0 (0.0%) |
| 90 or more Minutes | 0 (0.0%) | 0 (0.0%) |
Time of Departure to Work by Sex in Hooverson Heights
The most frequent times of departure to work in Hooverson Heights are 6:00 AM to 6:29 AM (108, 21.3%) for males and 8:00 AM to 8:29 AM (77, 23.0%) for females.
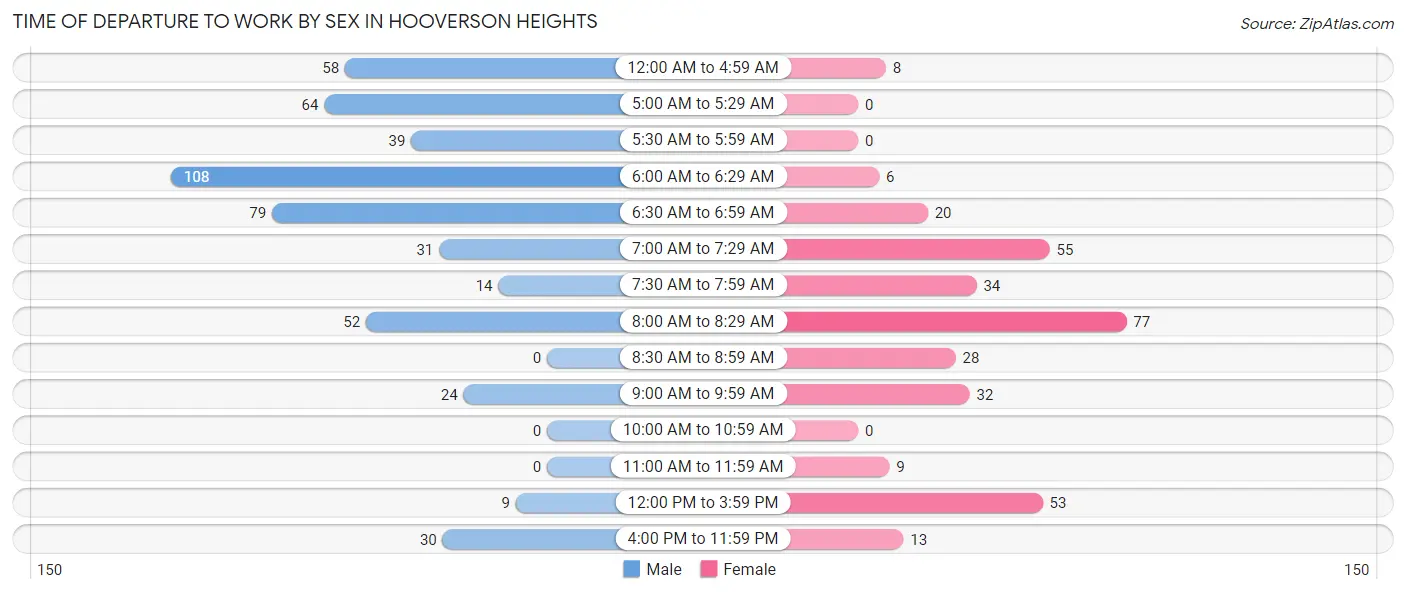
| Time of Departure | Male | Female |
| 12:00 AM to 4:59 AM | 58 (11.4%) | 8 (2.4%) |
| 5:00 AM to 5:29 AM | 64 (12.6%) | 0 (0.0%) |
| 5:30 AM to 5:59 AM | 39 (7.7%) | 0 (0.0%) |
| 6:00 AM to 6:29 AM | 108 (21.3%) | 6 (1.8%) |
| 6:30 AM to 6:59 AM | 79 (15.5%) | 20 (6.0%) |
| 7:00 AM to 7:29 AM | 31 (6.1%) | 55 (16.4%) |
| 7:30 AM to 7:59 AM | 14 (2.8%) | 34 (10.2%) |
| 8:00 AM to 8:29 AM | 52 (10.2%) | 77 (23.0%) |
| 8:30 AM to 8:59 AM | 0 (0.0%) | 28 (8.4%) |
| 9:00 AM to 9:59 AM | 24 (4.7%) | 32 (9.6%) |
| 10:00 AM to 10:59 AM | 0 (0.0%) | 0 (0.0%) |
| 11:00 AM to 11:59 AM | 0 (0.0%) | 9 (2.7%) |
| 12:00 PM to 3:59 PM | 9 (1.8%) | 53 (15.8%) |
| 4:00 PM to 11:59 PM | 30 (5.9%) | 13 (3.9%) |
| Total | 508 (100.0%) | 335 (100.0%) |
Housing Occupancy in Hooverson Heights
Occupancy by Ownership in Hooverson Heights
Of the total 1,034 dwellings in Hooverson Heights, owner-occupied units account for 821 (79.4%), while renter-occupied units make up 213 (20.6%).
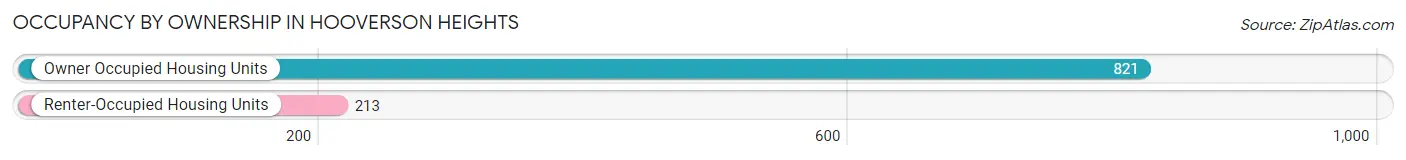
| Occupancy | # Housing Units | % Housing Units |
| Owner Occupied Housing Units | 821 | 79.4% |
| Renter-Occupied Housing Units | 213 | 20.6% |
| Total Occupied Housing Units | 1,034 | 100.0% |
Occupancy by Household Size in Hooverson Heights
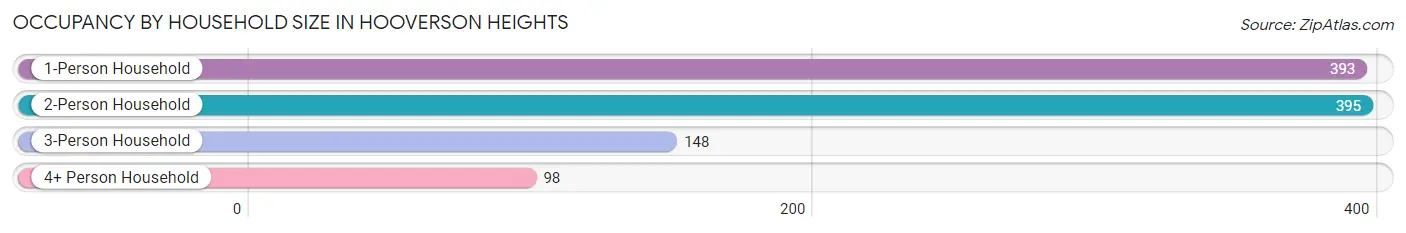
| Household Size | # Housing Units | % Housing Units |
| 1-Person Household | 393 | 38.0% |
| 2-Person Household | 395 | 38.2% |
| 3-Person Household | 148 | 14.3% |
| 4+ Person Household | 98 | 9.5% |
| Total Housing Units | 1,034 | 100.0% |
Occupancy by Ownership by Household Size in Hooverson Heights
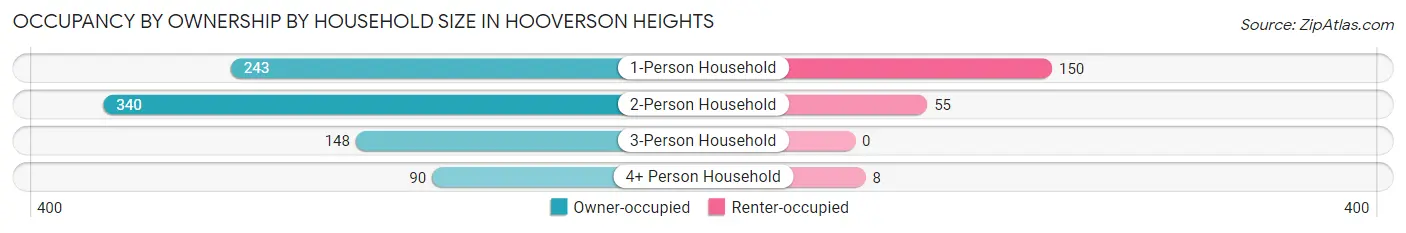
| Household Size | Owner-occupied | Renter-occupied |
| 1-Person Household | 243 (61.8%) | 150 (38.2%) |
| 2-Person Household | 340 (86.1%) | 55 (13.9%) |
| 3-Person Household | 148 (100.0%) | 0 (0.0%) |
| 4+ Person Household | 90 (91.8%) | 8 (8.2%) |
| Total Housing Units | 821 (79.4%) | 213 (20.6%) |
Occupancy by Educational Attainment in Hooverson Heights
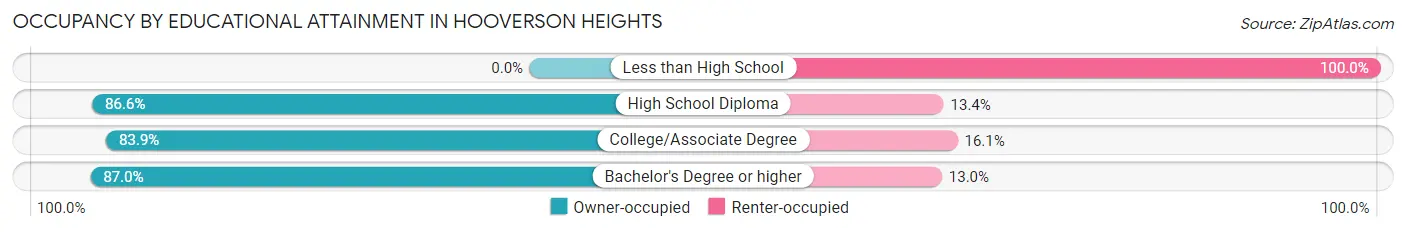
| Household Size | Owner-occupied | Renter-occupied |
| Less than High School | 0 (0.0%) | 75 (100.0%) |
| High School Diploma | 337 (86.6%) | 52 (13.4%) |
| College/Associate Degree | 317 (83.9%) | 61 (16.1%) |
| Bachelor's Degree or higher | 167 (87.0%) | 25 (13.0%) |
Occupancy by Age of Householder in Hooverson Heights
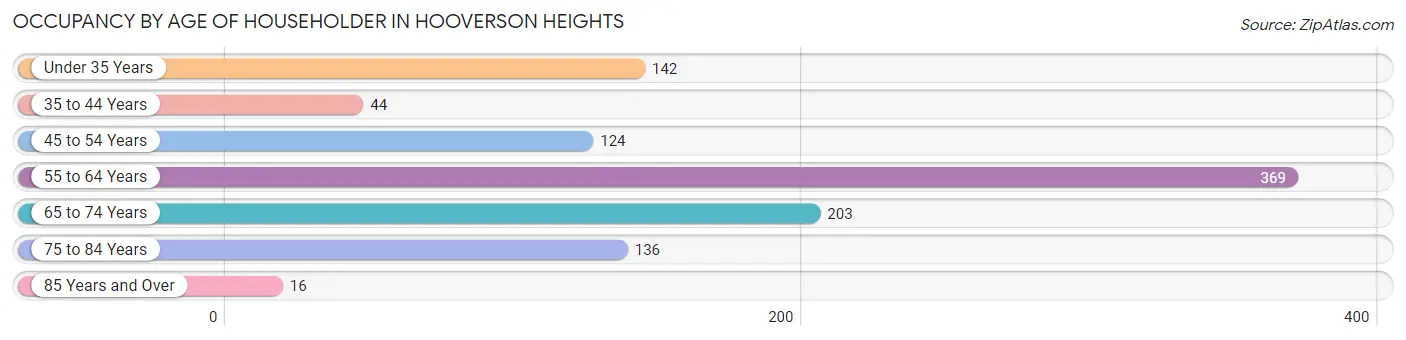
| Age Bracket | # Households | % Households |
| Under 35 Years | 142 | 13.7% |
| 35 to 44 Years | 44 | 4.3% |
| 45 to 54 Years | 124 | 12.0% |
| 55 to 64 Years | 369 | 35.7% |
| 65 to 74 Years | 203 | 19.6% |
| 75 to 84 Years | 136 | 13.2% |
| 85 Years and Over | 16 | 1.5% |
| Total | 1,034 | 100.0% |
Housing Finances in Hooverson Heights
Median Income by Occupancy in Hooverson Heights
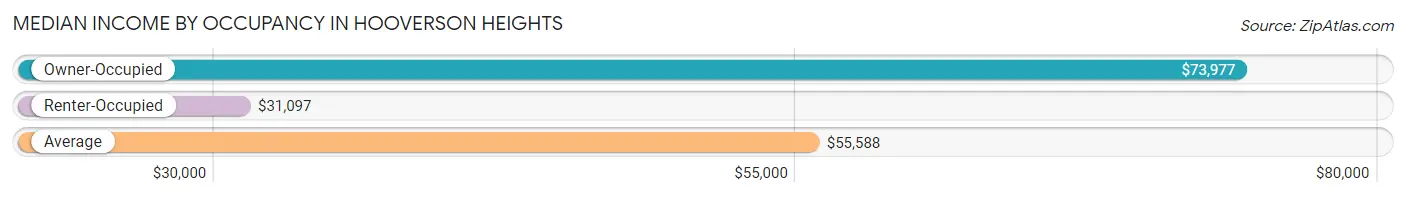
| Occupancy Type | # Households | Median Income |
| Owner-Occupied | 821 (79.4%) | $73,977 |
| Renter-Occupied | 213 (20.6%) | $31,097 |
| Average | 1,034 (100.0%) | $55,588 |
Occupancy by Householder Income Bracket in Hooverson Heights
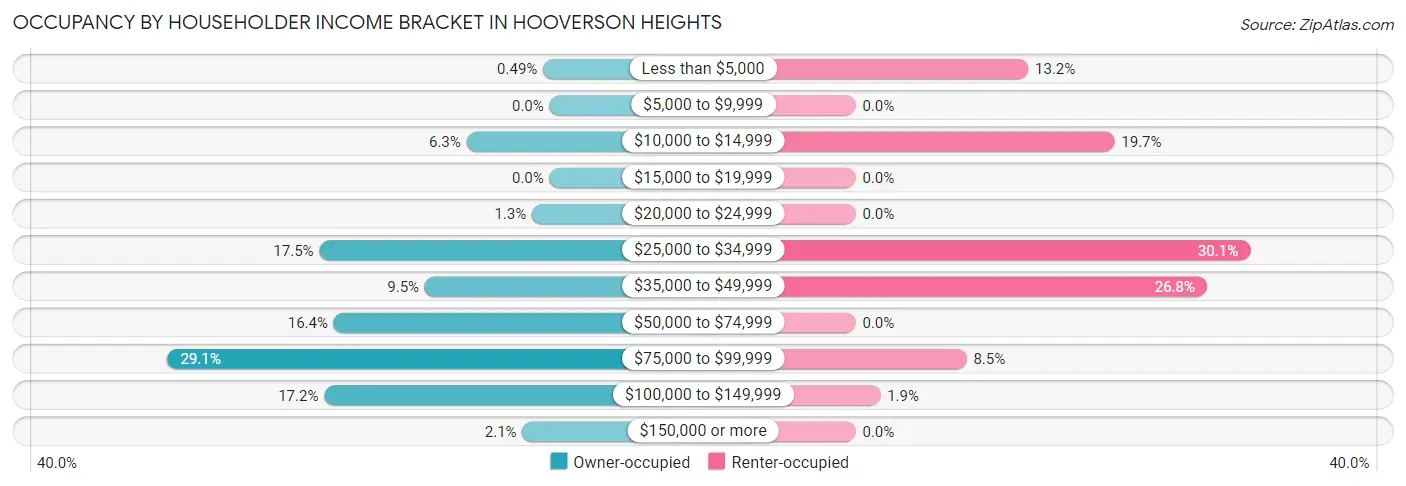
| Income Bracket | Owner-occupied | Renter-occupied |
| Less than $5,000 | 4 (0.5%) | 28 (13.2%) |
| $5,000 to $9,999 | 0 (0.0%) | 0 (0.0%) |
| $10,000 to $14,999 | 52 (6.3%) | 42 (19.7%) |
| $15,000 to $19,999 | 0 (0.0%) | 0 (0.0%) |
| $20,000 to $24,999 | 11 (1.3%) | 0 (0.0%) |
| $25,000 to $34,999 | 144 (17.5%) | 64 (30.0%) |
| $35,000 to $49,999 | 78 (9.5%) | 57 (26.8%) |
| $50,000 to $74,999 | 135 (16.4%) | 0 (0.0%) |
| $75,000 to $99,999 | 239 (29.1%) | 18 (8.5%) |
| $100,000 to $149,999 | 141 (17.2%) | 4 (1.9%) |
| $150,000 or more | 17 (2.1%) | 0 (0.0%) |
| Total | 821 (100.0%) | 213 (100.0%) |
Monthly Housing Cost Tiers in Hooverson Heights
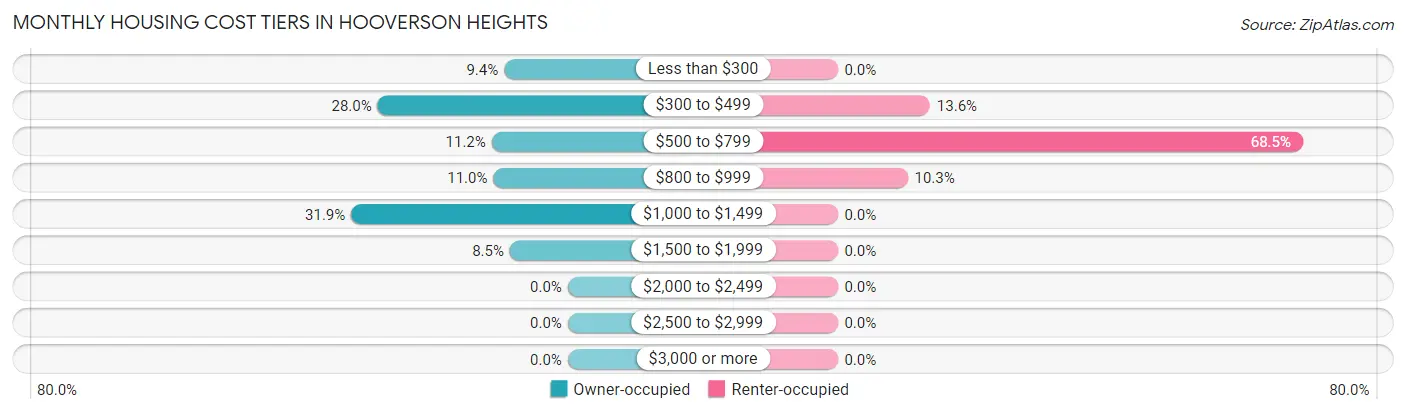
| Monthly Cost | Owner-occupied | Renter-occupied |
| Less than $300 | 77 (9.4%) | 0 (0.0%) |
| $300 to $499 | 230 (28.0%) | 29 (13.6%) |
| $500 to $799 | 92 (11.2%) | 146 (68.5%) |
| $800 to $999 | 90 (11.0%) | 22 (10.3%) |
| $1,000 to $1,499 | 262 (31.9%) | 0 (0.0%) |
| $1,500 to $1,999 | 70 (8.5%) | 0 (0.0%) |
| $2,000 to $2,499 | 0 (0.0%) | 0 (0.0%) |
| $2,500 to $2,999 | 0 (0.0%) | 0 (0.0%) |
| $3,000 or more | 0 (0.0%) | 0 (0.0%) |
| Total | 821 (100.0%) | 213 (100.0%) |
Physical Housing Characteristics in Hooverson Heights
Housing Structures in Hooverson Heights
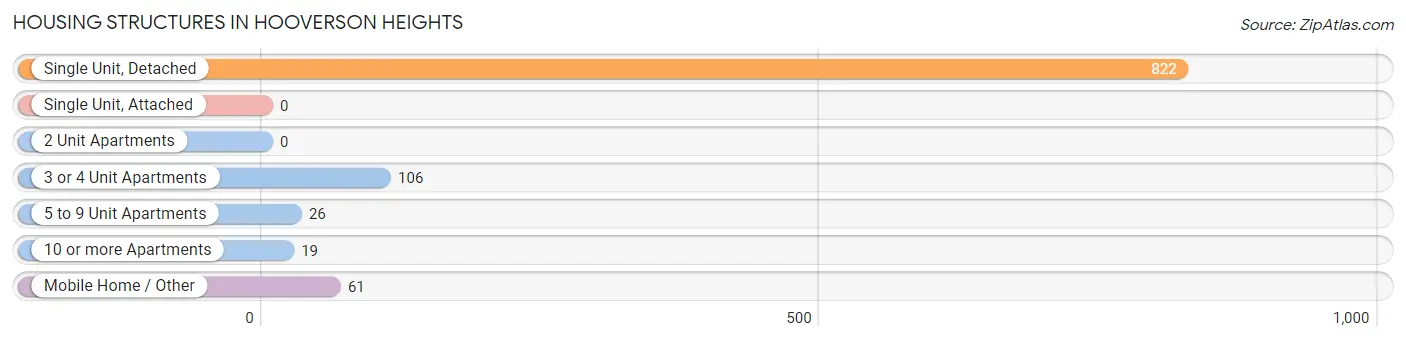
| Structure Type | # Housing Units | % Housing Units |
| Single Unit, Detached | 822 | 79.5% |
| Single Unit, Attached | 0 | 0.0% |
| 2 Unit Apartments | 0 | 0.0% |
| 3 or 4 Unit Apartments | 106 | 10.2% |
| 5 to 9 Unit Apartments | 26 | 2.5% |
| 10 or more Apartments | 19 | 1.8% |
| Mobile Home / Other | 61 | 5.9% |
| Total | 1,034 | 100.0% |
Housing Structures by Occupancy in Hooverson Heights
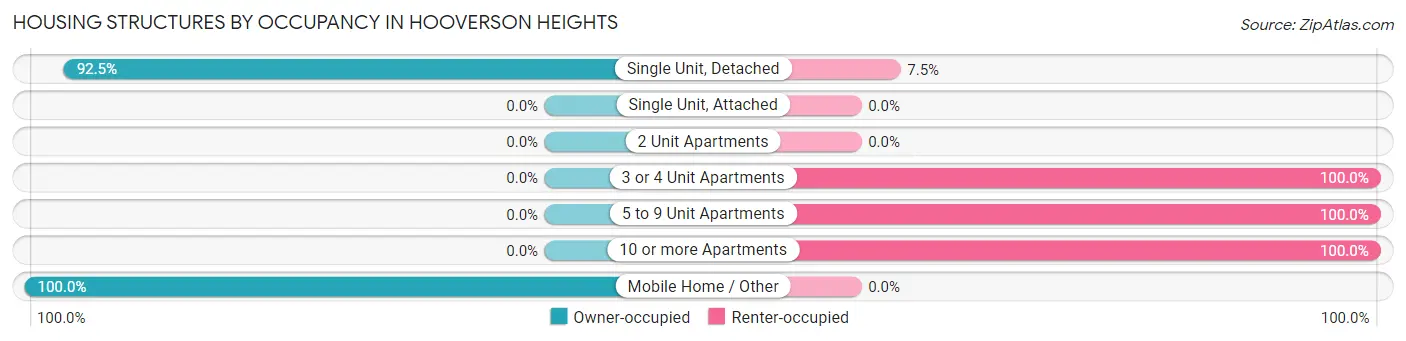
| Structure Type | Owner-occupied | Renter-occupied |
| Single Unit, Detached | 760 (92.5%) | 62 (7.5%) |
| Single Unit, Attached | 0 (0.0%) | 0 (0.0%) |
| 2 Unit Apartments | 0 (0.0%) | 0 (0.0%) |
| 3 or 4 Unit Apartments | 0 (0.0%) | 106 (100.0%) |
| 5 to 9 Unit Apartments | 0 (0.0%) | 26 (100.0%) |
| 10 or more Apartments | 0 (0.0%) | 19 (100.0%) |
| Mobile Home / Other | 61 (100.0%) | 0 (0.0%) |
| Total | 821 (79.4%) | 213 (20.6%) |
Housing Structures by Number of Rooms in Hooverson Heights
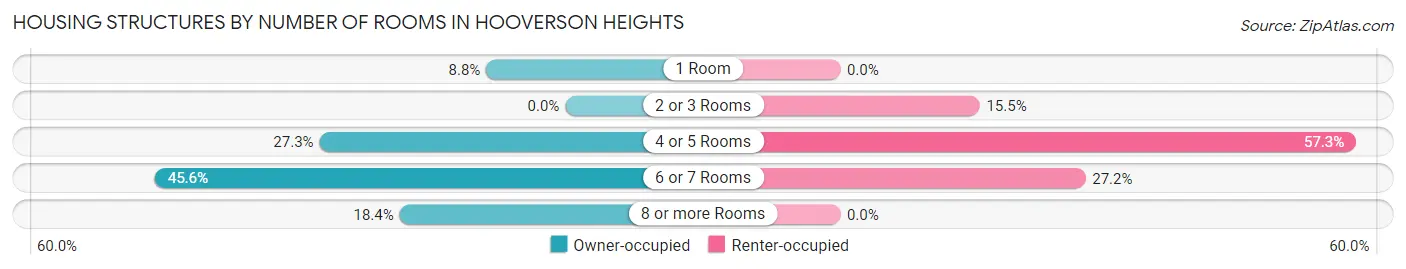
| Number of Rooms | Owner-occupied | Renter-occupied |
| 1 Room | 72 (8.8%) | 0 (0.0%) |
| 2 or 3 Rooms | 0 (0.0%) | 33 (15.5%) |
| 4 or 5 Rooms | 224 (27.3%) | 122 (57.3%) |
| 6 or 7 Rooms | 374 (45.6%) | 58 (27.2%) |
| 8 or more Rooms | 151 (18.4%) | 0 (0.0%) |
| Total | 821 (100.0%) | 213 (100.0%) |
Housing Structure by Heating Type in Hooverson Heights
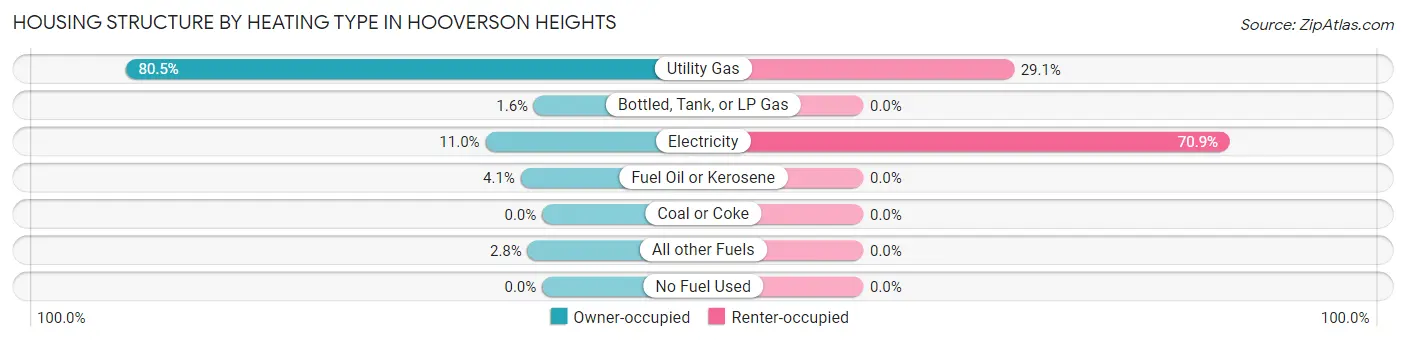
| Heating Type | Owner-occupied | Renter-occupied |
| Utility Gas | 661 (80.5%) | 62 (29.1%) |
| Bottled, Tank, or LP Gas | 13 (1.6%) | 0 (0.0%) |
| Electricity | 90 (11.0%) | 151 (70.9%) |
| Fuel Oil or Kerosene | 34 (4.1%) | 0 (0.0%) |
| Coal or Coke | 0 (0.0%) | 0 (0.0%) |
| All other Fuels | 23 (2.8%) | 0 (0.0%) |
| No Fuel Used | 0 (0.0%) | 0 (0.0%) |
| Total | 821 (100.0%) | 213 (100.0%) |
Household Vehicle Usage in Hooverson Heights
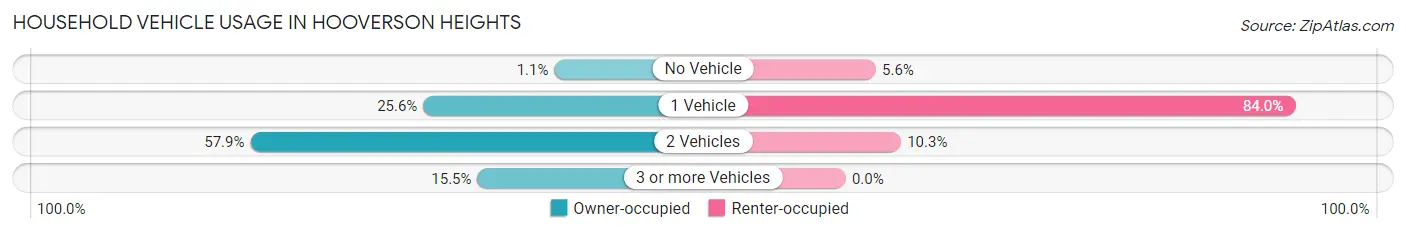
| Vehicles per Household | Owner-occupied | Renter-occupied |
| No Vehicle | 9 (1.1%) | 12 (5.6%) |
| 1 Vehicle | 210 (25.6%) | 179 (84.0%) |
| 2 Vehicles | 475 (57.9%) | 22 (10.3%) |
| 3 or more Vehicles | 127 (15.5%) | 0 (0.0%) |
| Total | 821 (100.0%) | 213 (100.0%) |
Real Estate & Mortgages in Hooverson Heights
Real Estate and Mortgage Overview in Hooverson Heights
| Characteristic | Without Mortgage | With Mortgage |
| Housing Units | 334 | 487 |
| Median Property Value | $99,700 | $153,500 |
| Median Household Income | $34,444 | $6 |
| Monthly Housing Costs | $404 | $0 |
| Real Estate Taxes | $600 | $0 |
Property Value by Mortgage Status in Hooverson Heights
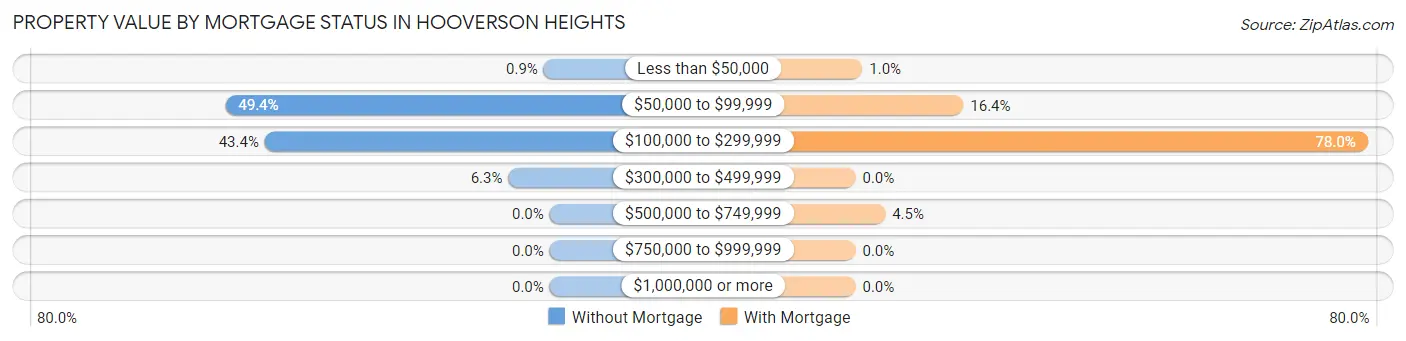
| Property Value | Without Mortgage | With Mortgage |
| Less than $50,000 | 3 (0.9%) | 5 (1.0%) |
| $50,000 to $99,999 | 165 (49.4%) | 80 (16.4%) |
| $100,000 to $299,999 | 145 (43.4%) | 380 (78.0%) |
| $300,000 to $499,999 | 21 (6.3%) | 0 (0.0%) |
| $500,000 to $749,999 | 0 (0.0%) | 22 (4.5%) |
| $750,000 to $999,999 | 0 (0.0%) | 0 (0.0%) |
| $1,000,000 or more | 0 (0.0%) | 0 (0.0%) |
| Total | 334 (100.0%) | 487 (100.0%) |
Household Income by Mortgage Status in Hooverson Heights
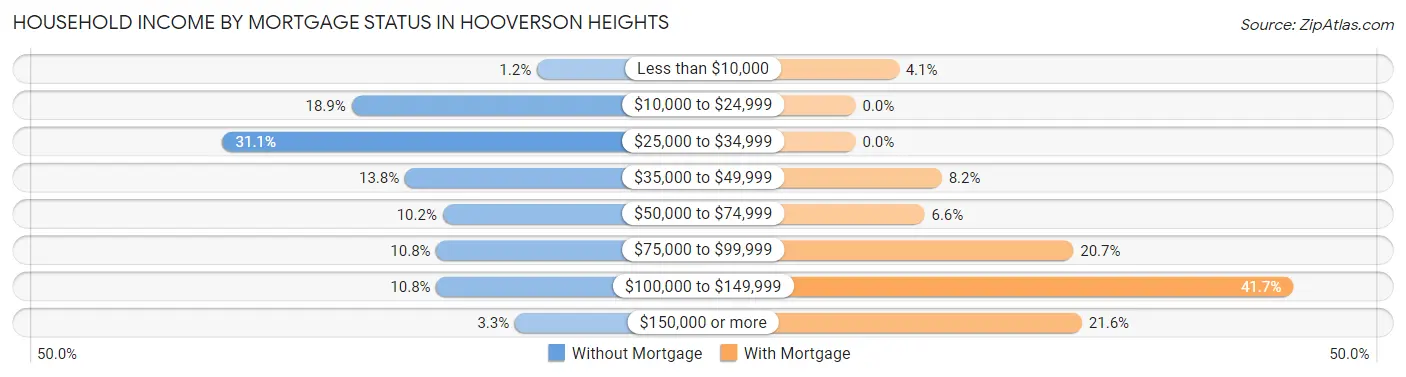
| Household Income | Without Mortgage | With Mortgage |
| Less than $10,000 | 4 (1.2%) | 20 (4.1%) |
| $10,000 to $24,999 | 63 (18.9%) | 0 (0.0%) |
| $25,000 to $34,999 | 104 (31.1%) | 0 (0.0%) |
| $35,000 to $49,999 | 46 (13.8%) | 40 (8.2%) |
| $50,000 to $74,999 | 34 (10.2%) | 32 (6.6%) |
| $75,000 to $99,999 | 36 (10.8%) | 101 (20.7%) |
| $100,000 to $149,999 | 36 (10.8%) | 203 (41.7%) |
| $150,000 or more | 11 (3.3%) | 105 (21.6%) |
| Total | 334 (100.0%) | 487 (100.0%) |
Property Value to Household Income Ratio in Hooverson Heights
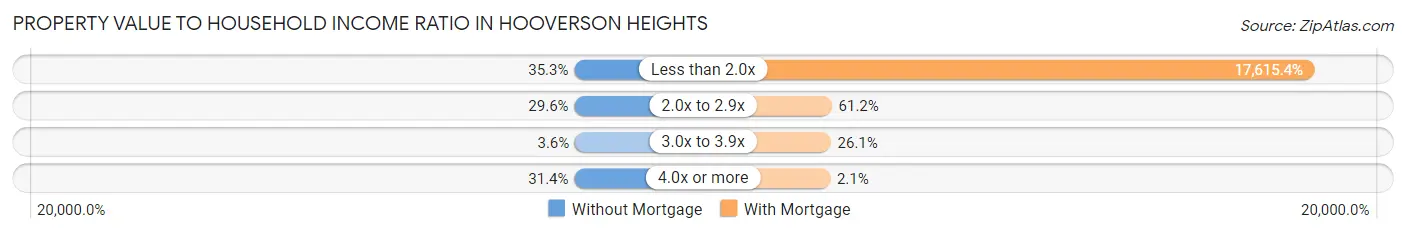
| Value-to-Income Ratio | Without Mortgage | With Mortgage |
| Less than 2.0x | 118 (35.3%) | 85,787 (17,615.4%) |
| 2.0x to 2.9x | 99 (29.6%) | 298 (61.2%) |
| 3.0x to 3.9x | 12 (3.6%) | 127 (26.1%) |
| 4.0x or more | 105 (31.4%) | 10 (2.1%) |
| Total | 334 (100.0%) | 487 (100.0%) |
Real Estate Taxes by Mortgage Status in Hooverson Heights
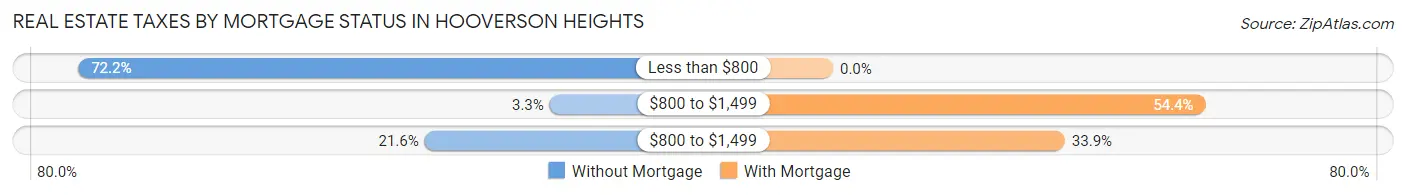
| Property Taxes | Without Mortgage | With Mortgage |
| Less than $800 | 241 (72.2%) | 0 (0.0%) |
| $800 to $1,499 | 11 (3.3%) | 265 (54.4%) |
| $800 to $1,499 | 72 (21.6%) | 165 (33.9%) |
| Total | 334 (100.0%) | 487 (100.0%) |
Health & Disability in Hooverson Heights
Health Insurance Coverage by Age in Hooverson Heights
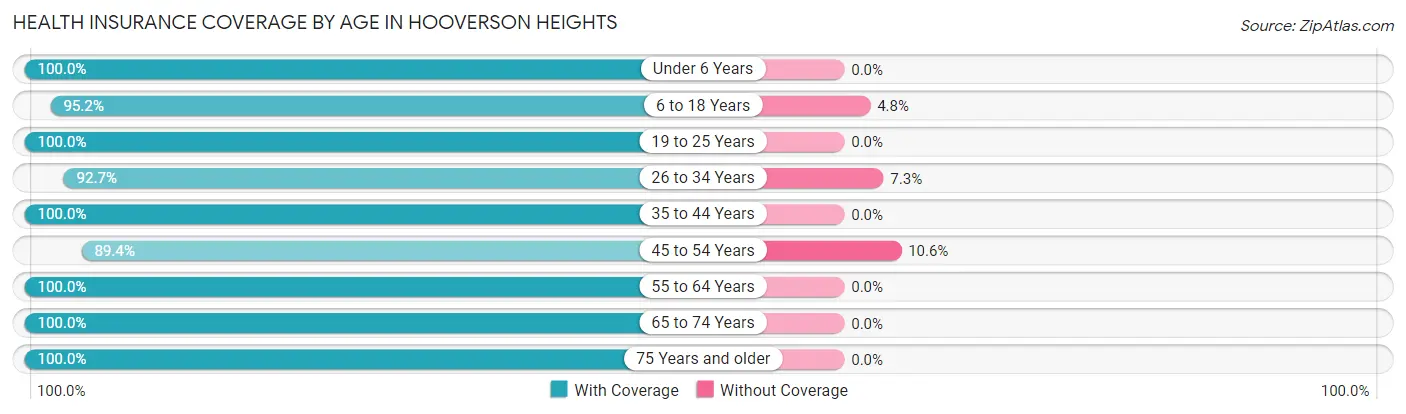
| Age Bracket | With Coverage | Without Coverage |
| Under 6 Years | 56 (100.0%) | 0 (0.0%) |
| 6 to 18 Years | 276 (95.2%) | 14 (4.8%) |
| 19 to 25 Years | 52 (100.0%) | 0 (0.0%) |
| 26 to 34 Years | 267 (92.7%) | 21 (7.3%) |
| 35 to 44 Years | 82 (100.0%) | 0 (0.0%) |
| 45 to 54 Years | 236 (89.4%) | 28 (10.6%) |
| 55 to 64 Years | 613 (100.0%) | 0 (0.0%) |
| 65 to 74 Years | 314 (100.0%) | 0 (0.0%) |
| 75 Years and older | 217 (100.0%) | 0 (0.0%) |
| Total | 2,113 (97.1%) | 63 (2.9%) |
Health Insurance Coverage by Citizenship Status in Hooverson Heights
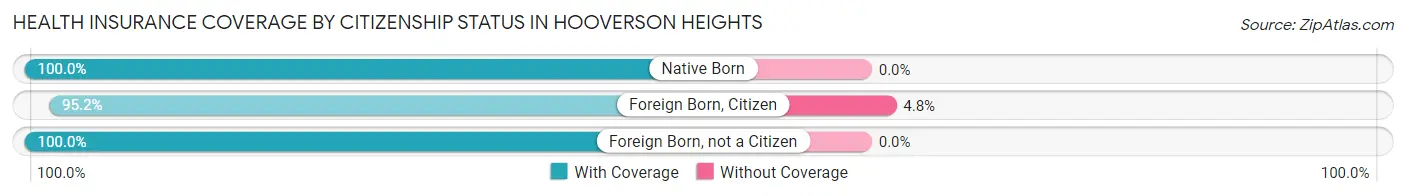
| Citizenship Status | With Coverage | Without Coverage |
| Native Born | 56 (100.0%) | 0 (0.0%) |
| Foreign Born, Citizen | 276 (95.2%) | 14 (4.8%) |
| Foreign Born, not a Citizen | 52 (100.0%) | 0 (0.0%) |
Health Insurance Coverage by Household Income in Hooverson Heights
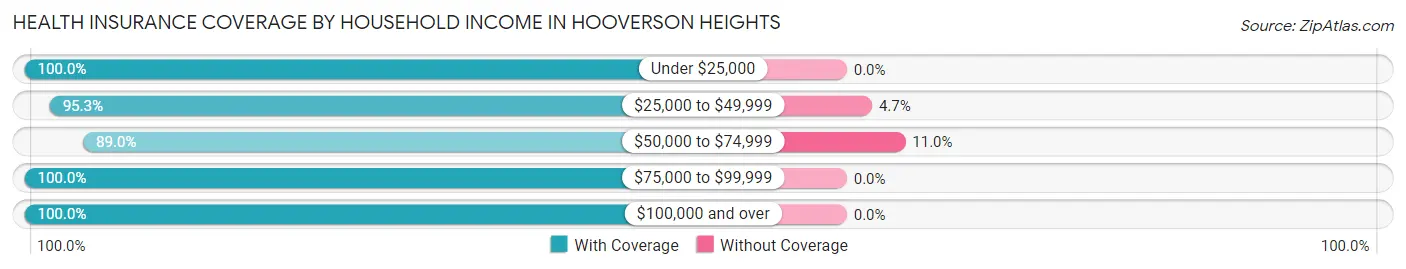
| Household Income | With Coverage | Without Coverage |
| Under $25,000 | 157 (100.0%) | 0 (0.0%) |
| $25,000 to $49,999 | 565 (95.3%) | 28 (4.7%) |
| $50,000 to $74,999 | 284 (89.0%) | 35 (11.0%) |
| $75,000 to $99,999 | 672 (100.0%) | 0 (0.0%) |
| $100,000 and over | 400 (100.0%) | 0 (0.0%) |
Public vs Private Health Insurance Coverage by Age in Hooverson Heights
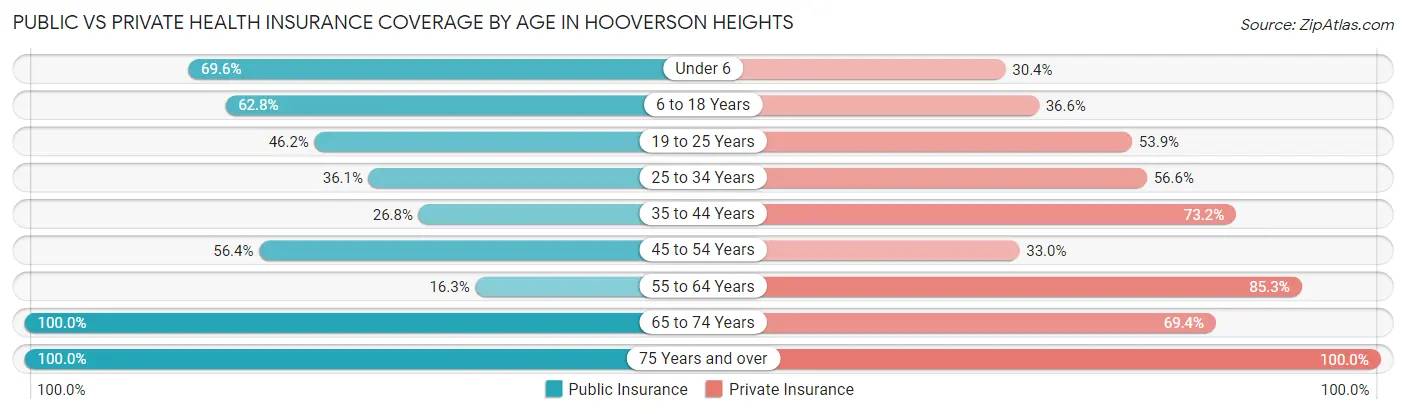
| Age Bracket | Public Insurance | Private Insurance |
| Under 6 | 39 (69.6%) | 17 (30.4%) |
| 6 to 18 Years | 182 (62.8%) | 106 (36.5%) |
| 19 to 25 Years | 24 (46.2%) | 28 (53.8%) |
| 25 to 34 Years | 104 (36.1%) | 163 (56.6%) |
| 35 to 44 Years | 22 (26.8%) | 60 (73.2%) |
| 45 to 54 Years | 149 (56.4%) | 87 (33.0%) |
| 55 to 64 Years | 100 (16.3%) | 523 (85.3%) |
| 65 to 74 Years | 314 (100.0%) | 218 (69.4%) |
| 75 Years and over | 217 (100.0%) | 217 (100.0%) |
| Total | 1,151 (52.9%) | 1,419 (65.2%) |
Disability Status by Sex by Age in Hooverson Heights
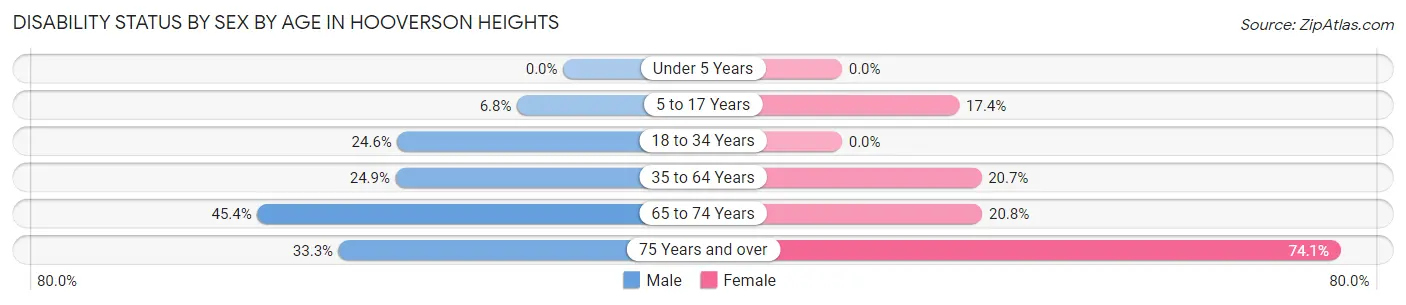
| Age Bracket | Male | Female |
| Under 5 Years | 0 (0.0%) | 0 (0.0%) |
| 5 to 17 Years | 8 (6.8%) | 27 (17.4%) |
| 18 to 34 Years | 46 (24.6%) | 0 (0.0%) |
| 35 to 64 Years | 104 (24.9%) | 112 (20.7%) |
| 65 to 74 Years | 99 (45.4%) | 20 (20.8%) |
| 75 Years and over | 26 (33.3%) | 103 (74.1%) |
Disability Class by Sex by Age in Hooverson Heights
Disability Class: Hearing Difficulty
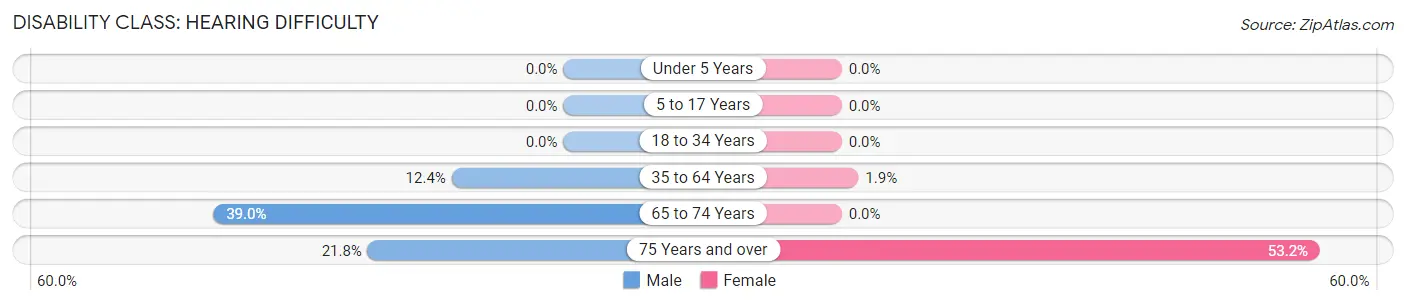
| Age Bracket | Male | Female |
| Under 5 Years | 0 (0.0%) | 0 (0.0%) |
| 5 to 17 Years | 0 (0.0%) | 0 (0.0%) |
| 18 to 34 Years | 0 (0.0%) | 0 (0.0%) |
| 35 to 64 Years | 52 (12.4%) | 10 (1.8%) |
| 65 to 74 Years | 85 (39.0%) | 0 (0.0%) |
| 75 Years and over | 17 (21.8%) | 74 (53.2%) |
Disability Class: Vision Difficulty
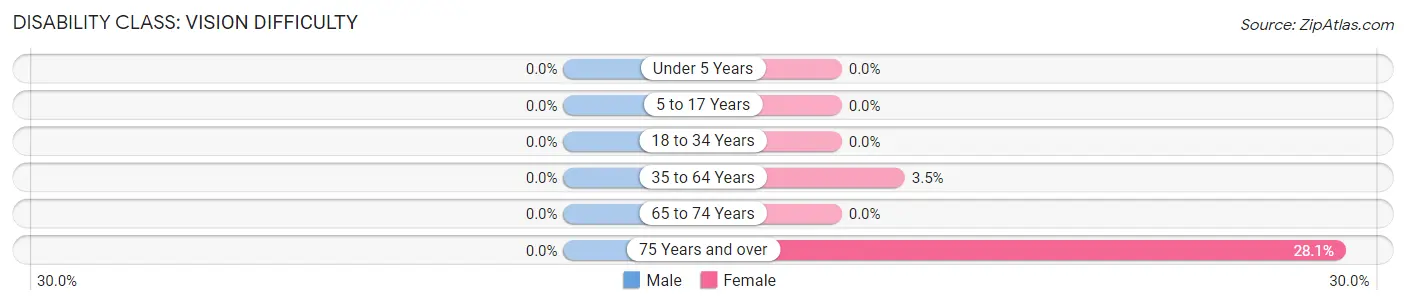
| Age Bracket | Male | Female |
| Under 5 Years | 0 (0.0%) | 0 (0.0%) |
| 5 to 17 Years | 0 (0.0%) | 0 (0.0%) |
| 18 to 34 Years | 0 (0.0%) | 0 (0.0%) |
| 35 to 64 Years | 0 (0.0%) | 19 (3.5%) |
| 65 to 74 Years | 0 (0.0%) | 0 (0.0%) |
| 75 Years and over | 0 (0.0%) | 39 (28.1%) |
Disability Class: Cognitive Difficulty
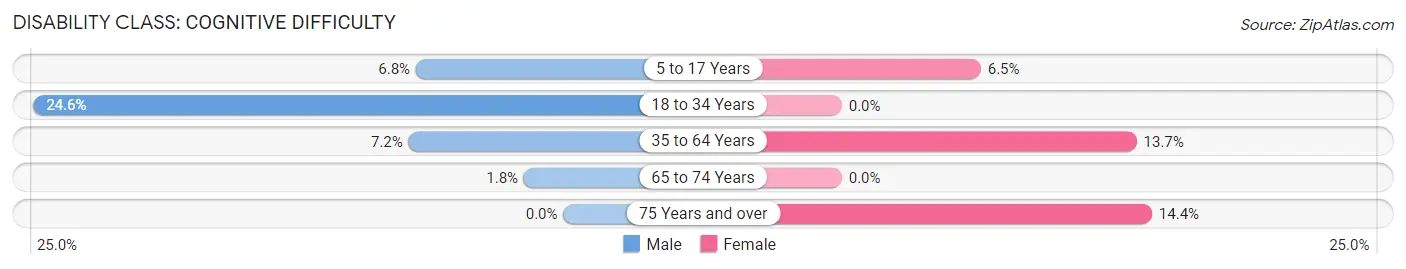
| Age Bracket | Male | Female |
| 5 to 17 Years | 8 (6.8%) | 10 (6.5%) |
| 18 to 34 Years | 46 (24.6%) | 0 (0.0%) |
| 35 to 64 Years | 30 (7.2%) | 74 (13.7%) |
| 65 to 74 Years | 4 (1.8%) | 0 (0.0%) |
| 75 Years and over | 0 (0.0%) | 20 (14.4%) |
Disability Class: Ambulatory Difficulty
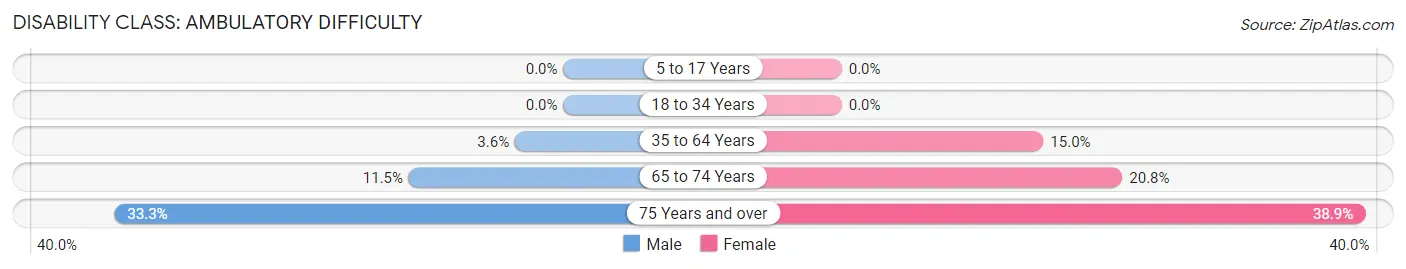
| Age Bracket | Male | Female |
| 5 to 17 Years | 0 (0.0%) | 0 (0.0%) |
| 18 to 34 Years | 0 (0.0%) | 0 (0.0%) |
| 35 to 64 Years | 15 (3.6%) | 81 (15.0%) |
| 65 to 74 Years | 25 (11.5%) | 20 (20.8%) |
| 75 Years and over | 26 (33.3%) | 54 (38.9%) |
Disability Class: Self-Care Difficulty
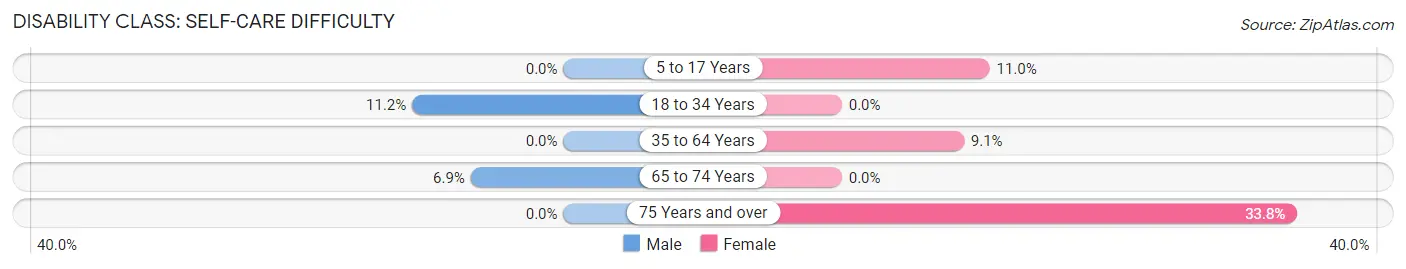
| Age Bracket | Male | Female |
| 5 to 17 Years | 0 (0.0%) | 17 (11.0%) |
| 18 to 34 Years | 21 (11.2%) | 0 (0.0%) |
| 35 to 64 Years | 0 (0.0%) | 49 (9.1%) |
| 65 to 74 Years | 15 (6.9%) | 0 (0.0%) |
| 75 Years and over | 0 (0.0%) | 47 (33.8%) |
Technology Access in Hooverson Heights
Computing Device Access in Hooverson Heights
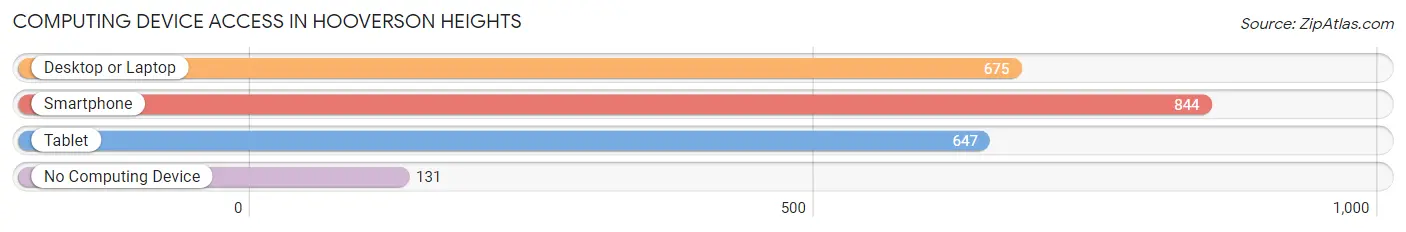
| Device Type | # Households | % Households |
| Desktop or Laptop | 675 | 65.3% |
| Smartphone | 844 | 81.6% |
| Tablet | 647 | 62.6% |
| No Computing Device | 131 | 12.7% |
| Total | 1,034 | 100.0% |
Internet Access in Hooverson Heights
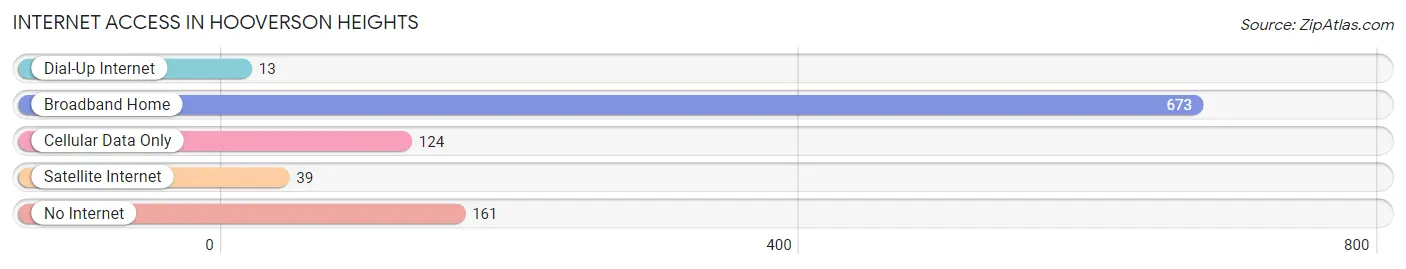
| Internet Type | # Households | % Households |
| Dial-Up Internet | 13 | 1.3% |
| Broadband Home | 673 | 65.1% |
| Cellular Data Only | 124 | 12.0% |
| Satellite Internet | 39 | 3.8% |
| No Internet | 161 | 15.6% |
| Total | 1,034 | 100.0% |
Hooverson Heights Summary
Hooverson Heights, West Virginia is a small town located in the northern panhandle of the state. It is situated in the Ohio River Valley, just south of Wheeling, West Virginia. The town was founded in 1891 and has a population of approximately 1,500 people.
Geography
Hooverson Heights is located in the northern panhandle of West Virginia, in the Ohio River Valley. The town is situated on the banks of the Ohio River, just south of Wheeling, West Virginia. The town is surrounded by rolling hills and is located in the Appalachian Mountains. The town is located at an elevation of 890 feet above sea level. The climate in Hooverson Heights is humid continental, with hot summers and cold winters.
Economy
Hooverson Heights is a small town with a limited economy. The town is primarily supported by the local coal industry, which has been in decline in recent years. The town also has a few small businesses, including a grocery store, a hardware store, and a few restaurants. The town also has a few small manufacturing plants, which provide employment for some of the town's residents.
Demographics
Hooverson Heights has a population of approximately 1,500 people. The town is predominantly white, with a small African American population. The median household income in Hooverson Heights is $35,000, and the median age is 40. The town has a high rate of poverty, with nearly one-third of the population living below the poverty line.
History
Hooverson Heights was founded in 1891 by a group of coal miners. The town was named after the Hooverson family, who owned the land on which the town was built. The town grew rapidly in the early 20th century, as the coal industry flourished in the area. The town was home to several coal mines, which provided employment for many of the town's residents.
In the 1950s, the coal industry began to decline, and the town's population began to decline as well. The town was hit hard by the Great Depression, and many of the town's residents were forced to leave in search of work. The town's population continued to decline until the late 1980s, when the town began to experience a resurgence. The town has since seen a steady increase in population, and is now home to approximately 1,500 people.
Hooverson Heights is a small town with a rich history and a bright future. The town is home to a diverse population, and is a great place to live and work. The town is surrounded by beautiful scenery, and is a great place to raise a family. The town is also home to a number of small businesses, which provide employment for many of the town's residents. Hooverson Heights is a great place to call home.
Common Questions
What is the Total Population of Hooverson Heights?
Total Population of Hooverson Heights is 2,329.
What is the Total Male Population of Hooverson Heights?
Total Male Population of Hooverson Heights is 1,069.
What is the Total Female Population of Hooverson Heights?
Total Female Population of Hooverson Heights is 1,260.
What is the Ratio of Males per 100 Females in Hooverson Heights?
There are 84.84 Males per 100 Females in Hooverson Heights.
What is the Ratio of Females per 100 Males in Hooverson Heights?
There are 117.87 Females per 100 Males in Hooverson Heights.
What is the Median Population Age in Hooverson Heights?
Median Population Age in Hooverson Heights is 58.3 Years.
What is the Average Family Size in Hooverson Heights
Average Family Size in Hooverson Heights is 2.5 People.
What is the Average Household Size in Hooverson Heights
Average Household Size in Hooverson Heights is 2.1 People.
What is Per Capita Income in Hooverson Heights?
Per Capita income in Hooverson Heights is $30,381.
What is the Median Family Income in Hooverson Heights?
Median Family Income in Hooverson Heights is $79,688.
What is the Median Household income in Hooverson Heights?
Median Household Income in Hooverson Heights is $55,588.
What is Income or Wage Gap in Hooverson Heights?
Income or Wage Gap in Hooverson Heights is 0.9%.
Women in Hooverson Heights earn 99.1 cents for every dollar earned by a man.
What is Inequality or Gini Index in Hooverson Heights?
Inequality or Gini Index in Hooverson Heights is 0.36.
How Large is the Labor Force in Hooverson Heights?
There are 1,018 People in the Labor Forcein in Hooverson Heights.
What is the Percentage of People in the Labor Force in Hooverson Heights?
50.6% of People are in the Labor Force in Hooverson Heights.
What is the Unemployment Rate in Hooverson Heights?
Unemployment Rate in Hooverson Heights is 3.2%.