Ranson corporation, WV
Ranson corporation Overview
5,497
TOTAL POPULATION
2,425
MALE POPULATION
3,072
FEMALE POPULATION
78.94
MALES / 100 FEMALES
126.68
FEMALES / 100 MALES
33.9
MEDIAN AGE
3.2
AVG FAMILY SIZE
2.7
AVG HOUSEHOLD SIZE
$33,607
PER CAPITA INCOME
$95,766
AVG FAMILY INCOME
$80,242
AVG HOUSEHOLD INCOME
16.8%
WAGE / INCOME GAP [ % ]
83.2¢/ $1
WAGE / INCOME GAP [ $ ]
0.35
INEQUALITY / GINI INDEX
3,100
LABOR FORCE [ PEOPLE ]
72.2%
PERCENT IN LABOR FORCE
4.9%
UNEMPLOYMENT RATE
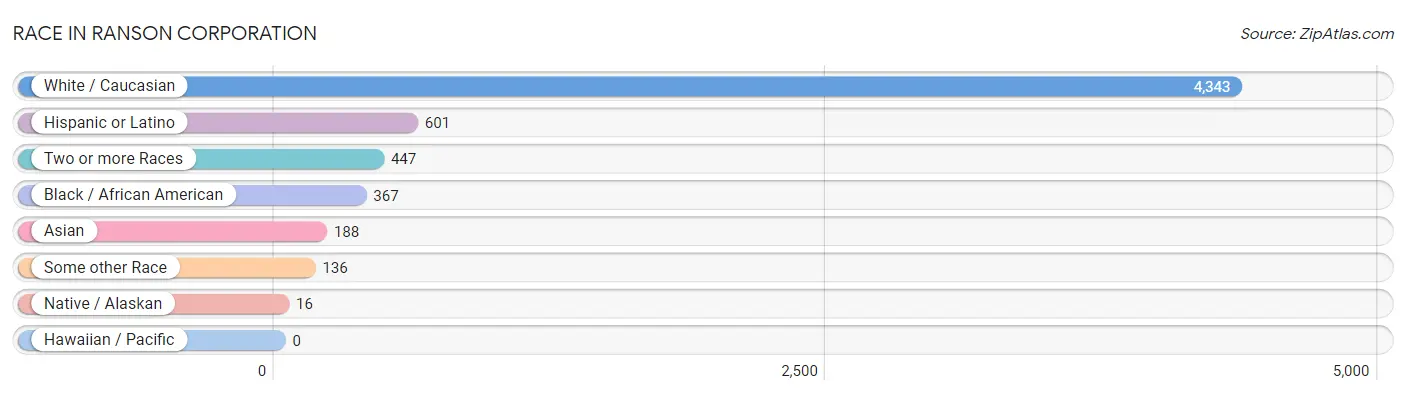
Race in Ranson corporation
The most populous races in Ranson corporation are White / Caucasian (4,343 | 79.0%), Hispanic or Latino (601 | 10.9%), and Two or more Races (447 | 8.1%).
| Race | # Population | % Population |
| Asian | 188 | 3.4% |
| Black / African American | 367 | 6.7% |
| Hawaiian / Pacific | 0 | 0.0% |
| Hispanic or Latino | 601 | 10.9% |
| Native / Alaskan | 16 | 0.3% |
| White / Caucasian | 4,343 | 79.0% |
| Two or more Races | 447 | 8.1% |
| Some other Race | 136 | 2.5% |
| Total | 5,497 | 100.0% |
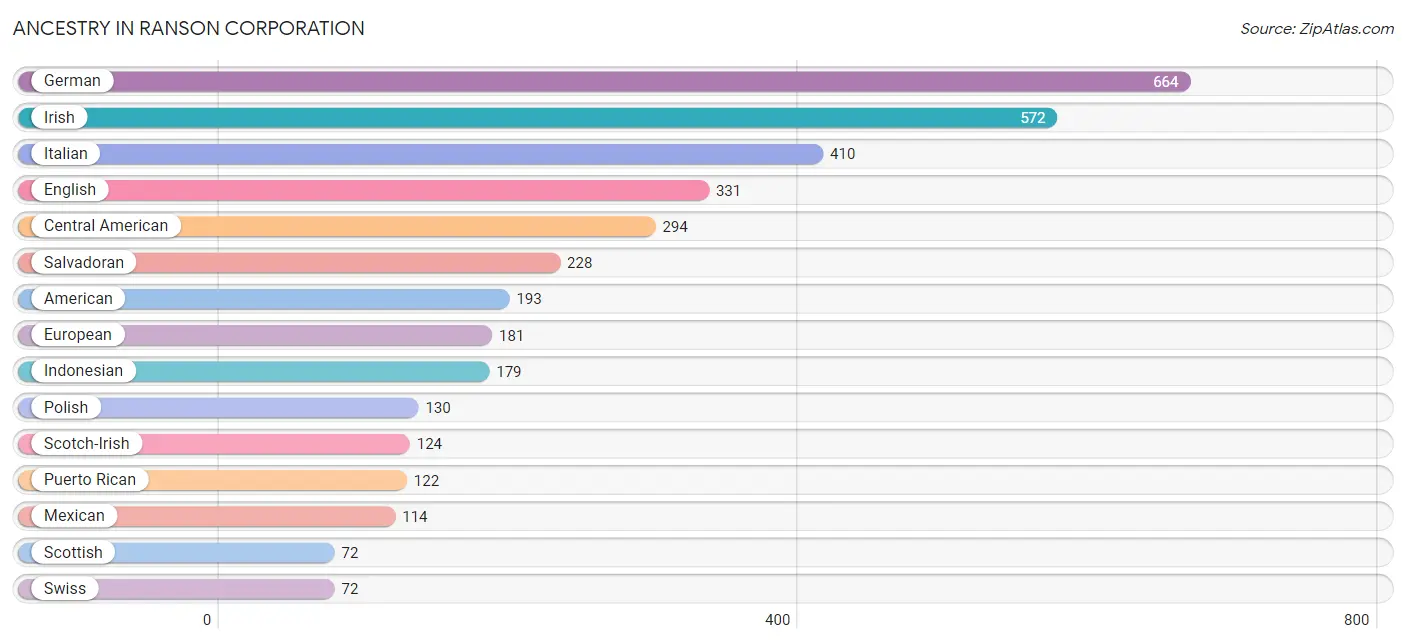
Ancestry in Ranson corporation
The most populous ancestries reported in Ranson corporation are German (664 | 12.1%), Irish (572 | 10.4%), Italian (410 | 7.5%), English (331 | 6.0%), and Central American (294 | 5.3%), together accounting for 41.3% of all Ranson corporation residents.
| Ancestry | # Population | % Population |
| American | 193 | 3.5% |
| Apache | 13 | 0.2% |
| Arab | 44 | 0.8% |
| Armenian | 10 | 0.2% |
| Australian | 13 | 0.2% |
| Austrian | 5 | 0.1% |
| Central American | 294 | 5.3% |
| Cherokee | 38 | 0.7% |
| Croatian | 10 | 0.2% |
| Cuban | 14 | 0.3% |
| Czech | 18 | 0.3% |
| Dutch | 20 | 0.4% |
| Egyptian | 29 | 0.5% |
| English | 331 | 6.0% |
| European | 181 | 3.3% |
| French | 48 | 0.9% |
| French Canadian | 40 | 0.7% |
| German | 664 | 12.1% |
| Greek | 33 | 0.6% |
| Honduran | 66 | 1.2% |
| Hungarian | 4 | 0.1% |
| Indonesian | 179 | 3.3% |
| Irish | 572 | 10.4% |
| Italian | 410 | 7.5% |
| Lebanese | 6 | 0.1% |
| Lithuanian | 5 | 0.1% |
| Mexican | 114 | 2.1% |
| Norwegian | 60 | 1.1% |
| Pakistani | 9 | 0.2% |
| Pennsylvania German | 24 | 0.4% |
| Peruvian | 45 | 0.8% |
| Polish | 130 | 2.4% |
| Portuguese | 10 | 0.2% |
| Puerto Rican | 122 | 2.2% |
| Romanian | 26 | 0.5% |
| Russian | 20 | 0.4% |
| Salvadoran | 228 | 4.2% |
| Scotch-Irish | 124 | 2.3% |
| Scottish | 72 | 1.3% |
| South American | 45 | 0.8% |
| Spanish | 12 | 0.2% |
| Swedish | 15 | 0.3% |
| Swiss | 72 | 1.3% |
| Thai | 40 | 0.7% |
| Welsh | 31 | 0.6% | View All 45 Rows |
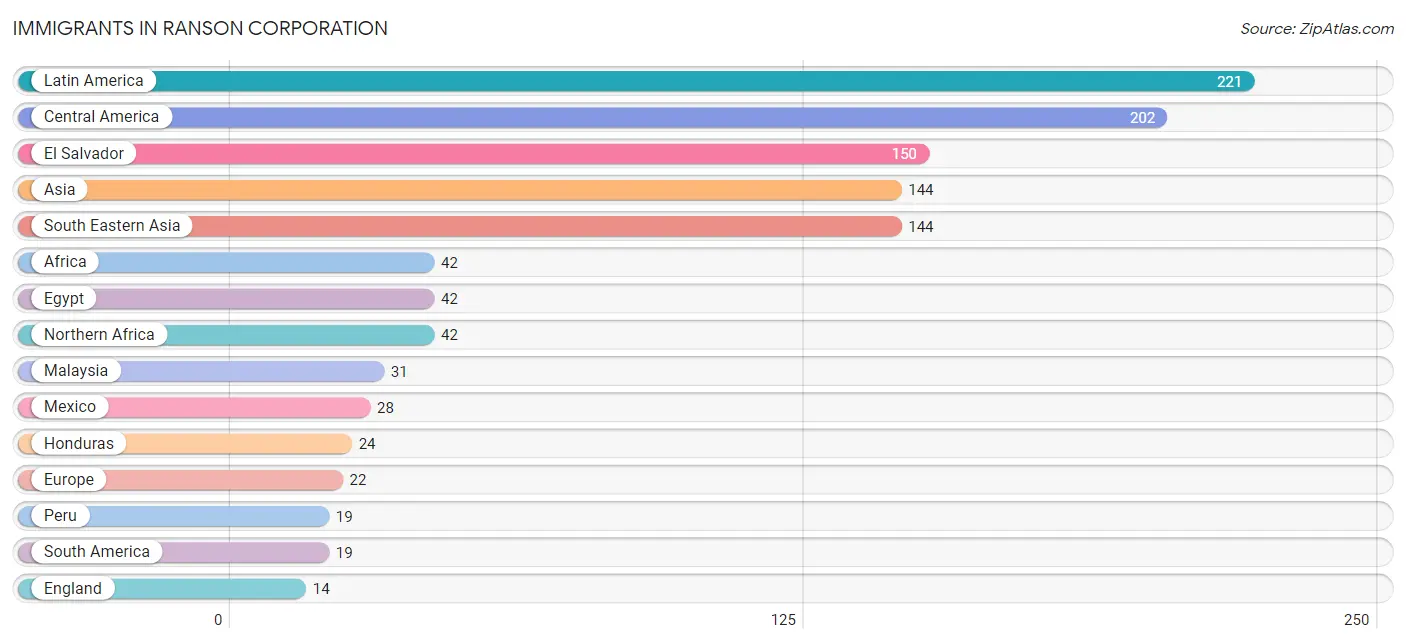
Immigrants in Ranson corporation
The most numerous immigrant groups reported in Ranson corporation came from Latin America (221 | 4.0%), Central America (202 | 3.7%), El Salvador (150 | 2.7%), Asia (144 | 2.6%), and South Eastern Asia (144 | 2.6%), together accounting for 15.7% of all Ranson corporation residents.
| Immigration Origin | # Population | % Population |
| Africa | 42 | 0.8% |
| Asia | 144 | 2.6% |
| Australia | 13 | 0.2% |
| Central America | 202 | 3.7% |
| Eastern Europe | 8 | 0.2% |
| Egypt | 42 | 0.8% |
| El Salvador | 150 | 2.7% |
| England | 14 | 0.3% |
| Europe | 22 | 0.4% |
| Honduras | 24 | 0.4% |
| Latin America | 221 | 4.0% |
| Malaysia | 31 | 0.6% |
| Mexico | 28 | 0.5% |
| Northern Africa | 42 | 0.8% |
| Northern Europe | 14 | 0.3% |
| Oceania | 13 | 0.2% |
| Peru | 19 | 0.4% |
| Russia | 8 | 0.2% |
| South America | 19 | 0.4% |
| South Eastern Asia | 144 | 2.6% |
| Thailand | 9 | 0.2% | View All 21 Rows |
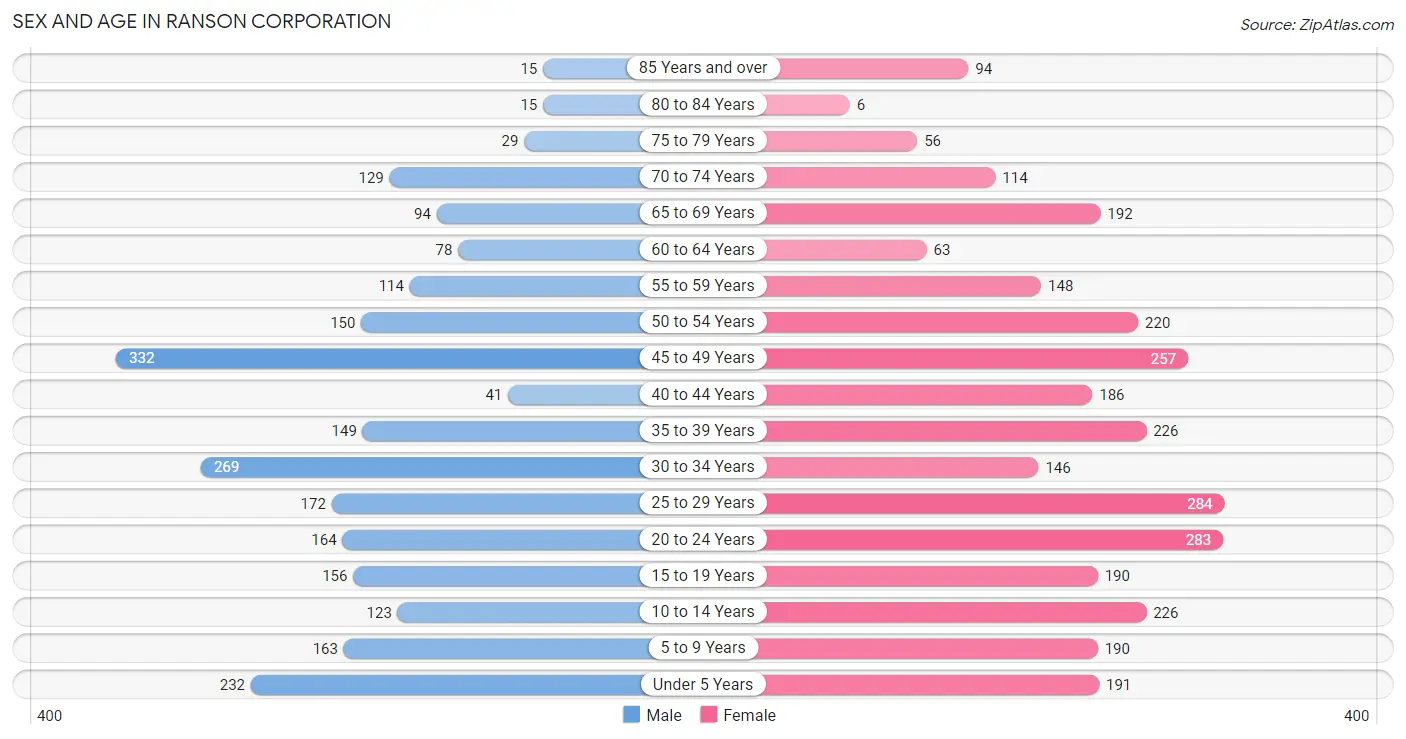
Sex and Age in Ranson corporation
Sex and Age in Ranson corporation
The most populous age groups in Ranson corporation are 45 to 49 Years (332 | 13.7%) for men and 25 to 29 Years (284 | 9.2%) for women.
| Age Bracket | Male | Female |
| Under 5 Years | 232 (9.6%) | 191 (6.2%) |
| 5 to 9 Years | 163 (6.7%) | 190 (6.2%) |
| 10 to 14 Years | 123 (5.1%) | 226 (7.4%) |
| 15 to 19 Years | 156 (6.4%) | 190 (6.2%) |
| 20 to 24 Years | 164 (6.8%) | 283 (9.2%) |
| 25 to 29 Years | 172 (7.1%) | 284 (9.2%) |
| 30 to 34 Years | 269 (11.1%) | 146 (4.8%) |
| 35 to 39 Years | 149 (6.1%) | 226 (7.4%) |
| 40 to 44 Years | 41 (1.7%) | 186 (6.0%) |
| 45 to 49 Years | 332 (13.7%) | 257 (8.4%) |
| 50 to 54 Years | 150 (6.2%) | 220 (7.2%) |
| 55 to 59 Years | 114 (4.7%) | 148 (4.8%) |
| 60 to 64 Years | 78 (3.2%) | 63 (2.1%) |
| 65 to 69 Years | 94 (3.9%) | 192 (6.2%) |
| 70 to 74 Years | 129 (5.3%) | 114 (3.7%) |
| 75 to 79 Years | 29 (1.2%) | 56 (1.8%) |
| 80 to 84 Years | 15 (0.6%) | 6 (0.2%) |
| 85 Years and over | 15 (0.6%) | 94 (3.1%) |
| Total | 2,425 (100.0%) | 3,072 (100.0%) |
Families and Households in Ranson corporation
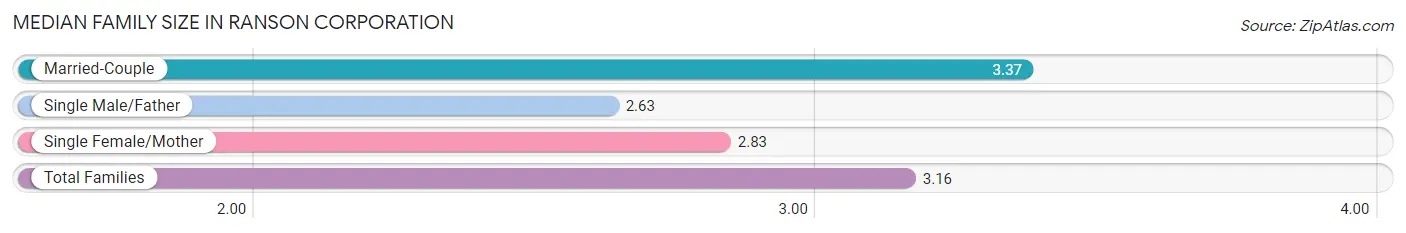
Median Family Size in Ranson corporation
The median family size in Ranson corporation is 3.16 persons per family, with married-couple families (915 | 64.9%) accounting for the largest median family size of 3.37 persons per family. On the other hand, single male/father families (111 | 7.9%) represent the smallest median family size with 2.63 persons per family.
| Family Type | # Families | Family Size |
| Married-Couple | 915 (64.9%) | 3.37 |
| Single Male/Father | 111 (7.9%) | 2.63 |
| Single Female/Mother | 383 (27.2%) | 2.83 |
| Total Families | 1,409 (100.0%) | 3.16 |
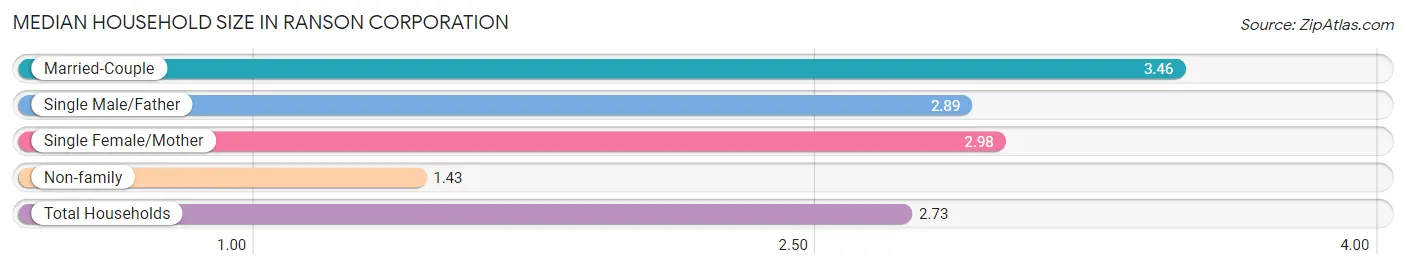
Median Household Size in Ranson corporation
The median household size in Ranson corporation is 2.73 persons per household, with married-couple households (915 | 45.4%) accounting for the largest median household size of 3.46 persons per household. non-family households (607 | 30.1%) represent the smallest median household size with 1.43 persons per household.
| Household Type | # Households | Household Size |
| Married-Couple | 915 (45.4%) | 3.46 |
| Single Male/Father | 111 (5.5%) | 2.89 |
| Single Female/Mother | 383 (19.0%) | 2.98 |
| Non-family | 607 (30.1%) | 1.43 |
| Total Households | 2,016 (100.0%) | 2.73 |
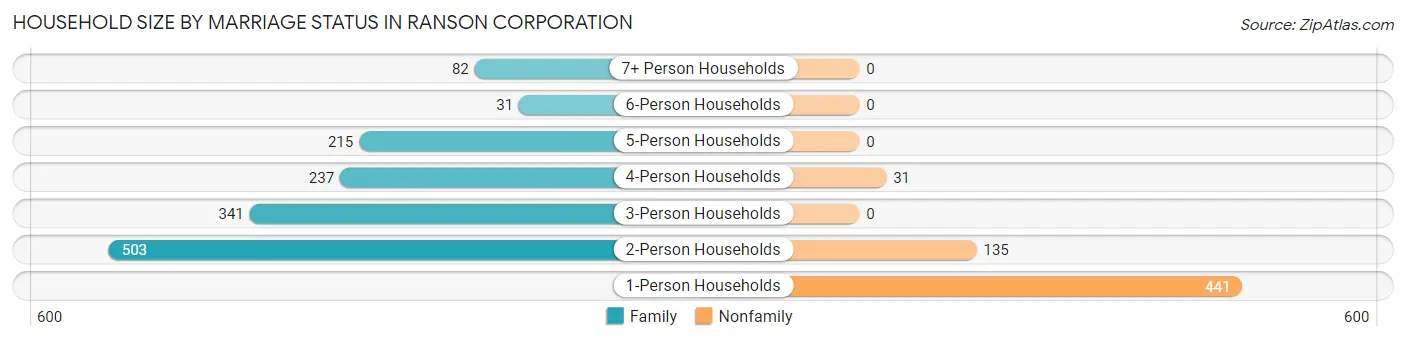
Household Size by Marriage Status in Ranson corporation
Out of a total of 2,016 households in Ranson corporation, 1,409 (69.9%) are family households, while 607 (30.1%) are nonfamily households. The most numerous type of family households are 2-person households, comprising 503, and the most common type of nonfamily households are 1-person households, comprising 441.
| Household Size | Family Households | Nonfamily Households |
| 1-Person Households | - | 441 (21.9%) |
| 2-Person Households | 503 (24.9%) | 135 (6.7%) |
| 3-Person Households | 341 (16.9%) | 0 (0.0%) |
| 4-Person Households | 237 (11.8%) | 31 (1.5%) |
| 5-Person Households | 215 (10.7%) | 0 (0.0%) |
| 6-Person Households | 31 (1.5%) | 0 (0.0%) |
| 7+ Person Households | 82 (4.1%) | 0 (0.0%) |
| Total | 1,409 (69.9%) | 607 (30.1%) |
Female Fertility in Ranson corporation
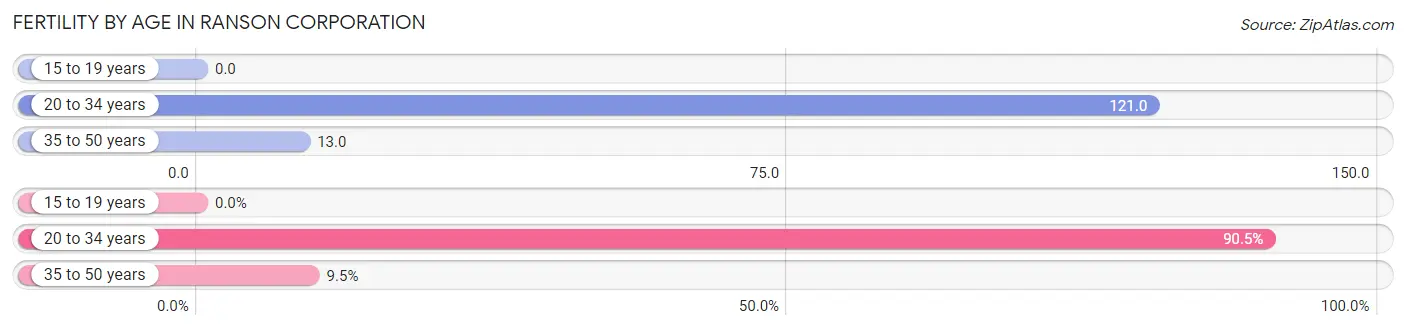
Fertility by Age in Ranson corporation
Average fertility rate in Ranson corporation is 59.0 births per 1,000 women. Women in the age bracket of 20 to 34 years have the highest fertility rate with 121.0 births per 1,000 women. Women in the age bracket of 20 to 34 years acount for 90.5% of all women with births.
| Age Bracket | Women with Births | Births / 1,000 Women |
| 15 to 19 years | 0 (0.0%) | 0.0 |
| 20 to 34 years | 86 (90.5%) | 121.0 |
| 35 to 50 years | 9 (9.5%) | 13.0 |
| Total | 95 (100.0%) | 59.0 |
Fertility by Age by Marriage Status in Ranson corporation
62.1% of women with births (95) in Ranson corporation are married. The highest percentage of unmarried women with births falls into 35 to 50 years age bracket with 100.0% of them unmarried at the time of birth, while the lowest percentage of unmarried women with births belong to 20 to 34 years age bracket with 31.4% of them unmarried.
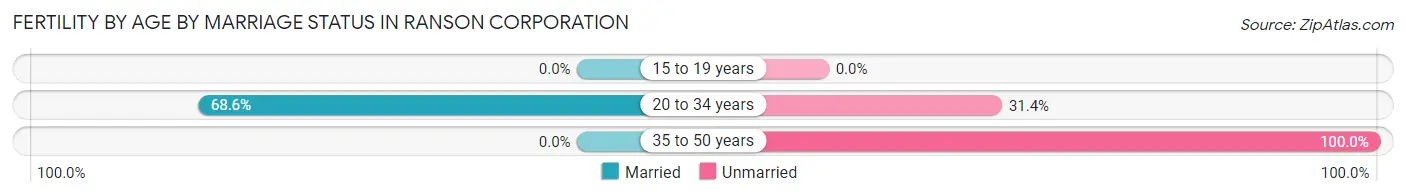
| Age Bracket | Married | Unmarried |
| 15 to 19 years | 0 (0.0%) | 0 (0.0%) |
| 20 to 34 years | 59 (68.6%) | 27 (31.4%) |
| 35 to 50 years | 0 (0.0%) | 9 (100.0%) |
| Total | 59 (62.1%) | 36 (37.9%) |
Fertility by Education in Ranson corporation
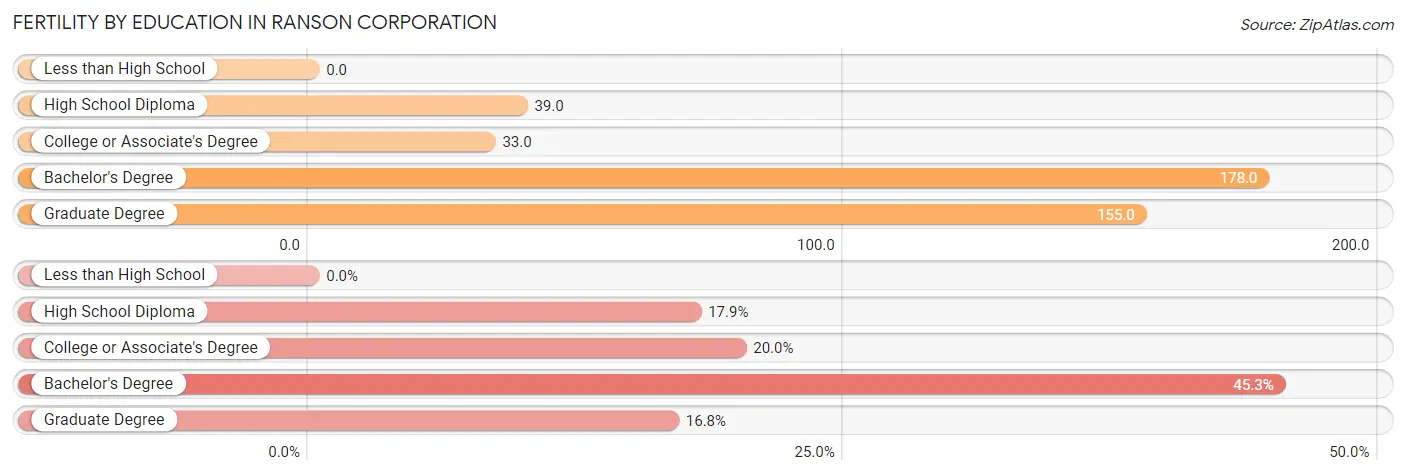
| Educational Attainment | Women with Births | Births / 1,000 Women |
| Less than High School | 0 (0.0%) | 0.0 |
| High School Diploma | 17 (17.9%) | 39.0 |
| College or Associate's Degree | 19 (20.0%) | 33.0 |
| Bachelor's Degree | 43 (45.3%) | 178.0 |
| Graduate Degree | 16 (16.8%) | 155.0 |
| Total | 95 (100.0%) | 59.0 |
Fertility by Education by Marriage Status in Ranson corporation
37.9% of women with births in Ranson corporation are unmarried. Women with the educational attainment of bachelor's degree are most likely to be married with 100.0% of them married at childbirth, while women with the educational attainment of high school diploma are least likely to be married with 100.0% of them unmarried at childbirth.
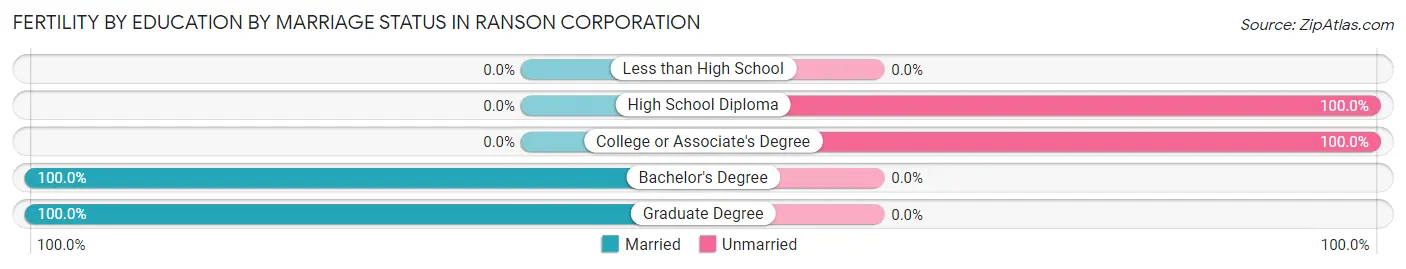
| Educational Attainment | Married | Unmarried |
| Less than High School | 0 (0.0%) | 0 (0.0%) |
| High School Diploma | 0 (0.0%) | 17 (100.0%) |
| College or Associate's Degree | 0 (0.0%) | 19 (100.0%) |
| Bachelor's Degree | 43 (100.0%) | 0 (0.0%) |
| Graduate Degree | 16 (100.0%) | 0 (0.0%) |
| Total | 59 (62.1%) | 36 (37.9%) |
Income in Ranson corporation
Income Overview in Ranson corporation
Per Capita Income in Ranson corporation is $33,607, while median incomes of families and households are $95,766 and $80,242 respectively.
| Characteristic | Number | Measure |
| Per Capita Income | 5,497 | $33,607 |
| Median Family Income | 1,409 | $95,766 |
| Mean Family Income | 1,409 | $98,329 |
| Median Household Income | 2,016 | $80,242 |
| Mean Household Income | 2,016 | $91,756 |
| Income Deficit | 1,409 | $0 |
| Wage / Income Gap (%) | 5,497 | 16.83% |
| Wage / Income Gap ($) | 5,497 | 83.17¢ per $1 |
| Gini / Inequality Index | 5,497 | 0.35 |
Earnings by Sex in Ranson corporation
Average Earnings in Ranson corporation are $39,964, $44,269 for men and $36,818 for women, a difference of 16.8%.
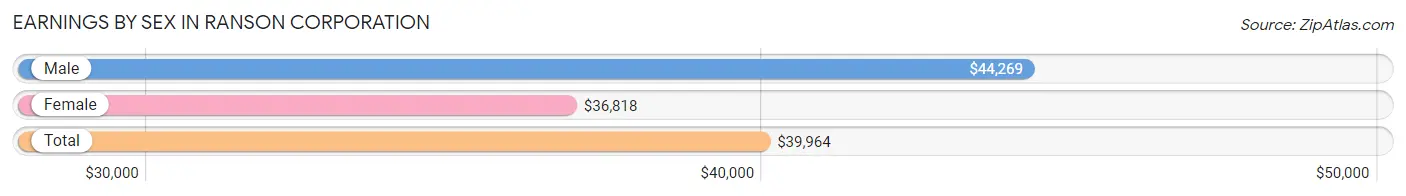
| Sex | Number | Average Earnings |
| Male | 1,534 (48.3%) | $44,269 |
| Female | 1,640 (51.7%) | $36,818 |
| Total | 3,174 (100.0%) | $39,964 |
Earnings by Sex by Income Bracket in Ranson corporation
The most common earnings brackets in Ranson corporation are $100,000+ for men (194 | 12.7%) and $40,000 to $44,999 for women (304 | 18.5%).
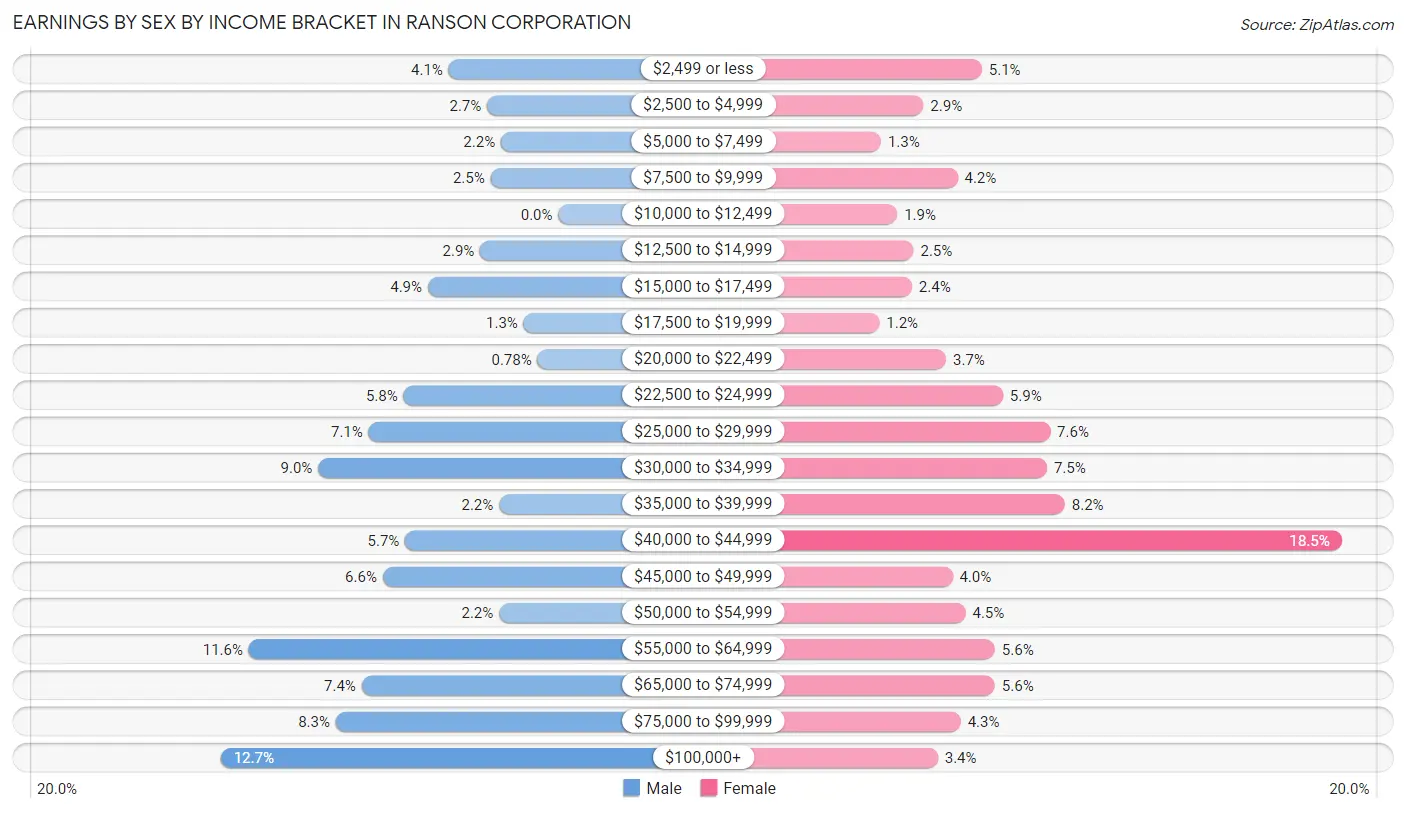
| Income | Male | Female |
| $2,499 or less | 63 (4.1%) | 83 (5.1%) |
| $2,500 to $4,999 | 41 (2.7%) | 47 (2.9%) |
| $5,000 to $7,499 | 33 (2.1%) | 21 (1.3%) |
| $7,500 to $9,999 | 39 (2.5%) | 68 (4.2%) |
| $10,000 to $12,499 | 0 (0.0%) | 31 (1.9%) |
| $12,500 to $14,999 | 45 (2.9%) | 41 (2.5%) |
| $15,000 to $17,499 | 75 (4.9%) | 40 (2.4%) |
| $17,500 to $19,999 | 20 (1.3%) | 20 (1.2%) |
| $20,000 to $22,499 | 12 (0.8%) | 61 (3.7%) |
| $22,500 to $24,999 | 89 (5.8%) | 96 (5.9%) |
| $25,000 to $29,999 | 109 (7.1%) | 125 (7.6%) |
| $30,000 to $34,999 | 138 (9.0%) | 123 (7.5%) |
| $35,000 to $39,999 | 34 (2.2%) | 134 (8.2%) |
| $40,000 to $44,999 | 88 (5.7%) | 304 (18.5%) |
| $45,000 to $49,999 | 101 (6.6%) | 65 (4.0%) |
| $50,000 to $54,999 | 34 (2.2%) | 73 (4.4%) |
| $55,000 to $64,999 | 178 (11.6%) | 91 (5.6%) |
| $65,000 to $74,999 | 113 (7.4%) | 91 (5.6%) |
| $75,000 to $99,999 | 128 (8.3%) | 70 (4.3%) |
| $100,000+ | 194 (12.7%) | 56 (3.4%) |
| Total | 1,534 (100.0%) | 1,640 (100.0%) |
Earnings by Sex by Educational Attainment in Ranson corporation
Average earnings in Ranson corporation are $48,672 for men and $40,556 for women, a difference of 16.7%. Men with an educational attainment of graduate degree enjoy the highest average annual earnings of $148,750, while those with less than high school education earn the least with $34,722. Women with an educational attainment of bachelor's degree earn the most with the average annual earnings of $69,048, while those with high school diploma education have the smallest earnings of $28,563.
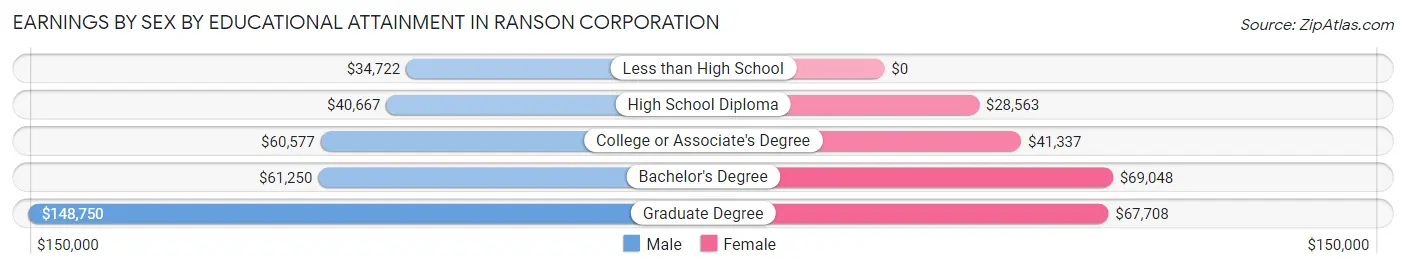
| Educational Attainment | Male Income | Female Income |
| Less than High School | $34,722 | $0 |
| High School Diploma | $40,667 | $28,563 |
| College or Associate's Degree | $60,577 | $41,337 |
| Bachelor's Degree | $61,250 | $69,048 |
| Graduate Degree | $148,750 | $67,708 |
| Total | $48,672 | $40,556 |
Family Income in Ranson corporation
Family Income Brackets in Ranson corporation
According to the Ranson corporation family income data, there are 395 families falling into the $100,000 to $149,999 income range, which is the most common income bracket and makes up 28.0% of all families. Conversely, the $10,000 to $14,999 income bracket is the least frequent group with only 27 families (1.9%) belonging to this category.
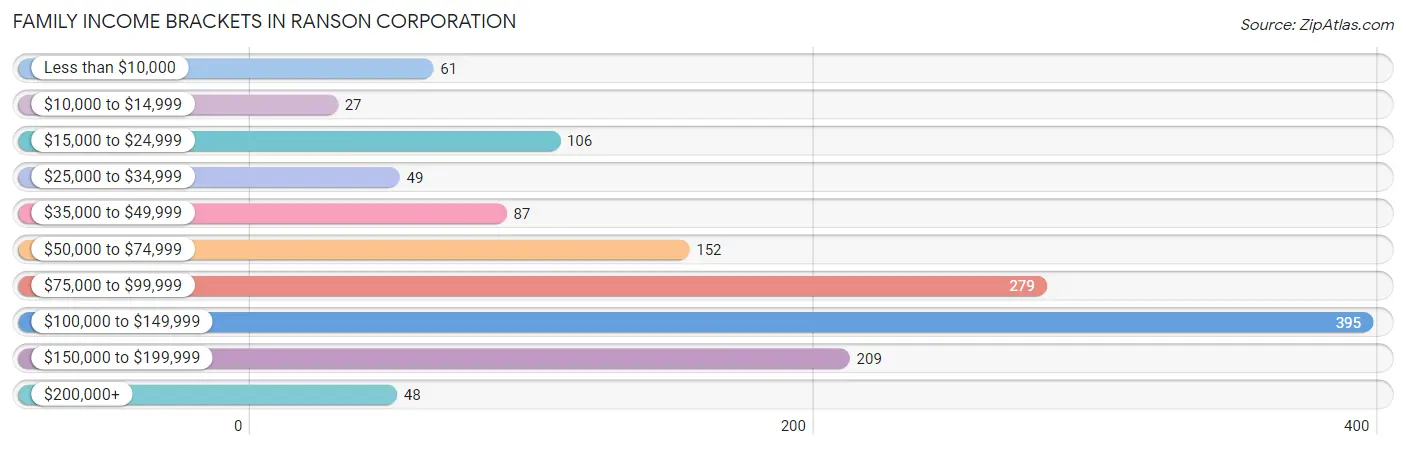
| Income Bracket | # Families | % Families |
| Less than $10,000 | 61 | 4.3% |
| $10,000 to $14,999 | 27 | 1.9% |
| $15,000 to $24,999 | 106 | 7.5% |
| $25,000 to $34,999 | 49 | 3.5% |
| $35,000 to $49,999 | 87 | 6.2% |
| $50,000 to $74,999 | 152 | 10.8% |
| $75,000 to $99,999 | 279 | 19.8% |
| $100,000 to $149,999 | 395 | 28.0% |
| $150,000 to $199,999 | 209 | 14.8% |
| $200,000+ | 48 | 3.4% |
Family Income by Famaliy Size in Ranson corporation
3-person families (359 | 25.5%) account for the highest median family income in Ranson corporation with $105,592 per family, while 2-person families (525 | 37.3%) have the highest median income of $50,254 per family member.
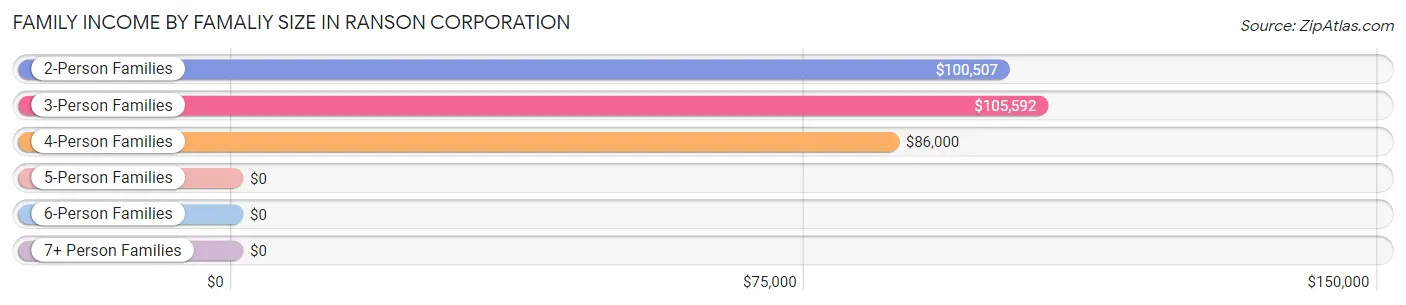
| Income Bracket | # Families | Median Income |
| 2-Person Families | 525 (37.3%) | $100,507 |
| 3-Person Families | 359 (25.5%) | $105,592 |
| 4-Person Families | 232 (16.5%) | $86,000 |
| 5-Person Families | 211 (15.0%) | $0 |
| 6-Person Families | 38 (2.7%) | $0 |
| 7+ Person Families | 44 (3.1%) | $0 |
| Total | 1,409 (100.0%) | $95,766 |
Family Income by Number of Earners in Ranson corporation
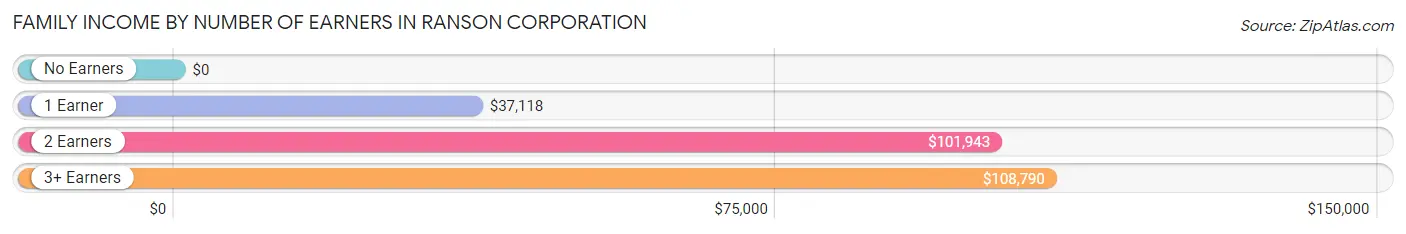
| Number of Earners | # Families | Median Income |
| No Earners | 115 (8.2%) | $0 |
| 1 Earner | 447 (31.7%) | $37,118 |
| 2 Earners | 591 (41.9%) | $101,943 |
| 3+ Earners | 256 (18.2%) | $108,790 |
| Total | 1,409 (100.0%) | $95,766 |
Household Income in Ranson corporation
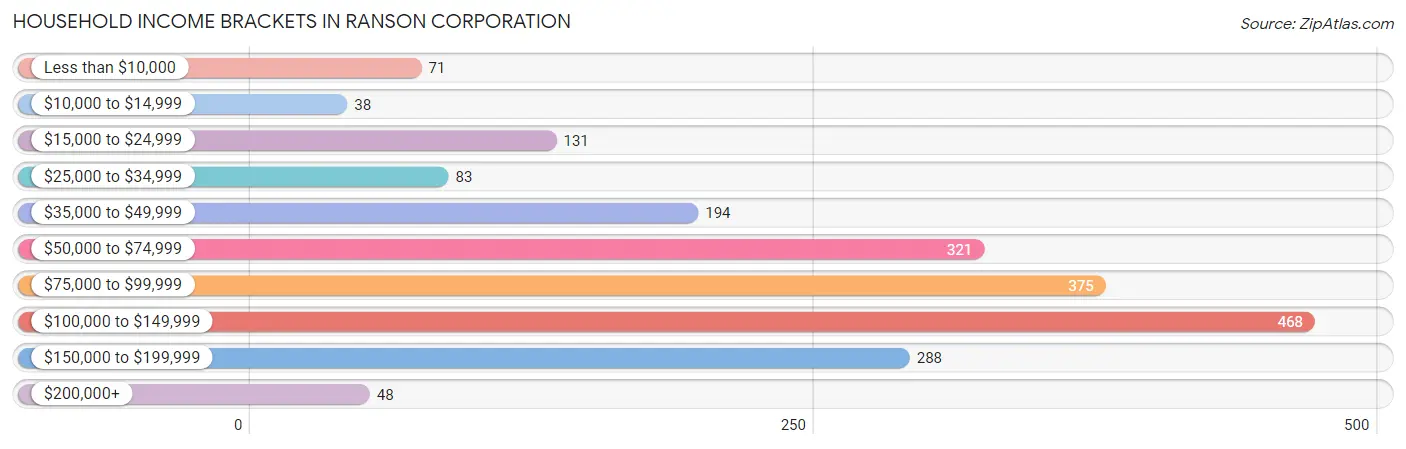
Household Income Brackets in Ranson corporation
With 468 households falling in the category, the $100,000 to $149,999 income range is the most frequent in Ranson corporation, accounting for 23.2% of all households. In contrast, only 38 households (1.9%) fall into the $10,000 to $14,999 income bracket, making it the least populous group.
| Income Bracket | # Households | % Households |
| Less than $10,000 | 71 | 3.5% |
| $10,000 to $14,999 | 38 | 1.9% |
| $15,000 to $24,999 | 131 | 6.5% |
| $25,000 to $34,999 | 83 | 4.1% |
| $35,000 to $49,999 | 194 | 9.6% |
| $50,000 to $74,999 | 321 | 15.9% |
| $75,000 to $99,999 | 375 | 18.6% |
| $100,000 to $149,999 | 468 | 23.2% |
| $150,000 to $199,999 | 288 | 14.3% |
| $200,000+ | 48 | 2.4% |
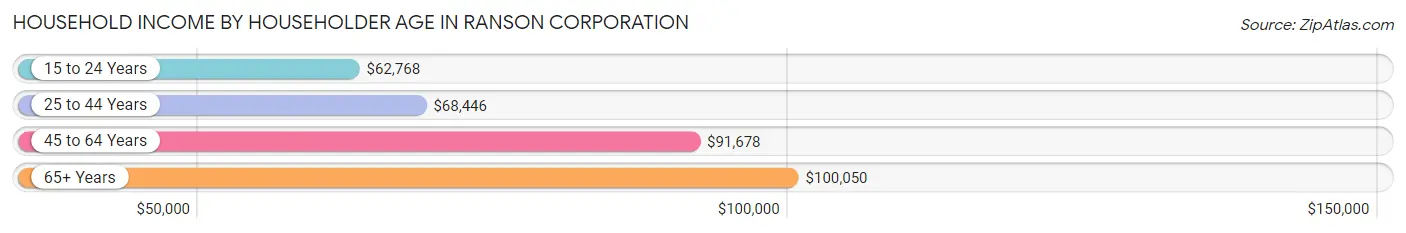
Household Income by Householder Age in Ranson corporation
The median household income in Ranson corporation is $80,242, with the highest median household income of $100,050 found in the 65+ years age bracket for the primary householder. A total of 444 households (22.0%) fall into this category. Meanwhile, the 15 to 24 years age bracket for the primary householder has the lowest median household income of $62,768, with 107 households (5.3%) in this group.
| Income Bracket | # Households | Median Income |
| 15 to 24 Years | 107 (5.3%) | $62,768 |
| 25 to 44 Years | 578 (28.7%) | $68,446 |
| 45 to 64 Years | 887 (44.0%) | $91,678 |
| 65+ Years | 444 (22.0%) | $100,050 |
| Total | 2,016 (100.0%) | $80,242 |
Poverty in Ranson corporation
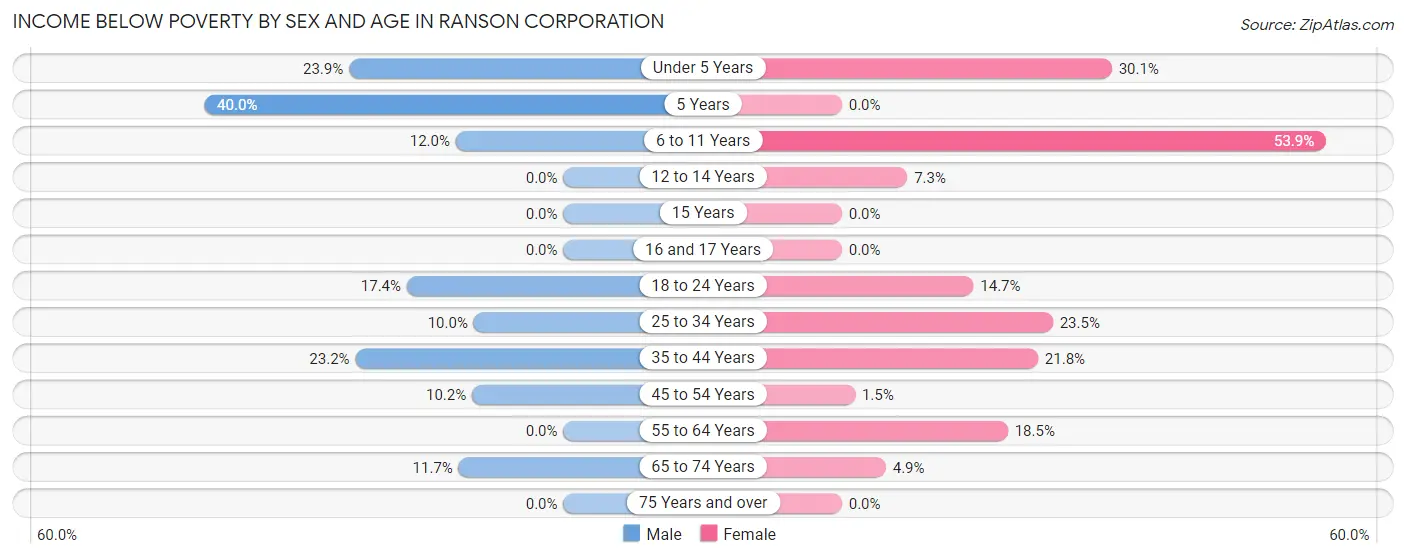
Income Below Poverty by Sex and Age in Ranson corporation
With 12.3% poverty level for males and 15.5% for females among the residents of Ranson corporation, 5 year old males and 6 to 11 year old females are the most vulnerable to poverty, with 22 males (40.0%) and 103 females (53.9%) in their respective age groups living below the poverty level.
| Age Bracket | Male | Female |
| Under 5 Years | 53 (23.9%) | 52 (30.1%) |
| 5 Years | 22 (40.0%) | 0 (0.0%) |
| 6 to 11 Years | 20 (12.0%) | 103 (53.9%) |
| 12 to 14 Years | 0 (0.0%) | 14 (7.3%) |
| 15 Years | 0 (0.0%) | 0 (0.0%) |
| 16 and 17 Years | 0 (0.0%) | 0 (0.0%) |
| 18 to 24 Years | 38 (17.4%) | 52 (14.6%) |
| 25 to 34 Years | 44 (10.0%) | 101 (23.5%) |
| 35 to 44 Years | 44 (23.2%) | 90 (21.8%) |
| 45 to 54 Years | 49 (10.2%) | 7 (1.5%) |
| 55 to 64 Years | 0 (0.0%) | 39 (18.5%) |
| 65 to 74 Years | 26 (11.7%) | 15 (4.9%) |
| 75 Years and over | 0 (0.0%) | 0 (0.0%) |
| Total | 296 (12.3%) | 473 (15.5%) |
Income Above Poverty by Sex and Age in Ranson corporation
According to the poverty statistics in Ranson corporation, males aged 12 to 14 years and females aged 5 years are the age groups that are most secure financially, with 100.0% of males and 100.0% of females in these age groups living above the poverty line.
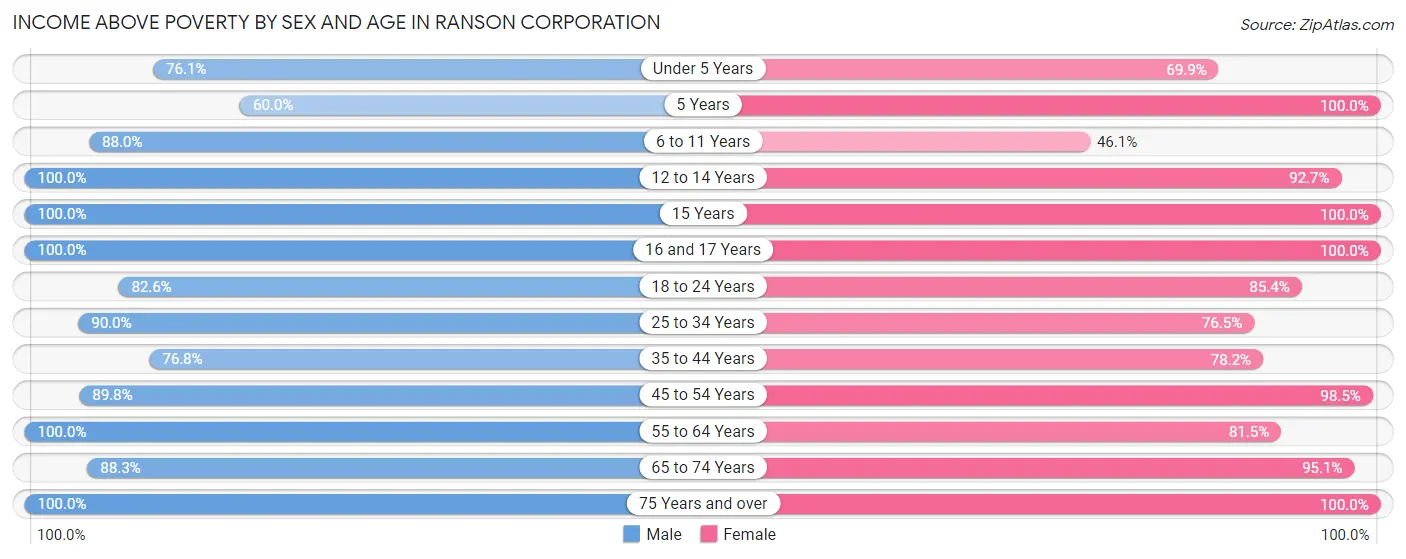
| Age Bracket | Male | Female |
| Under 5 Years | 169 (76.1%) | 121 (69.9%) |
| 5 Years | 33 (60.0%) | 33 (100.0%) |
| 6 to 11 Years | 147 (88.0%) | 88 (46.1%) |
| 12 to 14 Years | 54 (100.0%) | 178 (92.7%) |
| 15 Years | 36 (100.0%) | 42 (100.0%) |
| 16 and 17 Years | 66 (100.0%) | 76 (100.0%) |
| 18 to 24 Years | 180 (82.6%) | 303 (85.4%) |
| 25 to 34 Years | 397 (90.0%) | 329 (76.5%) |
| 35 to 44 Years | 146 (76.8%) | 322 (78.2%) |
| 45 to 54 Years | 433 (89.8%) | 470 (98.5%) |
| 55 to 64 Years | 192 (100.0%) | 172 (81.5%) |
| 65 to 74 Years | 197 (88.3%) | 291 (95.1%) |
| 75 Years and over | 59 (100.0%) | 156 (100.0%) |
| Total | 2,109 (87.7%) | 2,581 (84.5%) |
Income Below Poverty Among Married-Couple Families in Ranson corporation
The poverty statistics for married-couple families in Ranson corporation show that 5.7% or 52 of the total 915 families live below the poverty line. Families with 1 or 2 children have the highest poverty rate of 11.0%, comprising of 44 families. On the other hand, families with 3 or 4 children have the lowest poverty rate of 0.0%, which includes 0 families.
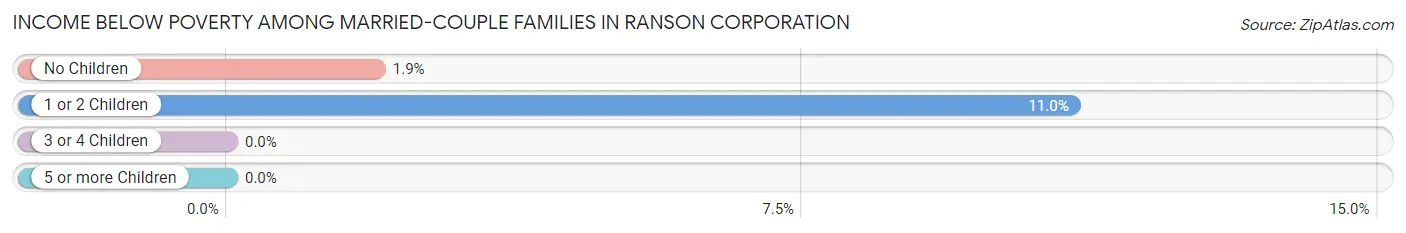
| Children | Above Poverty | Below Poverty |
| No Children | 406 (98.1%) | 8 (1.9%) |
| 1 or 2 Children | 356 (89.0%) | 44 (11.0%) |
| 3 or 4 Children | 90 (100.0%) | 0 (0.0%) |
| 5 or more Children | 11 (100.0%) | 0 (0.0%) |
| Total | 863 (94.3%) | 52 (5.7%) |
Income Below Poverty Among Single-Parent Households in Ranson corporation
According to the poverty data in Ranson corporation, 39.6% or 44 single-father households and 27.4% or 105 single-mother households are living below the poverty line. Among single-father households, those with 3 or 4 children have the highest poverty rate, with 35 households (100.0%) experiencing poverty. Likewise, among single-mother households, those with 3 or 4 children have the highest poverty rate, with 49 households (56.3%) falling below the poverty line.
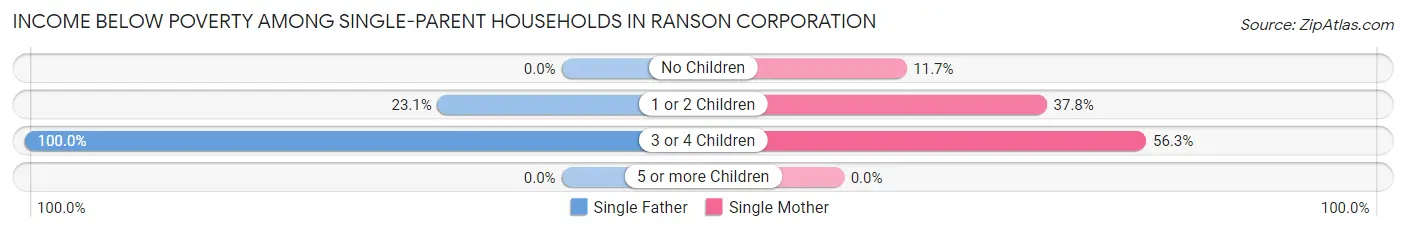
| Children | Single Father | Single Mother |
| No Children | 0 (0.0%) | 25 (11.7%) |
| 1 or 2 Children | 9 (23.1%) | 31 (37.8%) |
| 3 or 4 Children | 35 (100.0%) | 49 (56.3%) |
| 5 or more Children | 0 (0.0%) | 0 (0.0%) |
| Total | 44 (39.6%) | 105 (27.4%) |
Income Below Poverty Among Married-Couple vs Single-Parent Households in Ranson corporation
The poverty data for Ranson corporation shows that 52 of the married-couple family households (5.7%) and 149 of the single-parent households (30.2%) are living below the poverty level. Within the married-couple family households, those with 1 or 2 children have the highest poverty rate, with 44 households (11.0%) falling below the poverty line. Among the single-parent households, those with 3 or 4 children have the highest poverty rate, with 84 household (68.9%) living below poverty.
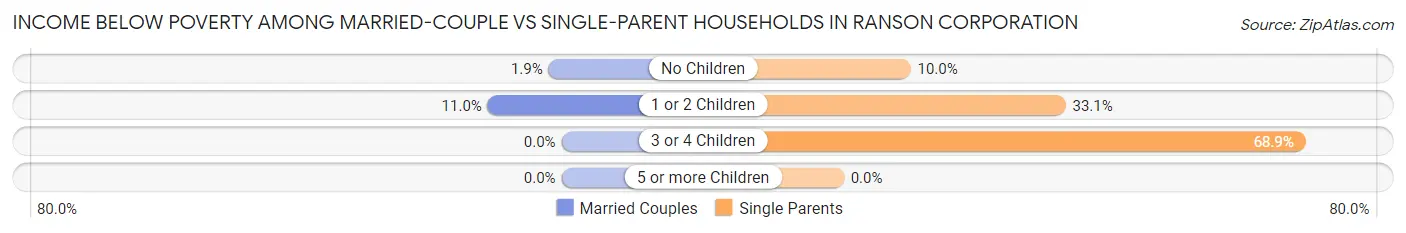
| Children | Married-Couple Families | Single-Parent Households |
| No Children | 8 (1.9%) | 25 (10.0%) |
| 1 or 2 Children | 44 (11.0%) | 40 (33.1%) |
| 3 or 4 Children | 0 (0.0%) | 84 (68.9%) |
| 5 or more Children | 0 (0.0%) | 0 (0.0%) |
| Total | 52 (5.7%) | 149 (30.2%) |
Employment Characteristics in Ranson corporation
Employment by Class of Employer in Ranson corporation
Among the 2,887 employed individuals in Ranson corporation, private company employees (2,200 | 76.2%), local government employees (145 | 5.0%), and federal government employees (134 | 4.6%) make up the most common classes of employment.
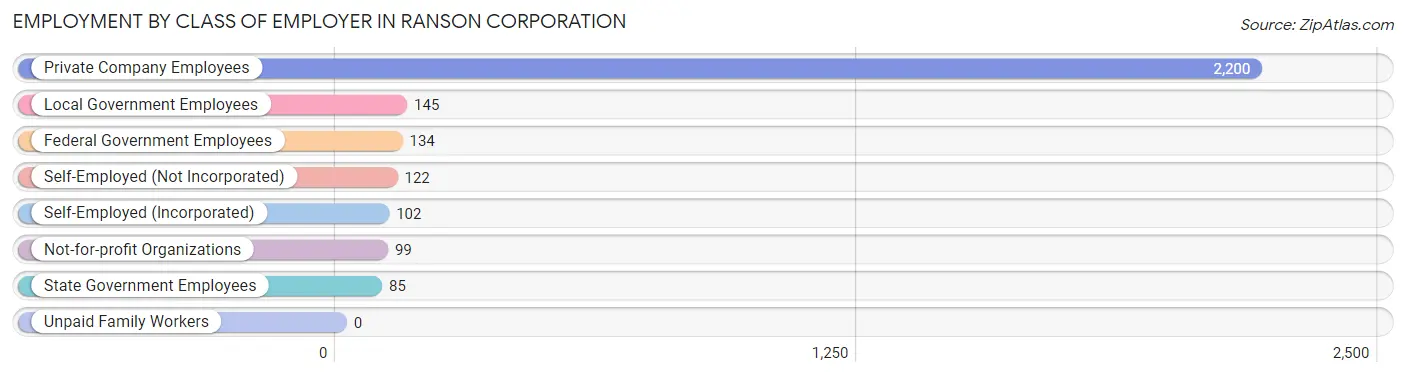
| Employer Class | # Employees | % Employees |
| Private Company Employees | 2,200 | 76.2% |
| Self-Employed (Incorporated) | 102 | 3.5% |
| Self-Employed (Not Incorporated) | 122 | 4.2% |
| Not-for-profit Organizations | 99 | 3.4% |
| Local Government Employees | 145 | 5.0% |
| State Government Employees | 85 | 2.9% |
| Federal Government Employees | 134 | 4.6% |
| Unpaid Family Workers | 0 | 0.0% |
| Total | 2,887 | 100.0% |
Employment Status by Age in Ranson corporation
According to the labor force statistics for Ranson corporation, out of the total population over 16 years of age (4,294), 72.2% or 3,100 individuals are in the labor force, with 4.9% or 152 of them unemployed. The age group with the highest labor force participation rate is 30 to 34 years, with 99.0% or 411 individuals in the labor force. Within the labor force, the 25 to 29 years age range has the highest percentage of unemployed individuals, with 16.2% or 58 of them being unemployed.
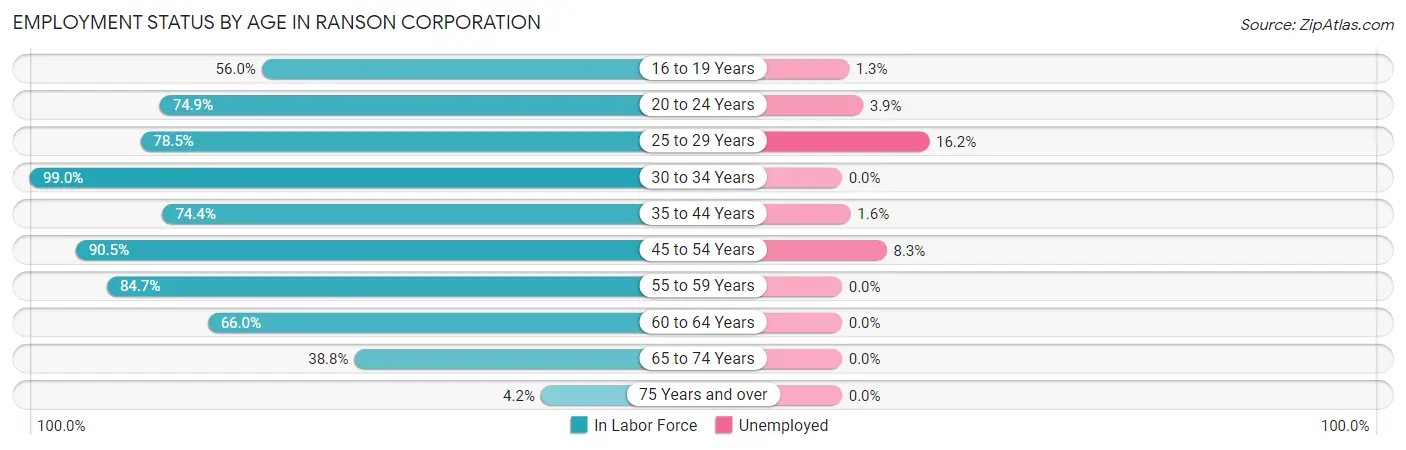
| Age Bracket | In Labor Force | Unemployed |
| 16 to 19 Years | 150 (56.0%) | 2 (1.3%) |
| 20 to 24 Years | 335 (74.9%) | 13 (3.9%) |
| 25 to 29 Years | 358 (78.5%) | 58 (16.2%) |
| 30 to 34 Years | 411 (99.0%) | 0 (0.0%) |
| 35 to 44 Years | 448 (74.4%) | 7 (1.6%) |
| 45 to 54 Years | 868 (90.5%) | 72 (8.3%) |
| 55 to 59 Years | 222 (84.7%) | 0 (0.0%) |
| 60 to 64 Years | 93 (66.0%) | 0 (0.0%) |
| 65 to 74 Years | 205 (38.8%) | 0 (0.0%) |
| 75 Years and over | 9 (4.2%) | 0 (0.0%) |
| Total | 3,100 (72.2%) | 152 (4.9%) |
Employment Status by Educational Attainment in Ranson corporation
According to labor force statistics for Ranson corporation, 84.7% of individuals (2,401) out of the total population between 25 and 64 years of age (2,835) are in the labor force, with 5.7% or 137 of them being unemployed. The group with the highest labor force participation rate are those with the educational attainment of college / associate degree, with 91.1% or 852 individuals in the labor force. Within the labor force, individuals with college / associate degree education have the highest percentage of unemployment, with 10.4% or 89 of them being unemployed.
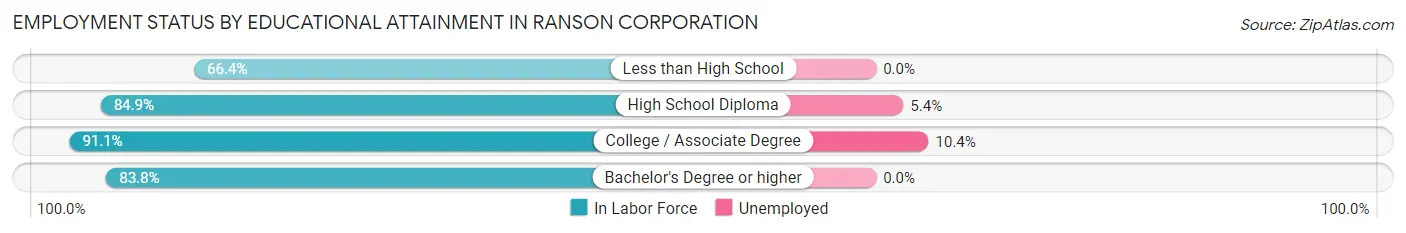
| Educational Attainment | In Labor Force | Unemployed |
| Less than High School | 215 (66.4%) | 0 (0.0%) |
| High School Diploma | 897 (84.9%) | 57 (5.4%) |
| College / Associate Degree | 852 (91.1%) | 97 (10.4%) |
| Bachelor's Degree or higher | 436 (83.8%) | 0 (0.0%) |
| Total | 2,401 (84.7%) | 162 (5.7%) |
Employment Occupations by Sex in Ranson corporation
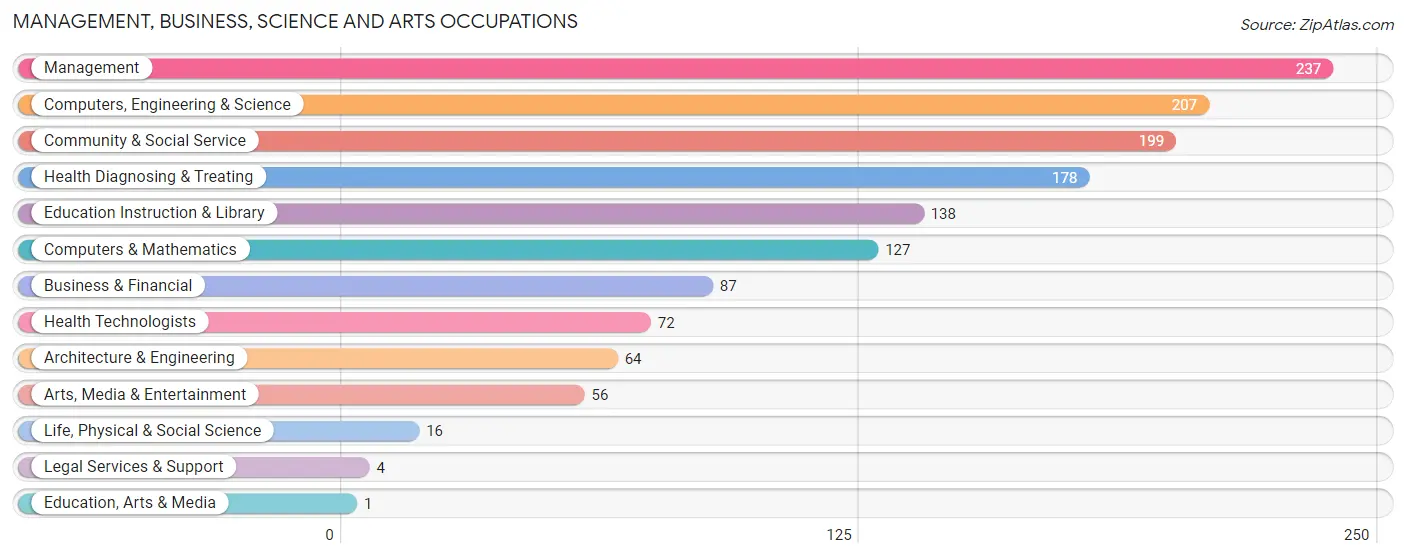
Management, Business, Science and Arts Occupations
The most common Management, Business, Science and Arts occupations in Ranson corporation are Management (237 | 8.0%), Computers, Engineering & Science (207 | 7.0%), Community & Social Service (199 | 6.8%), Health Diagnosing & Treating (178 | 6.0%), and Education Instruction & Library (138 | 4.7%).
Management, Business, Science and Arts Occupations by Sex
Within the Management, Business, Science and Arts occupations in Ranson corporation, the most male-oriented occupations are Legal Services & Support (100.0%), Architecture & Engineering (92.2%), and Computers & Mathematics (88.2%), while the most female-oriented occupations are Education, Arts & Media (100.0%), Health Diagnosing & Treating (92.1%), and Education Instruction & Library (85.5%).
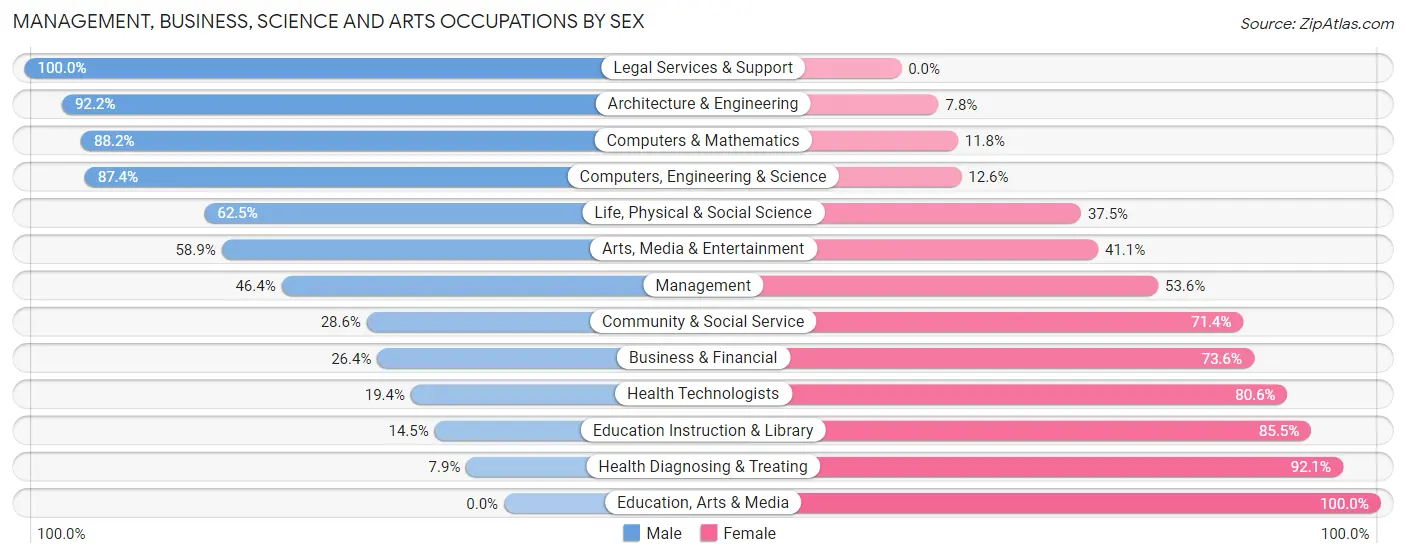
| Occupation | Male | Female |
| Management | 110 (46.4%) | 127 (53.6%) |
| Business & Financial | 23 (26.4%) | 64 (73.6%) |
| Computers, Engineering & Science | 181 (87.4%) | 26 (12.6%) |
| Computers & Mathematics | 112 (88.2%) | 15 (11.8%) |
| Architecture & Engineering | 59 (92.2%) | 5 (7.8%) |
| Life, Physical & Social Science | 10 (62.5%) | 6 (37.5%) |
| Community & Social Service | 57 (28.6%) | 142 (71.4%) |
| Education, Arts & Media | 0 (0.0%) | 1 (100.0%) |
| Legal Services & Support | 4 (100.0%) | 0 (0.0%) |
| Education Instruction & Library | 20 (14.5%) | 118 (85.5%) |
| Arts, Media & Entertainment | 33 (58.9%) | 23 (41.1%) |
| Health Diagnosing & Treating | 14 (7.9%) | 164 (92.1%) |
| Health Technologists | 14 (19.4%) | 58 (80.6%) |
| Total (Category) | 385 (42.4%) | 523 (57.6%) |
| Total (Overall) | 1,390 (47.2%) | 1,557 (52.8%) |
Services Occupations
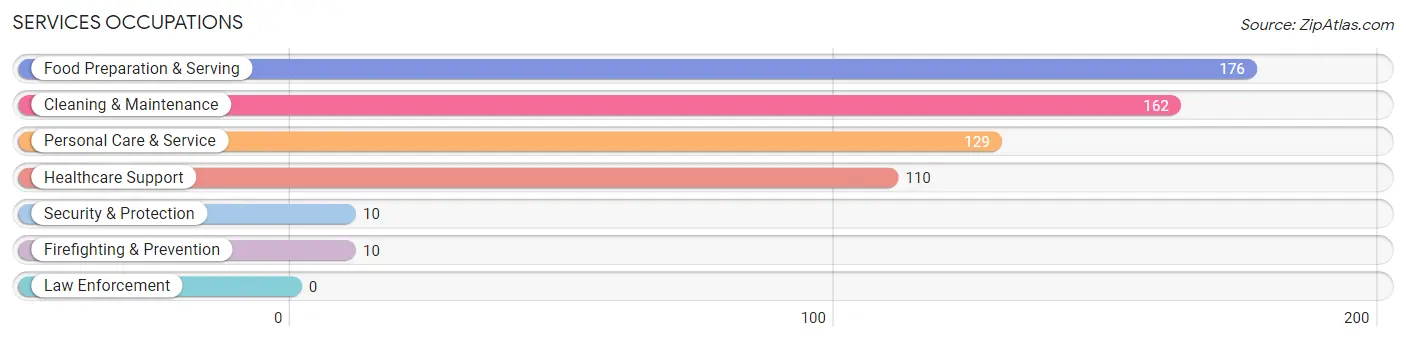
The most common Services occupations in Ranson corporation are Food Preparation & Serving (176 | 6.0%), Cleaning & Maintenance (162 | 5.5%), Personal Care & Service (129 | 4.4%), Healthcare Support (110 | 3.7%), and Security & Protection (10 | 0.3%).
Services Occupations by Sex
Within the Services occupations in Ranson corporation, the most male-oriented occupations are Security & Protection (100.0%), Firefighting & Prevention (100.0%), and Personal Care & Service (54.3%), while the most female-oriented occupations are Healthcare Support (100.0%), Food Preparation & Serving (71.0%), and Cleaning & Maintenance (53.1%).
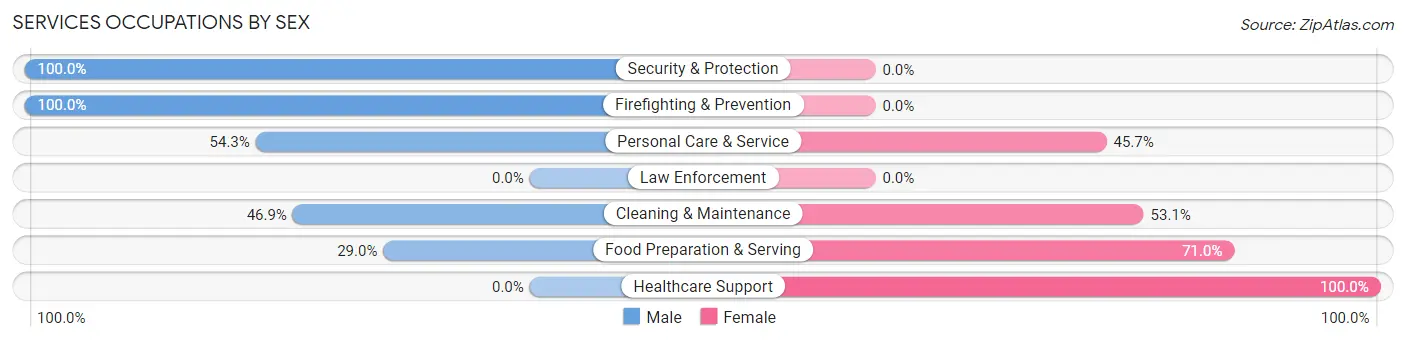
| Occupation | Male | Female |
| Healthcare Support | 0 (0.0%) | 110 (100.0%) |
| Security & Protection | 10 (100.0%) | 0 (0.0%) |
| Firefighting & Prevention | 10 (100.0%) | 0 (0.0%) |
| Law Enforcement | 0 (0.0%) | 0 (0.0%) |
| Food Preparation & Serving | 51 (29.0%) | 125 (71.0%) |
| Cleaning & Maintenance | 76 (46.9%) | 86 (53.1%) |
| Personal Care & Service | 70 (54.3%) | 59 (45.7%) |
| Total (Category) | 207 (35.3%) | 380 (64.7%) |
| Total (Overall) | 1,390 (47.2%) | 1,557 (52.8%) |
Sales and Office Occupations
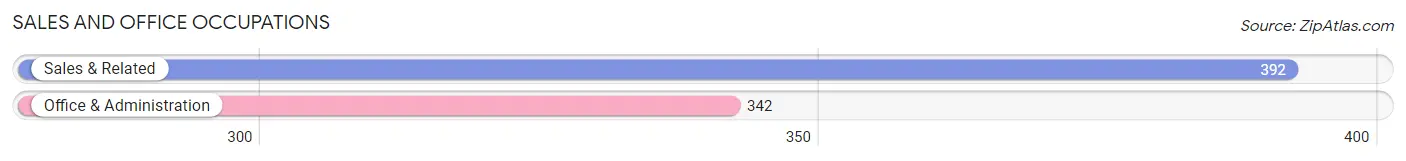
The most common Sales and Office occupations in Ranson corporation are Sales & Related (392 | 13.3%), and Office & Administration (342 | 11.6%).
Sales and Office Occupations by Sex
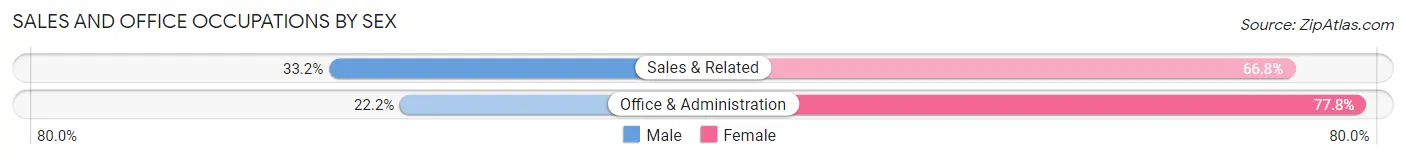
| Occupation | Male | Female |
| Sales & Related | 130 (33.2%) | 262 (66.8%) |
| Office & Administration | 76 (22.2%) | 266 (77.8%) |
| Total (Category) | 206 (28.1%) | 528 (71.9%) |
| Total (Overall) | 1,390 (47.2%) | 1,557 (52.8%) |
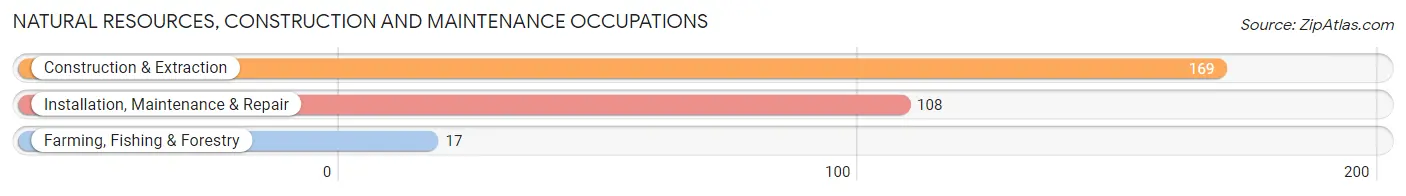
Natural Resources, Construction and Maintenance Occupations
The most common Natural Resources, Construction and Maintenance occupations in Ranson corporation are Construction & Extraction (169 | 5.7%), Installation, Maintenance & Repair (108 | 3.7%), and Farming, Fishing & Forestry (17 | 0.6%).
Natural Resources, Construction and Maintenance Occupations by Sex
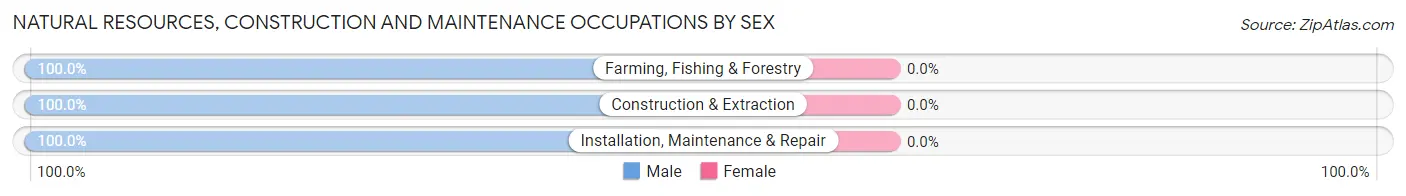
| Occupation | Male | Female |
| Farming, Fishing & Forestry | 17 (100.0%) | 0 (0.0%) |
| Construction & Extraction | 169 (100.0%) | 0 (0.0%) |
| Installation, Maintenance & Repair | 108 (100.0%) | 0 (0.0%) |
| Total (Category) | 294 (100.0%) | 0 (0.0%) |
| Total (Overall) | 1,390 (47.2%) | 1,557 (52.8%) |
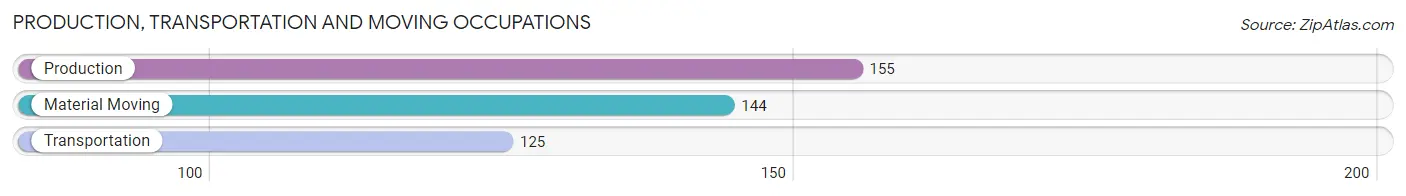
Production, Transportation and Moving Occupations
The most common Production, Transportation and Moving occupations in Ranson corporation are Production (155 | 5.3%), Material Moving (144 | 4.9%), and Transportation (125 | 4.2%).
Production, Transportation and Moving Occupations by Sex
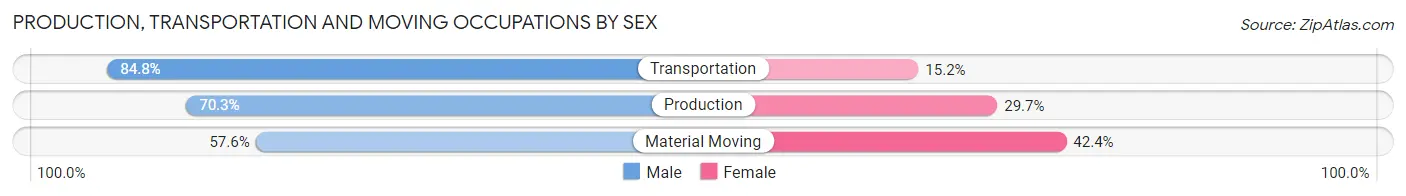
| Occupation | Male | Female |
| Production | 109 (70.3%) | 46 (29.7%) |
| Transportation | 106 (84.8%) | 19 (15.2%) |
| Material Moving | 83 (57.6%) | 61 (42.4%) |
| Total (Category) | 298 (70.3%) | 126 (29.7%) |
| Total (Overall) | 1,390 (47.2%) | 1,557 (52.8%) |
Employment Industries by Sex in Ranson corporation
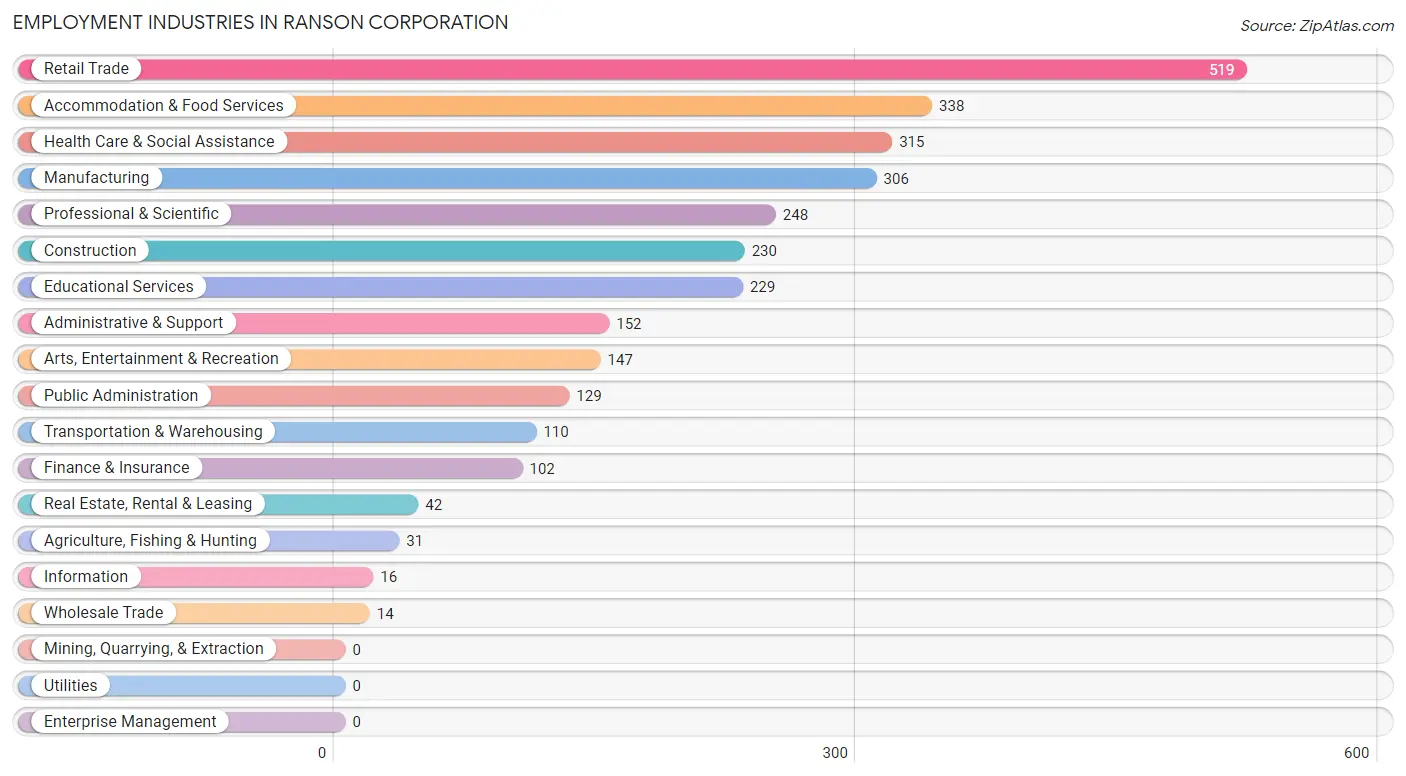
Employment Industries in Ranson corporation
The major employment industries in Ranson corporation include Retail Trade (519 | 17.6%), Accommodation & Food Services (338 | 11.5%), Health Care & Social Assistance (315 | 10.7%), Manufacturing (306 | 10.4%), and Professional & Scientific (248 | 8.4%).
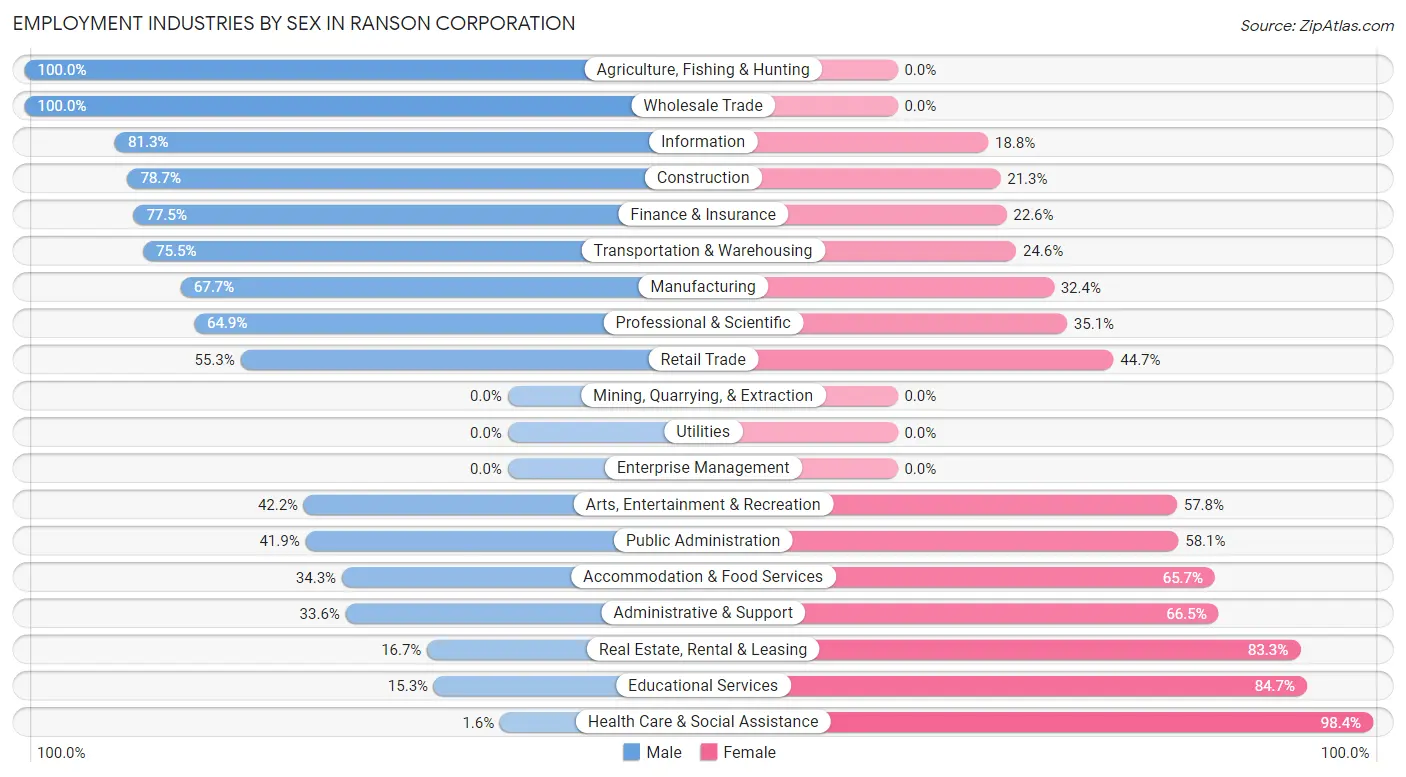
Employment Industries by Sex in Ranson corporation
The Ranson corporation industries that see more men than women are Agriculture, Fishing & Hunting (100.0%), Wholesale Trade (100.0%), and Information (81.2%), whereas the industries that tend to have a higher number of women are Health Care & Social Assistance (98.4%), Educational Services (84.7%), and Real Estate, Rental & Leasing (83.3%).
| Industry | Male | Female |
| Agriculture, Fishing & Hunting | 31 (100.0%) | 0 (0.0%) |
| Mining, Quarrying, & Extraction | 0 (0.0%) | 0 (0.0%) |
| Construction | 181 (78.7%) | 49 (21.3%) |
| Manufacturing | 207 (67.6%) | 99 (32.4%) |
| Wholesale Trade | 14 (100.0%) | 0 (0.0%) |
| Retail Trade | 287 (55.3%) | 232 (44.7%) |
| Transportation & Warehousing | 83 (75.4%) | 27 (24.5%) |
| Utilities | 0 (0.0%) | 0 (0.0%) |
| Information | 13 (81.2%) | 3 (18.8%) |
| Finance & Insurance | 79 (77.4%) | 23 (22.6%) |
| Real Estate, Rental & Leasing | 7 (16.7%) | 35 (83.3%) |
| Professional & Scientific | 161 (64.9%) | 87 (35.1%) |
| Enterprise Management | 0 (0.0%) | 0 (0.0%) |
| Administrative & Support | 51 (33.6%) | 101 (66.4%) |
| Educational Services | 35 (15.3%) | 194 (84.7%) |
| Health Care & Social Assistance | 5 (1.6%) | 310 (98.4%) |
| Arts, Entertainment & Recreation | 62 (42.2%) | 85 (57.8%) |
| Accommodation & Food Services | 116 (34.3%) | 222 (65.7%) |
| Public Administration | 54 (41.9%) | 75 (58.1%) |
| Total | 1,390 (47.2%) | 1,557 (52.8%) |
Education in Ranson corporation
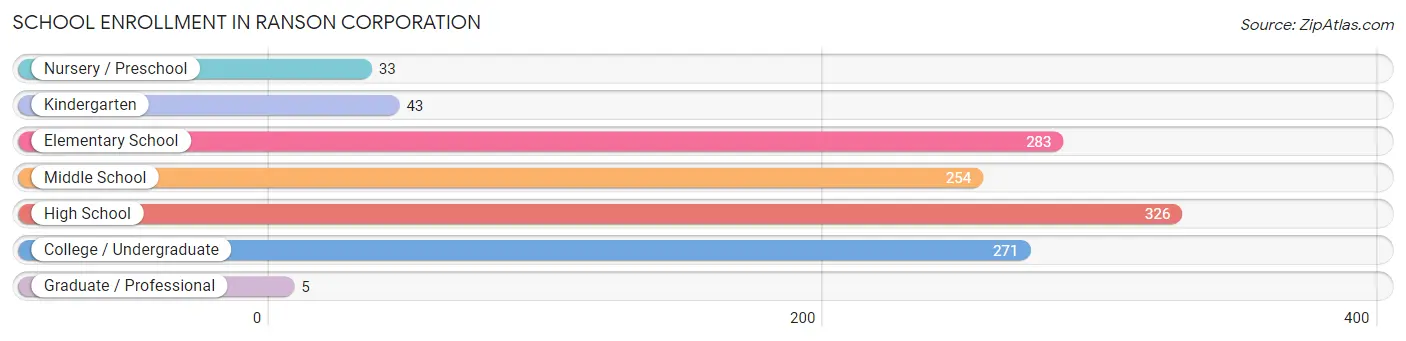
School Enrollment in Ranson corporation
The most common levels of schooling among the 1,215 students in Ranson corporation are high school (326 | 26.8%), elementary school (283 | 23.3%), and college / undergraduate (271 | 22.3%).
| School Level | # Students | % Students |
| Nursery / Preschool | 33 | 2.7% |
| Kindergarten | 43 | 3.5% |
| Elementary School | 283 | 23.3% |
| Middle School | 254 | 20.9% |
| High School | 326 | 26.8% |
| College / Undergraduate | 271 | 22.3% |
| Graduate / Professional | 5 | 0.4% |
| Total | 1,215 | 100.0% |
School Enrollment by Age by Funding Source in Ranson corporation
Out of a total of 1,215 students who are enrolled in schools in Ranson corporation, 156 (12.8%) attend a private institution, while the remaining 1,059 (87.2%) are enrolled in public schools. The age group of 10 to 14 year olds has the highest likelihood of being enrolled in private schools, with 65 (18.6% in the age bracket) enrolled. Conversely, the age group of 3 to 4 year olds has the lowest likelihood of being enrolled in a private school, with 11 (100.0% in the age bracket) attending a public institution.
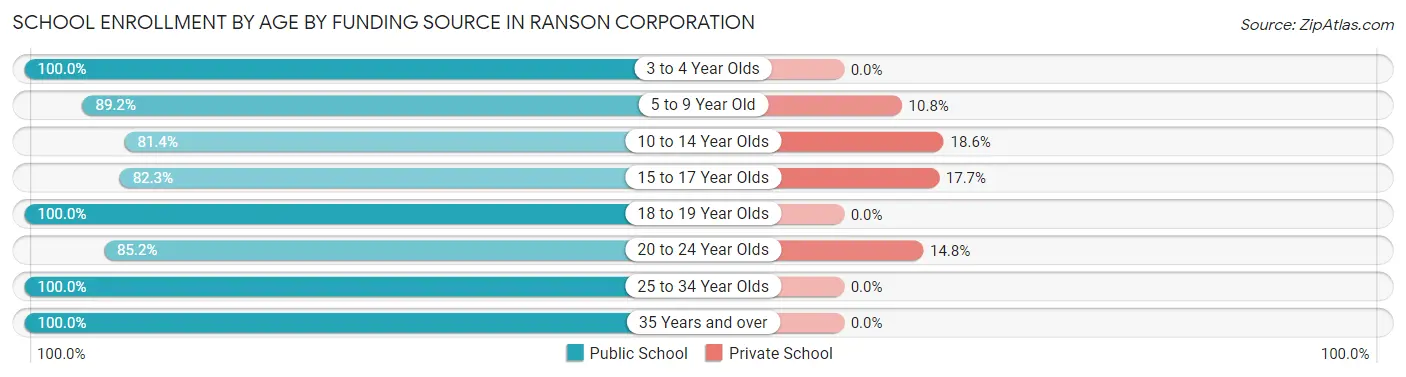
| Age Bracket | Public School | Private School |
| 3 to 4 Year Olds | 11 (100.0%) | 0 (0.0%) |
| 5 to 9 Year Old | 256 (89.2%) | 31 (10.8%) |
| 10 to 14 Year Olds | 284 (81.4%) | 65 (18.6%) |
| 15 to 17 Year Olds | 181 (82.3%) | 39 (17.7%) |
| 18 to 19 Year Olds | 107 (100.0%) | 0 (0.0%) |
| 20 to 24 Year Olds | 121 (85.2%) | 21 (14.8%) |
| 25 to 34 Year Olds | 50 (100.0%) | 0 (0.0%) |
| 35 Years and over | 49 (100.0%) | 0 (0.0%) |
| Total | 1,059 (87.2%) | 156 (12.8%) |
Educational Attainment by Field of Study in Ranson corporation
Business (178 | 28.3%), education (82 | 13.0%), science & technology (60 | 9.5%), engineering (57 | 9.1%), and bio, nature & agricultural (43 | 6.8%) are the most common fields of study among 629 individuals in Ranson corporation who have obtained a bachelor's degree or higher.
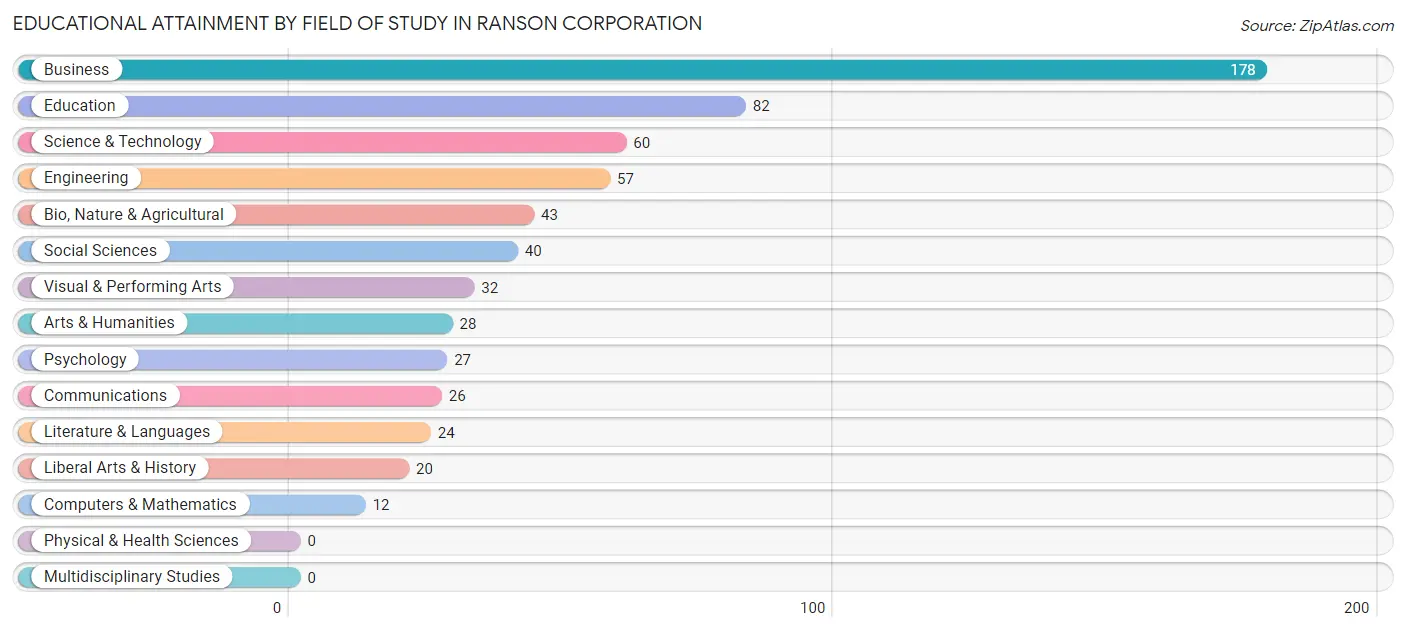
| Field of Study | # Graduates | % Graduates |
| Computers & Mathematics | 12 | 1.9% |
| Bio, Nature & Agricultural | 43 | 6.8% |
| Physical & Health Sciences | 0 | 0.0% |
| Psychology | 27 | 4.3% |
| Social Sciences | 40 | 6.4% |
| Engineering | 57 | 9.1% |
| Multidisciplinary Studies | 0 | 0.0% |
| Science & Technology | 60 | 9.5% |
| Business | 178 | 28.3% |
| Education | 82 | 13.0% |
| Literature & Languages | 24 | 3.8% |
| Liberal Arts & History | 20 | 3.2% |
| Visual & Performing Arts | 32 | 5.1% |
| Communications | 26 | 4.1% |
| Arts & Humanities | 28 | 4.4% |
| Total | 629 | 100.0% |
Transportation & Commute in Ranson corporation
Vehicle Availability by Sex in Ranson corporation
The most prevalent vehicle ownership categories in Ranson corporation are males with 2 vehicles (512, accounting for 37.3%) and females with 2 vehicles (583, making up 33.8%).
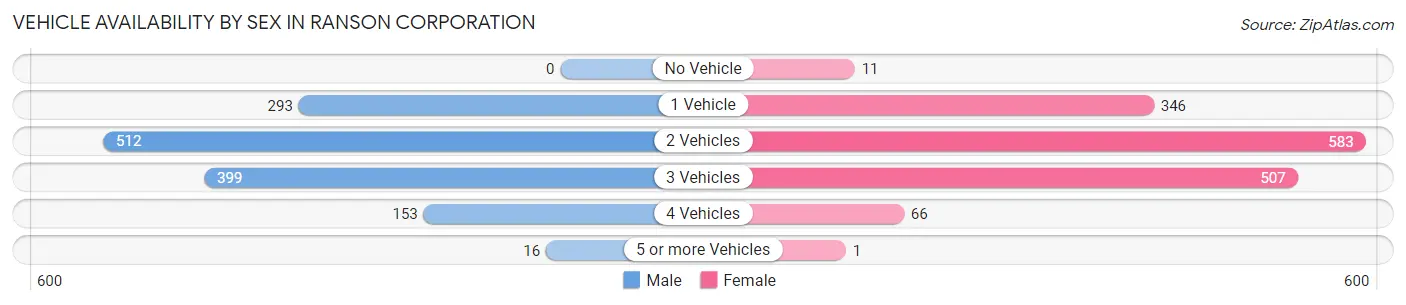
| Vehicles Available | Male | Female |
| No Vehicle | 0 (0.0%) | 11 (0.7%) |
| 1 Vehicle | 293 (21.3%) | 346 (22.9%) |
| 2 Vehicles | 512 (37.3%) | 583 (38.5%) |
| 3 Vehicles | 399 (29.1%) | 507 (33.5%) |
| 4 Vehicles | 153 (11.1%) | 66 (4.4%) |
| 5 or more Vehicles | 16 (1.2%) | 1 (0.1%) |
| Total | 1,373 (100.0%) | 1,514 (100.0%) |
Commute Time in Ranson corporation
The most frequently occuring commute durations in Ranson corporation are 30 to 34 minutes (390 commuters, 14.6%), 60 to 89 minutes (357 commuters, 13.3%), and 45 to 59 minutes (331 commuters, 12.4%).
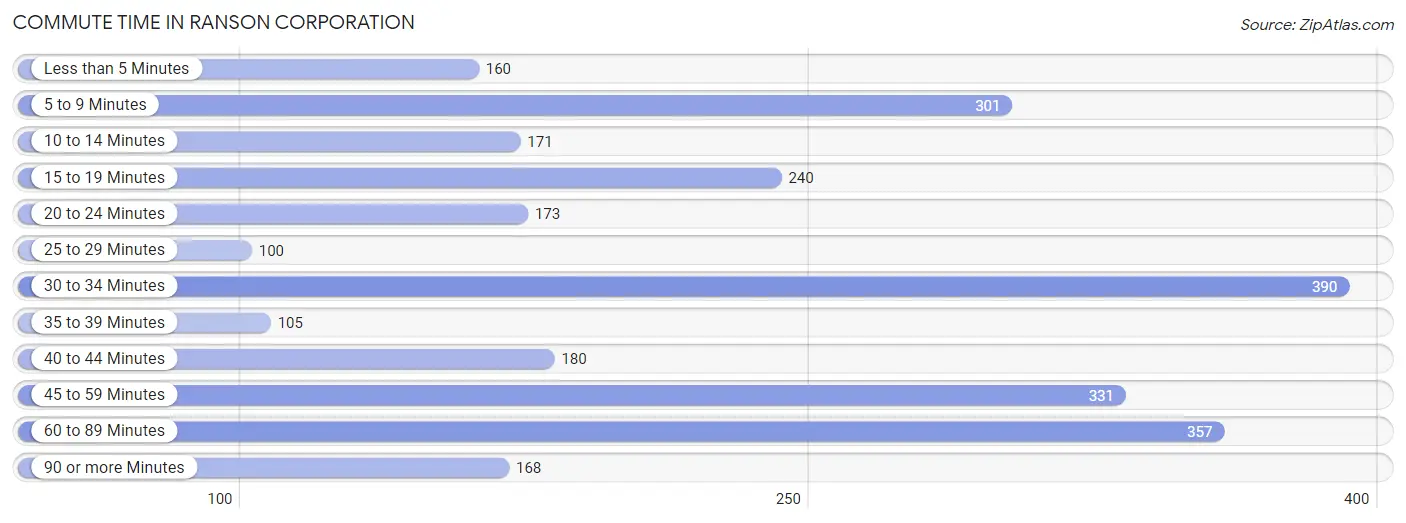
| Commute Time | # Commuters | % Commuters |
| Less than 5 Minutes | 160 | 6.0% |
| 5 to 9 Minutes | 301 | 11.3% |
| 10 to 14 Minutes | 171 | 6.4% |
| 15 to 19 Minutes | 240 | 9.0% |
| 20 to 24 Minutes | 173 | 6.5% |
| 25 to 29 Minutes | 100 | 3.7% |
| 30 to 34 Minutes | 390 | 14.6% |
| 35 to 39 Minutes | 105 | 3.9% |
| 40 to 44 Minutes | 180 | 6.7% |
| 45 to 59 Minutes | 331 | 12.4% |
| 60 to 89 Minutes | 357 | 13.3% |
| 90 or more Minutes | 168 | 6.3% |
Commute Time by Sex in Ranson corporation
The most common commute times in Ranson corporation are 45 to 59 minutes (183 commuters, 13.5%) for males and 30 to 34 minutes (264 commuters, 20.0%) for females.
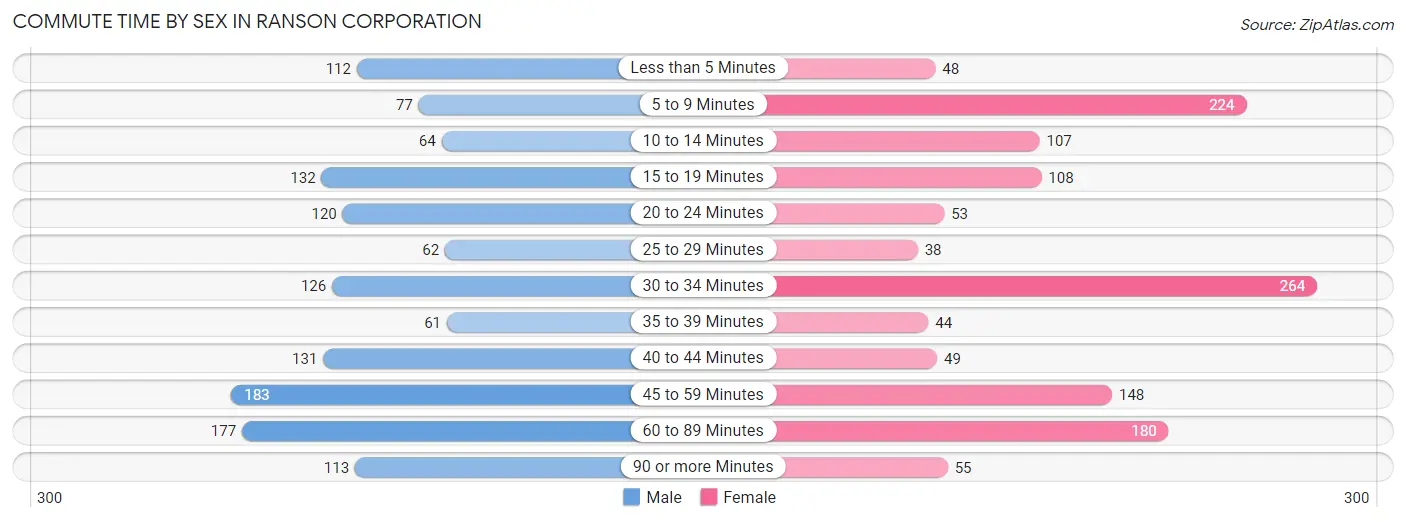
| Commute Time | Male | Female |
| Less than 5 Minutes | 112 (8.3%) | 48 (3.6%) |
| 5 to 9 Minutes | 77 (5.7%) | 224 (17.0%) |
| 10 to 14 Minutes | 64 (4.7%) | 107 (8.1%) |
| 15 to 19 Minutes | 132 (9.7%) | 108 (8.2%) |
| 20 to 24 Minutes | 120 (8.8%) | 53 (4.0%) |
| 25 to 29 Minutes | 62 (4.6%) | 38 (2.9%) |
| 30 to 34 Minutes | 126 (9.3%) | 264 (20.0%) |
| 35 to 39 Minutes | 61 (4.5%) | 44 (3.3%) |
| 40 to 44 Minutes | 131 (9.7%) | 49 (3.7%) |
| 45 to 59 Minutes | 183 (13.5%) | 148 (11.2%) |
| 60 to 89 Minutes | 177 (13.0%) | 180 (13.7%) |
| 90 or more Minutes | 113 (8.3%) | 55 (4.2%) |
Time of Departure to Work by Sex in Ranson corporation
The most frequent times of departure to work in Ranson corporation are 12:00 PM to 3:59 PM (267, 19.7%) for males and 6:30 AM to 6:59 AM (233, 17.7%) for females.
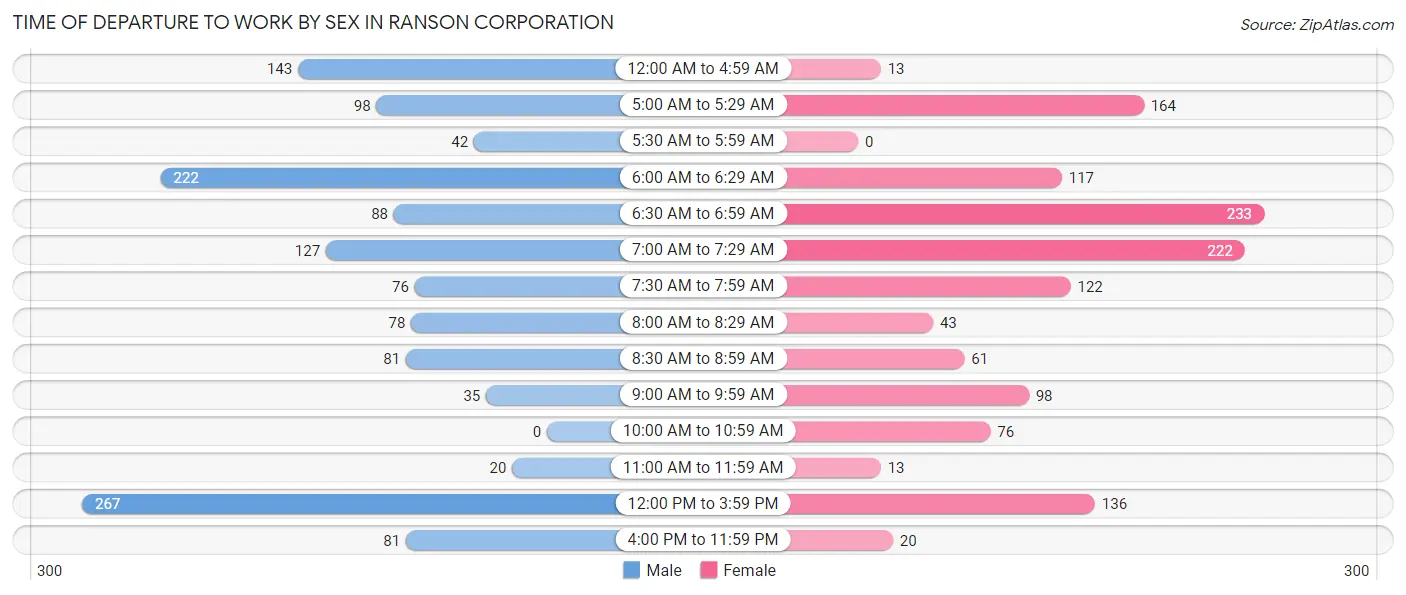
| Time of Departure | Male | Female |
| 12:00 AM to 4:59 AM | 143 (10.5%) | 13 (1.0%) |
| 5:00 AM to 5:29 AM | 98 (7.2%) | 164 (12.4%) |
| 5:30 AM to 5:59 AM | 42 (3.1%) | 0 (0.0%) |
| 6:00 AM to 6:29 AM | 222 (16.4%) | 117 (8.9%) |
| 6:30 AM to 6:59 AM | 88 (6.5%) | 233 (17.7%) |
| 7:00 AM to 7:29 AM | 127 (9.3%) | 222 (16.8%) |
| 7:30 AM to 7:59 AM | 76 (5.6%) | 122 (9.3%) |
| 8:00 AM to 8:29 AM | 78 (5.7%) | 43 (3.3%) |
| 8:30 AM to 8:59 AM | 81 (6.0%) | 61 (4.6%) |
| 9:00 AM to 9:59 AM | 35 (2.6%) | 98 (7.4%) |
| 10:00 AM to 10:59 AM | 0 (0.0%) | 76 (5.8%) |
| 11:00 AM to 11:59 AM | 20 (1.5%) | 13 (1.0%) |
| 12:00 PM to 3:59 PM | 267 (19.7%) | 136 (10.3%) |
| 4:00 PM to 11:59 PM | 81 (6.0%) | 20 (1.5%) |
| Total | 1,358 (100.0%) | 1,318 (100.0%) |
Housing Occupancy in Ranson corporation
Occupancy by Ownership in Ranson corporation
Of the total 2,016 dwellings in Ranson corporation, owner-occupied units account for 1,388 (68.9%), while renter-occupied units make up 628 (31.1%).
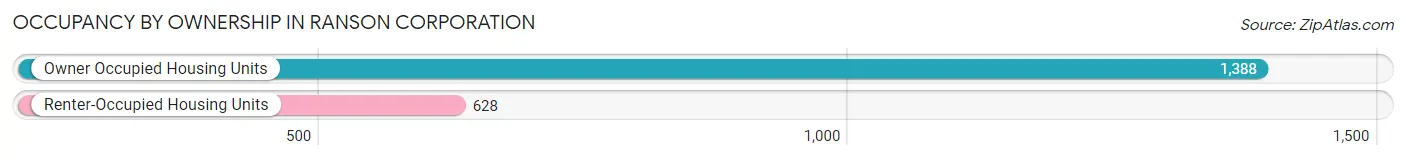
| Occupancy | # Housing Units | % Housing Units |
| Owner Occupied Housing Units | 1,388 | 68.9% |
| Renter-Occupied Housing Units | 628 | 31.1% |
| Total Occupied Housing Units | 2,016 | 100.0% |
Occupancy by Household Size in Ranson corporation
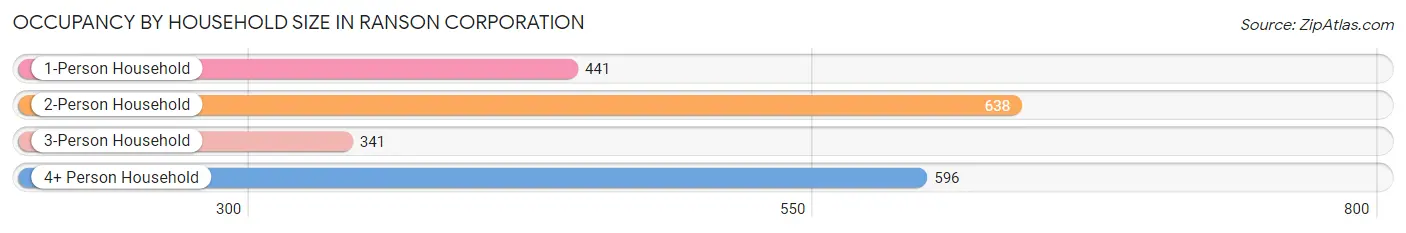
| Household Size | # Housing Units | % Housing Units |
| 1-Person Household | 441 | 21.9% |
| 2-Person Household | 638 | 31.7% |
| 3-Person Household | 341 | 16.9% |
| 4+ Person Household | 596 | 29.6% |
| Total Housing Units | 2,016 | 100.0% |
Occupancy by Ownership by Household Size in Ranson corporation
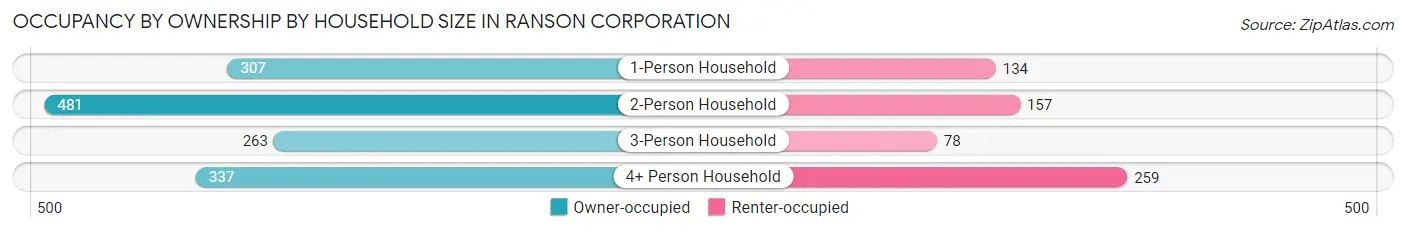
| Household Size | Owner-occupied | Renter-occupied |
| 1-Person Household | 307 (69.6%) | 134 (30.4%) |
| 2-Person Household | 481 (75.4%) | 157 (24.6%) |
| 3-Person Household | 263 (77.1%) | 78 (22.9%) |
| 4+ Person Household | 337 (56.5%) | 259 (43.5%) |
| Total Housing Units | 1,388 (68.9%) | 628 (31.1%) |
Occupancy by Educational Attainment in Ranson corporation

| Household Size | Owner-occupied | Renter-occupied |
| Less than High School | 32 (36.8%) | 55 (63.2%) |
| High School Diploma | 497 (78.4%) | 137 (21.6%) |
| College/Associate Degree | 534 (64.3%) | 296 (35.7%) |
| Bachelor's Degree or higher | 325 (69.9%) | 140 (30.1%) |
Occupancy by Age of Householder in Ranson corporation
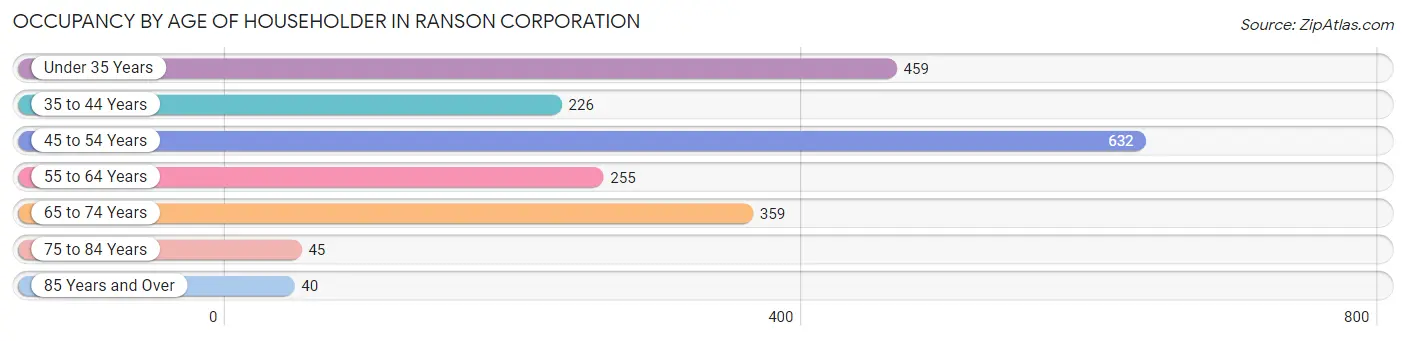
| Age Bracket | # Households | % Households |
| Under 35 Years | 459 | 22.8% |
| 35 to 44 Years | 226 | 11.2% |
| 45 to 54 Years | 632 | 31.4% |
| 55 to 64 Years | 255 | 12.7% |
| 65 to 74 Years | 359 | 17.8% |
| 75 to 84 Years | 45 | 2.2% |
| 85 Years and Over | 40 | 2.0% |
| Total | 2,016 | 100.0% |
Housing Finances in Ranson corporation
Median Income by Occupancy in Ranson corporation
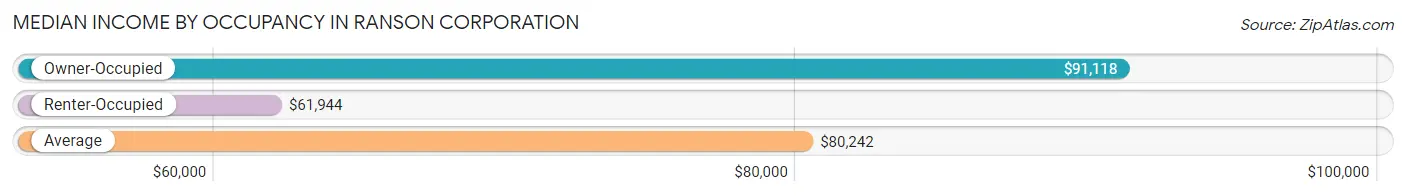
| Occupancy Type | # Households | Median Income |
| Owner-Occupied | 1,388 (68.9%) | $91,118 |
| Renter-Occupied | 628 (31.1%) | $61,944 |
| Average | 2,016 (100.0%) | $80,242 |
Occupancy by Householder Income Bracket in Ranson corporation
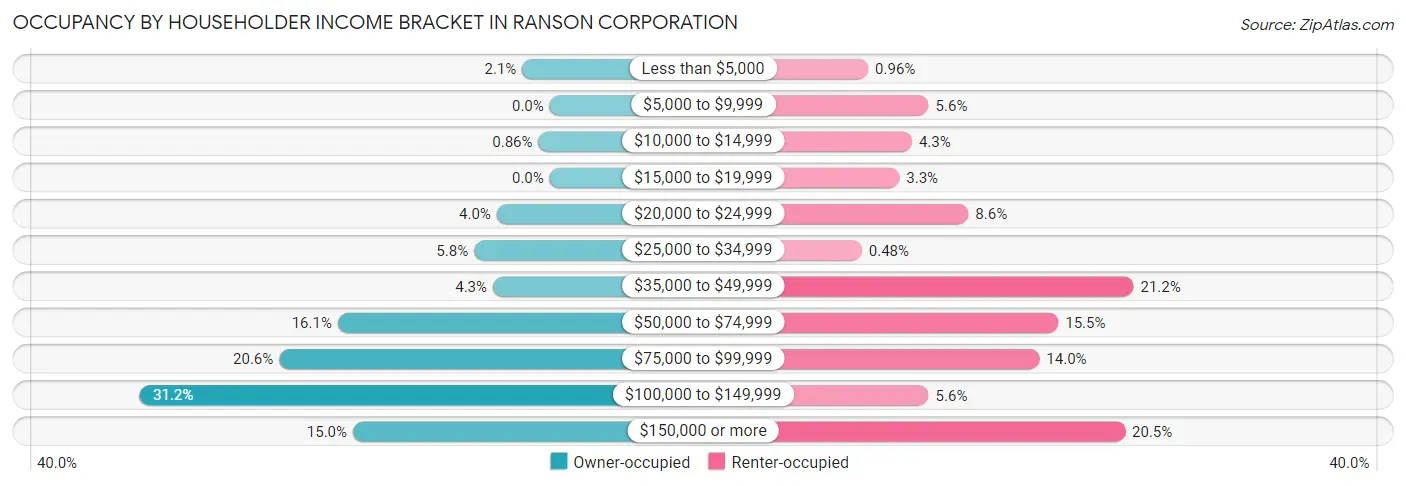
| Income Bracket | Owner-occupied | Renter-occupied |
| Less than $5,000 | 29 (2.1%) | 6 (1.0%) |
| $5,000 to $9,999 | 0 (0.0%) | 35 (5.6%) |
| $10,000 to $14,999 | 12 (0.9%) | 27 (4.3%) |
| $15,000 to $19,999 | 0 (0.0%) | 21 (3.3%) |
| $20,000 to $24,999 | 56 (4.0%) | 54 (8.6%) |
| $25,000 to $34,999 | 80 (5.8%) | 3 (0.5%) |
| $35,000 to $49,999 | 60 (4.3%) | 133 (21.2%) |
| $50,000 to $74,999 | 224 (16.1%) | 97 (15.4%) |
| $75,000 to $99,999 | 286 (20.6%) | 88 (14.0%) |
| $100,000 to $149,999 | 433 (31.2%) | 35 (5.6%) |
| $150,000 or more | 208 (15.0%) | 129 (20.5%) |
| Total | 1,388 (100.0%) | 628 (100.0%) |
Monthly Housing Cost Tiers in Ranson corporation
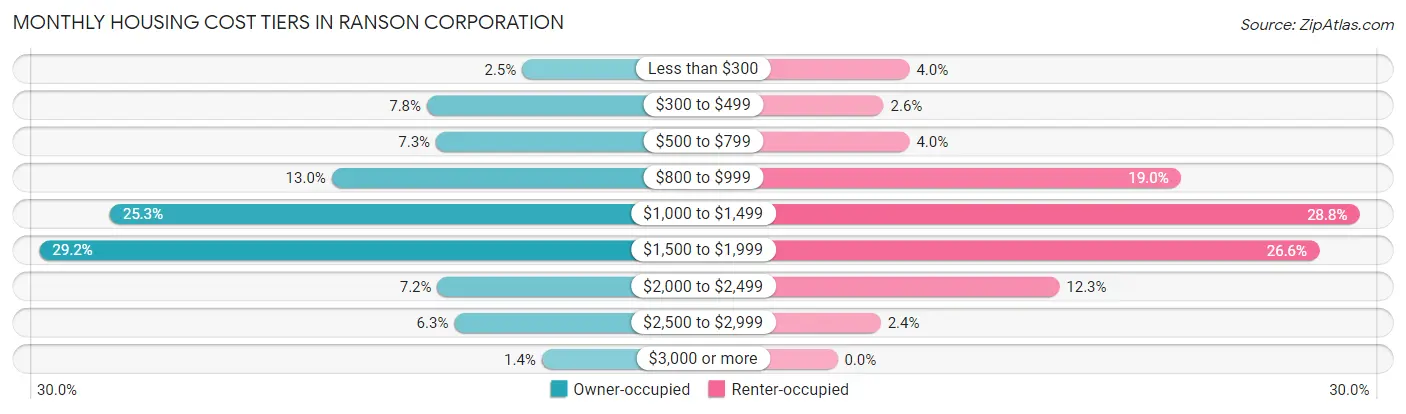
| Monthly Cost | Owner-occupied | Renter-occupied |
| Less than $300 | 35 (2.5%) | 25 (4.0%) |
| $300 to $499 | 108 (7.8%) | 16 (2.5%) |
| $500 to $799 | 101 (7.3%) | 25 (4.0%) |
| $800 to $999 | 181 (13.0%) | 119 (19.0%) |
| $1,000 to $1,499 | 351 (25.3%) | 181 (28.8%) |
| $1,500 to $1,999 | 405 (29.2%) | 167 (26.6%) |
| $2,000 to $2,499 | 100 (7.2%) | 77 (12.3%) |
| $2,500 to $2,999 | 87 (6.3%) | 15 (2.4%) |
| $3,000 or more | 20 (1.4%) | 0 (0.0%) |
| Total | 1,388 (100.0%) | 628 (100.0%) |
Physical Housing Characteristics in Ranson corporation
Housing Structures in Ranson corporation
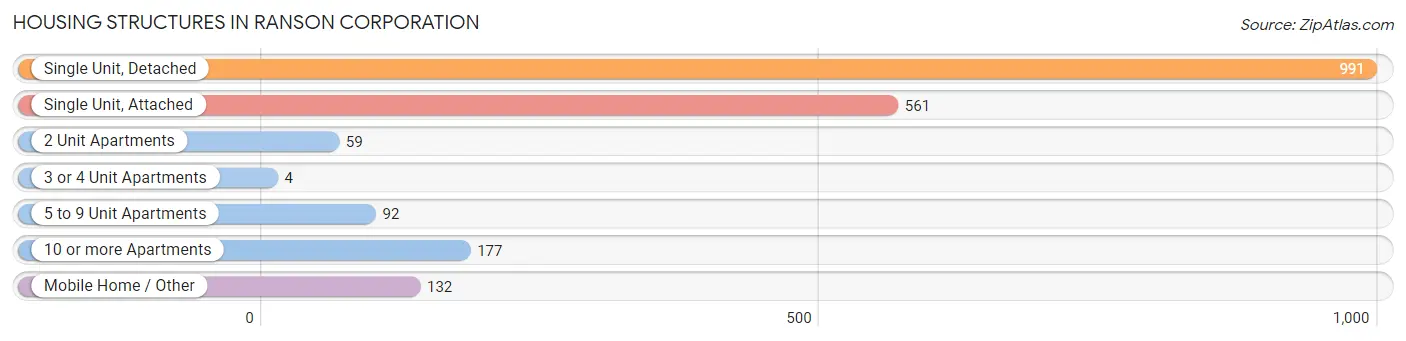
| Structure Type | # Housing Units | % Housing Units |
| Single Unit, Detached | 991 | 49.2% |
| Single Unit, Attached | 561 | 27.8% |
| 2 Unit Apartments | 59 | 2.9% |
| 3 or 4 Unit Apartments | 4 | 0.2% |
| 5 to 9 Unit Apartments | 92 | 4.6% |
| 10 or more Apartments | 177 | 8.8% |
| Mobile Home / Other | 132 | 6.6% |
| Total | 2,016 | 100.0% |
Housing Structures by Occupancy in Ranson corporation
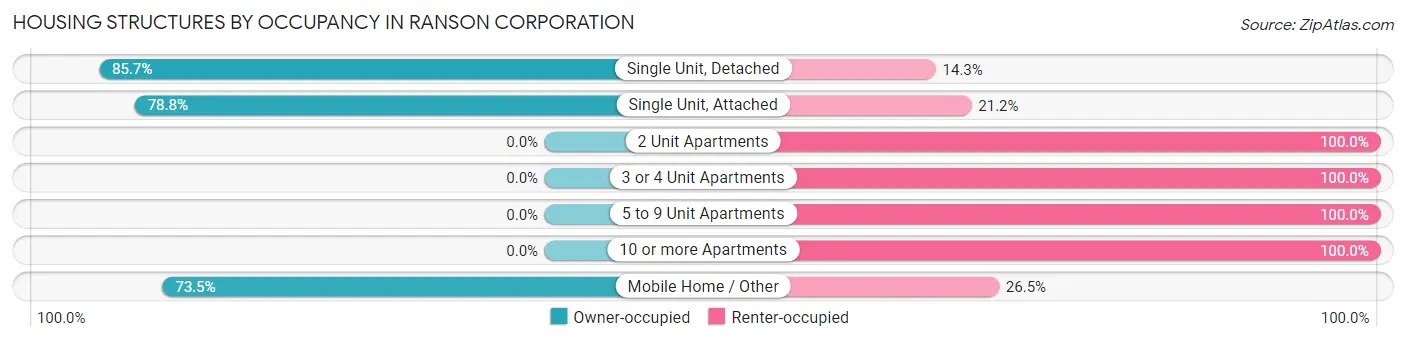
| Structure Type | Owner-occupied | Renter-occupied |
| Single Unit, Detached | 849 (85.7%) | 142 (14.3%) |
| Single Unit, Attached | 442 (78.8%) | 119 (21.2%) |
| 2 Unit Apartments | 0 (0.0%) | 59 (100.0%) |
| 3 or 4 Unit Apartments | 0 (0.0%) | 4 (100.0%) |
| 5 to 9 Unit Apartments | 0 (0.0%) | 92 (100.0%) |
| 10 or more Apartments | 0 (0.0%) | 177 (100.0%) |
| Mobile Home / Other | 97 (73.5%) | 35 (26.5%) |
| Total | 1,388 (68.9%) | 628 (31.1%) |
Housing Structures by Number of Rooms in Ranson corporation
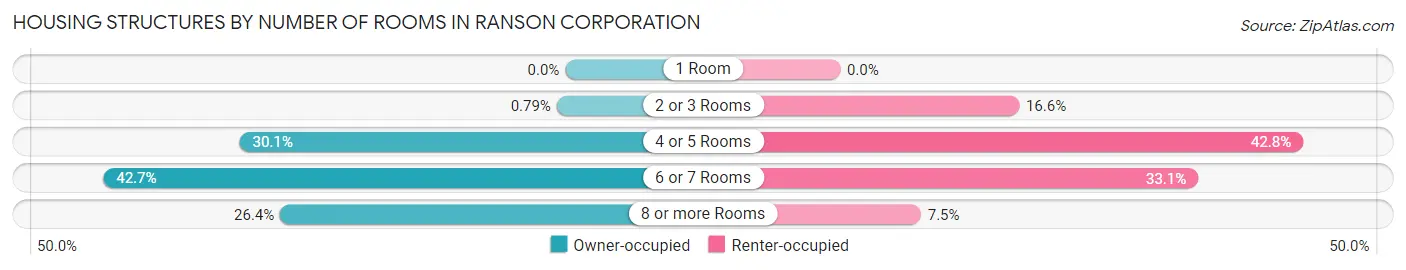
| Number of Rooms | Owner-occupied | Renter-occupied |
| 1 Room | 0 (0.0%) | 0 (0.0%) |
| 2 or 3 Rooms | 11 (0.8%) | 104 (16.6%) |
| 4 or 5 Rooms | 418 (30.1%) | 269 (42.8%) |
| 6 or 7 Rooms | 593 (42.7%) | 208 (33.1%) |
| 8 or more Rooms | 366 (26.4%) | 47 (7.5%) |
| Total | 1,388 (100.0%) | 628 (100.0%) |
Housing Structure by Heating Type in Ranson corporation
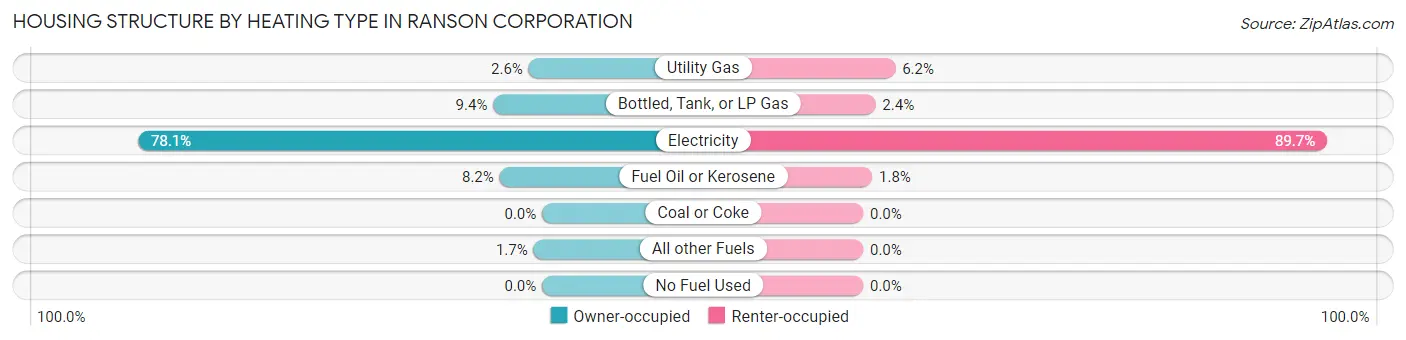
| Heating Type | Owner-occupied | Renter-occupied |
| Utility Gas | 36 (2.6%) | 39 (6.2%) |
| Bottled, Tank, or LP Gas | 131 (9.4%) | 15 (2.4%) |
| Electricity | 1,084 (78.1%) | 563 (89.6%) |
| Fuel Oil or Kerosene | 114 (8.2%) | 11 (1.8%) |
| Coal or Coke | 0 (0.0%) | 0 (0.0%) |
| All other Fuels | 23 (1.7%) | 0 (0.0%) |
| No Fuel Used | 0 (0.0%) | 0 (0.0%) |
| Total | 1,388 (100.0%) | 628 (100.0%) |
Household Vehicle Usage in Ranson corporation
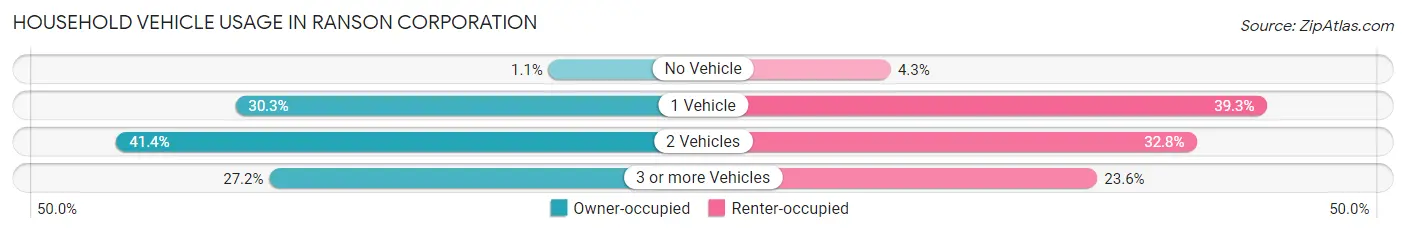
| Vehicles per Household | Owner-occupied | Renter-occupied |
| No Vehicle | 15 (1.1%) | 27 (4.3%) |
| 1 Vehicle | 421 (30.3%) | 247 (39.3%) |
| 2 Vehicles | 575 (41.4%) | 206 (32.8%) |
| 3 or more Vehicles | 377 (27.2%) | 148 (23.6%) |
| Total | 1,388 (100.0%) | 628 (100.0%) |
Real Estate & Mortgages in Ranson corporation
Real Estate and Mortgage Overview in Ranson corporation
| Characteristic | Without Mortgage | With Mortgage |
| Housing Units | 205 | 1,183 |
| Median Property Value | $131,300 | $219,600 |
| Median Household Income | $51,290 | $181 |
| Monthly Housing Costs | $340 | $20 |
| Real Estate Taxes | - | - |
Property Value by Mortgage Status in Ranson corporation
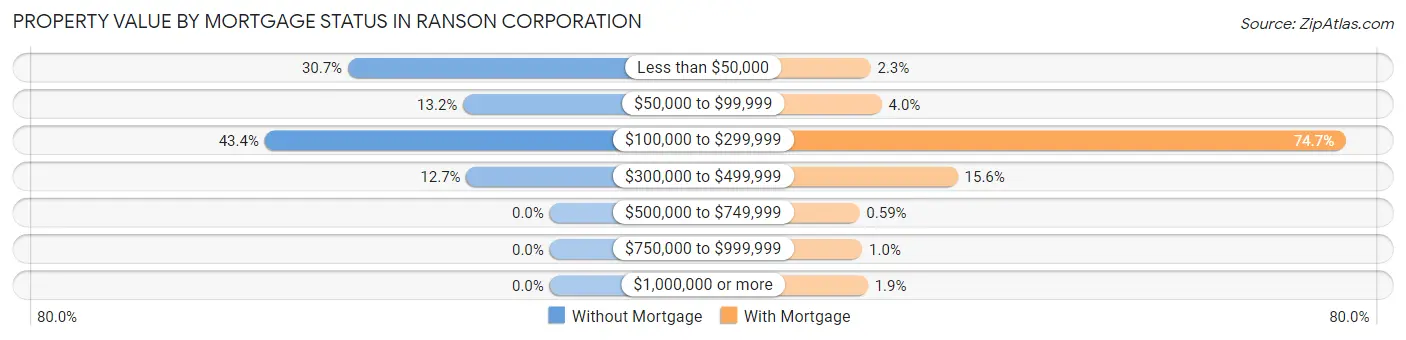
| Property Value | Without Mortgage | With Mortgage |
| Less than $50,000 | 63 (30.7%) | 27 (2.3%) |
| $50,000 to $99,999 | 27 (13.2%) | 47 (4.0%) |
| $100,000 to $299,999 | 89 (43.4%) | 884 (74.7%) |
| $300,000 to $499,999 | 26 (12.7%) | 184 (15.5%) |
| $500,000 to $749,999 | 0 (0.0%) | 7 (0.6%) |
| $750,000 to $999,999 | 0 (0.0%) | 12 (1.0%) |
| $1,000,000 or more | 0 (0.0%) | 22 (1.9%) |
| Total | 205 (100.0%) | 1,183 (100.0%) |
Household Income by Mortgage Status in Ranson corporation
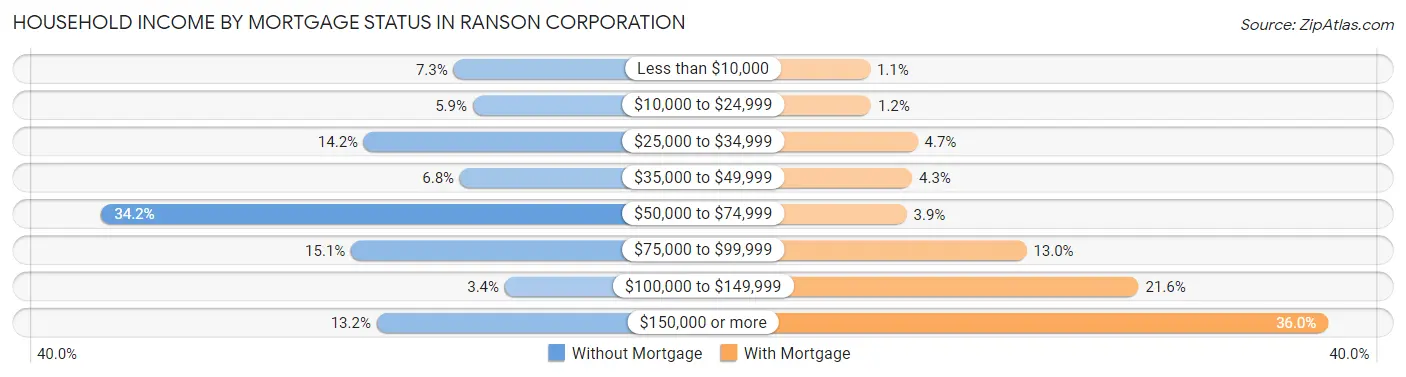
| Household Income | Without Mortgage | With Mortgage |
| Less than $10,000 | 15 (7.3%) | 13 (1.1%) |
| $10,000 to $24,999 | 12 (5.9%) | 14 (1.2%) |
| $25,000 to $34,999 | 29 (14.1%) | 56 (4.7%) |
| $35,000 to $49,999 | 14 (6.8%) | 51 (4.3%) |
| $50,000 to $74,999 | 70 (34.2%) | 46 (3.9%) |
| $75,000 to $99,999 | 31 (15.1%) | 154 (13.0%) |
| $100,000 to $149,999 | 7 (3.4%) | 255 (21.6%) |
| $150,000 or more | 27 (13.2%) | 426 (36.0%) |
| Total | 205 (100.0%) | 1,183 (100.0%) |
Property Value to Household Income Ratio in Ranson corporation
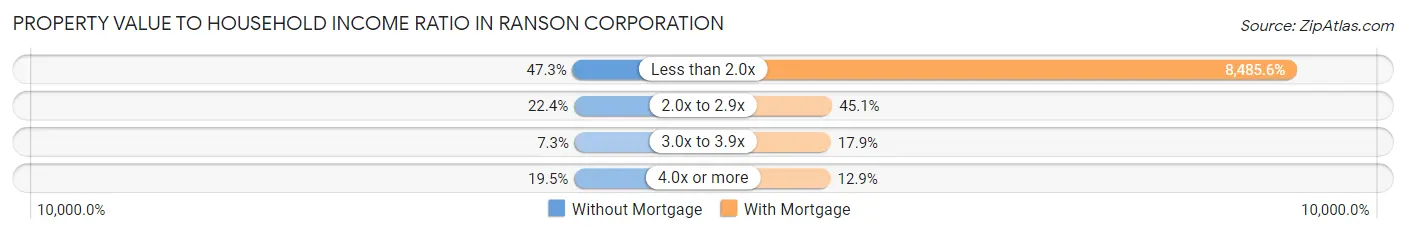
| Value-to-Income Ratio | Without Mortgage | With Mortgage |
| Less than 2.0x | 97 (47.3%) | 100,384 (8,485.6%) |
| 2.0x to 2.9x | 46 (22.4%) | 533 (45.1%) |
| 3.0x to 3.9x | 15 (7.3%) | 212 (17.9%) |
| 4.0x or more | 40 (19.5%) | 152 (12.9%) |
| Total | 205 (100.0%) | 1,183 (100.0%) |
Real Estate Taxes by Mortgage Status in Ranson corporation
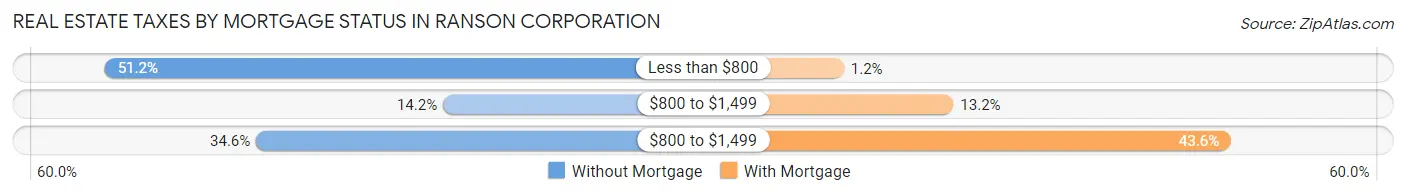
| Property Taxes | Without Mortgage | With Mortgage |
| Less than $800 | 105 (51.2%) | 14 (1.2%) |
| $800 to $1,499 | 29 (14.1%) | 156 (13.2%) |
| $800 to $1,499 | 71 (34.6%) | 516 (43.6%) |
| Total | 205 (100.0%) | 1,183 (100.0%) |
Health & Disability in Ranson corporation
Health Insurance Coverage by Age in Ranson corporation
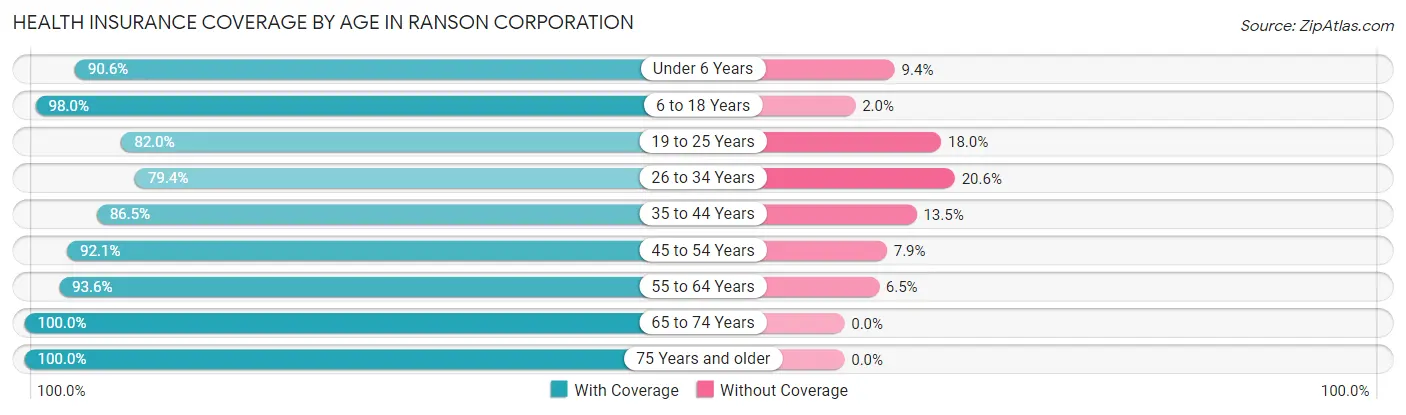
| Age Bracket | With Coverage | Without Coverage |
| Under 6 Years | 463 (90.6%) | 48 (9.4%) |
| 6 to 18 Years | 911 (98.0%) | 19 (2.0%) |
| 19 to 25 Years | 468 (82.0%) | 103 (18.0%) |
| 26 to 34 Years | 617 (79.4%) | 160 (20.6%) |
| 35 to 44 Years | 521 (86.5%) | 81 (13.5%) |
| 45 to 54 Years | 883 (92.1%) | 76 (7.9%) |
| 55 to 64 Years | 377 (93.5%) | 26 (6.5%) |
| 65 to 74 Years | 529 (100.0%) | 0 (0.0%) |
| 75 Years and older | 215 (100.0%) | 0 (0.0%) |
| Total | 4,984 (90.7%) | 513 (9.3%) |
Health Insurance Coverage by Citizenship Status in Ranson corporation
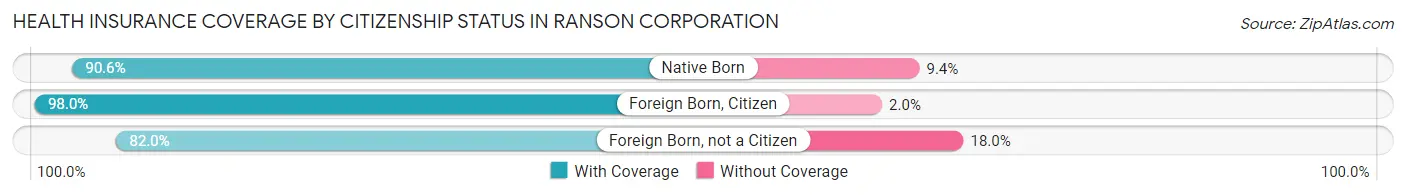
| Citizenship Status | With Coverage | Without Coverage |
| Native Born | 463 (90.6%) | 48 (9.4%) |
| Foreign Born, Citizen | 911 (98.0%) | 19 (2.0%) |
| Foreign Born, not a Citizen | 468 (82.0%) | 103 (18.0%) |
Health Insurance Coverage by Household Income in Ranson corporation
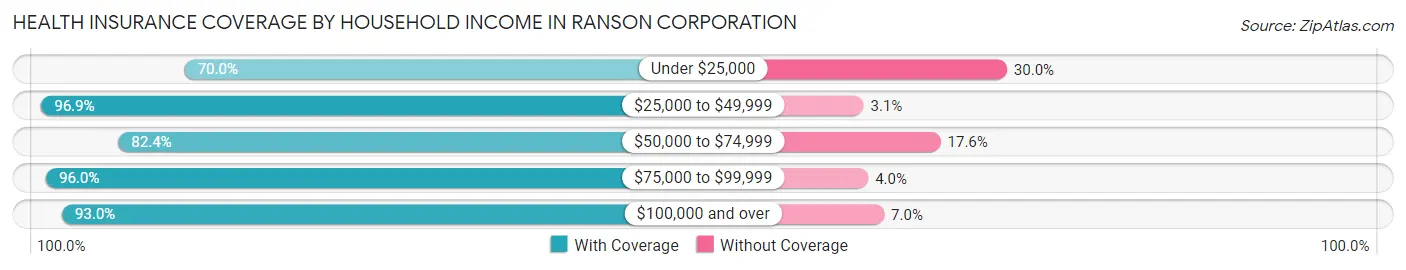
| Household Income | With Coverage | Without Coverage |
| Under $25,000 | 399 (70.0%) | 171 (30.0%) |
| $25,000 to $49,999 | 617 (96.9%) | 20 (3.1%) |
| $50,000 to $74,999 | 464 (82.4%) | 99 (17.6%) |
| $75,000 to $99,999 | 1,218 (96.0%) | 51 (4.0%) |
| $100,000 and over | 2,286 (93.0%) | 172 (7.0%) |
Public vs Private Health Insurance Coverage by Age in Ranson corporation
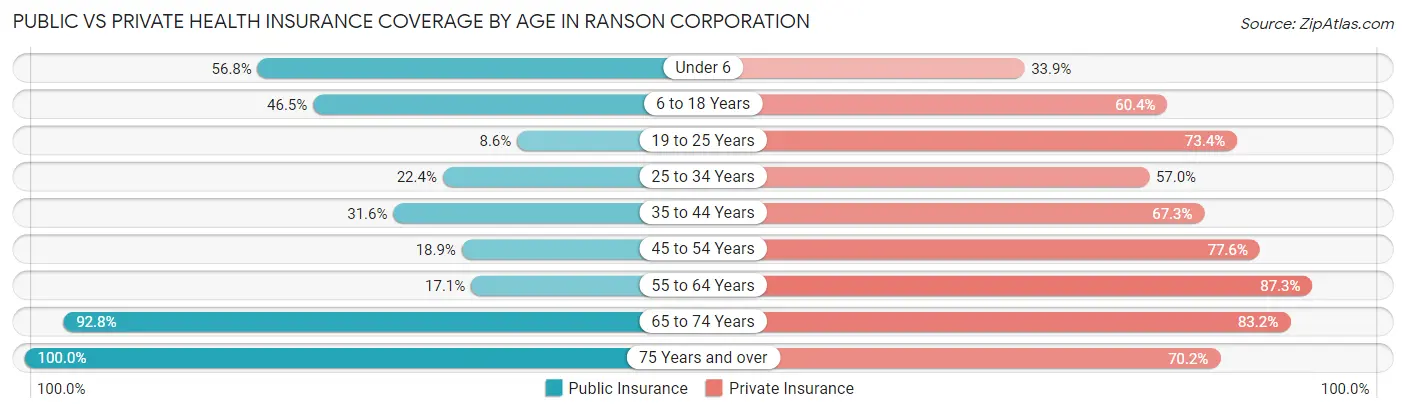
| Age Bracket | Public Insurance | Private Insurance |
| Under 6 | 290 (56.8%) | 173 (33.9%) |
| 6 to 18 Years | 432 (46.5%) | 562 (60.4%) |
| 19 to 25 Years | 49 (8.6%) | 419 (73.4%) |
| 25 to 34 Years | 174 (22.4%) | 443 (57.0%) |
| 35 to 44 Years | 190 (31.6%) | 405 (67.3%) |
| 45 to 54 Years | 181 (18.9%) | 744 (77.6%) |
| 55 to 64 Years | 69 (17.1%) | 352 (87.3%) |
| 65 to 74 Years | 491 (92.8%) | 440 (83.2%) |
| 75 Years and over | 215 (100.0%) | 151 (70.2%) |
| Total | 2,091 (38.0%) | 3,689 (67.1%) |
Disability Status by Sex by Age in Ranson corporation
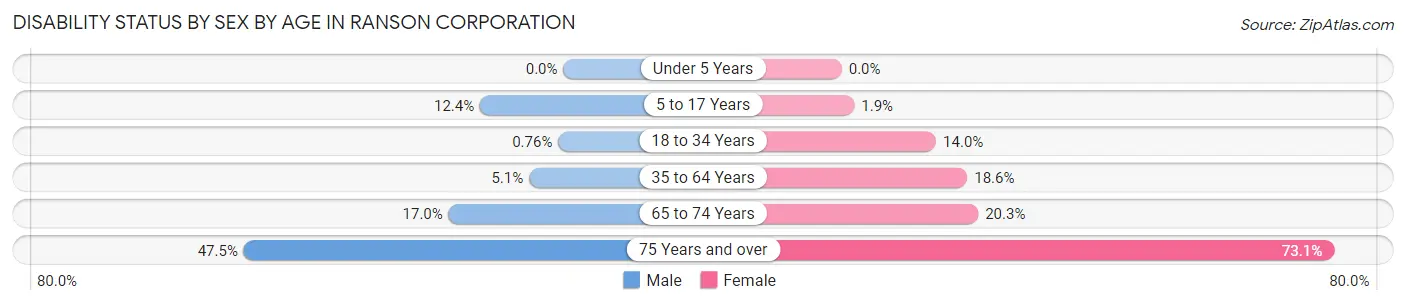
| Age Bracket | Male | Female |
| Under 5 Years | 0 (0.0%) | 0 (0.0%) |
| 5 to 17 Years | 48 (12.4%) | 10 (1.9%) |
| 18 to 34 Years | 5 (0.8%) | 110 (14.0%) |
| 35 to 64 Years | 44 (5.1%) | 205 (18.6%) |
| 65 to 74 Years | 38 (17.0%) | 62 (20.3%) |
| 75 Years and over | 28 (47.5%) | 114 (73.1%) |
Disability Class by Sex by Age in Ranson corporation
Disability Class: Hearing Difficulty
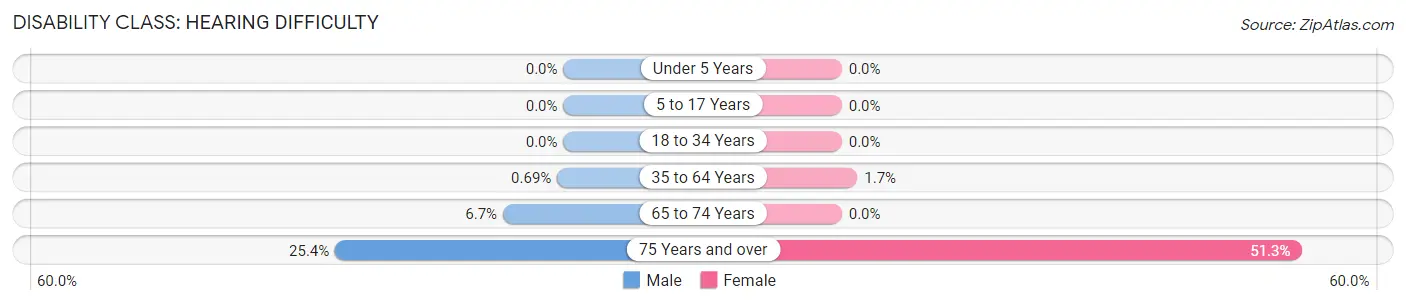
| Age Bracket | Male | Female |
| Under 5 Years | 0 (0.0%) | 0 (0.0%) |
| 5 to 17 Years | 0 (0.0%) | 0 (0.0%) |
| 18 to 34 Years | 0 (0.0%) | 0 (0.0%) |
| 35 to 64 Years | 6 (0.7%) | 19 (1.7%) |
| 65 to 74 Years | 15 (6.7%) | 0 (0.0%) |
| 75 Years and over | 15 (25.4%) | 80 (51.3%) |
Disability Class: Vision Difficulty
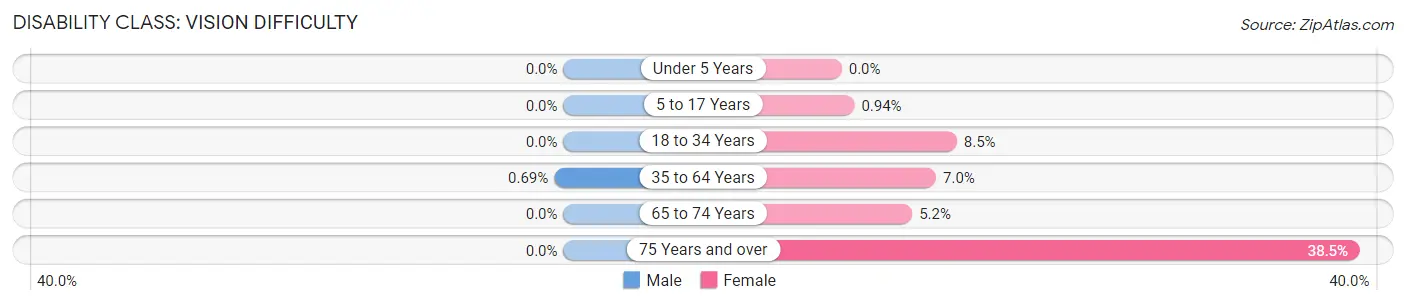
| Age Bracket | Male | Female |
| Under 5 Years | 0 (0.0%) | 0 (0.0%) |
| 5 to 17 Years | 0 (0.0%) | 5 (0.9%) |
| 18 to 34 Years | 0 (0.0%) | 67 (8.5%) |
| 35 to 64 Years | 6 (0.7%) | 77 (7.0%) |
| 65 to 74 Years | 0 (0.0%) | 16 (5.2%) |
| 75 Years and over | 0 (0.0%) | 60 (38.5%) |
Disability Class: Cognitive Difficulty
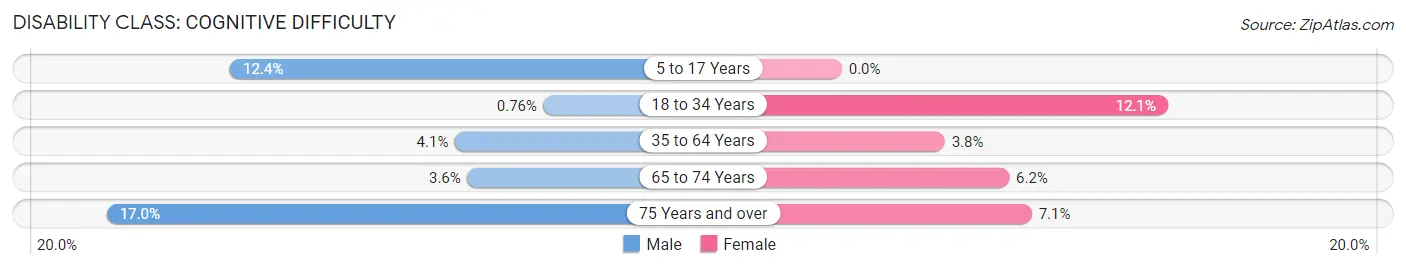
| Age Bracket | Male | Female |
| 5 to 17 Years | 48 (12.4%) | 0 (0.0%) |
| 18 to 34 Years | 5 (0.8%) | 95 (12.1%) |
| 35 to 64 Years | 35 (4.1%) | 42 (3.8%) |
| 65 to 74 Years | 8 (3.6%) | 19 (6.2%) |
| 75 Years and over | 10 (17.0%) | 11 (7.0%) |
Disability Class: Ambulatory Difficulty
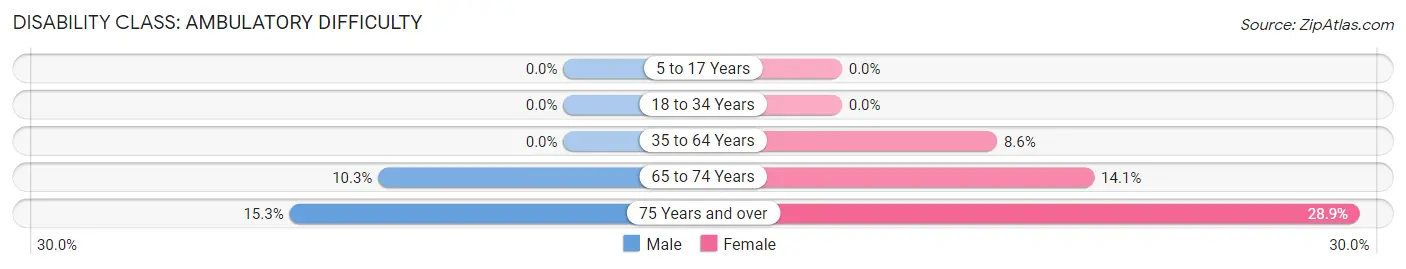
| Age Bracket | Male | Female |
| 5 to 17 Years | 0 (0.0%) | 0 (0.0%) |
| 18 to 34 Years | 0 (0.0%) | 0 (0.0%) |
| 35 to 64 Years | 0 (0.0%) | 95 (8.6%) |
| 65 to 74 Years | 23 (10.3%) | 43 (14.1%) |
| 75 Years and over | 9 (15.2%) | 45 (28.8%) |
Disability Class: Self-Care Difficulty
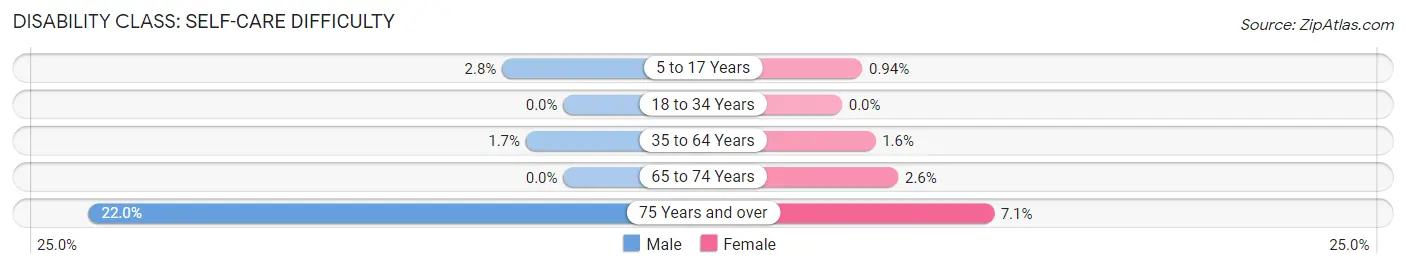
| Age Bracket | Male | Female |
| 5 to 17 Years | 11 (2.8%) | 5 (0.9%) |
| 18 to 34 Years | 0 (0.0%) | 0 (0.0%) |
| 35 to 64 Years | 15 (1.7%) | 17 (1.5%) |
| 65 to 74 Years | 0 (0.0%) | 8 (2.6%) |
| 75 Years and over | 13 (22.0%) | 11 (7.0%) |
Technology Access in Ranson corporation
Computing Device Access in Ranson corporation
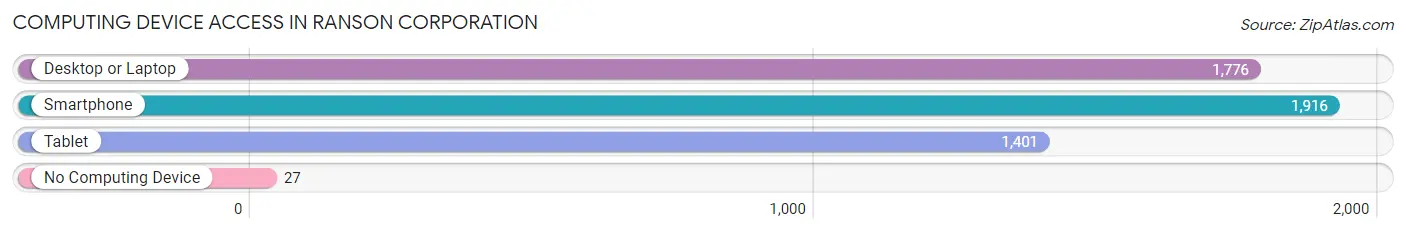
| Device Type | # Households | % Households |
| Desktop or Laptop | 1,776 | 88.1% |
| Smartphone | 1,916 | 95.0% |
| Tablet | 1,401 | 69.5% |
| No Computing Device | 27 | 1.3% |
| Total | 2,016 | 100.0% |
Internet Access in Ranson corporation
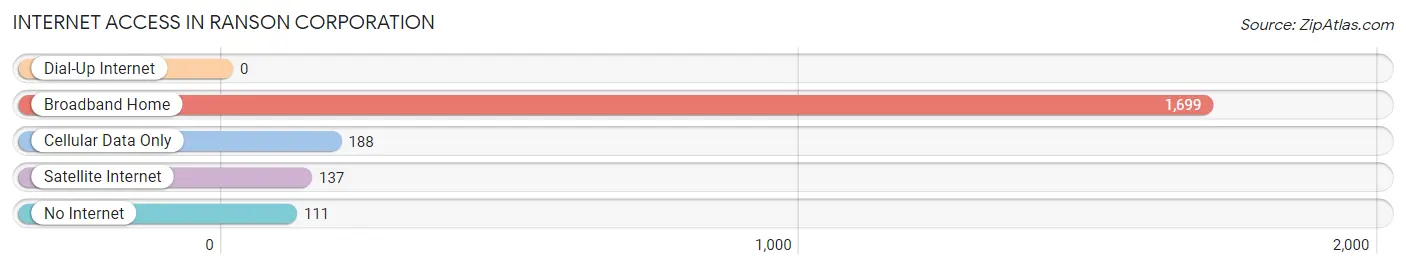
| Internet Type | # Households | % Households |
| Dial-Up Internet | 0 | 0.0% |
| Broadband Home | 1,699 | 84.3% |
| Cellular Data Only | 188 | 9.3% |
| Satellite Internet | 137 | 6.8% |
| No Internet | 111 | 5.5% |
| Total | 2,016 | 100.0% |
Ranson corporation Summary
Ranson Corporation, WV is a small city located in the Eastern Panhandle of West Virginia. It is situated in the heart of the Shenandoah Valley, just a few miles from the Potomac River. The city is home to a population of approximately 5,000 people, and is the county seat of Jefferson County.
History
Ranson Corporation, WV was founded in 1817 by a group of settlers from Pennsylvania. The city was named after the Ranson family, who were among the first settlers in the area. The city was incorporated in 1868, and has since grown to become the largest city in Jefferson County.
Geography
Ranson Corporation, WV is located in the Eastern Panhandle of West Virginia, in the heart of the Shenandoah Valley. The city is situated on the banks of the Potomac River, and is surrounded by rolling hills and lush forests. The city is located approximately 30 miles from Washington, D.C., and is easily accessible by car or train.
Economy
Ranson Corporation, WV is home to a diverse economy. The city is home to a number of manufacturing and industrial businesses, as well as a number of retail stores and restaurants. The city is also home to a number of government offices, including the Jefferson County Courthouse. The city is also home to a number of educational institutions, including the University of Charleston and Shepherd University.
Demographics
As of the 2010 census, the population of Ranson Corporation, WV was 5,000. The racial makeup of the city was 90.2% White, 4.2% African American, 0.3% Native American, 1.2% Asian, and 3.3% from other races. The median household income was $41,943, and the median family income was $50,943. The per capita income was $20,943.
Ranson Corporation, WV is a small city with a rich history and a diverse economy. The city is home to a number of businesses, educational institutions, and government offices, and is easily accessible by car or train. The city is also home to a diverse population, with a median household income of $41,943. Ranson Corporation, WV is a great place to live, work, and play.
Common Questions
What is the Total Population of Ranson corporation?
Total Population of Ranson corporation is 5,497.
What is the Total Male Population of Ranson corporation?
Total Male Population of Ranson corporation is 2,425.
What is the Total Female Population of Ranson corporation?
Total Female Population of Ranson corporation is 3,072.
What is the Ratio of Males per 100 Females in Ranson corporation?
There are 78.94 Males per 100 Females in Ranson corporation.
What is the Ratio of Females per 100 Males in Ranson corporation?
There are 126.68 Females per 100 Males in Ranson corporation.
What is the Median Population Age in Ranson corporation?
Median Population Age in Ranson corporation is 33.9 Years.
What is the Average Family Size in Ranson corporation
Average Family Size in Ranson corporation is 3.2 People.
What is the Average Household Size in Ranson corporation
Average Household Size in Ranson corporation is 2.7 People.
What is Per Capita Income in Ranson corporation?
Per Capita income in Ranson corporation is $33,607.
What is the Median Family Income in Ranson corporation?
Median Family Income in Ranson corporation is $95,766.
What is the Median Household income in Ranson corporation?
Median Household Income in Ranson corporation is $80,242.
What is Income or Wage Gap in Ranson corporation?
Income or Wage Gap in Ranson corporation is 16.8%.
Women in Ranson corporation earn 83.2 cents for every dollar earned by a man.
What is Inequality or Gini Index in Ranson corporation?
Inequality or Gini Index in Ranson corporation is 0.35.
How Large is the Labor Force in Ranson corporation?
There are 3,100 People in the Labor Forcein in Ranson corporation.
What is the Percentage of People in the Labor Force in Ranson corporation?
72.2% of People are in the Labor Force in Ranson corporation.
What is the Unemployment Rate in Ranson corporation?
Unemployment Rate in Ranson corporation is 4.9%.