Clarksburg, WV
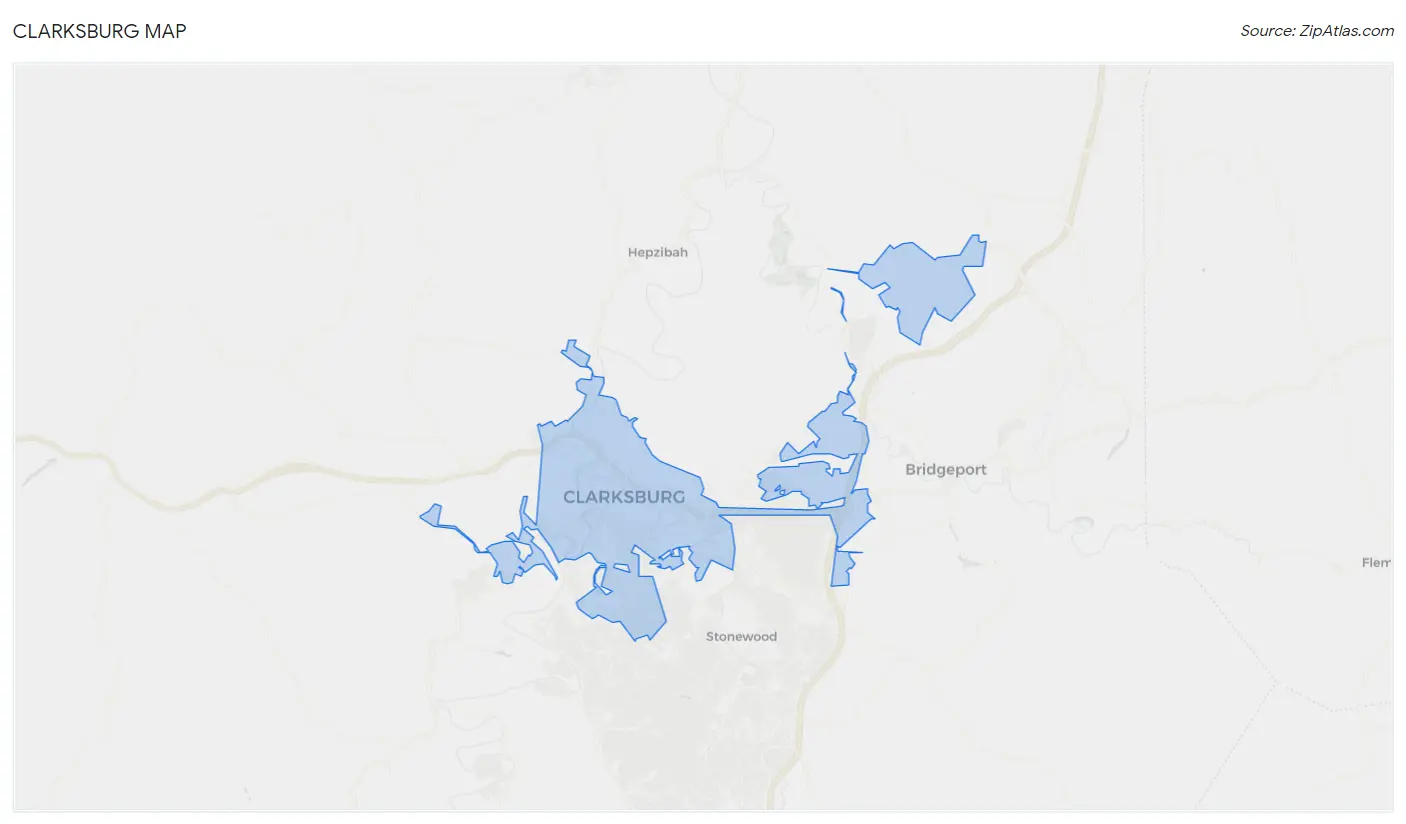
Clarksburg Map
Clarksburg Overview
15,977
TOTAL POPULATION
7,664
MALE POPULATION
8,313
FEMALE POPULATION
92.19
MALES / 100 FEMALES
108.47
FEMALES / 100 MALES
39.7
MEDIAN AGE
3.4
AVG FAMILY SIZE
2.4
AVG HOUSEHOLD SIZE
$26,585
PER CAPITA INCOME
$63,786
AVG FAMILY INCOME
$46,595
AVG HOUSEHOLD INCOME
18.6%
WAGE / INCOME GAP [ % ]
81.4¢/ $1
WAGE / INCOME GAP [ $ ]
$12,808
FAMILY INCOME DEFICIT
0.44
INEQUALITY / GINI INDEX
6,813
LABOR FORCE [ PEOPLE ]
53.5%
PERCENT IN LABOR FORCE
5.9%
UNEMPLOYMENT RATE
Clarksburg Zip Codes
Race in Clarksburg
The most populous races in Clarksburg are White / Caucasian (14,718 | 92.1%), Two or more Races (722 | 4.5%), and Black / African American (402 | 2.5%).
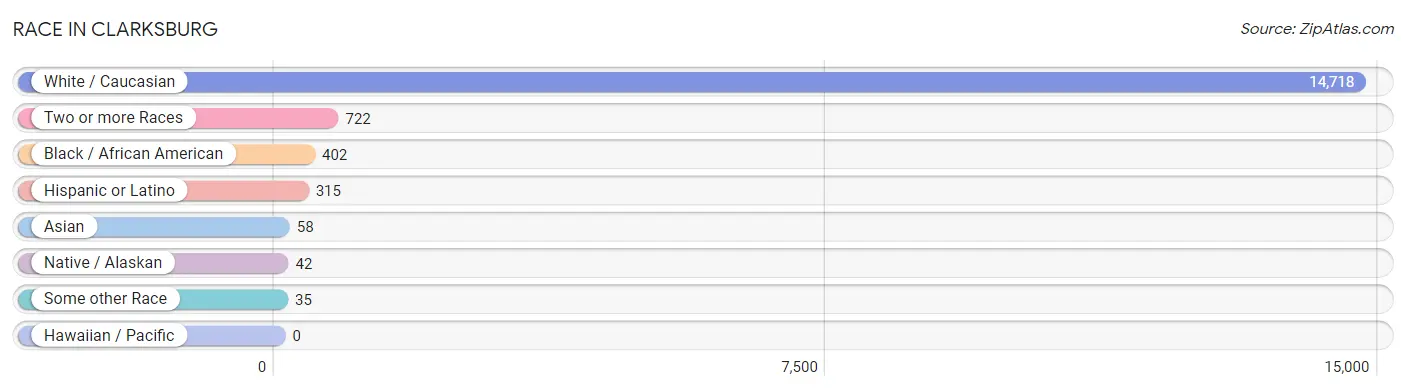
| Race | # Population | % Population |
| Asian | 58 | 0.4% |
| Black / African American | 402 | 2.5% |
| Hawaiian / Pacific | 0 | 0.0% |
| Hispanic or Latino | 315 | 2.0% |
| Native / Alaskan | 42 | 0.3% |
| White / Caucasian | 14,718 | 92.1% |
| Two or more Races | 722 | 4.5% |
| Some other Race | 35 | 0.2% |
| Total | 15,977 | 100.0% |
Ancestry in Clarksburg
The most populous ancestries reported in Clarksburg are German (3,109 | 19.5%), English (2,928 | 18.3%), Irish (2,598 | 16.3%), Italian (1,854 | 11.6%), and American (1,015 | 6.4%), together accounting for 72.0% of all Clarksburg residents.
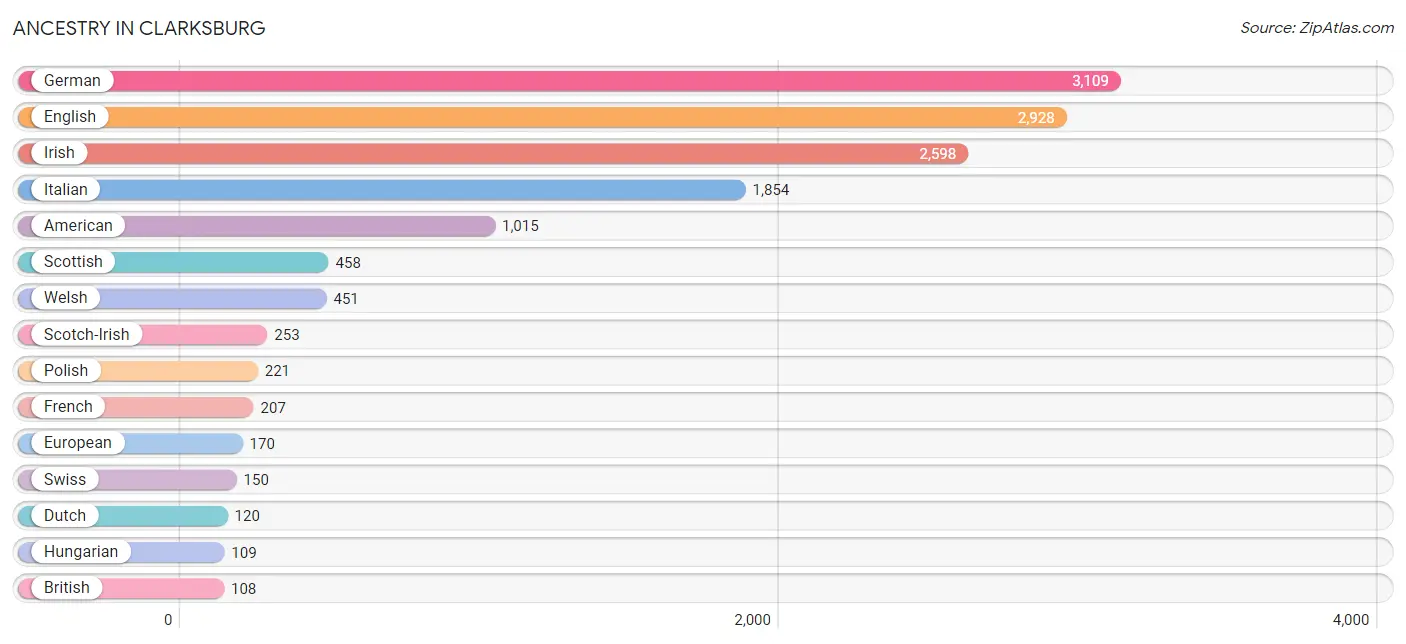
| Ancestry | # Population | % Population |
| African | 35 | 0.2% |
| American | 1,015 | 6.4% |
| Arab | 16 | 0.1% |
| Austrian | 13 | 0.1% |
| Belgian | 11 | 0.1% |
| Bhutanese | 28 | 0.2% |
| Blackfeet | 19 | 0.1% |
| Brazilian | 11 | 0.1% |
| British | 108 | 0.7% |
| Canadian | 46 | 0.3% |
| Central American | 10 | 0.1% |
| Cherokee | 49 | 0.3% |
| Cuban | 5 | 0.0% |
| Czech | 10 | 0.1% |
| Czechoslovakian | 38 | 0.2% |
| Dutch | 120 | 0.7% |
| Eastern European | 26 | 0.2% |
| English | 2,928 | 18.3% |
| European | 170 | 1.1% |
| French | 207 | 1.3% |
| French Canadian | 33 | 0.2% |
| German | 3,109 | 19.5% |
| Greek | 31 | 0.2% |
| Guatemalan | 10 | 0.1% |
| Hungarian | 109 | 0.7% |
| Indian (Asian) | 13 | 0.1% |
| Irish | 2,598 | 16.3% |
| Italian | 1,854 | 11.6% |
| Jamaican | 8 | 0.1% |
| Korean | 23 | 0.1% |
| Lebanese | 16 | 0.1% |
| Mexican | 98 | 0.6% |
| Mexican American Indian | 18 | 0.1% |
| Northern European | 10 | 0.1% |
| Norwegian | 12 | 0.1% |
| Polish | 221 | 1.4% |
| Puerto Rican | 86 | 0.5% |
| Russian | 13 | 0.1% |
| Samoan | 98 | 0.6% |
| Scotch-Irish | 253 | 1.6% |
| Scottish | 458 | 2.9% |
| Slavic | 4 | 0.0% |
| Slovak | 69 | 0.4% |
| Slovene | 67 | 0.4% |
| Spaniard | 7 | 0.0% |
| Spanish | 102 | 0.6% |
| Sri Lankan | 10 | 0.1% |
| Subsaharan African | 35 | 0.2% |
| Swedish | 15 | 0.1% |
| Swiss | 150 | 0.9% |
| Ukrainian | 82 | 0.5% |
| Welsh | 451 | 2.8% |
| Yugoslavian | 90 | 0.6% | View All 53 Rows |
Immigrants in Clarksburg
The most numerous immigrant groups reported in Clarksburg came from Europe (32 | 0.2%), Asia (21 | 0.1%), Italy (19 | 0.1%), Southern Europe (19 | 0.1%), and Northern Europe (13 | 0.1%), together accounting for 0.6% of all Clarksburg residents.
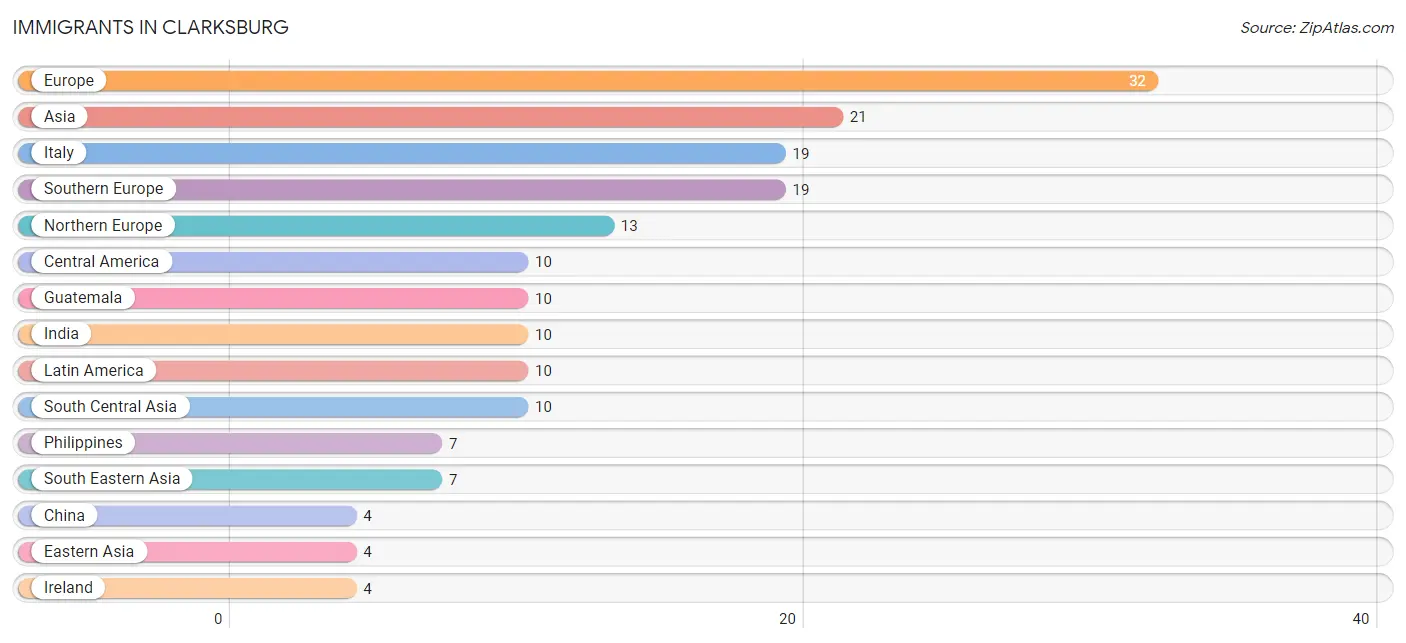
| Immigration Origin | # Population | % Population |
| Asia | 21 | 0.1% |
| Central America | 10 | 0.1% |
| China | 4 | 0.0% |
| Eastern Asia | 4 | 0.0% |
| Europe | 32 | 0.2% |
| Guatemala | 10 | 0.1% |
| India | 10 | 0.1% |
| Ireland | 4 | 0.0% |
| Italy | 19 | 0.1% |
| Latin America | 10 | 0.1% |
| Northern Europe | 13 | 0.1% |
| Philippines | 7 | 0.0% |
| South Central Asia | 10 | 0.1% |
| South Eastern Asia | 7 | 0.0% |
| Southern Europe | 19 | 0.1% | View All 15 Rows |
Sex and Age in Clarksburg
Sex and Age in Clarksburg
The most populous age groups in Clarksburg are 60 to 64 Years (672 | 8.8%) for men and 60 to 64 Years (769 | 9.2%) for women.
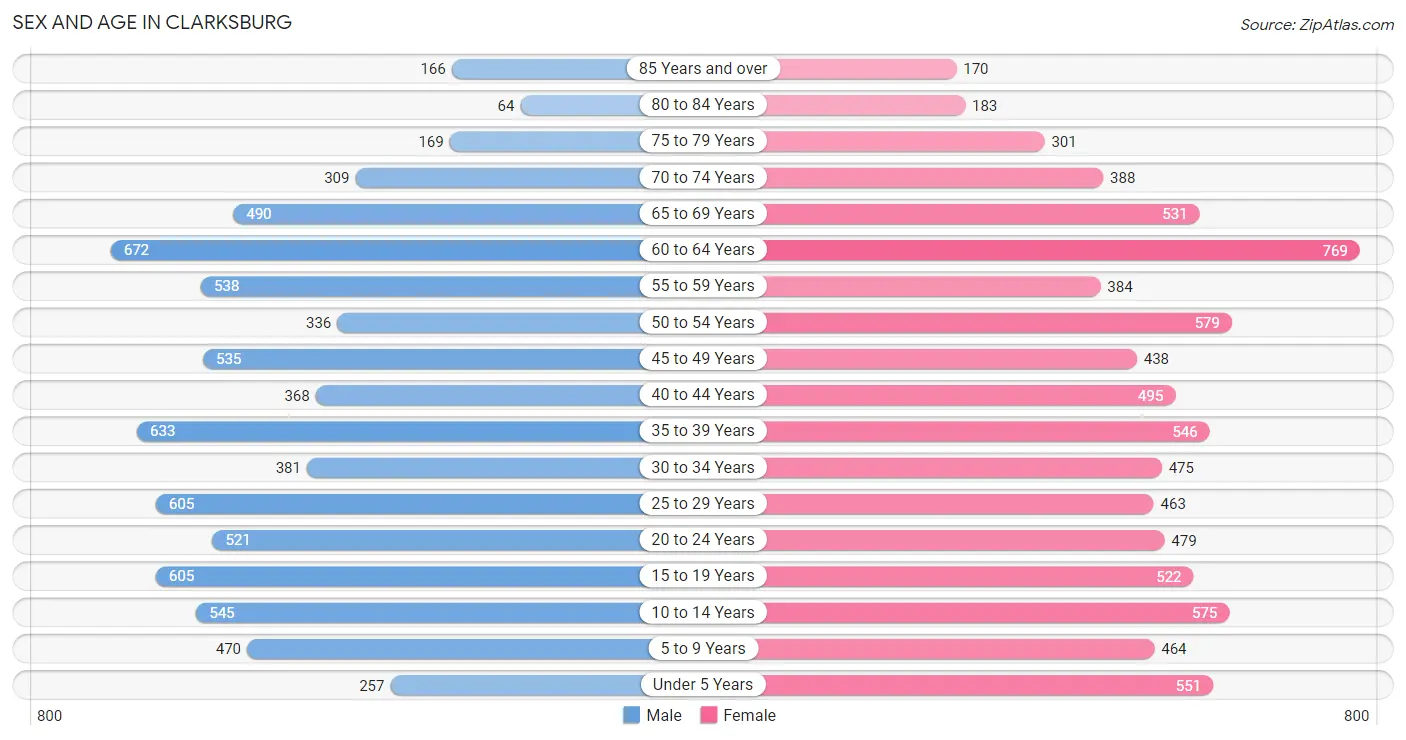
| Age Bracket | Male | Female |
| Under 5 Years | 257 (3.4%) | 551 (6.6%) |
| 5 to 9 Years | 470 (6.1%) | 464 (5.6%) |
| 10 to 14 Years | 545 (7.1%) | 575 (6.9%) |
| 15 to 19 Years | 605 (7.9%) | 522 (6.3%) |
| 20 to 24 Years | 521 (6.8%) | 479 (5.8%) |
| 25 to 29 Years | 605 (7.9%) | 463 (5.6%) |
| 30 to 34 Years | 381 (5.0%) | 475 (5.7%) |
| 35 to 39 Years | 633 (8.3%) | 546 (6.6%) |
| 40 to 44 Years | 368 (4.8%) | 495 (5.9%) |
| 45 to 49 Years | 535 (7.0%) | 438 (5.3%) |
| 50 to 54 Years | 336 (4.4%) | 579 (7.0%) |
| 55 to 59 Years | 538 (7.0%) | 384 (4.6%) |
| 60 to 64 Years | 672 (8.8%) | 769 (9.2%) |
| 65 to 69 Years | 490 (6.4%) | 531 (6.4%) |
| 70 to 74 Years | 309 (4.0%) | 388 (4.7%) |
| 75 to 79 Years | 169 (2.2%) | 301 (3.6%) |
| 80 to 84 Years | 64 (0.8%) | 183 (2.2%) |
| 85 Years and over | 166 (2.2%) | 170 (2.0%) |
| Total | 7,664 (100.0%) | 8,313 (100.0%) |
Families and Households in Clarksburg
Median Family Size in Clarksburg
The median family size in Clarksburg is 3.36 persons per family, with single female/mother families (795 | 23.1%) accounting for the largest median family size of 3.68 persons per family. On the other hand, single male/father families (297 | 8.6%) represent the smallest median family size with 2.76 persons per family.
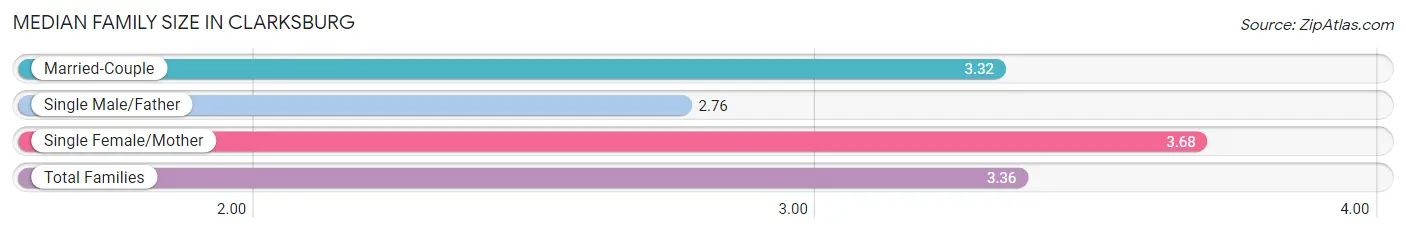
| Family Type | # Families | Family Size |
| Married-Couple | 2,355 (68.3%) | 3.32 |
| Single Male/Father | 297 (8.6%) | 2.76 |
| Single Female/Mother | 795 (23.1%) | 3.68 |
| Total Families | 3,447 (100.0%) | 3.36 |
Median Household Size in Clarksburg
The median household size in Clarksburg is 2.36 persons per household, with single female/mother households (795 | 11.9%) accounting for the largest median household size of 4.08 persons per household. non-family households (3,203 | 48.2%) represent the smallest median household size with 1.16 persons per household.
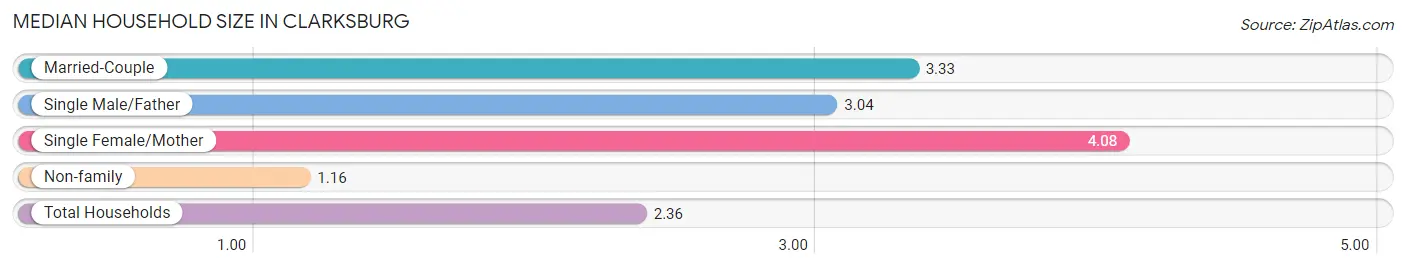
| Household Type | # Households | Household Size |
| Married-Couple | 2,355 (35.4%) | 3.33 |
| Single Male/Father | 297 (4.5%) | 3.04 |
| Single Female/Mother | 795 (11.9%) | 4.08 |
| Non-family | 3,203 (48.2%) | 1.16 |
| Total Households | 6,650 (100.0%) | 2.36 |
Household Size by Marriage Status in Clarksburg
Out of a total of 6,650 households in Clarksburg, 3,447 (51.8%) are family households, while 3,203 (48.2%) are nonfamily households. The most numerous type of family households are 2-person households, comprising 1,601, and the most common type of nonfamily households are 1-person households, comprising 2,839.
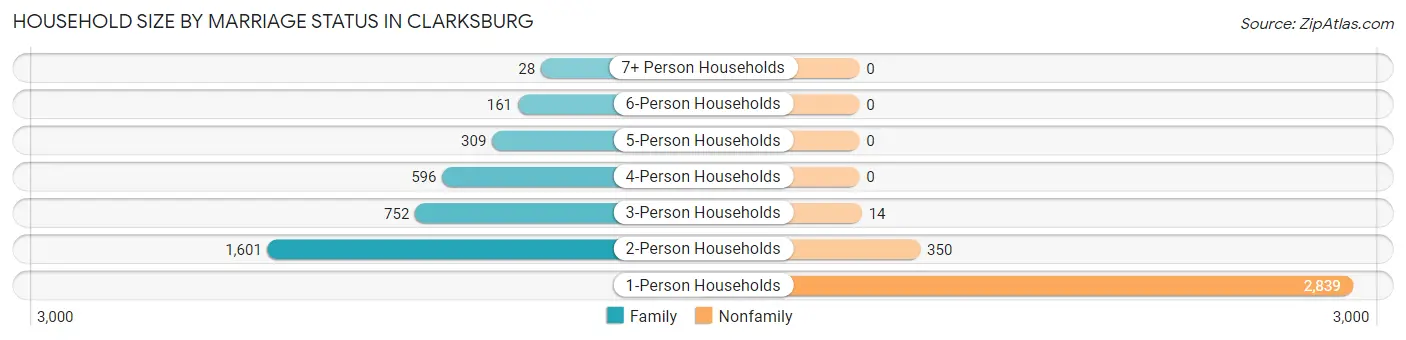
| Household Size | Family Households | Nonfamily Households |
| 1-Person Households | - | 2,839 (42.7%) |
| 2-Person Households | 1,601 (24.1%) | 350 (5.3%) |
| 3-Person Households | 752 (11.3%) | 14 (0.2%) |
| 4-Person Households | 596 (9.0%) | 0 (0.0%) |
| 5-Person Households | 309 (4.6%) | 0 (0.0%) |
| 6-Person Households | 161 (2.4%) | 0 (0.0%) |
| 7+ Person Households | 28 (0.4%) | 0 (0.0%) |
| Total | 3,447 (51.8%) | 3,203 (48.2%) |
Female Fertility in Clarksburg
Fertility by Age in Clarksburg
Average fertility rate in Clarksburg is 26.0 births per 1,000 women. Women in the age bracket of 20 to 34 years have the highest fertility rate with 59.0 births per 1,000 women. Women in the age bracket of 20 to 34 years acount for 89.4% of all women with births.
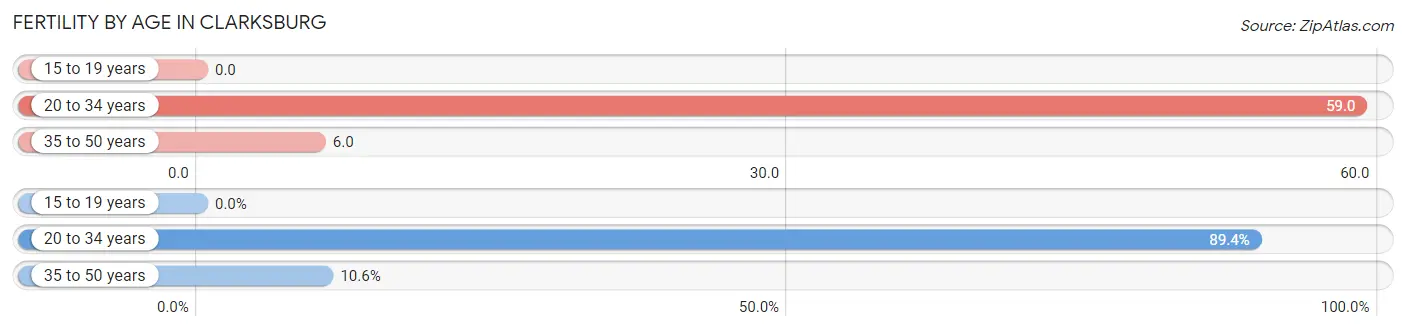
| Age Bracket | Women with Births | Births / 1,000 Women |
| 15 to 19 years | 0 (0.0%) | 0.0 |
| 20 to 34 years | 84 (89.4%) | 59.0 |
| 35 to 50 years | 10 (10.6%) | 6.0 |
| Total | 94 (100.0%) | 26.0 |
Fertility by Age by Marriage Status in Clarksburg
89.4% of women with births (94) in Clarksburg are married. The highest percentage of unmarried women with births falls into 20 to 34 years age bracket with 11.9% of them unmarried at the time of birth, while the lowest percentage of unmarried women with births belong to 35 to 50 years age bracket with 0.0% of them unmarried.
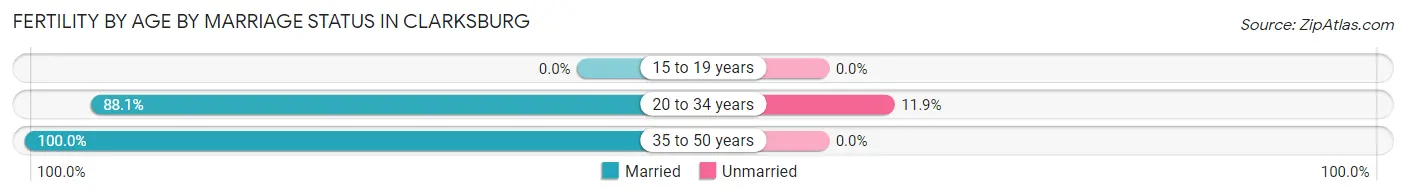
| Age Bracket | Married | Unmarried |
| 15 to 19 years | 0 (0.0%) | 0 (0.0%) |
| 20 to 34 years | 74 (88.1%) | 10 (11.9%) |
| 35 to 50 years | 10 (100.0%) | 0 (0.0%) |
| Total | 84 (89.4%) | 10 (10.6%) |
Fertility by Education in Clarksburg
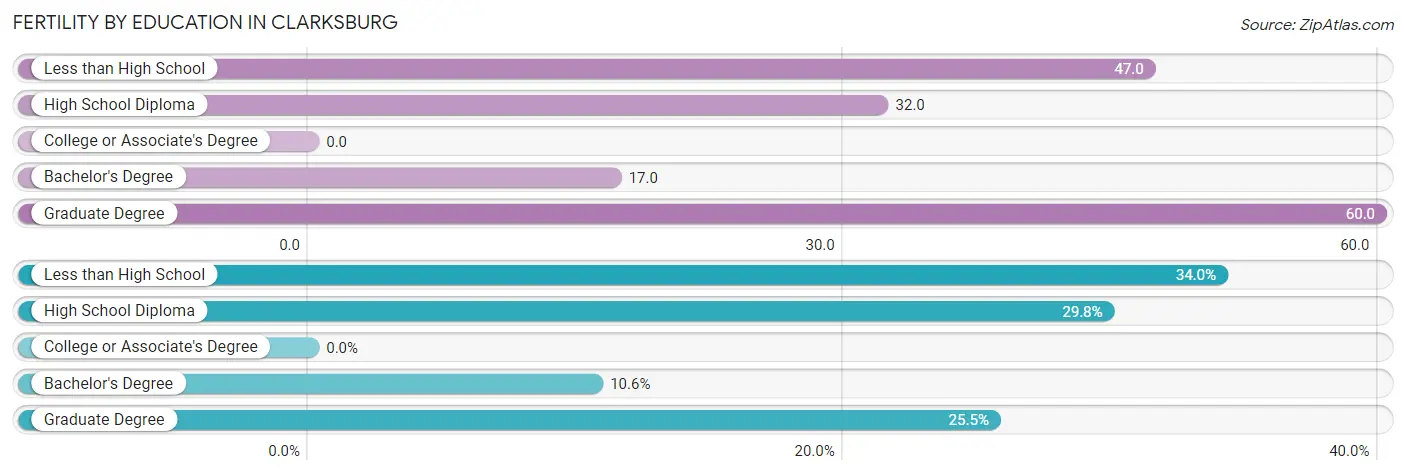
| Educational Attainment | Women with Births | Births / 1,000 Women |
| Less than High School | 32 (34.0%) | 47.0 |
| High School Diploma | 28 (29.8%) | 32.0 |
| College or Associate's Degree | 0 (0.0%) | 0.0 |
| Bachelor's Degree | 10 (10.6%) | 17.0 |
| Graduate Degree | 24 (25.5%) | 60.0 |
| Total | 94 (100.0%) | 26.0 |
Fertility by Education by Marriage Status in Clarksburg
10.6% of women with births in Clarksburg are unmarried. Women with the educational attainment of less than high school are most likely to be married with 100.0% of them married at childbirth, while women with the educational attainment of bachelor's degree are least likely to be married with 100.0% of them unmarried at childbirth.
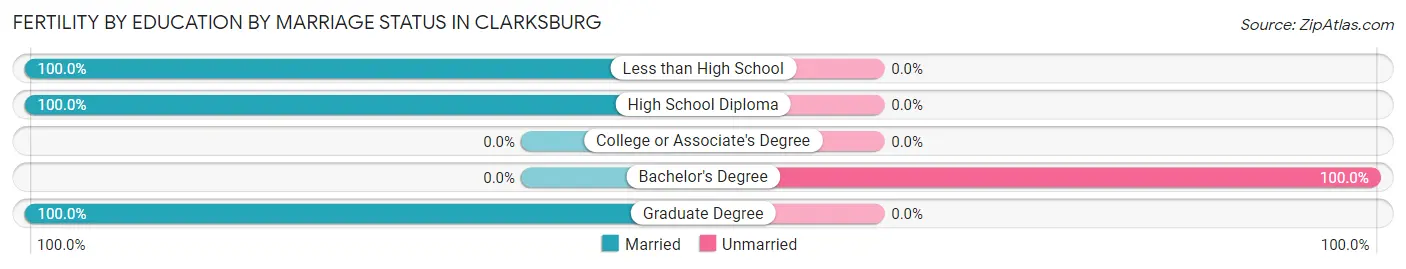
| Educational Attainment | Married | Unmarried |
| Less than High School | 32 (100.0%) | 0 (0.0%) |
| High School Diploma | 28 (100.0%) | 0 (0.0%) |
| College or Associate's Degree | 0 (0.0%) | 0 (0.0%) |
| Bachelor's Degree | 0 (0.0%) | 10 (100.0%) |
| Graduate Degree | 24 (100.0%) | 0 (0.0%) |
| Total | 84 (89.4%) | 10 (10.6%) |
Income in Clarksburg
Income Overview in Clarksburg
Per Capita Income in Clarksburg is $26,585, while median incomes of families and households are $63,786 and $46,595 respectively.
| Characteristic | Number | Measure |
| Per Capita Income | 15,977 | $26,585 |
| Median Family Income | 3,447 | $63,786 |
| Mean Family Income | 3,447 | $73,766 |
| Median Household Income | 6,650 | $46,595 |
| Mean Household Income | 6,650 | $60,232 |
| Income Deficit | 3,447 | $12,808 |
| Wage / Income Gap (%) | 15,977 | 18.56% |
| Wage / Income Gap ($) | 15,977 | 81.44¢ per $1 |
| Gini / Inequality Index | 15,977 | 0.44 |
Earnings by Sex in Clarksburg
Average Earnings in Clarksburg are $31,763, $34,620 for men and $28,196 for women, a difference of 18.6%.
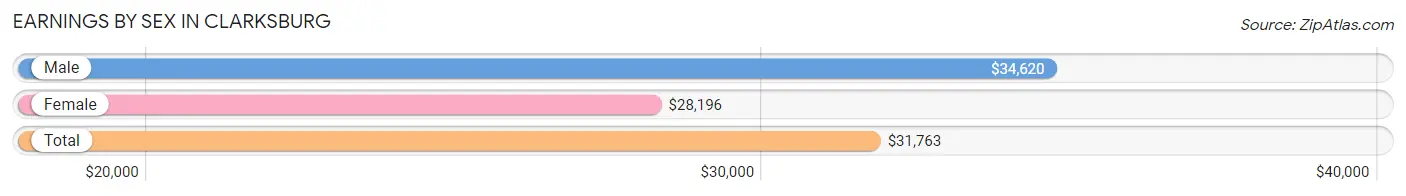
| Sex | Number | Average Earnings |
| Male | 3,904 (53.2%) | $34,620 |
| Female | 3,440 (46.8%) | $28,196 |
| Total | 7,344 (100.0%) | $31,763 |
Earnings by Sex by Income Bracket in Clarksburg
The most common earnings brackets in Clarksburg are $75,000 to $99,999 for men (341 | 8.7%) and $30,000 to $34,999 for women (327 | 9.5%).
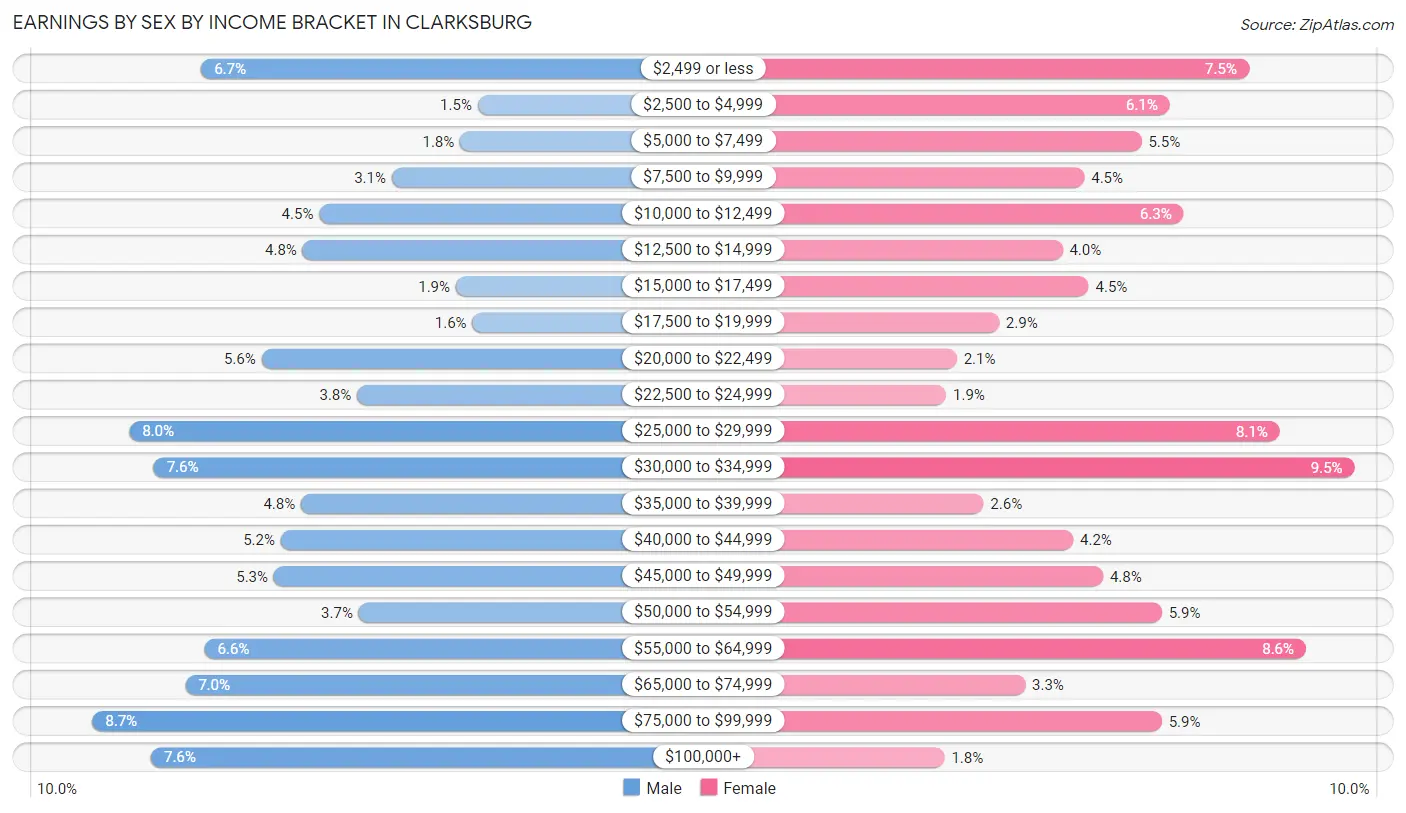
| Income | Male | Female |
| $2,499 or less | 261 (6.7%) | 259 (7.5%) |
| $2,500 to $4,999 | 59 (1.5%) | 208 (6.0%) |
| $5,000 to $7,499 | 72 (1.8%) | 190 (5.5%) |
| $7,500 to $9,999 | 122 (3.1%) | 153 (4.4%) |
| $10,000 to $12,499 | 175 (4.5%) | 217 (6.3%) |
| $12,500 to $14,999 | 187 (4.8%) | 139 (4.0%) |
| $15,000 to $17,499 | 75 (1.9%) | 156 (4.5%) |
| $17,500 to $19,999 | 63 (1.6%) | 98 (2.9%) |
| $20,000 to $22,499 | 217 (5.6%) | 71 (2.1%) |
| $22,500 to $24,999 | 147 (3.8%) | 64 (1.9%) |
| $25,000 to $29,999 | 314 (8.0%) | 279 (8.1%) |
| $30,000 to $34,999 | 296 (7.6%) | 327 (9.5%) |
| $35,000 to $39,999 | 188 (4.8%) | 88 (2.6%) |
| $40,000 to $44,999 | 203 (5.2%) | 146 (4.2%) |
| $45,000 to $49,999 | 208 (5.3%) | 165 (4.8%) |
| $50,000 to $54,999 | 146 (3.7%) | 203 (5.9%) |
| $55,000 to $64,999 | 259 (6.6%) | 296 (8.6%) |
| $65,000 to $74,999 | 273 (7.0%) | 115 (3.3%) |
| $75,000 to $99,999 | 341 (8.7%) | 203 (5.9%) |
| $100,000+ | 298 (7.6%) | 63 (1.8%) |
| Total | 3,904 (100.0%) | 3,440 (100.0%) |
Earnings by Sex by Educational Attainment in Clarksburg
Average earnings in Clarksburg are $40,344 for men and $31,875 for women, a difference of 21.0%. Men with an educational attainment of graduate degree enjoy the highest average annual earnings of $59,479, while those with less than high school education earn the least with $21,127. Women with an educational attainment of graduate degree earn the most with the average annual earnings of $54,593, while those with high school diploma education have the smallest earnings of $20,381.
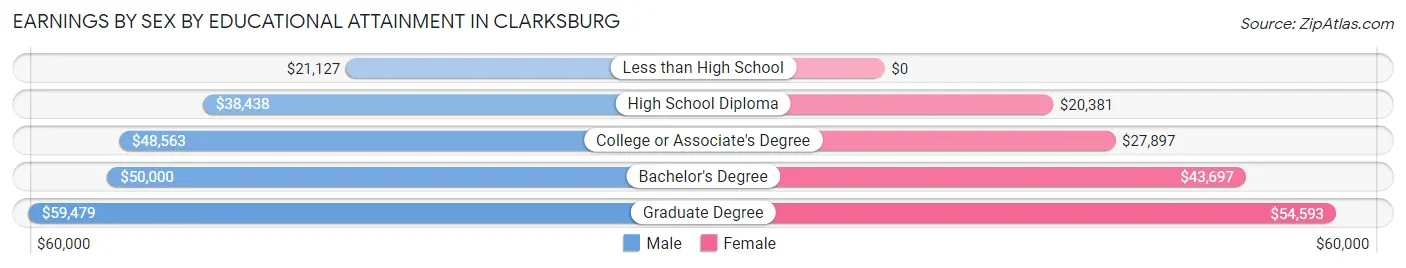
| Educational Attainment | Male Income | Female Income |
| Less than High School | $21,127 | $0 |
| High School Diploma | $38,438 | $20,381 |
| College or Associate's Degree | $48,563 | $27,897 |
| Bachelor's Degree | $50,000 | $43,697 |
| Graduate Degree | $59,479 | $54,593 |
| Total | $40,344 | $31,875 |
Family Income in Clarksburg
Family Income Brackets in Clarksburg
According to the Clarksburg family income data, there are 683 families falling into the $100,000 to $149,999 income range, which is the most common income bracket and makes up 19.8% of all families. Conversely, the $10,000 to $14,999 income bracket is the least frequent group with only 52 families (1.5%) belonging to this category.
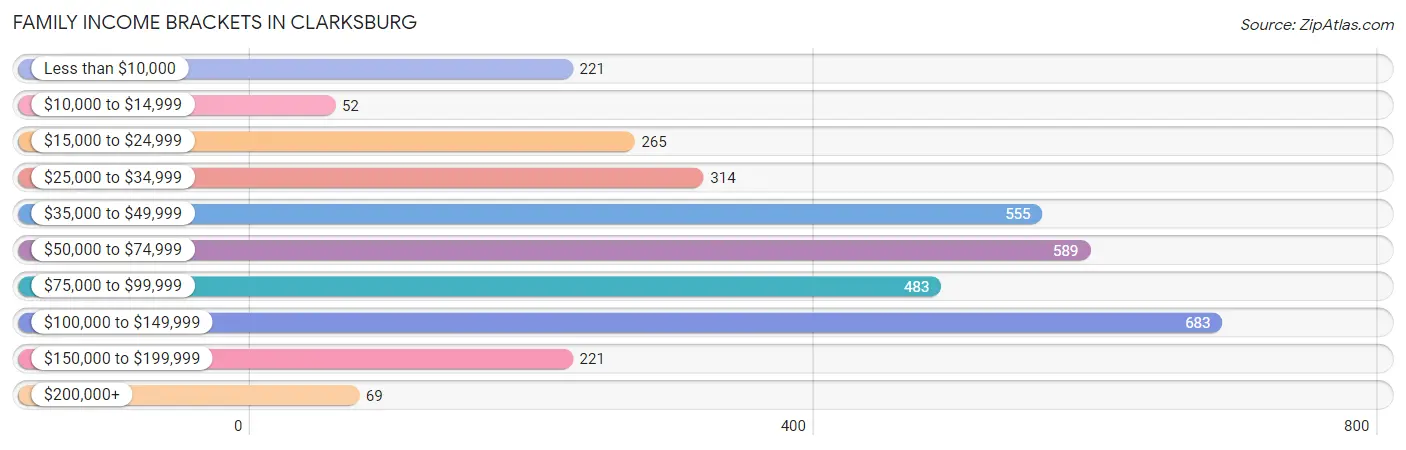
| Income Bracket | # Families | % Families |
| Less than $10,000 | 221 | 6.4% |
| $10,000 to $14,999 | 52 | 1.5% |
| $15,000 to $24,999 | 265 | 7.7% |
| $25,000 to $34,999 | 314 | 9.1% |
| $35,000 to $49,999 | 555 | 16.1% |
| $50,000 to $74,999 | 589 | 17.1% |
| $75,000 to $99,999 | 483 | 14.0% |
| $100,000 to $149,999 | 683 | 19.8% |
| $150,000 to $199,999 | 221 | 6.4% |
| $200,000+ | 69 | 2.0% |
Family Income by Famaliy Size in Clarksburg
4-person families (553 | 16.0%) account for the highest median family income in Clarksburg with $98,250 per family, while 3-person families (662 | 19.2%) have the highest median income of $27,059 per family member.
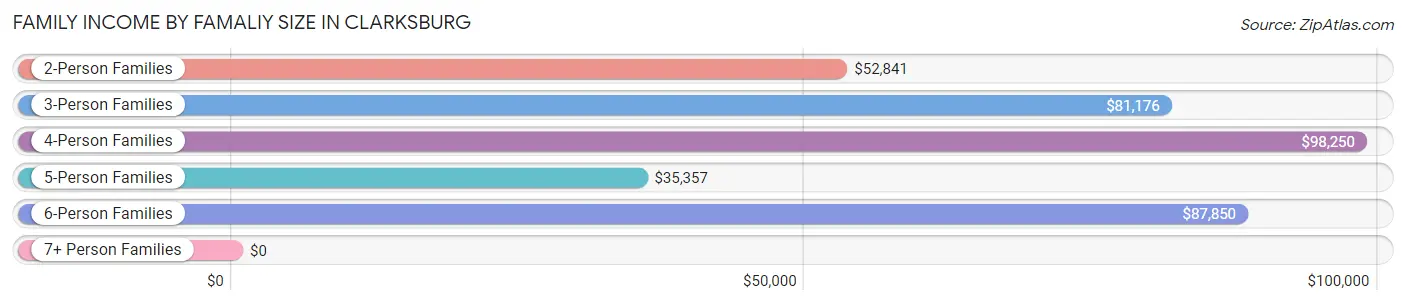
| Income Bracket | # Families | Median Income |
| 2-Person Families | 1,763 (51.1%) | $52,841 |
| 3-Person Families | 662 (19.2%) | $81,176 |
| 4-Person Families | 553 (16.0%) | $98,250 |
| 5-Person Families | 352 (10.2%) | $35,357 |
| 6-Person Families | 89 (2.6%) | $87,850 |
| 7+ Person Families | 28 (0.8%) | $0 |
| Total | 3,447 (100.0%) | $63,786 |
Family Income by Number of Earners in Clarksburg
The median family income in Clarksburg is $63,786, with families comprising 3+ earners (227) having the highest median family income of $98,155, while families with no earners (746) have the lowest median family income of $37,500, accounting for 6.6% and 21.6% of families, respectively.
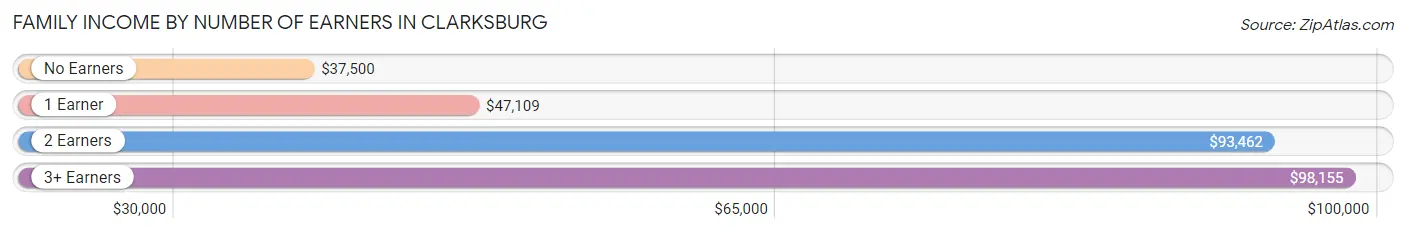
| Number of Earners | # Families | Median Income |
| No Earners | 746 (21.6%) | $37,500 |
| 1 Earner | 1,144 (33.2%) | $47,109 |
| 2 Earners | 1,330 (38.6%) | $93,462 |
| 3+ Earners | 227 (6.6%) | $98,155 |
| Total | 3,447 (100.0%) | $63,786 |
Household Income in Clarksburg
Household Income Brackets in Clarksburg
With 1,230 households falling in the category, the $50,000 to $74,999 income range is the most frequent in Clarksburg, accounting for 18.5% of all households. In contrast, only 86 households (1.3%) fall into the $200,000+ income bracket, making it the least populous group.
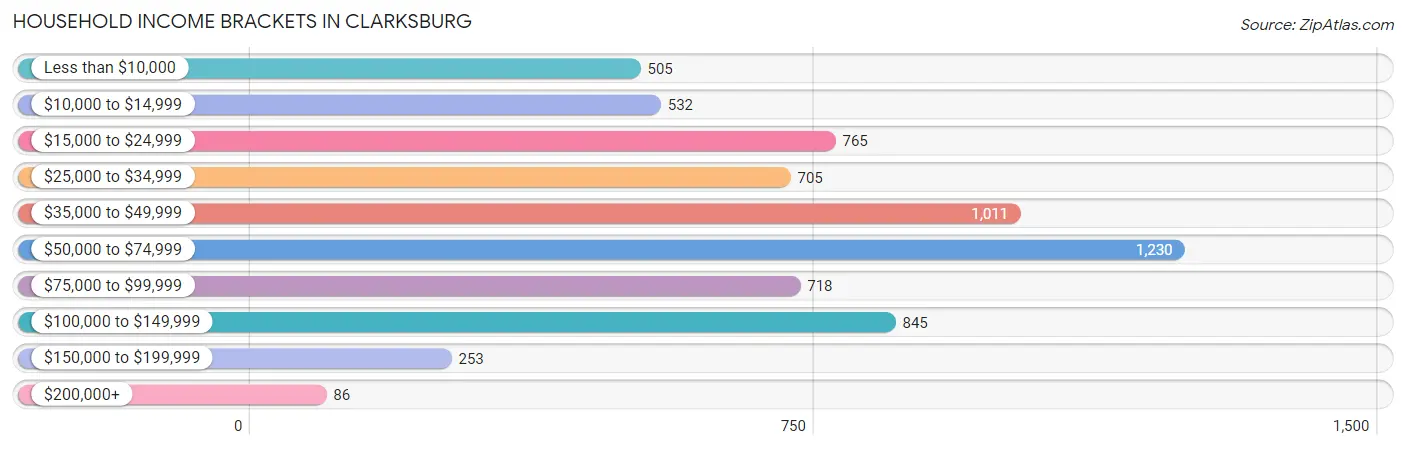
| Income Bracket | # Households | % Households |
| Less than $10,000 | 505 | 7.6% |
| $10,000 to $14,999 | 532 | 8.0% |
| $15,000 to $24,999 | 765 | 11.5% |
| $25,000 to $34,999 | 705 | 10.6% |
| $35,000 to $49,999 | 1,011 | 15.2% |
| $50,000 to $74,999 | 1,230 | 18.5% |
| $75,000 to $99,999 | 718 | 10.8% |
| $100,000 to $149,999 | 845 | 12.7% |
| $150,000 to $199,999 | 253 | 3.8% |
| $200,000+ | 86 | 1.3% |
Household Income by Householder Age in Clarksburg
The median household income in Clarksburg is $46,595, with the highest median household income of $54,623 found in the 25 to 44 years age bracket for the primary householder. A total of 1,914 households (28.8%) fall into this category. Meanwhile, the 65+ years age bracket for the primary householder has the lowest median household income of $37,917, with 1,979 households (29.8%) in this group.
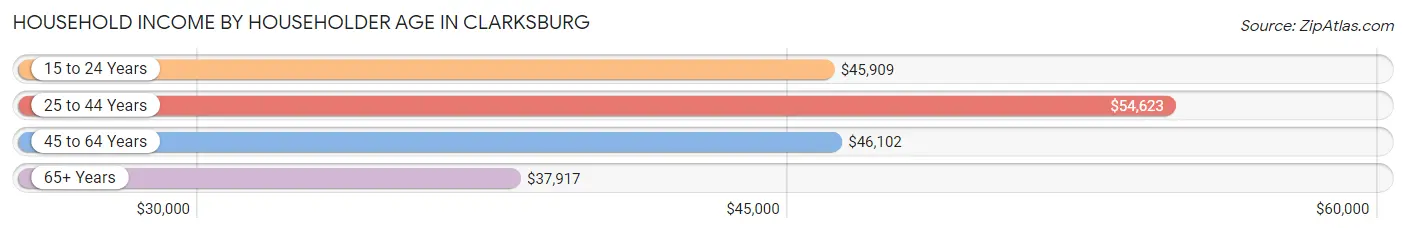
| Income Bracket | # Households | Median Income |
| 15 to 24 Years | 318 (4.8%) | $45,909 |
| 25 to 44 Years | 1,914 (28.8%) | $54,623 |
| 45 to 64 Years | 2,439 (36.7%) | $46,102 |
| 65+ Years | 1,979 (29.8%) | $37,917 |
| Total | 6,650 (100.0%) | $46,595 |
Poverty in Clarksburg
Income Below Poverty by Sex and Age in Clarksburg
With 18.2% poverty level for males and 24.8% for females among the residents of Clarksburg, under 5 year old males and 5 year old females are the most vulnerable to poverty, with 167 males (65.0%) and 157 females (82.2%) in their respective age groups living below the poverty level.
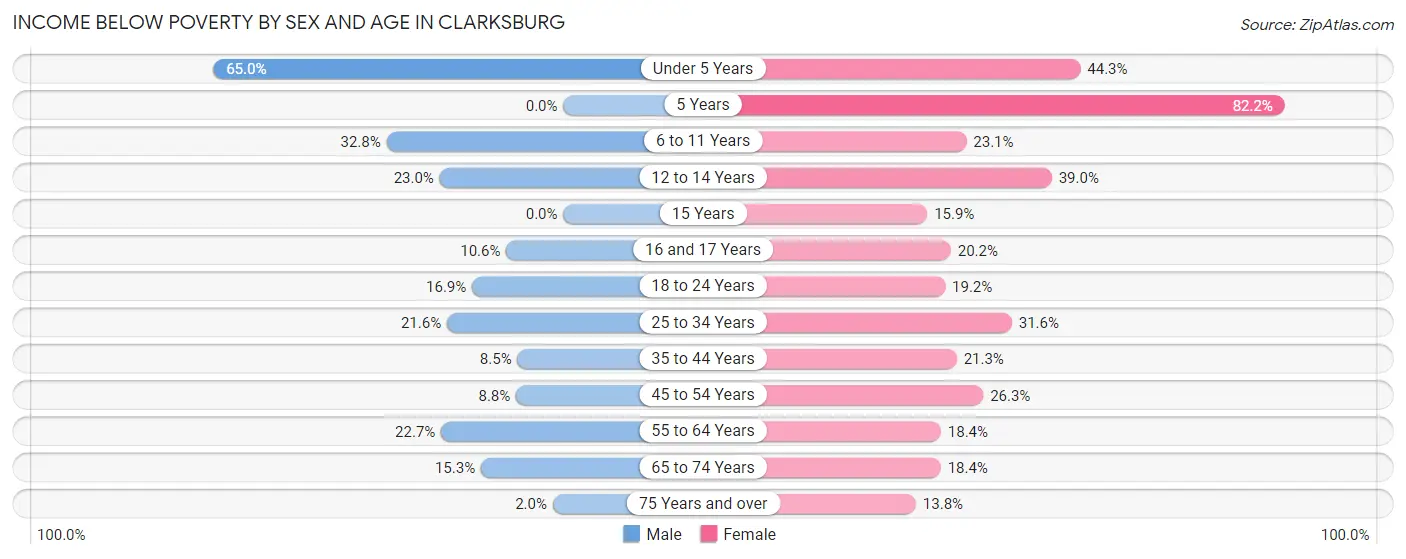
| Age Bracket | Male | Female |
| Under 5 Years | 167 (65.0%) | 244 (44.3%) |
| 5 Years | 0 (0.0%) | 157 (82.2%) |
| 6 to 11 Years | 253 (32.8%) | 160 (23.1%) |
| 12 to 14 Years | 28 (23.0%) | 53 (39.0%) |
| 15 Years | 0 (0.0%) | 26 (15.9%) |
| 16 and 17 Years | 18 (10.6%) | 35 (20.2%) |
| 18 to 24 Years | 125 (16.9%) | 127 (19.2%) |
| 25 to 34 Years | 213 (21.6%) | 296 (31.6%) |
| 35 to 44 Years | 84 (8.5%) | 222 (21.3%) |
| 45 to 54 Years | 76 (8.8%) | 267 (26.3%) |
| 55 to 64 Years | 264 (22.7%) | 212 (18.4%) |
| 65 to 74 Years | 120 (15.3%) | 168 (18.4%) |
| 75 Years and over | 6 (2.0%) | 90 (13.8%) |
| Total | 1,354 (18.2%) | 2,057 (24.8%) |
Income Above Poverty by Sex and Age in Clarksburg
According to the poverty statistics in Clarksburg, males aged 5 years and females aged 75 years and over are the age groups that are most secure financially, with 100.0% of males and 86.2% of females in these age groups living above the poverty line.
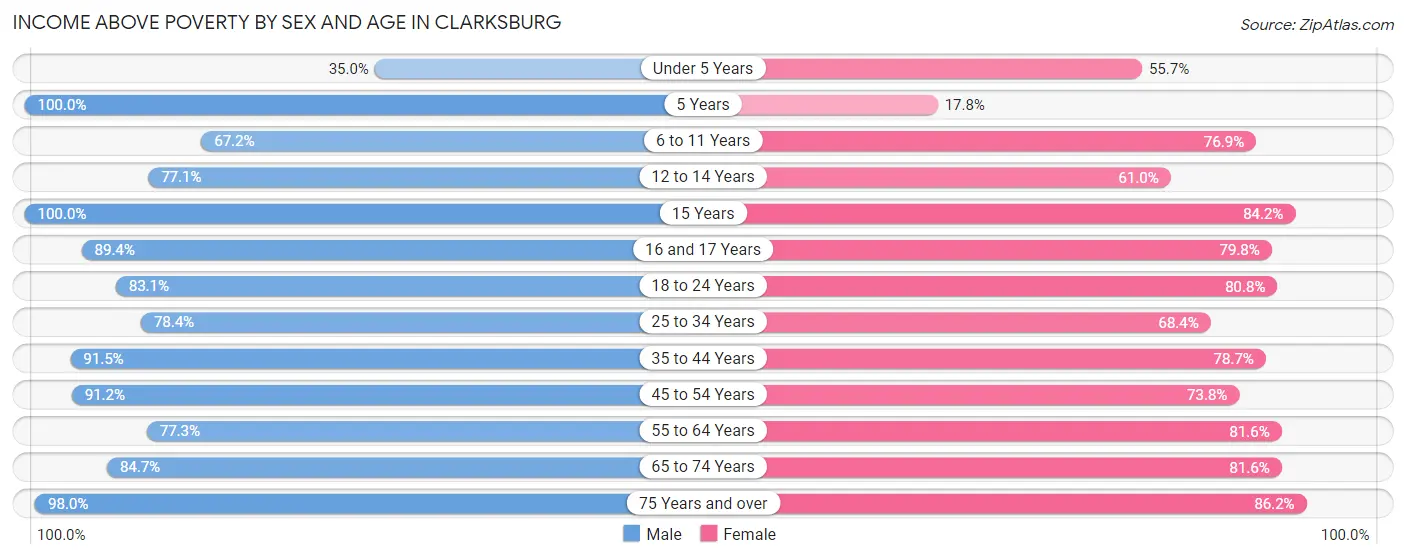
| Age Bracket | Male | Female |
| Under 5 Years | 90 (35.0%) | 307 (55.7%) |
| 5 Years | 83 (100.0%) | 34 (17.8%) |
| 6 to 11 Years | 518 (67.2%) | 532 (76.9%) |
| 12 to 14 Years | 94 (77.0%) | 83 (61.0%) |
| 15 Years | 213 (100.0%) | 138 (84.2%) |
| 16 and 17 Years | 152 (89.4%) | 138 (79.8%) |
| 18 to 24 Years | 613 (83.1%) | 535 (80.8%) |
| 25 to 34 Years | 773 (78.4%) | 642 (68.4%) |
| 35 to 44 Years | 903 (91.5%) | 819 (78.7%) |
| 45 to 54 Years | 791 (91.2%) | 750 (73.8%) |
| 55 to 64 Years | 900 (77.3%) | 941 (81.6%) |
| 65 to 74 Years | 665 (84.7%) | 747 (81.6%) |
| 75 Years and over | 300 (98.0%) | 564 (86.2%) |
| Total | 6,095 (81.8%) | 6,230 (75.2%) |
Income Below Poverty Among Married-Couple Families in Clarksburg
The poverty statistics for married-couple families in Clarksburg show that 6.3% or 149 of the total 2,355 families live below the poverty line. Families with 3 or 4 children have the highest poverty rate of 31.4%, comprising of 85 families. On the other hand, families with no children have the lowest poverty rate of 2.1%, which includes 27 families.
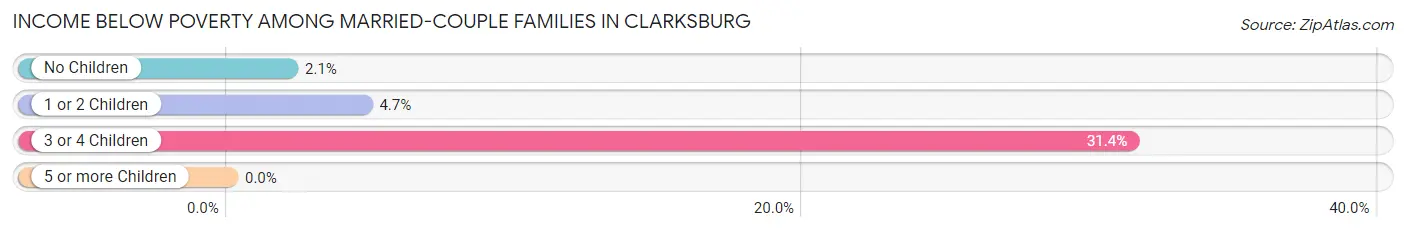
| Children | Above Poverty | Below Poverty |
| No Children | 1,266 (97.9%) | 27 (2.1%) |
| 1 or 2 Children | 754 (95.3%) | 37 (4.7%) |
| 3 or 4 Children | 186 (68.6%) | 85 (31.4%) |
| 5 or more Children | 0 (0.0%) | 0 (0.0%) |
| Total | 2,206 (93.7%) | 149 (6.3%) |
Income Below Poverty Among Single-Parent Households in Clarksburg
According to the poverty data in Clarksburg, 12.1% or 36 single-father households and 37.7% or 300 single-mother households are living below the poverty line. Among single-father households, those with no children have the highest poverty rate, with 31 households (13.4%) experiencing poverty. Likewise, among single-mother households, those with 3 or 4 children have the highest poverty rate, with 97 households (100.0%) falling below the poverty line.
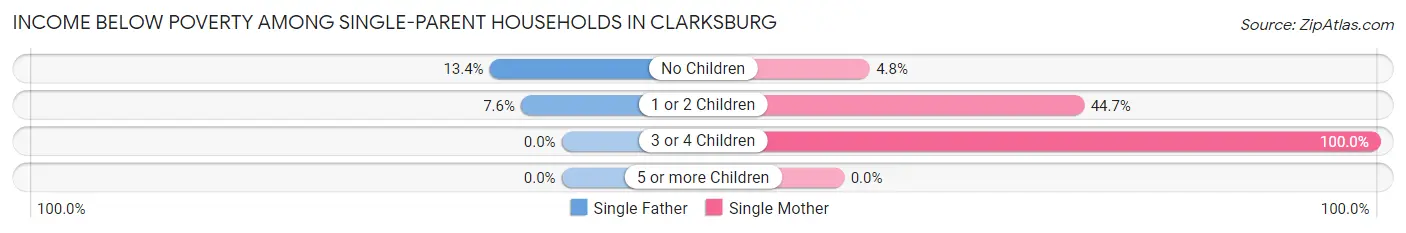
| Children | Single Father | Single Mother |
| No Children | 31 (13.4%) | 13 (4.8%) |
| 1 or 2 Children | 5 (7.6%) | 190 (44.7%) |
| 3 or 4 Children | 0 (0.0%) | 97 (100.0%) |
| 5 or more Children | 0 (0.0%) | 0 (0.0%) |
| Total | 36 (12.1%) | 300 (37.7%) |
Income Below Poverty Among Married-Couple vs Single-Parent Households in Clarksburg
The poverty data for Clarksburg shows that 149 of the married-couple family households (6.3%) and 336 of the single-parent households (30.8%) are living below the poverty level. Within the married-couple family households, those with 3 or 4 children have the highest poverty rate, with 85 households (31.4%) falling below the poverty line. Among the single-parent households, those with 3 or 4 children have the highest poverty rate, with 97 household (100.0%) living below poverty.
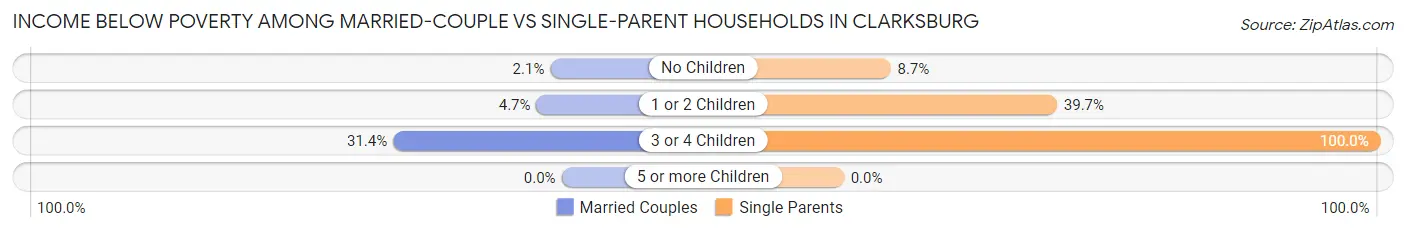
| Children | Married-Couple Families | Single-Parent Households |
| No Children | 27 (2.1%) | 44 (8.7%) |
| 1 or 2 Children | 37 (4.7%) | 195 (39.7%) |
| 3 or 4 Children | 85 (31.4%) | 97 (100.0%) |
| 5 or more Children | 0 (0.0%) | 0 (0.0%) |
| Total | 149 (6.3%) | 336 (30.8%) |
Employment Characteristics in Clarksburg
Employment by Class of Employer in Clarksburg
Among the 6,196 employed individuals in Clarksburg, private company employees (4,055 | 65.4%), federal government employees (545 | 8.8%), and not-for-profit organizations (475 | 7.7%) make up the most common classes of employment.
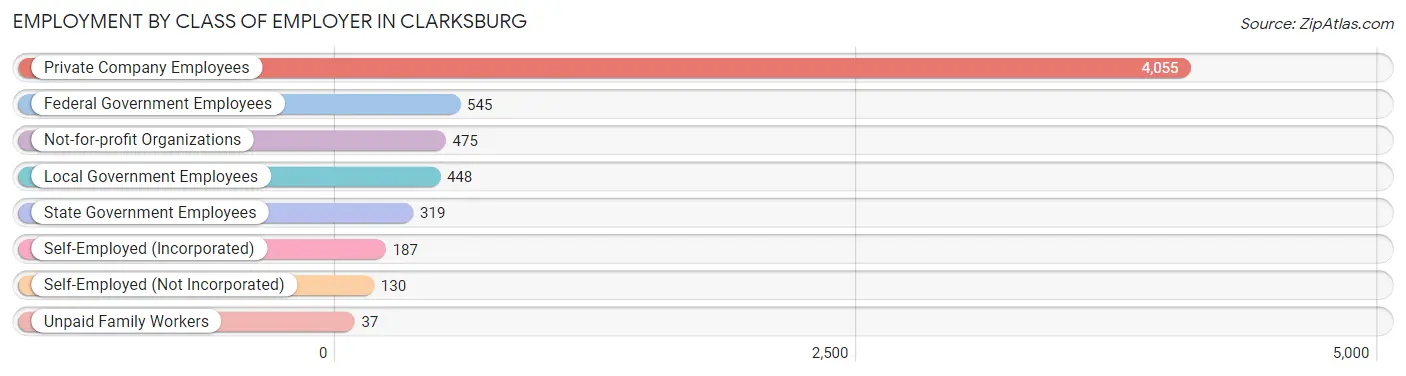
| Employer Class | # Employees | % Employees |
| Private Company Employees | 4,055 | 65.4% |
| Self-Employed (Incorporated) | 187 | 3.0% |
| Self-Employed (Not Incorporated) | 130 | 2.1% |
| Not-for-profit Organizations | 475 | 7.7% |
| Local Government Employees | 448 | 7.2% |
| State Government Employees | 319 | 5.1% |
| Federal Government Employees | 545 | 8.8% |
| Unpaid Family Workers | 37 | 0.6% |
| Total | 6,196 | 100.0% |
Employment Status by Age in Clarksburg
According to the labor force statistics for Clarksburg, out of the total population over 16 years of age (12,735), 53.5% or 6,813 individuals are in the labor force, with 5.9% or 402 of them unemployed. The age group with the highest labor force participation rate is 25 to 29 years, with 78.4% or 837 individuals in the labor force. Within the labor force, the 30 to 34 years age range has the highest percentage of unemployed individuals, with 16.2% or 92 of them being unemployed.
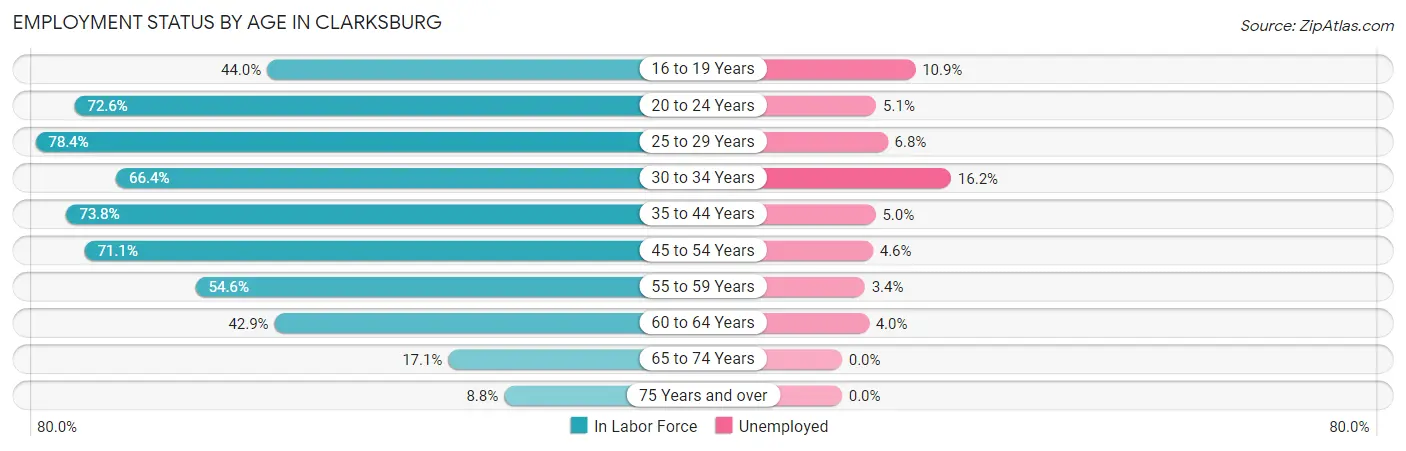
| Age Bracket | In Labor Force | Unemployed |
| 16 to 19 Years | 329 (44.0%) | 36 (10.9%) |
| 20 to 24 Years | 726 (72.6%) | 37 (5.1%) |
| 25 to 29 Years | 837 (78.4%) | 57 (6.8%) |
| 30 to 34 Years | 568 (66.4%) | 92 (16.2%) |
| 35 to 44 Years | 1,507 (73.8%) | 75 (5.0%) |
| 45 to 54 Years | 1,342 (71.1%) | 62 (4.6%) |
| 55 to 59 Years | 503 (54.6%) | 17 (3.4%) |
| 60 to 64 Years | 618 (42.9%) | 25 (4.0%) |
| 65 to 74 Years | 294 (17.1%) | 0 (0.0%) |
| 75 Years and over | 93 (8.8%) | 0 (0.0%) |
| Total | 6,813 (53.5%) | 402 (5.9%) |
Employment Status by Educational Attainment in Clarksburg
According to labor force statistics for Clarksburg, 65.4% of individuals (5,374) out of the total population between 25 and 64 years of age (8,217) are in the labor force, with 6.1% or 328 of them being unemployed. The group with the highest labor force participation rate are those with the educational attainment of bachelor's degree or higher, with 81.1% or 1,528 individuals in the labor force. Within the labor force, individuals with less than high school education have the highest percentage of unemployment, with 14.3% or 95 of them being unemployed.
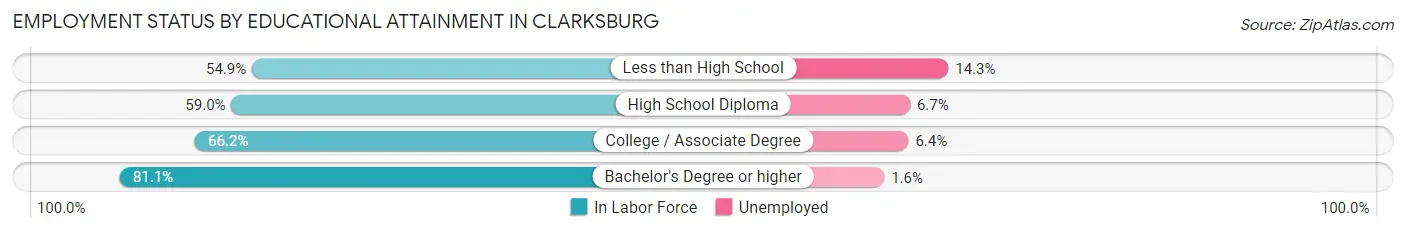
| Educational Attainment | In Labor Force | Unemployed |
| Less than High School | 665 (54.9%) | 173 (14.3%) |
| High School Diploma | 1,677 (59.0%) | 190 (6.7%) |
| College / Associate Degree | 1,508 (66.2%) | 146 (6.4%) |
| Bachelor's Degree or higher | 1,528 (81.1%) | 30 (1.6%) |
| Total | 5,374 (65.4%) | 501 (6.1%) |
Employment Occupations by Sex in Clarksburg
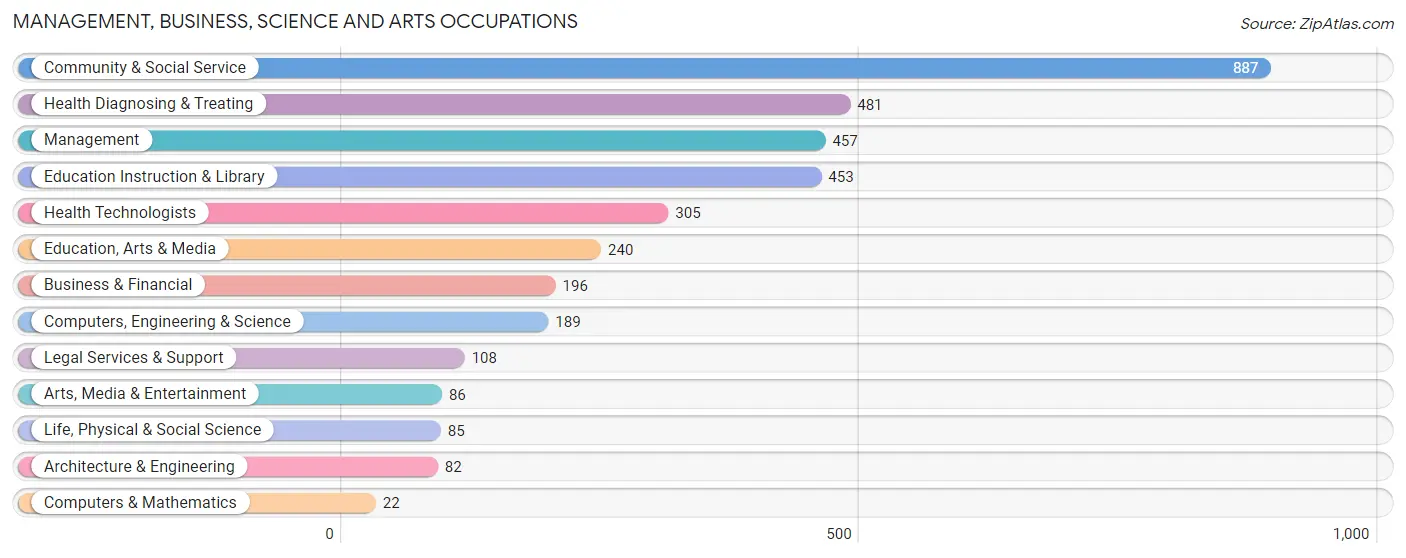
Management, Business, Science and Arts Occupations
The most common Management, Business, Science and Arts occupations in Clarksburg are Community & Social Service (887 | 13.8%), Health Diagnosing & Treating (481 | 7.5%), Management (457 | 7.1%), Education Instruction & Library (453 | 7.1%), and Health Technologists (305 | 4.8%).
Management, Business, Science and Arts Occupations by Sex
Within the Management, Business, Science and Arts occupations in Clarksburg, the most male-oriented occupations are Architecture & Engineering (100.0%), Life, Physical & Social Science (88.2%), and Computers, Engineering & Science (86.2%), while the most female-oriented occupations are Legal Services & Support (87.0%), Health Diagnosing & Treating (73.0%), and Computers & Mathematics (72.7%).
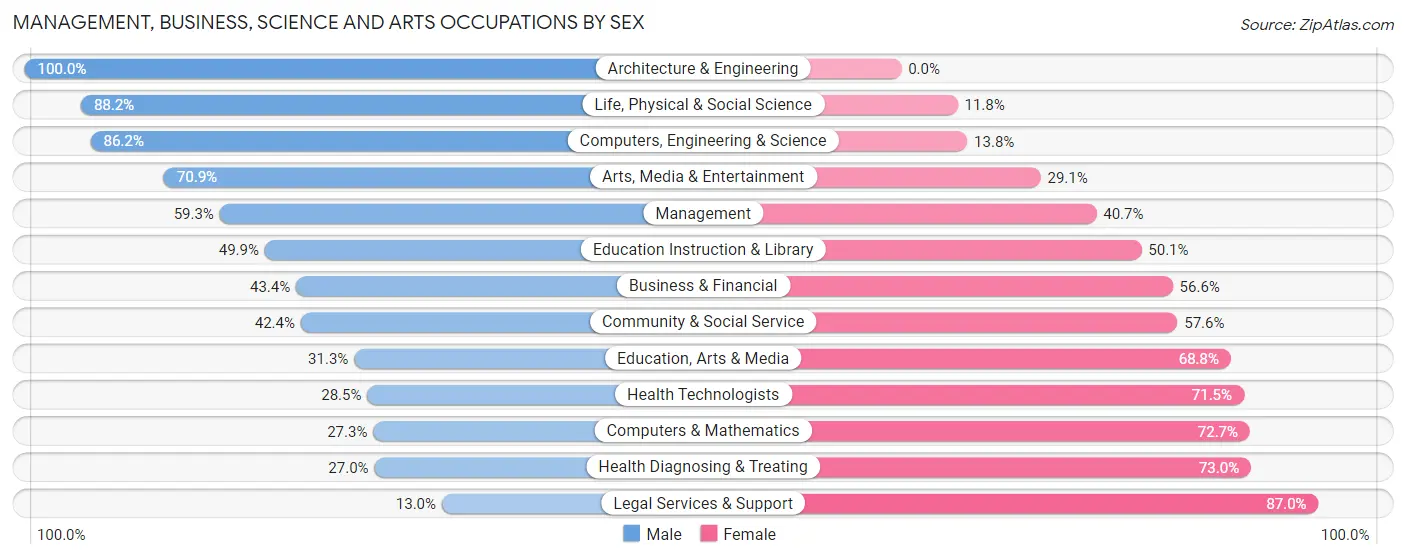
| Occupation | Male | Female |
| Management | 271 (59.3%) | 186 (40.7%) |
| Business & Financial | 85 (43.4%) | 111 (56.6%) |
| Computers, Engineering & Science | 163 (86.2%) | 26 (13.8%) |
| Computers & Mathematics | 6 (27.3%) | 16 (72.7%) |
| Architecture & Engineering | 82 (100.0%) | 0 (0.0%) |
| Life, Physical & Social Science | 75 (88.2%) | 10 (11.8%) |
| Community & Social Service | 376 (42.4%) | 511 (57.6%) |
| Education, Arts & Media | 75 (31.2%) | 165 (68.8%) |
| Legal Services & Support | 14 (13.0%) | 94 (87.0%) |
| Education Instruction & Library | 226 (49.9%) | 227 (50.1%) |
| Arts, Media & Entertainment | 61 (70.9%) | 25 (29.1%) |
| Health Diagnosing & Treating | 130 (27.0%) | 351 (73.0%) |
| Health Technologists | 87 (28.5%) | 218 (71.5%) |
| Total (Category) | 1,025 (46.4%) | 1,185 (53.6%) |
| Total (Overall) | 3,479 (54.2%) | 2,937 (45.8%) |
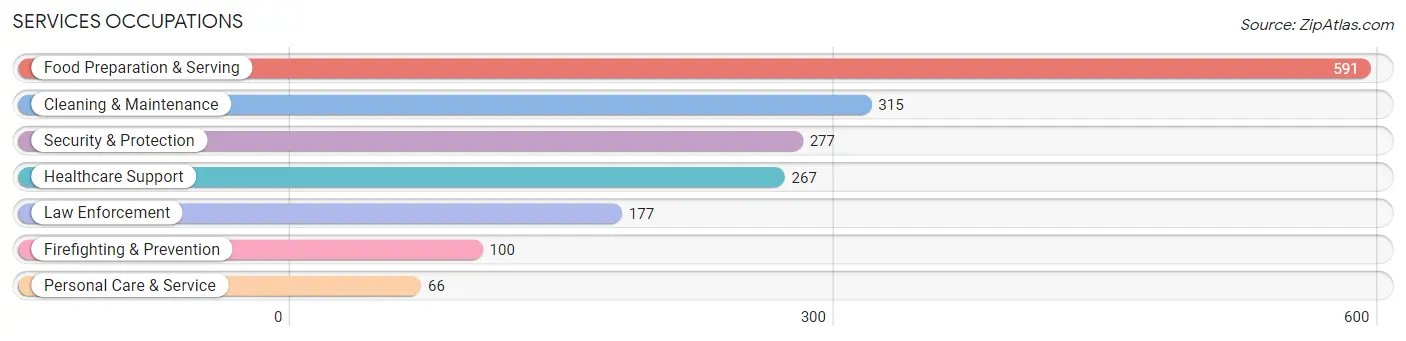
Services Occupations
The most common Services occupations in Clarksburg are Food Preparation & Serving (591 | 9.2%), Cleaning & Maintenance (315 | 4.9%), Security & Protection (277 | 4.3%), Healthcare Support (267 | 4.2%), and Law Enforcement (177 | 2.8%).
Services Occupations by Sex
Within the Services occupations in Clarksburg, the most male-oriented occupations are Firefighting & Prevention (100.0%), Cleaning & Maintenance (72.1%), and Security & Protection (60.3%), while the most female-oriented occupations are Healthcare Support (100.0%), Personal Care & Service (89.4%), and Law Enforcement (62.2%).
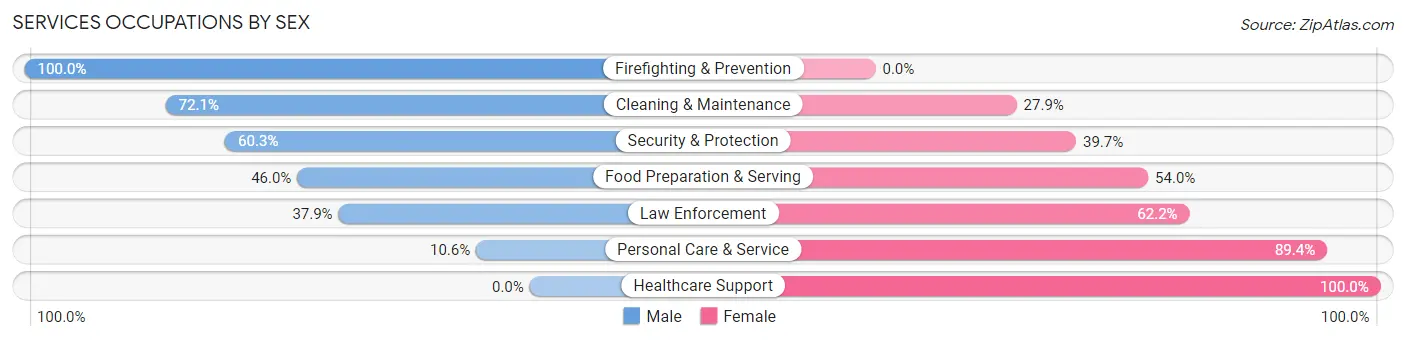
| Occupation | Male | Female |
| Healthcare Support | 0 (0.0%) | 267 (100.0%) |
| Security & Protection | 167 (60.3%) | 110 (39.7%) |
| Firefighting & Prevention | 100 (100.0%) | 0 (0.0%) |
| Law Enforcement | 67 (37.9%) | 110 (62.2%) |
| Food Preparation & Serving | 272 (46.0%) | 319 (54.0%) |
| Cleaning & Maintenance | 227 (72.1%) | 88 (27.9%) |
| Personal Care & Service | 7 (10.6%) | 59 (89.4%) |
| Total (Category) | 673 (44.4%) | 843 (55.6%) |
| Total (Overall) | 3,479 (54.2%) | 2,937 (45.8%) |
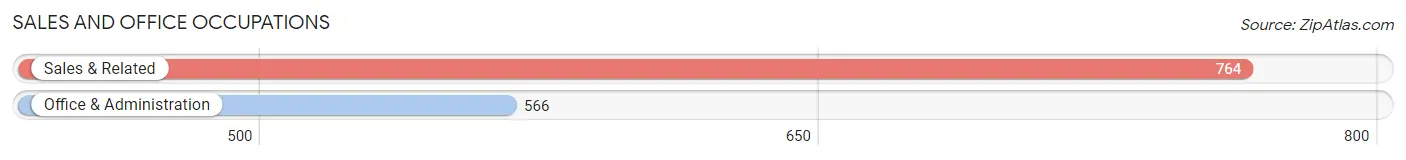
Sales and Office Occupations
The most common Sales and Office occupations in Clarksburg are Sales & Related (764 | 11.9%), and Office & Administration (566 | 8.8%).
Sales and Office Occupations by Sex
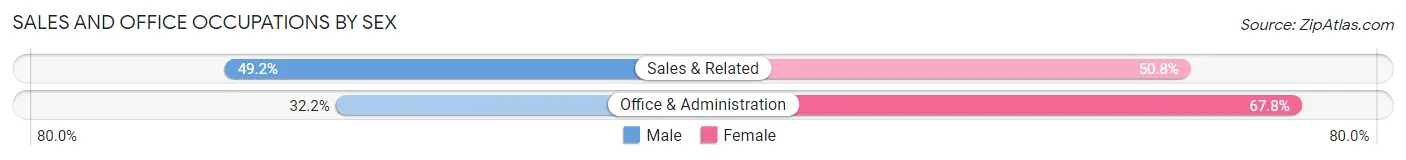
| Occupation | Male | Female |
| Sales & Related | 376 (49.2%) | 388 (50.8%) |
| Office & Administration | 182 (32.2%) | 384 (67.8%) |
| Total (Category) | 558 (41.9%) | 772 (58.1%) |
| Total (Overall) | 3,479 (54.2%) | 2,937 (45.8%) |
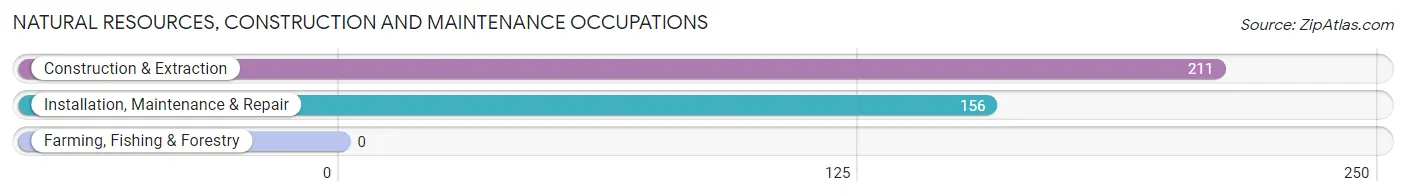
Natural Resources, Construction and Maintenance Occupations
The most common Natural Resources, Construction and Maintenance occupations in Clarksburg are Construction & Extraction (211 | 3.3%), and Installation, Maintenance & Repair (156 | 2.4%).
Natural Resources, Construction and Maintenance Occupations by Sex
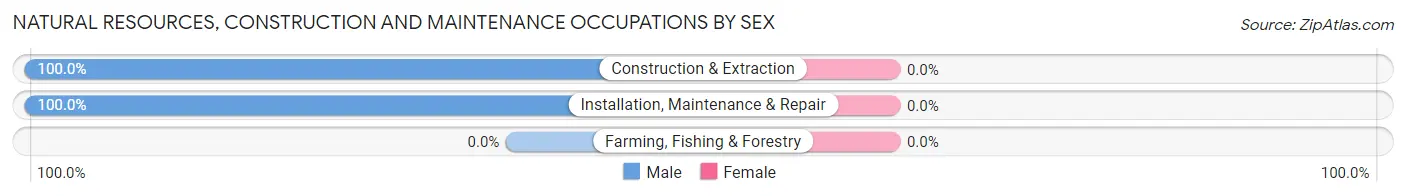
| Occupation | Male | Female |
| Farming, Fishing & Forestry | 0 (0.0%) | 0 (0.0%) |
| Construction & Extraction | 211 (100.0%) | 0 (0.0%) |
| Installation, Maintenance & Repair | 156 (100.0%) | 0 (0.0%) |
| Total (Category) | 367 (100.0%) | 0 (0.0%) |
| Total (Overall) | 3,479 (54.2%) | 2,937 (45.8%) |
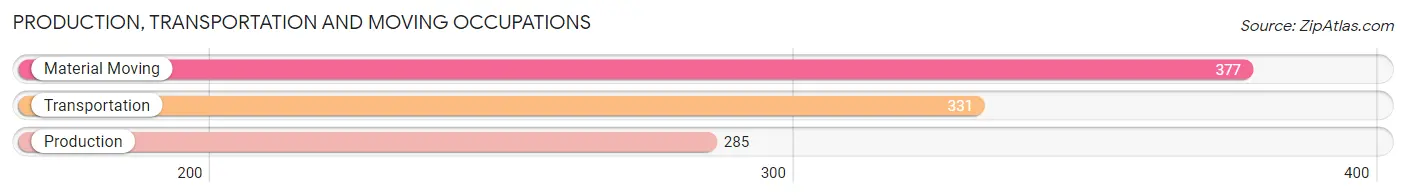
Production, Transportation and Moving Occupations
The most common Production, Transportation and Moving occupations in Clarksburg are Material Moving (377 | 5.9%), Transportation (331 | 5.2%), and Production (285 | 4.4%).
Production, Transportation and Moving Occupations by Sex
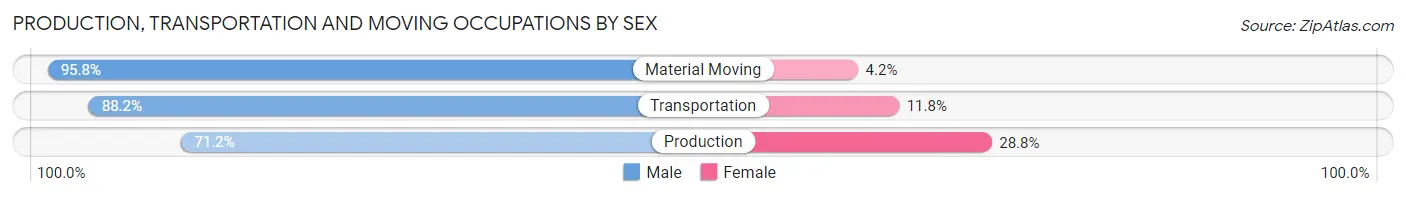
| Occupation | Male | Female |
| Production | 203 (71.2%) | 82 (28.8%) |
| Transportation | 292 (88.2%) | 39 (11.8%) |
| Material Moving | 361 (95.8%) | 16 (4.2%) |
| Total (Category) | 856 (86.2%) | 137 (13.8%) |
| Total (Overall) | 3,479 (54.2%) | 2,937 (45.8%) |
Employment Industries by Sex in Clarksburg
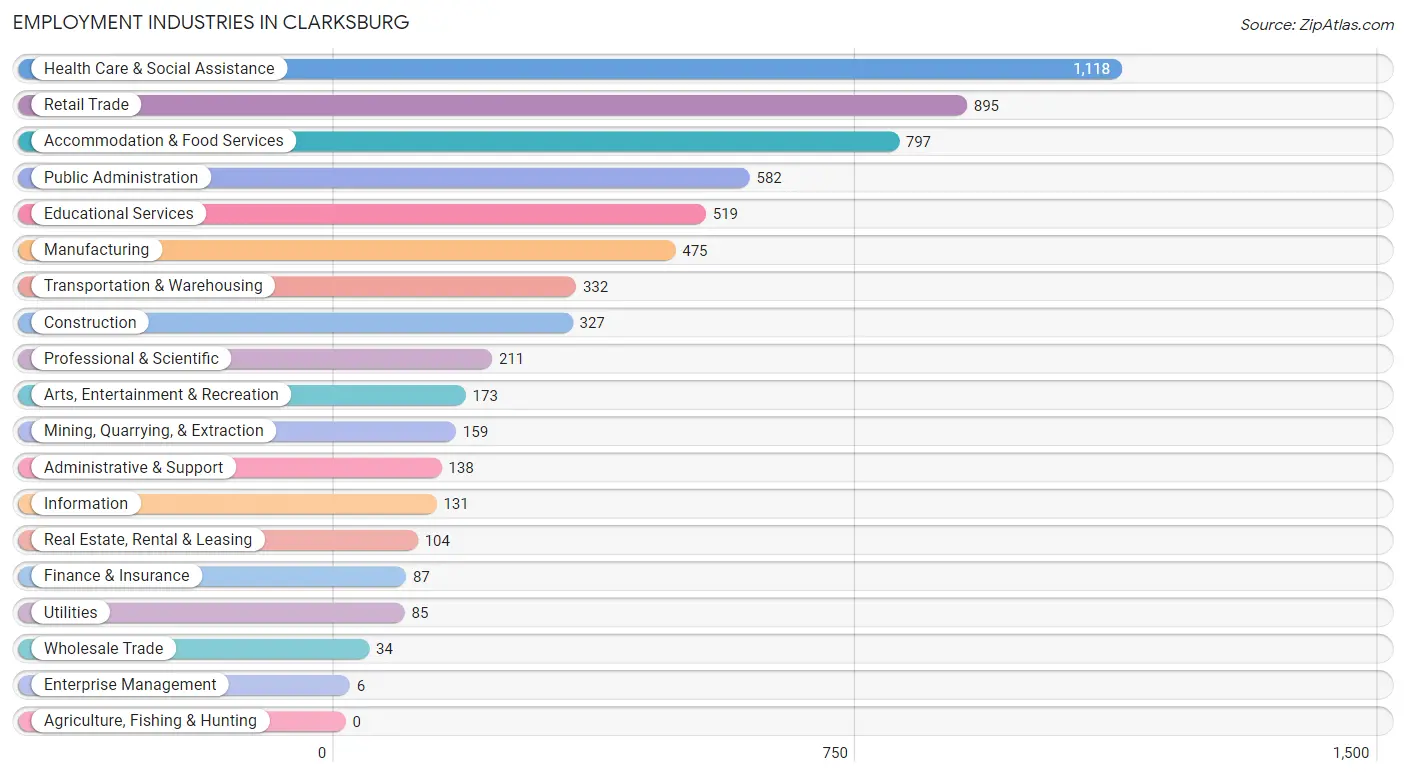
Employment Industries in Clarksburg
The major employment industries in Clarksburg include Health Care & Social Assistance (1,118 | 17.4%), Retail Trade (895 | 14.0%), Accommodation & Food Services (797 | 12.4%), Public Administration (582 | 9.1%), and Educational Services (519 | 8.1%).
Employment Industries by Sex in Clarksburg
The Clarksburg industries that see more men than women are Wholesale Trade (100.0%), Enterprise Management (100.0%), and Administrative & Support (94.9%), whereas the industries that tend to have a higher number of women are Health Care & Social Assistance (78.3%), Information (65.6%), and Educational Services (62.2%).
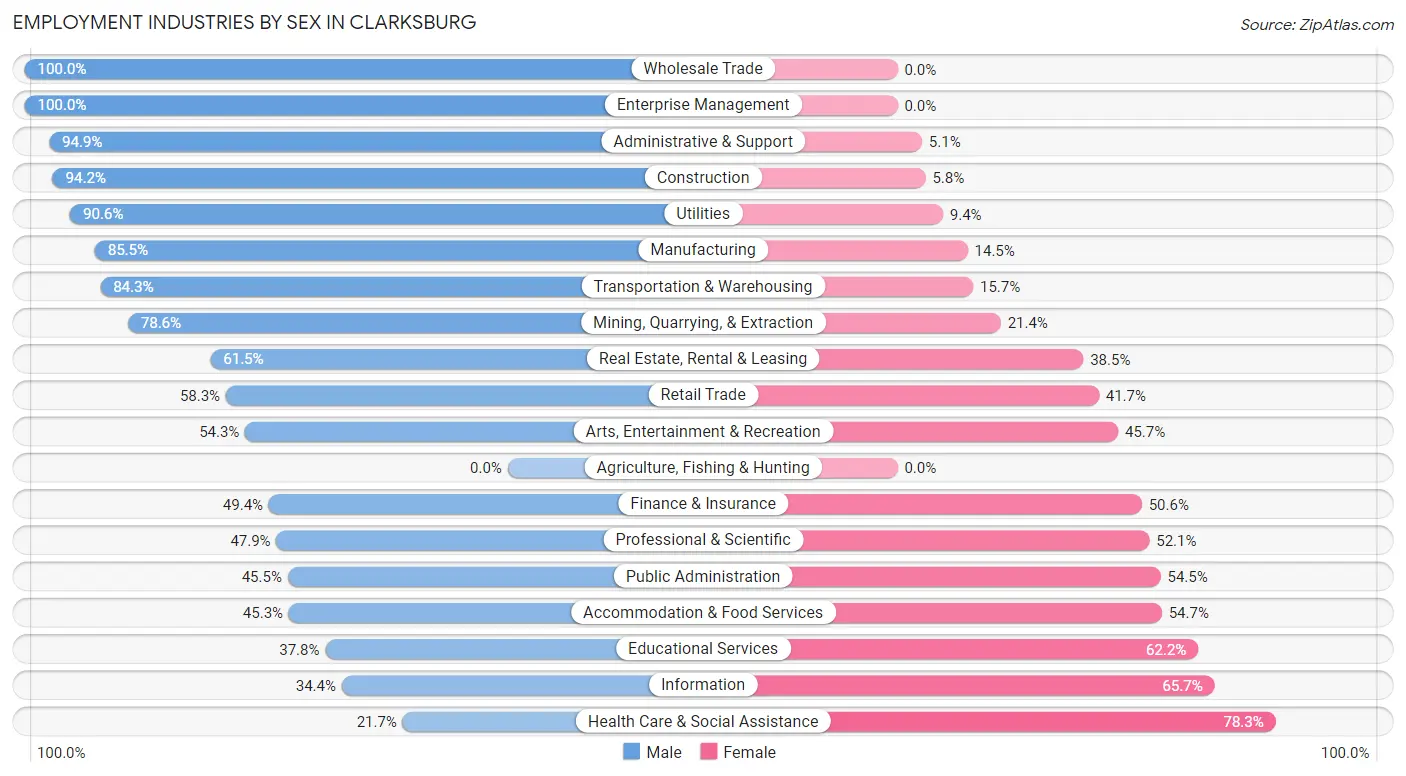
| Industry | Male | Female |
| Agriculture, Fishing & Hunting | 0 (0.0%) | 0 (0.0%) |
| Mining, Quarrying, & Extraction | 125 (78.6%) | 34 (21.4%) |
| Construction | 308 (94.2%) | 19 (5.8%) |
| Manufacturing | 406 (85.5%) | 69 (14.5%) |
| Wholesale Trade | 34 (100.0%) | 0 (0.0%) |
| Retail Trade | 522 (58.3%) | 373 (41.7%) |
| Transportation & Warehousing | 280 (84.3%) | 52 (15.7%) |
| Utilities | 77 (90.6%) | 8 (9.4%) |
| Information | 45 (34.4%) | 86 (65.6%) |
| Finance & Insurance | 43 (49.4%) | 44 (50.6%) |
| Real Estate, Rental & Leasing | 64 (61.5%) | 40 (38.5%) |
| Professional & Scientific | 101 (47.9%) | 110 (52.1%) |
| Enterprise Management | 6 (100.0%) | 0 (0.0%) |
| Administrative & Support | 131 (94.9%) | 7 (5.1%) |
| Educational Services | 196 (37.8%) | 323 (62.2%) |
| Health Care & Social Assistance | 243 (21.7%) | 875 (78.3%) |
| Arts, Entertainment & Recreation | 94 (54.3%) | 79 (45.7%) |
| Accommodation & Food Services | 361 (45.3%) | 436 (54.7%) |
| Public Administration | 265 (45.5%) | 317 (54.5%) |
| Total | 3,479 (54.2%) | 2,937 (45.8%) |
Education in Clarksburg
School Enrollment in Clarksburg
The most common levels of schooling among the 3,296 students in Clarksburg are middle school (957 | 29.0%), high school (852 | 25.9%), and elementary school (610 | 18.5%).
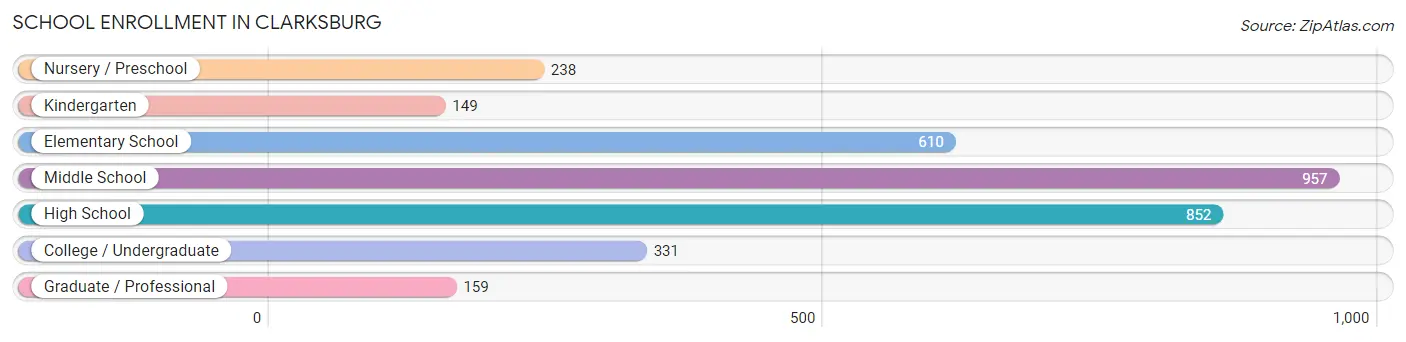
| School Level | # Students | % Students |
| Nursery / Preschool | 238 | 7.2% |
| Kindergarten | 149 | 4.5% |
| Elementary School | 610 | 18.5% |
| Middle School | 957 | 29.0% |
| High School | 852 | 25.9% |
| College / Undergraduate | 331 | 10.0% |
| Graduate / Professional | 159 | 4.8% |
| Total | 3,296 | 100.0% |
School Enrollment by Age by Funding Source in Clarksburg
Out of a total of 3,296 students who are enrolled in schools in Clarksburg, 356 (10.8%) attend a private institution, while the remaining 2,940 (89.2%) are enrolled in public schools. The age group of 3 to 4 year olds has the highest likelihood of being enrolled in private schools, with 69 (46.0% in the age bracket) enrolled. Conversely, the age group of 20 to 24 year olds has the lowest likelihood of being enrolled in a private school, with 284 (100.0% in the age bracket) attending a public institution.
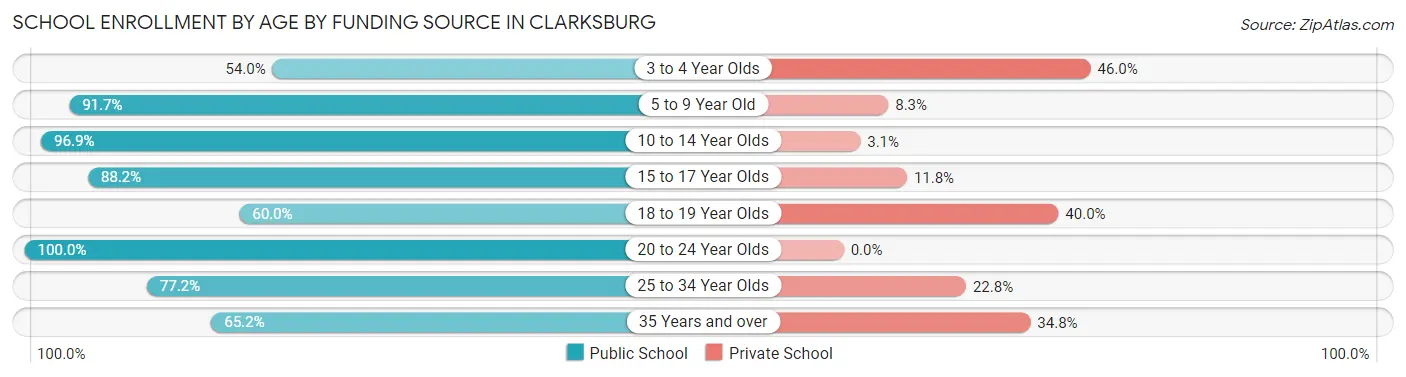
| Age Bracket | Public School | Private School |
| 3 to 4 Year Olds | 81 (54.0%) | 69 (46.0%) |
| 5 to 9 Year Old | 684 (91.7%) | 62 (8.3%) |
| 10 to 14 Year Olds | 1,068 (96.9%) | 34 (3.1%) |
| 15 to 17 Year Olds | 621 (88.2%) | 83 (11.8%) |
| 18 to 19 Year Olds | 111 (60.0%) | 74 (40.0%) |
| 20 to 24 Year Olds | 284 (100.0%) | 0 (0.0%) |
| 25 to 34 Year Olds | 61 (77.2%) | 18 (22.8%) |
| 35 Years and over | 30 (65.2%) | 16 (34.8%) |
| Total | 2,940 (89.2%) | 356 (10.8%) |
Educational Attainment by Field of Study in Clarksburg
Education (492 | 17.2%), business (475 | 16.6%), psychology (322 | 11.2%), arts & humanities (305 | 10.6%), and social sciences (273 | 9.5%) are the most common fields of study among 2,866 individuals in Clarksburg who have obtained a bachelor's degree or higher.
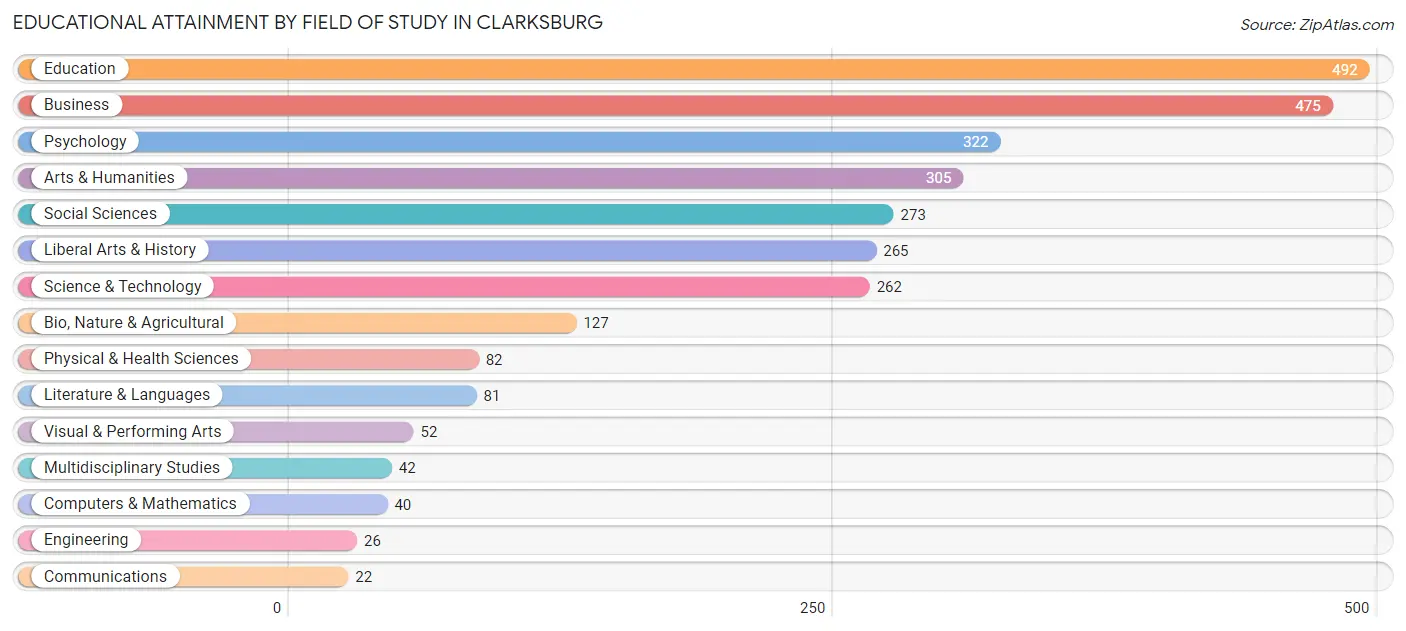
| Field of Study | # Graduates | % Graduates |
| Computers & Mathematics | 40 | 1.4% |
| Bio, Nature & Agricultural | 127 | 4.4% |
| Physical & Health Sciences | 82 | 2.9% |
| Psychology | 322 | 11.2% |
| Social Sciences | 273 | 9.5% |
| Engineering | 26 | 0.9% |
| Multidisciplinary Studies | 42 | 1.5% |
| Science & Technology | 262 | 9.1% |
| Business | 475 | 16.6% |
| Education | 492 | 17.2% |
| Literature & Languages | 81 | 2.8% |
| Liberal Arts & History | 265 | 9.2% |
| Visual & Performing Arts | 52 | 1.8% |
| Communications | 22 | 0.8% |
| Arts & Humanities | 305 | 10.6% |
| Total | 2,866 | 100.0% |
Transportation & Commute in Clarksburg
Vehicle Availability by Sex in Clarksburg
The most prevalent vehicle ownership categories in Clarksburg are males with 2 vehicles (1,546, accounting for 46.7%) and females with 2 vehicles (1,213, making up 54.5%).
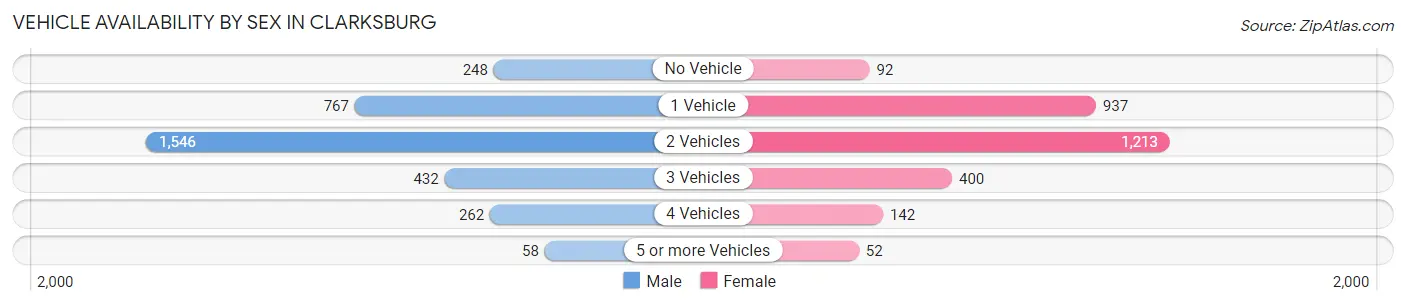
| Vehicles Available | Male | Female |
| No Vehicle | 248 (7.5%) | 92 (3.2%) |
| 1 Vehicle | 767 (23.2%) | 937 (33.0%) |
| 2 Vehicles | 1,546 (46.7%) | 1,213 (42.8%) |
| 3 Vehicles | 432 (13.0%) | 400 (14.1%) |
| 4 Vehicles | 262 (7.9%) | 142 (5.0%) |
| 5 or more Vehicles | 58 (1.8%) | 52 (1.8%) |
| Total | 3,313 (100.0%) | 2,836 (100.0%) |
Commute Time in Clarksburg
The most frequently occuring commute durations in Clarksburg are 15 to 19 minutes (1,304 commuters, 22.5%), 10 to 14 minutes (1,187 commuters, 20.4%), and 20 to 24 minutes (998 commuters, 17.2%).
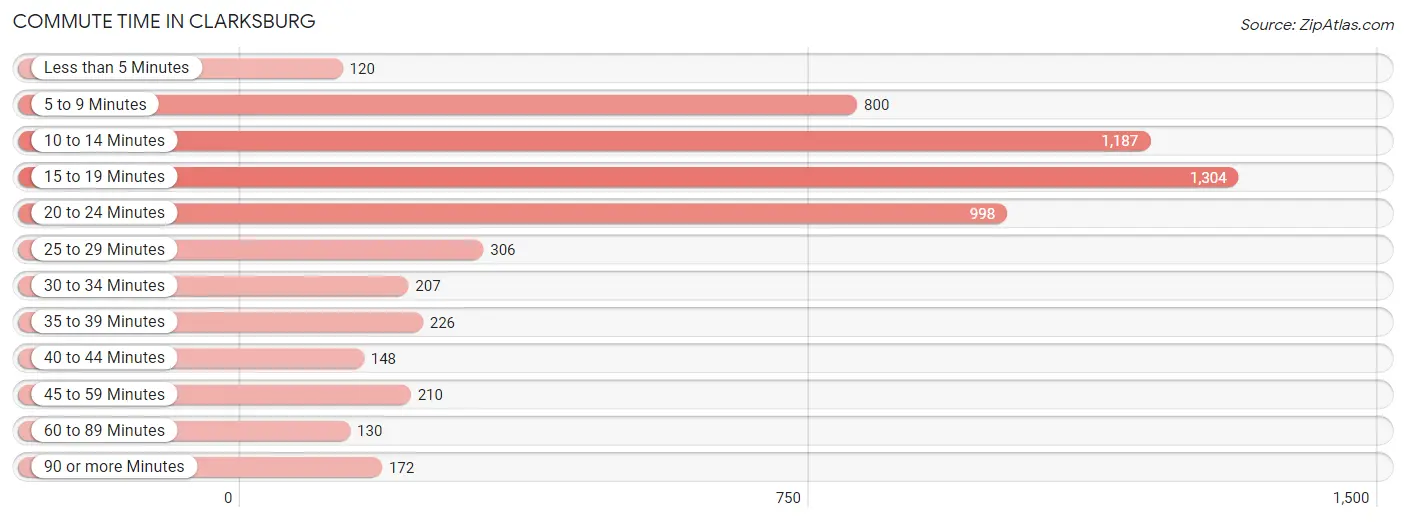
| Commute Time | # Commuters | % Commuters |
| Less than 5 Minutes | 120 | 2.1% |
| 5 to 9 Minutes | 800 | 13.8% |
| 10 to 14 Minutes | 1,187 | 20.4% |
| 15 to 19 Minutes | 1,304 | 22.5% |
| 20 to 24 Minutes | 998 | 17.2% |
| 25 to 29 Minutes | 306 | 5.3% |
| 30 to 34 Minutes | 207 | 3.6% |
| 35 to 39 Minutes | 226 | 3.9% |
| 40 to 44 Minutes | 148 | 2.5% |
| 45 to 59 Minutes | 210 | 3.6% |
| 60 to 89 Minutes | 130 | 2.2% |
| 90 or more Minutes | 172 | 3.0% |
Commute Time by Sex in Clarksburg
The most common commute times in Clarksburg are 15 to 19 minutes (763 commuters, 23.8%) for males and 10 to 14 minutes (619 commuters, 23.8%) for females.
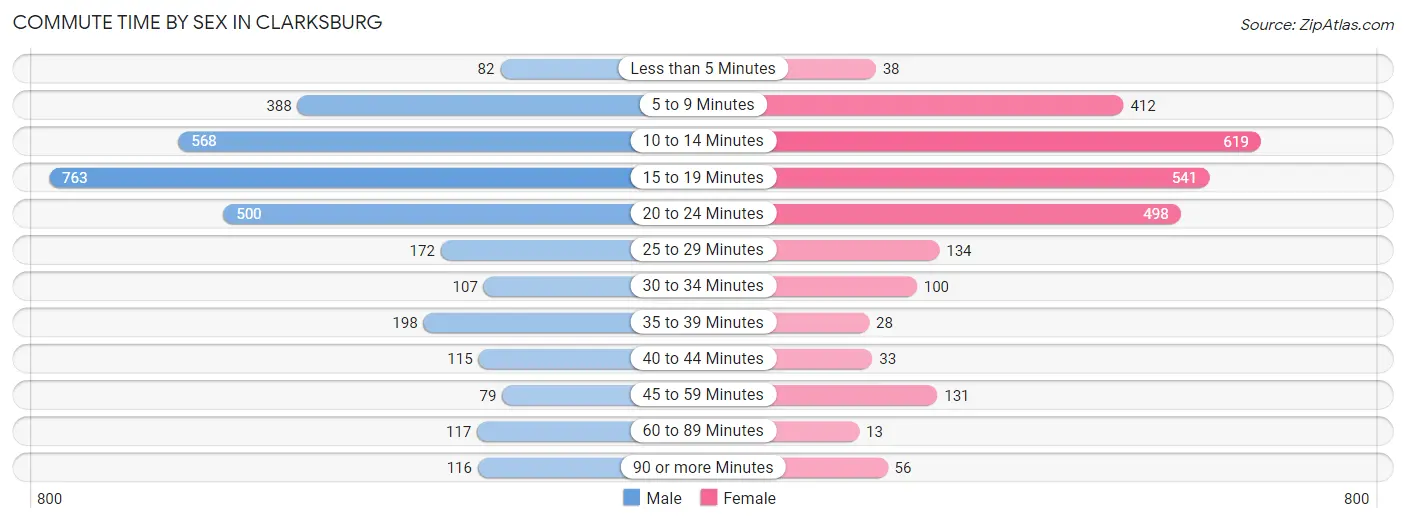
| Commute Time | Male | Female |
| Less than 5 Minutes | 82 (2.6%) | 38 (1.5%) |
| 5 to 9 Minutes | 388 (12.1%) | 412 (15.8%) |
| 10 to 14 Minutes | 568 (17.7%) | 619 (23.8%) |
| 15 to 19 Minutes | 763 (23.8%) | 541 (20.8%) |
| 20 to 24 Minutes | 500 (15.6%) | 498 (19.1%) |
| 25 to 29 Minutes | 172 (5.4%) | 134 (5.1%) |
| 30 to 34 Minutes | 107 (3.3%) | 100 (3.8%) |
| 35 to 39 Minutes | 198 (6.2%) | 28 (1.1%) |
| 40 to 44 Minutes | 115 (3.6%) | 33 (1.3%) |
| 45 to 59 Minutes | 79 (2.5%) | 131 (5.0%) |
| 60 to 89 Minutes | 117 (3.6%) | 13 (0.5%) |
| 90 or more Minutes | 116 (3.6%) | 56 (2.1%) |
Time of Departure to Work by Sex in Clarksburg
The most frequent times of departure to work in Clarksburg are 7:00 AM to 7:29 AM (498, 15.5%) for males and 6:30 AM to 6:59 AM (375, 14.4%) for females.
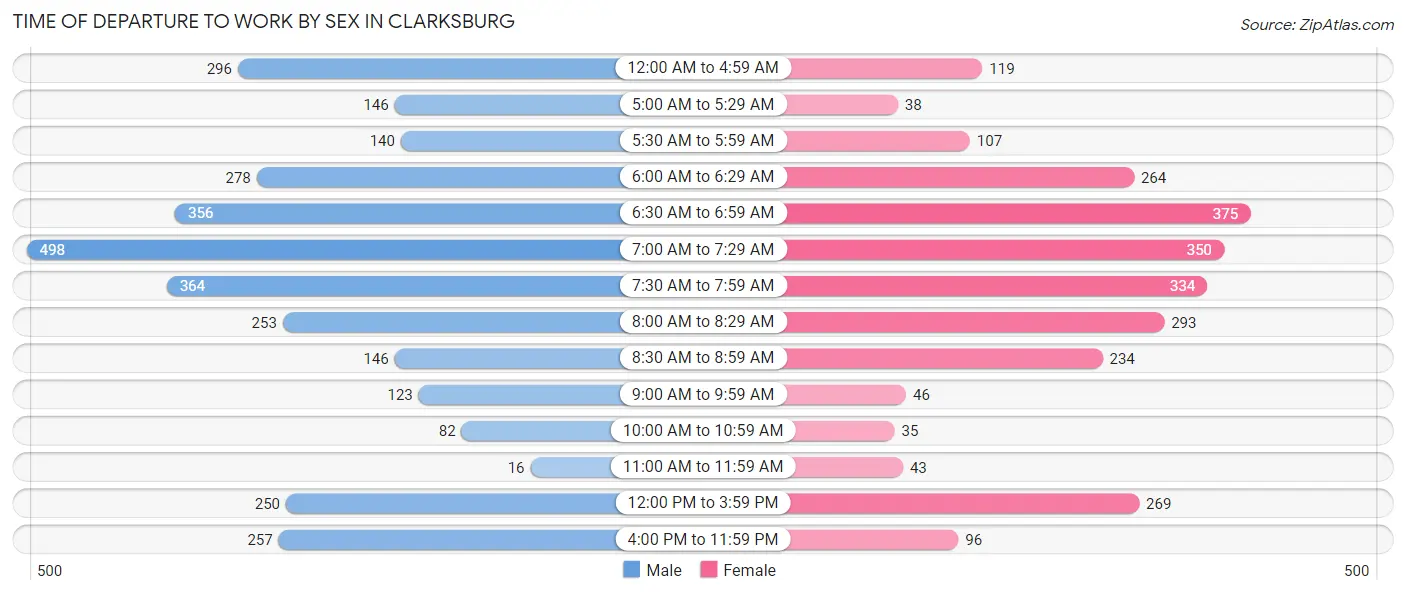
| Time of Departure | Male | Female |
| 12:00 AM to 4:59 AM | 296 (9.2%) | 119 (4.6%) |
| 5:00 AM to 5:29 AM | 146 (4.6%) | 38 (1.5%) |
| 5:30 AM to 5:59 AM | 140 (4.4%) | 107 (4.1%) |
| 6:00 AM to 6:29 AM | 278 (8.7%) | 264 (10.1%) |
| 6:30 AM to 6:59 AM | 356 (11.1%) | 375 (14.4%) |
| 7:00 AM to 7:29 AM | 498 (15.5%) | 350 (13.5%) |
| 7:30 AM to 7:59 AM | 364 (11.4%) | 334 (12.8%) |
| 8:00 AM to 8:29 AM | 253 (7.9%) | 293 (11.3%) |
| 8:30 AM to 8:59 AM | 146 (4.6%) | 234 (9.0%) |
| 9:00 AM to 9:59 AM | 123 (3.8%) | 46 (1.8%) |
| 10:00 AM to 10:59 AM | 82 (2.6%) | 35 (1.3%) |
| 11:00 AM to 11:59 AM | 16 (0.5%) | 43 (1.7%) |
| 12:00 PM to 3:59 PM | 250 (7.8%) | 269 (10.3%) |
| 4:00 PM to 11:59 PM | 257 (8.0%) | 96 (3.7%) |
| Total | 3,205 (100.0%) | 2,603 (100.0%) |
Housing Occupancy in Clarksburg
Occupancy by Ownership in Clarksburg
Of the total 6,650 dwellings in Clarksburg, owner-occupied units account for 4,191 (63.0%), while renter-occupied units make up 2,459 (37.0%).
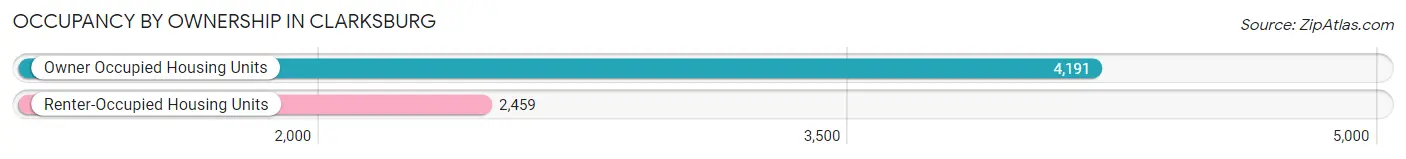
| Occupancy | # Housing Units | % Housing Units |
| Owner Occupied Housing Units | 4,191 | 63.0% |
| Renter-Occupied Housing Units | 2,459 | 37.0% |
| Total Occupied Housing Units | 6,650 | 100.0% |
Occupancy by Household Size in Clarksburg
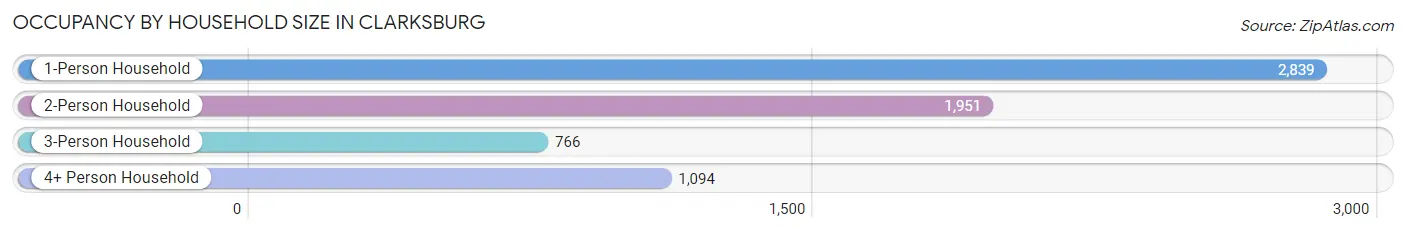
| Household Size | # Housing Units | % Housing Units |
| 1-Person Household | 2,839 | 42.7% |
| 2-Person Household | 1,951 | 29.3% |
| 3-Person Household | 766 | 11.5% |
| 4+ Person Household | 1,094 | 16.5% |
| Total Housing Units | 6,650 | 100.0% |
Occupancy by Ownership by Household Size in Clarksburg
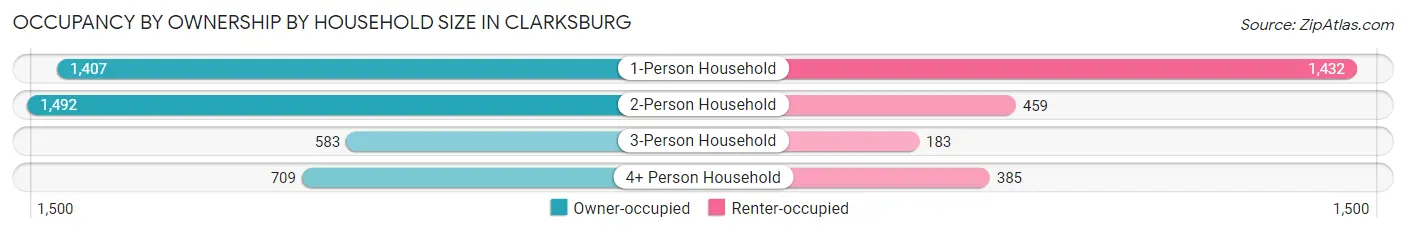
| Household Size | Owner-occupied | Renter-occupied |
| 1-Person Household | 1,407 (49.6%) | 1,432 (50.4%) |
| 2-Person Household | 1,492 (76.5%) | 459 (23.5%) |
| 3-Person Household | 583 (76.1%) | 183 (23.9%) |
| 4+ Person Household | 709 (64.8%) | 385 (35.2%) |
| Total Housing Units | 4,191 (63.0%) | 2,459 (37.0%) |
Occupancy by Educational Attainment in Clarksburg
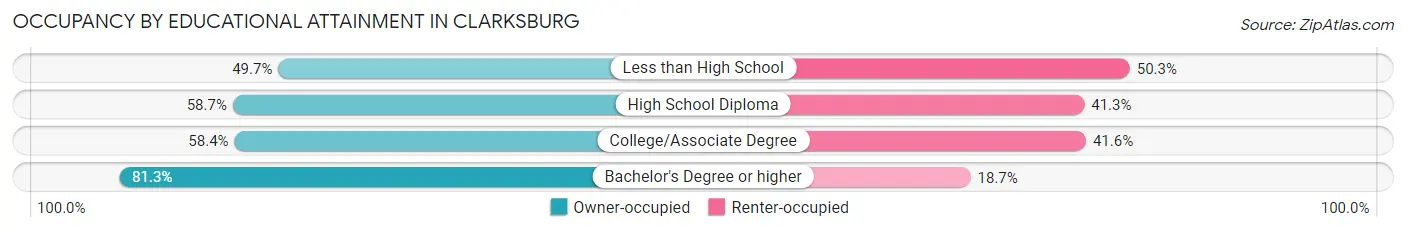
| Household Size | Owner-occupied | Renter-occupied |
| Less than High School | 510 (49.7%) | 516 (50.3%) |
| High School Diploma | 1,292 (58.7%) | 908 (41.3%) |
| College/Associate Degree | 1,005 (58.4%) | 716 (41.6%) |
| Bachelor's Degree or higher | 1,384 (81.3%) | 319 (18.7%) |
Occupancy by Age of Householder in Clarksburg
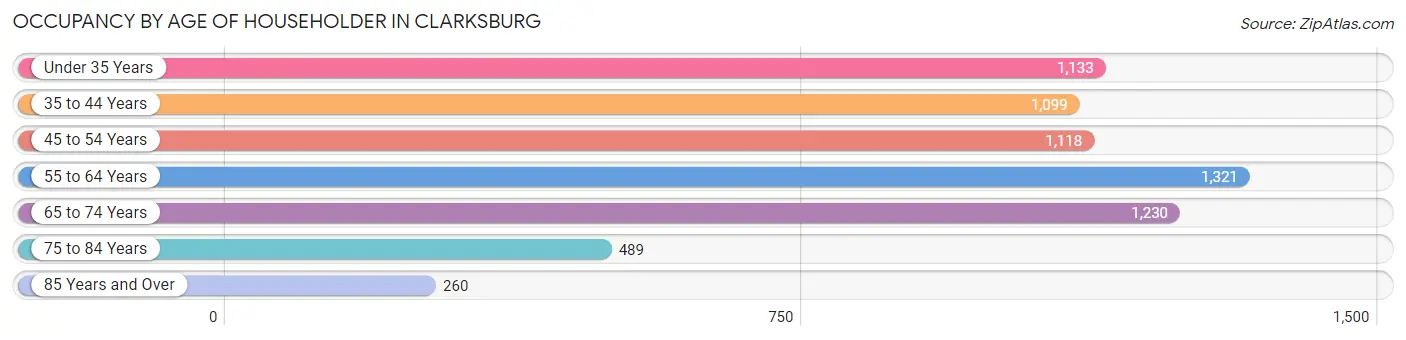
| Age Bracket | # Households | % Households |
| Under 35 Years | 1,133 | 17.0% |
| 35 to 44 Years | 1,099 | 16.5% |
| 45 to 54 Years | 1,118 | 16.8% |
| 55 to 64 Years | 1,321 | 19.9% |
| 65 to 74 Years | 1,230 | 18.5% |
| 75 to 84 Years | 489 | 7.3% |
| 85 Years and Over | 260 | 3.9% |
| Total | 6,650 | 100.0% |
Housing Finances in Clarksburg
Median Income by Occupancy in Clarksburg
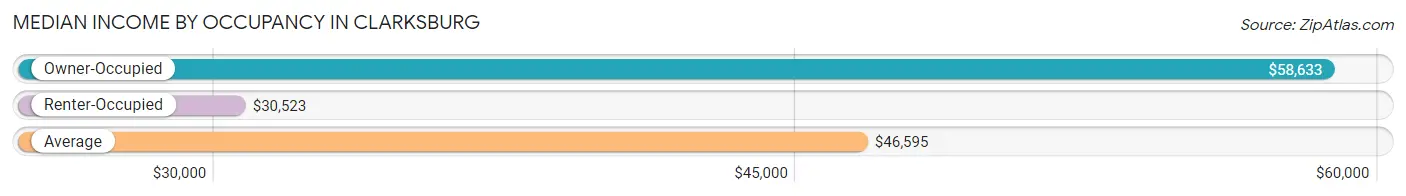
| Occupancy Type | # Households | Median Income |
| Owner-Occupied | 4,191 (63.0%) | $58,633 |
| Renter-Occupied | 2,459 (37.0%) | $30,523 |
| Average | 6,650 (100.0%) | $46,595 |
Occupancy by Householder Income Bracket in Clarksburg
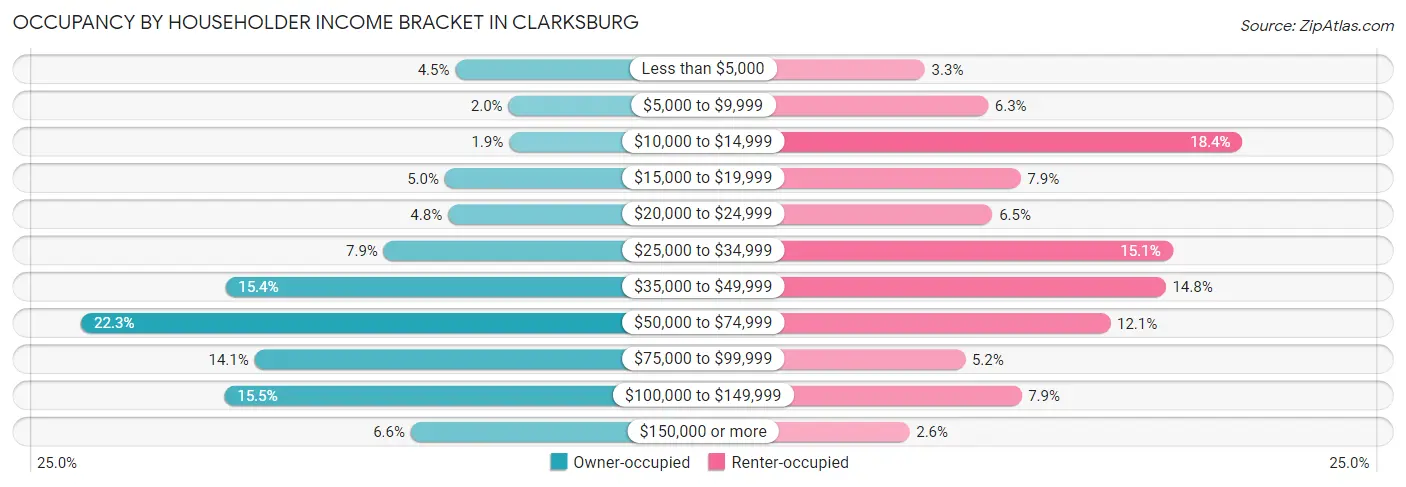
| Income Bracket | Owner-occupied | Renter-occupied |
| Less than $5,000 | 188 (4.5%) | 81 (3.3%) |
| $5,000 to $9,999 | 82 (2.0%) | 155 (6.3%) |
| $10,000 to $14,999 | 81 (1.9%) | 453 (18.4%) |
| $15,000 to $19,999 | 209 (5.0%) | 193 (7.9%) |
| $20,000 to $24,999 | 203 (4.8%) | 160 (6.5%) |
| $25,000 to $34,999 | 331 (7.9%) | 371 (15.1%) |
| $35,000 to $49,999 | 647 (15.4%) | 363 (14.8%) |
| $50,000 to $74,999 | 935 (22.3%) | 298 (12.1%) |
| $75,000 to $99,999 | 589 (14.1%) | 128 (5.2%) |
| $100,000 to $149,999 | 649 (15.5%) | 194 (7.9%) |
| $150,000 or more | 277 (6.6%) | 63 (2.6%) |
| Total | 4,191 (100.0%) | 2,459 (100.0%) |
Monthly Housing Cost Tiers in Clarksburg
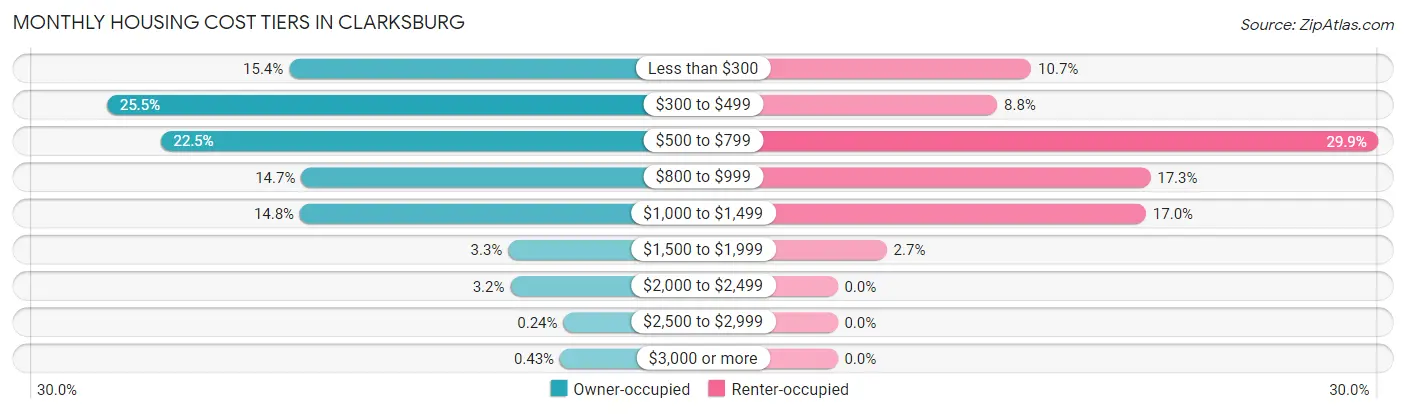
| Monthly Cost | Owner-occupied | Renter-occupied |
| Less than $300 | 645 (15.4%) | 263 (10.7%) |
| $300 to $499 | 1,067 (25.5%) | 217 (8.8%) |
| $500 to $799 | 943 (22.5%) | 735 (29.9%) |
| $800 to $999 | 617 (14.7%) | 425 (17.3%) |
| $1,000 to $1,499 | 620 (14.8%) | 419 (17.0%) |
| $1,500 to $1,999 | 138 (3.3%) | 67 (2.7%) |
| $2,000 to $2,499 | 133 (3.2%) | 0 (0.0%) |
| $2,500 to $2,999 | 10 (0.2%) | 0 (0.0%) |
| $3,000 or more | 18 (0.4%) | 0 (0.0%) |
| Total | 4,191 (100.0%) | 2,459 (100.0%) |
Physical Housing Characteristics in Clarksburg
Housing Structures in Clarksburg
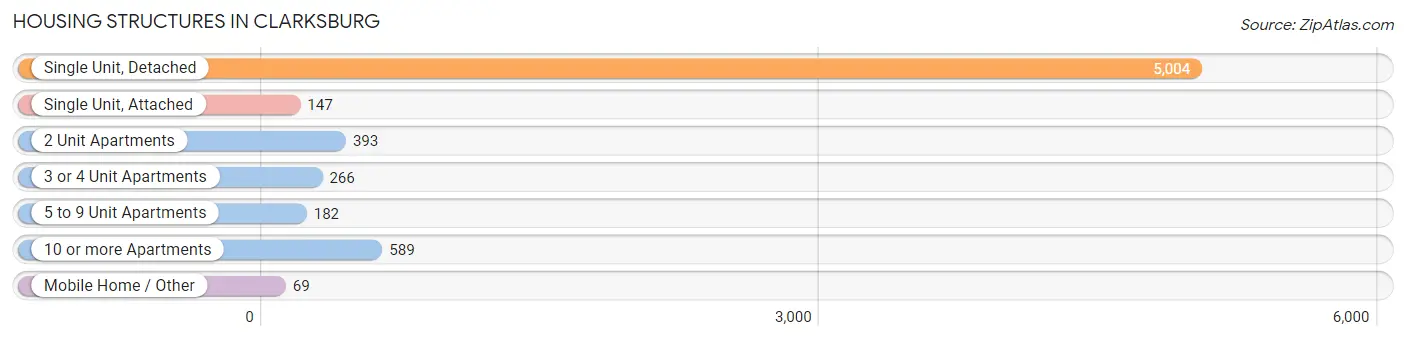
| Structure Type | # Housing Units | % Housing Units |
| Single Unit, Detached | 5,004 | 75.2% |
| Single Unit, Attached | 147 | 2.2% |
| 2 Unit Apartments | 393 | 5.9% |
| 3 or 4 Unit Apartments | 266 | 4.0% |
| 5 to 9 Unit Apartments | 182 | 2.7% |
| 10 or more Apartments | 589 | 8.9% |
| Mobile Home / Other | 69 | 1.0% |
| Total | 6,650 | 100.0% |
Housing Structures by Occupancy in Clarksburg
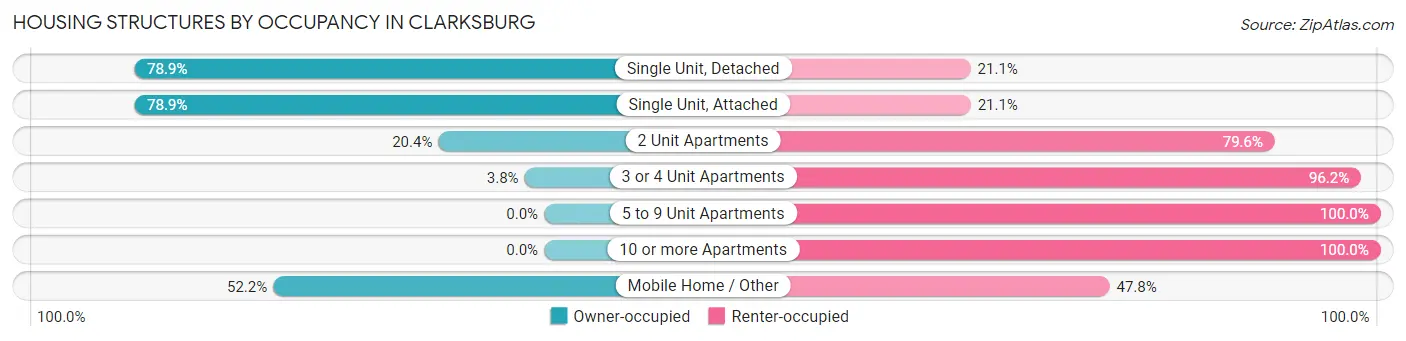
| Structure Type | Owner-occupied | Renter-occupied |
| Single Unit, Detached | 3,949 (78.9%) | 1,055 (21.1%) |
| Single Unit, Attached | 116 (78.9%) | 31 (21.1%) |
| 2 Unit Apartments | 80 (20.4%) | 313 (79.6%) |
| 3 or 4 Unit Apartments | 10 (3.8%) | 256 (96.2%) |
| 5 to 9 Unit Apartments | 0 (0.0%) | 182 (100.0%) |
| 10 or more Apartments | 0 (0.0%) | 589 (100.0%) |
| Mobile Home / Other | 36 (52.2%) | 33 (47.8%) |
| Total | 4,191 (63.0%) | 2,459 (37.0%) |
Housing Structures by Number of Rooms in Clarksburg
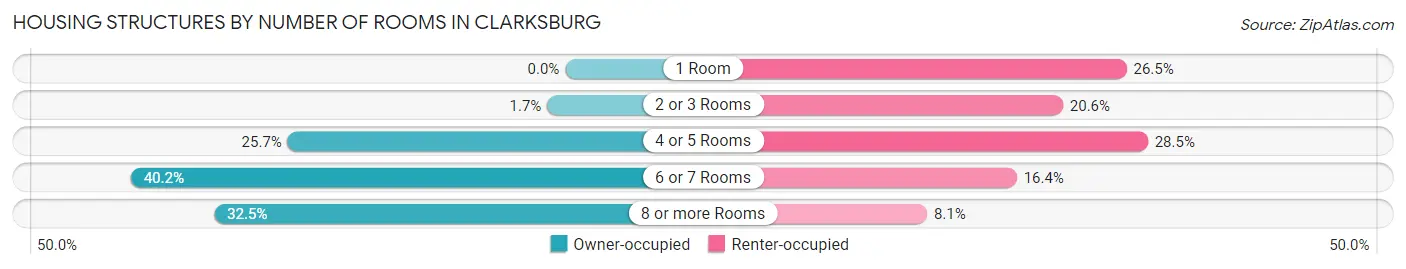
| Number of Rooms | Owner-occupied | Renter-occupied |
| 1 Room | 0 (0.0%) | 652 (26.5%) |
| 2 or 3 Rooms | 70 (1.7%) | 507 (20.6%) |
| 4 or 5 Rooms | 1,076 (25.7%) | 700 (28.5%) |
| 6 or 7 Rooms | 1,684 (40.2%) | 402 (16.4%) |
| 8 or more Rooms | 1,361 (32.5%) | 198 (8.1%) |
| Total | 4,191 (100.0%) | 2,459 (100.0%) |
Housing Structure by Heating Type in Clarksburg
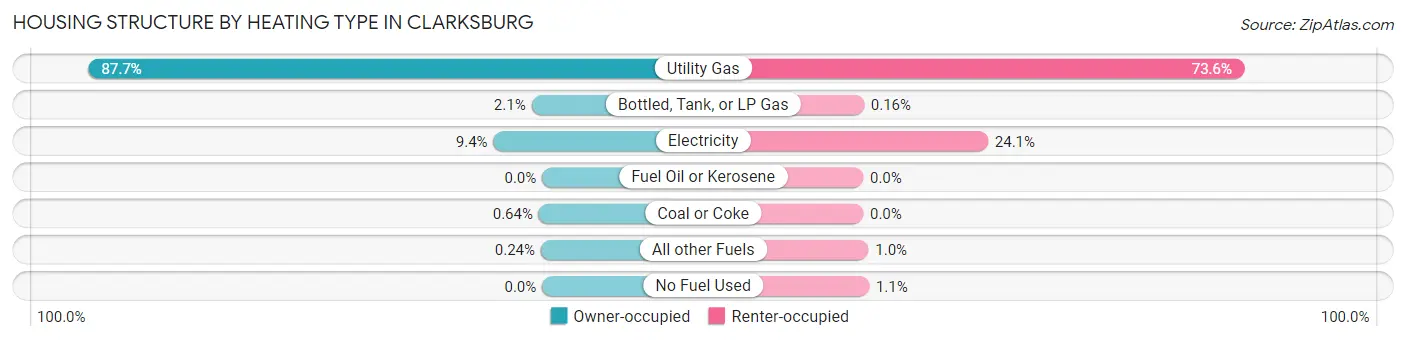
| Heating Type | Owner-occupied | Renter-occupied |
| Utility Gas | 3,674 (87.7%) | 1,809 (73.6%) |
| Bottled, Tank, or LP Gas | 86 (2.1%) | 4 (0.2%) |
| Electricity | 394 (9.4%) | 593 (24.1%) |
| Fuel Oil or Kerosene | 0 (0.0%) | 0 (0.0%) |
| Coal or Coke | 27 (0.6%) | 0 (0.0%) |
| All other Fuels | 10 (0.2%) | 25 (1.0%) |
| No Fuel Used | 0 (0.0%) | 28 (1.1%) |
| Total | 4,191 (100.0%) | 2,459 (100.0%) |
Household Vehicle Usage in Clarksburg
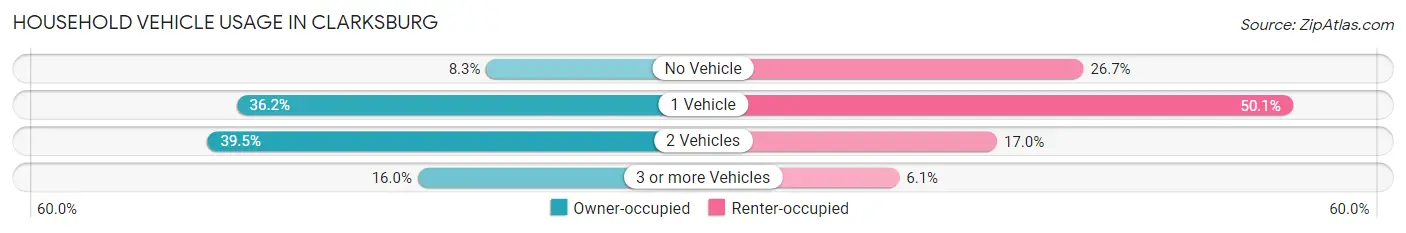
| Vehicles per Household | Owner-occupied | Renter-occupied |
| No Vehicle | 347 (8.3%) | 657 (26.7%) |
| 1 Vehicle | 1,519 (36.2%) | 1,233 (50.1%) |
| 2 Vehicles | 1,656 (39.5%) | 419 (17.0%) |
| 3 or more Vehicles | 669 (16.0%) | 150 (6.1%) |
| Total | 4,191 (100.0%) | 2,459 (100.0%) |
Real Estate & Mortgages in Clarksburg
Real Estate and Mortgage Overview in Clarksburg
| Characteristic | Without Mortgage | With Mortgage |
| Housing Units | 2,090 | 2,101 |
| Median Property Value | $99,500 | $116,300 |
| Median Household Income | $45,893 | $107 |
| Monthly Housing Costs | $376 | $11 |
| Real Estate Taxes | $706 | $50 |
Property Value by Mortgage Status in Clarksburg
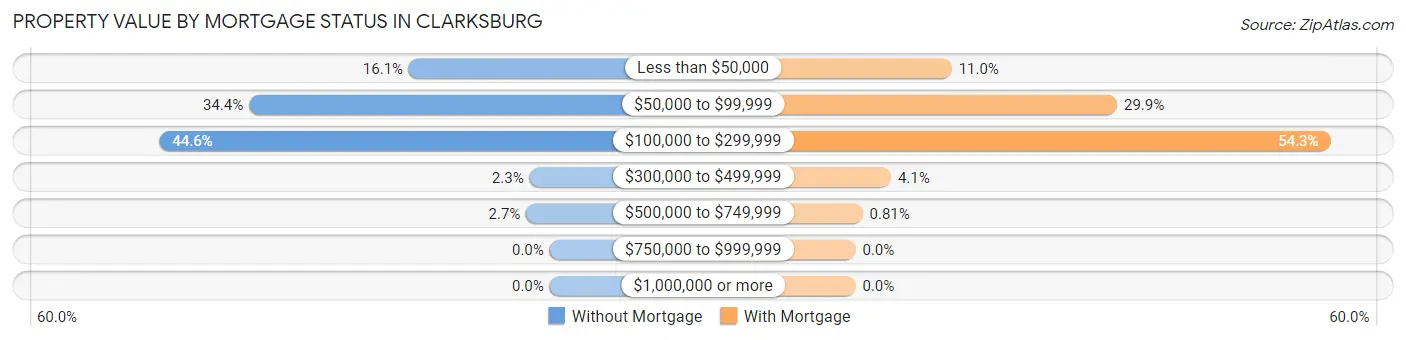
| Property Value | Without Mortgage | With Mortgage |
| Less than $50,000 | 336 (16.1%) | 231 (11.0%) |
| $50,000 to $99,999 | 718 (34.4%) | 628 (29.9%) |
| $100,000 to $299,999 | 932 (44.6%) | 1,140 (54.3%) |
| $300,000 to $499,999 | 48 (2.3%) | 85 (4.1%) |
| $500,000 to $749,999 | 56 (2.7%) | 17 (0.8%) |
| $750,000 to $999,999 | 0 (0.0%) | 0 (0.0%) |
| $1,000,000 or more | 0 (0.0%) | 0 (0.0%) |
| Total | 2,090 (100.0%) | 2,101 (100.0%) |
Household Income by Mortgage Status in Clarksburg
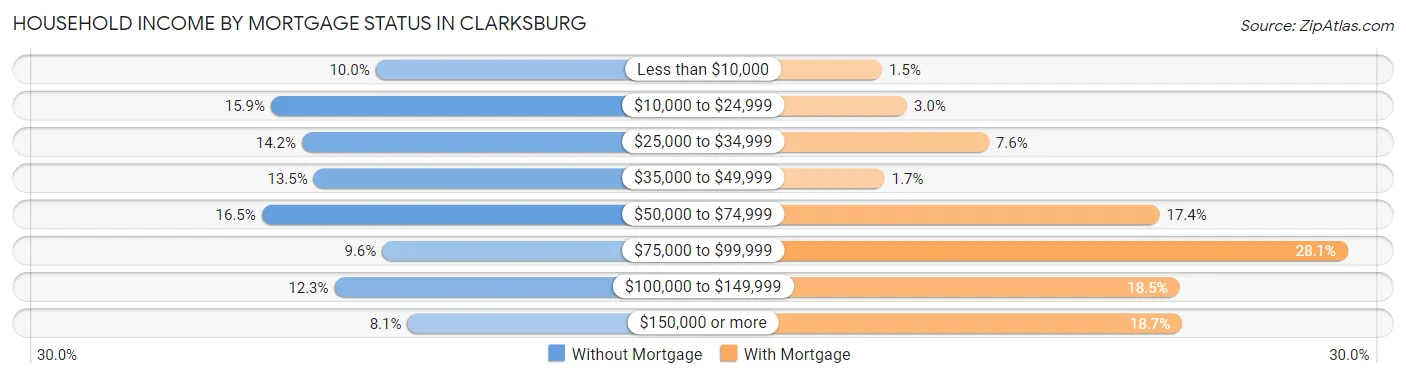
| Household Income | Without Mortgage | With Mortgage |
| Less than $10,000 | 208 (10.0%) | 32 (1.5%) |
| $10,000 to $24,999 | 333 (15.9%) | 62 (2.9%) |
| $25,000 to $34,999 | 296 (14.2%) | 160 (7.6%) |
| $35,000 to $49,999 | 282 (13.5%) | 35 (1.7%) |
| $50,000 to $74,999 | 344 (16.5%) | 365 (17.4%) |
| $75,000 to $99,999 | 200 (9.6%) | 591 (28.1%) |
| $100,000 to $149,999 | 257 (12.3%) | 389 (18.5%) |
| $150,000 or more | 170 (8.1%) | 392 (18.7%) |
| Total | 2,090 (100.0%) | 2,101 (100.0%) |
Property Value to Household Income Ratio in Clarksburg
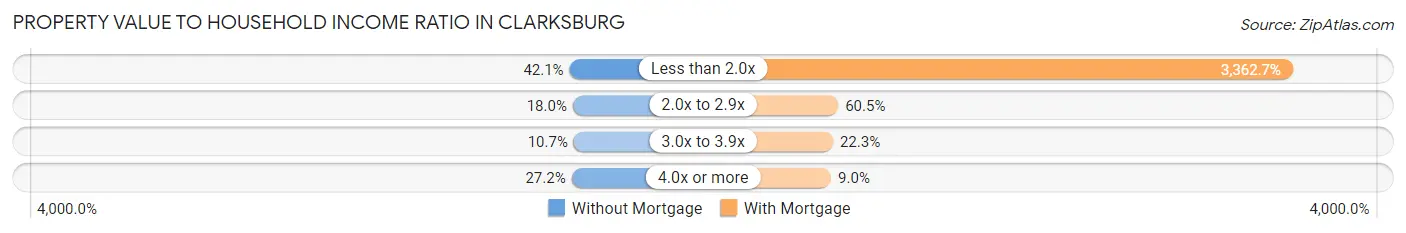
| Value-to-Income Ratio | Without Mortgage | With Mortgage |
| Less than 2.0x | 879 (42.1%) | 70,650 (3,362.7%) |
| 2.0x to 2.9x | 377 (18.0%) | 1,270 (60.5%) |
| 3.0x to 3.9x | 223 (10.7%) | 468 (22.3%) |
| 4.0x or more | 568 (27.2%) | 190 (9.0%) |
| Total | 2,090 (100.0%) | 2,101 (100.0%) |
Real Estate Taxes by Mortgage Status in Clarksburg
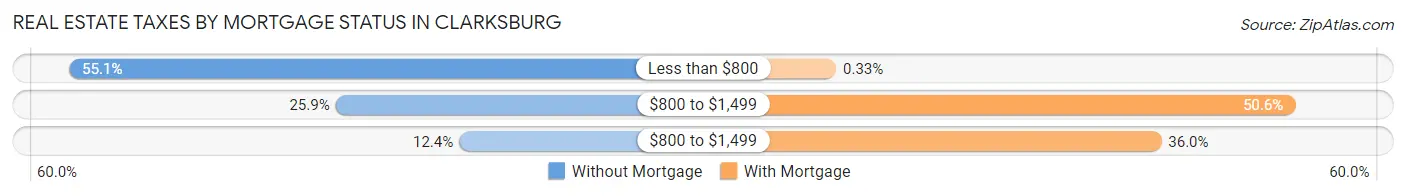
| Property Taxes | Without Mortgage | With Mortgage |
| Less than $800 | 1,152 (55.1%) | 7 (0.3%) |
| $800 to $1,499 | 542 (25.9%) | 1,064 (50.6%) |
| $800 to $1,499 | 259 (12.4%) | 756 (36.0%) |
| Total | 2,090 (100.0%) | 2,101 (100.0%) |
Health & Disability in Clarksburg
Health Insurance Coverage by Age in Clarksburg
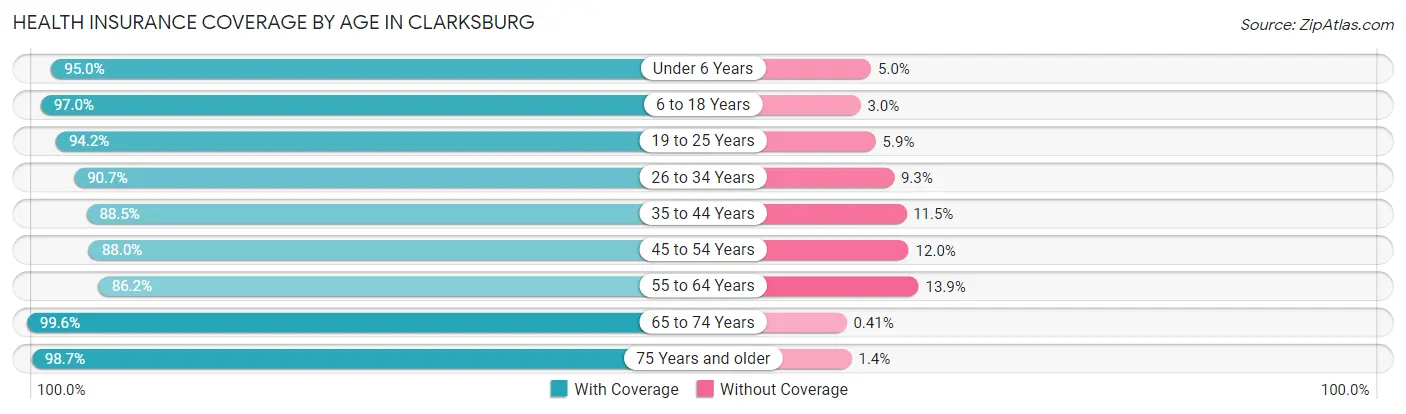
| Age Bracket | With Coverage | Without Coverage |
| Under 6 Years | 1,028 (95.0%) | 54 (5.0%) |
| 6 to 18 Years | 2,642 (97.0%) | 82 (3.0%) |
| 19 to 25 Years | 1,208 (94.2%) | 75 (5.9%) |
| 26 to 34 Years | 1,646 (90.7%) | 168 (9.3%) |
| 35 to 44 Years | 1,794 (88.5%) | 234 (11.5%) |
| 45 to 54 Years | 1,658 (88.0%) | 226 (12.0%) |
| 55 to 64 Years | 1,996 (86.2%) | 321 (13.9%) |
| 65 to 74 Years | 1,693 (99.6%) | 7 (0.4%) |
| 75 Years and older | 947 (98.7%) | 13 (1.3%) |
| Total | 14,612 (92.5%) | 1,180 (7.5%) |
Health Insurance Coverage by Citizenship Status in Clarksburg
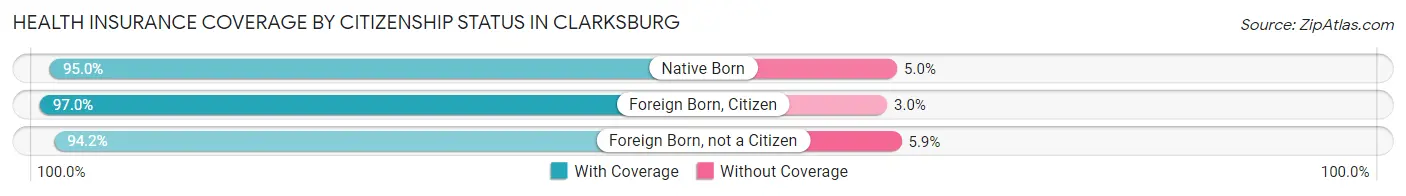
| Citizenship Status | With Coverage | Without Coverage |
| Native Born | 1,028 (95.0%) | 54 (5.0%) |
| Foreign Born, Citizen | 2,642 (97.0%) | 82 (3.0%) |
| Foreign Born, not a Citizen | 1,208 (94.2%) | 75 (5.9%) |
Health Insurance Coverage by Household Income in Clarksburg
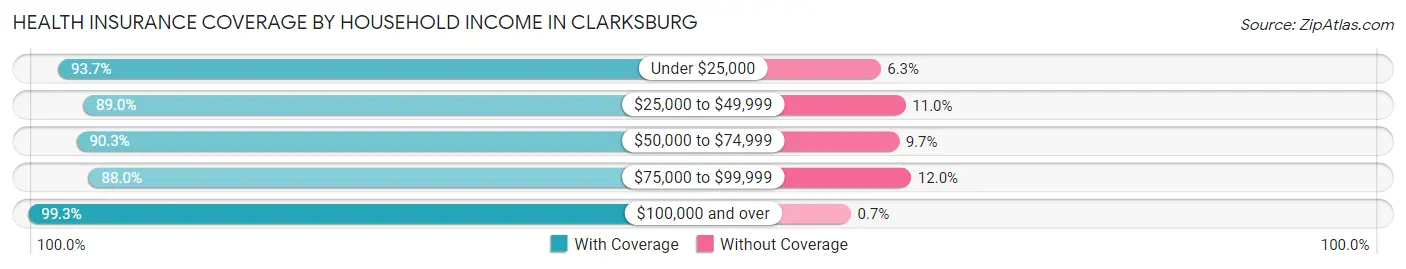
| Household Income | With Coverage | Without Coverage |
| Under $25,000 | 3,064 (93.7%) | 205 (6.3%) |
| $25,000 to $49,999 | 3,353 (89.0%) | 413 (11.0%) |
| $50,000 to $74,999 | 2,518 (90.3%) | 271 (9.7%) |
| $75,000 to $99,999 | 1,773 (88.0%) | 242 (12.0%) |
| $100,000 and over | 3,833 (99.3%) | 27 (0.7%) |
Public vs Private Health Insurance Coverage by Age in Clarksburg
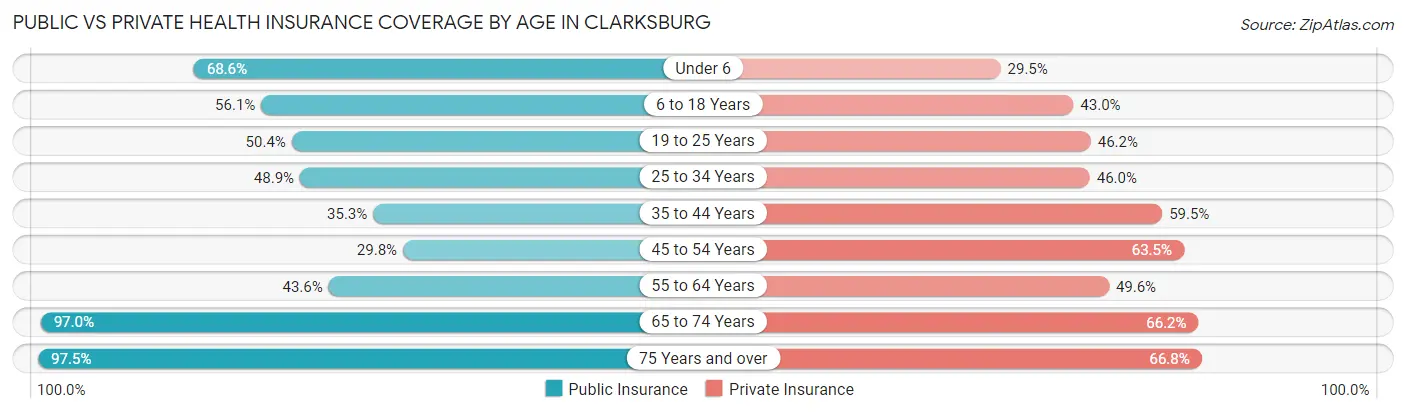
| Age Bracket | Public Insurance | Private Insurance |
| Under 6 | 742 (68.6%) | 319 (29.5%) |
| 6 to 18 Years | 1,528 (56.1%) | 1,171 (43.0%) |
| 19 to 25 Years | 647 (50.4%) | 593 (46.2%) |
| 25 to 34 Years | 887 (48.9%) | 835 (46.0%) |
| 35 to 44 Years | 716 (35.3%) | 1,206 (59.5%) |
| 45 to 54 Years | 561 (29.8%) | 1,196 (63.5%) |
| 55 to 64 Years | 1,010 (43.6%) | 1,149 (49.6%) |
| 65 to 74 Years | 1,649 (97.0%) | 1,125 (66.2%) |
| 75 Years and over | 936 (97.5%) | 641 (66.8%) |
| Total | 8,676 (54.9%) | 8,235 (52.1%) |
Disability Status by Sex by Age in Clarksburg
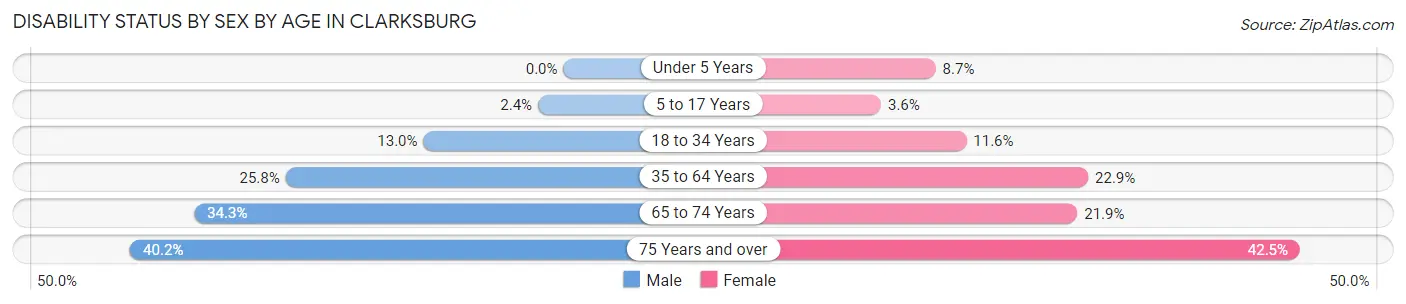
| Age Bracket | Male | Female |
| Under 5 Years | 0 (0.0%) | 48 (8.7%) |
| 5 to 17 Years | 33 (2.4%) | 50 (3.6%) |
| 18 to 34 Years | 224 (13.0%) | 185 (11.6%) |
| 35 to 64 Years | 778 (25.8%) | 734 (22.9%) |
| 65 to 74 Years | 269 (34.3%) | 200 (21.9%) |
| 75 Years and over | 123 (40.2%) | 278 (42.5%) |
Disability Class by Sex by Age in Clarksburg
Disability Class: Hearing Difficulty
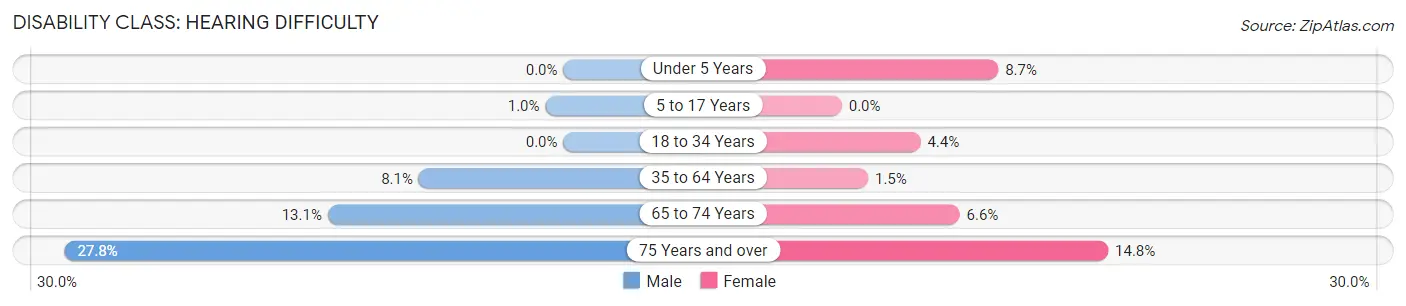
| Age Bracket | Male | Female |
| Under 5 Years | 0 (0.0%) | 48 (8.7%) |
| 5 to 17 Years | 14 (1.0%) | 0 (0.0%) |
| 18 to 34 Years | 0 (0.0%) | 70 (4.4%) |
| 35 to 64 Years | 243 (8.1%) | 47 (1.5%) |
| 65 to 74 Years | 103 (13.1%) | 60 (6.6%) |
| 75 Years and over | 85 (27.8%) | 97 (14.8%) |
Disability Class: Vision Difficulty
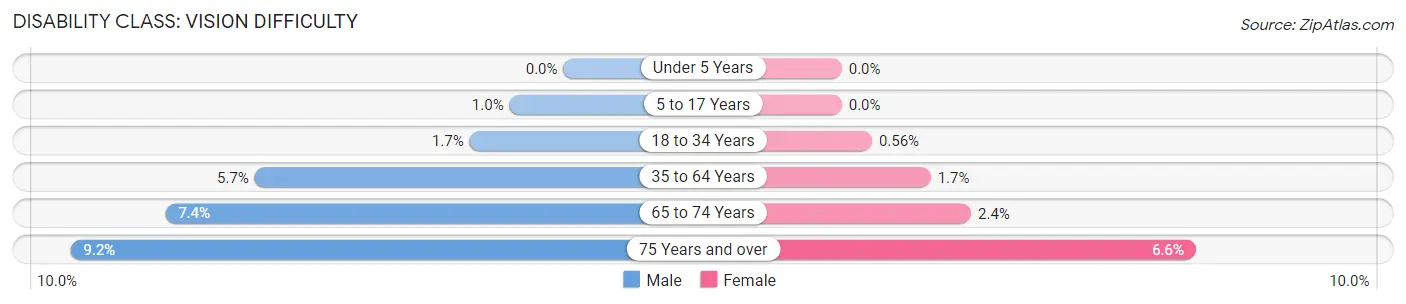
| Age Bracket | Male | Female |
| Under 5 Years | 0 (0.0%) | 0 (0.0%) |
| 5 to 17 Years | 14 (1.0%) | 0 (0.0%) |
| 18 to 34 Years | 30 (1.7%) | 9 (0.6%) |
| 35 to 64 Years | 173 (5.7%) | 53 (1.7%) |
| 65 to 74 Years | 58 (7.4%) | 22 (2.4%) |
| 75 Years and over | 28 (9.1%) | 43 (6.6%) |
Disability Class: Cognitive Difficulty
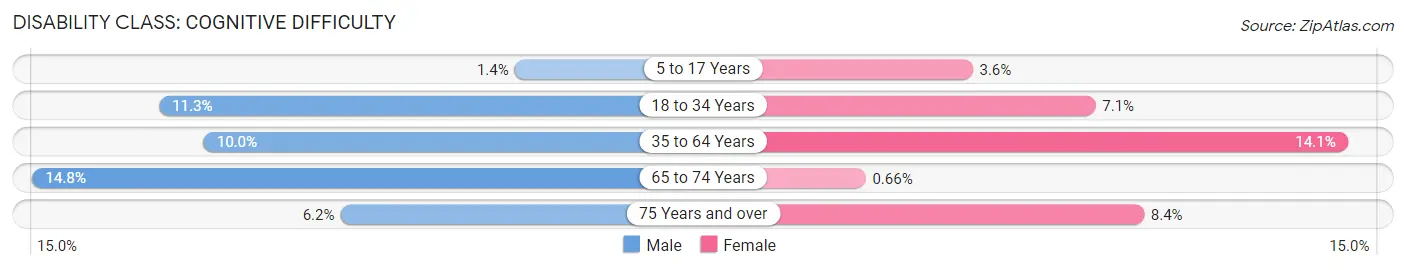
| Age Bracket | Male | Female |
| 5 to 17 Years | 19 (1.4%) | 50 (3.6%) |
| 18 to 34 Years | 194 (11.3%) | 113 (7.1%) |
| 35 to 64 Years | 302 (10.0%) | 452 (14.1%) |
| 65 to 74 Years | 116 (14.8%) | 6 (0.7%) |
| 75 Years and over | 19 (6.2%) | 55 (8.4%) |
Disability Class: Ambulatory Difficulty
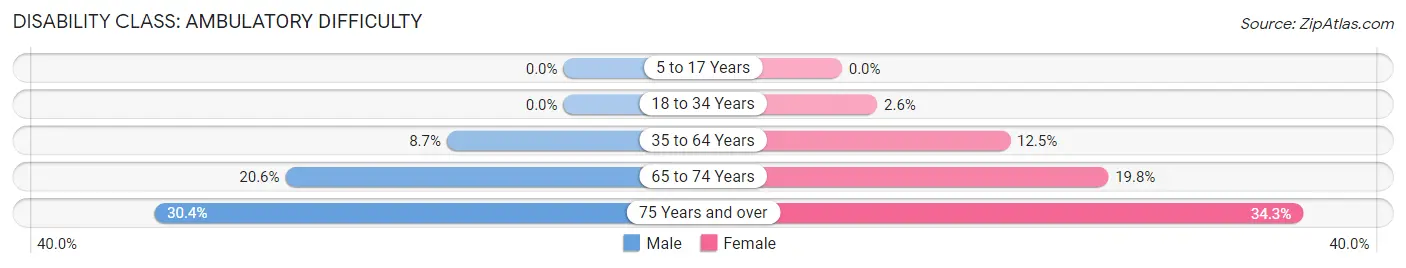
| Age Bracket | Male | Female |
| 5 to 17 Years | 0 (0.0%) | 0 (0.0%) |
| 18 to 34 Years | 0 (0.0%) | 42 (2.6%) |
| 35 to 64 Years | 261 (8.6%) | 401 (12.5%) |
| 65 to 74 Years | 162 (20.6%) | 181 (19.8%) |
| 75 Years and over | 93 (30.4%) | 224 (34.3%) |
Disability Class: Self-Care Difficulty
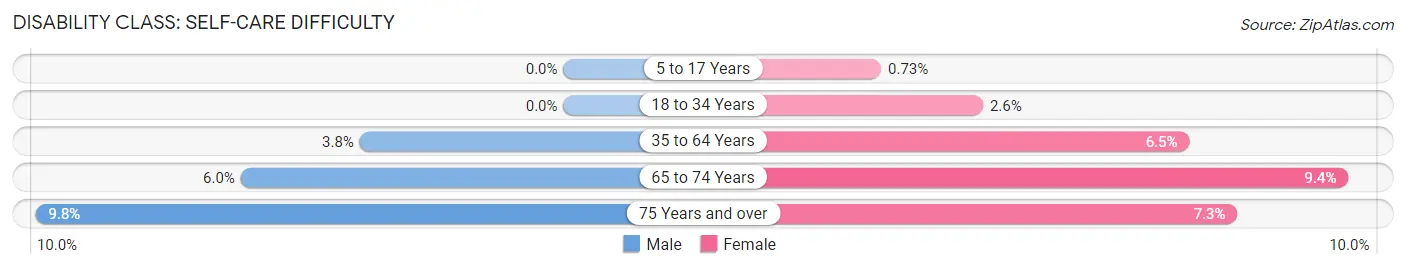
| Age Bracket | Male | Female |
| 5 to 17 Years | 0 (0.0%) | 10 (0.7%) |
| 18 to 34 Years | 0 (0.0%) | 42 (2.6%) |
| 35 to 64 Years | 114 (3.8%) | 207 (6.5%) |
| 65 to 74 Years | 47 (6.0%) | 86 (9.4%) |
| 75 Years and over | 30 (9.8%) | 48 (7.3%) |
Technology Access in Clarksburg
Computing Device Access in Clarksburg
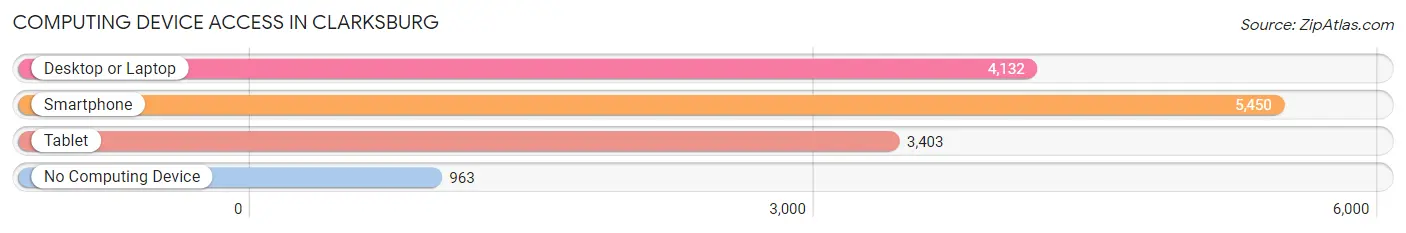
| Device Type | # Households | % Households |
| Desktop or Laptop | 4,132 | 62.1% |
| Smartphone | 5,450 | 82.0% |
| Tablet | 3,403 | 51.2% |
| No Computing Device | 963 | 14.5% |
| Total | 6,650 | 100.0% |
Internet Access in Clarksburg
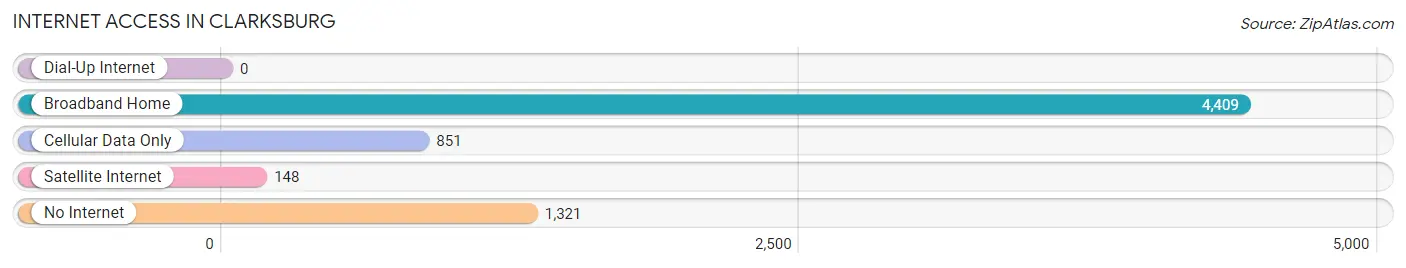
| Internet Type | # Households | % Households |
| Dial-Up Internet | 0 | 0.0% |
| Broadband Home | 4,409 | 66.3% |
| Cellular Data Only | 851 | 12.8% |
| Satellite Internet | 148 | 2.2% |
| No Internet | 1,321 | 19.9% |
| Total | 6,650 | 100.0% |
Clarksburg Summary
Clarksburg, West Virginia is a city located in the north-central part of the state, in Harrison County. It is the county seat and the largest city in the county. The city is situated along the West Fork River, and is located approximately 80 miles south of Pittsburgh, Pennsylvania. The city has a population of 16,743, according to the 2010 census.
History
Clarksburg was founded in 1785 by General George Rogers Clark, who named the city after his brother, General William Clark. The city was incorporated in 1817, and was the first city in West Virginia to be incorporated. The city was an important center of commerce and industry during the 19th century, and was the site of the first railroad in the state.
Geography
Clarksburg is located in the northern part of West Virginia, in Harrison County. The city is situated along the West Fork River, and is located approximately 80 miles south of Pittsburgh, Pennsylvania. The city has a total area of 8.3 square miles, of which 8.2 square miles is land and 0.1 square miles is water. The city is located in the Appalachian Mountains, and is surrounded by rolling hills and forests.
Economy
Clarksburg is an important center of commerce and industry in West Virginia. The city is home to several large employers, including the United States Postal Service, the West Virginia Department of Transportation, and the West Virginia University Health System. The city is also home to several manufacturing companies, including the Clarksburg Glass Company, the Clarksburg Steel Company, and the Clarksburg Textile Company.
Demographics
According to the 2010 census, the population of Clarksburg was 16,743. The racial makeup of the city was 92.3% White, 4.2% African American, 0.3% Native American, 0.7% Asian, 0.1% Pacific Islander, 0.7% from other races, and 1.7% from two or more races. The median household income was $30,945, and the median family income was $37,945. The per capita income was $17,845.
Conclusion
Clarksburg, West Virginia is a city located in the north-central part of the state, in Harrison County. It is the county seat and the largest city in the county. The city is situated along the West Fork River, and is located approximately 80 miles south of Pittsburgh, Pennsylvania. The city has a population of 16,743, according to the 2010 census. Clarksburg is an important center of commerce and industry in West Virginia, and is home to several large employers. The racial makeup of the city is 92.3% White, 4.2% African American, 0.3% Native American, 0.7% Asian, 0.1% Pacific Islander, 0.7% from other races, and 1.7% from two or more races. The median household income was $30,945, and the median family income was $37,945. The per capita income was $17,845.
Common Questions
What is the Total Population of Clarksburg?
Total Population of Clarksburg is 15,977.
What is the Total Male Population of Clarksburg?
Total Male Population of Clarksburg is 7,664.
What is the Total Female Population of Clarksburg?
Total Female Population of Clarksburg is 8,313.
What is the Ratio of Males per 100 Females in Clarksburg?
There are 92.19 Males per 100 Females in Clarksburg.
What is the Ratio of Females per 100 Males in Clarksburg?
There are 108.47 Females per 100 Males in Clarksburg.
What is the Median Population Age in Clarksburg?
Median Population Age in Clarksburg is 39.7 Years.
What is the Average Family Size in Clarksburg
Average Family Size in Clarksburg is 3.4 People.
What is the Average Household Size in Clarksburg
Average Household Size in Clarksburg is 2.4 People.
What is Per Capita Income in Clarksburg?
Per Capita income in Clarksburg is $26,585.
What is the Median Family Income in Clarksburg?
Median Family Income in Clarksburg is $63,786.
What is the Median Household income in Clarksburg?
Median Household Income in Clarksburg is $46,595.
What is Income or Wage Gap in Clarksburg?
Income or Wage Gap in Clarksburg is 18.6%.
Women in Clarksburg earn 81.4 cents for every dollar earned by a man.
What is Family Income Deficit in Clarksburg?
Family Income Deficit in Clarksburg is $12,808.
Families that are below poverty line in Clarksburg earn $12,808 less on average than the poverty threshold level.
What is Inequality or Gini Index in Clarksburg?
Inequality or Gini Index in Clarksburg is 0.44.
How Large is the Labor Force in Clarksburg?
There are 6,813 People in the Labor Forcein in Clarksburg.
What is the Percentage of People in the Labor Force in Clarksburg?
53.5% of People are in the Labor Force in Clarksburg.
What is the Unemployment Rate in Clarksburg?
Unemployment Rate in Clarksburg is 5.9%.