Mitchell Heights, WV
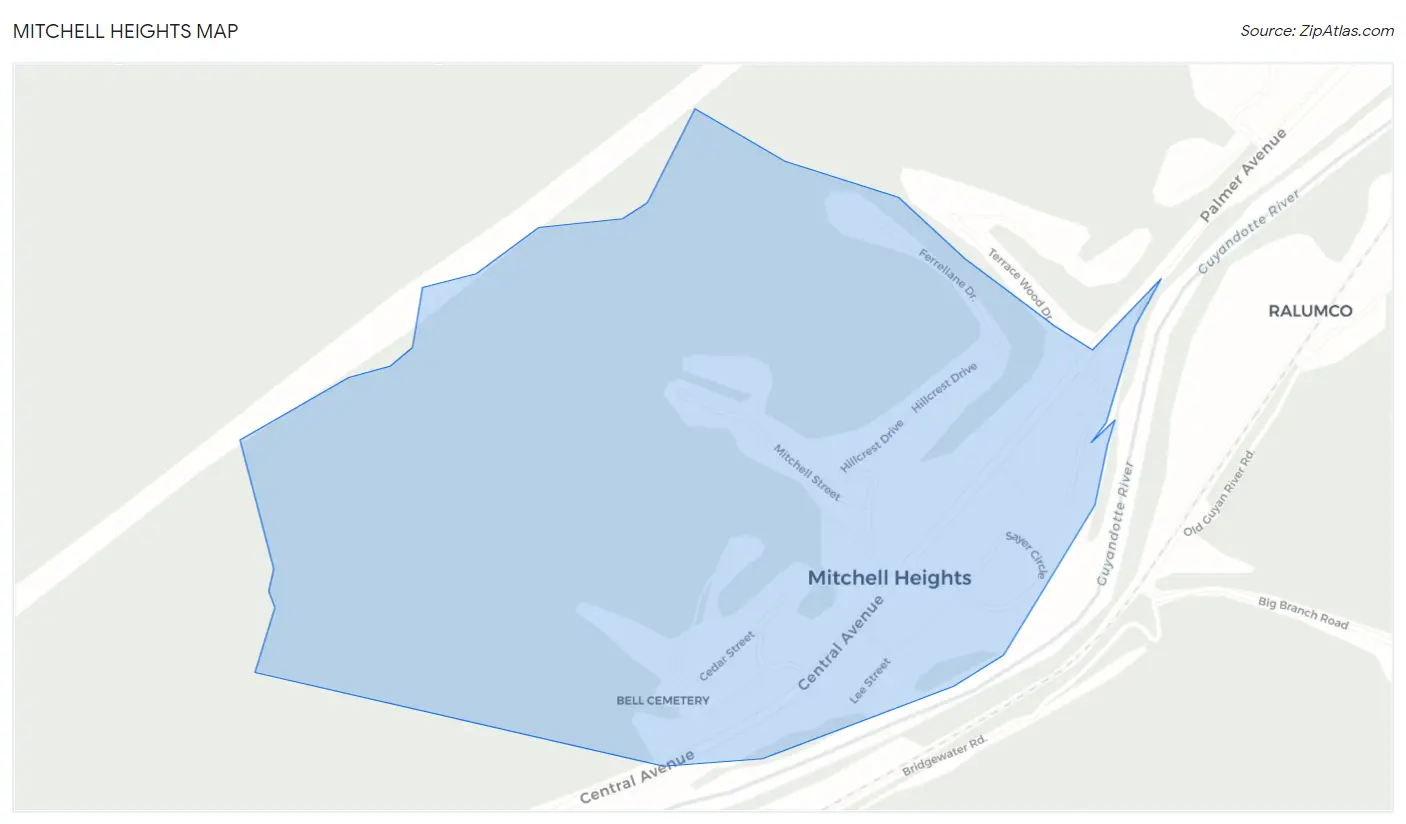
Mitchell Heights Map
Mitchell Heights Overview
414
TOTAL POPULATION
181
MALE POPULATION
233
FEMALE POPULATION
77.68
MALES / 100 FEMALES
128.73
FEMALES / 100 MALES
42.6
MEDIAN AGE
3.0
AVG FAMILY SIZE
2.5
AVG HOUSEHOLD SIZE
$37,947
PER CAPITA INCOME
$85,000
AVG FAMILY INCOME
$73,438
AVG HOUSEHOLD INCOME
53.7%
WAGE / INCOME GAP [ % ]
46.3¢/ $1
WAGE / INCOME GAP [ $ ]
0.42
INEQUALITY / GINI INDEX
200
LABOR FORCE [ PEOPLE ]
58.0%
PERCENT IN LABOR FORCE
4.5%
UNEMPLOYMENT RATE
Race in Mitchell Heights
The most populous races in Mitchell Heights are White / Caucasian (405 | 97.8%), Hispanic or Latino (5 | 1.2%), and Two or more Races (5 | 1.2%).
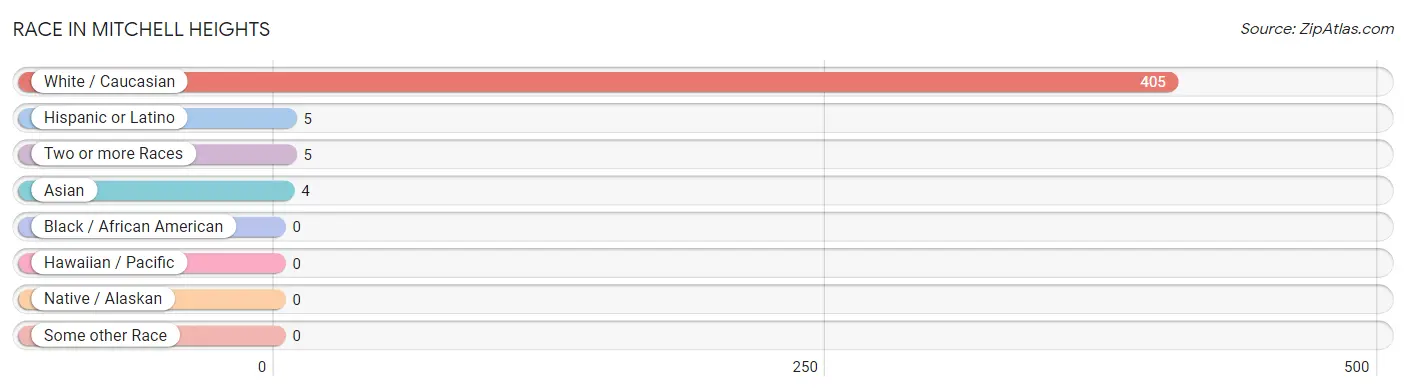
| Race | # Population | % Population |
| Asian | 4 | 1.0% |
| Black / African American | 0 | 0.0% |
| Hawaiian / Pacific | 0 | 0.0% |
| Hispanic or Latino | 5 | 1.2% |
| Native / Alaskan | 0 | 0.0% |
| White / Caucasian | 405 | 97.8% |
| Two or more Races | 5 | 1.2% |
| Some other Race | 0 | 0.0% |
| Total | 414 | 100.0% |
Ancestry in Mitchell Heights
The most populous ancestries reported in Mitchell Heights are Irish (81 | 19.6%), American (32 | 7.7%), Italian (32 | 7.7%), German (31 | 7.5%), and English (22 | 5.3%), together accounting for 47.8% of all Mitchell Heights residents.
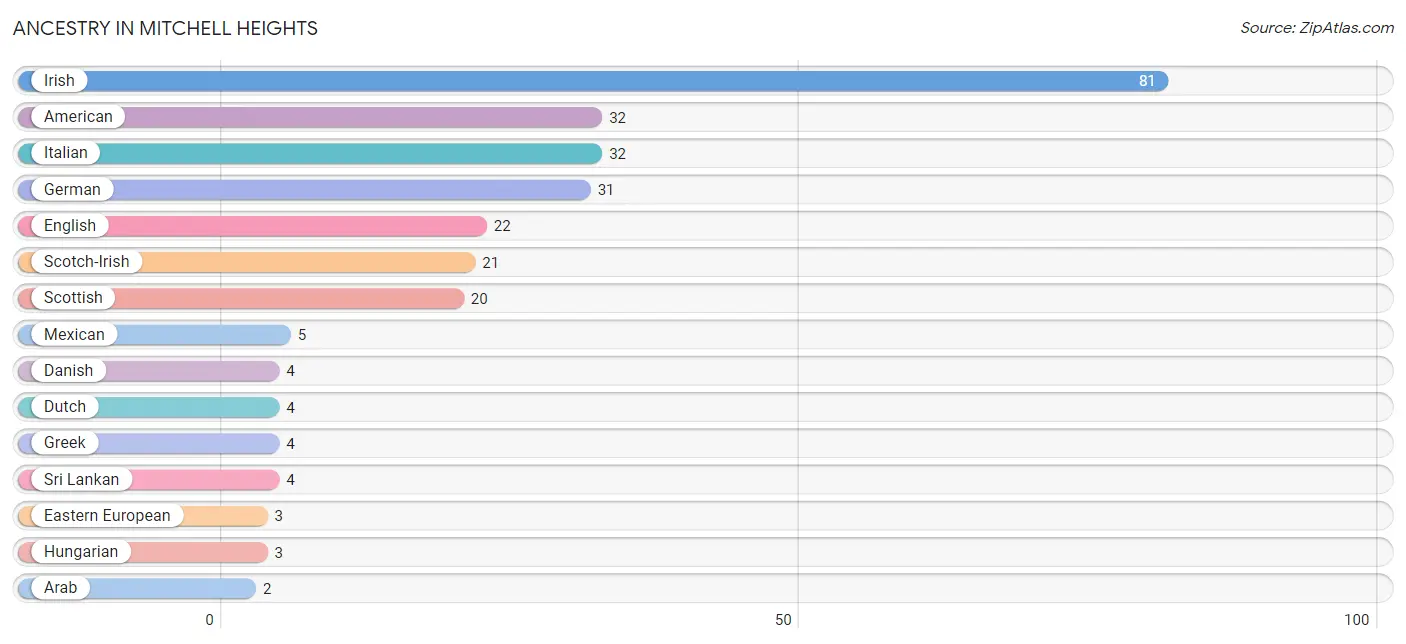
| Ancestry | # Population | % Population |
| American | 32 | 7.7% |
| Arab | 2 | 0.5% |
| Austrian | 1 | 0.2% |
| Danish | 4 | 1.0% |
| Dutch | 4 | 1.0% |
| Eastern European | 3 | 0.7% |
| English | 22 | 5.3% |
| German | 31 | 7.5% |
| Greek | 4 | 1.0% |
| Hungarian | 3 | 0.7% |
| Irish | 81 | 19.6% |
| Italian | 32 | 7.7% |
| Mexican | 5 | 1.2% |
| Scotch-Irish | 21 | 5.1% |
| Scottish | 20 | 4.8% |
| Sri Lankan | 4 | 1.0% |
| Syrian | 2 | 0.5% | View All 17 Rows |
Immigrants in Mitchell Heights
The most numerous immigrant groups reported in Mitchell Heights came from Asia (4 | 1.0%), South Eastern Asia (4 | 1.0%), Philippines (2 | 0.5%), and Vietnam (2 | 0.5%), together accounting for 2.9% of all Mitchell Heights residents.
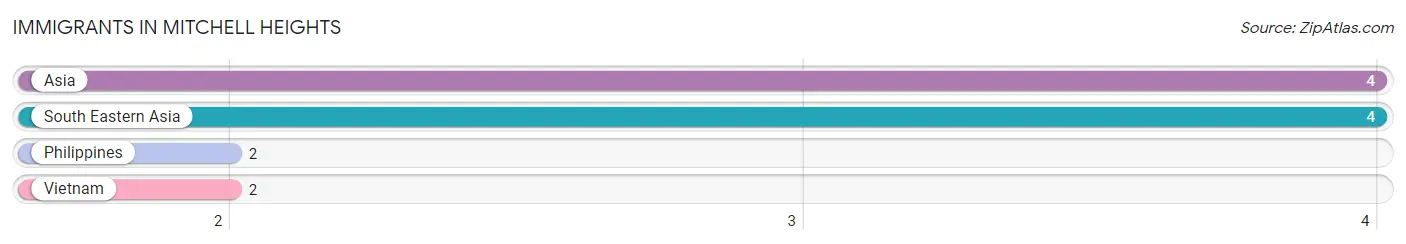
| Immigration Origin | # Population | % Population |
| Asia | 4 | 1.0% |
| Philippines | 2 | 0.5% |
| South Eastern Asia | 4 | 1.0% |
| Vietnam | 2 | 0.5% | View All 4 Rows |
Sex and Age in Mitchell Heights
Sex and Age in Mitchell Heights
The most populous age groups in Mitchell Heights are 40 to 44 Years (31 | 17.1%) for men and Under 5 Years (32 | 13.7%) for women.
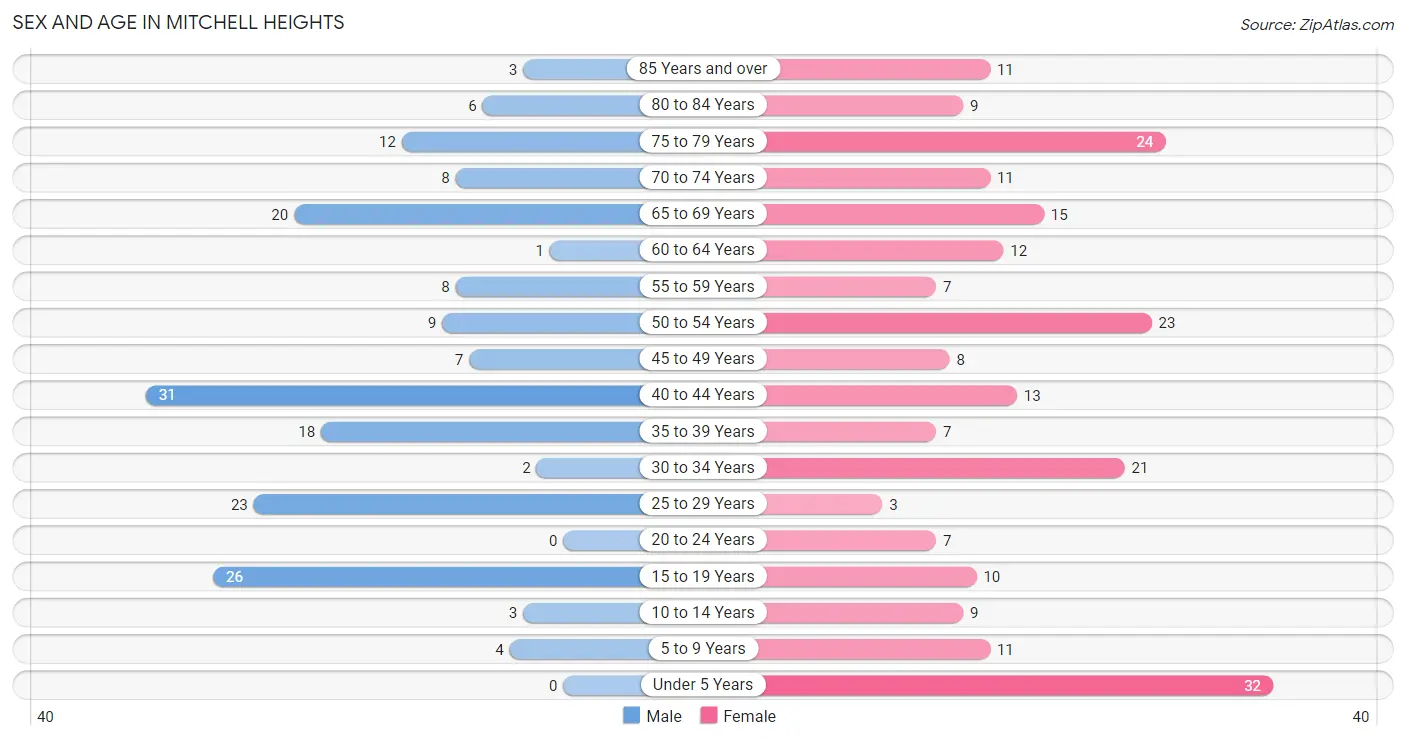
| Age Bracket | Male | Female |
| Under 5 Years | 0 (0.0%) | 32 (13.7%) |
| 5 to 9 Years | 4 (2.2%) | 11 (4.7%) |
| 10 to 14 Years | 3 (1.7%) | 9 (3.9%) |
| 15 to 19 Years | 26 (14.4%) | 10 (4.3%) |
| 20 to 24 Years | 0 (0.0%) | 7 (3.0%) |
| 25 to 29 Years | 23 (12.7%) | 3 (1.3%) |
| 30 to 34 Years | 2 (1.1%) | 21 (9.0%) |
| 35 to 39 Years | 18 (9.9%) | 7 (3.0%) |
| 40 to 44 Years | 31 (17.1%) | 13 (5.6%) |
| 45 to 49 Years | 7 (3.9%) | 8 (3.4%) |
| 50 to 54 Years | 9 (5.0%) | 23 (9.9%) |
| 55 to 59 Years | 8 (4.4%) | 7 (3.0%) |
| 60 to 64 Years | 1 (0.5%) | 12 (5.1%) |
| 65 to 69 Years | 20 (11.1%) | 15 (6.4%) |
| 70 to 74 Years | 8 (4.4%) | 11 (4.7%) |
| 75 to 79 Years | 12 (6.6%) | 24 (10.3%) |
| 80 to 84 Years | 6 (3.3%) | 9 (3.9%) |
| 85 Years and over | 3 (1.7%) | 11 (4.7%) |
| Total | 181 (100.0%) | 233 (100.0%) |
Families and Households in Mitchell Heights
Median Family Size in Mitchell Heights
The median family size in Mitchell Heights is 3.02 persons per family, with married-couple families (90 | 76.3%) accounting for the largest median family size of 3.07 persons per family. On the other hand, single male/father families (2 | 1.7%) represent the smallest median family size with 2.00 persons per family.
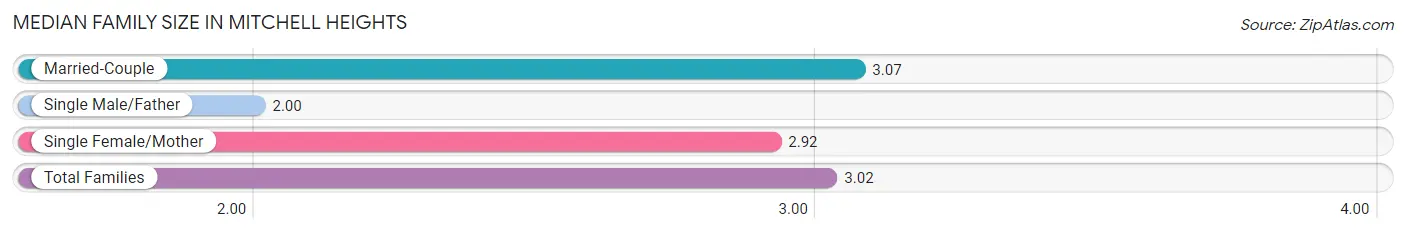
| Family Type | # Families | Family Size |
| Married-Couple | 90 (76.3%) | 3.07 |
| Single Male/Father | 2 (1.7%) | 2.00 |
| Single Female/Mother | 26 (22.0%) | 2.92 |
| Total Families | 118 (100.0%) | 3.02 |
Median Household Size in Mitchell Heights
The median household size in Mitchell Heights is 2.51 persons per household, with married-couple households (90 | 54.5%) accounting for the largest median household size of 3.07 persons per household. non-family households (47 | 28.5%) represent the smallest median household size with 1.23 persons per household.
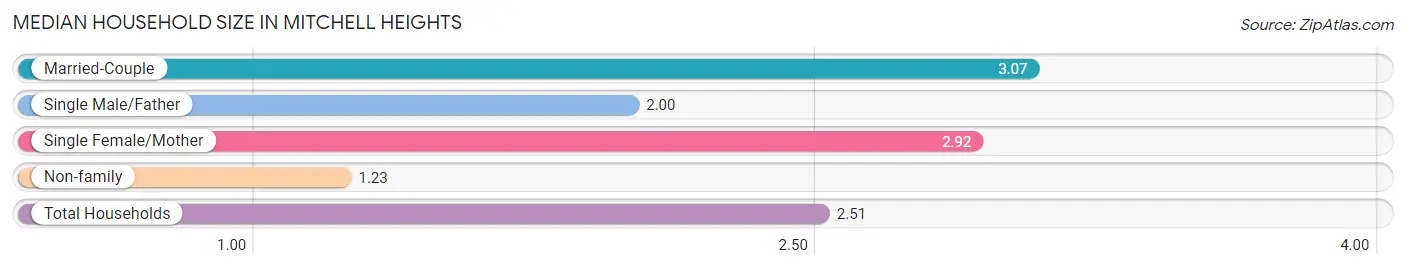
| Household Type | # Households | Household Size |
| Married-Couple | 90 (54.5%) | 3.07 |
| Single Male/Father | 2 (1.2%) | 2.00 |
| Single Female/Mother | 26 (15.8%) | 2.92 |
| Non-family | 47 (28.5%) | 1.23 |
| Total Households | 165 (100.0%) | 2.51 |
Household Size by Marriage Status in Mitchell Heights
Out of a total of 165 households in Mitchell Heights, 118 (71.5%) are family households, while 47 (28.5%) are nonfamily households. The most numerous type of family households are 2-person households, comprising 58, and the most common type of nonfamily households are 1-person households, comprising 39.
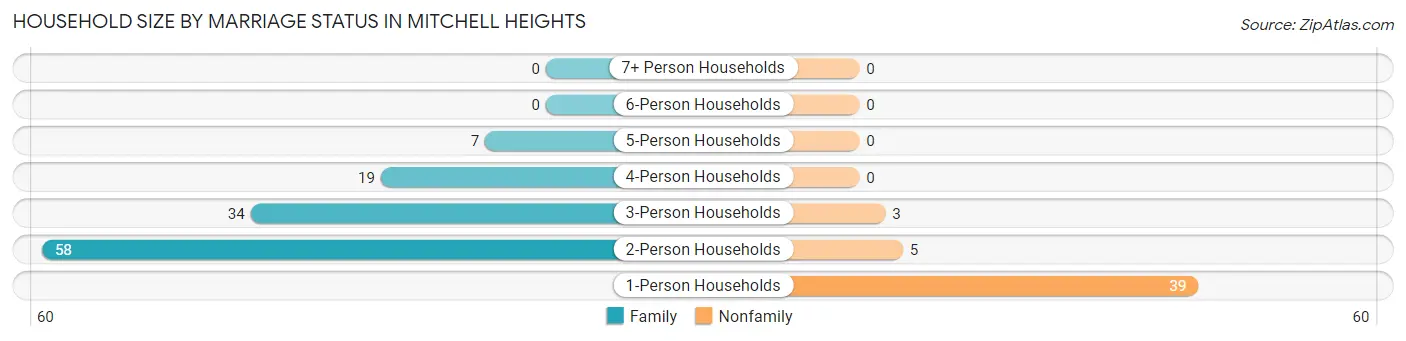
| Household Size | Family Households | Nonfamily Households |
| 1-Person Households | - | 39 (23.6%) |
| 2-Person Households | 58 (35.1%) | 5 (3.0%) |
| 3-Person Households | 34 (20.6%) | 3 (1.8%) |
| 4-Person Households | 19 (11.5%) | 0 (0.0%) |
| 5-Person Households | 7 (4.2%) | 0 (0.0%) |
| 6-Person Households | 0 (0.0%) | 0 (0.0%) |
| 7+ Person Households | 0 (0.0%) | 0 (0.0%) |
| Total | 118 (71.5%) | 47 (28.5%) |
Female Fertility in Mitchell Heights
Fertility by Age in Mitchell Heights
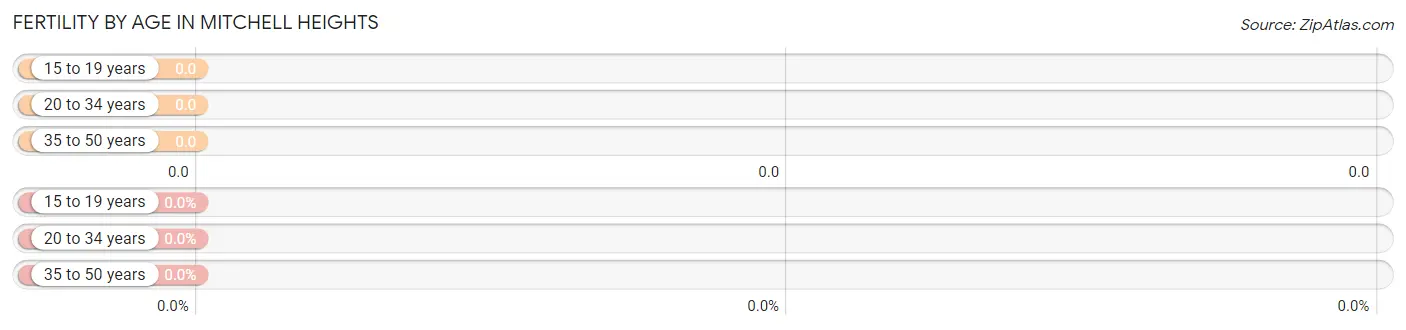
| Age Bracket | Women with Births | Births / 1,000 Women |
| 15 to 19 years | 0 (0.0%) | 0.0 |
| 20 to 34 years | 0 (0.0%) | 0.0 |
| 35 to 50 years | 0 (0.0%) | 0.0 |
| Total | 0 (0.0%) | 0.0 |
Fertility by Age by Marriage Status in Mitchell Heights
| Age Bracket | Married | Unmarried |
| 15 to 19 years | 0 (0.0%) | 0 (0.0%) |
| 20 to 34 years | 0 (0.0%) | 0 (0.0%) |
| 35 to 50 years | 0 (0.0%) | 0 (0.0%) |
| Total | 0 (0.0%) | 0 (0.0%) |
Fertility by Education in Mitchell Heights
| Educational Attainment | Women with Births | Births / 1,000 Women |
| Less than High School | 0 (0.0%) | 0.0 |
| High School Diploma | 0 (0.0%) | 0.0 |
| College or Associate's Degree | 0 (0.0%) | 0.0 |
| Bachelor's Degree | 0 (0.0%) | 0.0 |
| Graduate Degree | 0 (0.0%) | 0.0 |
| Total | 0 (0.0%) | 0.0 |
Fertility by Education by Marriage Status in Mitchell Heights
| Educational Attainment | Married | Unmarried |
| Less than High School | 0 (0.0%) | 0 (0.0%) |
| High School Diploma | 0 (0.0%) | 0 (0.0%) |
| College or Associate's Degree | 0 (0.0%) | 0 (0.0%) |
| Bachelor's Degree | 0 (0.0%) | 0 (0.0%) |
| Graduate Degree | 0 (0.0%) | 0 (0.0%) |
| Total | 0 (0.0%) | 0 (0.0%) |
Income in Mitchell Heights
Income Overview in Mitchell Heights
Per Capita Income in Mitchell Heights is $37,947, while median incomes of families and households are $85,000 and $73,438 respectively.
| Characteristic | Number | Measure |
| Per Capita Income | 414 | $37,947 |
| Median Family Income | 118 | $85,000 |
| Mean Family Income | 118 | $112,574 |
| Median Household Income | 165 | $73,438 |
| Mean Household Income | 165 | $91,879 |
| Income Deficit | 118 | $0 |
| Wage / Income Gap (%) | 414 | 53.70% |
| Wage / Income Gap ($) | 414 | 46.30¢ per $1 |
| Gini / Inequality Index | 414 | 0.42 |
Earnings by Sex in Mitchell Heights
Average Earnings in Mitchell Heights are $34,615, $24,886 for men and $53,750 for women, a difference of 53.7%.
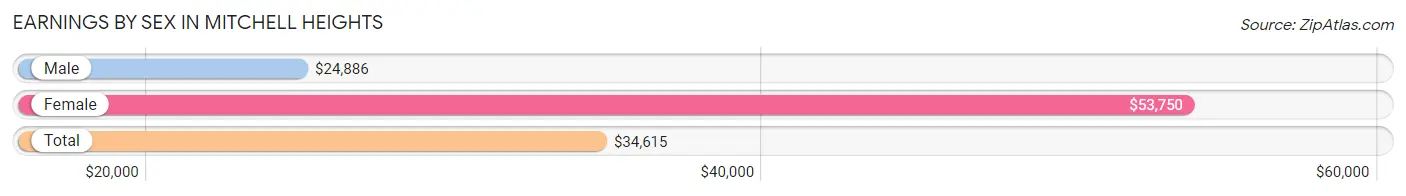
| Sex | Number | Average Earnings |
| Male | 113 (52.8%) | $24,886 |
| Female | 101 (47.2%) | $53,750 |
| Total | 214 (100.0%) | $34,615 |
Earnings by Sex by Income Bracket in Mitchell Heights
The most common earnings brackets in Mitchell Heights are $2,499 or less for men (19 | 16.8%) and $75,000 to $99,999 for women (20 | 19.8%).
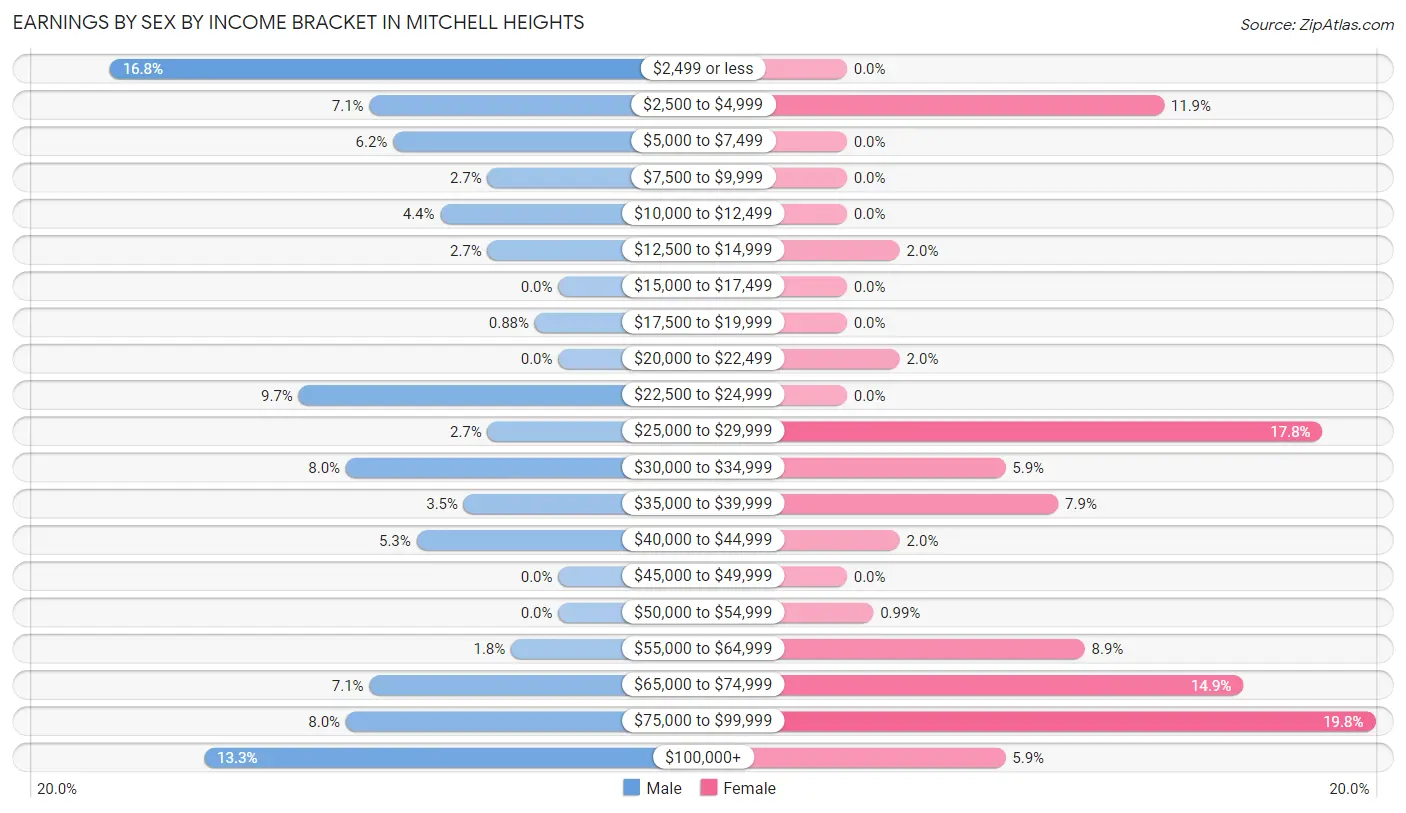
| Income | Male | Female |
| $2,499 or less | 19 (16.8%) | 0 (0.0%) |
| $2,500 to $4,999 | 8 (7.1%) | 12 (11.9%) |
| $5,000 to $7,499 | 7 (6.2%) | 0 (0.0%) |
| $7,500 to $9,999 | 3 (2.6%) | 0 (0.0%) |
| $10,000 to $12,499 | 5 (4.4%) | 0 (0.0%) |
| $12,500 to $14,999 | 3 (2.6%) | 2 (2.0%) |
| $15,000 to $17,499 | 0 (0.0%) | 0 (0.0%) |
| $17,500 to $19,999 | 1 (0.9%) | 0 (0.0%) |
| $20,000 to $22,499 | 0 (0.0%) | 2 (2.0%) |
| $22,500 to $24,999 | 11 (9.7%) | 0 (0.0%) |
| $25,000 to $29,999 | 3 (2.6%) | 18 (17.8%) |
| $30,000 to $34,999 | 9 (8.0%) | 6 (5.9%) |
| $35,000 to $39,999 | 4 (3.5%) | 8 (7.9%) |
| $40,000 to $44,999 | 6 (5.3%) | 2 (2.0%) |
| $45,000 to $49,999 | 0 (0.0%) | 0 (0.0%) |
| $50,000 to $54,999 | 0 (0.0%) | 1 (1.0%) |
| $55,000 to $64,999 | 2 (1.8%) | 9 (8.9%) |
| $65,000 to $74,999 | 8 (7.1%) | 15 (14.8%) |
| $75,000 to $99,999 | 9 (8.0%) | 20 (19.8%) |
| $100,000+ | 15 (13.3%) | 6 (5.9%) |
| Total | 113 (100.0%) | 101 (100.0%) |
Earnings by Sex by Educational Attainment in Mitchell Heights
Average earnings in Mitchell Heights are $33,889 for men and $60,000 for women, a difference of 43.5%. Men with an educational attainment of graduate degree enjoy the highest average annual earnings of $81,750, while those with graduate degree education earn the least with $81,750. Women with an educational attainment of graduate degree earn the most with the average annual earnings of $76,786, while those with high school diploma education have the smallest earnings of $25,000.
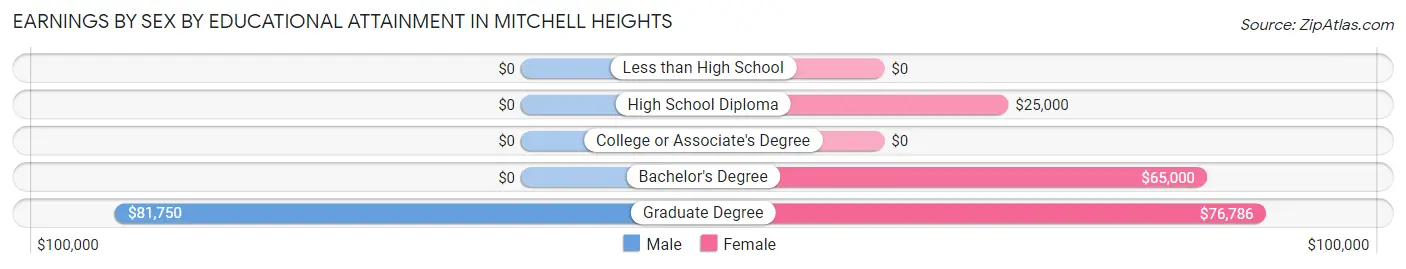
| Educational Attainment | Male Income | Female Income |
| Less than High School | - | - |
| High School Diploma | - | - |
| College or Associate's Degree | - | - |
| Bachelor's Degree | - | - |
| Graduate Degree | $81,750 | $76,786 |
| Total | $33,889 | $60,000 |
Family Income in Mitchell Heights
Family Income Brackets in Mitchell Heights
According to the Mitchell Heights family income data, there are 39 families falling into the $100,000 to $149,999 income range, which is the most common income bracket and makes up 33.1% of all families.
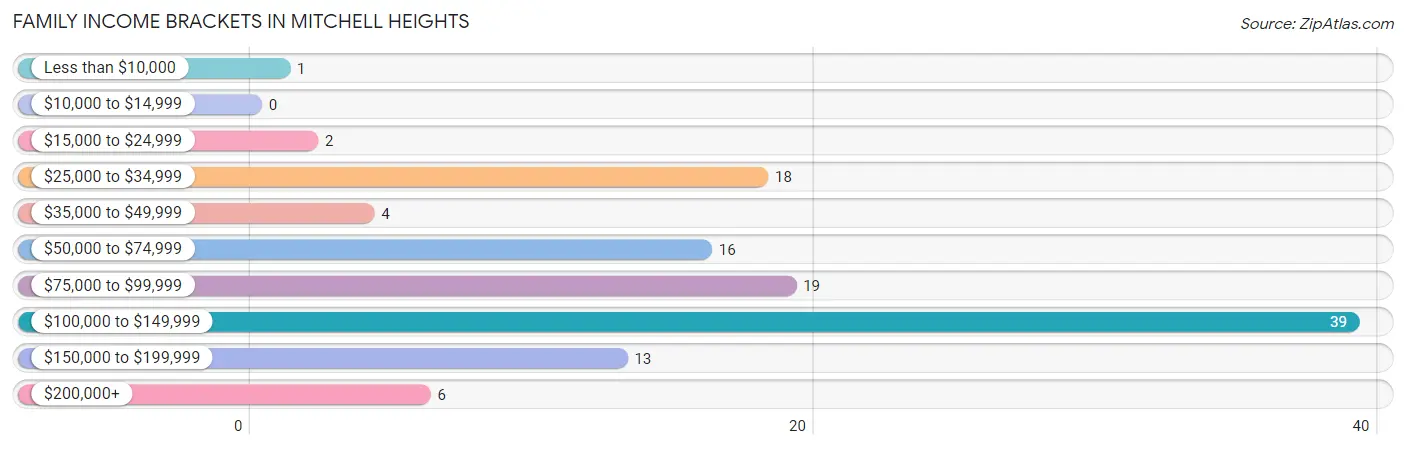
| Income Bracket | # Families | % Families |
| Less than $10,000 | 1 | 0.8% |
| $10,000 to $14,999 | 0 | 0.0% |
| $15,000 to $24,999 | 2 | 1.7% |
| $25,000 to $34,999 | 18 | 15.3% |
| $35,000 to $49,999 | 4 | 3.4% |
| $50,000 to $74,999 | 16 | 13.6% |
| $75,000 to $99,999 | 19 | 16.1% |
| $100,000 to $149,999 | 39 | 33.1% |
| $150,000 to $199,999 | 13 | 11.0% |
| $200,000+ | 6 | 5.1% |
Family Income by Famaliy Size in Mitchell Heights
4-person families (19 | 16.1%) account for the highest median family income in Mitchell Heights with $128,438 per family, while 2-person families (58 | 49.1%) have the highest median income of $40,416 per family member.
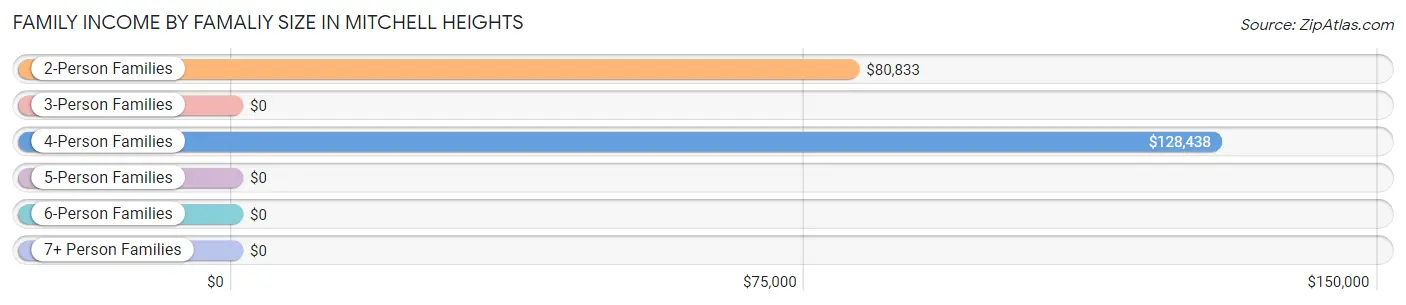
| Income Bracket | # Families | Median Income |
| 2-Person Families | 58 (49.1%) | $80,833 |
| 3-Person Families | 34 (28.8%) | $0 |
| 4-Person Families | 19 (16.1%) | $128,438 |
| 5-Person Families | 7 (5.9%) | $0 |
| 6-Person Families | 0 (0.0%) | $0 |
| 7+ Person Families | 0 (0.0%) | $0 |
| Total | 118 (100.0%) | $85,000 |
Family Income by Number of Earners in Mitchell Heights
The median family income in Mitchell Heights is $85,000, with families comprising 3+ earners (14) having the highest median family income of $148,750, while families with no earners (17) have the lowest median family income of $68,542, accounting for 11.9% and 14.4% of families, respectively.
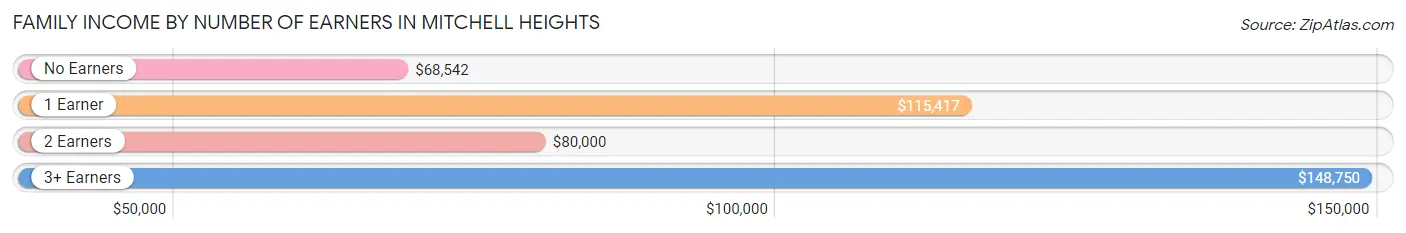
| Number of Earners | # Families | Median Income |
| No Earners | 17 (14.4%) | $68,542 |
| 1 Earner | 31 (26.3%) | $115,417 |
| 2 Earners | 56 (47.5%) | $80,000 |
| 3+ Earners | 14 (11.9%) | $148,750 |
| Total | 118 (100.0%) | $85,000 |
Household Income in Mitchell Heights
Household Income Brackets in Mitchell Heights
With 41 households falling in the category, the $100,000 to $149,999 income range is the most frequent in Mitchell Heights, accounting for 24.8% of all households.
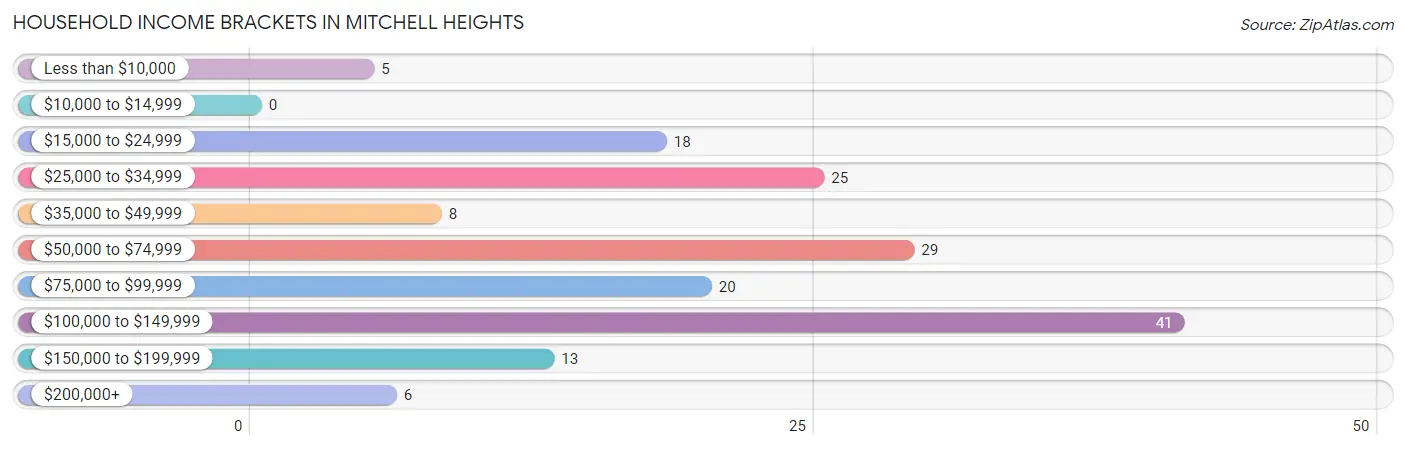
| Income Bracket | # Households | % Households |
| Less than $10,000 | 5 | 3.0% |
| $10,000 to $14,999 | 0 | 0.0% |
| $15,000 to $24,999 | 18 | 10.9% |
| $25,000 to $34,999 | 25 | 15.2% |
| $35,000 to $49,999 | 8 | 4.8% |
| $50,000 to $74,999 | 29 | 17.6% |
| $75,000 to $99,999 | 20 | 12.1% |
| $100,000 to $149,999 | 41 | 24.8% |
| $150,000 to $199,999 | 13 | 7.9% |
| $200,000+ | 6 | 3.6% |
Household Income by Householder Age in Mitchell Heights
The median household income in Mitchell Heights is $73,438, with the highest median household income of $102,750 found in the 45 to 64 years age bracket for the primary householder. A total of 45 households (27.3%) fall into this category.
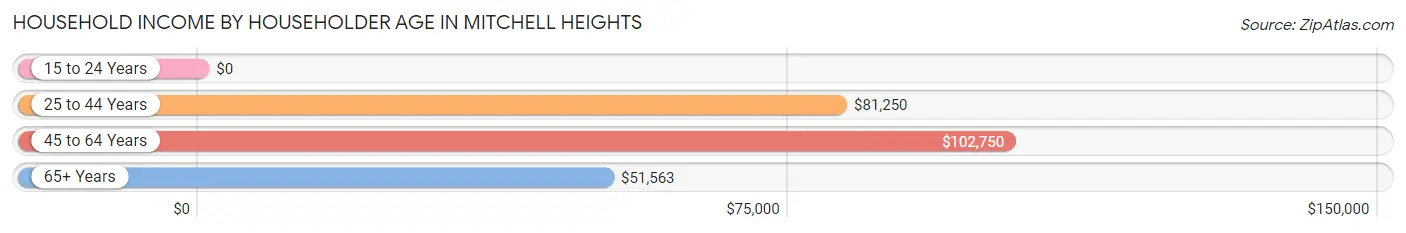
| Income Bracket | # Households | Median Income |
| 15 to 24 Years | 0 (0.0%) | $0 |
| 25 to 44 Years | 43 (26.1%) | $81,250 |
| 45 to 64 Years | 45 (27.3%) | $102,750 |
| 65+ Years | 77 (46.7%) | $51,563 |
| Total | 165 (100.0%) | $73,438 |
Poverty in Mitchell Heights
Income Below Poverty by Sex and Age in Mitchell Heights
With 5.5% poverty level for males and 3.9% for females among the residents of Mitchell Heights, 55 to 64 year old males and 35 to 44 year old females are the most vulnerable to poverty, with 4 males (44.4%) and 3 females (15.0%) in their respective age groups living below the poverty level.
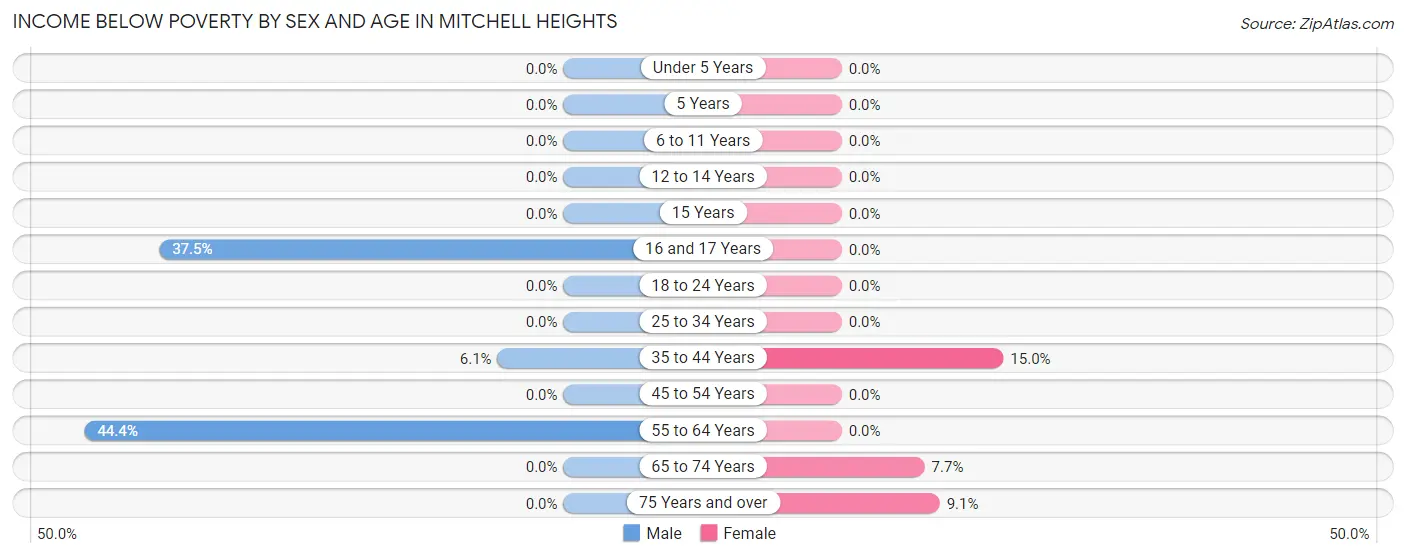
| Age Bracket | Male | Female |
| Under 5 Years | 0 (0.0%) | 0 (0.0%) |
| 5 Years | 0 (0.0%) | 0 (0.0%) |
| 6 to 11 Years | 0 (0.0%) | 0 (0.0%) |
| 12 to 14 Years | 0 (0.0%) | 0 (0.0%) |
| 15 Years | 0 (0.0%) | 0 (0.0%) |
| 16 and 17 Years | 3 (37.5%) | 0 (0.0%) |
| 18 to 24 Years | 0 (0.0%) | 0 (0.0%) |
| 25 to 34 Years | 0 (0.0%) | 0 (0.0%) |
| 35 to 44 Years | 3 (6.1%) | 3 (15.0%) |
| 45 to 54 Years | 0 (0.0%) | 0 (0.0%) |
| 55 to 64 Years | 4 (44.4%) | 0 (0.0%) |
| 65 to 74 Years | 0 (0.0%) | 2 (7.7%) |
| 75 Years and over | 0 (0.0%) | 4 (9.1%) |
| Total | 10 (5.5%) | 9 (3.9%) |
Income Above Poverty by Sex and Age in Mitchell Heights
According to the poverty statistics in Mitchell Heights, males aged 6 to 11 years and females aged under 5 years are the age groups that are most secure financially, with 100.0% of males and 100.0% of females in these age groups living above the poverty line.
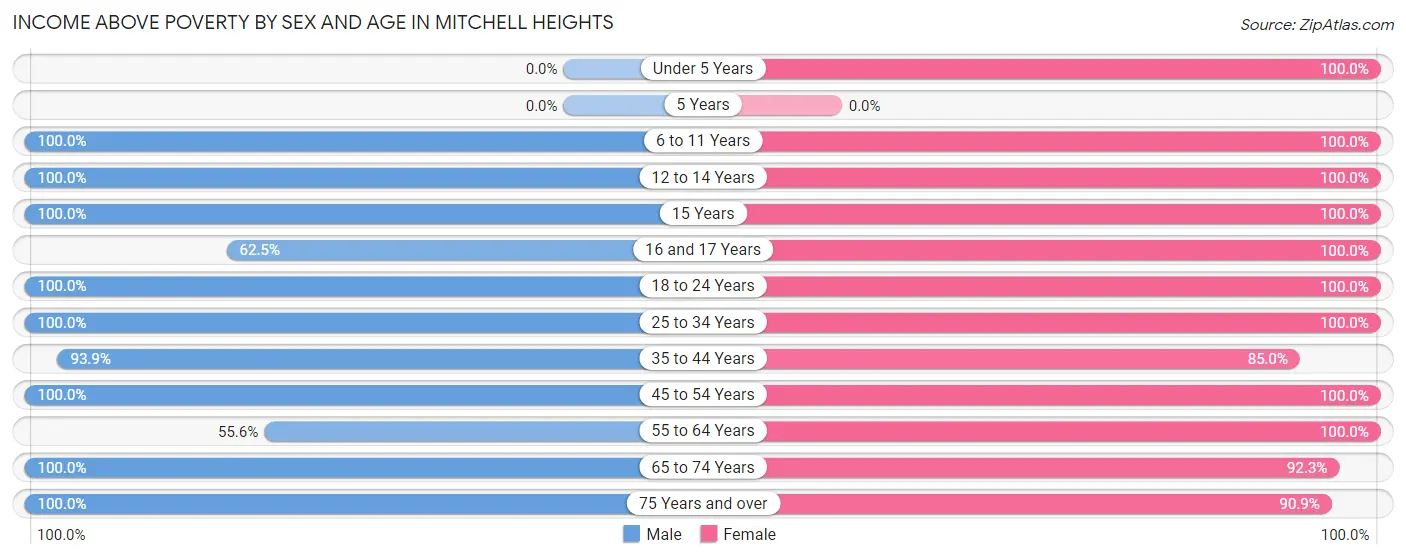
| Age Bracket | Male | Female |
| Under 5 Years | 0 (0.0%) | 32 (100.0%) |
| 5 Years | 0 (0.0%) | 0 (0.0%) |
| 6 to 11 Years | 4 (100.0%) | 11 (100.0%) |
| 12 to 14 Years | 3 (100.0%) | 9 (100.0%) |
| 15 Years | 1 (100.0%) | 9 (100.0%) |
| 16 and 17 Years | 5 (62.5%) | 1 (100.0%) |
| 18 to 24 Years | 17 (100.0%) | 7 (100.0%) |
| 25 to 34 Years | 25 (100.0%) | 24 (100.0%) |
| 35 to 44 Years | 46 (93.9%) | 17 (85.0%) |
| 45 to 54 Years | 16 (100.0%) | 31 (100.0%) |
| 55 to 64 Years | 5 (55.6%) | 19 (100.0%) |
| 65 to 74 Years | 28 (100.0%) | 24 (92.3%) |
| 75 Years and over | 21 (100.0%) | 40 (90.9%) |
| Total | 171 (94.5%) | 224 (96.1%) |
Income Below Poverty Among Married-Couple Families in Mitchell Heights
The poverty statistics for married-couple families in Mitchell Heights show that 1.1% or 1 of the total 90 families live below the poverty line. Families with no children have the highest poverty rate of 1.8%, comprising of 1 families. On the other hand, families with 1 or 2 children have the lowest poverty rate of 0.0%, which includes 0 families.
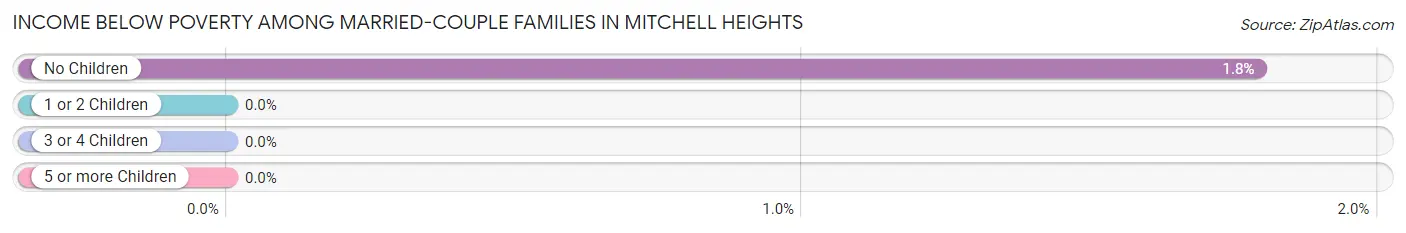
| Children | Above Poverty | Below Poverty |
| No Children | 55 (98.2%) | 1 (1.8%) |
| 1 or 2 Children | 27 (100.0%) | 0 (0.0%) |
| 3 or 4 Children | 7 (100.0%) | 0 (0.0%) |
| 5 or more Children | 0 (0.0%) | 0 (0.0%) |
| Total | 89 (98.9%) | 1 (1.1%) |
Income Below Poverty Among Single-Parent Households in Mitchell Heights
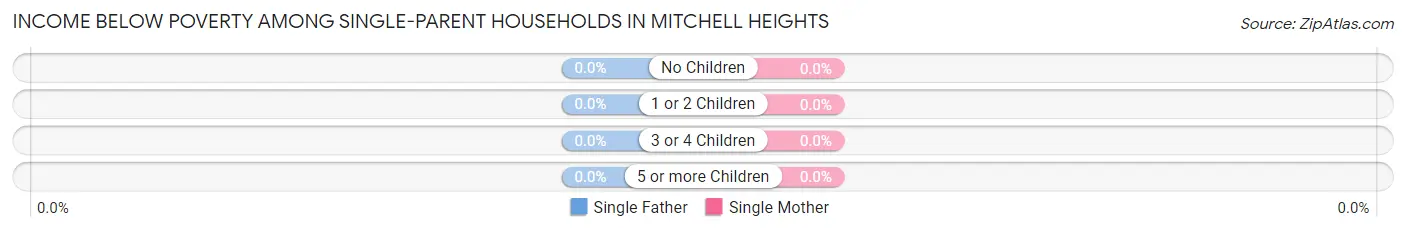
| Children | Single Father | Single Mother |
| No Children | 0 (0.0%) | 0 (0.0%) |
| 1 or 2 Children | 0 (0.0%) | 0 (0.0%) |
| 3 or 4 Children | 0 (0.0%) | 0 (0.0%) |
| 5 or more Children | 0 (0.0%) | 0 (0.0%) |
| Total | 0 (0.0%) | 0 (0.0%) |
Income Below Poverty Among Married-Couple vs Single-Parent Households in Mitchell Heights
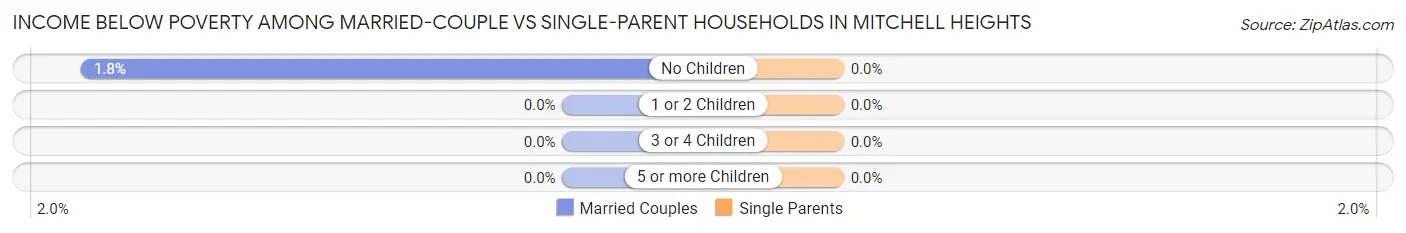
| Children | Married-Couple Families | Single-Parent Households |
| No Children | 1 (1.8%) | 0 (0.0%) |
| 1 or 2 Children | 0 (0.0%) | 0 (0.0%) |
| 3 or 4 Children | 0 (0.0%) | 0 (0.0%) |
| 5 or more Children | 0 (0.0%) | 0 (0.0%) |
| Total | 1 (1.1%) | 0 (0.0%) |
Employment Characteristics in Mitchell Heights
Employment by Class of Employer in Mitchell Heights
Among the 183 employed individuals in Mitchell Heights, private company employees (108 | 59.0%), state government employees (28 | 15.3%), and not-for-profit organizations (22 | 12.0%) make up the most common classes of employment.
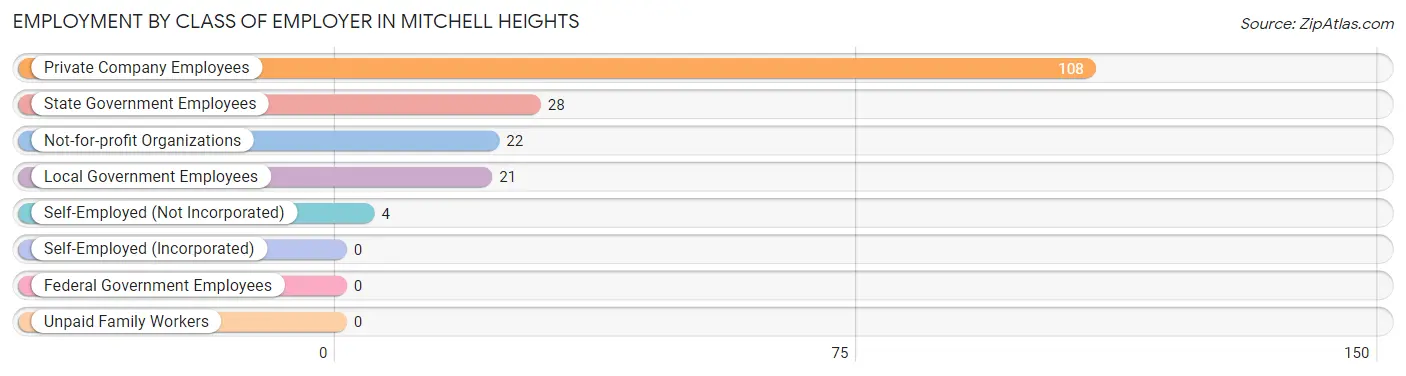
| Employer Class | # Employees | % Employees |
| Private Company Employees | 108 | 59.0% |
| Self-Employed (Incorporated) | 0 | 0.0% |
| Self-Employed (Not Incorporated) | 4 | 2.2% |
| Not-for-profit Organizations | 22 | 12.0% |
| Local Government Employees | 21 | 11.5% |
| State Government Employees | 28 | 15.3% |
| Federal Government Employees | 0 | 0.0% |
| Unpaid Family Workers | 0 | 0.0% |
| Total | 183 | 100.0% |
Employment Status by Age in Mitchell Heights
According to the labor force statistics for Mitchell Heights, out of the total population over 16 years of age (345), 58.0% or 200 individuals are in the labor force, with 4.5% or 9 of them unemployed. The age group with the highest labor force participation rate is 20 to 24 years, with 100.0% or 7 individuals in the labor force. Within the labor force, the 35 to 44 years age range has the highest percentage of unemployed individuals, with 13.7% or 7 of them being unemployed.

| Age Bracket | In Labor Force | Unemployed |
| 16 to 19 Years | 17 (65.4%) | 0 (0.0%) |
| 20 to 24 Years | 7 (100.0%) | 0 (0.0%) |
| 25 to 29 Years | 26 (100.0%) | 0 (0.0%) |
| 30 to 34 Years | 16 (69.6%) | 0 (0.0%) |
| 35 to 44 Years | 51 (73.9%) | 7 (13.7%) |
| 45 to 54 Years | 40 (85.1%) | 0 (0.0%) |
| 55 to 59 Years | 10 (66.7%) | 0 (0.0%) |
| 60 to 64 Years | 6 (46.2%) | 0 (0.0%) |
| 65 to 74 Years | 21 (38.9%) | 2 (9.5%) |
| 75 Years and over | 6 (9.2%) | 0 (0.0%) |
| Total | 200 (58.0%) | 9 (4.5%) |
Employment Status by Educational Attainment in Mitchell Heights
According to labor force statistics for Mitchell Heights, 77.2% of individuals (149) out of the total population between 25 and 64 years of age (193) are in the labor force, with 4.7% or 7 of them being unemployed. The group with the highest labor force participation rate are those with the educational attainment of bachelor's degree or higher, with 94.3% or 50 individuals in the labor force. Within the labor force, individuals with high school diploma education have the highest percentage of unemployment, with 20.6% or 7 of them being unemployed.
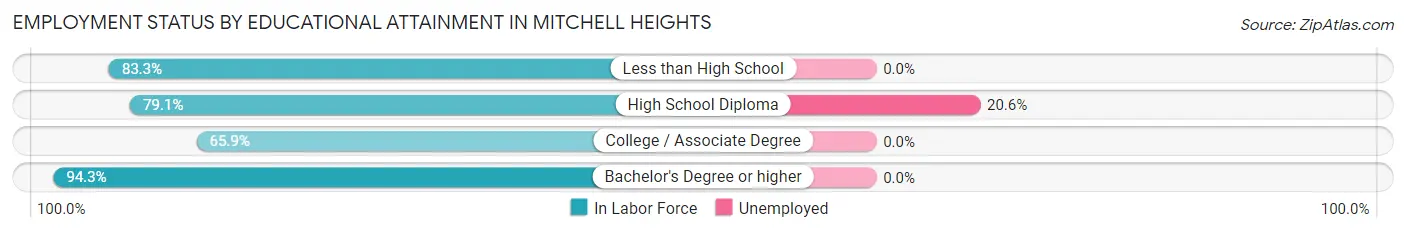
| Educational Attainment | In Labor Force | Unemployed |
| Less than High School | 5 (83.3%) | 0 (0.0%) |
| High School Diploma | 34 (79.1%) | 9 (20.6%) |
| College / Associate Degree | 60 (65.9%) | 0 (0.0%) |
| Bachelor's Degree or higher | 50 (94.3%) | 0 (0.0%) |
| Total | 149 (77.2%) | 9 (4.7%) |
Employment Occupations by Sex in Mitchell Heights
Management, Business, Science and Arts Occupations
The most common Management, Business, Science and Arts occupations in Mitchell Heights are Community & Social Service (45 | 23.6%), Health Diagnosing & Treating (31 | 16.2%), Health Technologists (29 | 15.2%), Education, Arts & Media (22 | 11.5%), and Management (20 | 10.5%).
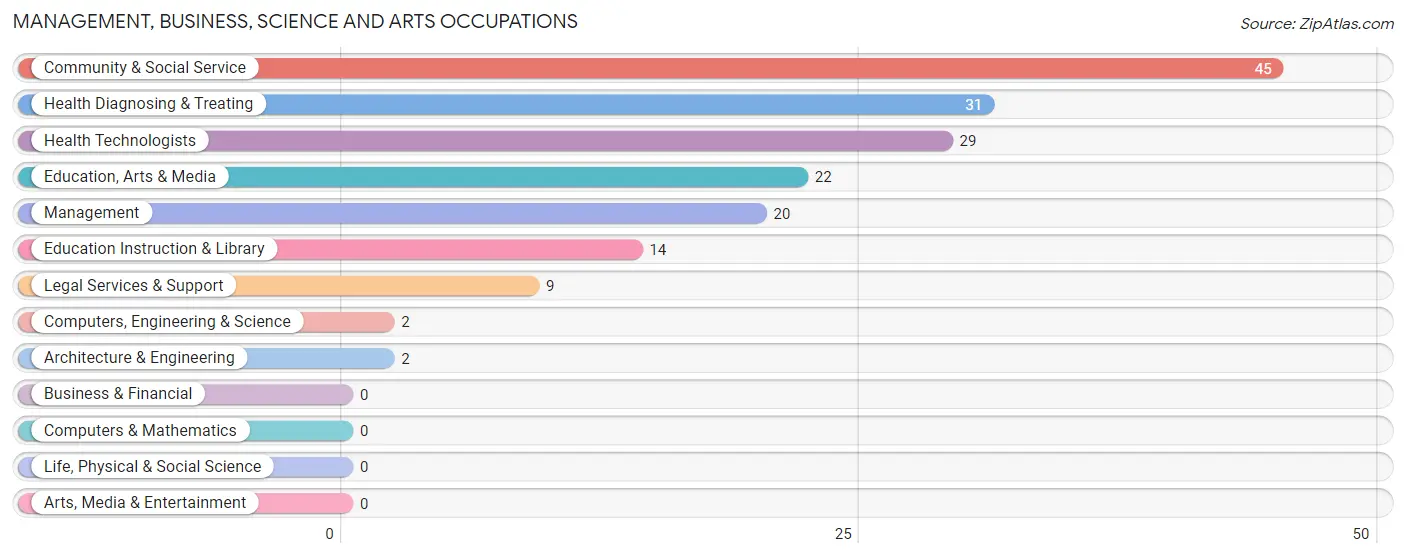
Management, Business, Science and Arts Occupations by Sex
Within the Management, Business, Science and Arts occupations in Mitchell Heights, the most male-oriented occupations are Computers, Engineering & Science (100.0%), Architecture & Engineering (100.0%), and Legal Services & Support (100.0%), while the most female-oriented occupations are Health Diagnosing & Treating (96.8%), Health Technologists (96.6%), and Education Instruction & Library (92.9%).
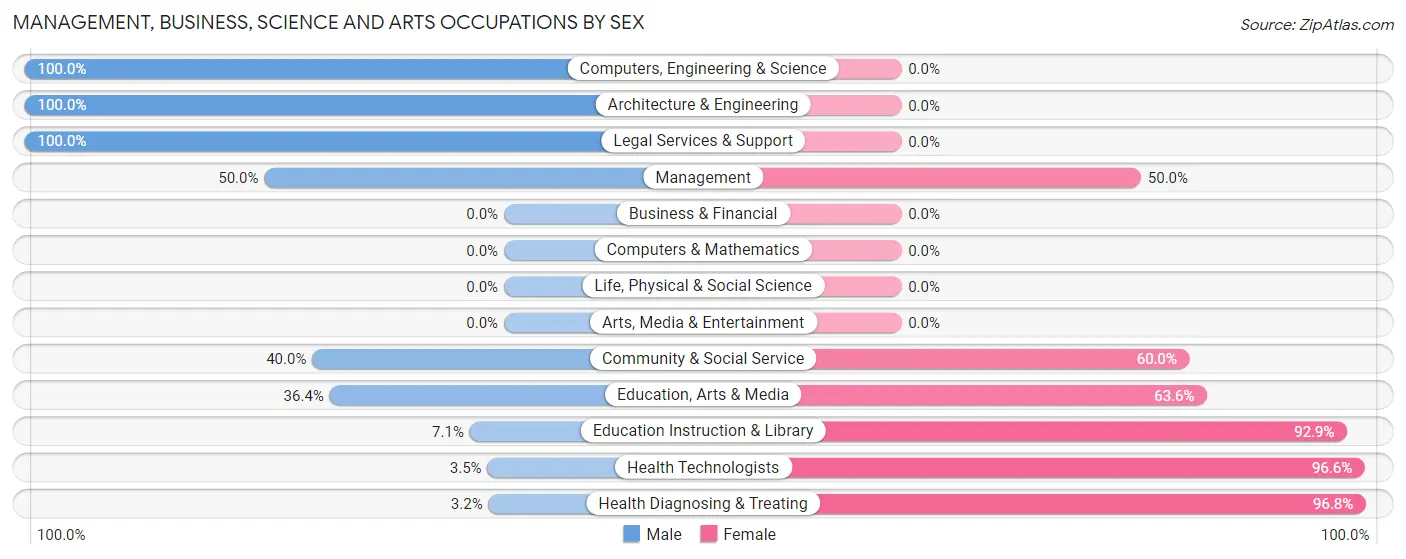
| Occupation | Male | Female |
| Management | 10 (50.0%) | 10 (50.0%) |
| Business & Financial | 0 (0.0%) | 0 (0.0%) |
| Computers, Engineering & Science | 2 (100.0%) | 0 (0.0%) |
| Computers & Mathematics | 0 (0.0%) | 0 (0.0%) |
| Architecture & Engineering | 2 (100.0%) | 0 (0.0%) |
| Life, Physical & Social Science | 0 (0.0%) | 0 (0.0%) |
| Community & Social Service | 18 (40.0%) | 27 (60.0%) |
| Education, Arts & Media | 8 (36.4%) | 14 (63.6%) |
| Legal Services & Support | 9 (100.0%) | 0 (0.0%) |
| Education Instruction & Library | 1 (7.1%) | 13 (92.9%) |
| Arts, Media & Entertainment | 0 (0.0%) | 0 (0.0%) |
| Health Diagnosing & Treating | 1 (3.2%) | 30 (96.8%) |
| Health Technologists | 1 (3.5%) | 28 (96.6%) |
| Total (Category) | 31 (31.6%) | 67 (68.4%) |
| Total (Overall) | 100 (52.4%) | 91 (47.6%) |
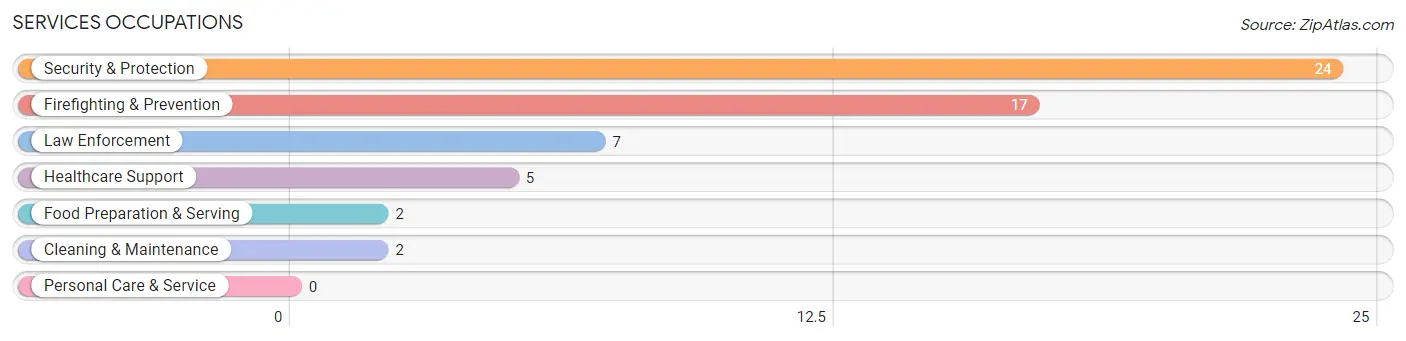
Services Occupations
The most common Services occupations in Mitchell Heights are Security & Protection (24 | 12.6%), Firefighting & Prevention (17 | 8.9%), Law Enforcement (7 | 3.7%), Healthcare Support (5 | 2.6%), and Food Preparation & Serving (2 | 1.1%).
Services Occupations by Sex
Within the Services occupations in Mitchell Heights, the most male-oriented occupations are Security & Protection (100.0%), Firefighting & Prevention (100.0%), and Law Enforcement (100.0%), while the most female-oriented occupations are Healthcare Support (100.0%), Food Preparation & Serving (100.0%), and Cleaning & Maintenance (100.0%).
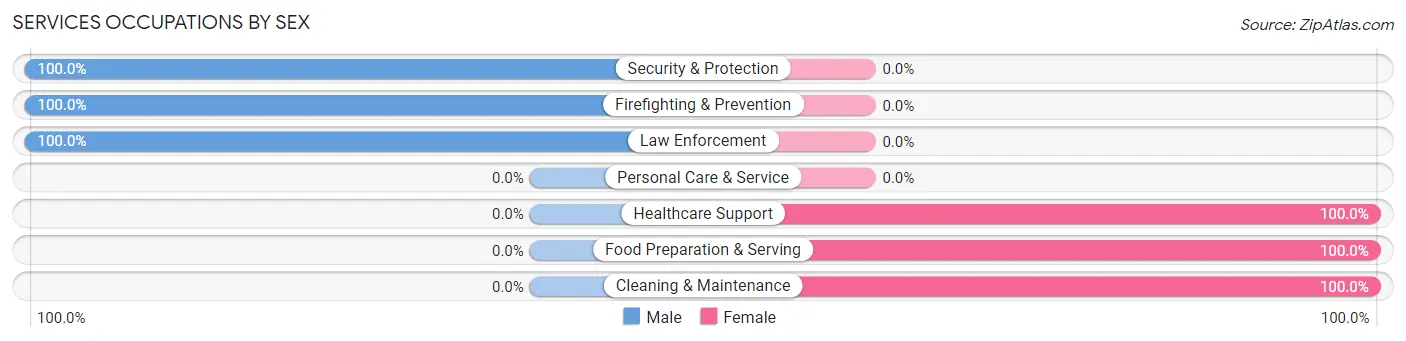
| Occupation | Male | Female |
| Healthcare Support | 0 (0.0%) | 5 (100.0%) |
| Security & Protection | 24 (100.0%) | 0 (0.0%) |
| Firefighting & Prevention | 17 (100.0%) | 0 (0.0%) |
| Law Enforcement | 7 (100.0%) | 0 (0.0%) |
| Food Preparation & Serving | 0 (0.0%) | 2 (100.0%) |
| Cleaning & Maintenance | 0 (0.0%) | 2 (100.0%) |
| Personal Care & Service | 0 (0.0%) | 0 (0.0%) |
| Total (Category) | 24 (72.7%) | 9 (27.3%) |
| Total (Overall) | 100 (52.4%) | 91 (47.6%) |
Sales and Office Occupations
The most common Sales and Office occupations in Mitchell Heights are Sales & Related (22 | 11.5%), and Office & Administration (11 | 5.8%).
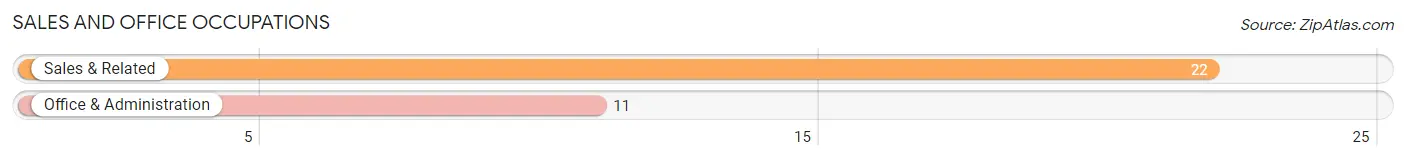
Sales and Office Occupations by Sex
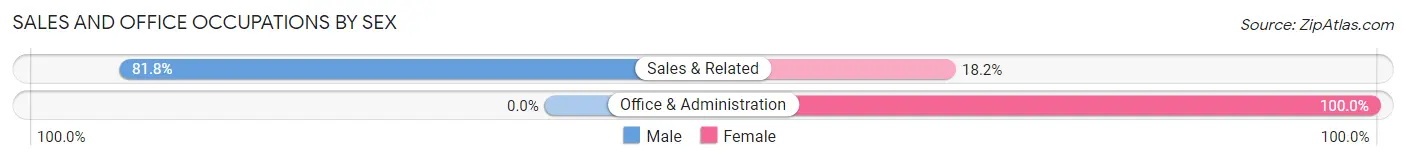
| Occupation | Male | Female |
| Sales & Related | 18 (81.8%) | 4 (18.2%) |
| Office & Administration | 0 (0.0%) | 11 (100.0%) |
| Total (Category) | 18 (54.5%) | 15 (45.5%) |
| Total (Overall) | 100 (52.4%) | 91 (47.6%) |
Natural Resources, Construction and Maintenance Occupations
The most common Natural Resources, Construction and Maintenance occupations in Mitchell Heights are Installation, Maintenance & Repair (9 | 4.7%), and Construction & Extraction (8 | 4.2%).
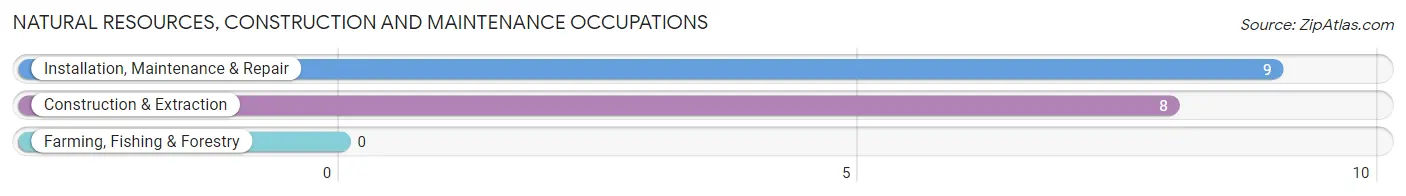
Natural Resources, Construction and Maintenance Occupations by Sex
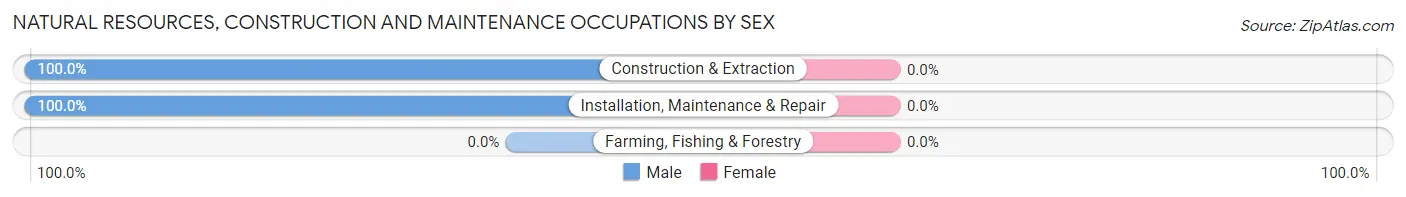
| Occupation | Male | Female |
| Farming, Fishing & Forestry | 0 (0.0%) | 0 (0.0%) |
| Construction & Extraction | 8 (100.0%) | 0 (0.0%) |
| Installation, Maintenance & Repair | 9 (100.0%) | 0 (0.0%) |
| Total (Category) | 17 (100.0%) | 0 (0.0%) |
| Total (Overall) | 100 (52.4%) | 91 (47.6%) |
Production, Transportation and Moving Occupations
The most common Production, Transportation and Moving occupations in Mitchell Heights are Transportation (7 | 3.7%), and Material Moving (3 | 1.6%).
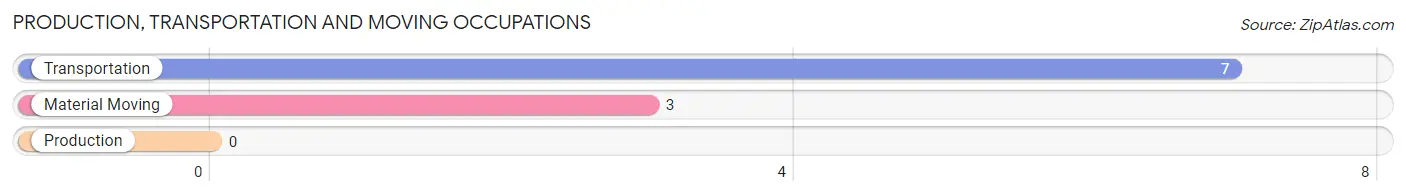
Production, Transportation and Moving Occupations by Sex
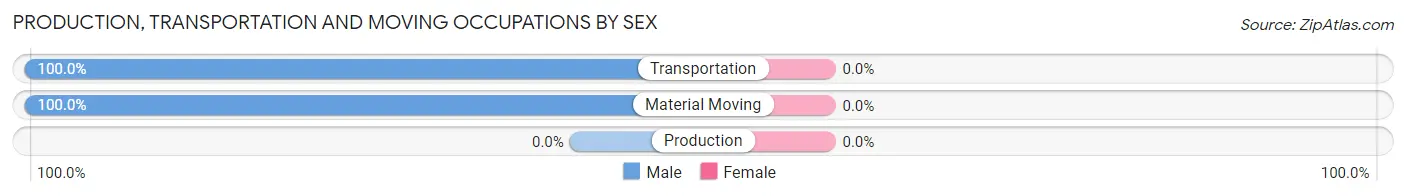
| Occupation | Male | Female |
| Production | 0 (0.0%) | 0 (0.0%) |
| Transportation | 7 (100.0%) | 0 (0.0%) |
| Material Moving | 3 (100.0%) | 0 (0.0%) |
| Total (Category) | 10 (100.0%) | 0 (0.0%) |
| Total (Overall) | 100 (52.4%) | 91 (47.6%) |
Employment Industries by Sex in Mitchell Heights
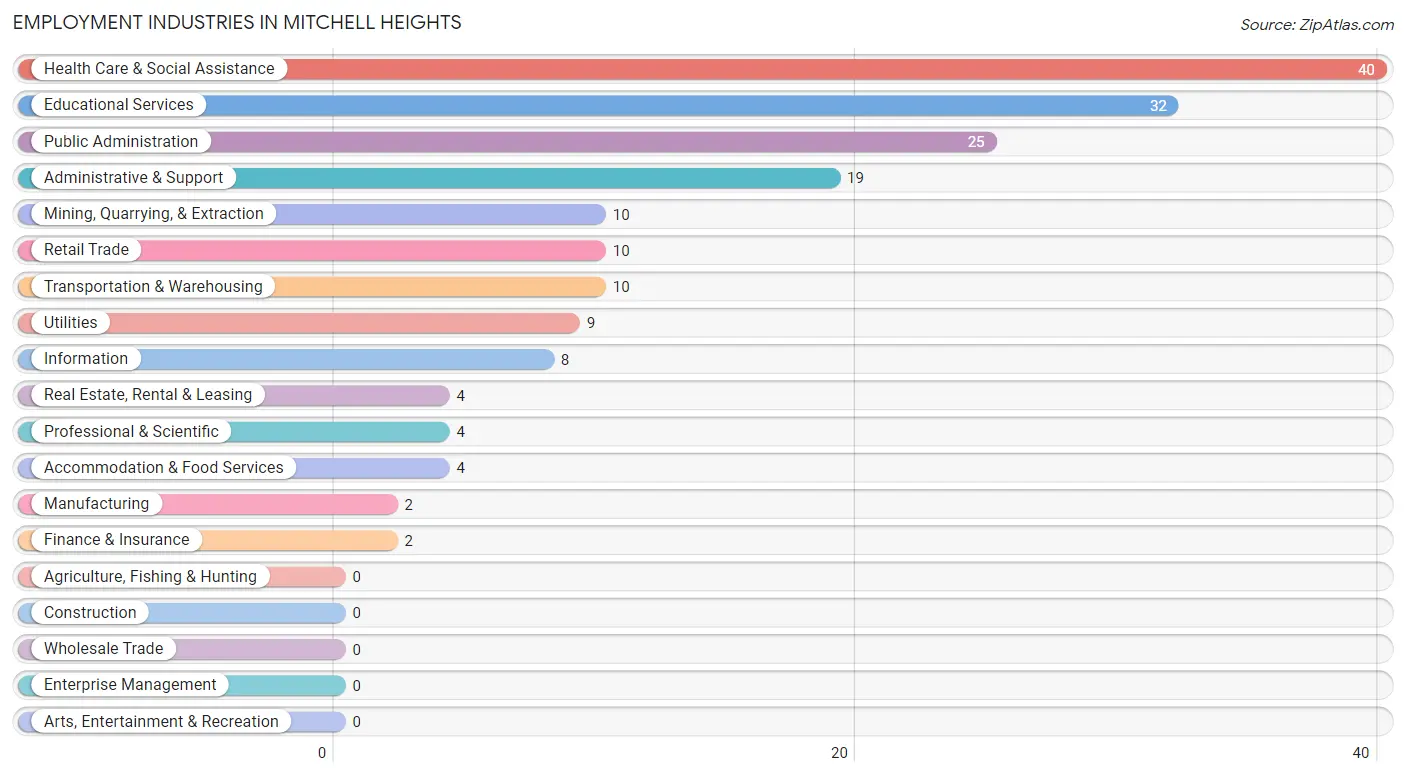
Employment Industries in Mitchell Heights
The major employment industries in Mitchell Heights include Health Care & Social Assistance (40 | 20.9%), Educational Services (32 | 16.8%), Public Administration (25 | 13.1%), Administrative & Support (19 | 10.0%), and Mining, Quarrying, & Extraction (10 | 5.2%).
Employment Industries by Sex in Mitchell Heights
The Mitchell Heights industries that see more men than women are Mining, Quarrying, & Extraction (100.0%), Manufacturing (100.0%), and Retail Trade (100.0%), whereas the industries that tend to have a higher number of women are Real Estate, Rental & Leasing (100.0%), Accommodation & Food Services (100.0%), and Health Care & Social Assistance (85.0%).
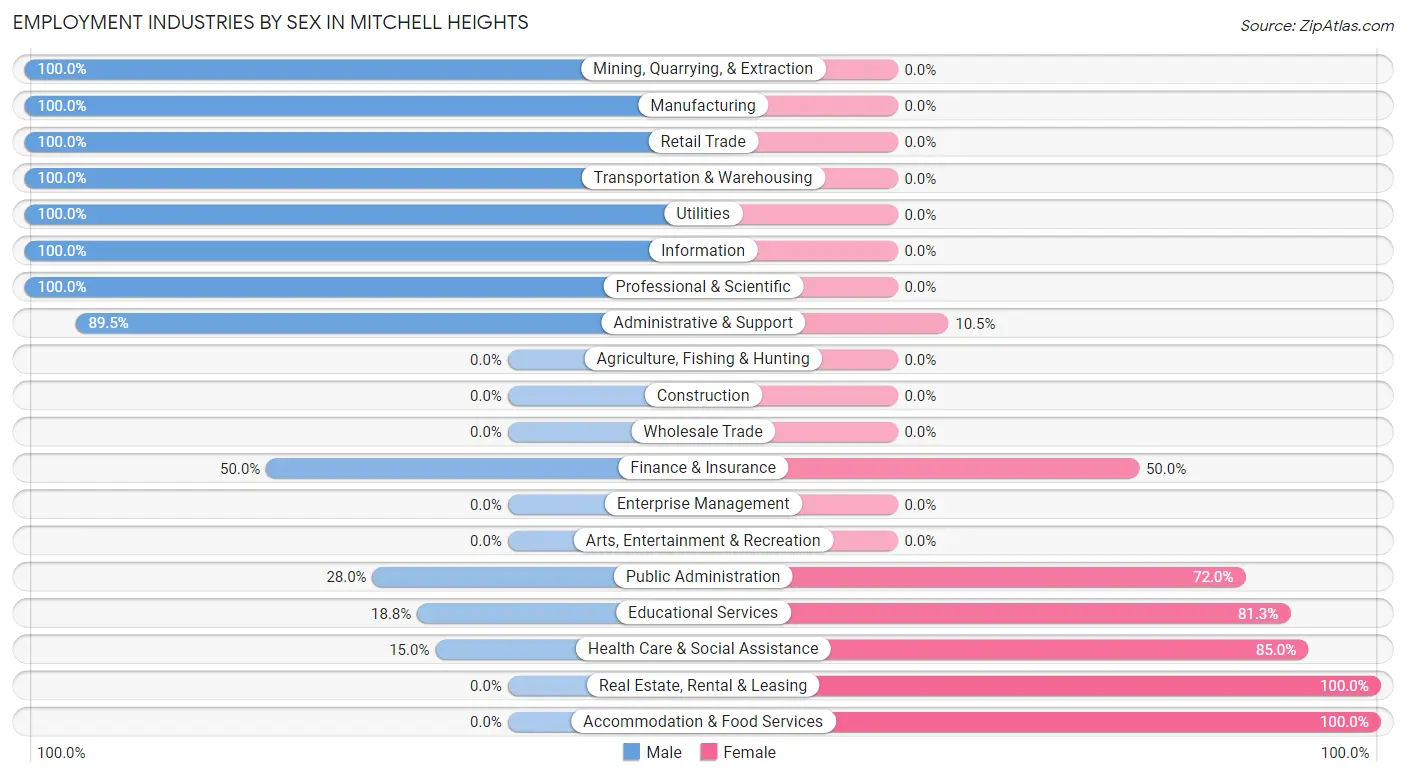
| Industry | Male | Female |
| Agriculture, Fishing & Hunting | 0 (0.0%) | 0 (0.0%) |
| Mining, Quarrying, & Extraction | 10 (100.0%) | 0 (0.0%) |
| Construction | 0 (0.0%) | 0 (0.0%) |
| Manufacturing | 2 (100.0%) | 0 (0.0%) |
| Wholesale Trade | 0 (0.0%) | 0 (0.0%) |
| Retail Trade | 10 (100.0%) | 0 (0.0%) |
| Transportation & Warehousing | 10 (100.0%) | 0 (0.0%) |
| Utilities | 9 (100.0%) | 0 (0.0%) |
| Information | 8 (100.0%) | 0 (0.0%) |
| Finance & Insurance | 1 (50.0%) | 1 (50.0%) |
| Real Estate, Rental & Leasing | 0 (0.0%) | 4 (100.0%) |
| Professional & Scientific | 4 (100.0%) | 0 (0.0%) |
| Enterprise Management | 0 (0.0%) | 0 (0.0%) |
| Administrative & Support | 17 (89.5%) | 2 (10.5%) |
| Educational Services | 6 (18.8%) | 26 (81.2%) |
| Health Care & Social Assistance | 6 (15.0%) | 34 (85.0%) |
| Arts, Entertainment & Recreation | 0 (0.0%) | 0 (0.0%) |
| Accommodation & Food Services | 0 (0.0%) | 4 (100.0%) |
| Public Administration | 7 (28.0%) | 18 (72.0%) |
| Total | 100 (52.4%) | 91 (47.6%) |
Education in Mitchell Heights
School Enrollment in Mitchell Heights
The most common levels of schooling among the 76 students in Mitchell Heights are high school (25 | 32.9%), elementary school (15 | 19.7%), and college / undergraduate (14 | 18.4%).
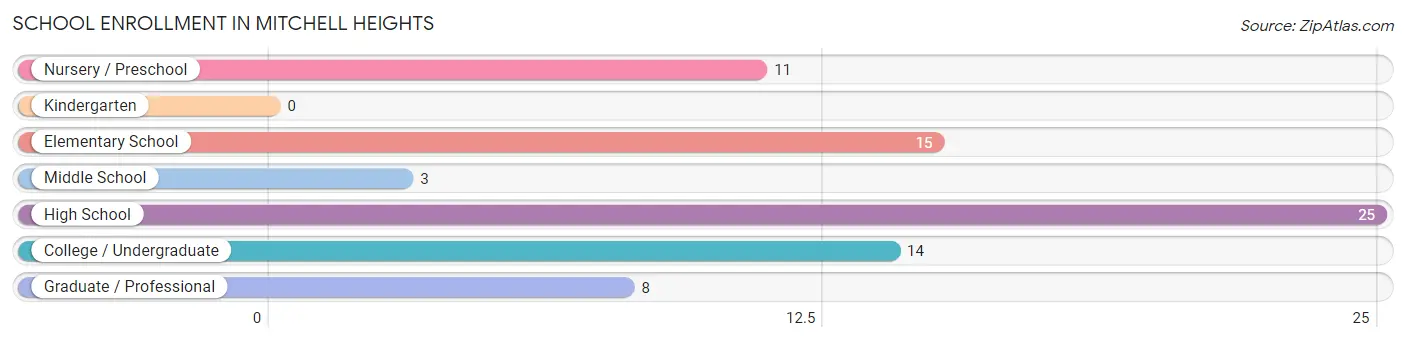
| School Level | # Students | % Students |
| Nursery / Preschool | 11 | 14.5% |
| Kindergarten | 0 | 0.0% |
| Elementary School | 15 | 19.7% |
| Middle School | 3 | 4.0% |
| High School | 25 | 32.9% |
| College / Undergraduate | 14 | 18.4% |
| Graduate / Professional | 8 | 10.5% |
| Total | 76 | 100.0% |
School Enrollment by Age by Funding Source in Mitchell Heights
Out of a total of 76 students who are enrolled in schools in Mitchell Heights, 8 (10.5%) attend a private institution, while the remaining 68 (89.5%) are enrolled in public schools. The age group of 3 to 4 year olds has the highest likelihood of being enrolled in private schools, with 3 (27.3% in the age bracket) enrolled. Conversely, the age group of 10 to 14 year olds has the lowest likelihood of being enrolled in a private school, with 9 (100.0% in the age bracket) attending a public institution.
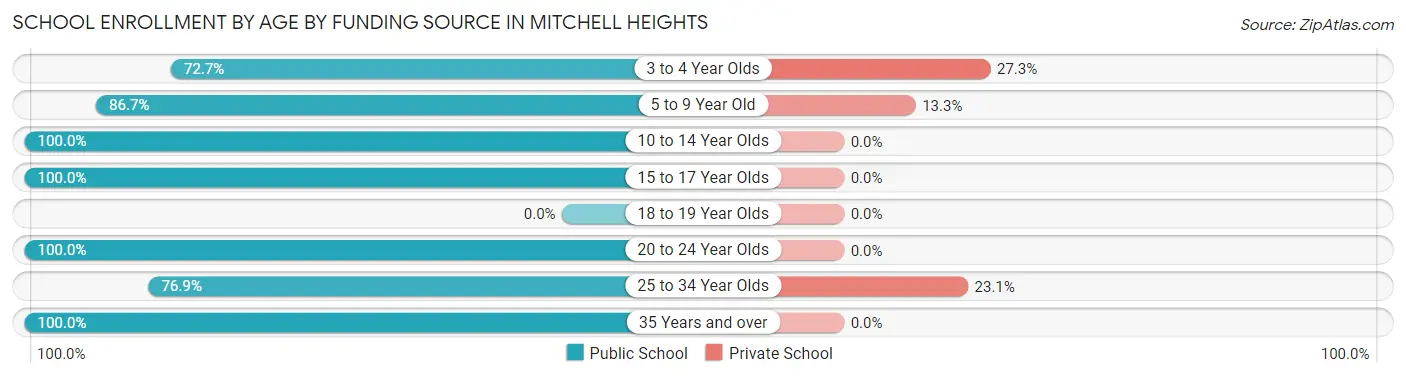
| Age Bracket | Public School | Private School |
| 3 to 4 Year Olds | 8 (72.7%) | 3 (27.3%) |
| 5 to 9 Year Old | 13 (86.7%) | 2 (13.3%) |
| 10 to 14 Year Olds | 9 (100.0%) | 0 (0.0%) |
| 15 to 17 Year Olds | 19 (100.0%) | 0 (0.0%) |
| 18 to 19 Year Olds | 0 (0.0%) | 0 (0.0%) |
| 20 to 24 Year Olds | 2 (100.0%) | 0 (0.0%) |
| 25 to 34 Year Olds | 10 (76.9%) | 3 (23.1%) |
| 35 Years and over | 7 (100.0%) | 0 (0.0%) |
| Total | 68 (89.5%) | 8 (10.5%) |
Educational Attainment by Field of Study in Mitchell Heights
Education (45 | 45.9%), business (14 | 14.3%), science & technology (10 | 10.2%), psychology (7 | 7.1%), and engineering (5 | 5.1%) are the most common fields of study among 98 individuals in Mitchell Heights who have obtained a bachelor's degree or higher.
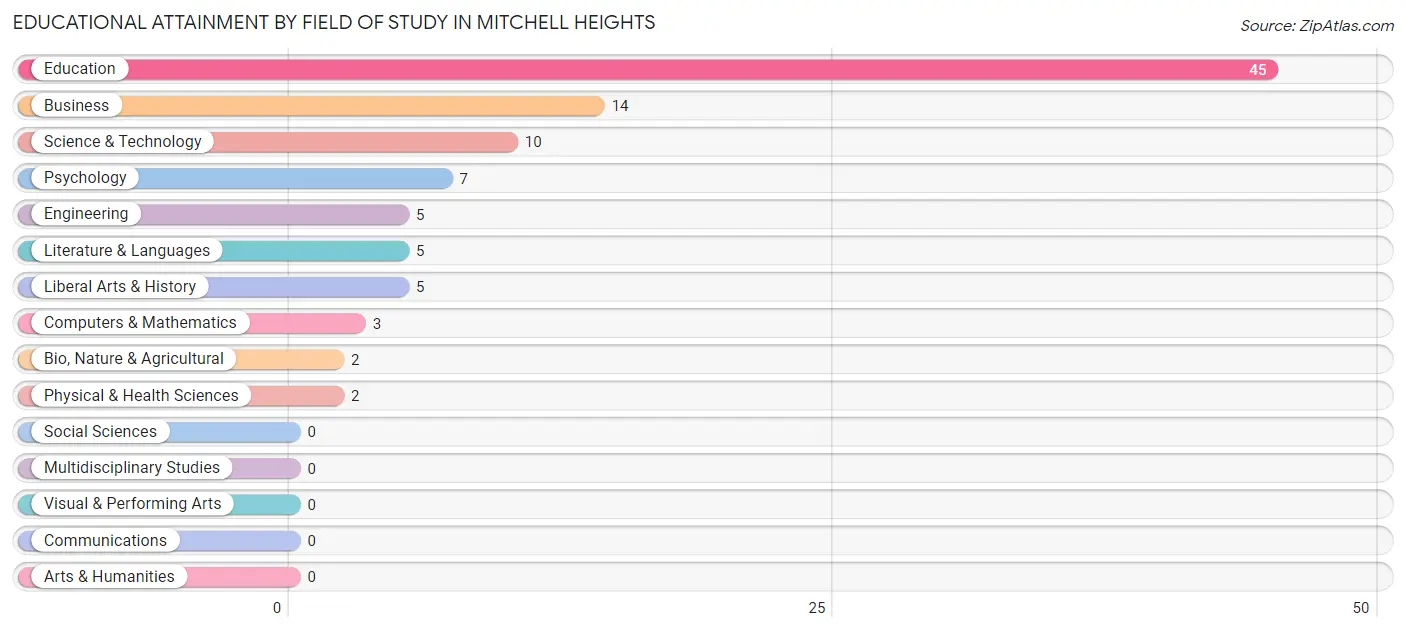
| Field of Study | # Graduates | % Graduates |
| Computers & Mathematics | 3 | 3.1% |
| Bio, Nature & Agricultural | 2 | 2.0% |
| Physical & Health Sciences | 2 | 2.0% |
| Psychology | 7 | 7.1% |
| Social Sciences | 0 | 0.0% |
| Engineering | 5 | 5.1% |
| Multidisciplinary Studies | 0 | 0.0% |
| Science & Technology | 10 | 10.2% |
| Business | 14 | 14.3% |
| Education | 45 | 45.9% |
| Literature & Languages | 5 | 5.1% |
| Liberal Arts & History | 5 | 5.1% |
| Visual & Performing Arts | 0 | 0.0% |
| Communications | 0 | 0.0% |
| Arts & Humanities | 0 | 0.0% |
| Total | 98 | 100.0% |
Transportation & Commute in Mitchell Heights
Vehicle Availability by Sex in Mitchell Heights
The most prevalent vehicle ownership categories in Mitchell Heights are males with 2 vehicles (52, accounting for 56.5%) and females with 2 vehicles (47, making up 57.1%).
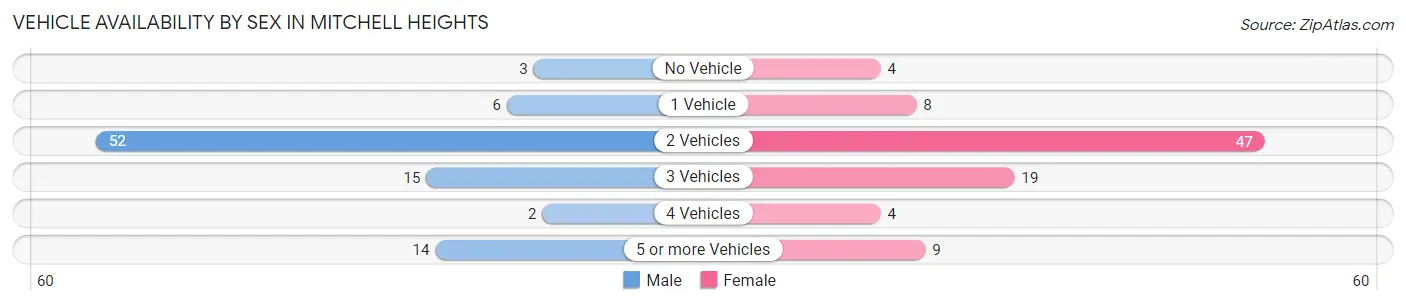
| Vehicles Available | Male | Female |
| No Vehicle | 3 (3.3%) | 4 (4.4%) |
| 1 Vehicle | 6 (6.5%) | 8 (8.8%) |
| 2 Vehicles | 52 (56.5%) | 47 (51.6%) |
| 3 Vehicles | 15 (16.3%) | 19 (20.9%) |
| 4 Vehicles | 2 (2.2%) | 4 (4.4%) |
| 5 or more Vehicles | 14 (15.2%) | 9 (9.9%) |
| Total | 92 (100.0%) | 91 (100.0%) |
Commute Time in Mitchell Heights
The most frequently occuring commute durations in Mitchell Heights are 15 to 19 minutes (51 commuters, 28.2%), 10 to 14 minutes (31 commuters, 17.1%), and 30 to 34 minutes (29 commuters, 16.0%).
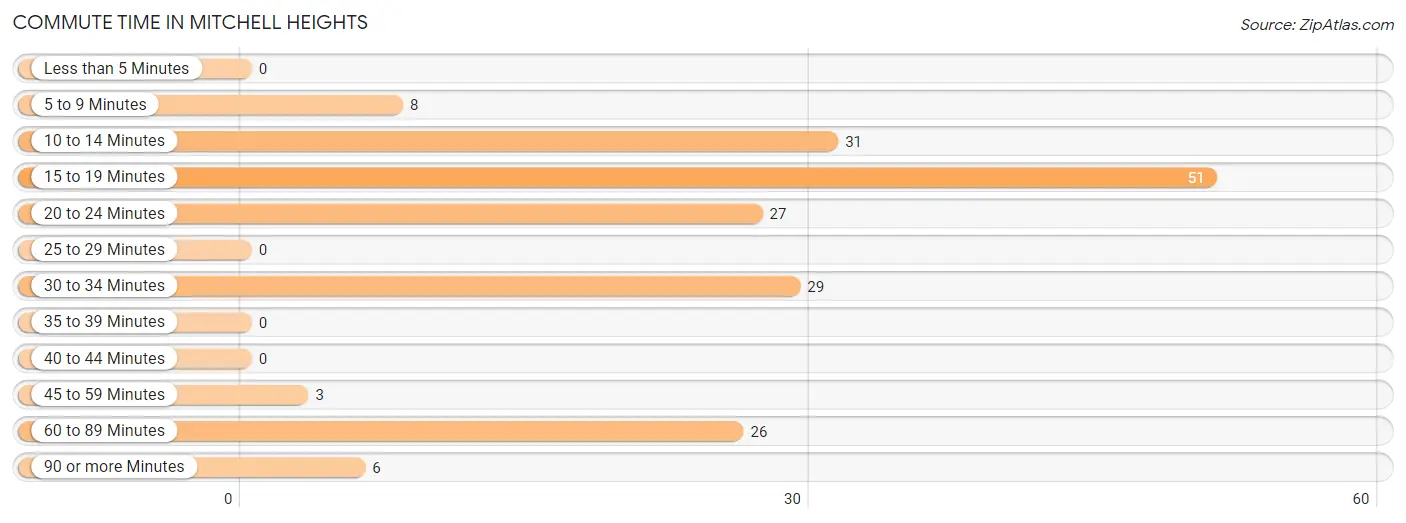
| Commute Time | # Commuters | % Commuters |
| Less than 5 Minutes | 0 | 0.0% |
| 5 to 9 Minutes | 8 | 4.4% |
| 10 to 14 Minutes | 31 | 17.1% |
| 15 to 19 Minutes | 51 | 28.2% |
| 20 to 24 Minutes | 27 | 14.9% |
| 25 to 29 Minutes | 0 | 0.0% |
| 30 to 34 Minutes | 29 | 16.0% |
| 35 to 39 Minutes | 0 | 0.0% |
| 40 to 44 Minutes | 0 | 0.0% |
| 45 to 59 Minutes | 3 | 1.7% |
| 60 to 89 Minutes | 26 | 14.4% |
| 90 or more Minutes | 6 | 3.3% |
Commute Time by Sex in Mitchell Heights
The most common commute times in Mitchell Heights are 30 to 34 minutes (27 commuters, 30.0%) for males and 15 to 19 minutes (32 commuters, 35.2%) for females.
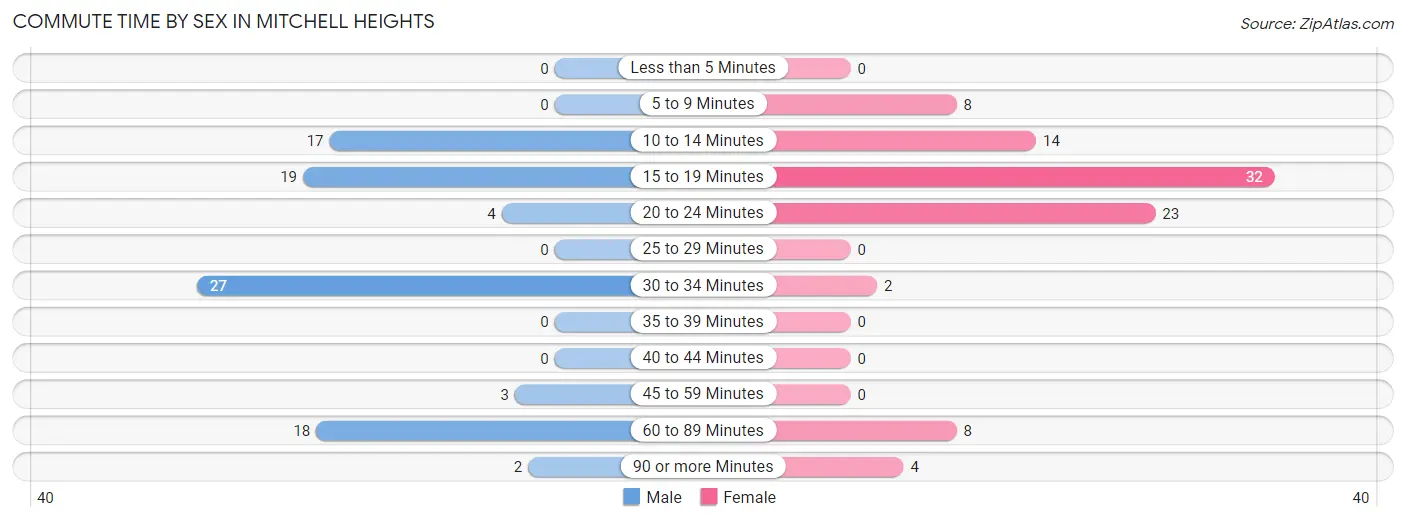
| Commute Time | Male | Female |
| Less than 5 Minutes | 0 (0.0%) | 0 (0.0%) |
| 5 to 9 Minutes | 0 (0.0%) | 8 (8.8%) |
| 10 to 14 Minutes | 17 (18.9%) | 14 (15.4%) |
| 15 to 19 Minutes | 19 (21.1%) | 32 (35.2%) |
| 20 to 24 Minutes | 4 (4.4%) | 23 (25.3%) |
| 25 to 29 Minutes | 0 (0.0%) | 0 (0.0%) |
| 30 to 34 Minutes | 27 (30.0%) | 2 (2.2%) |
| 35 to 39 Minutes | 0 (0.0%) | 0 (0.0%) |
| 40 to 44 Minutes | 0 (0.0%) | 0 (0.0%) |
| 45 to 59 Minutes | 3 (3.3%) | 0 (0.0%) |
| 60 to 89 Minutes | 18 (20.0%) | 8 (8.8%) |
| 90 or more Minutes | 2 (2.2%) | 4 (4.4%) |
Time of Departure to Work by Sex in Mitchell Heights
The most frequent times of departure to work in Mitchell Heights are 4:00 PM to 11:59 PM (36, 40.0%) for males and 8:00 AM to 8:29 AM (29, 31.9%) for females.
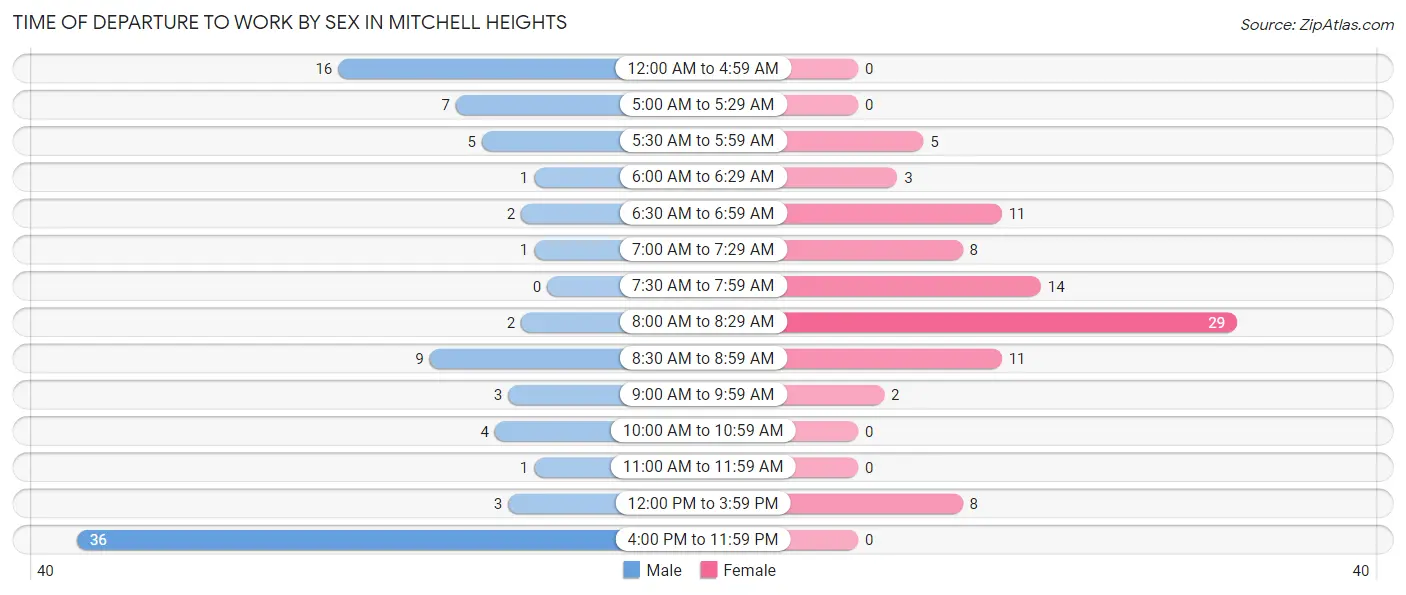
| Time of Departure | Male | Female |
| 12:00 AM to 4:59 AM | 16 (17.8%) | 0 (0.0%) |
| 5:00 AM to 5:29 AM | 7 (7.8%) | 0 (0.0%) |
| 5:30 AM to 5:59 AM | 5 (5.6%) | 5 (5.5%) |
| 6:00 AM to 6:29 AM | 1 (1.1%) | 3 (3.3%) |
| 6:30 AM to 6:59 AM | 2 (2.2%) | 11 (12.1%) |
| 7:00 AM to 7:29 AM | 1 (1.1%) | 8 (8.8%) |
| 7:30 AM to 7:59 AM | 0 (0.0%) | 14 (15.4%) |
| 8:00 AM to 8:29 AM | 2 (2.2%) | 29 (31.9%) |
| 8:30 AM to 8:59 AM | 9 (10.0%) | 11 (12.1%) |
| 9:00 AM to 9:59 AM | 3 (3.3%) | 2 (2.2%) |
| 10:00 AM to 10:59 AM | 4 (4.4%) | 0 (0.0%) |
| 11:00 AM to 11:59 AM | 1 (1.1%) | 0 (0.0%) |
| 12:00 PM to 3:59 PM | 3 (3.3%) | 8 (8.8%) |
| 4:00 PM to 11:59 PM | 36 (40.0%) | 0 (0.0%) |
| Total | 90 (100.0%) | 91 (100.0%) |
Housing Occupancy in Mitchell Heights
Occupancy by Ownership in Mitchell Heights
Of the total 165 dwellings in Mitchell Heights, owner-occupied units account for 150 (90.9%), while renter-occupied units make up 15 (9.1%).
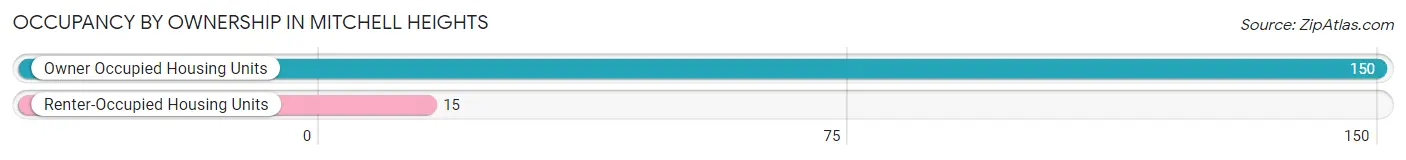
| Occupancy | # Housing Units | % Housing Units |
| Owner Occupied Housing Units | 150 | 90.9% |
| Renter-Occupied Housing Units | 15 | 9.1% |
| Total Occupied Housing Units | 165 | 100.0% |
Occupancy by Household Size in Mitchell Heights
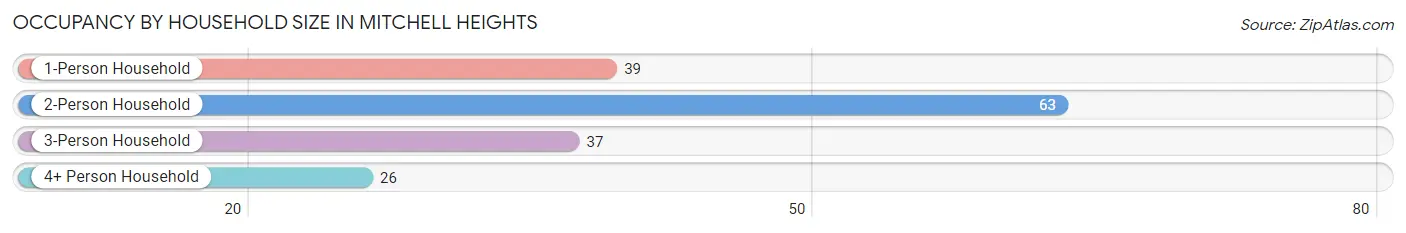
| Household Size | # Housing Units | % Housing Units |
| 1-Person Household | 39 | 23.6% |
| 2-Person Household | 63 | 38.2% |
| 3-Person Household | 37 | 22.4% |
| 4+ Person Household | 26 | 15.8% |
| Total Housing Units | 165 | 100.0% |
Occupancy by Ownership by Household Size in Mitchell Heights
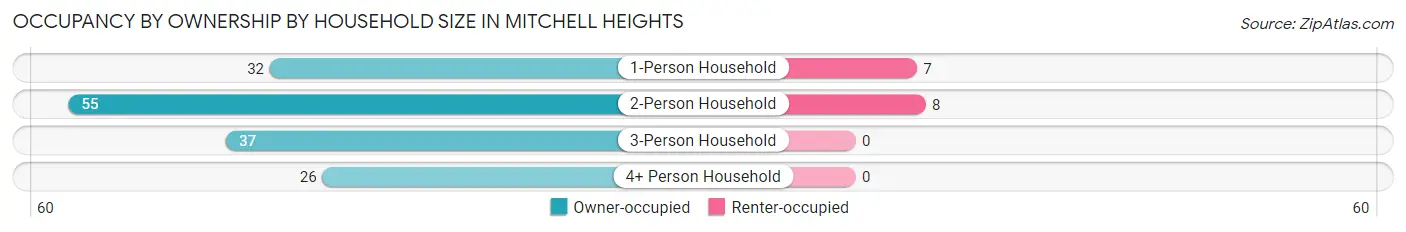
| Household Size | Owner-occupied | Renter-occupied |
| 1-Person Household | 32 (82.1%) | 7 (17.9%) |
| 2-Person Household | 55 (87.3%) | 8 (12.7%) |
| 3-Person Household | 37 (100.0%) | 0 (0.0%) |
| 4+ Person Household | 26 (100.0%) | 0 (0.0%) |
| Total Housing Units | 150 (90.9%) | 15 (9.1%) |
Occupancy by Educational Attainment in Mitchell Heights
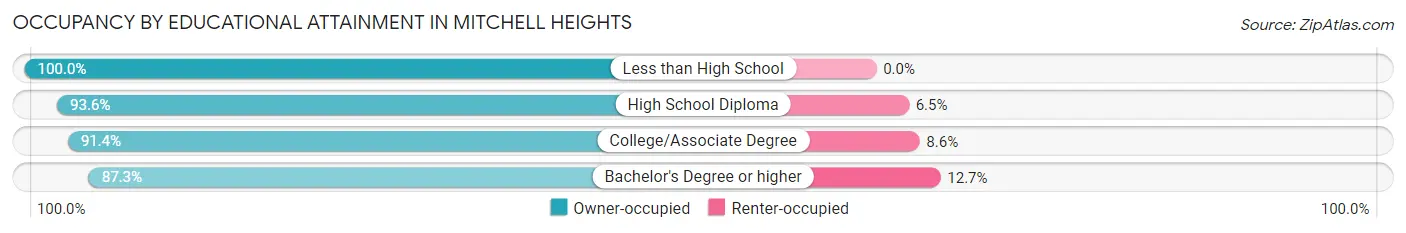
| Household Size | Owner-occupied | Renter-occupied |
| Less than High School | 9 (100.0%) | 0 (0.0%) |
| High School Diploma | 29 (93.5%) | 2 (6.5%) |
| College/Associate Degree | 64 (91.4%) | 6 (8.6%) |
| Bachelor's Degree or higher | 48 (87.3%) | 7 (12.7%) |
Occupancy by Age of Householder in Mitchell Heights
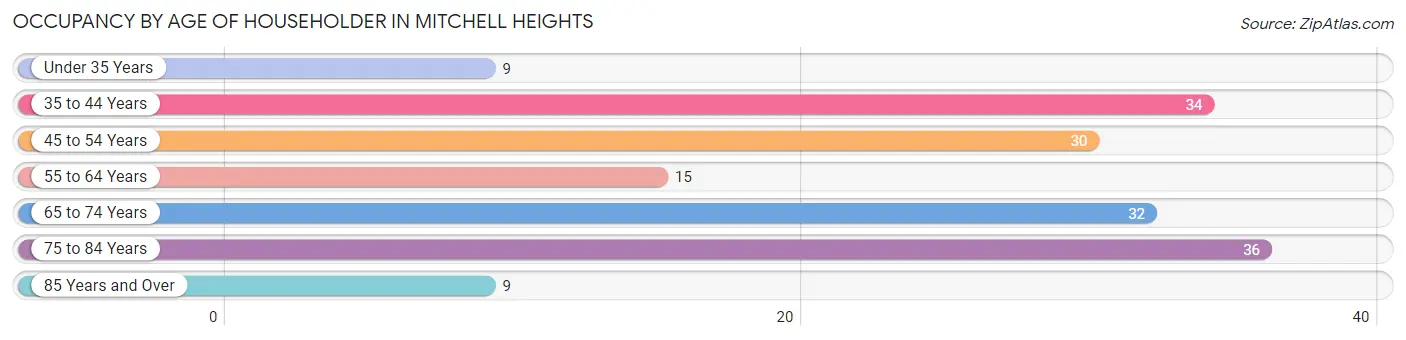
| Age Bracket | # Households | % Households |
| Under 35 Years | 9 | 5.4% |
| 35 to 44 Years | 34 | 20.6% |
| 45 to 54 Years | 30 | 18.2% |
| 55 to 64 Years | 15 | 9.1% |
| 65 to 74 Years | 32 | 19.4% |
| 75 to 84 Years | 36 | 21.8% |
| 85 Years and Over | 9 | 5.4% |
| Total | 165 | 100.0% |
Housing Finances in Mitchell Heights
Median Income by Occupancy in Mitchell Heights
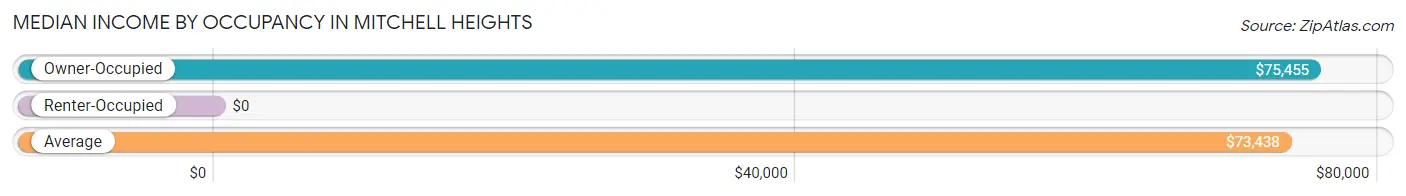
| Occupancy Type | # Households | Median Income |
| Owner-Occupied | 150 (90.9%) | $75,455 |
| Renter-Occupied | 15 (9.1%) | $0 |
| Average | 165 (100.0%) | $73,438 |
Occupancy by Householder Income Bracket in Mitchell Heights
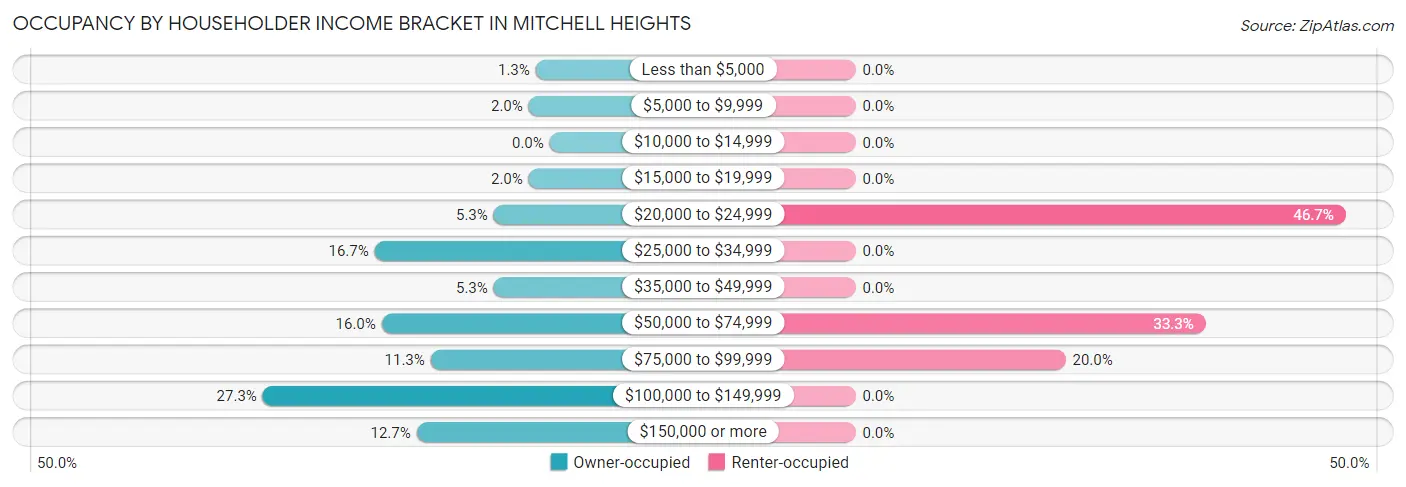
| Income Bracket | Owner-occupied | Renter-occupied |
| Less than $5,000 | 2 (1.3%) | 0 (0.0%) |
| $5,000 to $9,999 | 3 (2.0%) | 0 (0.0%) |
| $10,000 to $14,999 | 0 (0.0%) | 0 (0.0%) |
| $15,000 to $19,999 | 3 (2.0%) | 0 (0.0%) |
| $20,000 to $24,999 | 8 (5.3%) | 7 (46.7%) |
| $25,000 to $34,999 | 25 (16.7%) | 0 (0.0%) |
| $35,000 to $49,999 | 8 (5.3%) | 0 (0.0%) |
| $50,000 to $74,999 | 24 (16.0%) | 5 (33.3%) |
| $75,000 to $99,999 | 17 (11.3%) | 3 (20.0%) |
| $100,000 to $149,999 | 41 (27.3%) | 0 (0.0%) |
| $150,000 or more | 19 (12.7%) | 0 (0.0%) |
| Total | 150 (100.0%) | 15 (100.0%) |
Monthly Housing Cost Tiers in Mitchell Heights
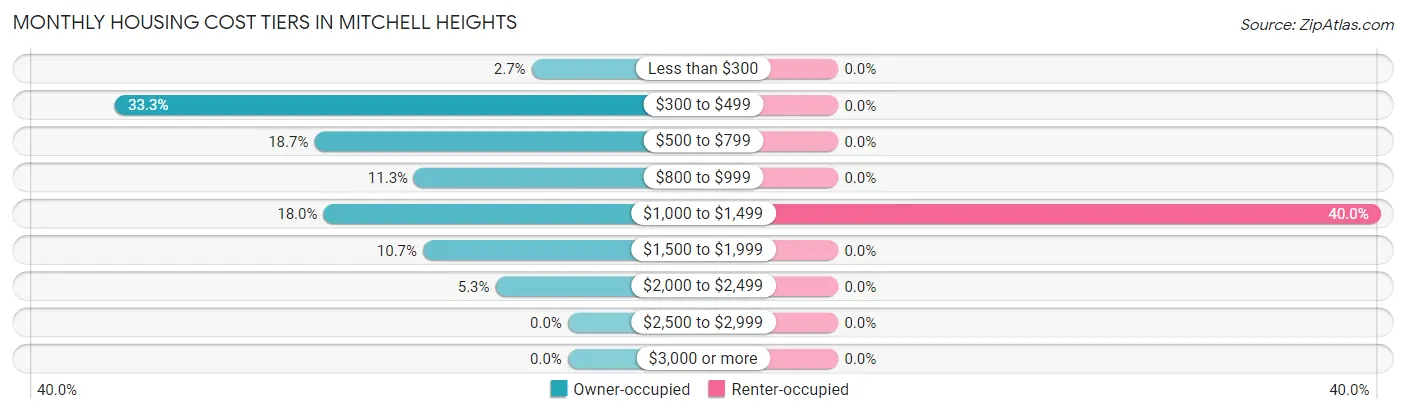
| Monthly Cost | Owner-occupied | Renter-occupied |
| Less than $300 | 4 (2.7%) | 0 (0.0%) |
| $300 to $499 | 50 (33.3%) | 0 (0.0%) |
| $500 to $799 | 28 (18.7%) | 0 (0.0%) |
| $800 to $999 | 17 (11.3%) | 0 (0.0%) |
| $1,000 to $1,499 | 27 (18.0%) | 6 (40.0%) |
| $1,500 to $1,999 | 16 (10.7%) | 0 (0.0%) |
| $2,000 to $2,499 | 8 (5.3%) | 0 (0.0%) |
| $2,500 to $2,999 | 0 (0.0%) | 0 (0.0%) |
| $3,000 or more | 0 (0.0%) | 0 (0.0%) |
| Total | 150 (100.0%) | 15 (100.0%) |
Physical Housing Characteristics in Mitchell Heights
Housing Structures in Mitchell Heights
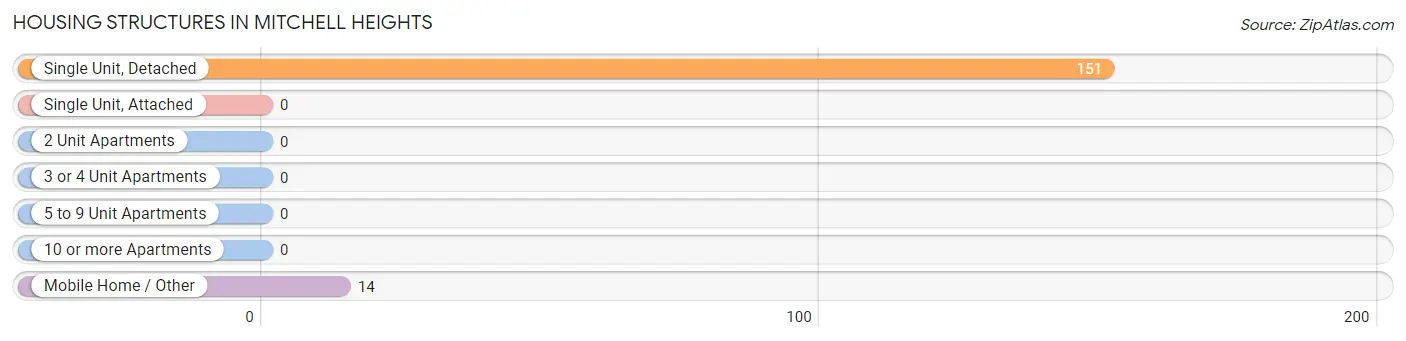
| Structure Type | # Housing Units | % Housing Units |
| Single Unit, Detached | 151 | 91.5% |
| Single Unit, Attached | 0 | 0.0% |
| 2 Unit Apartments | 0 | 0.0% |
| 3 or 4 Unit Apartments | 0 | 0.0% |
| 5 to 9 Unit Apartments | 0 | 0.0% |
| 10 or more Apartments | 0 | 0.0% |
| Mobile Home / Other | 14 | 8.5% |
| Total | 165 | 100.0% |
Housing Structures by Occupancy in Mitchell Heights
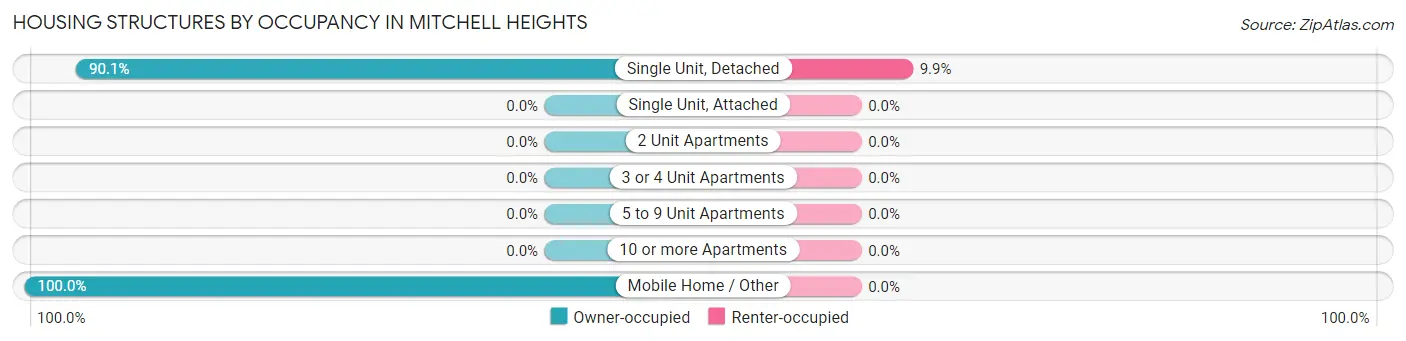
| Structure Type | Owner-occupied | Renter-occupied |
| Single Unit, Detached | 136 (90.1%) | 15 (9.9%) |
| Single Unit, Attached | 0 (0.0%) | 0 (0.0%) |
| 2 Unit Apartments | 0 (0.0%) | 0 (0.0%) |
| 3 or 4 Unit Apartments | 0 (0.0%) | 0 (0.0%) |
| 5 to 9 Unit Apartments | 0 (0.0%) | 0 (0.0%) |
| 10 or more Apartments | 0 (0.0%) | 0 (0.0%) |
| Mobile Home / Other | 14 (100.0%) | 0 (0.0%) |
| Total | 150 (90.9%) | 15 (9.1%) |
Housing Structures by Number of Rooms in Mitchell Heights
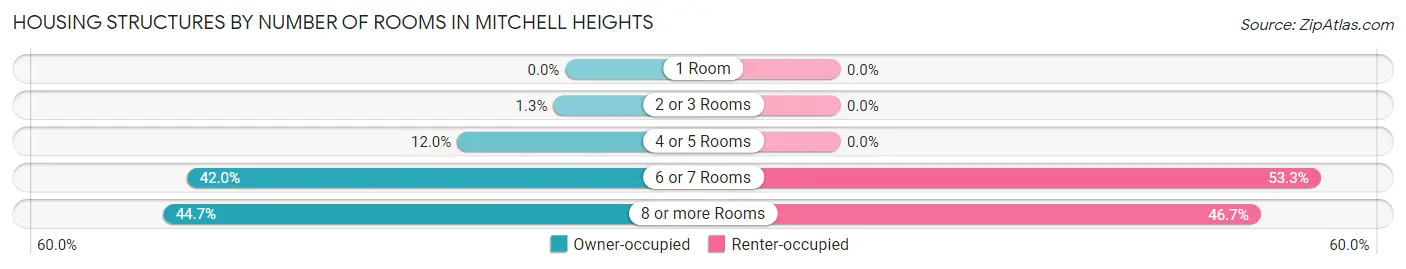
| Number of Rooms | Owner-occupied | Renter-occupied |
| 1 Room | 0 (0.0%) | 0 (0.0%) |
| 2 or 3 Rooms | 2 (1.3%) | 0 (0.0%) |
| 4 or 5 Rooms | 18 (12.0%) | 0 (0.0%) |
| 6 or 7 Rooms | 63 (42.0%) | 8 (53.3%) |
| 8 or more Rooms | 67 (44.7%) | 7 (46.7%) |
| Total | 150 (100.0%) | 15 (100.0%) |
Housing Structure by Heating Type in Mitchell Heights
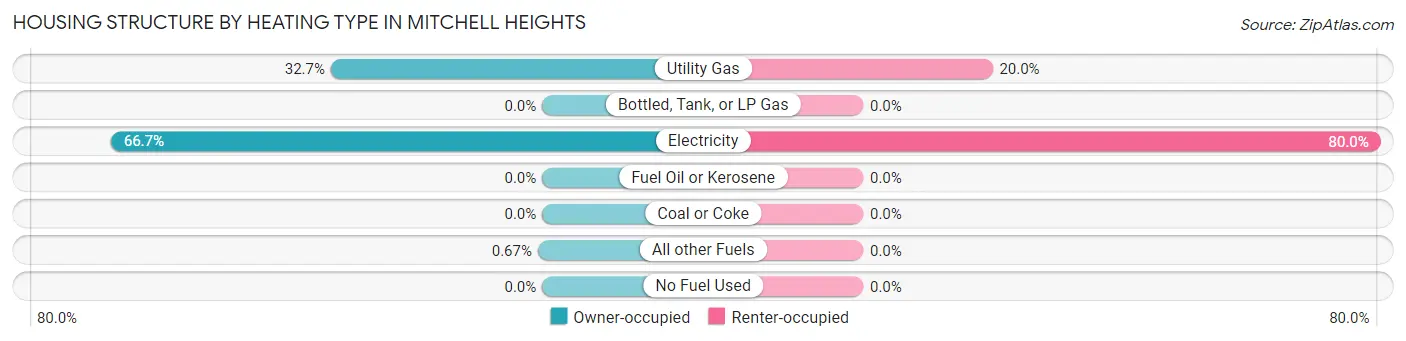
| Heating Type | Owner-occupied | Renter-occupied |
| Utility Gas | 49 (32.7%) | 3 (20.0%) |
| Bottled, Tank, or LP Gas | 0 (0.0%) | 0 (0.0%) |
| Electricity | 100 (66.7%) | 12 (80.0%) |
| Fuel Oil or Kerosene | 0 (0.0%) | 0 (0.0%) |
| Coal or Coke | 0 (0.0%) | 0 (0.0%) |
| All other Fuels | 1 (0.7%) | 0 (0.0%) |
| No Fuel Used | 0 (0.0%) | 0 (0.0%) |
| Total | 150 (100.0%) | 15 (100.0%) |
Household Vehicle Usage in Mitchell Heights
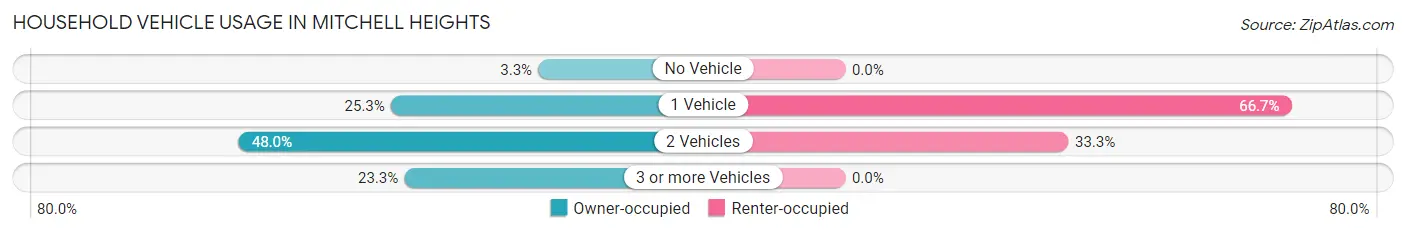
| Vehicles per Household | Owner-occupied | Renter-occupied |
| No Vehicle | 5 (3.3%) | 0 (0.0%) |
| 1 Vehicle | 38 (25.3%) | 10 (66.7%) |
| 2 Vehicles | 72 (48.0%) | 5 (33.3%) |
| 3 or more Vehicles | 35 (23.3%) | 0 (0.0%) |
| Total | 150 (100.0%) | 15 (100.0%) |
Real Estate & Mortgages in Mitchell Heights
Real Estate and Mortgage Overview in Mitchell Heights
| Characteristic | Without Mortgage | With Mortgage |
| Housing Units | 84 | 66 |
| Median Property Value | $154,500 | $171,400 |
| Median Household Income | $45,000 | $13 |
| Monthly Housing Costs | $469 | $0 |
| Real Estate Taxes | $800 | $0 |
Property Value by Mortgage Status in Mitchell Heights
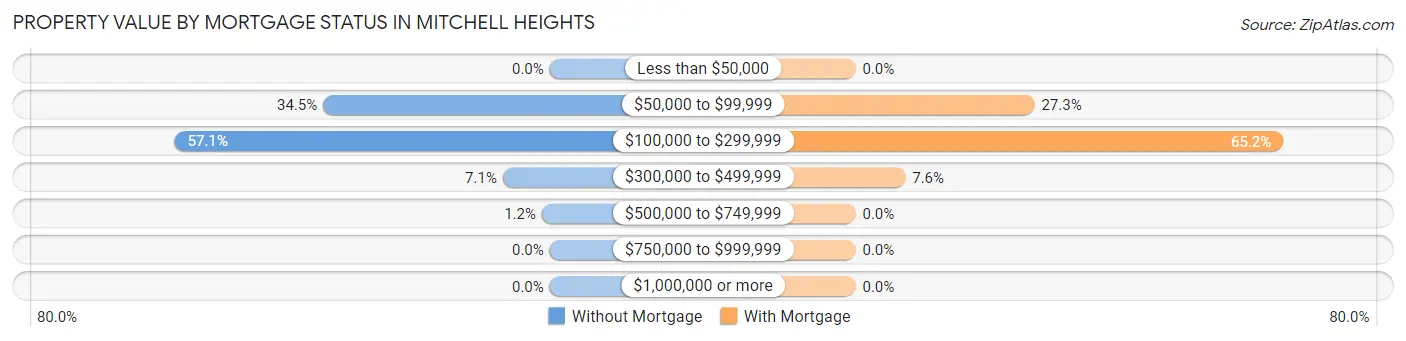
| Property Value | Without Mortgage | With Mortgage |
| Less than $50,000 | 0 (0.0%) | 0 (0.0%) |
| $50,000 to $99,999 | 29 (34.5%) | 18 (27.3%) |
| $100,000 to $299,999 | 48 (57.1%) | 43 (65.1%) |
| $300,000 to $499,999 | 6 (7.1%) | 5 (7.6%) |
| $500,000 to $749,999 | 1 (1.2%) | 0 (0.0%) |
| $750,000 to $999,999 | 0 (0.0%) | 0 (0.0%) |
| $1,000,000 or more | 0 (0.0%) | 0 (0.0%) |
| Total | 84 (100.0%) | 66 (100.0%) |
Household Income by Mortgage Status in Mitchell Heights
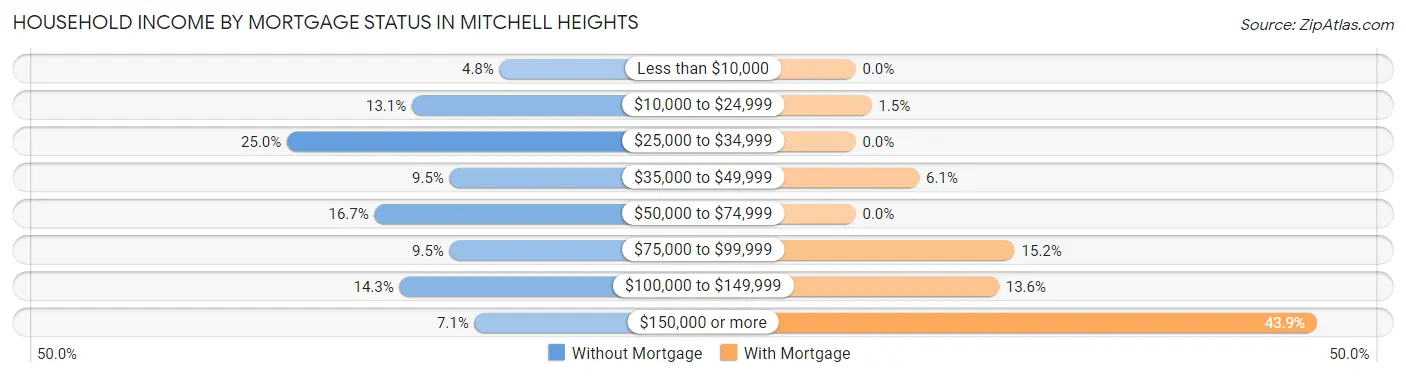
| Household Income | Without Mortgage | With Mortgage |
| Less than $10,000 | 4 (4.8%) | 0 (0.0%) |
| $10,000 to $24,999 | 11 (13.1%) | 1 (1.5%) |
| $25,000 to $34,999 | 21 (25.0%) | 0 (0.0%) |
| $35,000 to $49,999 | 8 (9.5%) | 4 (6.1%) |
| $50,000 to $74,999 | 14 (16.7%) | 0 (0.0%) |
| $75,000 to $99,999 | 8 (9.5%) | 10 (15.1%) |
| $100,000 to $149,999 | 12 (14.3%) | 9 (13.6%) |
| $150,000 or more | 6 (7.1%) | 29 (43.9%) |
| Total | 84 (100.0%) | 66 (100.0%) |
Property Value to Household Income Ratio in Mitchell Heights
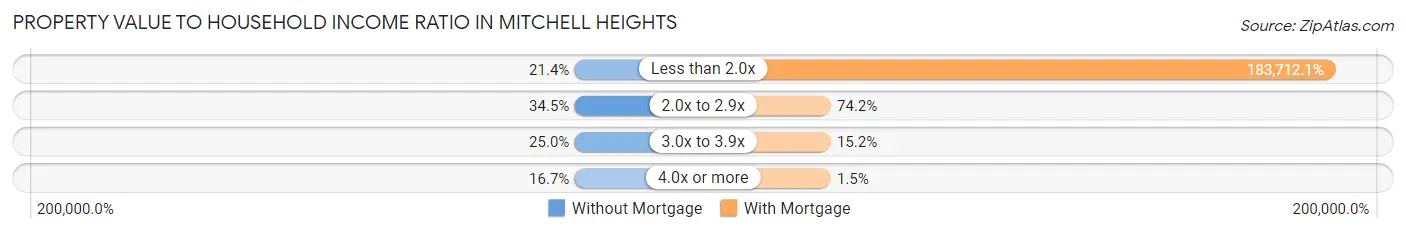
| Value-to-Income Ratio | Without Mortgage | With Mortgage |
| Less than 2.0x | 18 (21.4%) | 121,250 (183,712.1%) |
| 2.0x to 2.9x | 29 (34.5%) | 49 (74.2%) |
| 3.0x to 3.9x | 21 (25.0%) | 10 (15.1%) |
| 4.0x or more | 14 (16.7%) | 1 (1.5%) |
| Total | 84 (100.0%) | 66 (100.0%) |
Real Estate Taxes by Mortgage Status in Mitchell Heights
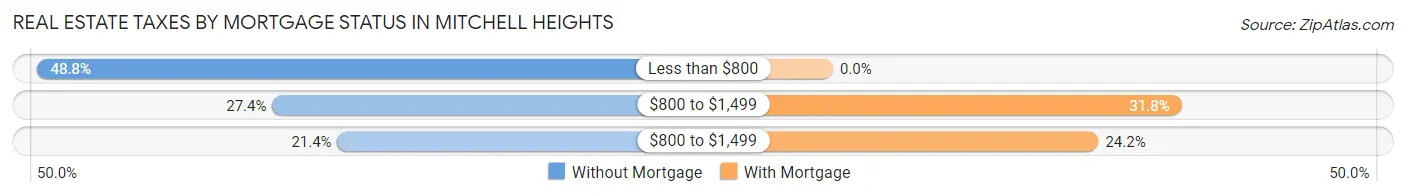
| Property Taxes | Without Mortgage | With Mortgage |
| Less than $800 | 41 (48.8%) | 0 (0.0%) |
| $800 to $1,499 | 23 (27.4%) | 21 (31.8%) |
| $800 to $1,499 | 18 (21.4%) | 16 (24.2%) |
| Total | 84 (100.0%) | 66 (100.0%) |
Health & Disability in Mitchell Heights
Health Insurance Coverage by Age in Mitchell Heights
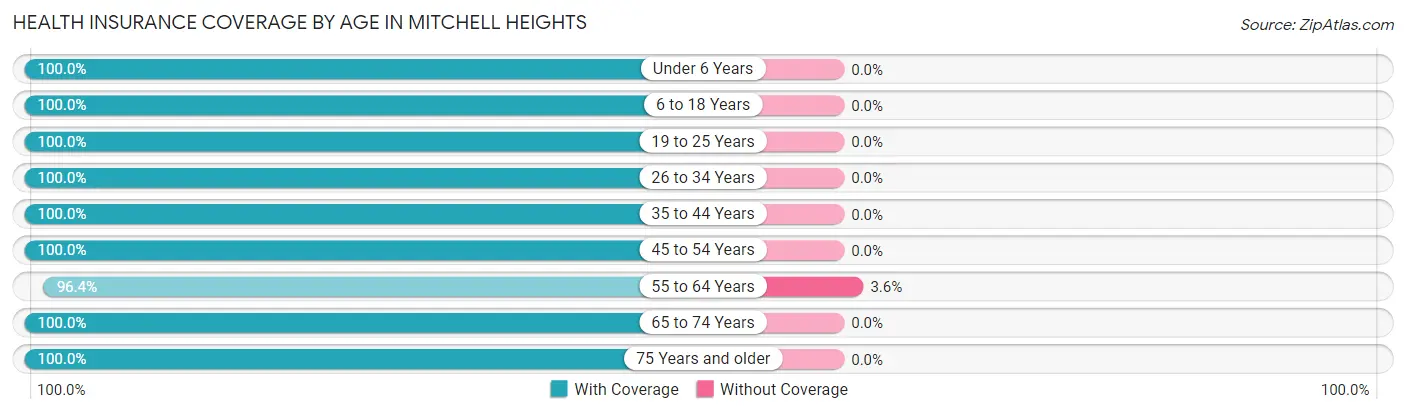
| Age Bracket | With Coverage | Without Coverage |
| Under 6 Years | 32 (100.0%) | 0 (0.0%) |
| 6 to 18 Years | 63 (100.0%) | 0 (0.0%) |
| 19 to 25 Years | 10 (100.0%) | 0 (0.0%) |
| 26 to 34 Years | 46 (100.0%) | 0 (0.0%) |
| 35 to 44 Years | 69 (100.0%) | 0 (0.0%) |
| 45 to 54 Years | 47 (100.0%) | 0 (0.0%) |
| 55 to 64 Years | 27 (96.4%) | 1 (3.6%) |
| 65 to 74 Years | 54 (100.0%) | 0 (0.0%) |
| 75 Years and older | 65 (100.0%) | 0 (0.0%) |
| Total | 413 (99.8%) | 1 (0.2%) |
Health Insurance Coverage by Citizenship Status in Mitchell Heights
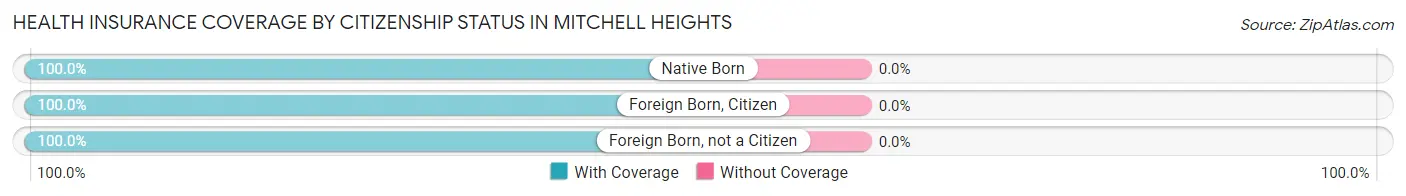
| Citizenship Status | With Coverage | Without Coverage |
| Native Born | 32 (100.0%) | 0 (0.0%) |
| Foreign Born, Citizen | 63 (100.0%) | 0 (0.0%) |
| Foreign Born, not a Citizen | 10 (100.0%) | 0 (0.0%) |
Health Insurance Coverage by Household Income in Mitchell Heights
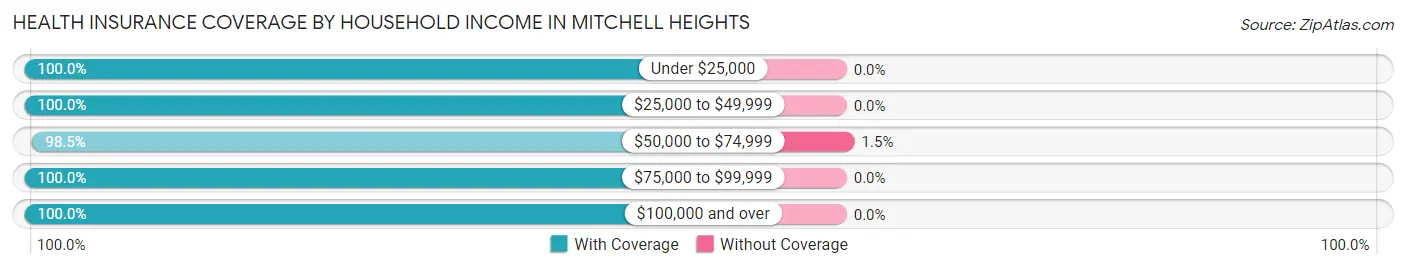
| Household Income | With Coverage | Without Coverage |
| Under $25,000 | 29 (100.0%) | 0 (0.0%) |
| $25,000 to $49,999 | 75 (100.0%) | 0 (0.0%) |
| $50,000 to $74,999 | 67 (98.5%) | 1 (1.5%) |
| $75,000 to $99,999 | 39 (100.0%) | 0 (0.0%) |
| $100,000 and over | 203 (100.0%) | 0 (0.0%) |
Public vs Private Health Insurance Coverage by Age in Mitchell Heights
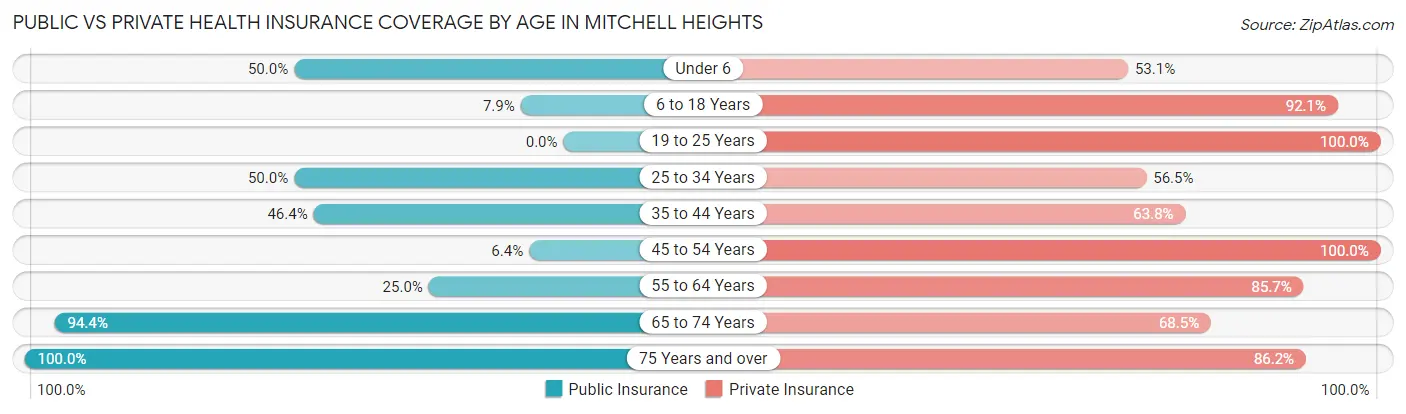
| Age Bracket | Public Insurance | Private Insurance |
| Under 6 | 16 (50.0%) | 17 (53.1%) |
| 6 to 18 Years | 5 (7.9%) | 58 (92.1%) |
| 19 to 25 Years | 0 (0.0%) | 10 (100.0%) |
| 25 to 34 Years | 23 (50.0%) | 26 (56.5%) |
| 35 to 44 Years | 32 (46.4%) | 44 (63.8%) |
| 45 to 54 Years | 3 (6.4%) | 47 (100.0%) |
| 55 to 64 Years | 7 (25.0%) | 24 (85.7%) |
| 65 to 74 Years | 51 (94.4%) | 37 (68.5%) |
| 75 Years and over | 65 (100.0%) | 56 (86.2%) |
| Total | 202 (48.8%) | 319 (77.0%) |
Disability Status by Sex by Age in Mitchell Heights
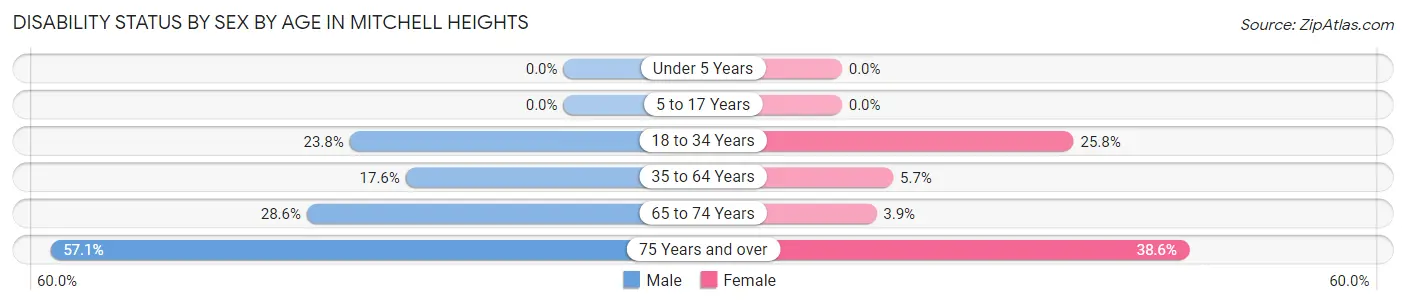
| Age Bracket | Male | Female |
| Under 5 Years | 0 (0.0%) | 0 (0.0%) |
| 5 to 17 Years | 0 (0.0%) | 0 (0.0%) |
| 18 to 34 Years | 10 (23.8%) | 8 (25.8%) |
| 35 to 64 Years | 13 (17.6%) | 4 (5.7%) |
| 65 to 74 Years | 8 (28.6%) | 1 (3.8%) |
| 75 Years and over | 12 (57.1%) | 17 (38.6%) |
Disability Class by Sex by Age in Mitchell Heights
Disability Class: Hearing Difficulty
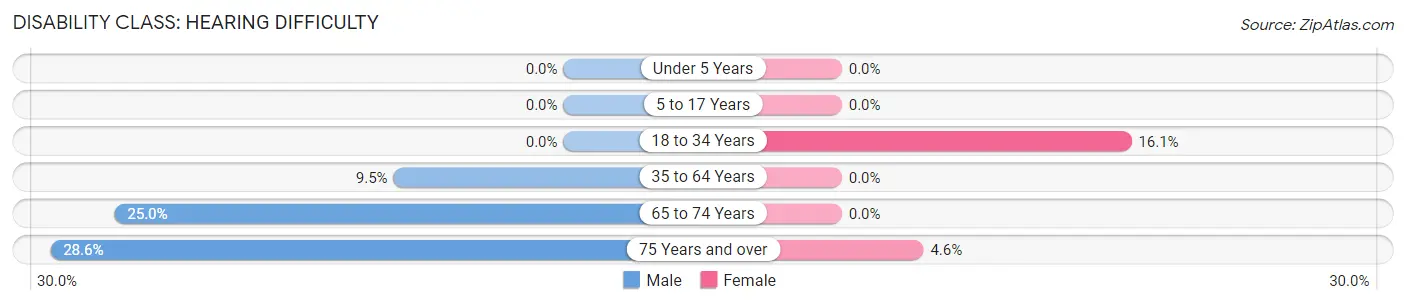
| Age Bracket | Male | Female |
| Under 5 Years | 0 (0.0%) | 0 (0.0%) |
| 5 to 17 Years | 0 (0.0%) | 0 (0.0%) |
| 18 to 34 Years | 0 (0.0%) | 5 (16.1%) |
| 35 to 64 Years | 7 (9.5%) | 0 (0.0%) |
| 65 to 74 Years | 7 (25.0%) | 0 (0.0%) |
| 75 Years and over | 6 (28.6%) | 2 (4.5%) |
Disability Class: Vision Difficulty
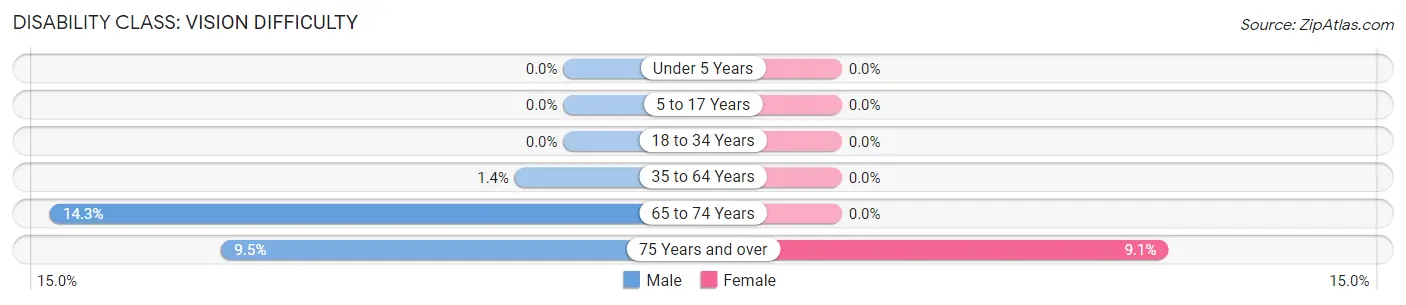
| Age Bracket | Male | Female |
| Under 5 Years | 0 (0.0%) | 0 (0.0%) |
| 5 to 17 Years | 0 (0.0%) | 0 (0.0%) |
| 18 to 34 Years | 0 (0.0%) | 0 (0.0%) |
| 35 to 64 Years | 1 (1.3%) | 0 (0.0%) |
| 65 to 74 Years | 4 (14.3%) | 0 (0.0%) |
| 75 Years and over | 2 (9.5%) | 4 (9.1%) |
Disability Class: Cognitive Difficulty
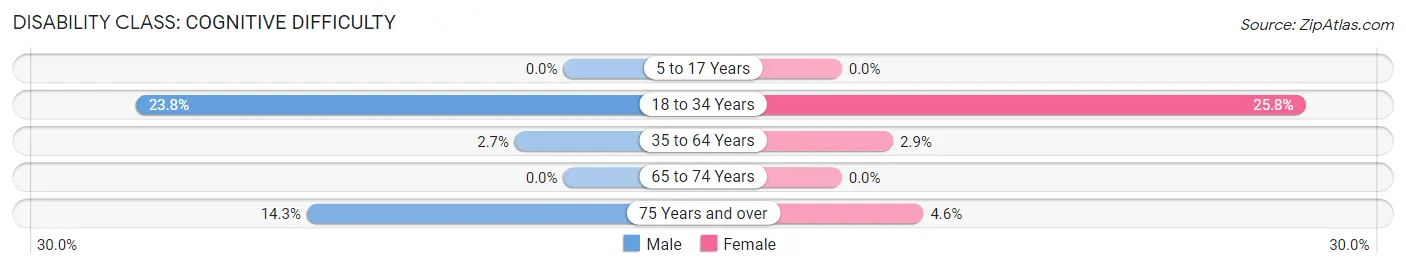
| Age Bracket | Male | Female |
| 5 to 17 Years | 0 (0.0%) | 0 (0.0%) |
| 18 to 34 Years | 10 (23.8%) | 8 (25.8%) |
| 35 to 64 Years | 2 (2.7%) | 2 (2.9%) |
| 65 to 74 Years | 0 (0.0%) | 0 (0.0%) |
| 75 Years and over | 3 (14.3%) | 2 (4.5%) |
Disability Class: Ambulatory Difficulty
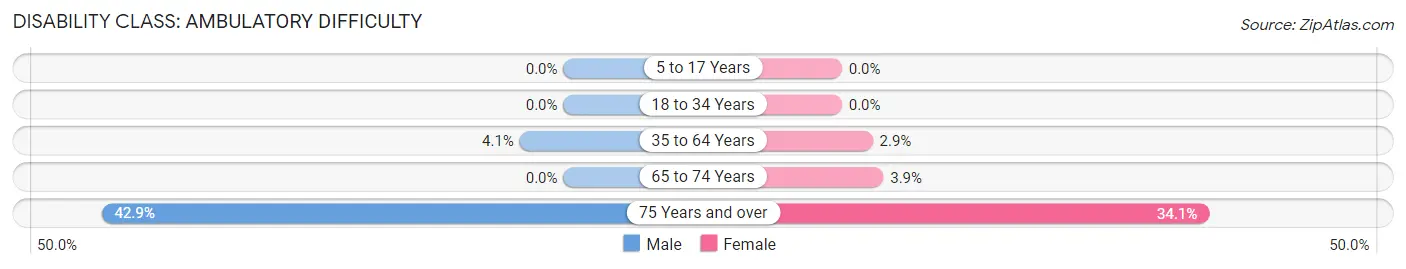
| Age Bracket | Male | Female |
| 5 to 17 Years | 0 (0.0%) | 0 (0.0%) |
| 18 to 34 Years | 0 (0.0%) | 0 (0.0%) |
| 35 to 64 Years | 3 (4.1%) | 2 (2.9%) |
| 65 to 74 Years | 0 (0.0%) | 1 (3.8%) |
| 75 Years and over | 9 (42.9%) | 15 (34.1%) |
Disability Class: Self-Care Difficulty
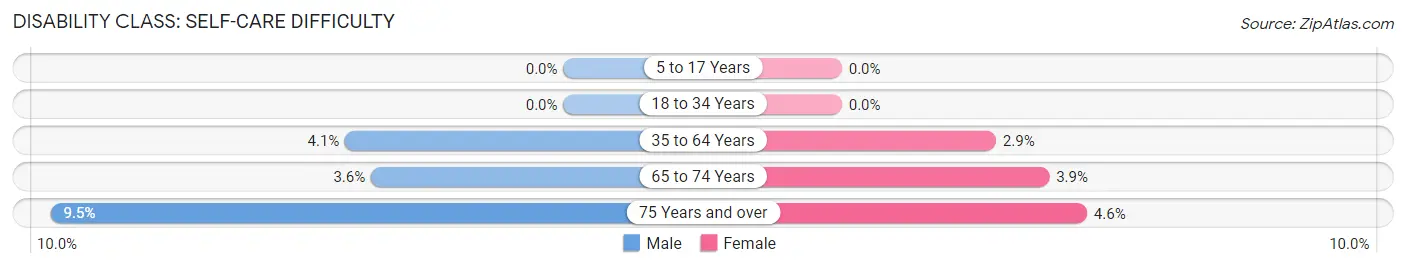
| Age Bracket | Male | Female |
| 5 to 17 Years | 0 (0.0%) | 0 (0.0%) |
| 18 to 34 Years | 0 (0.0%) | 0 (0.0%) |
| 35 to 64 Years | 3 (4.1%) | 2 (2.9%) |
| 65 to 74 Years | 1 (3.6%) | 1 (3.8%) |
| 75 Years and over | 2 (9.5%) | 2 (4.5%) |
Technology Access in Mitchell Heights
Computing Device Access in Mitchell Heights
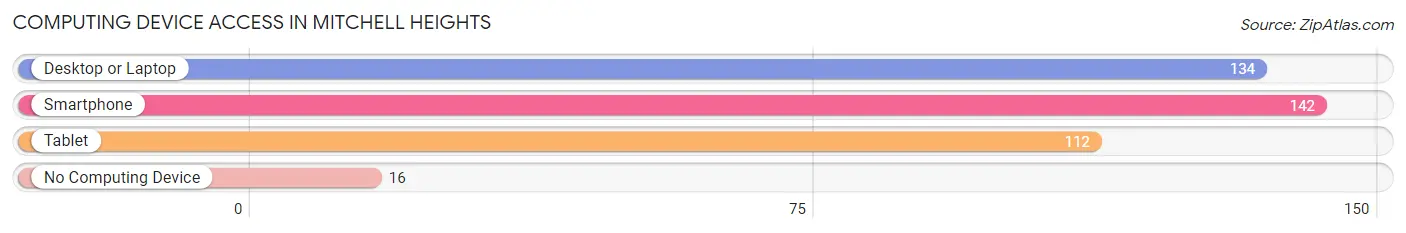
| Device Type | # Households | % Households |
| Desktop or Laptop | 134 | 81.2% |
| Smartphone | 142 | 86.1% |
| Tablet | 112 | 67.9% |
| No Computing Device | 16 | 9.7% |
| Total | 165 | 100.0% |
Internet Access in Mitchell Heights
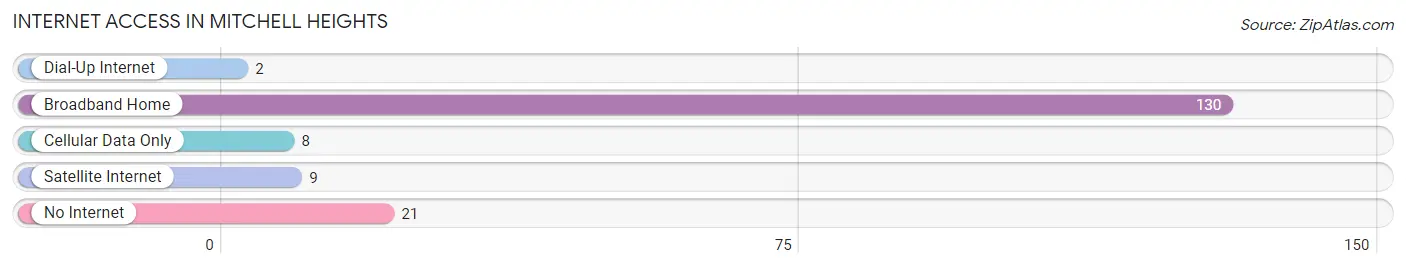
| Internet Type | # Households | % Households |
| Dial-Up Internet | 2 | 1.2% |
| Broadband Home | 130 | 78.8% |
| Cellular Data Only | 8 | 4.9% |
| Satellite Internet | 9 | 5.4% |
| No Internet | 21 | 12.7% |
| Total | 165 | 100.0% |
Mitchell Heights Summary
Mitchell Heights is a small unincorporated community located in the eastern panhandle of West Virginia. It is situated in Berkeley County, approximately five miles south of Martinsburg. The community is bordered by the Potomac River to the east and the Opequon Creek to the west.
History
The area that is now Mitchell Heights was first settled in the late 1700s by German immigrants. The community was originally known as “Mittelstadt”, which translates to “middle town” in German. The name was changed to Mitchell Heights in the early 1900s, after the Mitchell family, who owned a large amount of land in the area.
The community was largely agricultural until the 1950s, when the construction of Interstate 81 brought an influx of new residents and businesses. The population of Mitchell Heights has grown steadily since then, and the community is now home to a variety of businesses, including restaurants, retail stores, and professional services.
Geography
Mitchell Heights is located in the eastern panhandle of West Virginia, approximately five miles south of Martinsburg. The community is bordered by the Potomac River to the east and the Opequon Creek to the west. The terrain is mostly flat, with some rolling hills in the area. The climate is temperate, with hot summers and cold winters.
Economy
The economy of Mitchell Heights is largely based on the service industry. The community is home to a variety of restaurants, retail stores, and professional services. There are also several manufacturing and industrial businesses in the area, including a paper mill and a furniture factory.
Demographics
As of the 2010 census, the population of Mitchell Heights was 1,845. The racial makeup of the community was 94.3% White, 2.7% African American, 0.7% Native American, 0.4% Asian, and 1.9% from other races. The median household income was $45,938, and the median home value was $179,000.
Conclusion
Mitchell Heights is a small unincorporated community located in the eastern panhandle of West Virginia. It is situated in Berkeley County, approximately five miles south of Martinsburg. The community is bordered by the Potomac River to the east and the Opequon Creek to the west. The economy of Mitchell Heights is largely based on the service industry, and the population of the community was 1,845 as of the 2010 census.
Common Questions
What is the Total Population of Mitchell Heights?
Total Population of Mitchell Heights is 414.
What is the Total Male Population of Mitchell Heights?
Total Male Population of Mitchell Heights is 181.
What is the Total Female Population of Mitchell Heights?
Total Female Population of Mitchell Heights is 233.
What is the Ratio of Males per 100 Females in Mitchell Heights?
There are 77.68 Males per 100 Females in Mitchell Heights.
What is the Ratio of Females per 100 Males in Mitchell Heights?
There are 128.73 Females per 100 Males in Mitchell Heights.
What is the Median Population Age in Mitchell Heights?
Median Population Age in Mitchell Heights is 42.6 Years.
What is the Average Family Size in Mitchell Heights
Average Family Size in Mitchell Heights is 3.0 People.
What is the Average Household Size in Mitchell Heights
Average Household Size in Mitchell Heights is 2.5 People.
What is Per Capita Income in Mitchell Heights?
Per Capita income in Mitchell Heights is $37,947.
What is the Median Family Income in Mitchell Heights?
Median Family Income in Mitchell Heights is $85,000.
What is the Median Household income in Mitchell Heights?
Median Household Income in Mitchell Heights is $73,438.
What is Income or Wage Gap in Mitchell Heights?
Income or Wage Gap in Mitchell Heights is 53.7%.
Women in Mitchell Heights earn 46.3 cents for every dollar earned by a man.
What is Inequality or Gini Index in Mitchell Heights?
Inequality or Gini Index in Mitchell Heights is 0.42.
How Large is the Labor Force in Mitchell Heights?
There are 200 People in the Labor Forcein in Mitchell Heights.
What is the Percentage of People in the Labor Force in Mitchell Heights?
58.0% of People are in the Labor Force in Mitchell Heights.
What is the Unemployment Rate in Mitchell Heights?
Unemployment Rate in Mitchell Heights is 4.5%.