Mabscott, WV
Mabscott Map
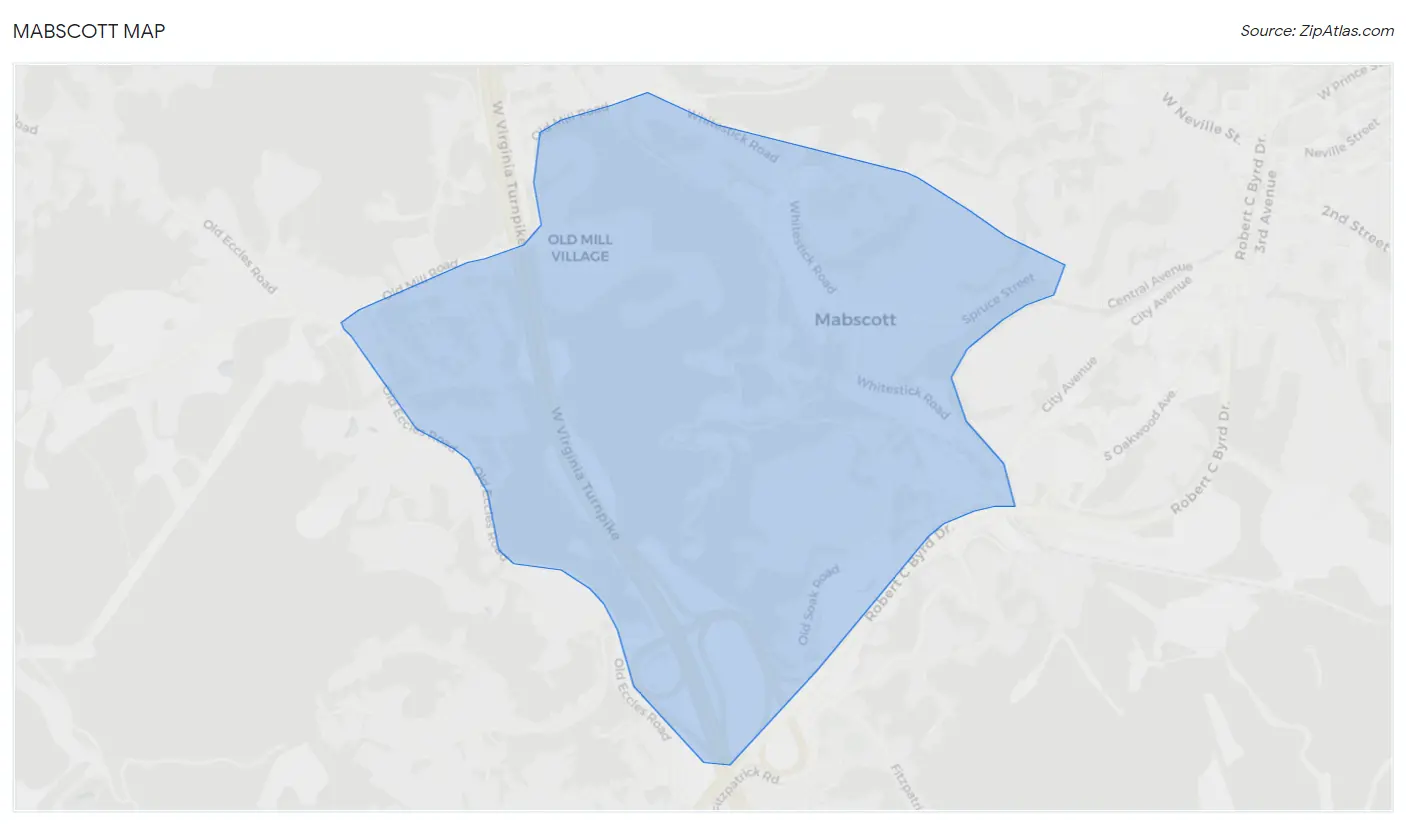
Mabscott Overview
1,550
TOTAL POPULATION
714
MALE POPULATION
836
FEMALE POPULATION
85.41
MALES / 100 FEMALES
117.09
FEMALES / 100 MALES
33.4
MEDIAN AGE
3.5
AVG FAMILY SIZE
2.7
AVG HOUSEHOLD SIZE
$24,114
PER CAPITA INCOME
$65,000
AVG FAMILY INCOME
$52,083
AVG HOUSEHOLD INCOME
48.7%
WAGE / INCOME GAP [ % ]
51.3¢/ $1
WAGE / INCOME GAP [ $ ]
0.46
INEQUALITY / GINI INDEX
590
LABOR FORCE [ PEOPLE ]
53.8%
PERCENT IN LABOR FORCE
2.2%
UNEMPLOYMENT RATE
Mabscott Zip Codes
Mabscott Area Codes
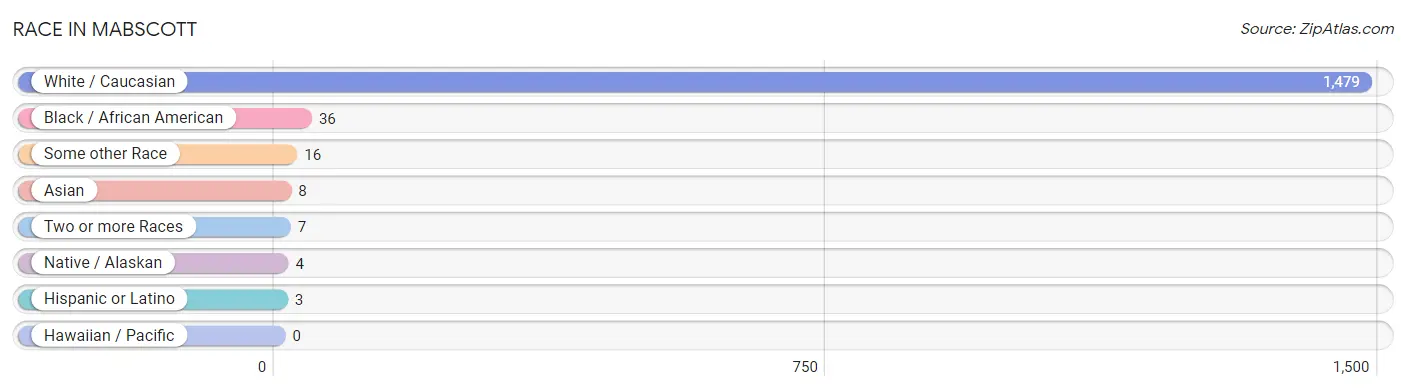
Race in Mabscott
The most populous races in Mabscott are White / Caucasian (1,479 | 95.4%), Black / African American (36 | 2.3%), and Some other Race (16 | 1.0%).
| Race | # Population | % Population |
| Asian | 8 | 0.5% |
| Black / African American | 36 | 2.3% |
| Hawaiian / Pacific | 0 | 0.0% |
| Hispanic or Latino | 3 | 0.2% |
| Native / Alaskan | 4 | 0.3% |
| White / Caucasian | 1,479 | 95.4% |
| Two or more Races | 7 | 0.4% |
| Some other Race | 16 | 1.0% |
| Total | 1,550 | 100.0% |
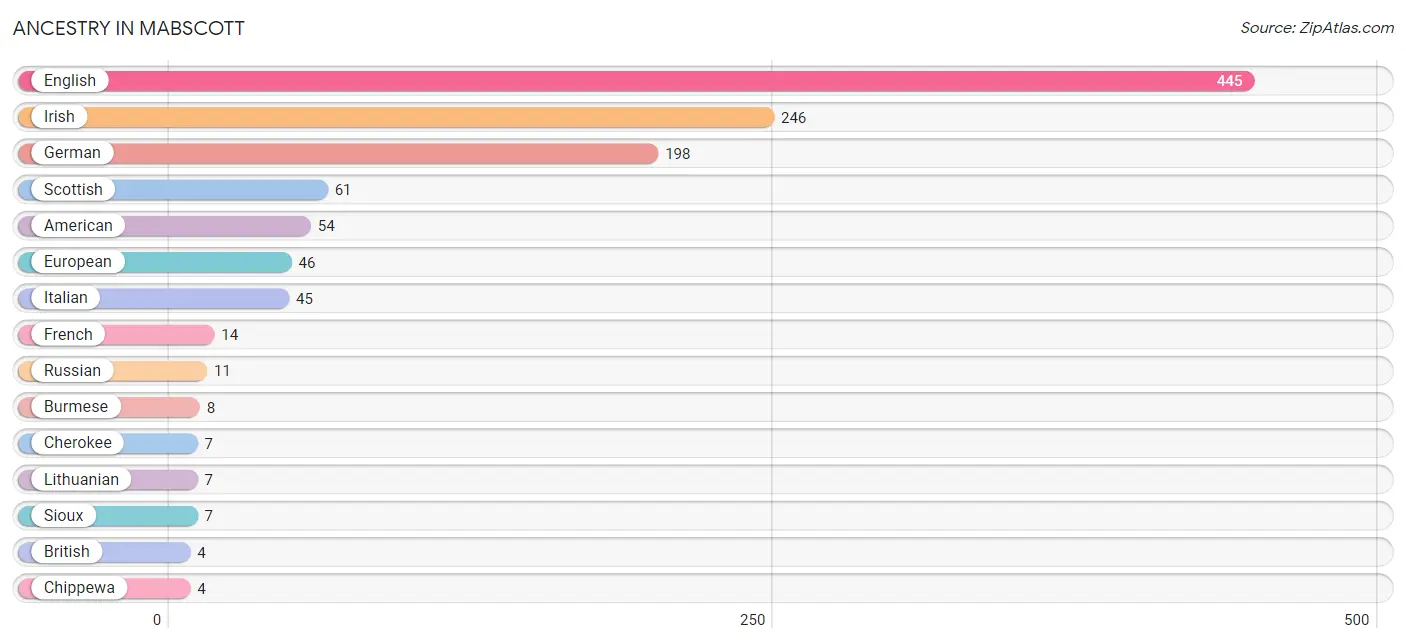
Ancestry in Mabscott
The most populous ancestries reported in Mabscott are English (445 | 28.7%), Irish (246 | 15.9%), German (198 | 12.8%), Scottish (61 | 3.9%), and American (54 | 3.5%), together accounting for 64.8% of all Mabscott residents.
| Ancestry | # Population | % Population |
| American | 54 | 3.5% |
| British | 4 | 0.3% |
| Burmese | 8 | 0.5% |
| Cherokee | 7 | 0.4% |
| Chippewa | 4 | 0.3% |
| English | 445 | 28.7% |
| European | 46 | 3.0% |
| French | 14 | 0.9% |
| German | 198 | 12.8% |
| Irish | 246 | 15.9% |
| Italian | 45 | 2.9% |
| Lithuanian | 7 | 0.4% |
| Polish | 2 | 0.1% |
| Puerto Rican | 3 | 0.2% |
| Russian | 11 | 0.7% |
| Scotch-Irish | 2 | 0.1% |
| Scottish | 61 | 3.9% |
| Sioux | 7 | 0.4% | View All 18 Rows |
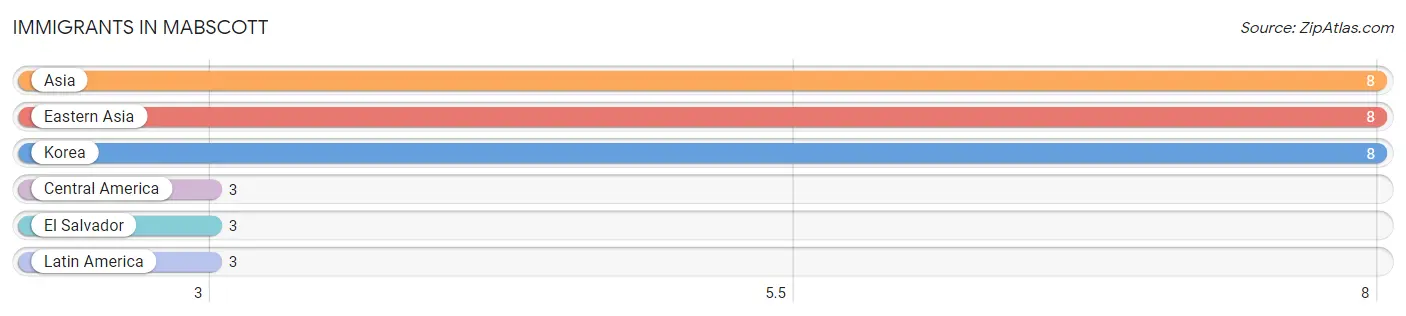
Immigrants in Mabscott
The most numerous immigrant groups reported in Mabscott came from Asia (8 | 0.5%), Eastern Asia (8 | 0.5%), Korea (8 | 0.5%), Central America (3 | 0.2%), and El Salvador (3 | 0.2%), together accounting for 1.9% of all Mabscott residents.
| Immigration Origin | # Population | % Population |
| Asia | 8 | 0.5% |
| Central America | 3 | 0.2% |
| Eastern Asia | 8 | 0.5% |
| El Salvador | 3 | 0.2% |
| Korea | 8 | 0.5% |
| Latin America | 3 | 0.2% | View All 6 Rows |
Sex and Age in Mabscott
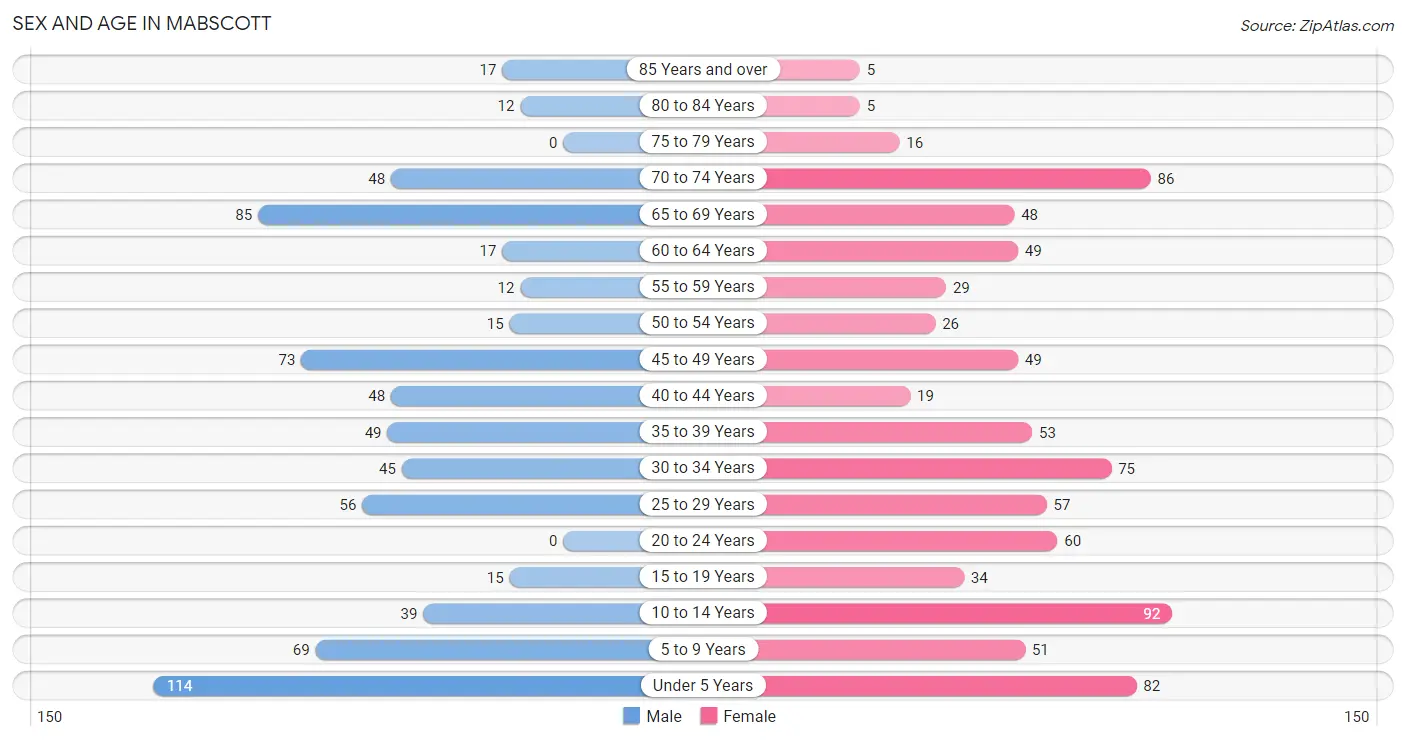
Sex and Age in Mabscott
The most populous age groups in Mabscott are Under 5 Years (114 | 16.0%) for men and 10 to 14 Years (92 | 11.0%) for women.
| Age Bracket | Male | Female |
| Under 5 Years | 114 (16.0%) | 82 (9.8%) |
| 5 to 9 Years | 69 (9.7%) | 51 (6.1%) |
| 10 to 14 Years | 39 (5.5%) | 92 (11.0%) |
| 15 to 19 Years | 15 (2.1%) | 34 (4.1%) |
| 20 to 24 Years | 0 (0.0%) | 60 (7.2%) |
| 25 to 29 Years | 56 (7.8%) | 57 (6.8%) |
| 30 to 34 Years | 45 (6.3%) | 75 (9.0%) |
| 35 to 39 Years | 49 (6.9%) | 53 (6.3%) |
| 40 to 44 Years | 48 (6.7%) | 19 (2.3%) |
| 45 to 49 Years | 73 (10.2%) | 49 (5.9%) |
| 50 to 54 Years | 15 (2.1%) | 26 (3.1%) |
| 55 to 59 Years | 12 (1.7%) | 29 (3.5%) |
| 60 to 64 Years | 17 (2.4%) | 49 (5.9%) |
| 65 to 69 Years | 85 (11.9%) | 48 (5.7%) |
| 70 to 74 Years | 48 (6.7%) | 86 (10.3%) |
| 75 to 79 Years | 0 (0.0%) | 16 (1.9%) |
| 80 to 84 Years | 12 (1.7%) | 5 (0.6%) |
| 85 Years and over | 17 (2.4%) | 5 (0.6%) |
| Total | 714 (100.0%) | 836 (100.0%) |
Families and Households in Mabscott
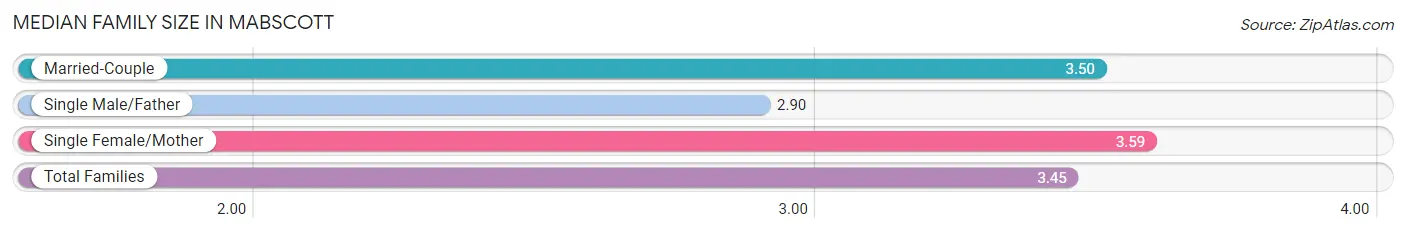
Median Family Size in Mabscott
The median family size in Mabscott is 3.45 persons per family, with single female/mother families (70 | 21.2%) accounting for the largest median family size of 3.59 persons per family. On the other hand, single male/father families (40 | 12.1%) represent the smallest median family size with 2.90 persons per family.
| Family Type | # Families | Family Size |
| Married-Couple | 220 (66.7%) | 3.50 |
| Single Male/Father | 40 (12.1%) | 2.90 |
| Single Female/Mother | 70 (21.2%) | 3.59 |
| Total Families | 330 (100.0%) | 3.45 |
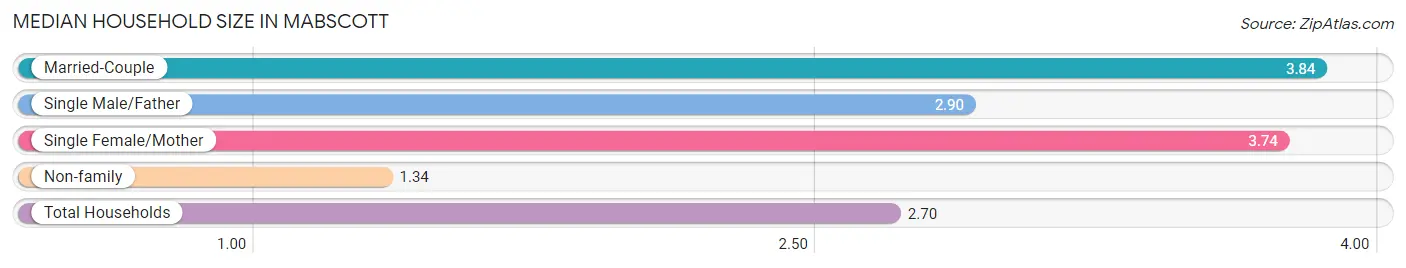
Median Household Size in Mabscott
The median household size in Mabscott is 2.70 persons per household, with married-couple households (220 | 38.3%) accounting for the largest median household size of 3.84 persons per household. non-family households (244 | 42.5%) represent the smallest median household size with 1.34 persons per household.
| Household Type | # Households | Household Size |
| Married-Couple | 220 (38.3%) | 3.84 |
| Single Male/Father | 40 (7.0%) | 2.90 |
| Single Female/Mother | 70 (12.2%) | 3.74 |
| Non-family | 244 (42.5%) | 1.34 |
| Total Households | 574 (100.0%) | 2.70 |
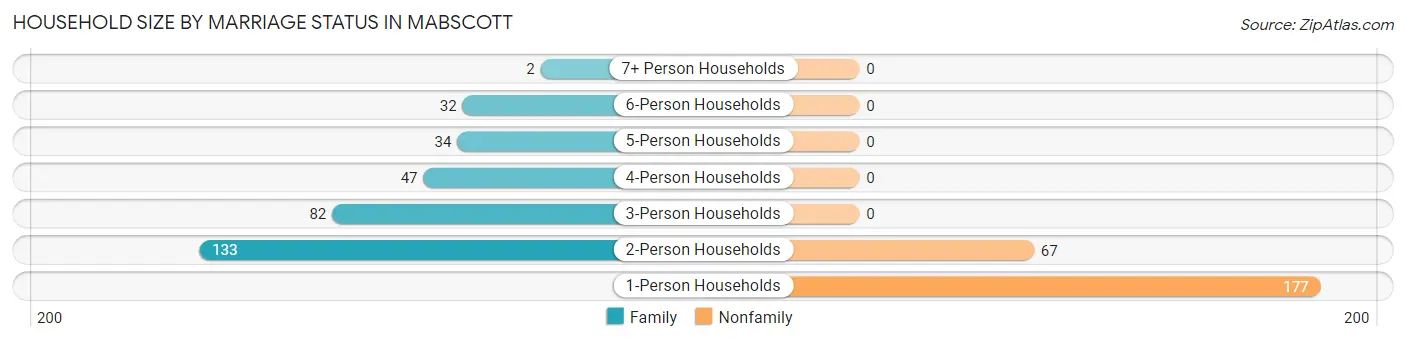
Household Size by Marriage Status in Mabscott
Out of a total of 574 households in Mabscott, 330 (57.5%) are family households, while 244 (42.5%) are nonfamily households. The most numerous type of family households are 2-person households, comprising 133, and the most common type of nonfamily households are 1-person households, comprising 177.
| Household Size | Family Households | Nonfamily Households |
| 1-Person Households | - | 177 (30.8%) |
| 2-Person Households | 133 (23.2%) | 67 (11.7%) |
| 3-Person Households | 82 (14.3%) | 0 (0.0%) |
| 4-Person Households | 47 (8.2%) | 0 (0.0%) |
| 5-Person Households | 34 (5.9%) | 0 (0.0%) |
| 6-Person Households | 32 (5.6%) | 0 (0.0%) |
| 7+ Person Households | 2 (0.4%) | 0 (0.0%) |
| Total | 330 (57.5%) | 244 (42.5%) |
Female Fertility in Mabscott
Fertility by Age in Mabscott
Average fertility rate in Mabscott is 91.0 births per 1,000 women. Women in the age bracket of 20 to 34 years have the highest fertility rate with 167.0 births per 1,000 women. Women in the age bracket of 20 to 34 years acount for 100.0% of all women with births.
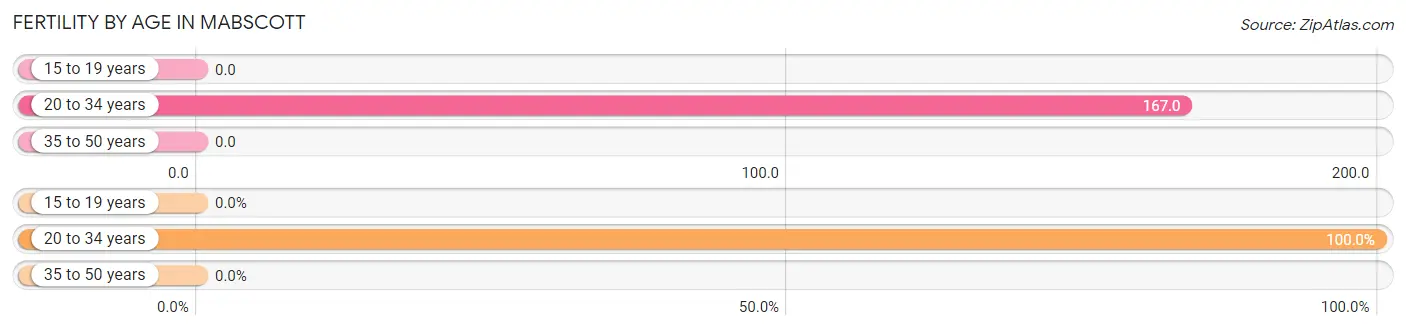
| Age Bracket | Women with Births | Births / 1,000 Women |
| 15 to 19 years | 0 (0.0%) | 0.0 |
| 20 to 34 years | 32 (100.0%) | 167.0 |
| 35 to 50 years | 0 (0.0%) | 0.0 |
| Total | 32 (100.0%) | 91.0 |
Fertility by Age by Marriage Status in Mabscott
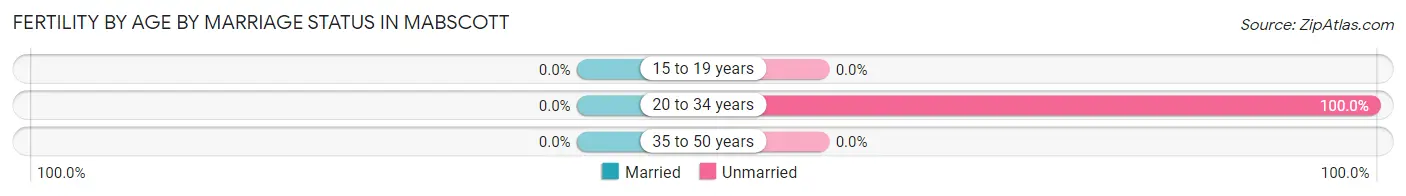
| Age Bracket | Married | Unmarried |
| 15 to 19 years | 0 (0.0%) | 0 (0.0%) |
| 20 to 34 years | 0 (0.0%) | 32 (100.0%) |
| 35 to 50 years | 0 (0.0%) | 0 (0.0%) |
| Total | 0 (0.0%) | 32 (100.0%) |
Fertility by Education in Mabscott
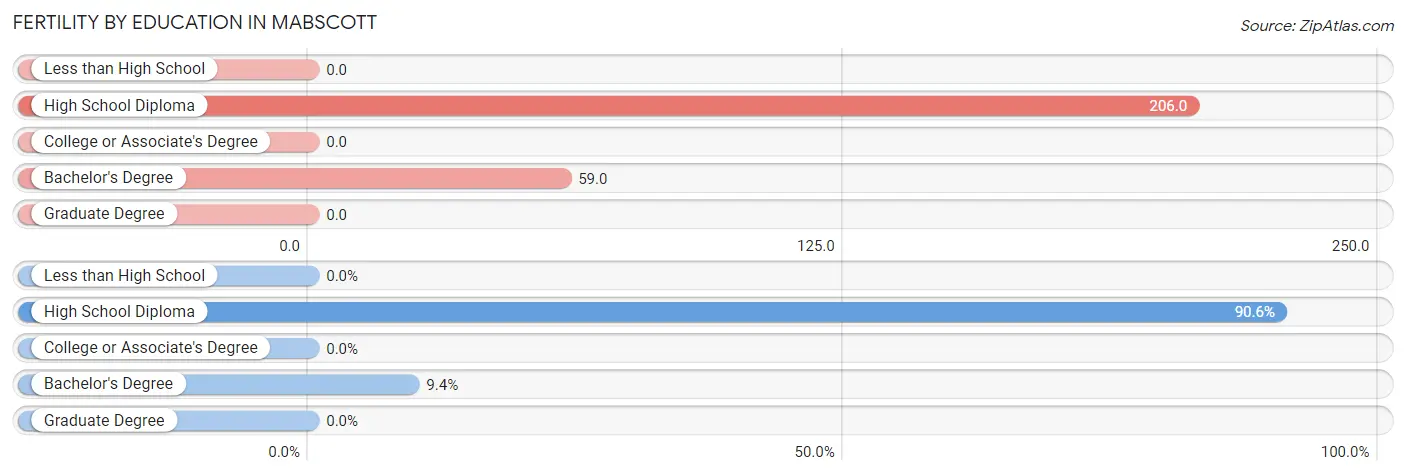
| Educational Attainment | Women with Births | Births / 1,000 Women |
| Less than High School | 0 (0.0%) | 0.0 |
| High School Diploma | 29 (90.6%) | 206.0 |
| College or Associate's Degree | 0 (0.0%) | 0.0 |
| Bachelor's Degree | 3 (9.4%) | 59.0 |
| Graduate Degree | 0 (0.0%) | 0.0 |
| Total | 32 (100.0%) | 91.0 |
Fertility by Education by Marriage Status in Mabscott
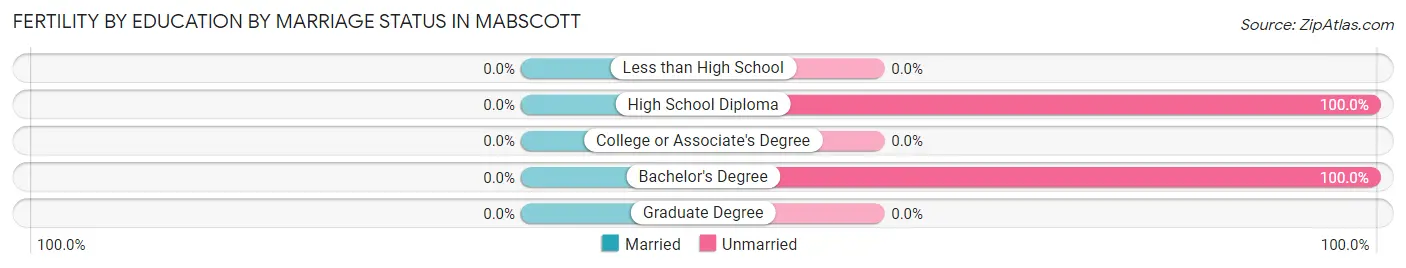
| Educational Attainment | Married | Unmarried |
| Less than High School | 0 (0.0%) | 0 (0.0%) |
| High School Diploma | 0 (0.0%) | 29 (100.0%) |
| College or Associate's Degree | 0 (0.0%) | 0 (0.0%) |
| Bachelor's Degree | 0 (0.0%) | 3 (100.0%) |
| Graduate Degree | 0 (0.0%) | 0 (0.0%) |
| Total | 0 (0.0%) | 32 (100.0%) |
Income in Mabscott
Income Overview in Mabscott
Per Capita Income in Mabscott is $24,114, while median incomes of families and households are $65,000 and $52,083 respectively.
| Characteristic | Number | Measure |
| Per Capita Income | 1,550 | $24,114 |
| Median Family Income | 330 | $65,000 |
| Mean Family Income | 330 | $79,186 |
| Median Household Income | 574 | $52,083 |
| Mean Household Income | 574 | $62,519 |
| Income Deficit | 330 | $0 |
| Wage / Income Gap (%) | 1,550 | 48.70% |
| Wage / Income Gap ($) | 1,550 | 51.30¢ per $1 |
| Gini / Inequality Index | 1,550 | 0.46 |
Earnings by Sex in Mabscott
Average Earnings in Mabscott are $33,371, $51,667 for men and $26,506 for women, a difference of 48.7%.
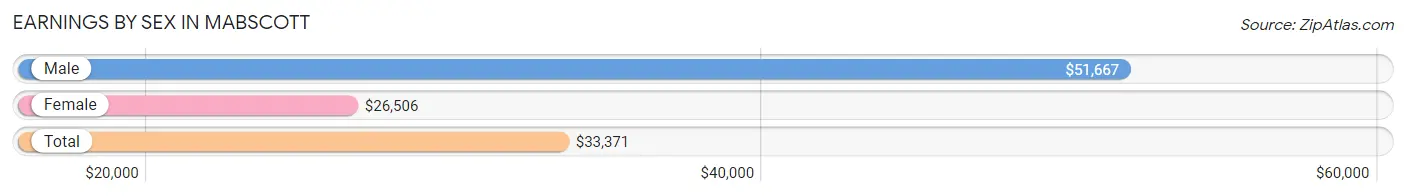
| Sex | Number | Average Earnings |
| Male | 276 (44.3%) | $51,667 |
| Female | 347 (55.7%) | $26,506 |
| Total | 623 (100.0%) | $33,371 |
Earnings by Sex by Income Bracket in Mabscott
The most common earnings brackets in Mabscott are $55,000 to $64,999 for men (46 | 16.7%) and $30,000 to $34,999 for women (68 | 19.6%).
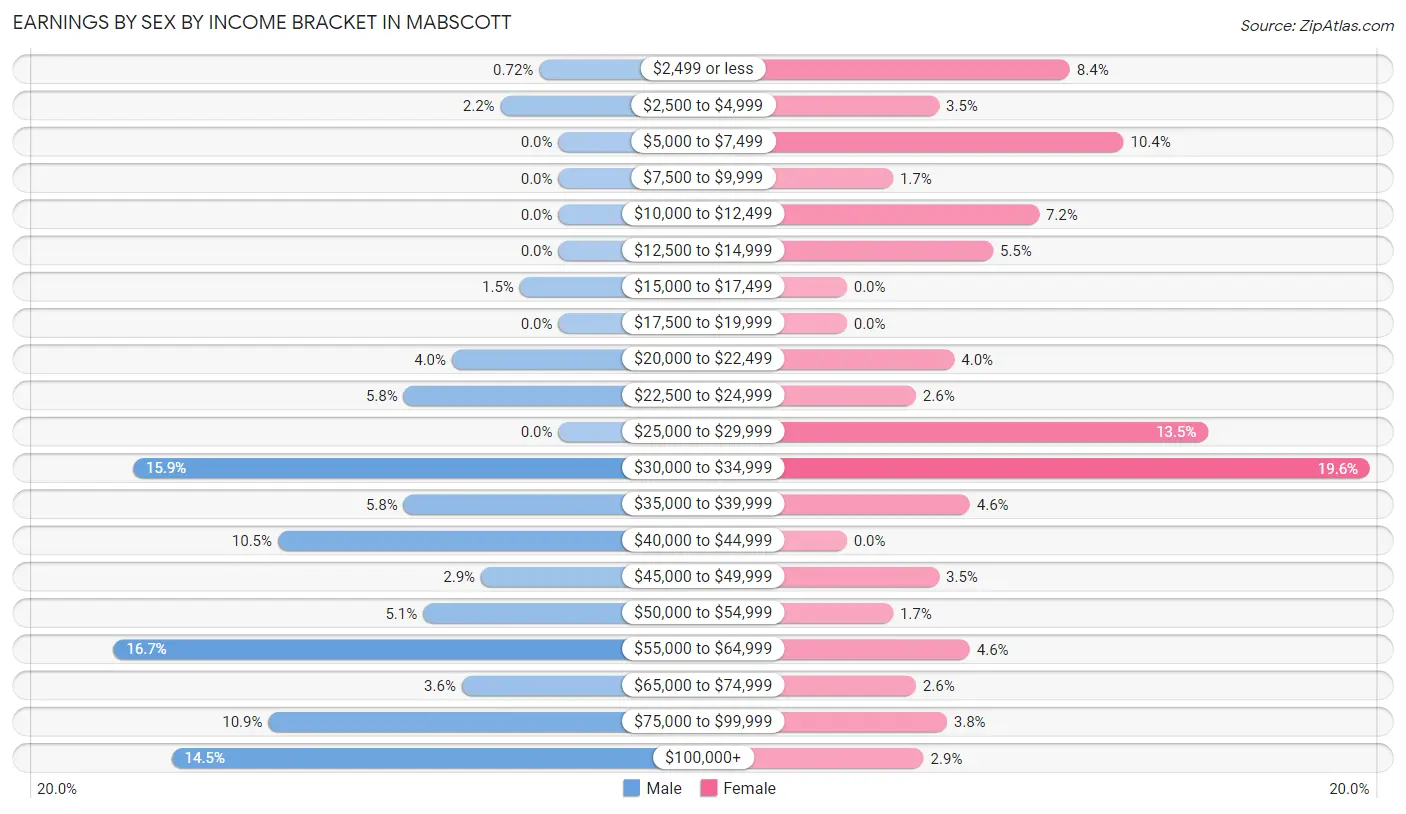
| Income | Male | Female |
| $2,499 or less | 2 (0.7%) | 29 (8.4%) |
| $2,500 to $4,999 | 6 (2.2%) | 12 (3.5%) |
| $5,000 to $7,499 | 0 (0.0%) | 36 (10.4%) |
| $7,500 to $9,999 | 0 (0.0%) | 6 (1.7%) |
| $10,000 to $12,499 | 0 (0.0%) | 25 (7.2%) |
| $12,500 to $14,999 | 0 (0.0%) | 19 (5.5%) |
| $15,000 to $17,499 | 4 (1.5%) | 0 (0.0%) |
| $17,500 to $19,999 | 0 (0.0%) | 0 (0.0%) |
| $20,000 to $22,499 | 11 (4.0%) | 14 (4.0%) |
| $22,500 to $24,999 | 16 (5.8%) | 9 (2.6%) |
| $25,000 to $29,999 | 0 (0.0%) | 47 (13.5%) |
| $30,000 to $34,999 | 44 (15.9%) | 68 (19.6%) |
| $35,000 to $39,999 | 16 (5.8%) | 16 (4.6%) |
| $40,000 to $44,999 | 29 (10.5%) | 0 (0.0%) |
| $45,000 to $49,999 | 8 (2.9%) | 12 (3.5%) |
| $50,000 to $54,999 | 14 (5.1%) | 6 (1.7%) |
| $55,000 to $64,999 | 46 (16.7%) | 16 (4.6%) |
| $65,000 to $74,999 | 10 (3.6%) | 9 (2.6%) |
| $75,000 to $99,999 | 30 (10.9%) | 13 (3.7%) |
| $100,000+ | 40 (14.5%) | 10 (2.9%) |
| Total | 276 (100.0%) | 347 (100.0%) |
Earnings by Sex by Educational Attainment in Mabscott
Average earnings in Mabscott are $53,977 for men and $30,662 for women, a difference of 43.2%. Men with an educational attainment of graduate degree enjoy the highest average annual earnings of $105,000, while those with bachelor's degree education earn the least with $39,375. Women with an educational attainment of graduate degree earn the most with the average annual earnings of $35,357, while those with high school diploma education have the smallest earnings of $27,448.
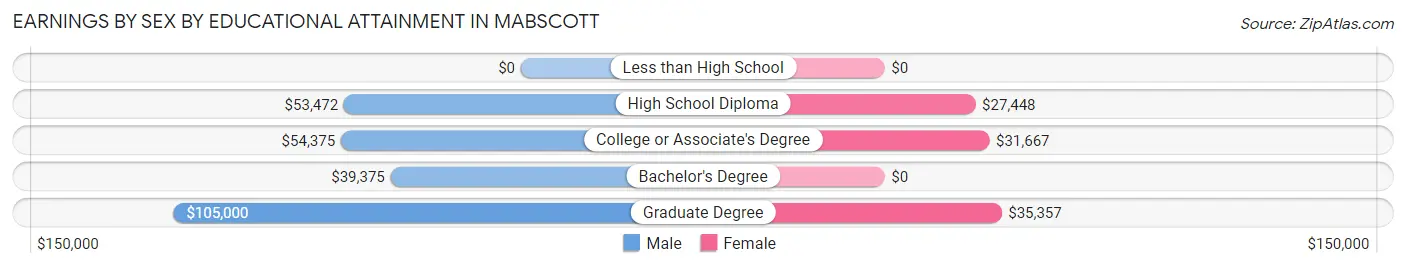
| Educational Attainment | Male Income | Female Income |
| Less than High School | - | - |
| High School Diploma | $53,472 | $27,448 |
| College or Associate's Degree | $54,375 | $31,667 |
| Bachelor's Degree | $39,375 | $0 |
| Graduate Degree | $105,000 | $35,357 |
| Total | $53,977 | $30,662 |
Family Income in Mabscott
Family Income Brackets in Mabscott
According to the Mabscott family income data, there are 84 families falling into the $50,000 to $74,999 income range, which is the most common income bracket and makes up 25.5% of all families.
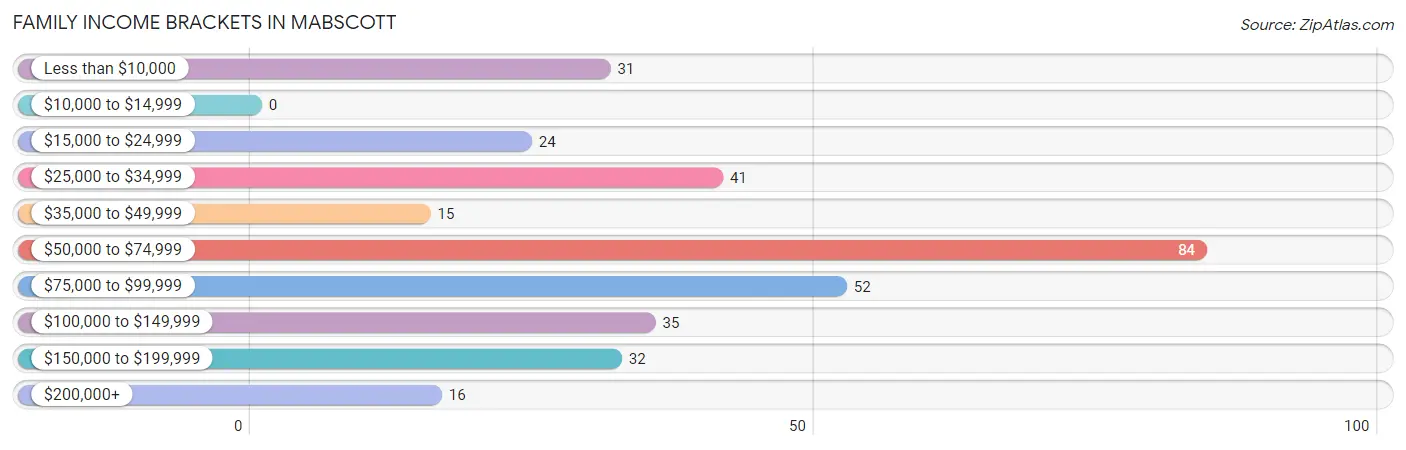
| Income Bracket | # Families | % Families |
| Less than $10,000 | 31 | 9.4% |
| $10,000 to $14,999 | 0 | 0.0% |
| $15,000 to $24,999 | 24 | 7.3% |
| $25,000 to $34,999 | 41 | 12.4% |
| $35,000 to $49,999 | 15 | 4.5% |
| $50,000 to $74,999 | 84 | 25.5% |
| $75,000 to $99,999 | 52 | 15.8% |
| $100,000 to $149,999 | 35 | 10.6% |
| $150,000 to $199,999 | 32 | 9.7% |
| $200,000+ | 16 | 4.8% |
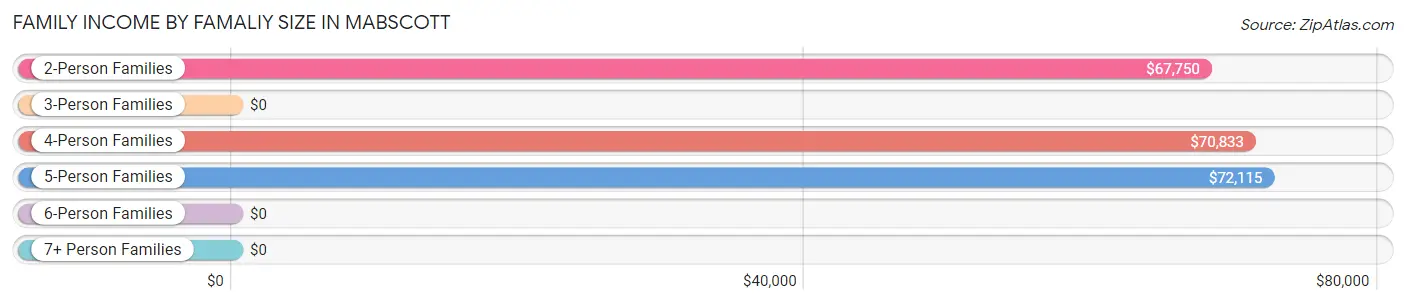
Family Income by Famaliy Size in Mabscott
5-person families (34 | 10.3%) account for the highest median family income in Mabscott with $72,115 per family, while 2-person families (155 | 47.0%) have the highest median income of $33,875 per family member.
| Income Bracket | # Families | Median Income |
| 2-Person Families | 155 (47.0%) | $67,750 |
| 3-Person Families | 71 (21.5%) | $0 |
| 4-Person Families | 36 (10.9%) | $70,833 |
| 5-Person Families | 34 (10.3%) | $72,115 |
| 6-Person Families | 32 (9.7%) | $0 |
| 7+ Person Families | 2 (0.6%) | $0 |
| Total | 330 (100.0%) | $65,000 |
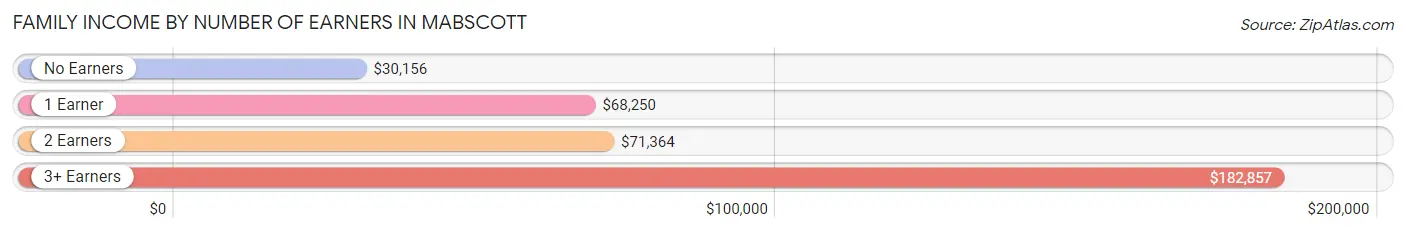
Family Income by Number of Earners in Mabscott
The median family income in Mabscott is $65,000, with families comprising 3+ earners (24) having the highest median family income of $182,857, while families with no earners (81) have the lowest median family income of $30,156, accounting for 7.3% and 24.5% of families, respectively.
| Number of Earners | # Families | Median Income |
| No Earners | 81 (24.5%) | $30,156 |
| 1 Earner | 111 (33.6%) | $68,250 |
| 2 Earners | 114 (34.5%) | $71,364 |
| 3+ Earners | 24 (7.3%) | $182,857 |
| Total | 330 (100.0%) | $65,000 |
Household Income in Mabscott
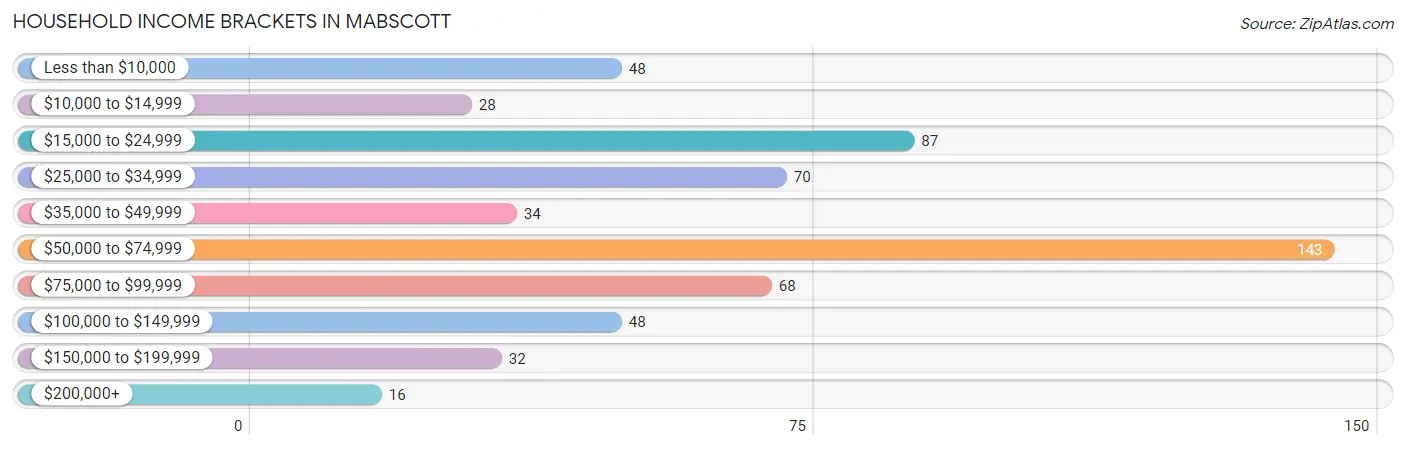
Household Income Brackets in Mabscott
With 143 households falling in the category, the $50,000 to $74,999 income range is the most frequent in Mabscott, accounting for 24.9% of all households. In contrast, only 16 households (2.8%) fall into the $200,000+ income bracket, making it the least populous group.
| Income Bracket | # Households | % Households |
| Less than $10,000 | 48 | 8.4% |
| $10,000 to $14,999 | 28 | 4.9% |
| $15,000 to $24,999 | 87 | 15.2% |
| $25,000 to $34,999 | 70 | 12.2% |
| $35,000 to $49,999 | 34 | 5.9% |
| $50,000 to $74,999 | 143 | 24.9% |
| $75,000 to $99,999 | 68 | 11.8% |
| $100,000 to $149,999 | 48 | 8.4% |
| $150,000 to $199,999 | 32 | 5.6% |
| $200,000+ | 16 | 2.8% |
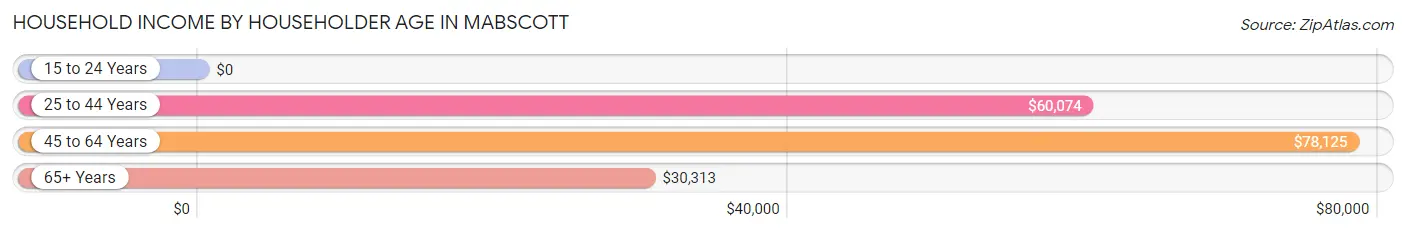
Household Income by Householder Age in Mabscott
The median household income in Mabscott is $52,083, with the highest median household income of $78,125 found in the 45 to 64 years age bracket for the primary householder. A total of 139 households (24.2%) fall into this category. Meanwhile, the 15 to 24 years age bracket for the primary householder has the lowest median household income of $0, with 12 households (2.1%) in this group.
| Income Bracket | # Households | Median Income |
| 15 to 24 Years | 12 (2.1%) | $0 |
| 25 to 44 Years | 231 (40.2%) | $60,074 |
| 45 to 64 Years | 139 (24.2%) | $78,125 |
| 65+ Years | 192 (33.5%) | $30,313 |
| Total | 574 (100.0%) | $52,083 |
Poverty in Mabscott
Income Below Poverty by Sex and Age in Mabscott
With 14.7% poverty level for males and 17.4% for females among the residents of Mabscott, under 5 year old males and 5 year old females are the most vulnerable to poverty, with 34 males (85.0%) and 17 females (100.0%) in their respective age groups living below the poverty level.
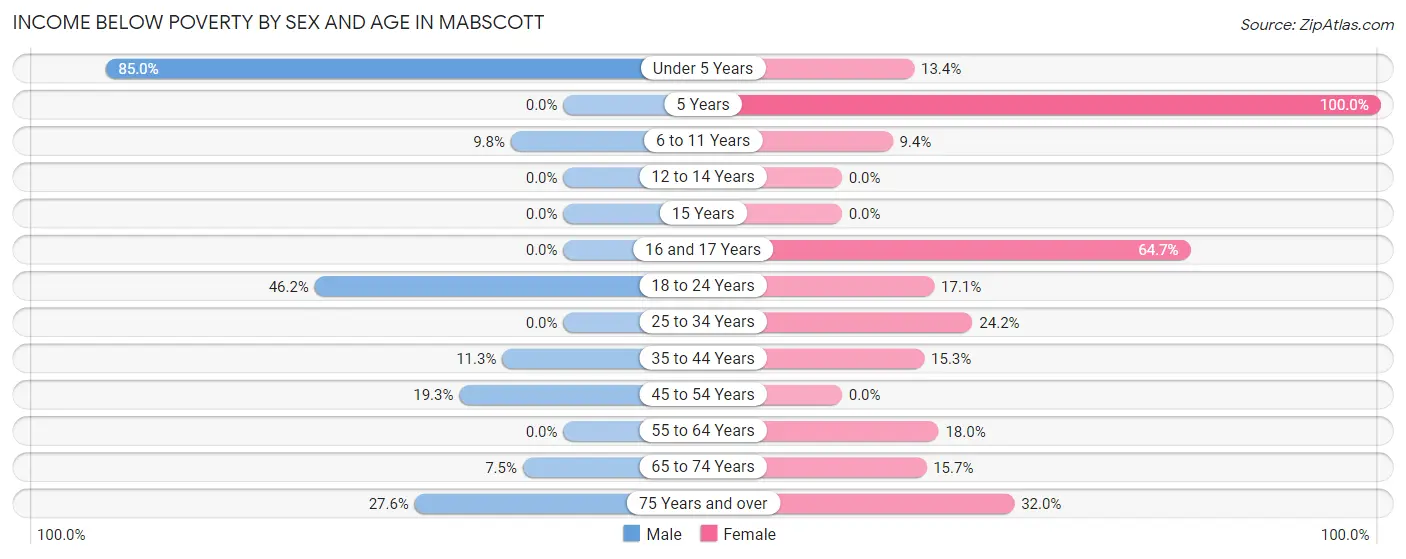
| Age Bracket | Male | Female |
| Under 5 Years | 34 (85.0%) | 11 (13.4%) |
| 5 Years | 0 (0.0%) | 17 (100.0%) |
| 6 to 11 Years | 8 (9.8%) | 8 (9.4%) |
| 12 to 14 Years | 0 (0.0%) | 0 (0.0%) |
| 15 Years | 0 (0.0%) | 0 (0.0%) |
| 16 and 17 Years | 0 (0.0%) | 11 (64.7%) |
| 18 to 24 Years | 6 (46.2%) | 12 (17.1%) |
| 25 to 34 Years | 0 (0.0%) | 32 (24.2%) |
| 35 to 44 Years | 11 (11.3%) | 11 (15.3%) |
| 45 to 54 Years | 17 (19.3%) | 0 (0.0%) |
| 55 to 64 Years | 0 (0.0%) | 14 (17.9%) |
| 65 to 74 Years | 10 (7.5%) | 21 (15.7%) |
| 75 Years and over | 8 (27.6%) | 8 (32.0%) |
| Total | 94 (14.7%) | 145 (17.4%) |
Income Above Poverty by Sex and Age in Mabscott
According to the poverty statistics in Mabscott, males aged 5 years and females aged 12 to 14 years are the age groups that are most secure financially, with 100.0% of males and 100.0% of females in these age groups living above the poverty line.
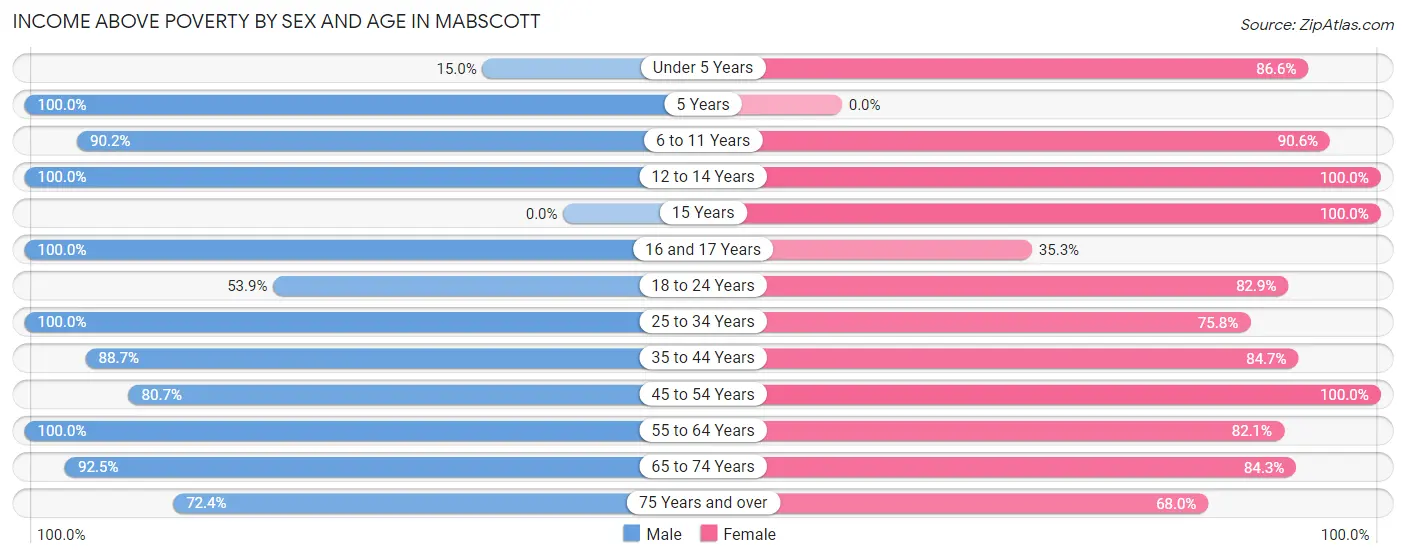
| Age Bracket | Male | Female |
| Under 5 Years | 6 (15.0%) | 71 (86.6%) |
| 5 Years | 14 (100.0%) | 0 (0.0%) |
| 6 to 11 Years | 74 (90.2%) | 77 (90.6%) |
| 12 to 14 Years | 12 (100.0%) | 37 (100.0%) |
| 15 Years | 0 (0.0%) | 7 (100.0%) |
| 16 and 17 Years | 2 (100.0%) | 6 (35.3%) |
| 18 to 24 Years | 7 (53.8%) | 58 (82.9%) |
| 25 to 34 Years | 101 (100.0%) | 100 (75.8%) |
| 35 to 44 Years | 86 (88.7%) | 61 (84.7%) |
| 45 to 54 Years | 71 (80.7%) | 75 (100.0%) |
| 55 to 64 Years | 29 (100.0%) | 64 (82.1%) |
| 65 to 74 Years | 123 (92.5%) | 113 (84.3%) |
| 75 Years and over | 21 (72.4%) | 17 (68.0%) |
| Total | 546 (85.3%) | 686 (82.6%) |
Income Below Poverty Among Married-Couple Families in Mabscott
The poverty statistics for married-couple families in Mabscott show that 7.7% or 17 of the total 220 families live below the poverty line. Families with 3 or 4 children have the highest poverty rate of 22.5%, comprising of 9 families. On the other hand, families with 1 or 2 children have the lowest poverty rate of 0.0%, which includes 0 families.
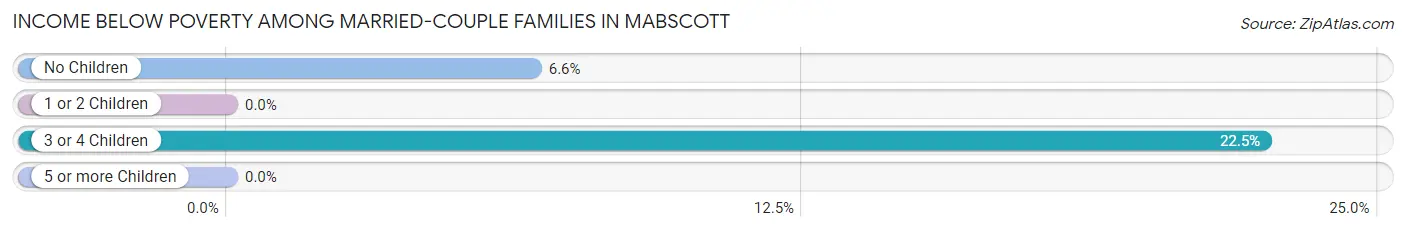
| Children | Above Poverty | Below Poverty |
| No Children | 113 (93.4%) | 8 (6.6%) |
| 1 or 2 Children | 57 (100.0%) | 0 (0.0%) |
| 3 or 4 Children | 31 (77.5%) | 9 (22.5%) |
| 5 or more Children | 2 (100.0%) | 0 (0.0%) |
| Total | 203 (92.3%) | 17 (7.7%) |
Income Below Poverty Among Single-Parent Households in Mabscott
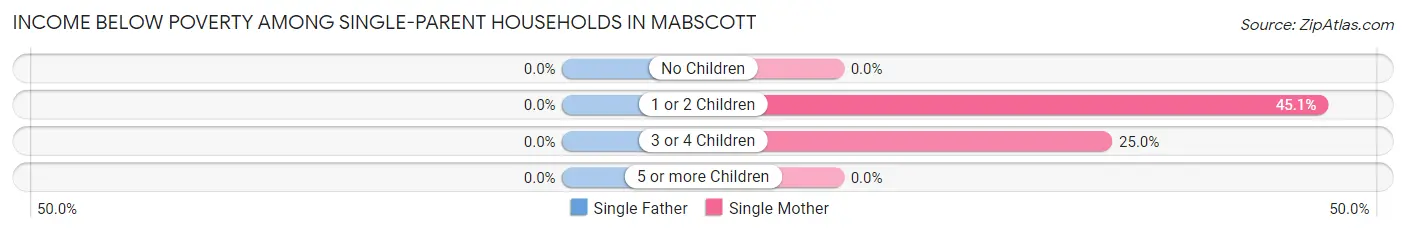
| Children | Single Father | Single Mother |
| No Children | 0 (0.0%) | 0 (0.0%) |
| 1 or 2 Children | 0 (0.0%) | 23 (45.1%) |
| 3 or 4 Children | 0 (0.0%) | 3 (25.0%) |
| 5 or more Children | 0 (0.0%) | 0 (0.0%) |
| Total | 0 (0.0%) | 26 (37.1%) |
Income Below Poverty Among Married-Couple vs Single-Parent Households in Mabscott
The poverty data for Mabscott shows that 17 of the married-couple family households (7.7%) and 26 of the single-parent households (23.6%) are living below the poverty level. Within the married-couple family households, those with 3 or 4 children have the highest poverty rate, with 9 households (22.5%) falling below the poverty line. Among the single-parent households, those with 1 or 2 children have the highest poverty rate, with 23 household (45.1%) living below poverty.
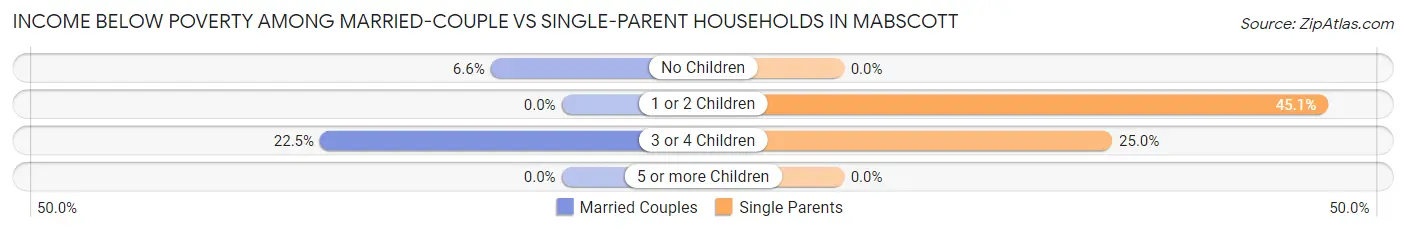
| Children | Married-Couple Families | Single-Parent Households |
| No Children | 8 (6.6%) | 0 (0.0%) |
| 1 or 2 Children | 0 (0.0%) | 23 (45.1%) |
| 3 or 4 Children | 9 (22.5%) | 3 (25.0%) |
| 5 or more Children | 0 (0.0%) | 0 (0.0%) |
| Total | 17 (7.7%) | 26 (23.6%) |
Employment Characteristics in Mabscott
Employment by Class of Employer in Mabscott
Among the 560 employed individuals in Mabscott, private company employees (401 | 71.6%), local government employees (66 | 11.8%), and state government employees (24 | 4.3%) make up the most common classes of employment.
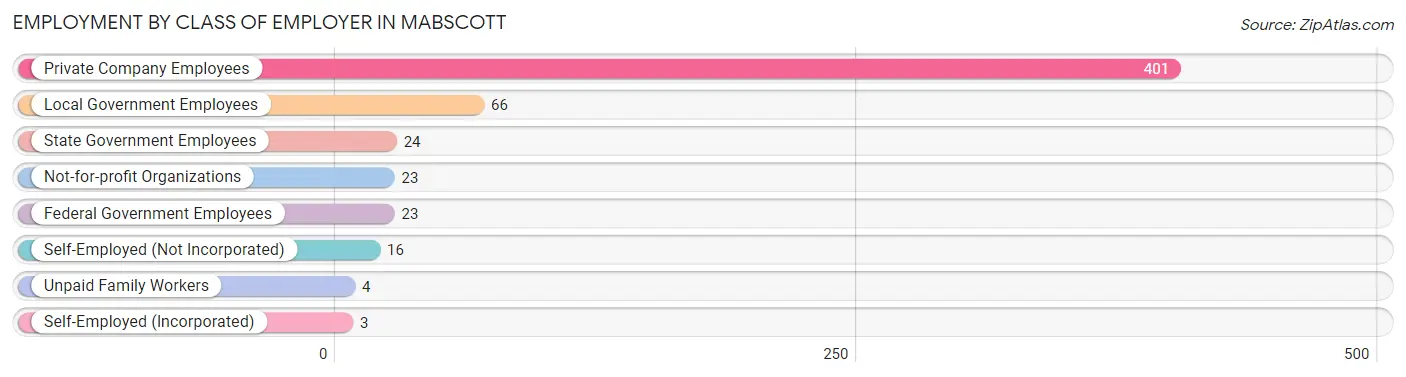
| Employer Class | # Employees | % Employees |
| Private Company Employees | 401 | 71.6% |
| Self-Employed (Incorporated) | 3 | 0.5% |
| Self-Employed (Not Incorporated) | 16 | 2.9% |
| Not-for-profit Organizations | 23 | 4.1% |
| Local Government Employees | 66 | 11.8% |
| State Government Employees | 24 | 4.3% |
| Federal Government Employees | 23 | 4.1% |
| Unpaid Family Workers | 4 | 0.7% |
| Total | 560 | 100.0% |
Employment Status by Age in Mabscott
According to the labor force statistics for Mabscott, out of the total population over 16 years of age (1,096), 53.8% or 590 individuals are in the labor force, with 2.2% or 13 of them unemployed. The age group with the highest labor force participation rate is 20 to 24 years, with 100.0% or 60 individuals in the labor force. Within the labor force, the 45 to 54 years age range has the highest percentage of unemployed individuals, with 8.5% or 8 of them being unemployed.
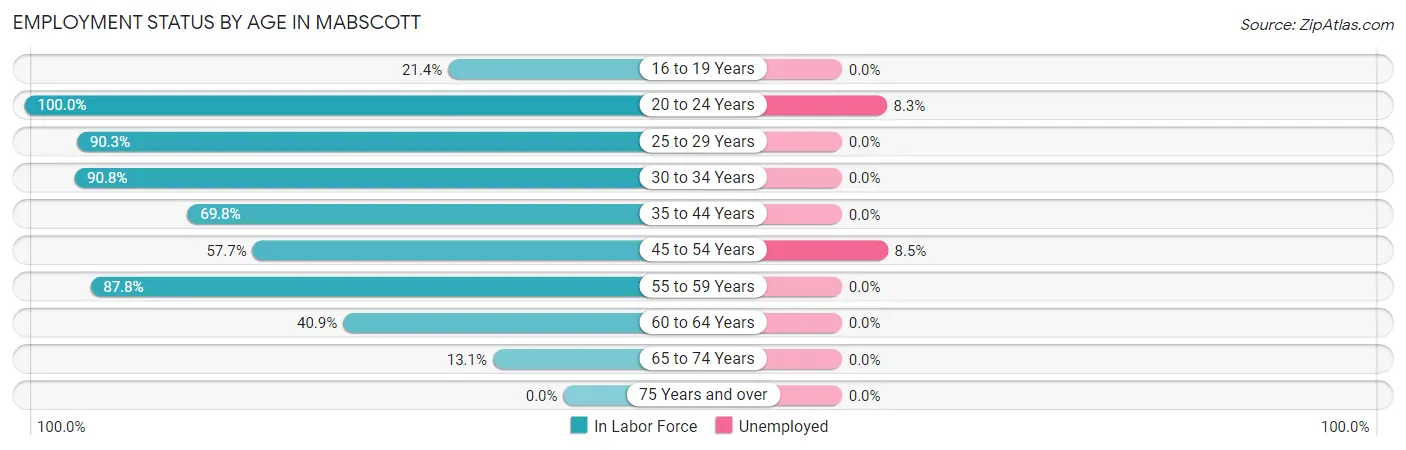
| Age Bracket | In Labor Force | Unemployed |
| 16 to 19 Years | 9 (21.4%) | 0 (0.0%) |
| 20 to 24 Years | 60 (100.0%) | 5 (8.3%) |
| 25 to 29 Years | 102 (90.3%) | 0 (0.0%) |
| 30 to 34 Years | 109 (90.8%) | 0 (0.0%) |
| 35 to 44 Years | 118 (69.8%) | 0 (0.0%) |
| 45 to 54 Years | 94 (57.7%) | 8 (8.5%) |
| 55 to 59 Years | 36 (87.8%) | 0 (0.0%) |
| 60 to 64 Years | 27 (40.9%) | 0 (0.0%) |
| 65 to 74 Years | 35 (13.1%) | 0 (0.0%) |
| 75 Years and over | 0 (0.0%) | 0 (0.0%) |
| Total | 590 (53.8%) | 13 (2.2%) |
Employment Status by Educational Attainment in Mabscott
According to labor force statistics for Mabscott, 72.3% of individuals (486) out of the total population between 25 and 64 years of age (672) are in the labor force, with 1.6% or 8 of them being unemployed. The group with the highest labor force participation rate are those with the educational attainment of bachelor's degree or higher, with 94.6% or 176 individuals in the labor force. Within the labor force, individuals with high school diploma education have the highest percentage of unemployment, with 4.7% or 6 of them being unemployed.
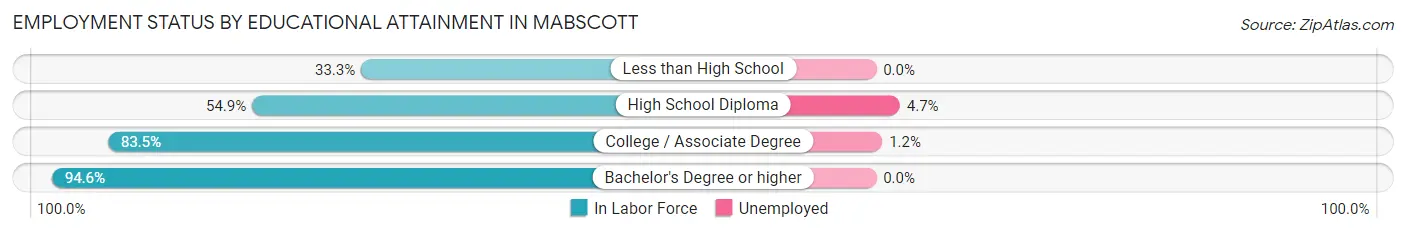
| Educational Attainment | In Labor Force | Unemployed |
| Less than High School | 19 (33.3%) | 0 (0.0%) |
| High School Diploma | 129 (54.9%) | 11 (4.7%) |
| College / Associate Degree | 162 (83.5%) | 2 (1.2%) |
| Bachelor's Degree or higher | 176 (94.6%) | 0 (0.0%) |
| Total | 486 (72.3%) | 11 (1.6%) |
Employment Occupations by Sex in Mabscott
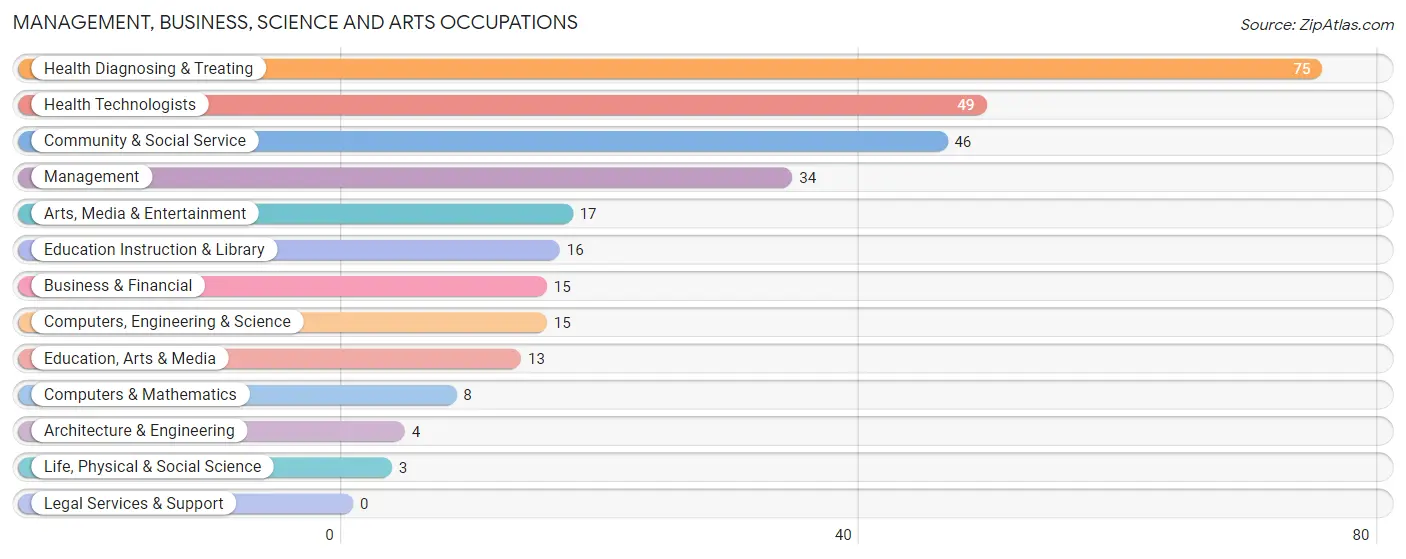
Management, Business, Science and Arts Occupations
The most common Management, Business, Science and Arts occupations in Mabscott are Health Diagnosing & Treating (75 | 13.0%), Health Technologists (49 | 8.5%), Community & Social Service (46 | 8.0%), Management (34 | 5.9%), and Arts, Media & Entertainment (17 | 2.9%).
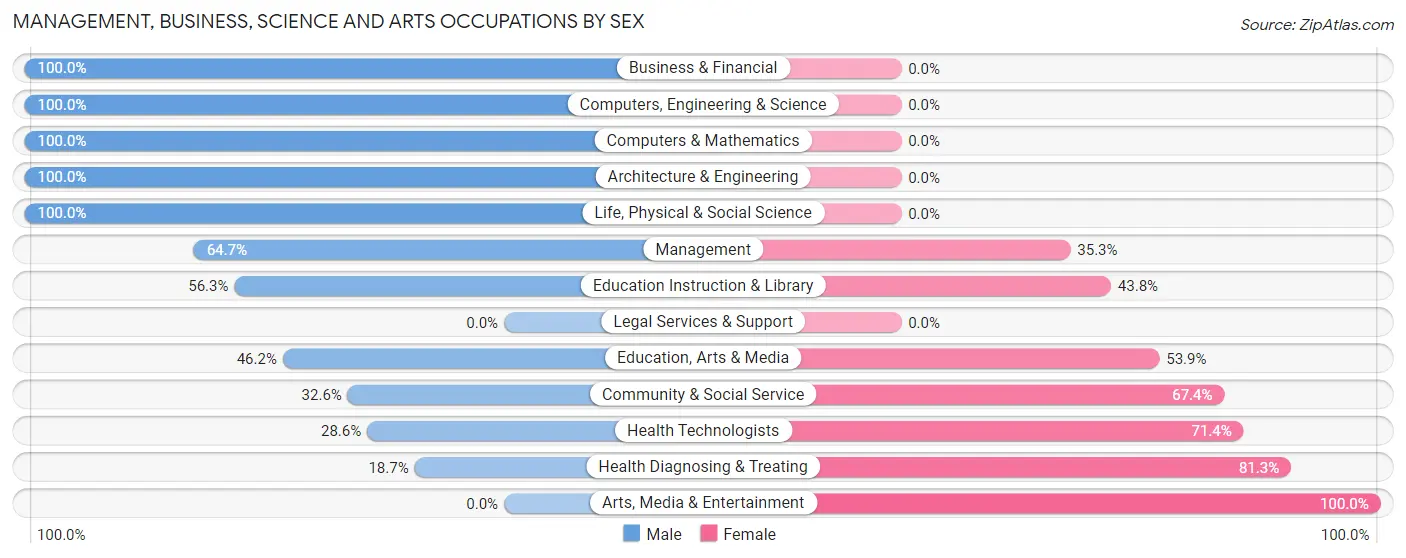
Management, Business, Science and Arts Occupations by Sex
Within the Management, Business, Science and Arts occupations in Mabscott, the most male-oriented occupations are Business & Financial (100.0%), Computers, Engineering & Science (100.0%), and Computers & Mathematics (100.0%), while the most female-oriented occupations are Arts, Media & Entertainment (100.0%), Health Diagnosing & Treating (81.3%), and Health Technologists (71.4%).
| Occupation | Male | Female |
| Management | 22 (64.7%) | 12 (35.3%) |
| Business & Financial | 15 (100.0%) | 0 (0.0%) |
| Computers, Engineering & Science | 15 (100.0%) | 0 (0.0%) |
| Computers & Mathematics | 8 (100.0%) | 0 (0.0%) |
| Architecture & Engineering | 4 (100.0%) | 0 (0.0%) |
| Life, Physical & Social Science | 3 (100.0%) | 0 (0.0%) |
| Community & Social Service | 15 (32.6%) | 31 (67.4%) |
| Education, Arts & Media | 6 (46.2%) | 7 (53.8%) |
| Legal Services & Support | 0 (0.0%) | 0 (0.0%) |
| Education Instruction & Library | 9 (56.2%) | 7 (43.8%) |
| Arts, Media & Entertainment | 0 (0.0%) | 17 (100.0%) |
| Health Diagnosing & Treating | 14 (18.7%) | 61 (81.3%) |
| Health Technologists | 14 (28.6%) | 35 (71.4%) |
| Total (Category) | 81 (43.8%) | 104 (56.2%) |
| Total (Overall) | 270 (46.8%) | 307 (53.2%) |
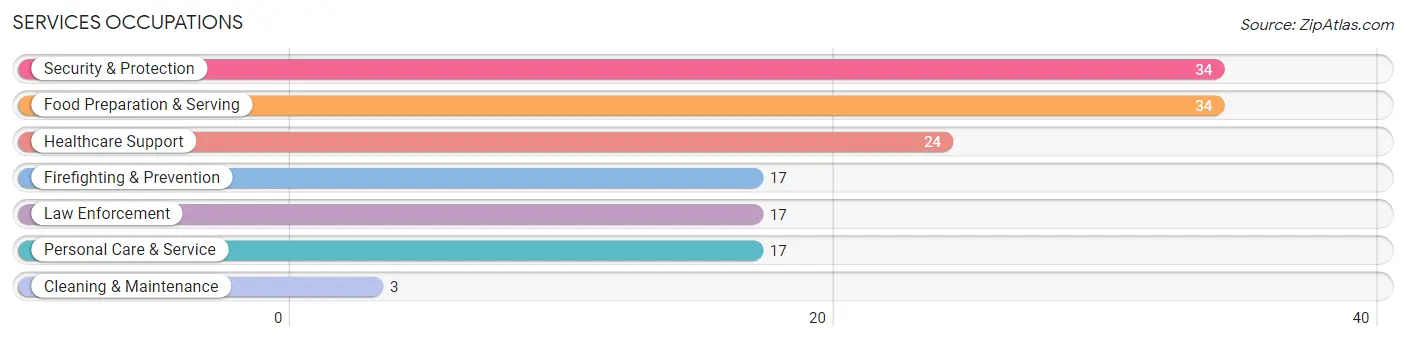
Services Occupations
The most common Services occupations in Mabscott are Security & Protection (34 | 5.9%), Food Preparation & Serving (34 | 5.9%), Healthcare Support (24 | 4.2%), Firefighting & Prevention (17 | 2.9%), and Law Enforcement (17 | 2.9%).
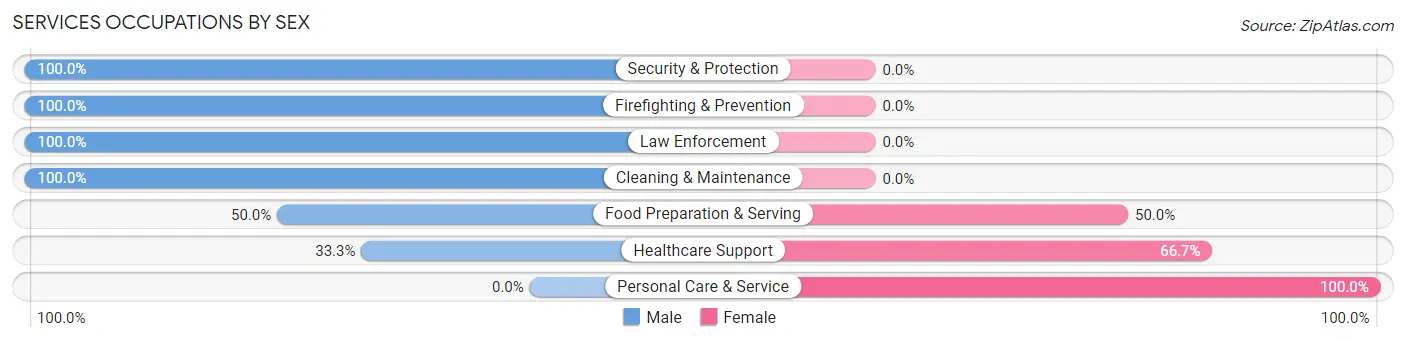
Services Occupations by Sex
Within the Services occupations in Mabscott, the most male-oriented occupations are Security & Protection (100.0%), Firefighting & Prevention (100.0%), and Law Enforcement (100.0%), while the most female-oriented occupations are Personal Care & Service (100.0%), Healthcare Support (66.7%), and Food Preparation & Serving (50.0%).
| Occupation | Male | Female |
| Healthcare Support | 8 (33.3%) | 16 (66.7%) |
| Security & Protection | 34 (100.0%) | 0 (0.0%) |
| Firefighting & Prevention | 17 (100.0%) | 0 (0.0%) |
| Law Enforcement | 17 (100.0%) | 0 (0.0%) |
| Food Preparation & Serving | 17 (50.0%) | 17 (50.0%) |
| Cleaning & Maintenance | 3 (100.0%) | 0 (0.0%) |
| Personal Care & Service | 0 (0.0%) | 17 (100.0%) |
| Total (Category) | 62 (55.4%) | 50 (44.6%) |
| Total (Overall) | 270 (46.8%) | 307 (53.2%) |
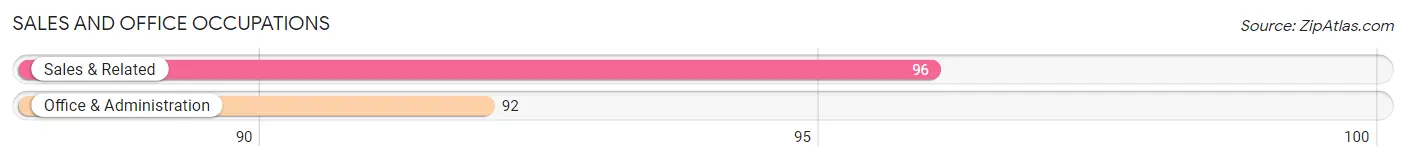
Sales and Office Occupations
The most common Sales and Office occupations in Mabscott are Sales & Related (96 | 16.6%), and Office & Administration (92 | 15.9%).
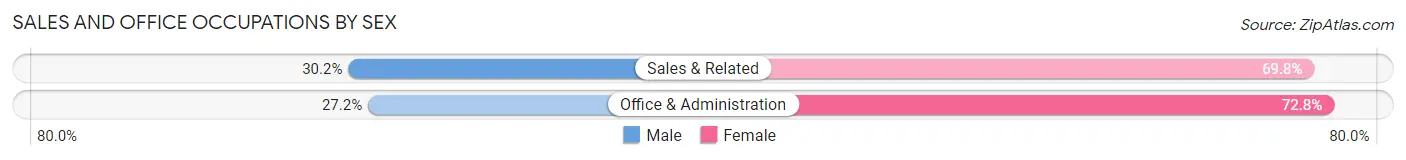
Sales and Office Occupations by Sex
| Occupation | Male | Female |
| Sales & Related | 29 (30.2%) | 67 (69.8%) |
| Office & Administration | 25 (27.2%) | 67 (72.8%) |
| Total (Category) | 54 (28.7%) | 134 (71.3%) |
| Total (Overall) | 270 (46.8%) | 307 (53.2%) |
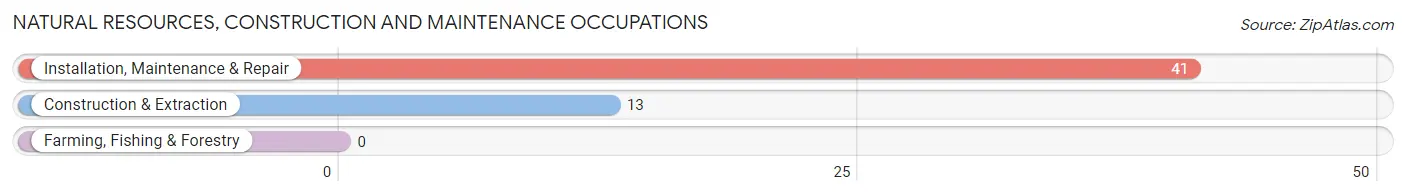
Natural Resources, Construction and Maintenance Occupations
The most common Natural Resources, Construction and Maintenance occupations in Mabscott are Installation, Maintenance & Repair (41 | 7.1%), and Construction & Extraction (13 | 2.2%).
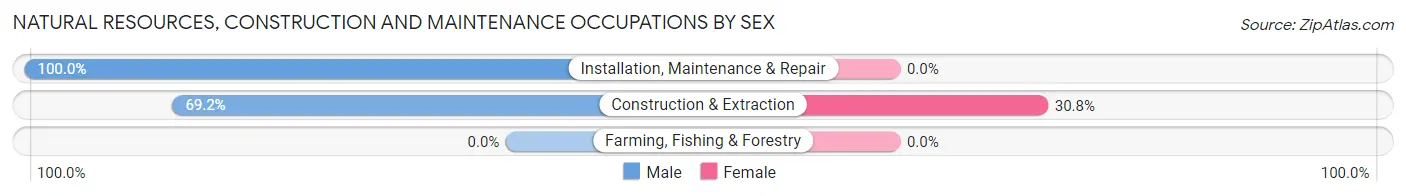
Natural Resources, Construction and Maintenance Occupations by Sex
| Occupation | Male | Female |
| Farming, Fishing & Forestry | 0 (0.0%) | 0 (0.0%) |
| Construction & Extraction | 9 (69.2%) | 4 (30.8%) |
| Installation, Maintenance & Repair | 41 (100.0%) | 0 (0.0%) |
| Total (Category) | 50 (92.6%) | 4 (7.4%) |
| Total (Overall) | 270 (46.8%) | 307 (53.2%) |
Production, Transportation and Moving Occupations
The most common Production, Transportation and Moving occupations in Mabscott are Material Moving (28 | 4.9%), and Transportation (10 | 1.7%).
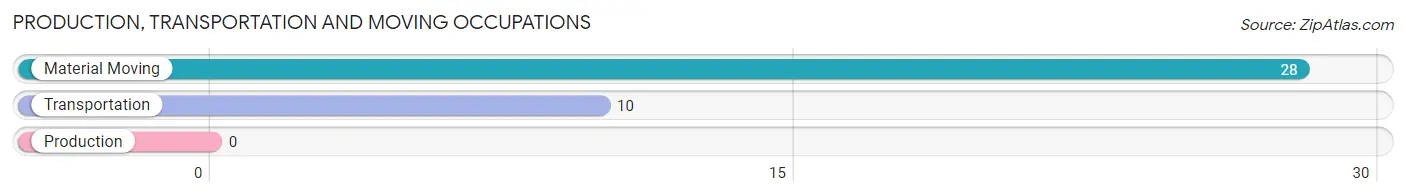
Production, Transportation and Moving Occupations by Sex
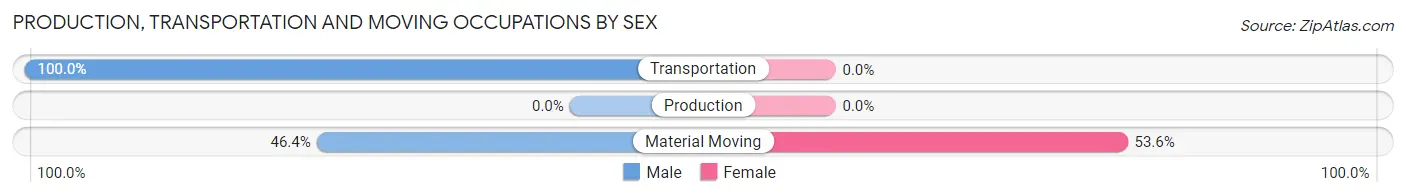
| Occupation | Male | Female |
| Production | 0 (0.0%) | 0 (0.0%) |
| Transportation | 10 (100.0%) | 0 (0.0%) |
| Material Moving | 13 (46.4%) | 15 (53.6%) |
| Total (Category) | 23 (60.5%) | 15 (39.5%) |
| Total (Overall) | 270 (46.8%) | 307 (53.2%) |
Employment Industries by Sex in Mabscott
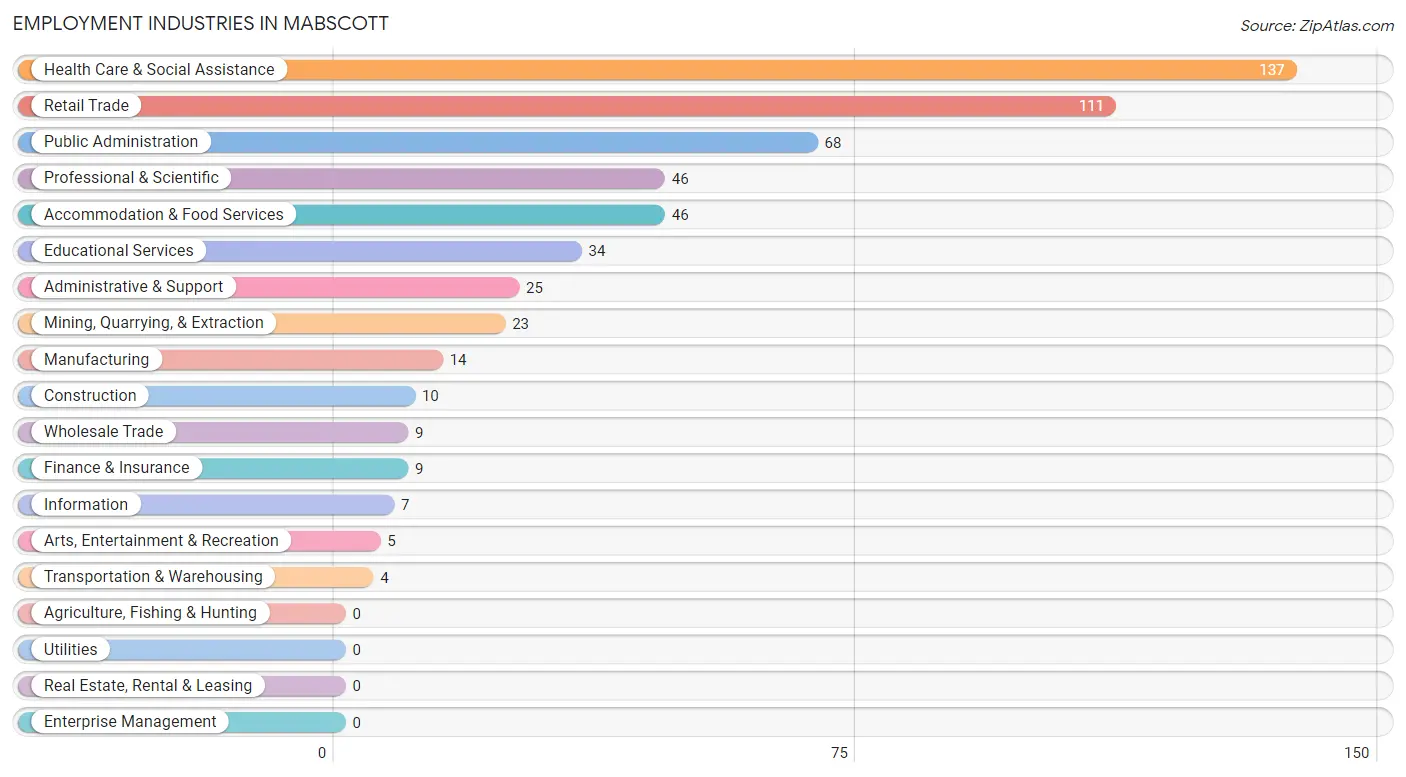
Employment Industries in Mabscott
The major employment industries in Mabscott include Health Care & Social Assistance (137 | 23.7%), Retail Trade (111 | 19.2%), Public Administration (68 | 11.8%), Professional & Scientific (46 | 8.0%), and Accommodation & Food Services (46 | 8.0%).
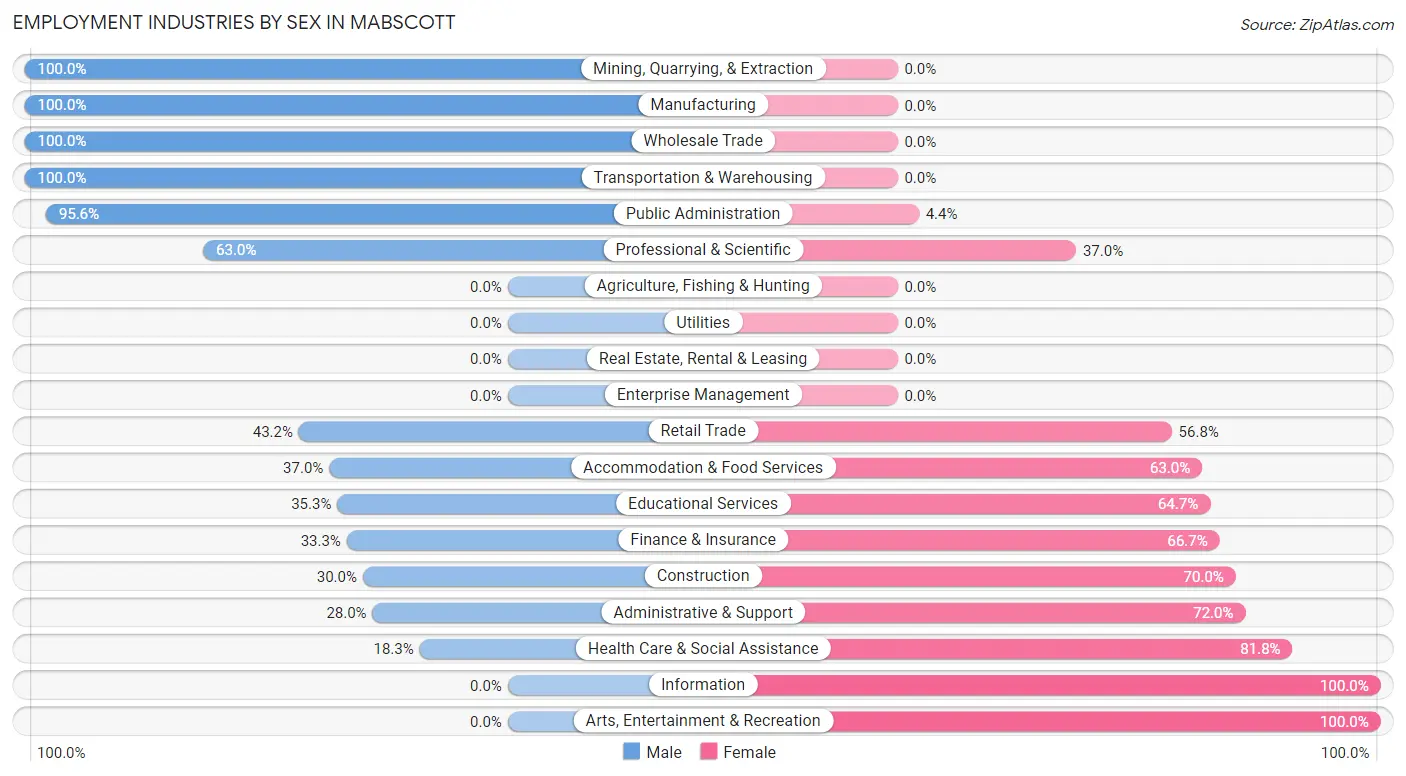
Employment Industries by Sex in Mabscott
The Mabscott industries that see more men than women are Mining, Quarrying, & Extraction (100.0%), Manufacturing (100.0%), and Wholesale Trade (100.0%), whereas the industries that tend to have a higher number of women are Information (100.0%), Arts, Entertainment & Recreation (100.0%), and Health Care & Social Assistance (81.8%).
| Industry | Male | Female |
| Agriculture, Fishing & Hunting | 0 (0.0%) | 0 (0.0%) |
| Mining, Quarrying, & Extraction | 23 (100.0%) | 0 (0.0%) |
| Construction | 3 (30.0%) | 7 (70.0%) |
| Manufacturing | 14 (100.0%) | 0 (0.0%) |
| Wholesale Trade | 9 (100.0%) | 0 (0.0%) |
| Retail Trade | 48 (43.2%) | 63 (56.8%) |
| Transportation & Warehousing | 4 (100.0%) | 0 (0.0%) |
| Utilities | 0 (0.0%) | 0 (0.0%) |
| Information | 0 (0.0%) | 7 (100.0%) |
| Finance & Insurance | 3 (33.3%) | 6 (66.7%) |
| Real Estate, Rental & Leasing | 0 (0.0%) | 0 (0.0%) |
| Professional & Scientific | 29 (63.0%) | 17 (37.0%) |
| Enterprise Management | 0 (0.0%) | 0 (0.0%) |
| Administrative & Support | 7 (28.0%) | 18 (72.0%) |
| Educational Services | 12 (35.3%) | 22 (64.7%) |
| Health Care & Social Assistance | 25 (18.2%) | 112 (81.8%) |
| Arts, Entertainment & Recreation | 0 (0.0%) | 5 (100.0%) |
| Accommodation & Food Services | 17 (37.0%) | 29 (63.0%) |
| Public Administration | 65 (95.6%) | 3 (4.4%) |
| Total | 270 (46.8%) | 307 (53.2%) |
Education in Mabscott
School Enrollment in Mabscott
The most common levels of schooling among the 233 students in Mabscott are middle school (83 | 35.6%), elementary school (67 | 28.8%), and high school (27 | 11.6%).
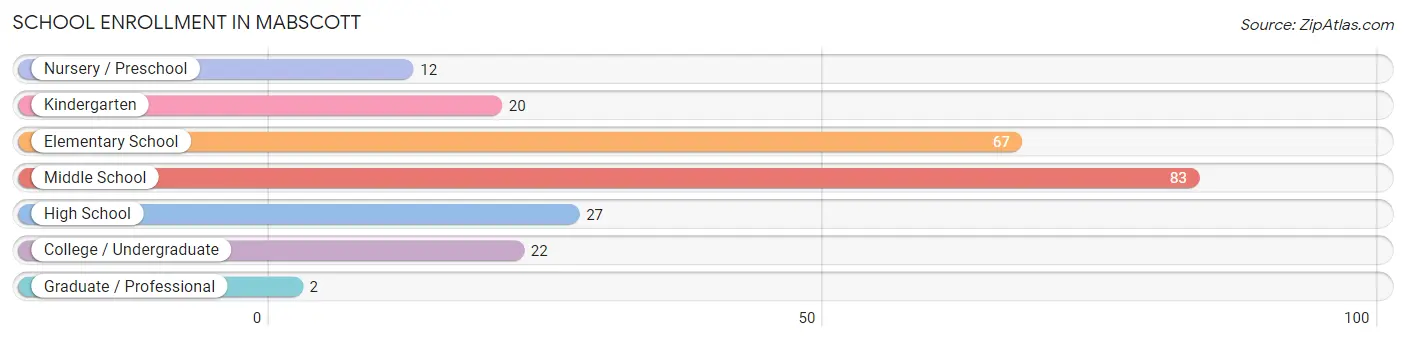
| School Level | # Students | % Students |
| Nursery / Preschool | 12 | 5.1% |
| Kindergarten | 20 | 8.6% |
| Elementary School | 67 | 28.8% |
| Middle School | 83 | 35.6% |
| High School | 27 | 11.6% |
| College / Undergraduate | 22 | 9.4% |
| Graduate / Professional | 2 | 0.9% |
| Total | 233 | 100.0% |
School Enrollment by Age by Funding Source in Mabscott
Out of a total of 233 students who are enrolled in schools in Mabscott, 38 (16.3%) attend a private institution, while the remaining 195 (83.7%) are enrolled in public schools. The age group of 3 to 4 year olds has the highest likelihood of being enrolled in private schools, with 3 (37.5% in the age bracket) enrolled. Conversely, the age group of 18 to 19 year olds has the lowest likelihood of being enrolled in a private school, with 5 (100.0% in the age bracket) attending a public institution.
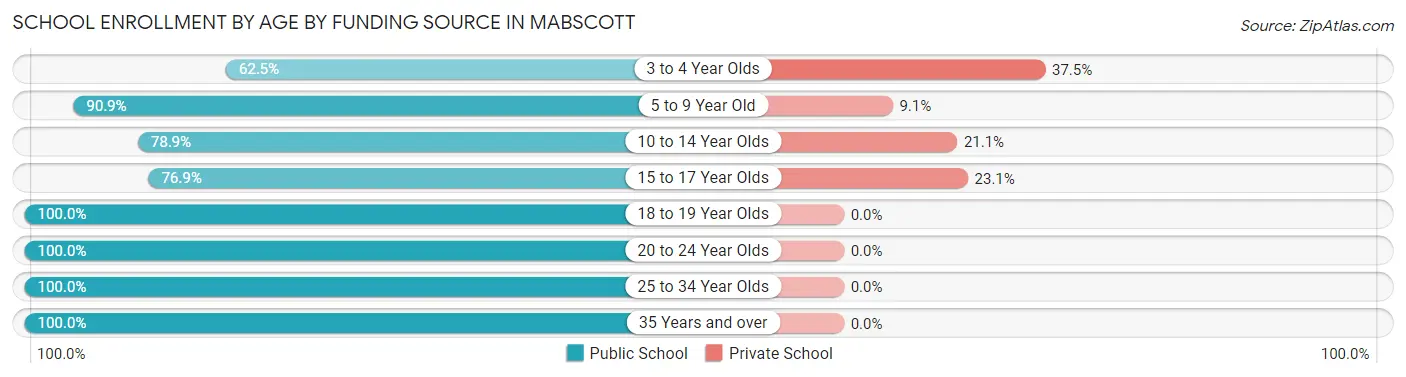
| Age Bracket | Public School | Private School |
| 3 to 4 Year Olds | 5 (62.5%) | 3 (37.5%) |
| 5 to 9 Year Old | 60 (90.9%) | 6 (9.1%) |
| 10 to 14 Year Olds | 86 (78.9%) | 23 (21.1%) |
| 15 to 17 Year Olds | 20 (76.9%) | 6 (23.1%) |
| 18 to 19 Year Olds | 5 (100.0%) | 0 (0.0%) |
| 20 to 24 Year Olds | 5 (100.0%) | 0 (0.0%) |
| 25 to 34 Year Olds | 7 (100.0%) | 0 (0.0%) |
| 35 Years and over | 7 (100.0%) | 0 (0.0%) |
| Total | 195 (83.7%) | 38 (16.3%) |
Educational Attainment by Field of Study in Mabscott
Business (49 | 16.7%), education (43 | 14.7%), science & technology (42 | 14.3%), social sciences (31 | 10.6%), and liberal arts & history (30 | 10.2%) are the most common fields of study among 293 individuals in Mabscott who have obtained a bachelor's degree or higher.
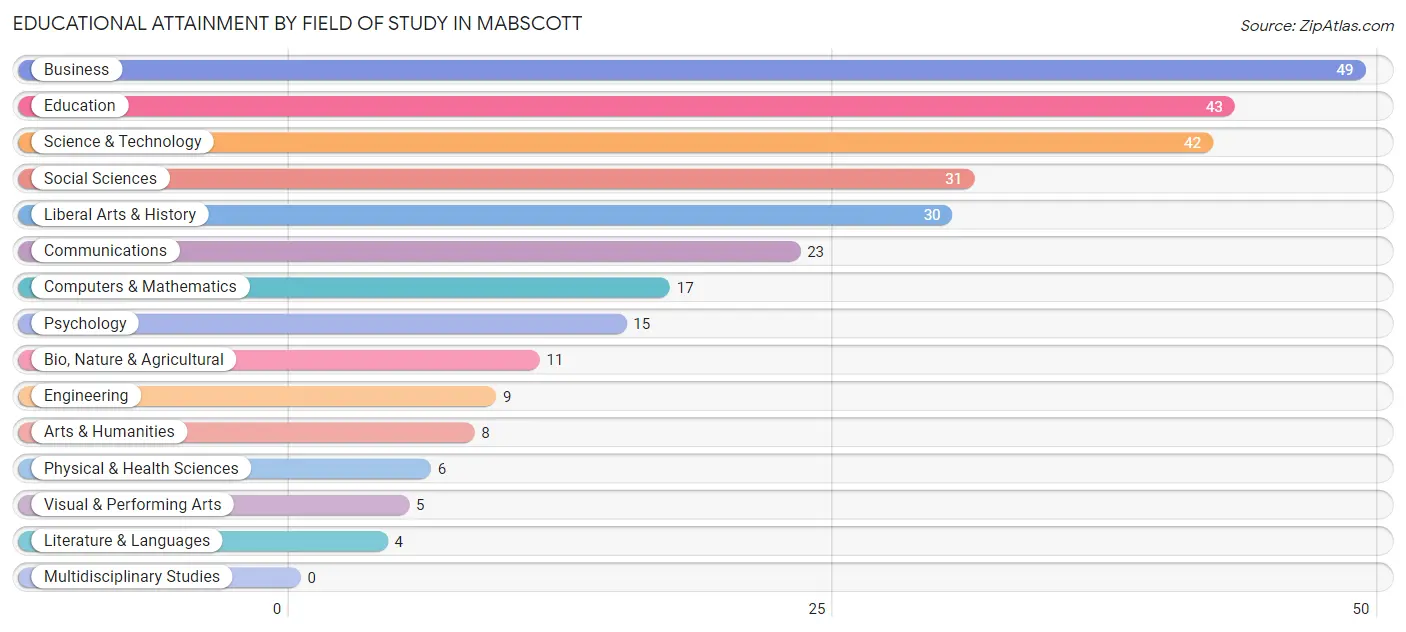
| Field of Study | # Graduates | % Graduates |
| Computers & Mathematics | 17 | 5.8% |
| Bio, Nature & Agricultural | 11 | 3.7% |
| Physical & Health Sciences | 6 | 2.1% |
| Psychology | 15 | 5.1% |
| Social Sciences | 31 | 10.6% |
| Engineering | 9 | 3.1% |
| Multidisciplinary Studies | 0 | 0.0% |
| Science & Technology | 42 | 14.3% |
| Business | 49 | 16.7% |
| Education | 43 | 14.7% |
| Literature & Languages | 4 | 1.4% |
| Liberal Arts & History | 30 | 10.2% |
| Visual & Performing Arts | 5 | 1.7% |
| Communications | 23 | 7.9% |
| Arts & Humanities | 8 | 2.7% |
| Total | 293 | 100.0% |
Transportation & Commute in Mabscott
Vehicle Availability by Sex in Mabscott
The most prevalent vehicle ownership categories in Mabscott are males with 2 vehicles (133, accounting for 49.3%) and females with 2 vehicles (158, making up 45.9%).
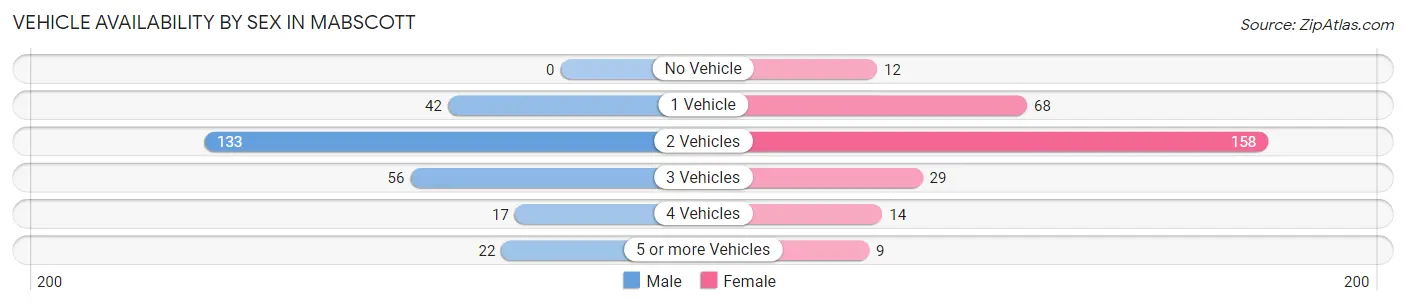
| Vehicles Available | Male | Female |
| No Vehicle | 0 (0.0%) | 12 (4.1%) |
| 1 Vehicle | 42 (15.6%) | 68 (23.4%) |
| 2 Vehicles | 133 (49.3%) | 158 (54.5%) |
| 3 Vehicles | 56 (20.7%) | 29 (10.0%) |
| 4 Vehicles | 17 (6.3%) | 14 (4.8%) |
| 5 or more Vehicles | 22 (8.2%) | 9 (3.1%) |
| Total | 270 (100.0%) | 290 (100.0%) |
Commute Time in Mabscott
The most frequently occuring commute durations in Mabscott are 15 to 19 minutes (152 commuters, 28.1%), 10 to 14 minutes (129 commuters, 23.9%), and 5 to 9 minutes (87 commuters, 16.1%).
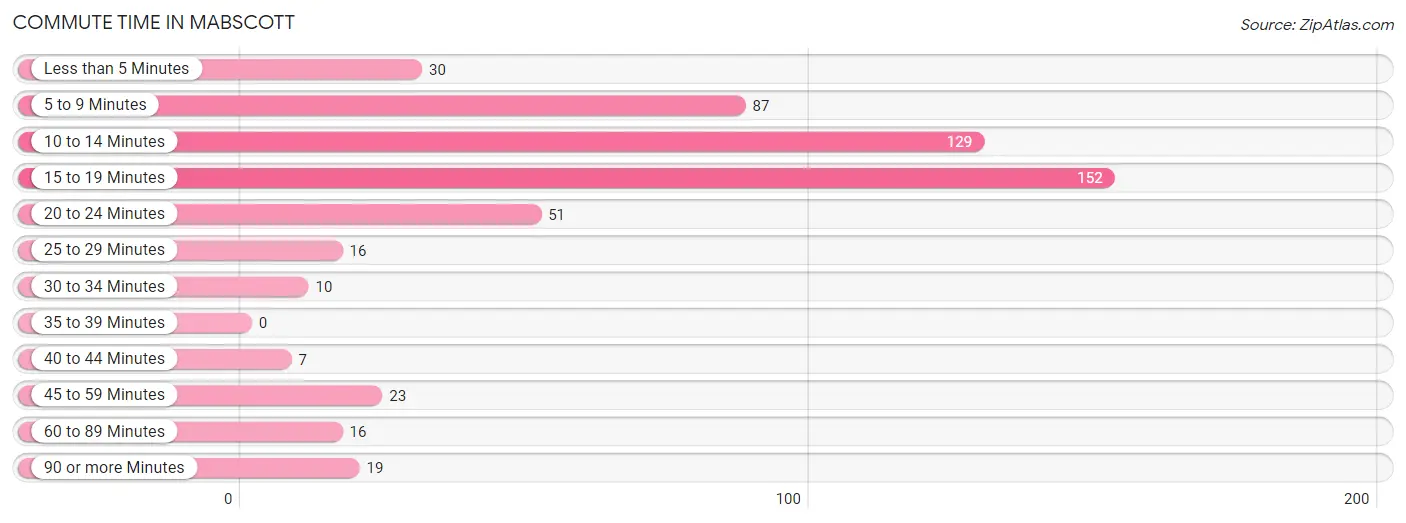
| Commute Time | # Commuters | % Commuters |
| Less than 5 Minutes | 30 | 5.6% |
| 5 to 9 Minutes | 87 | 16.1% |
| 10 to 14 Minutes | 129 | 23.9% |
| 15 to 19 Minutes | 152 | 28.1% |
| 20 to 24 Minutes | 51 | 9.4% |
| 25 to 29 Minutes | 16 | 3.0% |
| 30 to 34 Minutes | 10 | 1.8% |
| 35 to 39 Minutes | 0 | 0.0% |
| 40 to 44 Minutes | 7 | 1.3% |
| 45 to 59 Minutes | 23 | 4.3% |
| 60 to 89 Minutes | 16 | 3.0% |
| 90 or more Minutes | 19 | 3.5% |
Commute Time by Sex in Mabscott
The most common commute times in Mabscott are 15 to 19 minutes (74 commuters, 27.6%) for males and 10 to 14 minutes (103 commuters, 37.9%) for females.
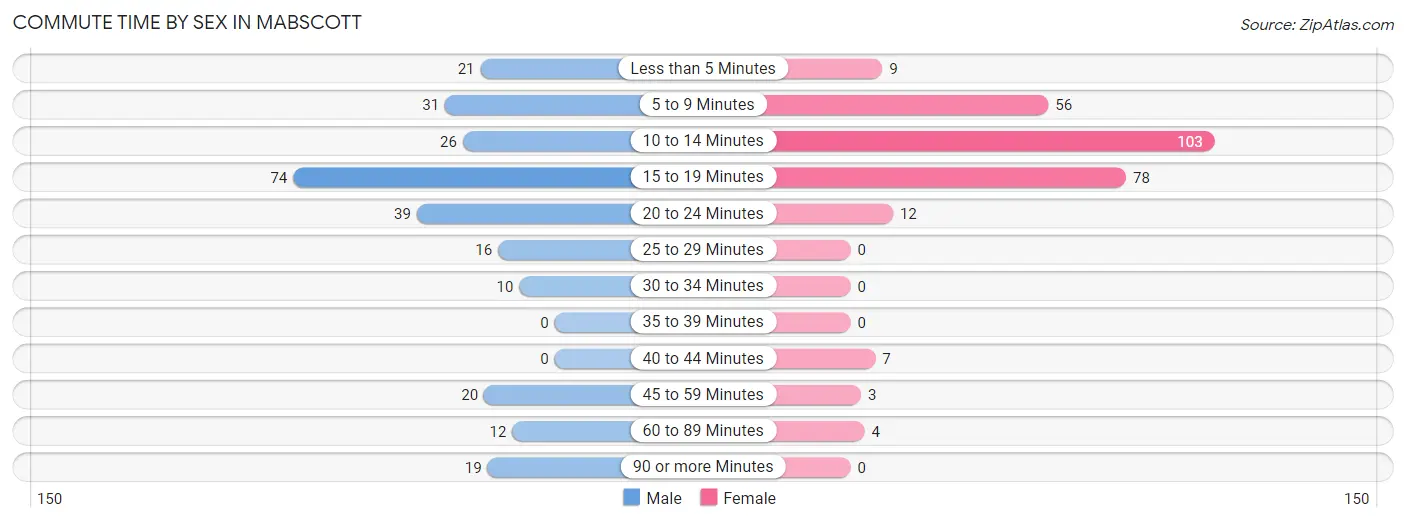
| Commute Time | Male | Female |
| Less than 5 Minutes | 21 (7.8%) | 9 (3.3%) |
| 5 to 9 Minutes | 31 (11.6%) | 56 (20.6%) |
| 10 to 14 Minutes | 26 (9.7%) | 103 (37.9%) |
| 15 to 19 Minutes | 74 (27.6%) | 78 (28.7%) |
| 20 to 24 Minutes | 39 (14.5%) | 12 (4.4%) |
| 25 to 29 Minutes | 16 (6.0%) | 0 (0.0%) |
| 30 to 34 Minutes | 10 (3.7%) | 0 (0.0%) |
| 35 to 39 Minutes | 0 (0.0%) | 0 (0.0%) |
| 40 to 44 Minutes | 0 (0.0%) | 7 (2.6%) |
| 45 to 59 Minutes | 20 (7.5%) | 3 (1.1%) |
| 60 to 89 Minutes | 12 (4.5%) | 4 (1.5%) |
| 90 or more Minutes | 19 (7.1%) | 0 (0.0%) |
Time of Departure to Work by Sex in Mabscott
The most frequent times of departure to work in Mabscott are 8:00 AM to 8:29 AM (61, 22.8%) for males and 12:00 PM to 3:59 PM (98, 36.0%) for females.
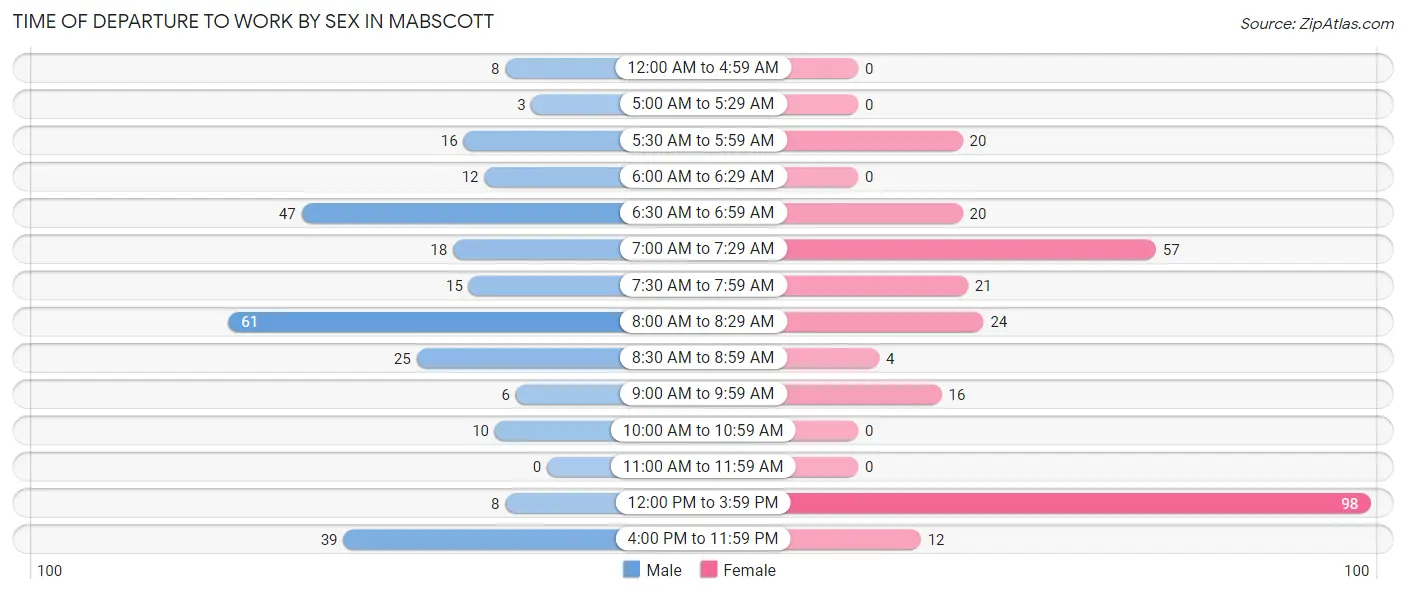
| Time of Departure | Male | Female |
| 12:00 AM to 4:59 AM | 8 (3.0%) | 0 (0.0%) |
| 5:00 AM to 5:29 AM | 3 (1.1%) | 0 (0.0%) |
| 5:30 AM to 5:59 AM | 16 (6.0%) | 20 (7.3%) |
| 6:00 AM to 6:29 AM | 12 (4.5%) | 0 (0.0%) |
| 6:30 AM to 6:59 AM | 47 (17.5%) | 20 (7.3%) |
| 7:00 AM to 7:29 AM | 18 (6.7%) | 57 (21.0%) |
| 7:30 AM to 7:59 AM | 15 (5.6%) | 21 (7.7%) |
| 8:00 AM to 8:29 AM | 61 (22.8%) | 24 (8.8%) |
| 8:30 AM to 8:59 AM | 25 (9.3%) | 4 (1.5%) |
| 9:00 AM to 9:59 AM | 6 (2.2%) | 16 (5.9%) |
| 10:00 AM to 10:59 AM | 10 (3.7%) | 0 (0.0%) |
| 11:00 AM to 11:59 AM | 0 (0.0%) | 0 (0.0%) |
| 12:00 PM to 3:59 PM | 8 (3.0%) | 98 (36.0%) |
| 4:00 PM to 11:59 PM | 39 (14.5%) | 12 (4.4%) |
| Total | 268 (100.0%) | 272 (100.0%) |
Housing Occupancy in Mabscott
Occupancy by Ownership in Mabscott
Of the total 574 dwellings in Mabscott, owner-occupied units account for 389 (67.8%), while renter-occupied units make up 185 (32.2%).
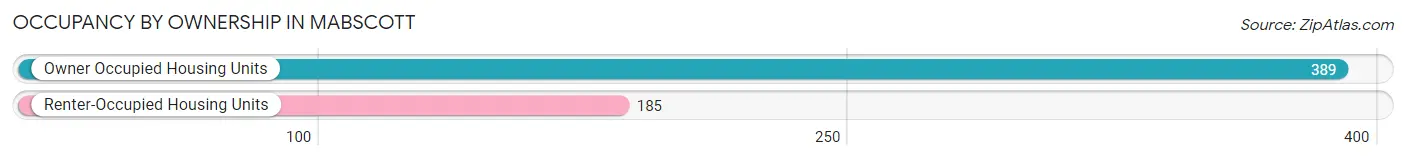
| Occupancy | # Housing Units | % Housing Units |
| Owner Occupied Housing Units | 389 | 67.8% |
| Renter-Occupied Housing Units | 185 | 32.2% |
| Total Occupied Housing Units | 574 | 100.0% |
Occupancy by Household Size in Mabscott
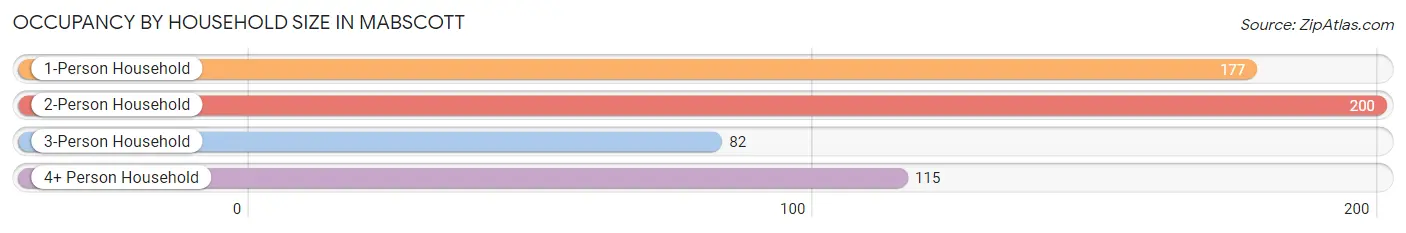
| Household Size | # Housing Units | % Housing Units |
| 1-Person Household | 177 | 30.8% |
| 2-Person Household | 200 | 34.8% |
| 3-Person Household | 82 | 14.3% |
| 4+ Person Household | 115 | 20.0% |
| Total Housing Units | 574 | 100.0% |
Occupancy by Ownership by Household Size in Mabscott
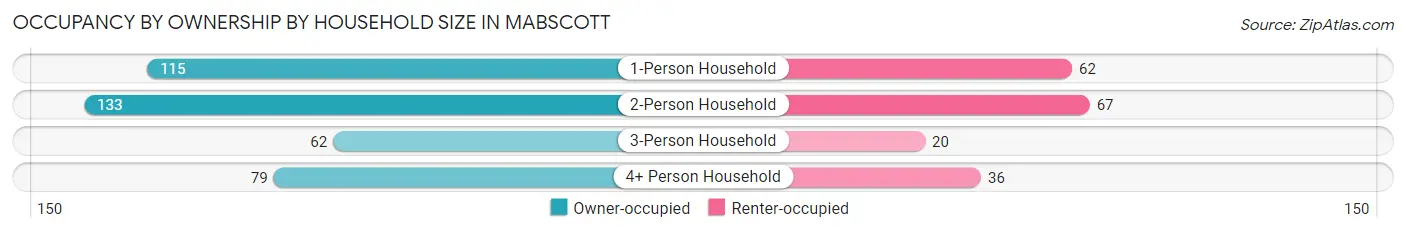
| Household Size | Owner-occupied | Renter-occupied |
| 1-Person Household | 115 (65.0%) | 62 (35.0%) |
| 2-Person Household | 133 (66.5%) | 67 (33.5%) |
| 3-Person Household | 62 (75.6%) | 20 (24.4%) |
| 4+ Person Household | 79 (68.7%) | 36 (31.3%) |
| Total Housing Units | 389 (67.8%) | 185 (32.2%) |
Occupancy by Educational Attainment in Mabscott
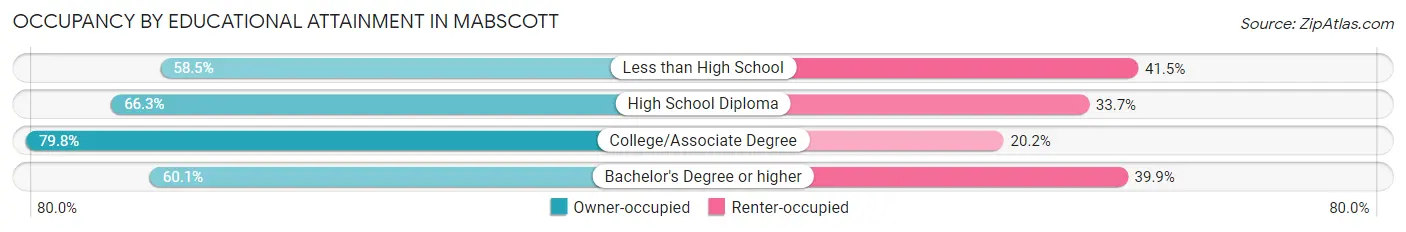
| Household Size | Owner-occupied | Renter-occupied |
| Less than High School | 38 (58.5%) | 27 (41.5%) |
| High School Diploma | 108 (66.3%) | 55 (33.7%) |
| College/Associate Degree | 142 (79.8%) | 36 (20.2%) |
| Bachelor's Degree or higher | 101 (60.1%) | 67 (39.9%) |
Occupancy by Age of Householder in Mabscott
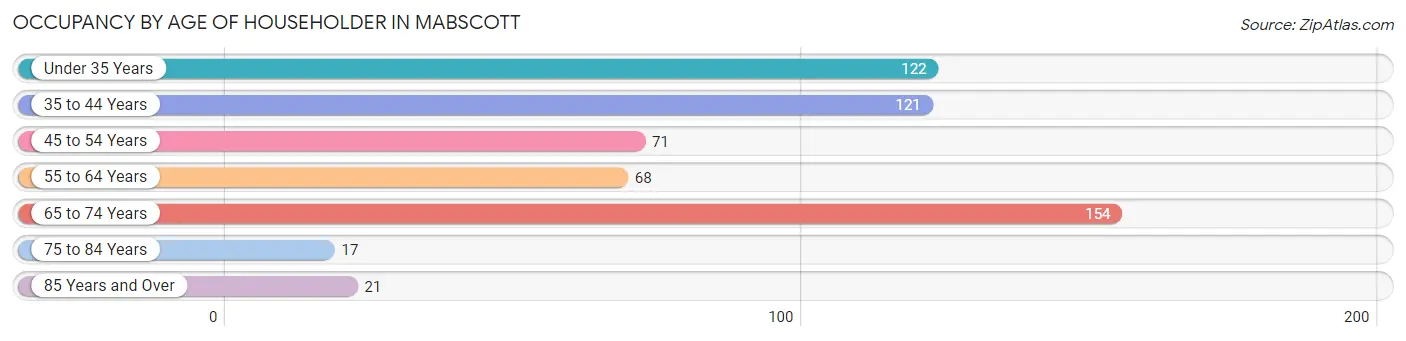
| Age Bracket | # Households | % Households |
| Under 35 Years | 122 | 21.2% |
| 35 to 44 Years | 121 | 21.1% |
| 45 to 54 Years | 71 | 12.4% |
| 55 to 64 Years | 68 | 11.8% |
| 65 to 74 Years | 154 | 26.8% |
| 75 to 84 Years | 17 | 3.0% |
| 85 Years and Over | 21 | 3.7% |
| Total | 574 | 100.0% |
Housing Finances in Mabscott
Median Income by Occupancy in Mabscott
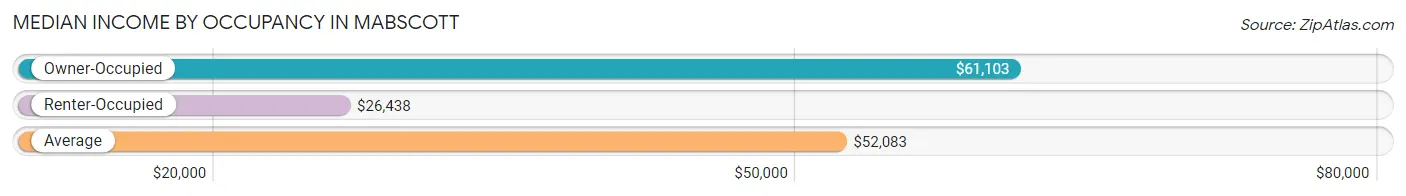
| Occupancy Type | # Households | Median Income |
| Owner-Occupied | 389 (67.8%) | $61,103 |
| Renter-Occupied | 185 (32.2%) | $26,438 |
| Average | 574 (100.0%) | $52,083 |
Occupancy by Householder Income Bracket in Mabscott
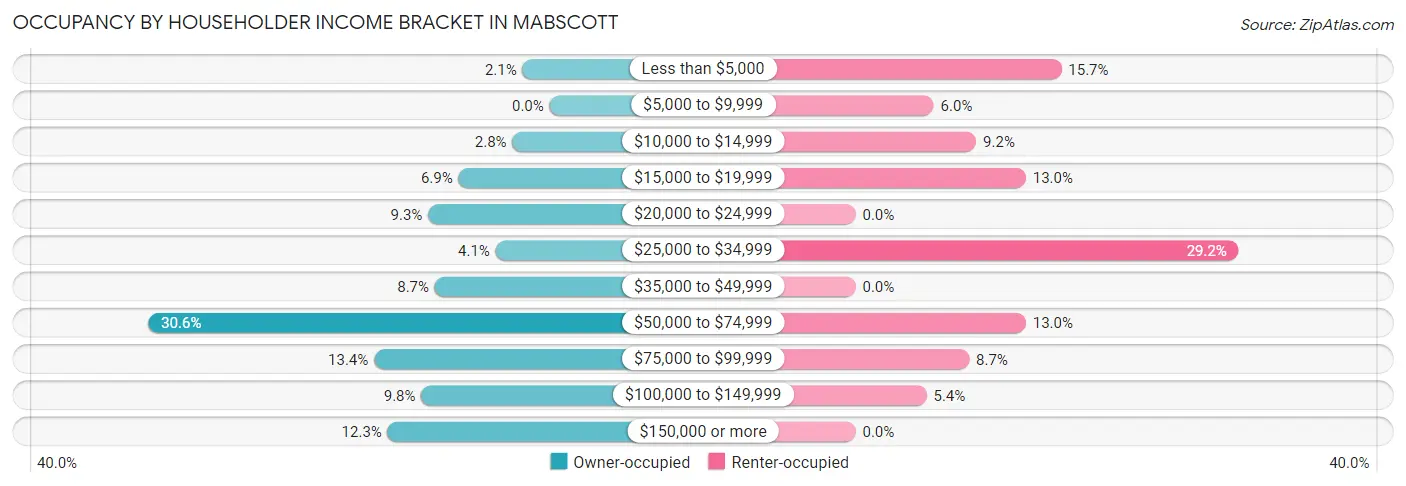
| Income Bracket | Owner-occupied | Renter-occupied |
| Less than $5,000 | 8 (2.1%) | 29 (15.7%) |
| $5,000 to $9,999 | 0 (0.0%) | 11 (5.9%) |
| $10,000 to $14,999 | 11 (2.8%) | 17 (9.2%) |
| $15,000 to $19,999 | 27 (6.9%) | 24 (13.0%) |
| $20,000 to $24,999 | 36 (9.2%) | 0 (0.0%) |
| $25,000 to $34,999 | 16 (4.1%) | 54 (29.2%) |
| $35,000 to $49,999 | 34 (8.7%) | 0 (0.0%) |
| $50,000 to $74,999 | 119 (30.6%) | 24 (13.0%) |
| $75,000 to $99,999 | 52 (13.4%) | 16 (8.6%) |
| $100,000 to $149,999 | 38 (9.8%) | 10 (5.4%) |
| $150,000 or more | 48 (12.3%) | 0 (0.0%) |
| Total | 389 (100.0%) | 185 (100.0%) |
Monthly Housing Cost Tiers in Mabscott
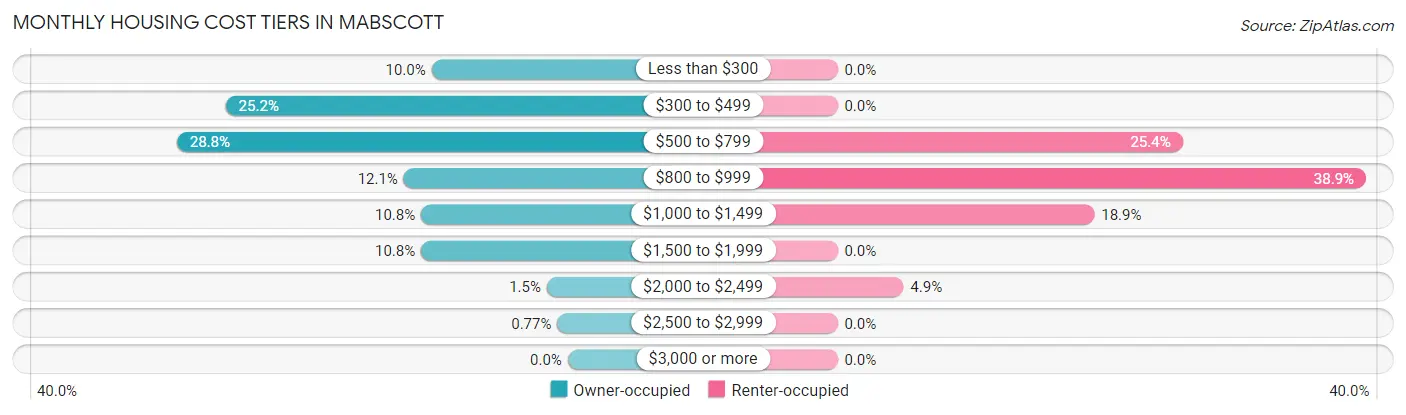
| Monthly Cost | Owner-occupied | Renter-occupied |
| Less than $300 | 39 (10.0%) | 0 (0.0%) |
| $300 to $499 | 98 (25.2%) | 0 (0.0%) |
| $500 to $799 | 112 (28.8%) | 47 (25.4%) |
| $800 to $999 | 47 (12.1%) | 72 (38.9%) |
| $1,000 to $1,499 | 42 (10.8%) | 35 (18.9%) |
| $1,500 to $1,999 | 42 (10.8%) | 0 (0.0%) |
| $2,000 to $2,499 | 6 (1.5%) | 9 (4.9%) |
| $2,500 to $2,999 | 3 (0.8%) | 0 (0.0%) |
| $3,000 or more | 0 (0.0%) | 0 (0.0%) |
| Total | 389 (100.0%) | 185 (100.0%) |
Physical Housing Characteristics in Mabscott
Housing Structures in Mabscott
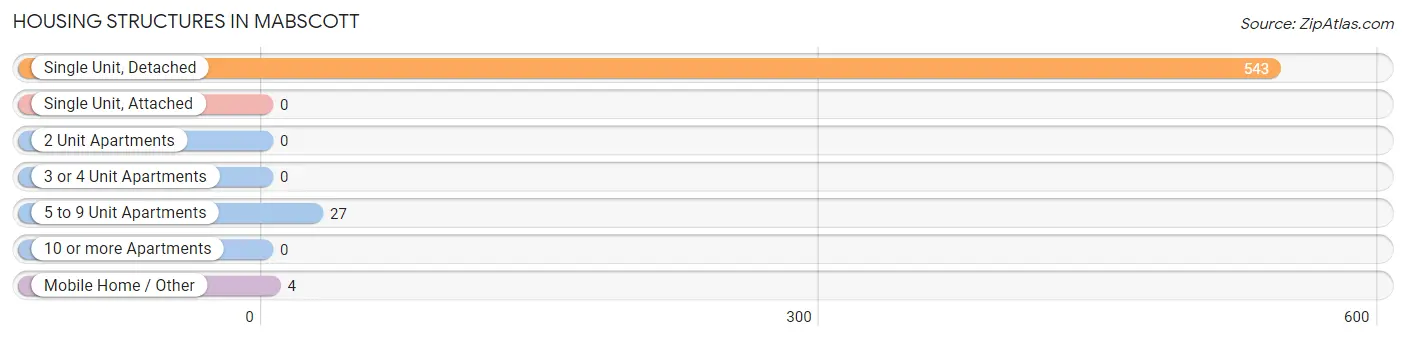
| Structure Type | # Housing Units | % Housing Units |
| Single Unit, Detached | 543 | 94.6% |
| Single Unit, Attached | 0 | 0.0% |
| 2 Unit Apartments | 0 | 0.0% |
| 3 or 4 Unit Apartments | 0 | 0.0% |
| 5 to 9 Unit Apartments | 27 | 4.7% |
| 10 or more Apartments | 0 | 0.0% |
| Mobile Home / Other | 4 | 0.7% |
| Total | 574 | 100.0% |
Housing Structures by Occupancy in Mabscott
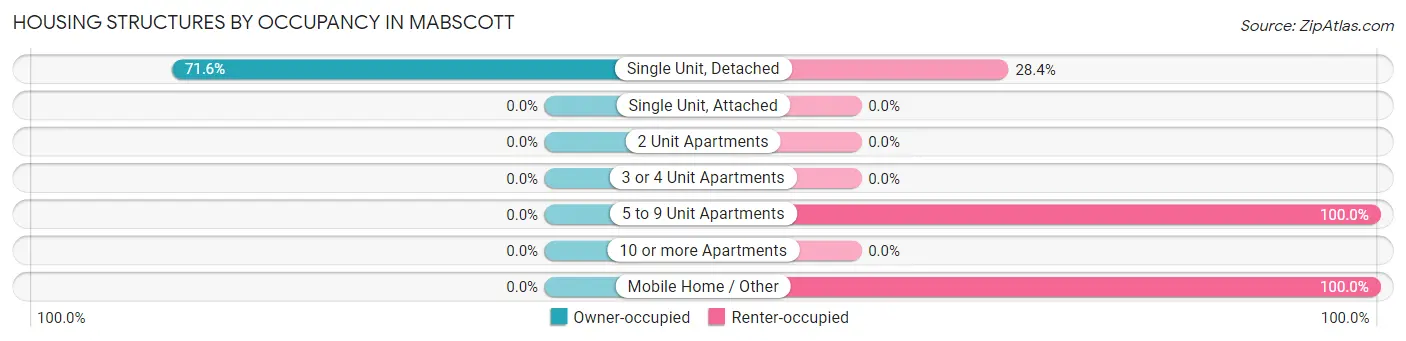
| Structure Type | Owner-occupied | Renter-occupied |
| Single Unit, Detached | 389 (71.6%) | 154 (28.4%) |
| Single Unit, Attached | 0 (0.0%) | 0 (0.0%) |
| 2 Unit Apartments | 0 (0.0%) | 0 (0.0%) |
| 3 or 4 Unit Apartments | 0 (0.0%) | 0 (0.0%) |
| 5 to 9 Unit Apartments | 0 (0.0%) | 27 (100.0%) |
| 10 or more Apartments | 0 (0.0%) | 0 (0.0%) |
| Mobile Home / Other | 0 (0.0%) | 4 (100.0%) |
| Total | 389 (67.8%) | 185 (32.2%) |
Housing Structures by Number of Rooms in Mabscott
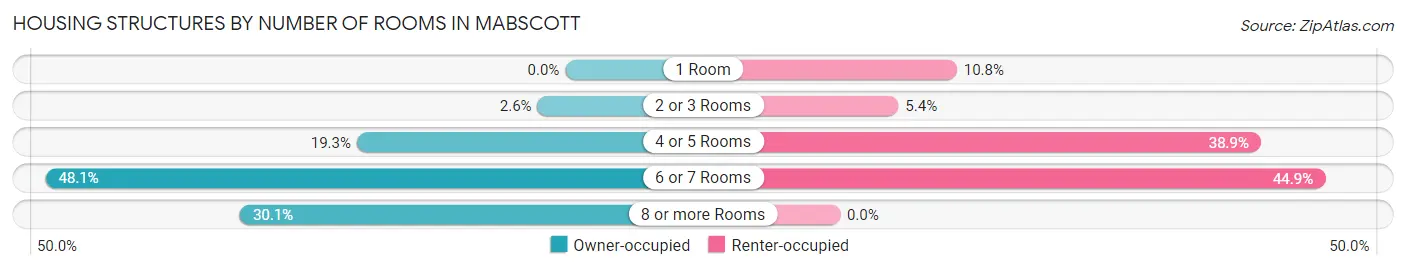
| Number of Rooms | Owner-occupied | Renter-occupied |
| 1 Room | 0 (0.0%) | 20 (10.8%) |
| 2 or 3 Rooms | 10 (2.6%) | 10 (5.4%) |
| 4 or 5 Rooms | 75 (19.3%) | 72 (38.9%) |
| 6 or 7 Rooms | 187 (48.1%) | 83 (44.9%) |
| 8 or more Rooms | 117 (30.1%) | 0 (0.0%) |
| Total | 389 (100.0%) | 185 (100.0%) |
Housing Structure by Heating Type in Mabscott
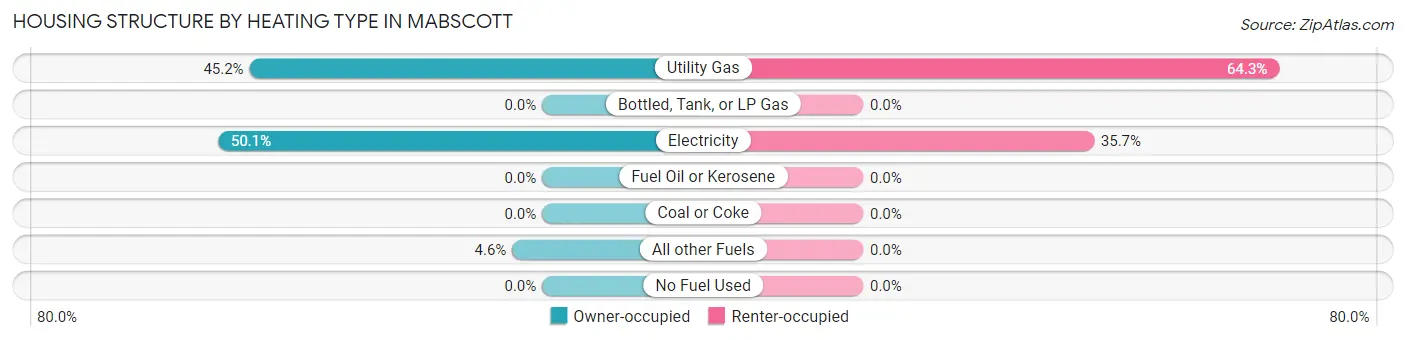
| Heating Type | Owner-occupied | Renter-occupied |
| Utility Gas | 176 (45.2%) | 119 (64.3%) |
| Bottled, Tank, or LP Gas | 0 (0.0%) | 0 (0.0%) |
| Electricity | 195 (50.1%) | 66 (35.7%) |
| Fuel Oil or Kerosene | 0 (0.0%) | 0 (0.0%) |
| Coal or Coke | 0 (0.0%) | 0 (0.0%) |
| All other Fuels | 18 (4.6%) | 0 (0.0%) |
| No Fuel Used | 0 (0.0%) | 0 (0.0%) |
| Total | 389 (100.0%) | 185 (100.0%) |
Household Vehicle Usage in Mabscott
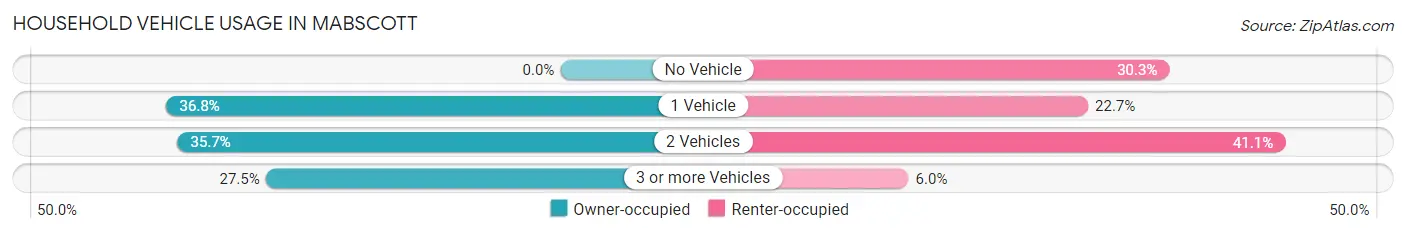
| Vehicles per Household | Owner-occupied | Renter-occupied |
| No Vehicle | 0 (0.0%) | 56 (30.3%) |
| 1 Vehicle | 143 (36.8%) | 42 (22.7%) |
| 2 Vehicles | 139 (35.7%) | 76 (41.1%) |
| 3 or more Vehicles | 107 (27.5%) | 11 (5.9%) |
| Total | 389 (100.0%) | 185 (100.0%) |
Real Estate & Mortgages in Mabscott
Real Estate and Mortgage Overview in Mabscott
| Characteristic | Without Mortgage | With Mortgage |
| Housing Units | 237 | 152 |
| Median Property Value | $88,900 | $170,000 |
| Median Household Income | $51,705 | $31 |
| Monthly Housing Costs | $465 | $0 |
| Real Estate Taxes | $603 | $4 |
Property Value by Mortgage Status in Mabscott
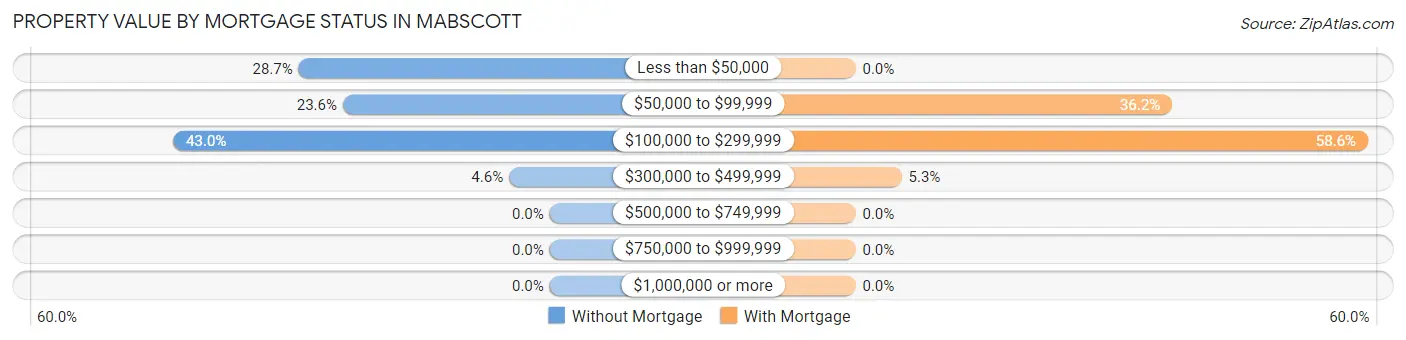
| Property Value | Without Mortgage | With Mortgage |
| Less than $50,000 | 68 (28.7%) | 0 (0.0%) |
| $50,000 to $99,999 | 56 (23.6%) | 55 (36.2%) |
| $100,000 to $299,999 | 102 (43.0%) | 89 (58.6%) |
| $300,000 to $499,999 | 11 (4.6%) | 8 (5.3%) |
| $500,000 to $749,999 | 0 (0.0%) | 0 (0.0%) |
| $750,000 to $999,999 | 0 (0.0%) | 0 (0.0%) |
| $1,000,000 or more | 0 (0.0%) | 0 (0.0%) |
| Total | 237 (100.0%) | 152 (100.0%) |
Household Income by Mortgage Status in Mabscott
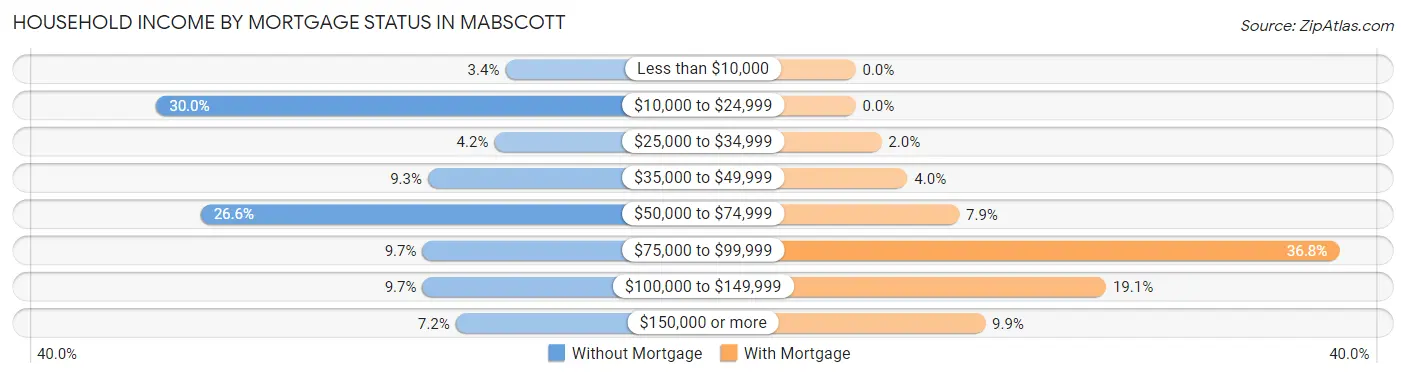
| Household Income | Without Mortgage | With Mortgage |
| Less than $10,000 | 8 (3.4%) | 0 (0.0%) |
| $10,000 to $24,999 | 71 (30.0%) | 0 (0.0%) |
| $25,000 to $34,999 | 10 (4.2%) | 3 (2.0%) |
| $35,000 to $49,999 | 22 (9.3%) | 6 (4.0%) |
| $50,000 to $74,999 | 63 (26.6%) | 12 (7.9%) |
| $75,000 to $99,999 | 23 (9.7%) | 56 (36.8%) |
| $100,000 to $149,999 | 23 (9.7%) | 29 (19.1%) |
| $150,000 or more | 17 (7.2%) | 15 (9.9%) |
| Total | 237 (100.0%) | 152 (100.0%) |
Property Value to Household Income Ratio in Mabscott
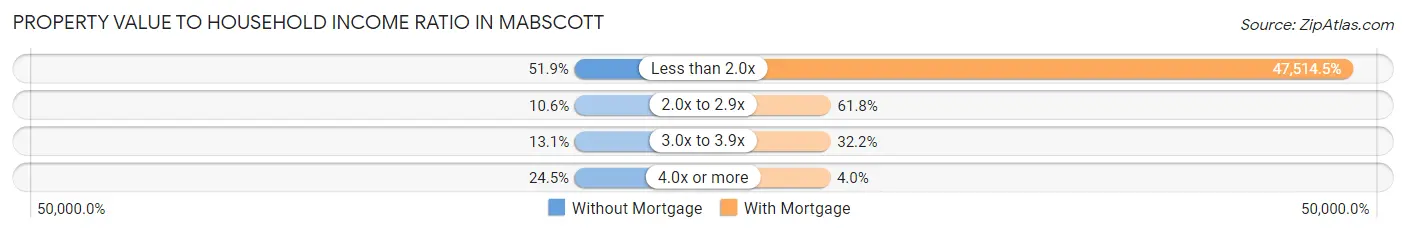
| Value-to-Income Ratio | Without Mortgage | With Mortgage |
| Less than 2.0x | 123 (51.9%) | 72,222 (47,514.5%) |
| 2.0x to 2.9x | 25 (10.5%) | 94 (61.8%) |
| 3.0x to 3.9x | 31 (13.1%) | 49 (32.2%) |
| 4.0x or more | 58 (24.5%) | 6 (4.0%) |
| Total | 237 (100.0%) | 152 (100.0%) |
Real Estate Taxes by Mortgage Status in Mabscott
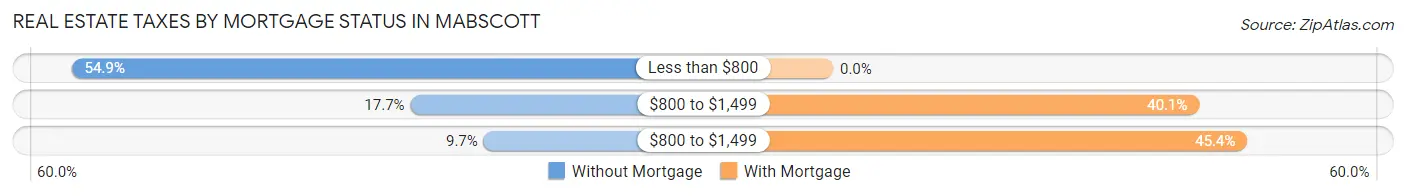
| Property Taxes | Without Mortgage | With Mortgage |
| Less than $800 | 130 (54.8%) | 0 (0.0%) |
| $800 to $1,499 | 42 (17.7%) | 61 (40.1%) |
| $800 to $1,499 | 23 (9.7%) | 69 (45.4%) |
| Total | 237 (100.0%) | 152 (100.0%) |
Health & Disability in Mabscott
Health Insurance Coverage by Age in Mabscott
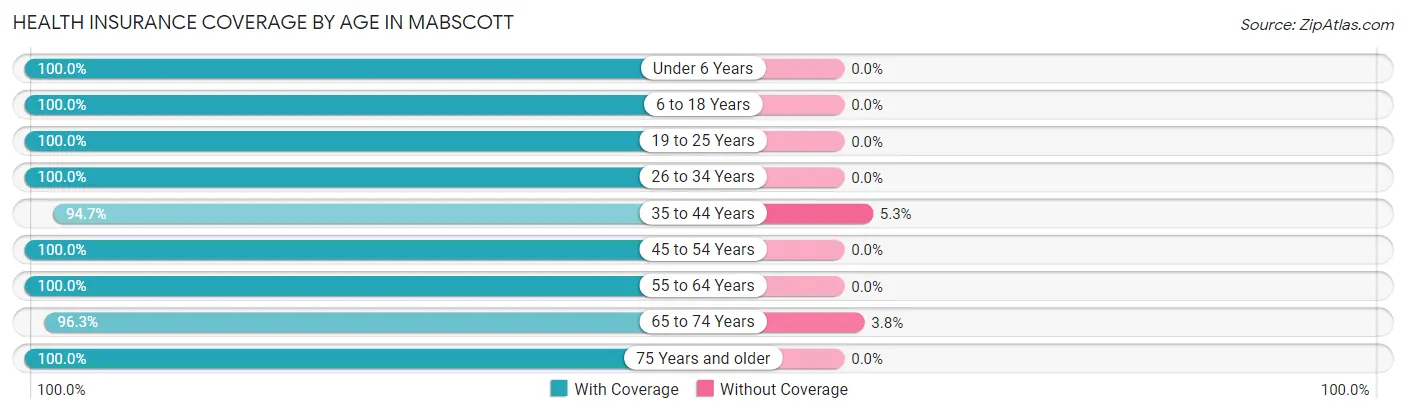
| Age Bracket | With Coverage | Without Coverage |
| Under 6 Years | 227 (100.0%) | 0 (0.0%) |
| 6 to 18 Years | 255 (100.0%) | 0 (0.0%) |
| 19 to 25 Years | 86 (100.0%) | 0 (0.0%) |
| 26 to 34 Years | 221 (100.0%) | 0 (0.0%) |
| 35 to 44 Years | 160 (94.7%) | 9 (5.3%) |
| 45 to 54 Years | 163 (100.0%) | 0 (0.0%) |
| 55 to 64 Years | 107 (100.0%) | 0 (0.0%) |
| 65 to 74 Years | 257 (96.3%) | 10 (3.7%) |
| 75 Years and older | 54 (100.0%) | 0 (0.0%) |
| Total | 1,530 (98.8%) | 19 (1.2%) |
Health Insurance Coverage by Citizenship Status in Mabscott
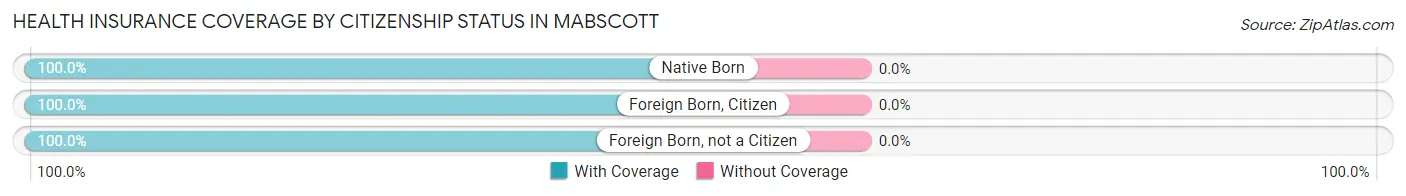
| Citizenship Status | With Coverage | Without Coverage |
| Native Born | 227 (100.0%) | 0 (0.0%) |
| Foreign Born, Citizen | 255 (100.0%) | 0 (0.0%) |
| Foreign Born, not a Citizen | 86 (100.0%) | 0 (0.0%) |
Health Insurance Coverage by Household Income in Mabscott
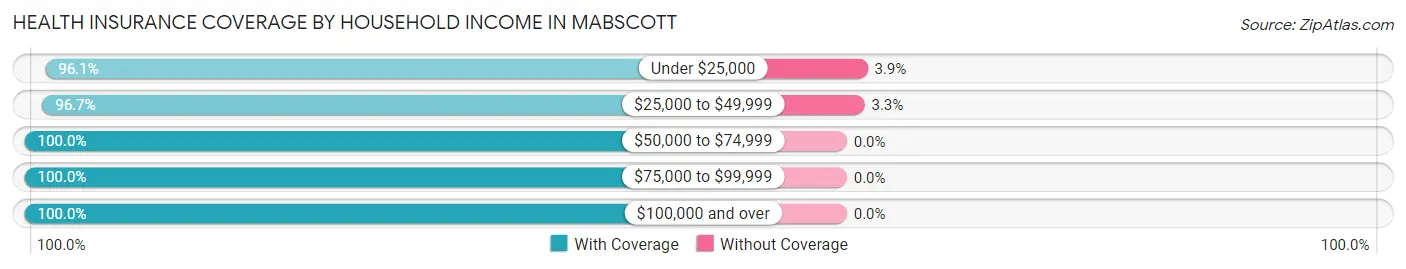
| Household Income | With Coverage | Without Coverage |
| Under $25,000 | 248 (96.1%) | 10 (3.9%) |
| $25,000 to $49,999 | 262 (96.7%) | 9 (3.3%) |
| $50,000 to $74,999 | 425 (100.0%) | 0 (0.0%) |
| $75,000 to $99,999 | 240 (100.0%) | 0 (0.0%) |
| $100,000 and over | 355 (100.0%) | 0 (0.0%) |
Public vs Private Health Insurance Coverage by Age in Mabscott
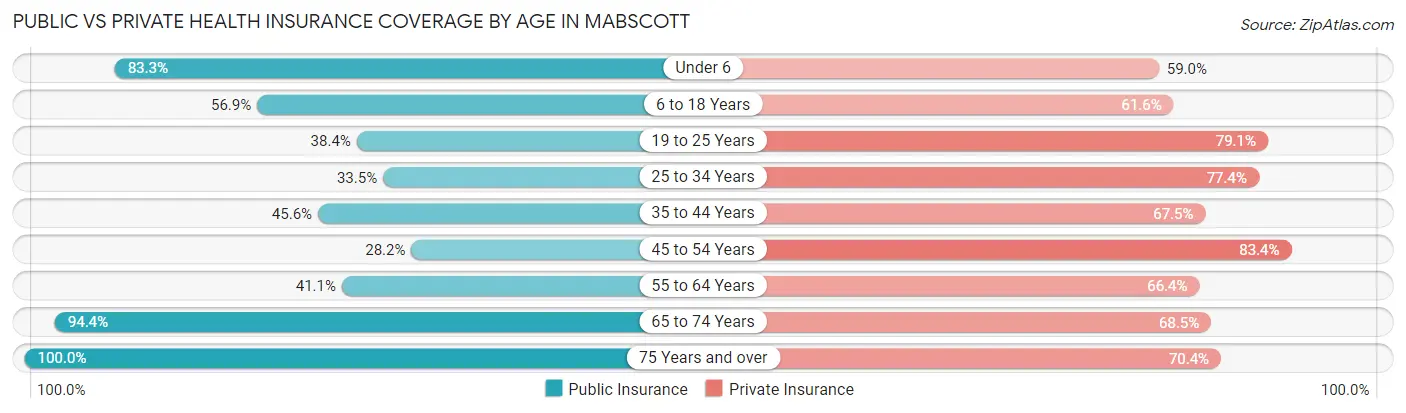
| Age Bracket | Public Insurance | Private Insurance |
| Under 6 | 189 (83.3%) | 134 (59.0%) |
| 6 to 18 Years | 145 (56.9%) | 157 (61.6%) |
| 19 to 25 Years | 33 (38.4%) | 68 (79.1%) |
| 25 to 34 Years | 74 (33.5%) | 171 (77.4%) |
| 35 to 44 Years | 77 (45.6%) | 114 (67.5%) |
| 45 to 54 Years | 46 (28.2%) | 136 (83.4%) |
| 55 to 64 Years | 44 (41.1%) | 71 (66.4%) |
| 65 to 74 Years | 252 (94.4%) | 183 (68.5%) |
| 75 Years and over | 54 (100.0%) | 38 (70.4%) |
| Total | 914 (59.0%) | 1,072 (69.2%) |
Disability Status by Sex by Age in Mabscott
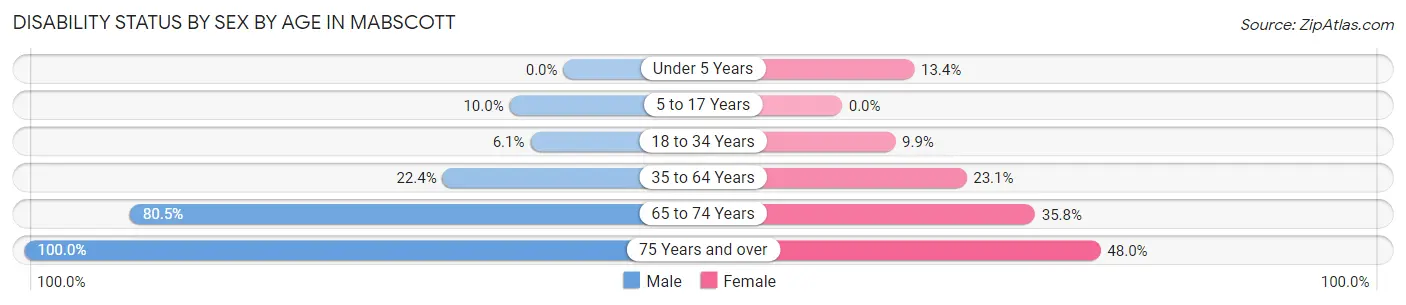
| Age Bracket | Male | Female |
| Under 5 Years | 0 (0.0%) | 11 (13.4%) |
| 5 to 17 Years | 11 (10.0%) | 0 (0.0%) |
| 18 to 34 Years | 7 (6.1%) | 20 (9.9%) |
| 35 to 64 Years | 48 (22.4%) | 52 (23.1%) |
| 65 to 74 Years | 107 (80.4%) | 48 (35.8%) |
| 75 Years and over | 29 (100.0%) | 12 (48.0%) |
Disability Class by Sex by Age in Mabscott
Disability Class: Hearing Difficulty
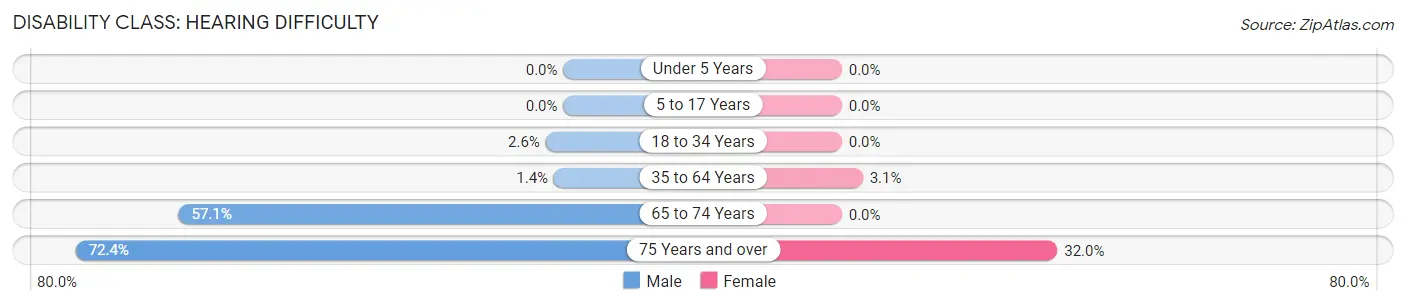
| Age Bracket | Male | Female |
| Under 5 Years | 0 (0.0%) | 0 (0.0%) |
| 5 to 17 Years | 0 (0.0%) | 0 (0.0%) |
| 18 to 34 Years | 3 (2.6%) | 0 (0.0%) |
| 35 to 64 Years | 3 (1.4%) | 7 (3.1%) |
| 65 to 74 Years | 76 (57.1%) | 0 (0.0%) |
| 75 Years and over | 21 (72.4%) | 8 (32.0%) |
Disability Class: Vision Difficulty
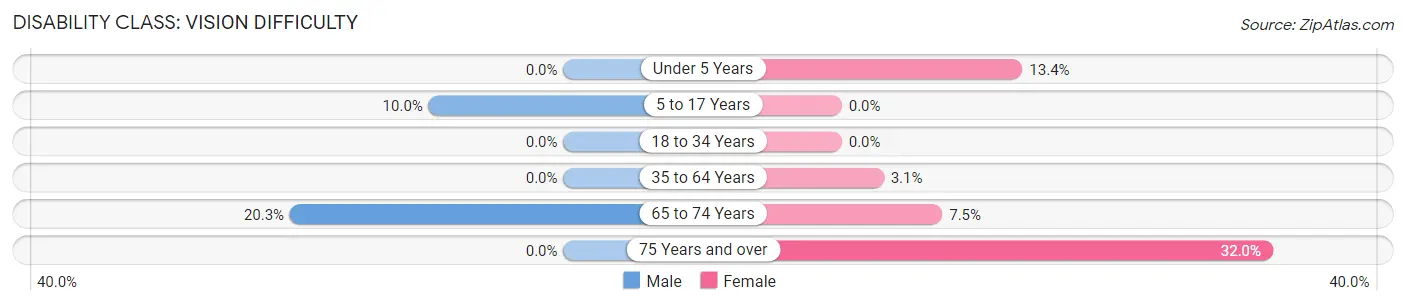
| Age Bracket | Male | Female |
| Under 5 Years | 0 (0.0%) | 11 (13.4%) |
| 5 to 17 Years | 11 (10.0%) | 0 (0.0%) |
| 18 to 34 Years | 0 (0.0%) | 0 (0.0%) |
| 35 to 64 Years | 0 (0.0%) | 7 (3.1%) |
| 65 to 74 Years | 27 (20.3%) | 10 (7.5%) |
| 75 Years and over | 0 (0.0%) | 8 (32.0%) |
Disability Class: Cognitive Difficulty
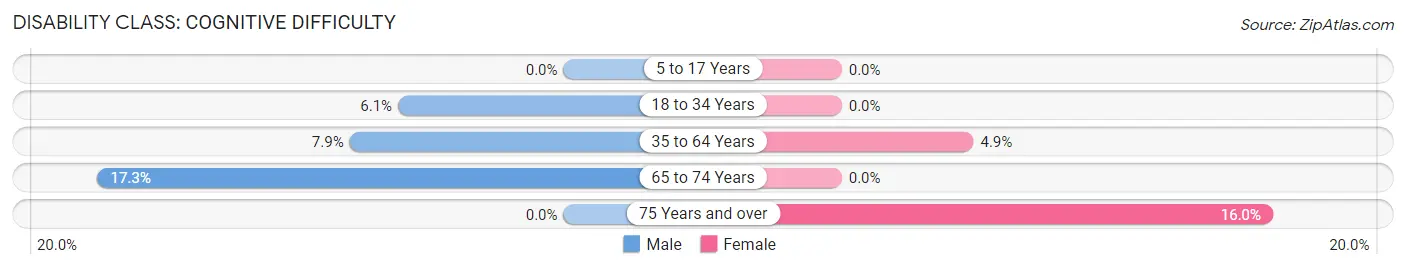
| Age Bracket | Male | Female |
| 5 to 17 Years | 0 (0.0%) | 0 (0.0%) |
| 18 to 34 Years | 7 (6.1%) | 0 (0.0%) |
| 35 to 64 Years | 17 (7.9%) | 11 (4.9%) |
| 65 to 74 Years | 23 (17.3%) | 0 (0.0%) |
| 75 Years and over | 0 (0.0%) | 4 (16.0%) |
Disability Class: Ambulatory Difficulty
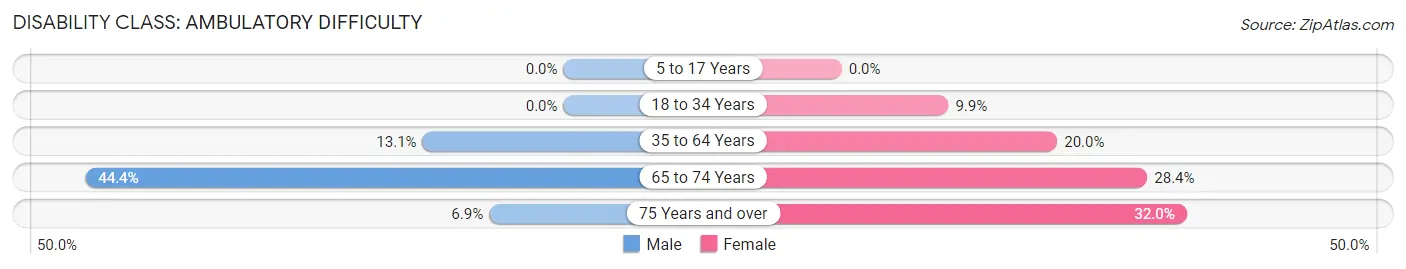
| Age Bracket | Male | Female |
| 5 to 17 Years | 0 (0.0%) | 0 (0.0%) |
| 18 to 34 Years | 0 (0.0%) | 20 (9.9%) |
| 35 to 64 Years | 28 (13.1%) | 45 (20.0%) |
| 65 to 74 Years | 59 (44.4%) | 38 (28.4%) |
| 75 Years and over | 2 (6.9%) | 8 (32.0%) |
Disability Class: Self-Care Difficulty
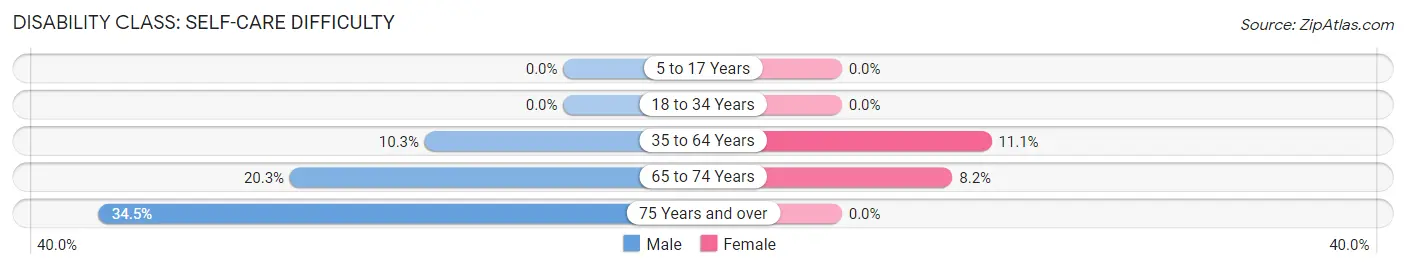
| Age Bracket | Male | Female |
| 5 to 17 Years | 0 (0.0%) | 0 (0.0%) |
| 18 to 34 Years | 0 (0.0%) | 0 (0.0%) |
| 35 to 64 Years | 22 (10.3%) | 25 (11.1%) |
| 65 to 74 Years | 27 (20.3%) | 11 (8.2%) |
| 75 Years and over | 10 (34.5%) | 0 (0.0%) |
Technology Access in Mabscott
Computing Device Access in Mabscott
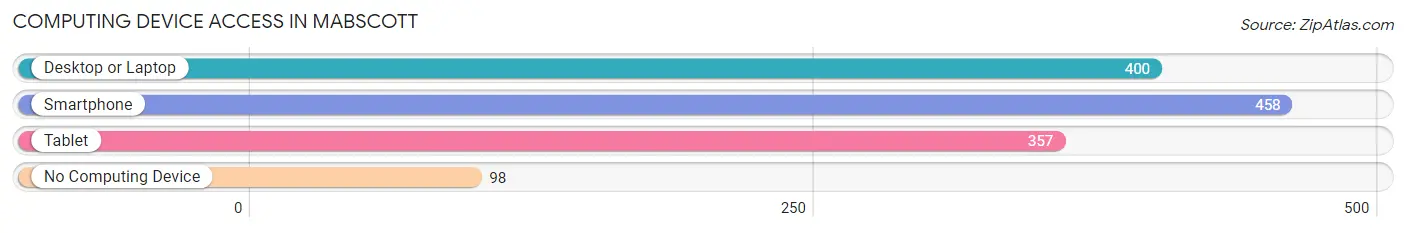
| Device Type | # Households | % Households |
| Desktop or Laptop | 400 | 69.7% |
| Smartphone | 458 | 79.8% |
| Tablet | 357 | 62.2% |
| No Computing Device | 98 | 17.1% |
| Total | 574 | 100.0% |
Internet Access in Mabscott
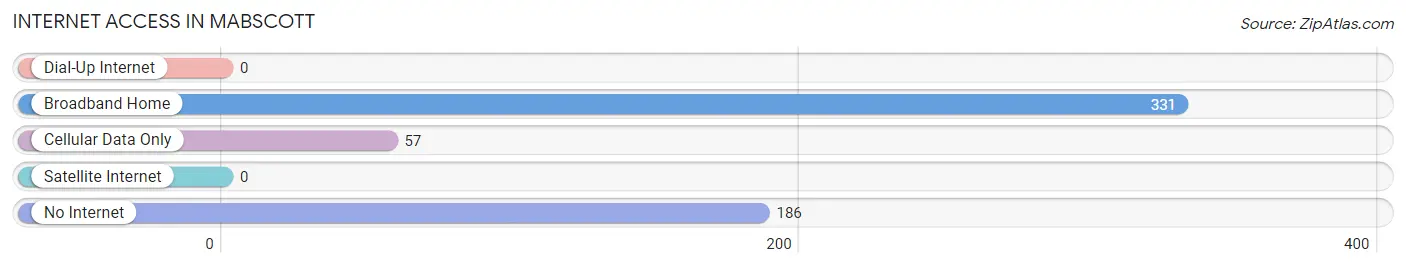
| Internet Type | # Households | % Households |
| Dial-Up Internet | 0 | 0.0% |
| Broadband Home | 331 | 57.7% |
| Cellular Data Only | 57 | 9.9% |
| Satellite Internet | 0 | 0.0% |
| No Internet | 186 | 32.4% |
| Total | 574 | 100.0% |
Mabscott Summary
Mabscott is a small town located in Raleigh County, West Virginia. It is situated in the Appalachian Mountains and is part of the Beckley-Raleigh County Metropolitan Statistical Area. The town was founded in 1891 and was named after the Mabscott Coal Company. The population of Mabscott was 1,845 as of the 2010 census.
History
Mabscott was founded in 1891 by the Mabscott Coal Company. The company was founded by William Mabscott, who was a coal operator from England. The town was originally known as Mabscott Coal Company Town and was home to many of the company’s employees. The town was incorporated in 1909 and was named after William Mabscott.
The town was a major coal mining center in the early 20th century. The coal industry in Mabscott declined in the 1950s and 1960s as the demand for coal decreased. The town’s population decreased as well, and by the 1970s, the town was mostly abandoned.
In the late 1970s, the town was revitalized by the efforts of local residents. The town was designated as a historic district in 1979 and was listed on the National Register of Historic Places in 1980.
Geography
Mabscott is located in Raleigh County, West Virginia. It is situated in the Appalachian Mountains and is part of the Beckley-Raleigh County Metropolitan Statistical Area. The town is located at an elevation of 1,845 feet above sea level.
The town is located near the New River Gorge National River, which is a popular destination for whitewater rafting and other outdoor activities. The town is also located near the Bluestone National Scenic River, which is a popular destination for fishing and other outdoor activities.
Economy
The economy of Mabscott is largely based on tourism. The town is home to several tourist attractions, including the New River Gorge National River, the Bluestone National Scenic River, and the Mabscott Historic District. The town is also home to several restaurants, shops, and other businesses.
The town is also home to several manufacturing companies, including a furniture manufacturer, a plastics manufacturer, and a metal fabrication company. The town is also home to several coal mines, which provide employment for many of the town’s residents.
Demographics
As of the 2010 census, the population of Mabscott was 1,845. The racial makeup of the town was 95.3% White, 2.2% African American, 0.2% Native American, 0.2% Asian, 0.1% Pacific Islander, 0.7% from other races, and 1.3% from two or more races. Hispanic or Latino of any race were 1.3% of the population.
The median household income in Mabscott was $30,938, and the median family income was $37,813. The per capita income in Mabscott was $17,845. About 17.3% of the population was below the poverty line.
Conclusion
Mabscott is a small town located in Raleigh County, West Virginia. It was founded in 1891 and was named after the Mabscott Coal Company. The town was a major coal mining center in the early 20th century, but the industry declined in the 1950s and 1960s. The town was revitalized in the late 1970s and was designated as a historic district in 1979. The economy of Mabscott is largely based on tourism, and the town is home to several tourist attractions, restaurants, shops, and other businesses. The population of Mabscott was 1,845 as of the 2010 census.
Common Questions
What is the Total Population of Mabscott?
Total Population of Mabscott is 1,550.
What is the Total Male Population of Mabscott?
Total Male Population of Mabscott is 714.
What is the Total Female Population of Mabscott?
Total Female Population of Mabscott is 836.
What is the Ratio of Males per 100 Females in Mabscott?
There are 85.41 Males per 100 Females in Mabscott.
What is the Ratio of Females per 100 Males in Mabscott?
There are 117.09 Females per 100 Males in Mabscott.
What is the Median Population Age in Mabscott?
Median Population Age in Mabscott is 33.4 Years.
What is the Average Family Size in Mabscott
Average Family Size in Mabscott is 3.5 People.
What is the Average Household Size in Mabscott
Average Household Size in Mabscott is 2.7 People.
What is Per Capita Income in Mabscott?
Per Capita income in Mabscott is $24,114.
What is the Median Family Income in Mabscott?
Median Family Income in Mabscott is $65,000.
What is the Median Household income in Mabscott?
Median Household Income in Mabscott is $52,083.
What is Income or Wage Gap in Mabscott?
Income or Wage Gap in Mabscott is 48.7%.
Women in Mabscott earn 51.3 cents for every dollar earned by a man.
What is Inequality or Gini Index in Mabscott?
Inequality or Gini Index in Mabscott is 0.46.
How Large is the Labor Force in Mabscott?
There are 590 People in the Labor Forcein in Mabscott.
What is the Percentage of People in the Labor Force in Mabscott?
53.8% of People are in the Labor Force in Mabscott.
What is the Unemployment Rate in Mabscott?
Unemployment Rate in Mabscott is 2.2%.