Teays Valley, WV
Teays Valley Map
Teays Valley Overview
13,816
TOTAL POPULATION
6,915
MALE POPULATION
6,901
FEMALE POPULATION
100.20
MALES / 100 FEMALES
99.80
FEMALES / 100 MALES
42.4
MEDIAN AGE
3.0
AVG FAMILY SIZE
2.5
AVG HOUSEHOLD SIZE
$47,520
PER CAPITA INCOME
$110,469
AVG FAMILY INCOME
$102,349
AVG HOUSEHOLD INCOME
35.8%
WAGE / INCOME GAP [ % ]
64.2¢/ $1
WAGE / INCOME GAP [ $ ]
$16,541
FAMILY INCOME DEFICIT
0.39
INEQUALITY / GINI INDEX
6,884
LABOR FORCE [ PEOPLE ]
62.5%
PERCENT IN LABOR FORCE
3.4%
UNEMPLOYMENT RATE
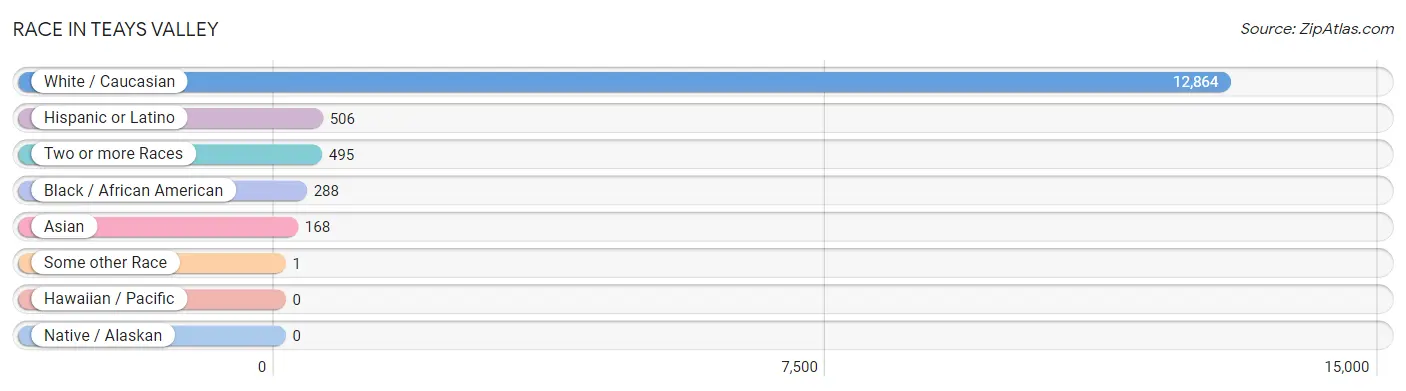
Race in Teays Valley
The most populous races in Teays Valley are White / Caucasian (12,864 | 93.1%), Hispanic or Latino (506 | 3.7%), and Two or more Races (495 | 3.6%).
| Race | # Population | % Population |
| Asian | 168 | 1.2% |
| Black / African American | 288 | 2.1% |
| Hawaiian / Pacific | 0 | 0.0% |
| Hispanic or Latino | 506 | 3.7% |
| Native / Alaskan | 0 | 0.0% |
| White / Caucasian | 12,864 | 93.1% |
| Two or more Races | 495 | 3.6% |
| Some other Race | 1 | 0.0% |
| Total | 13,816 | 100.0% |
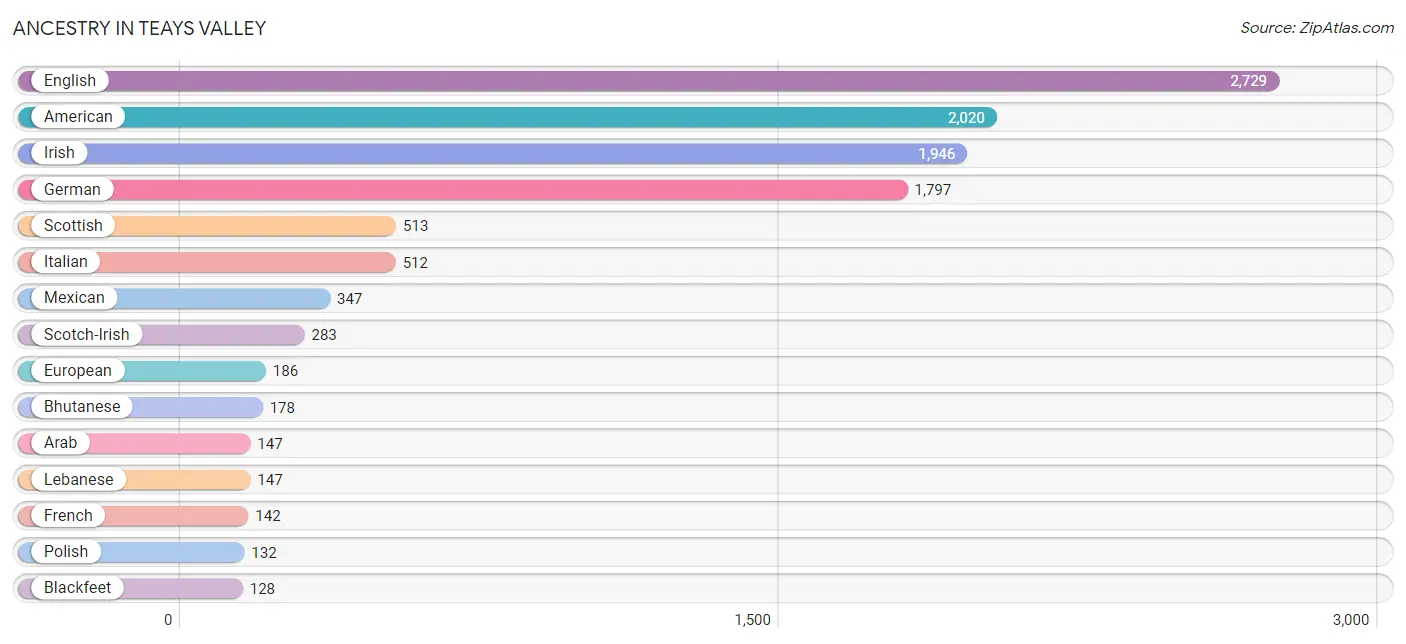
Ancestry in Teays Valley
The most populous ancestries reported in Teays Valley are English (2,729 | 19.8%), American (2,020 | 14.6%), Irish (1,946 | 14.1%), German (1,797 | 13.0%), and Scottish (513 | 3.7%), together accounting for 65.2% of all Teays Valley residents.
| Ancestry | # Population | % Population |
| African | 26 | 0.2% |
| American | 2,020 | 14.6% |
| Arab | 147 | 1.1% |
| Bhutanese | 178 | 1.3% |
| Blackfeet | 128 | 0.9% |
| Burmese | 47 | 0.3% |
| Cherokee | 21 | 0.2% |
| Cuban | 31 | 0.2% |
| Czech | 9 | 0.1% |
| Czechoslovakian | 12 | 0.1% |
| Dutch | 83 | 0.6% |
| Eastern European | 12 | 0.1% |
| English | 2,729 | 19.8% |
| European | 186 | 1.3% |
| French | 142 | 1.0% |
| French Canadian | 14 | 0.1% |
| German | 1,797 | 13.0% |
| Greek | 37 | 0.3% |
| Guyanese | 28 | 0.2% |
| Irish | 1,946 | 14.1% |
| Italian | 512 | 3.7% |
| Korean | 69 | 0.5% |
| Laotian | 18 | 0.1% |
| Lebanese | 147 | 1.1% |
| Mexican | 347 | 2.5% |
| Nigerian | 12 | 0.1% |
| Northern European | 12 | 0.1% |
| Polish | 132 | 1.0% |
| Puerto Rican | 128 | 0.9% |
| Scandinavian | 52 | 0.4% |
| Scotch-Irish | 283 | 2.1% |
| Scottish | 513 | 3.7% |
| Slovak | 35 | 0.3% |
| Subsaharan African | 38 | 0.3% |
| Swedish | 21 | 0.2% |
| Swiss | 43 | 0.3% |
| Thai | 46 | 0.3% |
| Ukrainian | 8 | 0.1% |
| Welsh | 90 | 0.6% | View All 39 Rows |
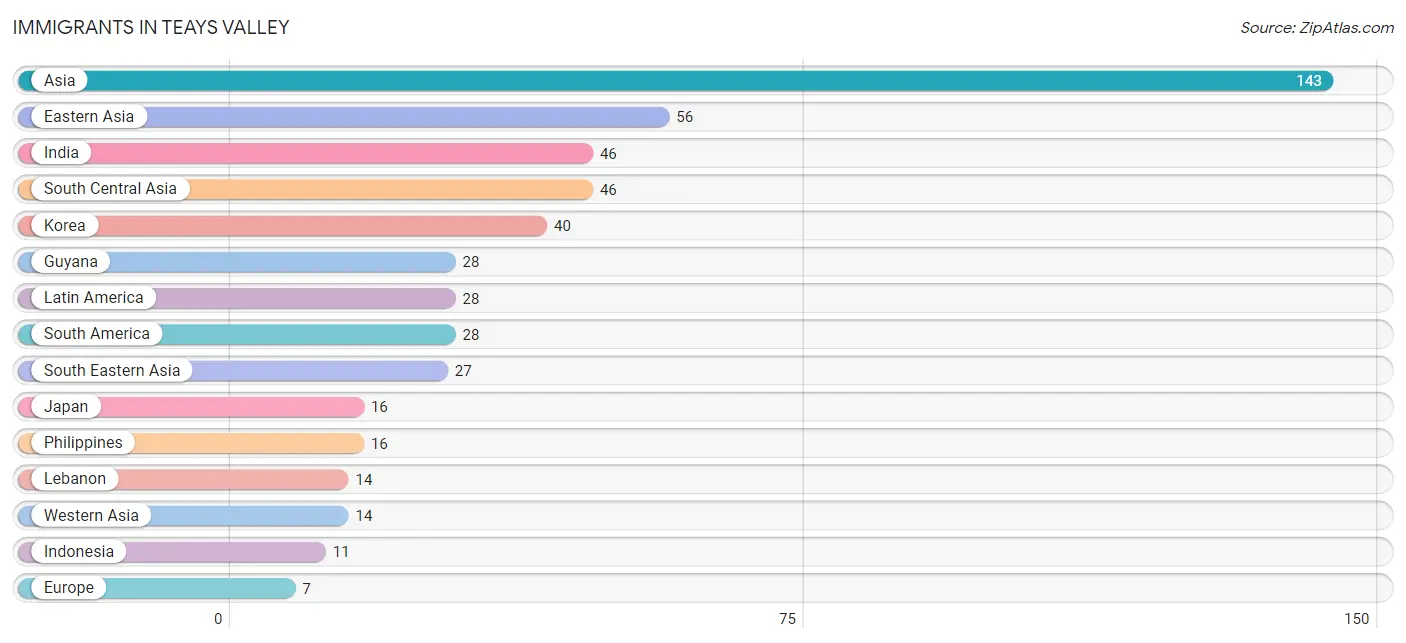
Immigrants in Teays Valley
The most numerous immigrant groups reported in Teays Valley came from Asia (143 | 1.0%), Eastern Asia (56 | 0.4%), India (46 | 0.3%), South Central Asia (46 | 0.3%), and Korea (40 | 0.3%), together accounting for 2.4% of all Teays Valley residents.
| Immigration Origin | # Population | % Population |
| Asia | 143 | 1.0% |
| Eastern Asia | 56 | 0.4% |
| Europe | 7 | 0.1% |
| Germany | 7 | 0.1% |
| Guyana | 28 | 0.2% |
| India | 46 | 0.3% |
| Indonesia | 11 | 0.1% |
| Japan | 16 | 0.1% |
| Korea | 40 | 0.3% |
| Latin America | 28 | 0.2% |
| Lebanon | 14 | 0.1% |
| Philippines | 16 | 0.1% |
| South America | 28 | 0.2% |
| South Central Asia | 46 | 0.3% |
| South Eastern Asia | 27 | 0.2% |
| Western Asia | 14 | 0.1% |
| Western Europe | 7 | 0.1% | View All 17 Rows |
Sex and Age in Teays Valley
Sex and Age in Teays Valley
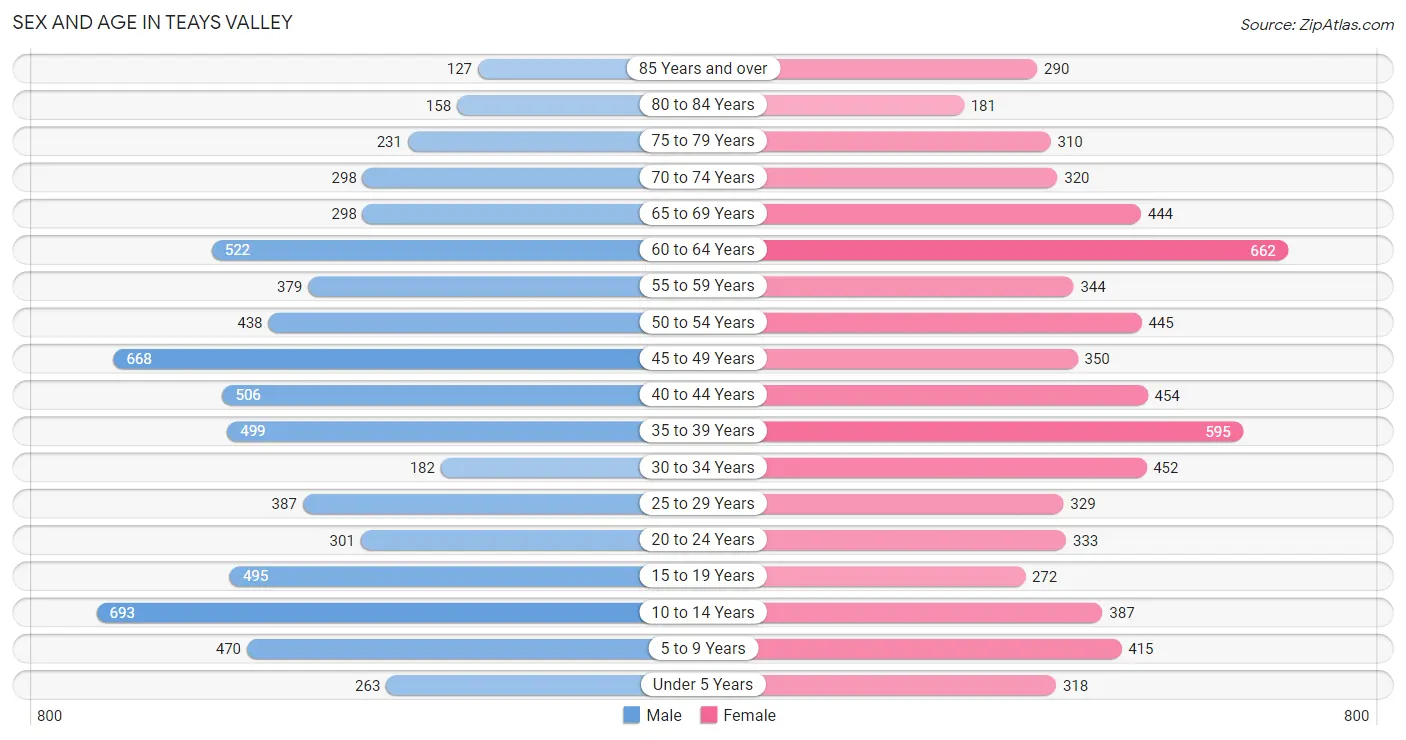
The most populous age groups in Teays Valley are 10 to 14 Years (693 | 10.0%) for men and 60 to 64 Years (662 | 9.6%) for women.
| Age Bracket | Male | Female |
| Under 5 Years | 263 (3.8%) | 318 (4.6%) |
| 5 to 9 Years | 470 (6.8%) | 415 (6.0%) |
| 10 to 14 Years | 693 (10.0%) | 387 (5.6%) |
| 15 to 19 Years | 495 (7.2%) | 272 (3.9%) |
| 20 to 24 Years | 301 (4.3%) | 333 (4.8%) |
| 25 to 29 Years | 387 (5.6%) | 329 (4.8%) |
| 30 to 34 Years | 182 (2.6%) | 452 (6.6%) |
| 35 to 39 Years | 499 (7.2%) | 595 (8.6%) |
| 40 to 44 Years | 506 (7.3%) | 454 (6.6%) |
| 45 to 49 Years | 668 (9.7%) | 350 (5.1%) |
| 50 to 54 Years | 438 (6.3%) | 445 (6.5%) |
| 55 to 59 Years | 379 (5.5%) | 344 (5.0%) |
| 60 to 64 Years | 522 (7.5%) | 662 (9.6%) |
| 65 to 69 Years | 298 (4.3%) | 444 (6.4%) |
| 70 to 74 Years | 298 (4.3%) | 320 (4.6%) |
| 75 to 79 Years | 231 (3.3%) | 310 (4.5%) |
| 80 to 84 Years | 158 (2.3%) | 181 (2.6%) |
| 85 Years and over | 127 (1.8%) | 290 (4.2%) |
| Total | 6,915 (100.0%) | 6,901 (100.0%) |
Families and Households in Teays Valley
Median Family Size in Teays Valley
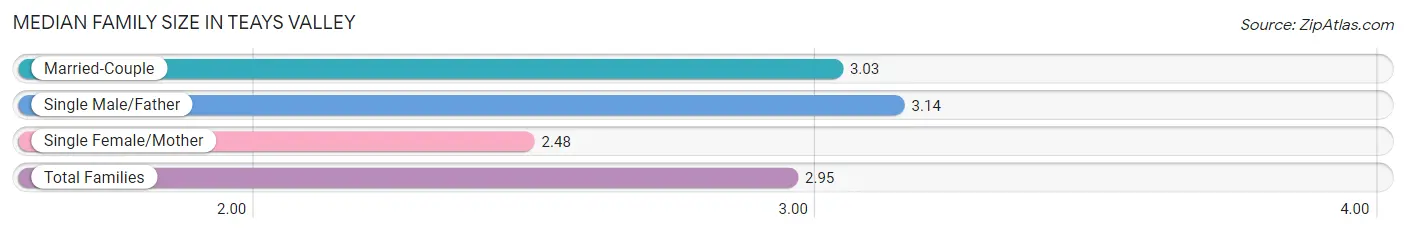
The median family size in Teays Valley is 2.95 persons per family, with single male/father families (194 | 4.8%) accounting for the largest median family size of 3.14 persons per family. On the other hand, single female/mother families (643 | 16.0%) represent the smallest median family size with 2.48 persons per family.
| Family Type | # Families | Family Size |
| Married-Couple | 3,171 (79.1%) | 3.03 |
| Single Male/Father | 194 (4.8%) | 3.14 |
| Single Female/Mother | 643 (16.0%) | 2.48 |
| Total Families | 4,008 (100.0%) | 2.95 |
Median Household Size in Teays Valley
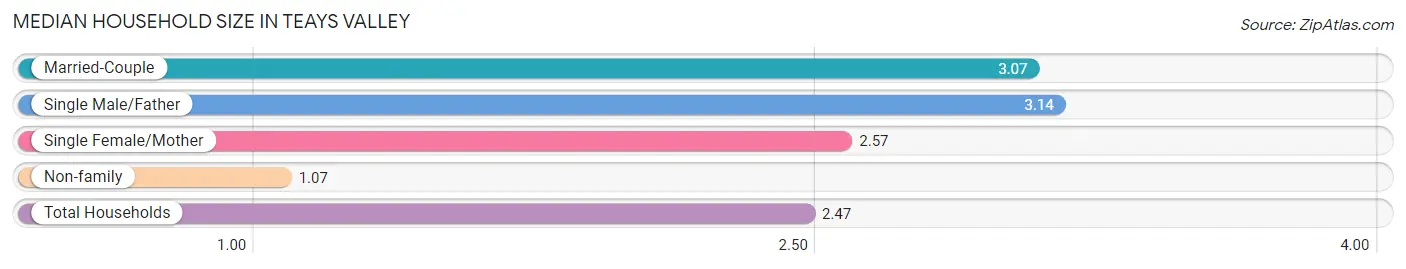
The median household size in Teays Valley is 2.47 persons per household, with single male/father households (194 | 3.5%) accounting for the largest median household size of 3.14 persons per household. non-family households (1,509 | 27.4%) represent the smallest median household size with 1.07 persons per household.
| Household Type | # Households | Household Size |
| Married-Couple | 3,171 (57.5%) | 3.07 |
| Single Male/Father | 194 (3.5%) | 3.14 |
| Single Female/Mother | 643 (11.7%) | 2.57 |
| Non-family | 1,509 (27.4%) | 1.07 |
| Total Households | 5,517 (100.0%) | 2.47 |
Household Size by Marriage Status in Teays Valley
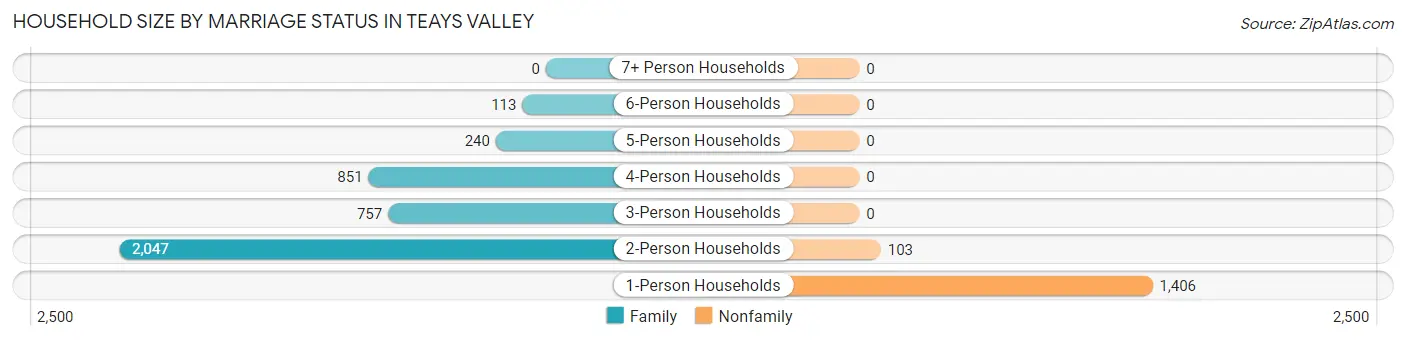
Out of a total of 5,517 households in Teays Valley, 4,008 (72.7%) are family households, while 1,509 (27.4%) are nonfamily households. The most numerous type of family households are 2-person households, comprising 2,047, and the most common type of nonfamily households are 1-person households, comprising 1,406.
| Household Size | Family Households | Nonfamily Households |
| 1-Person Households | - | 1,406 (25.5%) |
| 2-Person Households | 2,047 (37.1%) | 103 (1.9%) |
| 3-Person Households | 757 (13.7%) | 0 (0.0%) |
| 4-Person Households | 851 (15.4%) | 0 (0.0%) |
| 5-Person Households | 240 (4.3%) | 0 (0.0%) |
| 6-Person Households | 113 (2.1%) | 0 (0.0%) |
| 7+ Person Households | 0 (0.0%) | 0 (0.0%) |
| Total | 4,008 (72.7%) | 1,509 (27.4%) |
Female Fertility in Teays Valley
Fertility by Age in Teays Valley
Average fertility rate in Teays Valley is 115.0 births per 1,000 women. Women in the age bracket of 15 to 19 years have the highest fertility rate with 210.0 births per 1,000 women. Women in the age bracket of 20 to 34 years acount for 68.9% of all women with births.
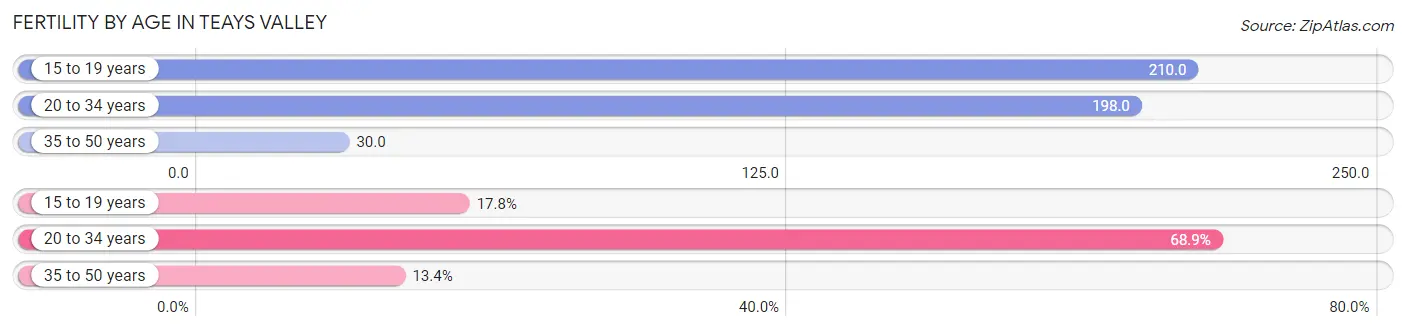
| Age Bracket | Women with Births | Births / 1,000 Women |
| 15 to 19 years | 57 (17.8%) | 210.0 |
| 20 to 34 years | 221 (68.9%) | 198.0 |
| 35 to 50 years | 43 (13.4%) | 30.0 |
| Total | 321 (100.0%) | 115.0 |
Fertility by Age by Marriage Status in Teays Valley
52.0% of women with births (321) in Teays Valley are married. The highest percentage of unmarried women with births falls into 15 to 19 years age bracket with 100.0% of them unmarried at the time of birth, while the lowest percentage of unmarried women with births belong to 35 to 50 years age bracket with 0.0% of them unmarried.
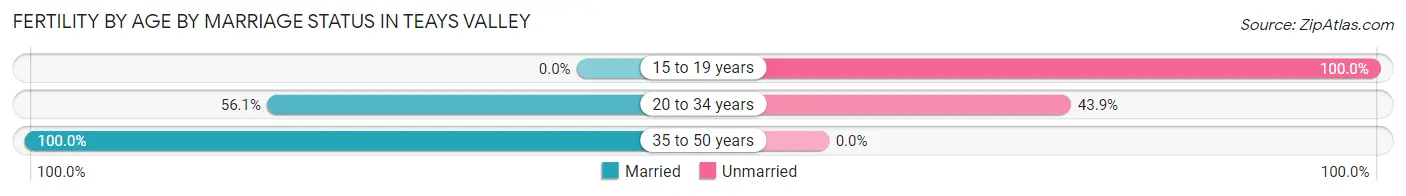
| Age Bracket | Married | Unmarried |
| 15 to 19 years | 0 (0.0%) | 57 (100.0%) |
| 20 to 34 years | 124 (56.1%) | 97 (43.9%) |
| 35 to 50 years | 43 (100.0%) | 0 (0.0%) |
| Total | 167 (52.0%) | 154 (48.0%) |
Fertility by Education in Teays Valley
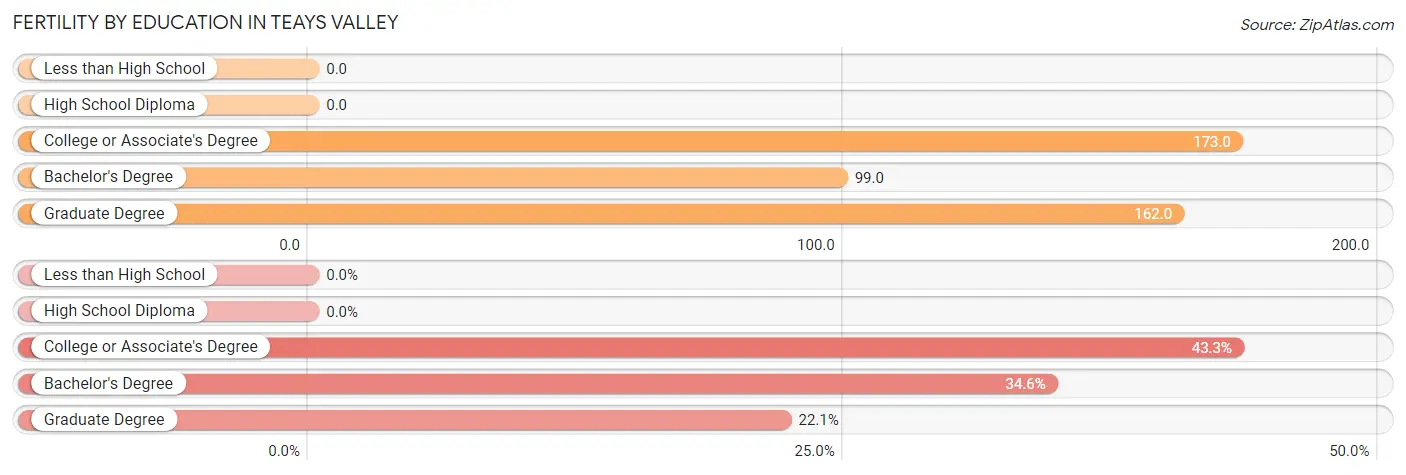
| Educational Attainment | Women with Births | Births / 1,000 Women |
| Less than High School | 0 (0.0%) | 0.0 |
| High School Diploma | 0 (0.0%) | 0.0 |
| College or Associate's Degree | 139 (43.3%) | 173.0 |
| Bachelor's Degree | 111 (34.6%) | 99.0 |
| Graduate Degree | 71 (22.1%) | 162.0 |
| Total | 321 (100.0%) | 115.0 |
Fertility by Education by Marriage Status in Teays Valley
48.0% of women with births in Teays Valley are unmarried. Women with the educational attainment of graduate degree are most likely to be married with 100.0% of them married at childbirth, while women with the educational attainment of college or associate's degree are least likely to be married with 100.0% of them unmarried at childbirth.
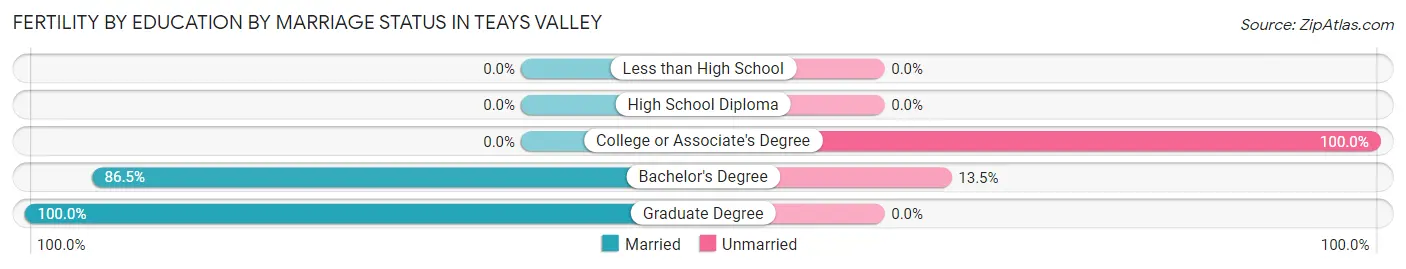
| Educational Attainment | Married | Unmarried |
| Less than High School | 0 (0.0%) | 0 (0.0%) |
| High School Diploma | 0 (0.0%) | 0 (0.0%) |
| College or Associate's Degree | 0 (0.0%) | 139 (100.0%) |
| Bachelor's Degree | 96 (86.5%) | 15 (13.5%) |
| Graduate Degree | 71 (100.0%) | 0 (0.0%) |
| Total | 167 (52.0%) | 154 (48.0%) |
Income in Teays Valley
Income Overview in Teays Valley
Per Capita Income in Teays Valley is $47,520, while median incomes of families and households are $110,469 and $102,349 respectively.
| Characteristic | Number | Measure |
| Per Capita Income | 13,816 | $47,520 |
| Median Family Income | 4,008 | $110,469 |
| Mean Family Income | 4,008 | $129,773 |
| Median Household Income | 5,517 | $102,349 |
| Mean Household Income | 5,517 | $113,275 |
| Income Deficit | 4,008 | $16,541 |
| Wage / Income Gap (%) | 13,816 | 35.80% |
| Wage / Income Gap ($) | 13,816 | 64.20¢ per $1 |
| Gini / Inequality Index | 13,816 | 0.39 |
Earnings by Sex in Teays Valley
Average Earnings in Teays Valley are $62,626, $80,163 for men and $51,464 for women, a difference of 35.8%.
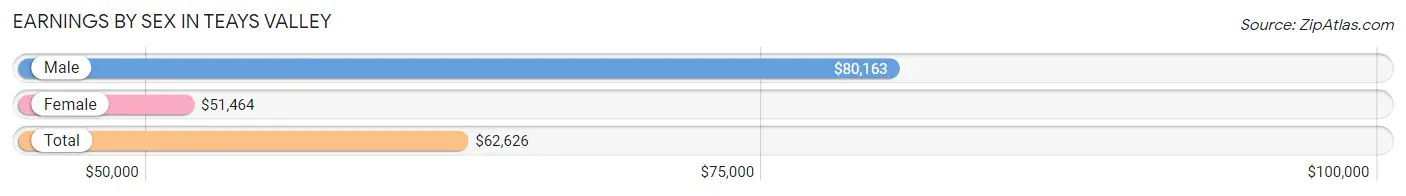
| Sex | Number | Average Earnings |
| Male | 3,686 (52.9%) | $80,163 |
| Female | 3,283 (47.1%) | $51,464 |
| Total | 6,969 (100.0%) | $62,626 |
Earnings by Sex by Income Bracket in Teays Valley
The most common earnings brackets in Teays Valley are $100,000+ for men (1,271 | 34.5%) and $55,000 to $64,999 for women (475 | 14.5%).
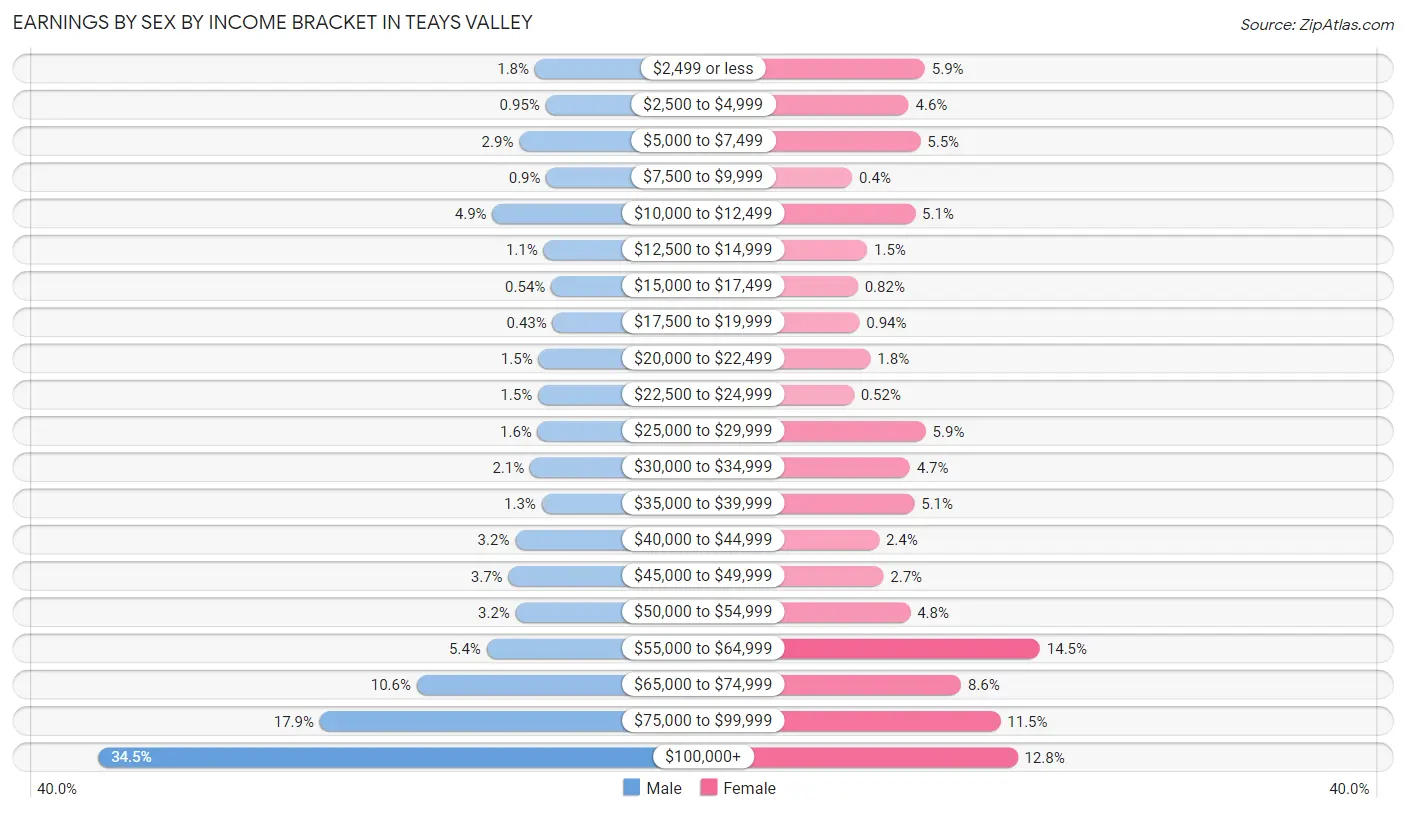
| Income | Male | Female |
| $2,499 or less | 65 (1.8%) | 192 (5.9%) |
| $2,500 to $4,999 | 35 (0.9%) | 152 (4.6%) |
| $5,000 to $7,499 | 108 (2.9%) | 181 (5.5%) |
| $7,500 to $9,999 | 33 (0.9%) | 13 (0.4%) |
| $10,000 to $12,499 | 182 (4.9%) | 168 (5.1%) |
| $12,500 to $14,999 | 41 (1.1%) | 50 (1.5%) |
| $15,000 to $17,499 | 20 (0.5%) | 27 (0.8%) |
| $17,500 to $19,999 | 16 (0.4%) | 31 (0.9%) |
| $20,000 to $22,499 | 55 (1.5%) | 58 (1.8%) |
| $22,500 to $24,999 | 56 (1.5%) | 17 (0.5%) |
| $25,000 to $29,999 | 57 (1.5%) | 194 (5.9%) |
| $30,000 to $34,999 | 78 (2.1%) | 155 (4.7%) |
| $35,000 to $39,999 | 46 (1.3%) | 166 (5.1%) |
| $40,000 to $44,999 | 119 (3.2%) | 79 (2.4%) |
| $45,000 to $49,999 | 138 (3.7%) | 90 (2.7%) |
| $50,000 to $54,999 | 118 (3.2%) | 156 (4.8%) |
| $55,000 to $64,999 | 198 (5.4%) | 475 (14.5%) |
| $65,000 to $74,999 | 391 (10.6%) | 281 (8.6%) |
| $75,000 to $99,999 | 659 (17.9%) | 378 (11.5%) |
| $100,000+ | 1,271 (34.5%) | 420 (12.8%) |
| Total | 3,686 (100.0%) | 3,283 (100.0%) |
Earnings by Sex by Educational Attainment in Teays Valley
Average earnings in Teays Valley are $84,484 for men and $56,439 for women, a difference of 33.2%. Men with an educational attainment of graduate degree enjoy the highest average annual earnings of $128,469, while those with high school diploma education earn the least with $48,750. Women with an educational attainment of graduate degree earn the most with the average annual earnings of $71,786, while those with college or associate's degree education have the smallest earnings of $26,362.
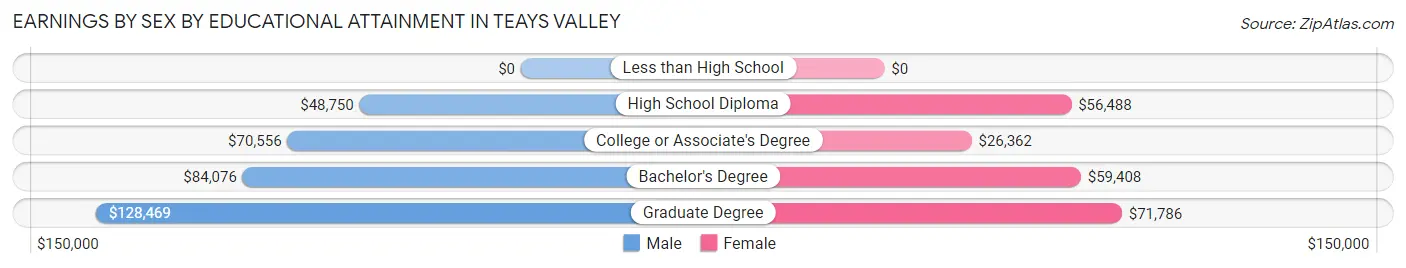
| Educational Attainment | Male Income | Female Income |
| Less than High School | - | - |
| High School Diploma | $48,750 | $56,488 |
| College or Associate's Degree | $70,556 | $26,362 |
| Bachelor's Degree | $84,076 | $59,408 |
| Graduate Degree | $128,469 | $71,786 |
| Total | $84,484 | $56,439 |
Family Income in Teays Valley
Family Income Brackets in Teays Valley
According to the Teays Valley family income data, there are 1,267 families falling into the $100,000 to $149,999 income range, which is the most common income bracket and makes up 31.6% of all families. Conversely, the $25,000 to $34,999 income bracket is the least frequent group with only 12 families (0.3%) belonging to this category.
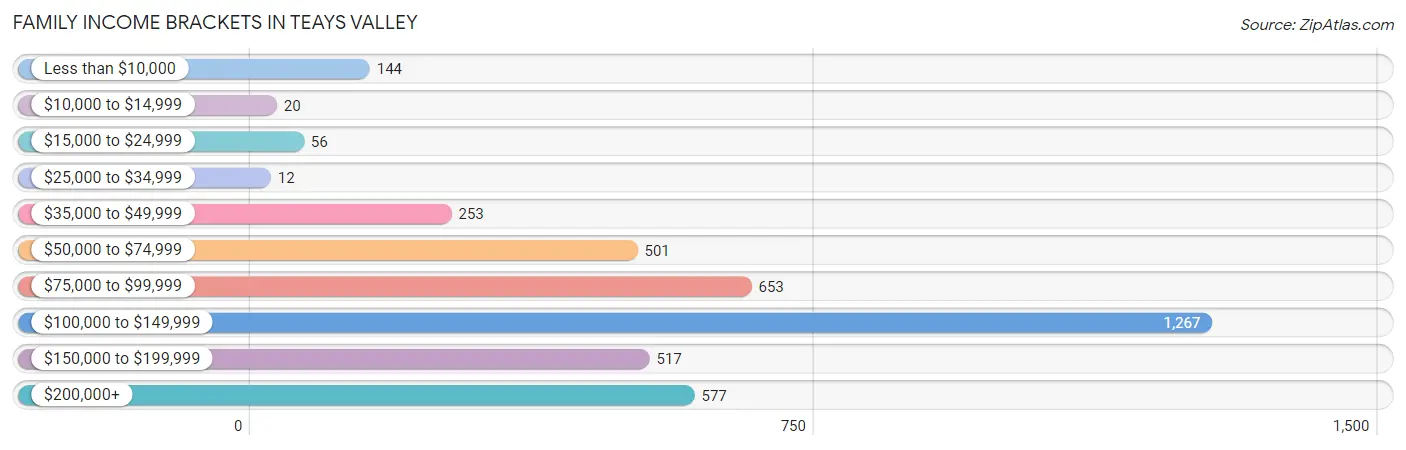
| Income Bracket | # Families | % Families |
| Less than $10,000 | 144 | 3.6% |
| $10,000 to $14,999 | 20 | 0.5% |
| $15,000 to $24,999 | 56 | 1.4% |
| $25,000 to $34,999 | 12 | 0.3% |
| $35,000 to $49,999 | 253 | 6.3% |
| $50,000 to $74,999 | 501 | 12.5% |
| $75,000 to $99,999 | 653 | 16.3% |
| $100,000 to $149,999 | 1,267 | 31.6% |
| $150,000 to $199,999 | 517 | 12.9% |
| $200,000+ | 577 | 14.4% |
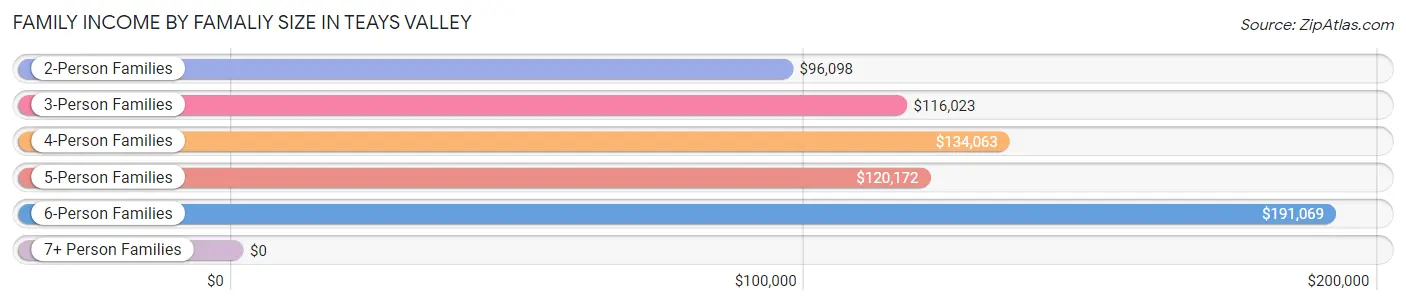
Family Income by Famaliy Size in Teays Valley
6-person families (113 | 2.8%) account for the highest median family income in Teays Valley with $191,069 per family, while 2-person families (2,069 | 51.6%) have the highest median income of $48,049 per family member.
| Income Bracket | # Families | Median Income |
| 2-Person Families | 2,069 (51.6%) | $96,098 |
| 3-Person Families | 831 (20.7%) | $116,023 |
| 4-Person Families | 755 (18.8%) | $134,063 |
| 5-Person Families | 240 (6.0%) | $120,172 |
| 6-Person Families | 113 (2.8%) | $191,069 |
| 7+ Person Families | 0 (0.0%) | $0 |
| Total | 4,008 (100.0%) | $110,469 |
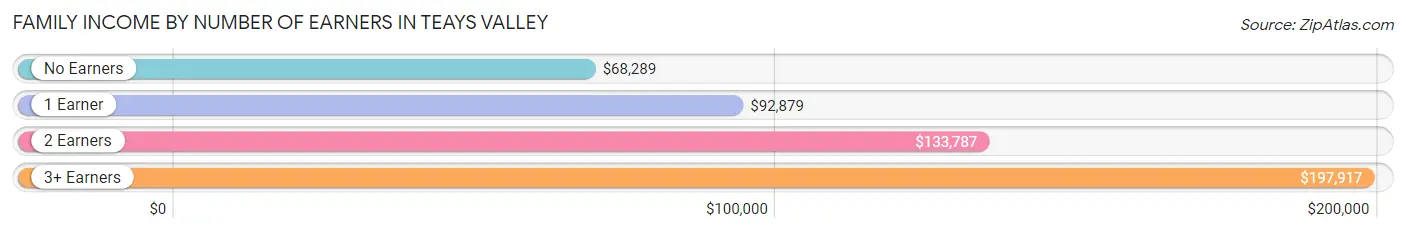
Family Income by Number of Earners in Teays Valley
The median family income in Teays Valley is $110,469, with families comprising 3+ earners (285) having the highest median family income of $197,917, while families with no earners (856) have the lowest median family income of $68,289, accounting for 7.1% and 21.4% of families, respectively.
| Number of Earners | # Families | Median Income |
| No Earners | 856 (21.4%) | $68,289 |
| 1 Earner | 1,342 (33.5%) | $92,879 |
| 2 Earners | 1,525 (38.1%) | $133,787 |
| 3+ Earners | 285 (7.1%) | $197,917 |
| Total | 4,008 (100.0%) | $110,469 |
Household Income in Teays Valley
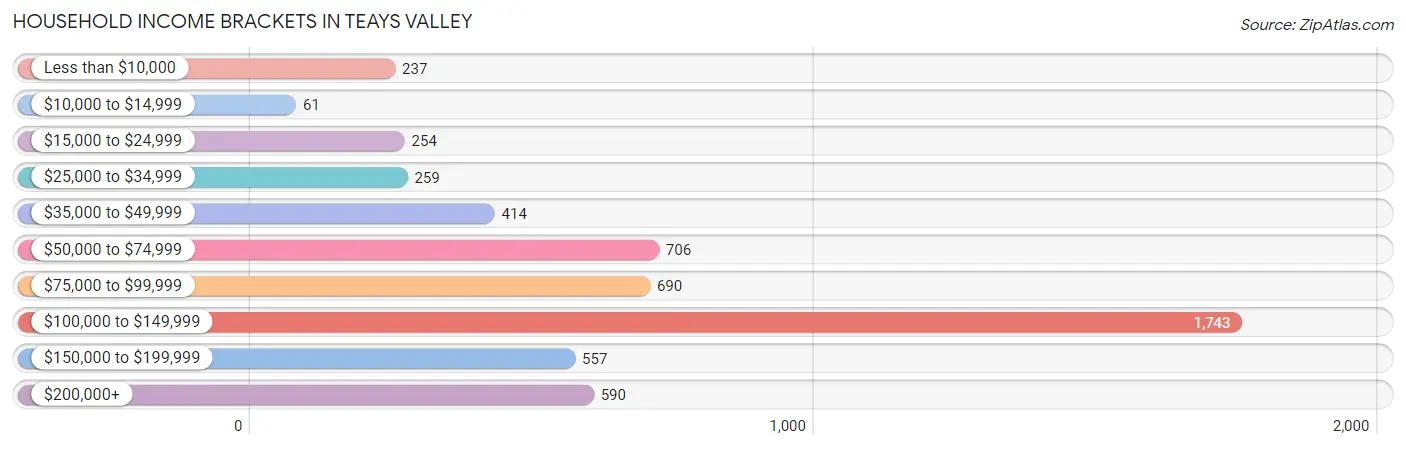
Household Income Brackets in Teays Valley
With 1,743 households falling in the category, the $100,000 to $149,999 income range is the most frequent in Teays Valley, accounting for 31.6% of all households. In contrast, only 61 households (1.1%) fall into the $10,000 to $14,999 income bracket, making it the least populous group.
| Income Bracket | # Households | % Households |
| Less than $10,000 | 237 | 4.3% |
| $10,000 to $14,999 | 61 | 1.1% |
| $15,000 to $24,999 | 254 | 4.6% |
| $25,000 to $34,999 | 259 | 4.7% |
| $35,000 to $49,999 | 414 | 7.5% |
| $50,000 to $74,999 | 706 | 12.8% |
| $75,000 to $99,999 | 690 | 12.5% |
| $100,000 to $149,999 | 1,743 | 31.6% |
| $150,000 to $199,999 | 557 | 10.1% |
| $200,000+ | 590 | 10.7% |
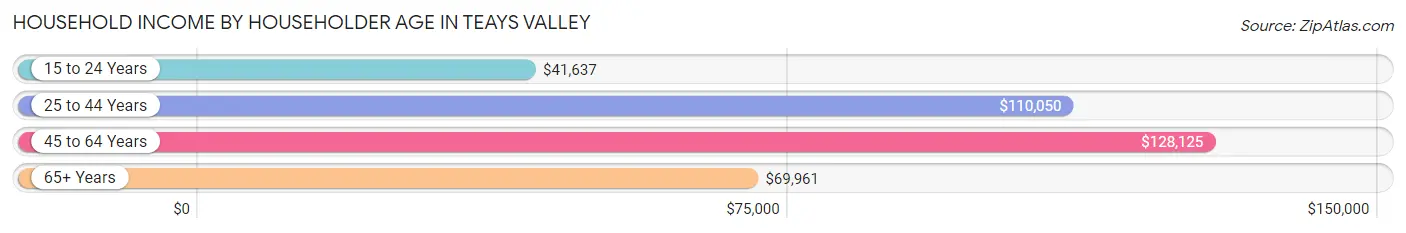
Household Income by Householder Age in Teays Valley
The median household income in Teays Valley is $102,349, with the highest median household income of $128,125 found in the 45 to 64 years age bracket for the primary householder. A total of 2,066 households (37.4%) fall into this category. Meanwhile, the 15 to 24 years age bracket for the primary householder has the lowest median household income of $41,637, with 181 households (3.3%) in this group.
| Income Bracket | # Households | Median Income |
| 15 to 24 Years | 181 (3.3%) | $41,637 |
| 25 to 44 Years | 1,699 (30.8%) | $110,050 |
| 45 to 64 Years | 2,066 (37.4%) | $128,125 |
| 65+ Years | 1,571 (28.5%) | $69,961 |
| Total | 5,517 (100.0%) | $102,349 |
Poverty in Teays Valley
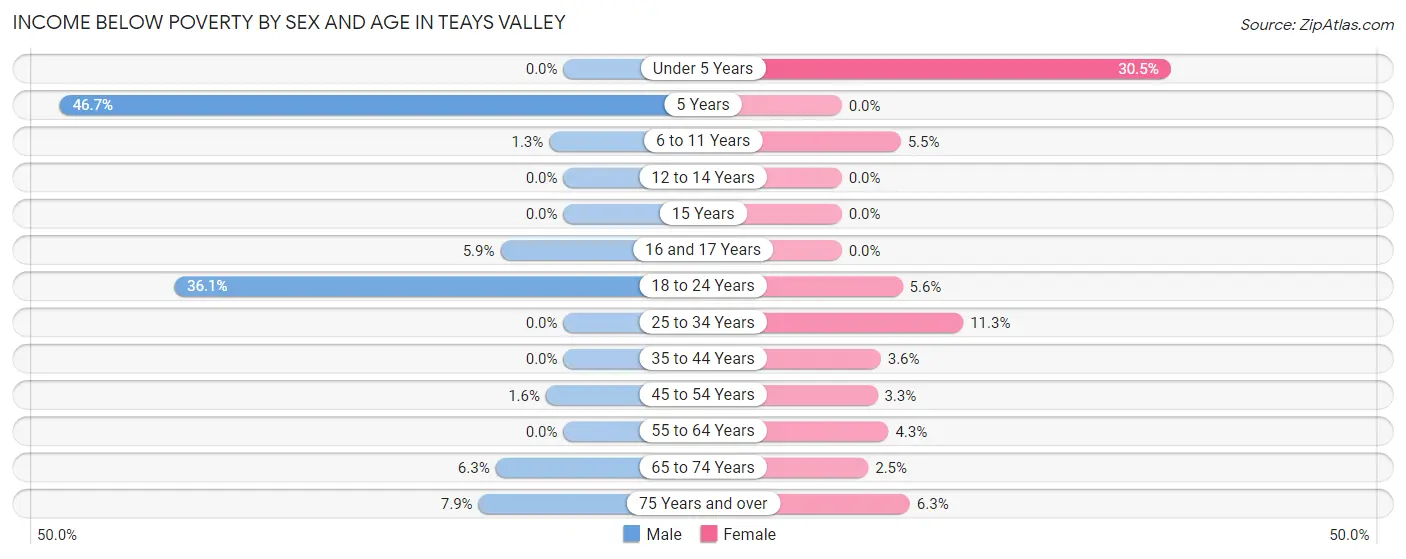
Income Below Poverty by Sex and Age in Teays Valley
With 4.5% poverty level for males and 6.0% for females among the residents of Teays Valley, 5 year old males and under 5 year old females are the most vulnerable to poverty, with 43 males (46.7%) and 97 females (30.5%) in their respective age groups living below the poverty level.
| Age Bracket | Male | Female |
| Under 5 Years | 0 (0.0%) | 97 (30.5%) |
| 5 Years | 43 (46.7%) | 0 (0.0%) |
| 6 to 11 Years | 8 (1.3%) | 26 (5.5%) |
| 12 to 14 Years | 0 (0.0%) | 0 (0.0%) |
| 15 Years | 0 (0.0%) | 0 (0.0%) |
| 16 and 17 Years | 11 (5.9%) | 0 (0.0%) |
| 18 to 24 Years | 151 (36.1%) | 27 (5.6%) |
| 25 to 34 Years | 0 (0.0%) | 88 (11.3%) |
| 35 to 44 Years | 0 (0.0%) | 38 (3.6%) |
| 45 to 54 Years | 18 (1.6%) | 26 (3.3%) |
| 55 to 64 Years | 0 (0.0%) | 43 (4.3%) |
| 65 to 74 Years | 36 (6.3%) | 18 (2.5%) |
| 75 Years and over | 39 (7.9%) | 43 (6.3%) |
| Total | 306 (4.5%) | 406 (6.0%) |
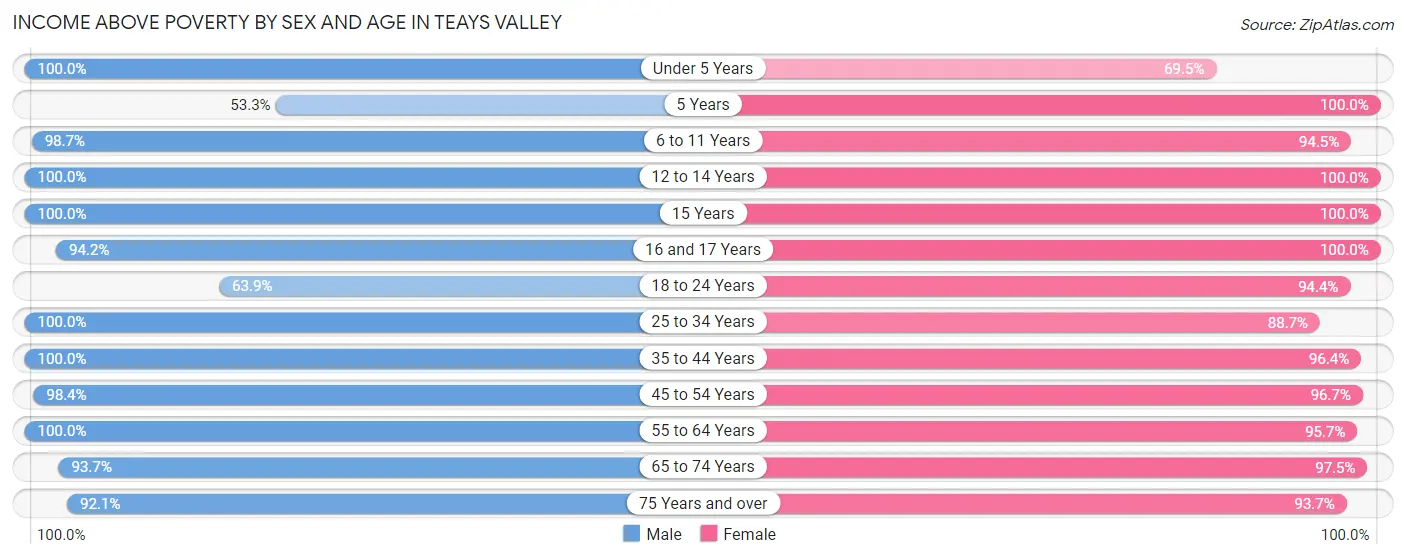
Income Above Poverty by Sex and Age in Teays Valley
According to the poverty statistics in Teays Valley, males aged under 5 years and females aged 5 years are the age groups that are most secure financially, with 100.0% of males and 100.0% of females in these age groups living above the poverty line.
| Age Bracket | Male | Female |
| Under 5 Years | 263 (100.0%) | 221 (69.5%) |
| 5 Years | 49 (53.3%) | 128 (100.0%) |
| 6 to 11 Years | 599 (98.7%) | 449 (94.5%) |
| 12 to 14 Years | 464 (100.0%) | 199 (100.0%) |
| 15 Years | 190 (100.0%) | 65 (100.0%) |
| 16 and 17 Years | 177 (94.2%) | 61 (100.0%) |
| 18 to 24 Years | 267 (63.9%) | 452 (94.4%) |
| 25 to 34 Years | 569 (100.0%) | 693 (88.7%) |
| 35 to 44 Years | 1,005 (100.0%) | 1,011 (96.4%) |
| 45 to 54 Years | 1,088 (98.4%) | 759 (96.7%) |
| 55 to 64 Years | 896 (100.0%) | 949 (95.7%) |
| 65 to 74 Years | 535 (93.7%) | 715 (97.5%) |
| 75 Years and over | 456 (92.1%) | 637 (93.7%) |
| Total | 6,558 (95.5%) | 6,339 (94.0%) |
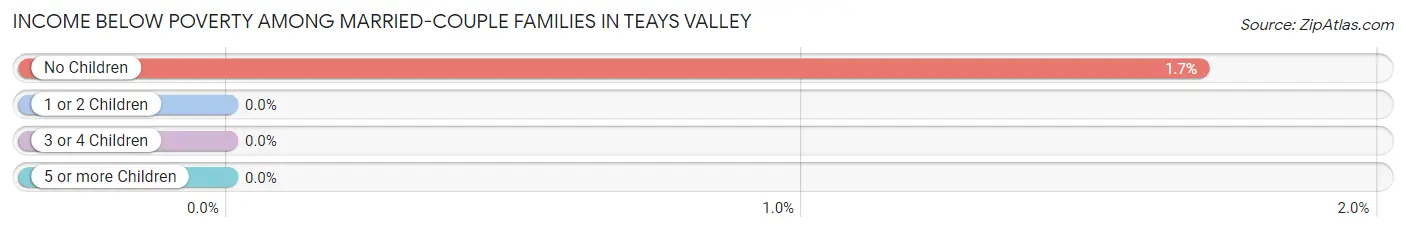
Income Below Poverty Among Married-Couple Families in Teays Valley
The poverty statistics for married-couple families in Teays Valley show that 1.0% or 31 of the total 3,171 families live below the poverty line. Families with no children have the highest poverty rate of 1.7%, comprising of 31 families. On the other hand, families with 1 or 2 children have the lowest poverty rate of 0.0%, which includes 0 families.
| Children | Above Poverty | Below Poverty |
| No Children | 1,808 (98.3%) | 31 (1.7%) |
| 1 or 2 Children | 1,048 (100.0%) | 0 (0.0%) |
| 3 or 4 Children | 284 (100.0%) | 0 (0.0%) |
| 5 or more Children | 0 (0.0%) | 0 (0.0%) |
| Total | 3,140 (99.0%) | 31 (1.0%) |
Income Below Poverty Among Single-Parent Households in Teays Valley
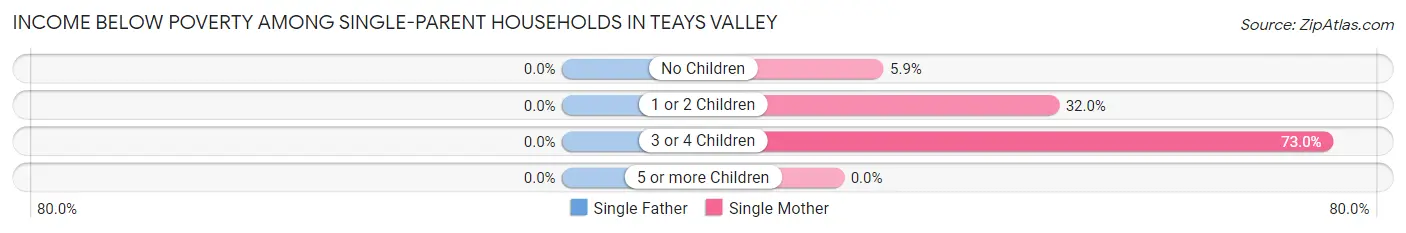
| Children | Single Father | Single Mother |
| No Children | 0 (0.0%) | 16 (5.9%) |
| 1 or 2 Children | 0 (0.0%) | 107 (32.0%) |
| 3 or 4 Children | 0 (0.0%) | 27 (73.0%) |
| 5 or more Children | 0 (0.0%) | 0 (0.0%) |
| Total | 0 (0.0%) | 150 (23.3%) |
Income Below Poverty Among Married-Couple vs Single-Parent Households in Teays Valley
The poverty data for Teays Valley shows that 31 of the married-couple family households (1.0%) and 150 of the single-parent households (17.9%) are living below the poverty level. Within the married-couple family households, those with no children have the highest poverty rate, with 31 households (1.7%) falling below the poverty line. Among the single-parent households, those with 3 or 4 children have the highest poverty rate, with 27 household (33.3%) living below poverty.
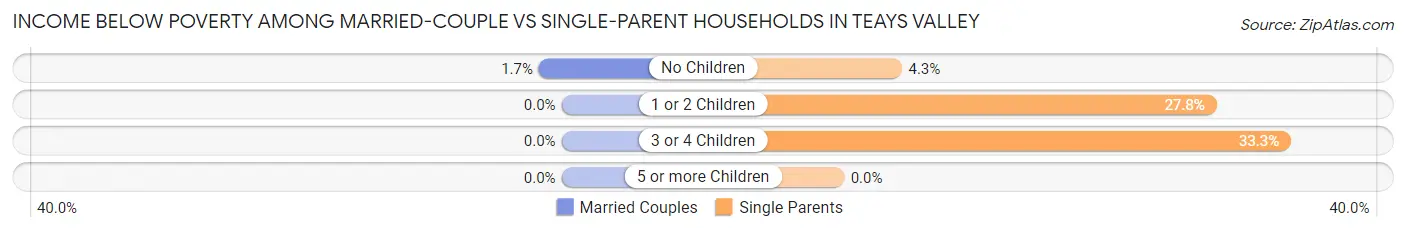
| Children | Married-Couple Families | Single-Parent Households |
| No Children | 31 (1.7%) | 16 (4.3%) |
| 1 or 2 Children | 0 (0.0%) | 107 (27.8%) |
| 3 or 4 Children | 0 (0.0%) | 27 (33.3%) |
| 5 or more Children | 0 (0.0%) | 0 (0.0%) |
| Total | 31 (1.0%) | 150 (17.9%) |
Employment Characteristics in Teays Valley
Employment by Class of Employer in Teays Valley
Among the 6,619 employed individuals in Teays Valley, private company employees (4,071 | 61.5%), state government employees (711 | 10.7%), and not-for-profit organizations (571 | 8.6%) make up the most common classes of employment.
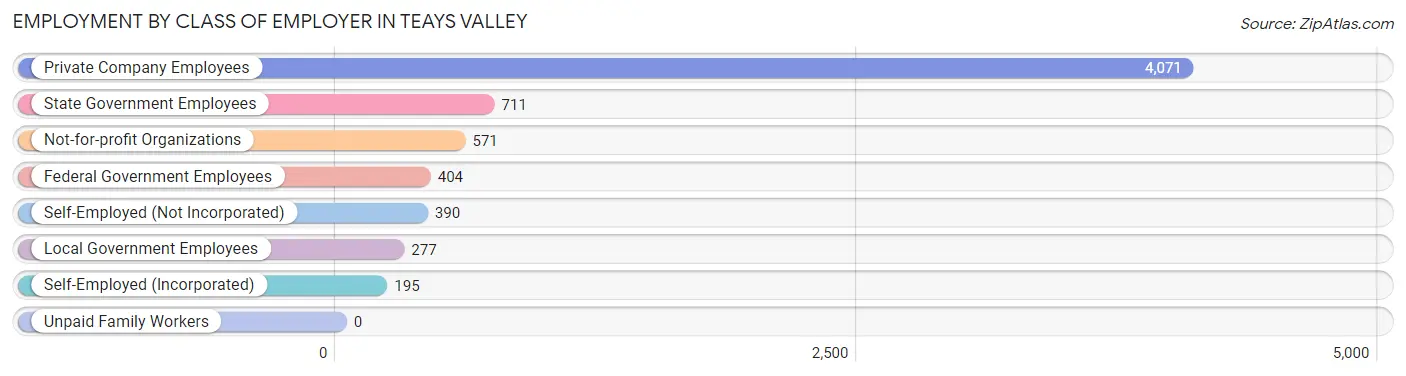
| Employer Class | # Employees | % Employees |
| Private Company Employees | 4,071 | 61.5% |
| Self-Employed (Incorporated) | 195 | 2.9% |
| Self-Employed (Not Incorporated) | 390 | 5.9% |
| Not-for-profit Organizations | 571 | 8.6% |
| Local Government Employees | 277 | 4.2% |
| State Government Employees | 711 | 10.7% |
| Federal Government Employees | 404 | 6.1% |
| Unpaid Family Workers | 0 | 0.0% |
| Total | 6,619 | 100.0% |
Employment Status by Age in Teays Valley
According to the labor force statistics for Teays Valley, out of the total population over 16 years of age (11,015), 62.5% or 6,884 individuals are in the labor force, with 3.4% or 234 of them unemployed. The age group with the highest labor force participation rate is 20 to 24 years, with 93.2% or 591 individuals in the labor force. Within the labor force, the 25 to 29 years age range has the highest percentage of unemployed individuals, with 11.7% or 71 of them being unemployed.
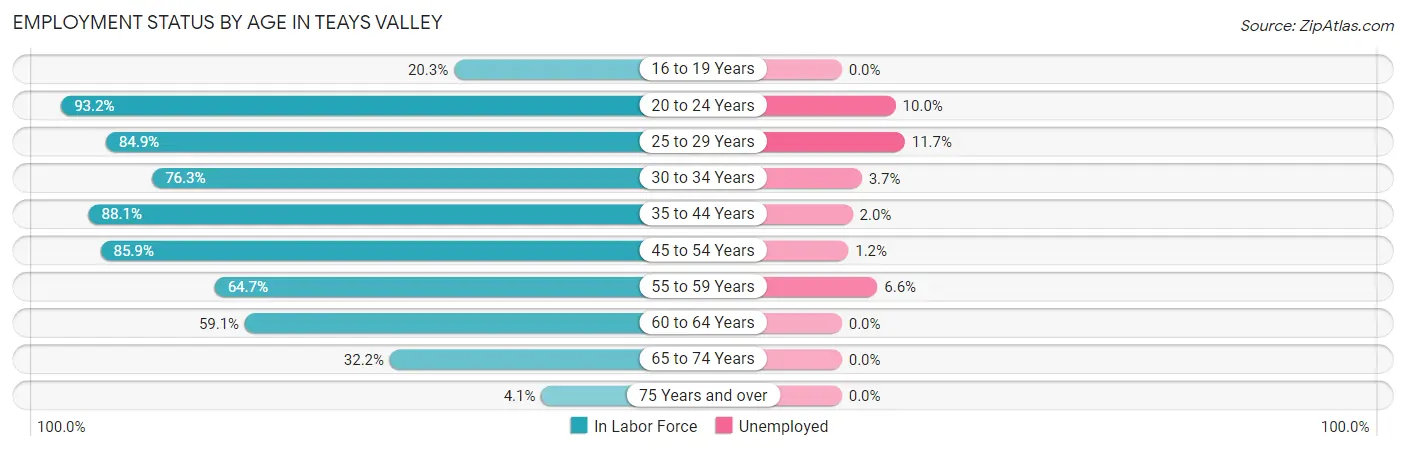
| Age Bracket | In Labor Force | Unemployed |
| 16 to 19 Years | 104 (20.3%) | 0 (0.0%) |
| 20 to 24 Years | 591 (93.2%) | 59 (10.0%) |
| 25 to 29 Years | 608 (84.9%) | 71 (11.7%) |
| 30 to 34 Years | 484 (76.3%) | 18 (3.7%) |
| 35 to 44 Years | 1,810 (88.1%) | 36 (2.0%) |
| 45 to 54 Years | 1,633 (85.9%) | 20 (1.2%) |
| 55 to 59 Years | 468 (64.7%) | 31 (6.6%) |
| 60 to 64 Years | 700 (59.1%) | 0 (0.0%) |
| 65 to 74 Years | 438 (32.2%) | 0 (0.0%) |
| 75 Years and over | 53 (4.1%) | 0 (0.0%) |
| Total | 6,884 (62.5%) | 234 (3.4%) |
Employment Status by Educational Attainment in Teays Valley
According to labor force statistics for Teays Valley, 79.1% of individuals (5,705) out of the total population between 25 and 64 years of age (7,212) are in the labor force, with 3.1% or 177 of them being unemployed. The group with the highest labor force participation rate are those with the educational attainment of bachelor's degree or higher, with 88.1% or 3,773 individuals in the labor force. Within the labor force, individuals with high school diploma education have the highest percentage of unemployment, with 16.3% or 85 of them being unemployed.
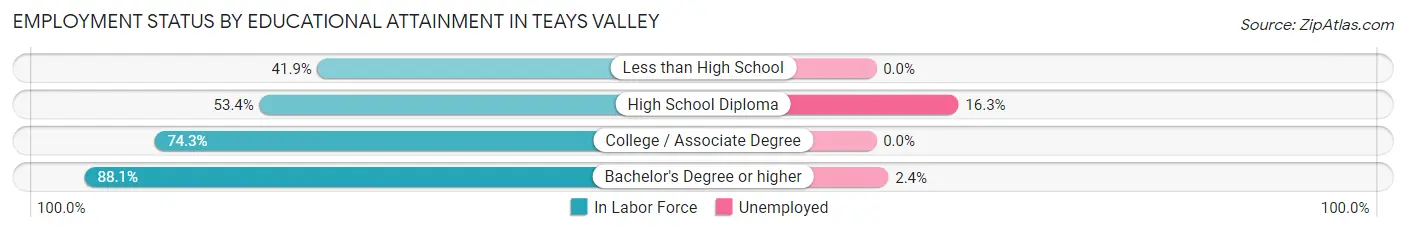
| Educational Attainment | In Labor Force | Unemployed |
| Less than High School | 57 (41.9%) | 0 (0.0%) |
| High School Diploma | 520 (53.4%) | 159 (16.3%) |
| College / Associate Degree | 1,352 (74.3%) | 0 (0.0%) |
| Bachelor's Degree or higher | 3,773 (88.1%) | 103 (2.4%) |
| Total | 5,705 (79.1%) | 224 (3.1%) |
Employment Occupations by Sex in Teays Valley
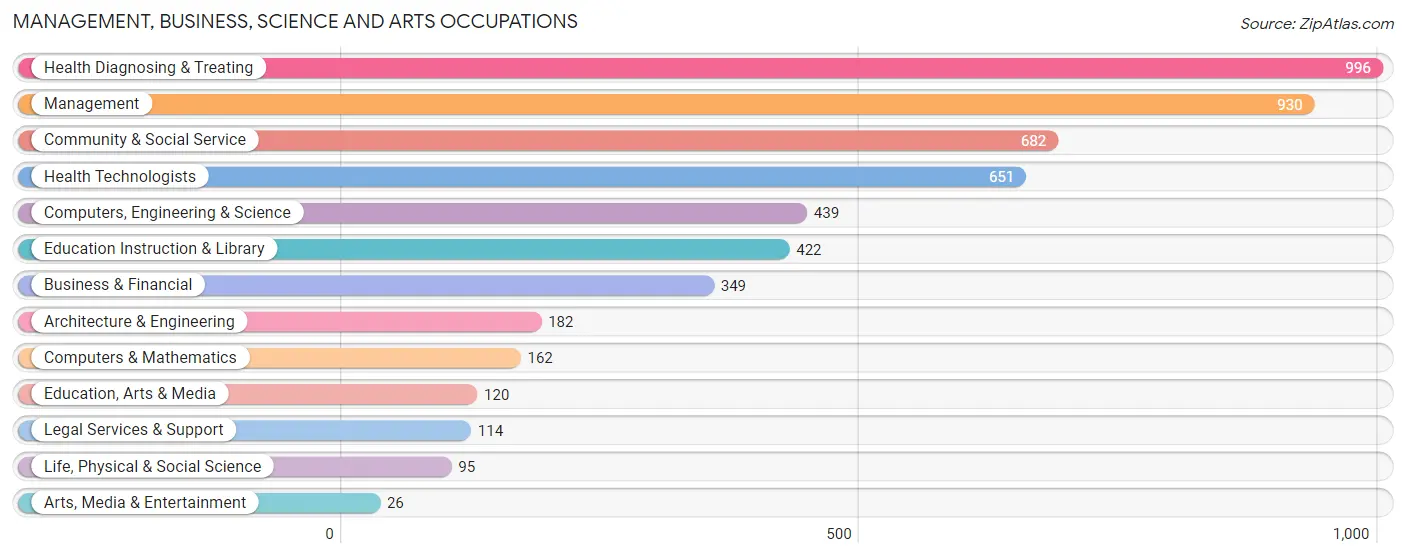
Management, Business, Science and Arts Occupations
The most common Management, Business, Science and Arts occupations in Teays Valley are Health Diagnosing & Treating (996 | 15.2%), Management (930 | 14.2%), Community & Social Service (682 | 10.4%), Health Technologists (651 | 9.9%), and Computers, Engineering & Science (439 | 6.7%).
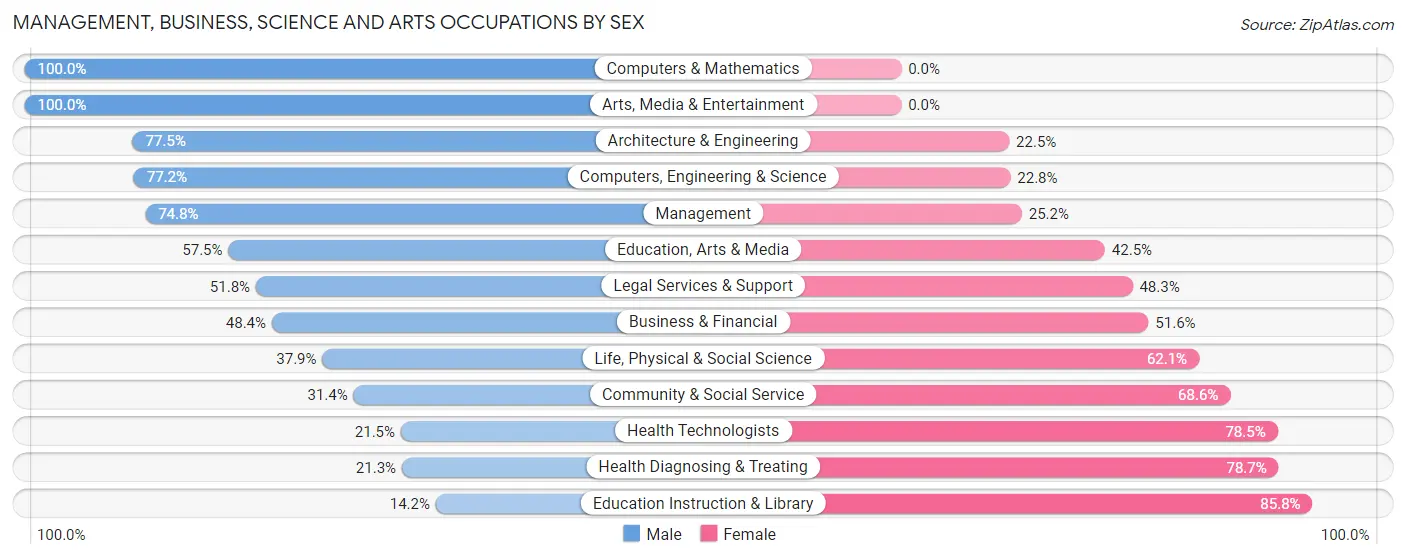
Management, Business, Science and Arts Occupations by Sex
Within the Management, Business, Science and Arts occupations in Teays Valley, the most male-oriented occupations are Computers & Mathematics (100.0%), Arts, Media & Entertainment (100.0%), and Architecture & Engineering (77.5%), while the most female-oriented occupations are Education Instruction & Library (85.8%), Health Diagnosing & Treating (78.7%), and Health Technologists (78.5%).
| Occupation | Male | Female |
| Management | 696 (74.8%) | 234 (25.2%) |
| Business & Financial | 169 (48.4%) | 180 (51.6%) |
| Computers, Engineering & Science | 339 (77.2%) | 100 (22.8%) |
| Computers & Mathematics | 162 (100.0%) | 0 (0.0%) |
| Architecture & Engineering | 141 (77.5%) | 41 (22.5%) |
| Life, Physical & Social Science | 36 (37.9%) | 59 (62.1%) |
| Community & Social Service | 214 (31.4%) | 468 (68.6%) |
| Education, Arts & Media | 69 (57.5%) | 51 (42.5%) |
| Legal Services & Support | 59 (51.7%) | 55 (48.2%) |
| Education Instruction & Library | 60 (14.2%) | 362 (85.8%) |
| Arts, Media & Entertainment | 26 (100.0%) | 0 (0.0%) |
| Health Diagnosing & Treating | 212 (21.3%) | 784 (78.7%) |
| Health Technologists | 140 (21.5%) | 511 (78.5%) |
| Total (Category) | 1,630 (48.0%) | 1,766 (52.0%) |
| Total (Overall) | 3,447 (52.6%) | 3,104 (47.4%) |
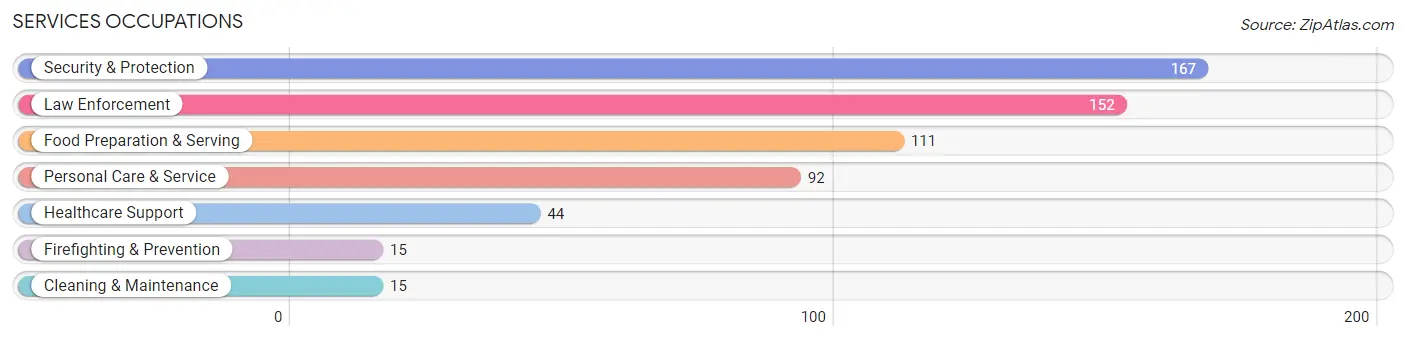
Services Occupations
The most common Services occupations in Teays Valley are Security & Protection (167 | 2.5%), Law Enforcement (152 | 2.3%), Food Preparation & Serving (111 | 1.7%), Personal Care & Service (92 | 1.4%), and Healthcare Support (44 | 0.7%).
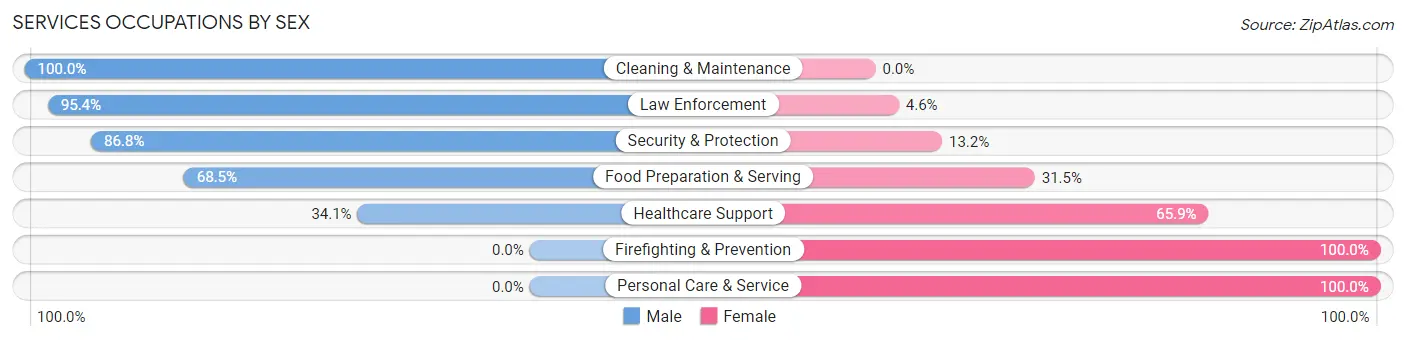
Services Occupations by Sex
Within the Services occupations in Teays Valley, the most male-oriented occupations are Cleaning & Maintenance (100.0%), Law Enforcement (95.4%), and Security & Protection (86.8%), while the most female-oriented occupations are Firefighting & Prevention (100.0%), Personal Care & Service (100.0%), and Healthcare Support (65.9%).
| Occupation | Male | Female |
| Healthcare Support | 15 (34.1%) | 29 (65.9%) |
| Security & Protection | 145 (86.8%) | 22 (13.2%) |
| Firefighting & Prevention | 0 (0.0%) | 15 (100.0%) |
| Law Enforcement | 145 (95.4%) | 7 (4.6%) |
| Food Preparation & Serving | 76 (68.5%) | 35 (31.5%) |
| Cleaning & Maintenance | 15 (100.0%) | 0 (0.0%) |
| Personal Care & Service | 0 (0.0%) | 92 (100.0%) |
| Total (Category) | 251 (58.5%) | 178 (41.5%) |
| Total (Overall) | 3,447 (52.6%) | 3,104 (47.4%) |
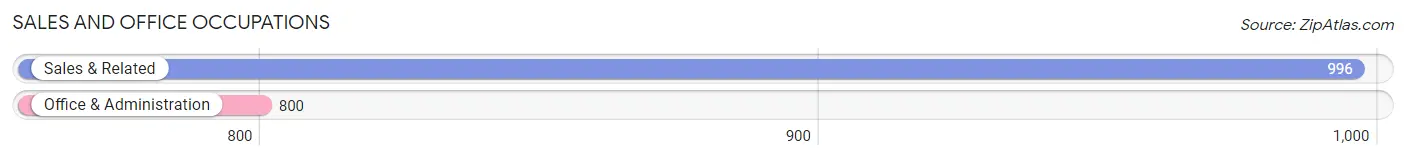
Sales and Office Occupations
The most common Sales and Office occupations in Teays Valley are Sales & Related (996 | 15.2%), and Office & Administration (800 | 12.2%).
Sales and Office Occupations by Sex
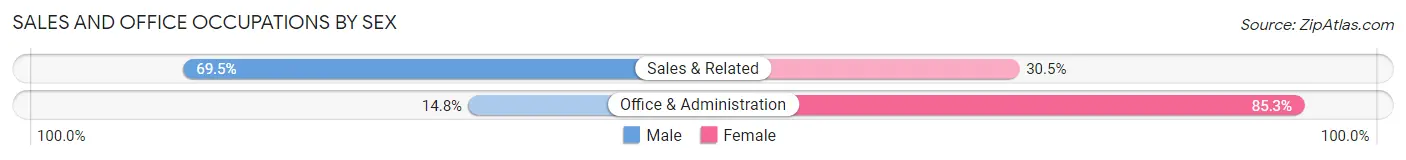
| Occupation | Male | Female |
| Sales & Related | 692 (69.5%) | 304 (30.5%) |
| Office & Administration | 118 (14.7%) | 682 (85.3%) |
| Total (Category) | 810 (45.1%) | 986 (54.9%) |
| Total (Overall) | 3,447 (52.6%) | 3,104 (47.4%) |
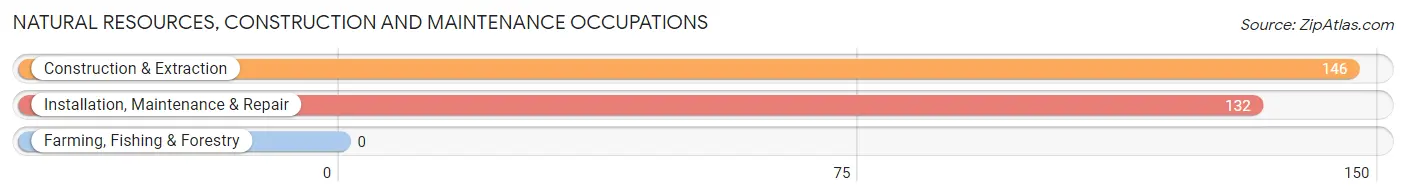
Natural Resources, Construction and Maintenance Occupations
The most common Natural Resources, Construction and Maintenance occupations in Teays Valley are Construction & Extraction (146 | 2.2%), and Installation, Maintenance & Repair (132 | 2.0%).
Natural Resources, Construction and Maintenance Occupations by Sex
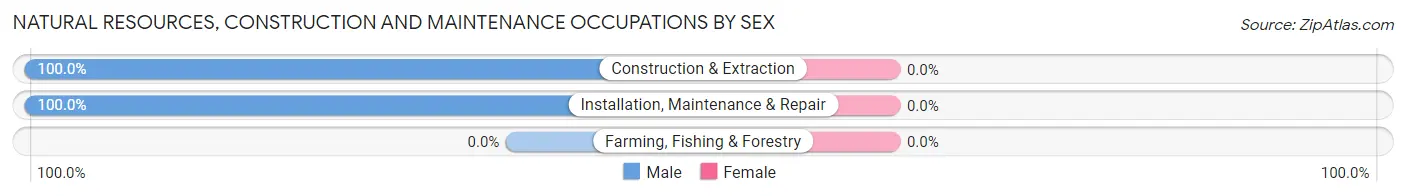
| Occupation | Male | Female |
| Farming, Fishing & Forestry | 0 (0.0%) | 0 (0.0%) |
| Construction & Extraction | 146 (100.0%) | 0 (0.0%) |
| Installation, Maintenance & Repair | 132 (100.0%) | 0 (0.0%) |
| Total (Category) | 278 (100.0%) | 0 (0.0%) |
| Total (Overall) | 3,447 (52.6%) | 3,104 (47.4%) |
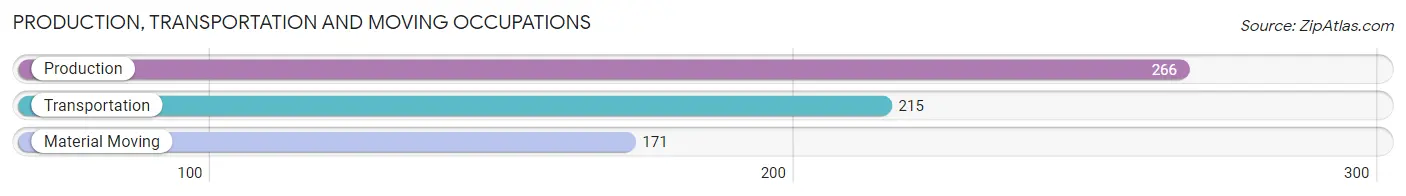
Production, Transportation and Moving Occupations
The most common Production, Transportation and Moving occupations in Teays Valley are Production (266 | 4.1%), Transportation (215 | 3.3%), and Material Moving (171 | 2.6%).
Production, Transportation and Moving Occupations by Sex
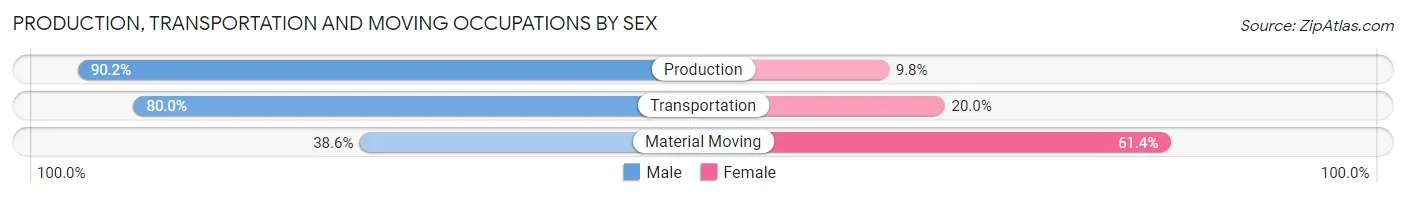
| Occupation | Male | Female |
| Production | 240 (90.2%) | 26 (9.8%) |
| Transportation | 172 (80.0%) | 43 (20.0%) |
| Material Moving | 66 (38.6%) | 105 (61.4%) |
| Total (Category) | 478 (73.3%) | 174 (26.7%) |
| Total (Overall) | 3,447 (52.6%) | 3,104 (47.4%) |
Employment Industries by Sex in Teays Valley
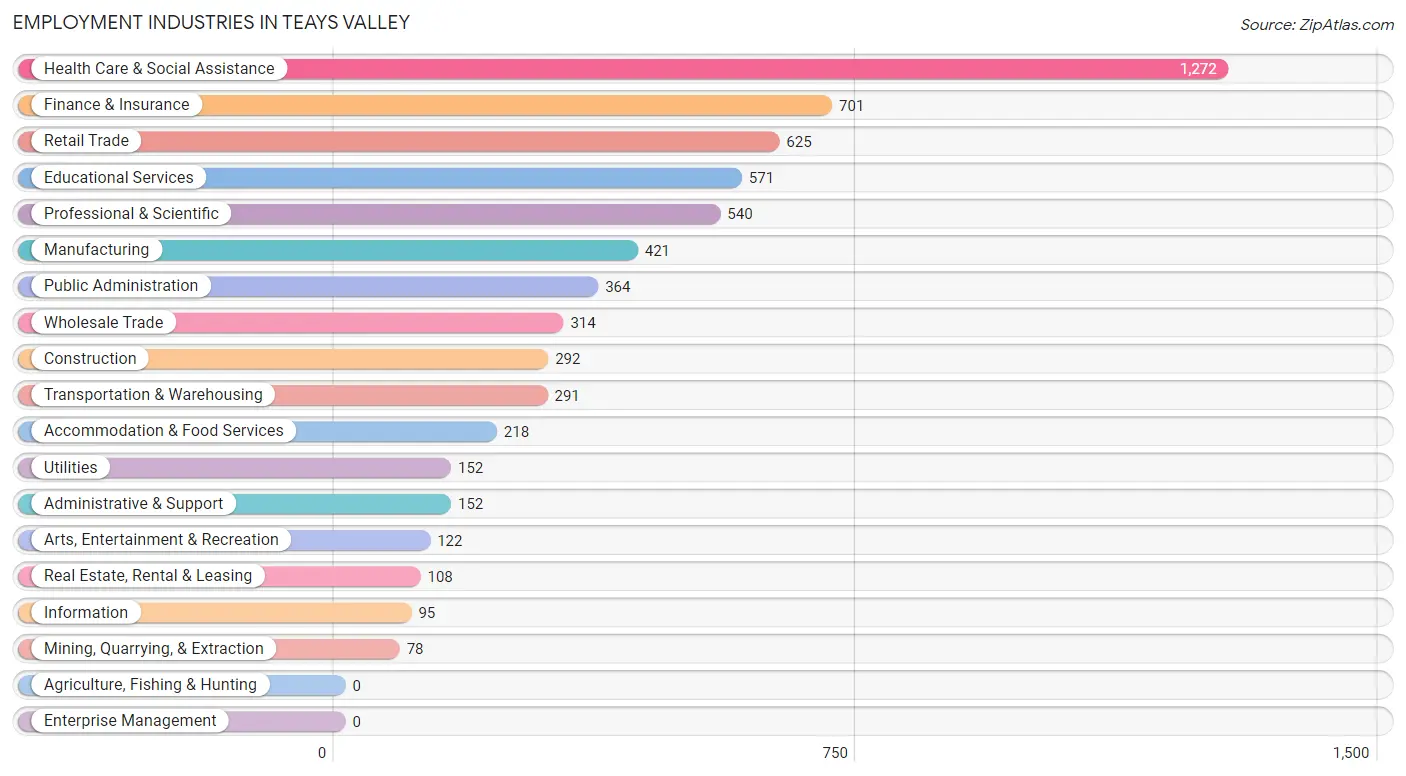
Employment Industries in Teays Valley
The major employment industries in Teays Valley include Health Care & Social Assistance (1,272 | 19.4%), Finance & Insurance (701 | 10.7%), Retail Trade (625 | 9.5%), Educational Services (571 | 8.7%), and Professional & Scientific (540 | 8.2%).
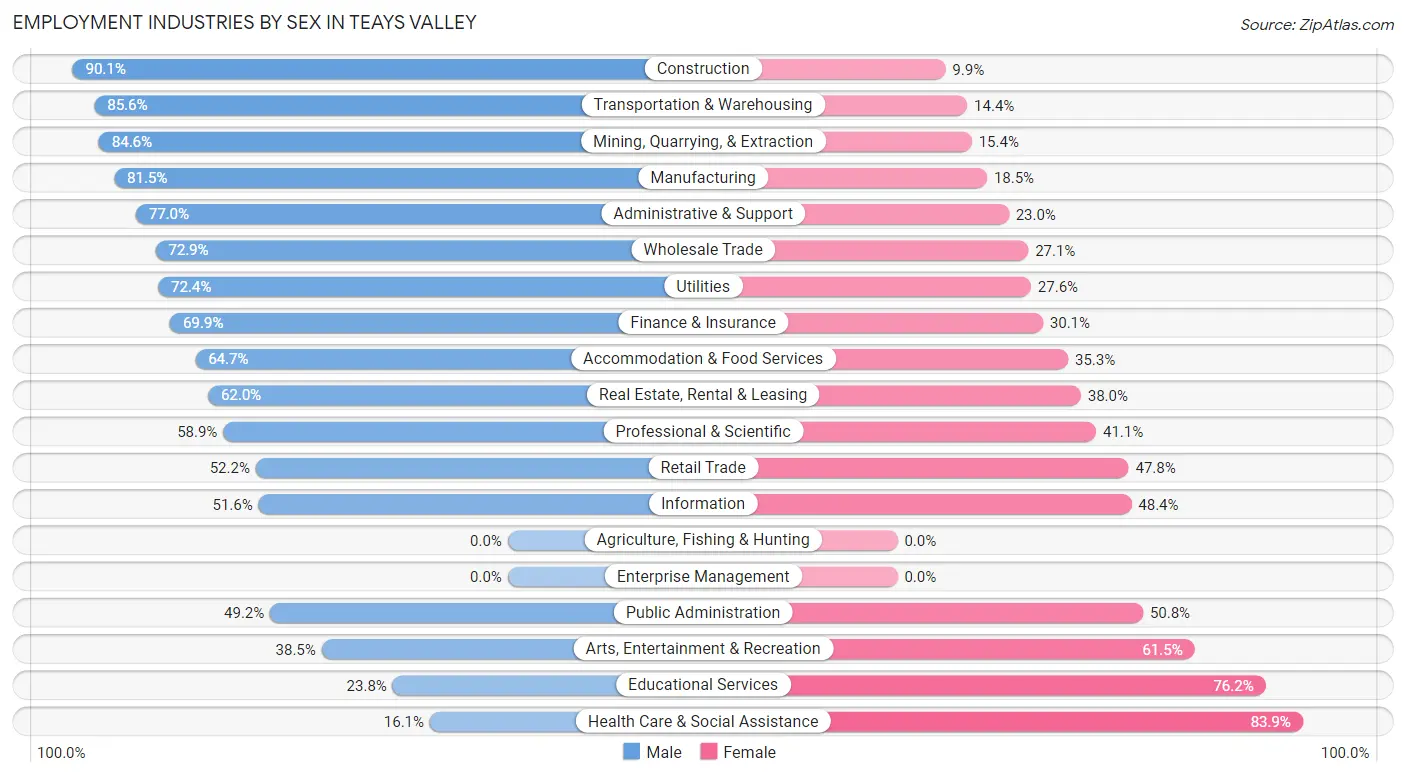
Employment Industries by Sex in Teays Valley
The Teays Valley industries that see more men than women are Construction (90.1%), Transportation & Warehousing (85.6%), and Mining, Quarrying, & Extraction (84.6%), whereas the industries that tend to have a higher number of women are Health Care & Social Assistance (83.9%), Educational Services (76.2%), and Arts, Entertainment & Recreation (61.5%).
| Industry | Male | Female |
| Agriculture, Fishing & Hunting | 0 (0.0%) | 0 (0.0%) |
| Mining, Quarrying, & Extraction | 66 (84.6%) | 12 (15.4%) |
| Construction | 263 (90.1%) | 29 (9.9%) |
| Manufacturing | 343 (81.5%) | 78 (18.5%) |
| Wholesale Trade | 229 (72.9%) | 85 (27.1%) |
| Retail Trade | 326 (52.2%) | 299 (47.8%) |
| Transportation & Warehousing | 249 (85.6%) | 42 (14.4%) |
| Utilities | 110 (72.4%) | 42 (27.6%) |
| Information | 49 (51.6%) | 46 (48.4%) |
| Finance & Insurance | 490 (69.9%) | 211 (30.1%) |
| Real Estate, Rental & Leasing | 67 (62.0%) | 41 (38.0%) |
| Professional & Scientific | 318 (58.9%) | 222 (41.1%) |
| Enterprise Management | 0 (0.0%) | 0 (0.0%) |
| Administrative & Support | 117 (77.0%) | 35 (23.0%) |
| Educational Services | 136 (23.8%) | 435 (76.2%) |
| Health Care & Social Assistance | 205 (16.1%) | 1,067 (83.9%) |
| Arts, Entertainment & Recreation | 47 (38.5%) | 75 (61.5%) |
| Accommodation & Food Services | 141 (64.7%) | 77 (35.3%) |
| Public Administration | 179 (49.2%) | 185 (50.8%) |
| Total | 3,447 (52.6%) | 3,104 (47.4%) |
Education in Teays Valley
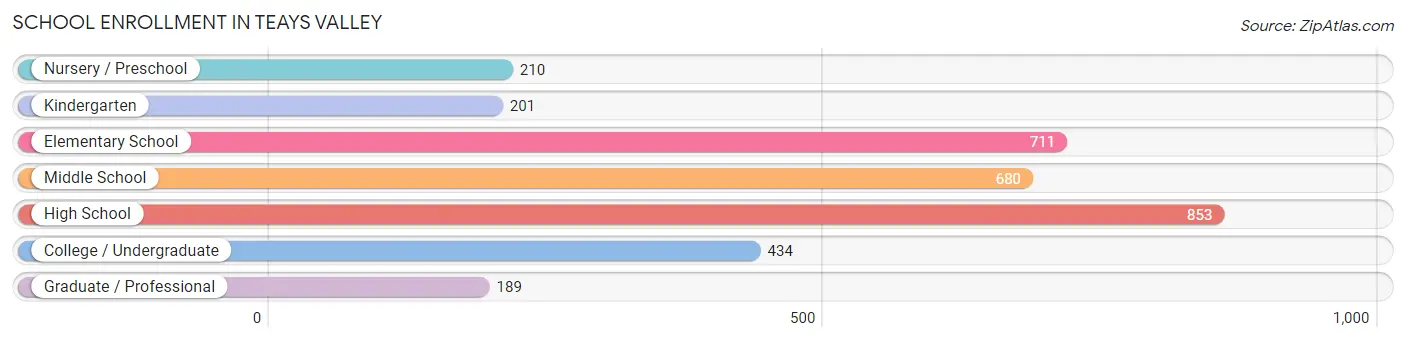
School Enrollment in Teays Valley
The most common levels of schooling among the 3,278 students in Teays Valley are high school (853 | 26.0%), elementary school (711 | 21.7%), and middle school (680 | 20.7%).
| School Level | # Students | % Students |
| Nursery / Preschool | 210 | 6.4% |
| Kindergarten | 201 | 6.1% |
| Elementary School | 711 | 21.7% |
| Middle School | 680 | 20.7% |
| High School | 853 | 26.0% |
| College / Undergraduate | 434 | 13.2% |
| Graduate / Professional | 189 | 5.8% |
| Total | 3,278 | 100.0% |
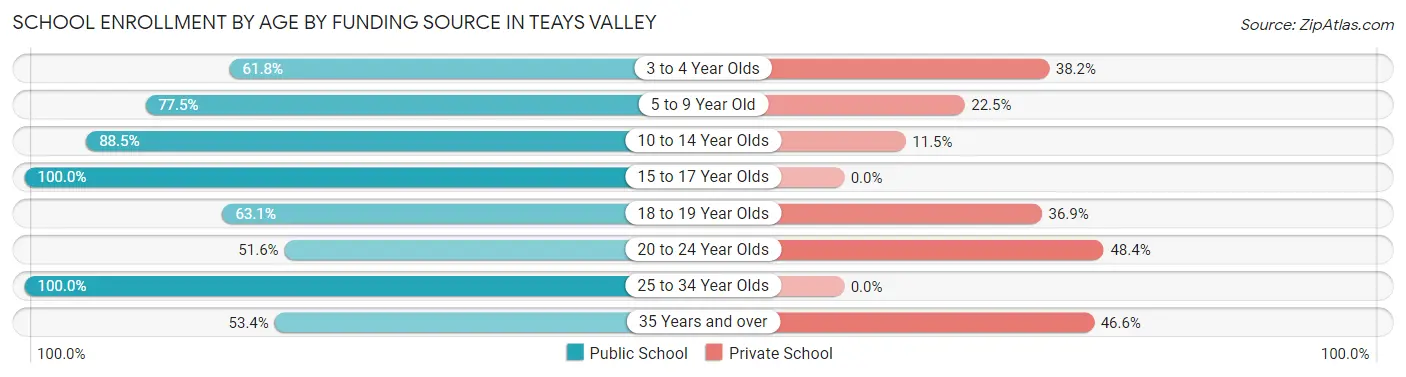
School Enrollment by Age by Funding Source in Teays Valley
Out of a total of 3,278 students who are enrolled in schools in Teays Valley, 610 (18.6%) attend a private institution, while the remaining 2,668 (81.4%) are enrolled in public schools. The age group of 20 to 24 year olds has the highest likelihood of being enrolled in private schools, with 45 (48.4% in the age bracket) enrolled. Conversely, the age group of 15 to 17 year olds has the lowest likelihood of being enrolled in a private school, with 503 (100.0% in the age bracket) attending a public institution.
| Age Bracket | Public School | Private School |
| 3 to 4 Year Olds | 55 (61.8%) | 34 (38.2%) |
| 5 to 9 Year Old | 673 (77.5%) | 195 (22.5%) |
| 10 to 14 Year Olds | 932 (88.5%) | 121 (11.5%) |
| 15 to 17 Year Olds | 503 (100.0%) | 0 (0.0%) |
| 18 to 19 Year Olds | 149 (63.1%) | 87 (36.9%) |
| 20 to 24 Year Olds | 48 (51.6%) | 45 (48.4%) |
| 25 to 34 Year Olds | 159 (100.0%) | 0 (0.0%) |
| 35 Years and over | 148 (53.4%) | 129 (46.6%) |
| Total | 2,668 (81.4%) | 610 (18.6%) |
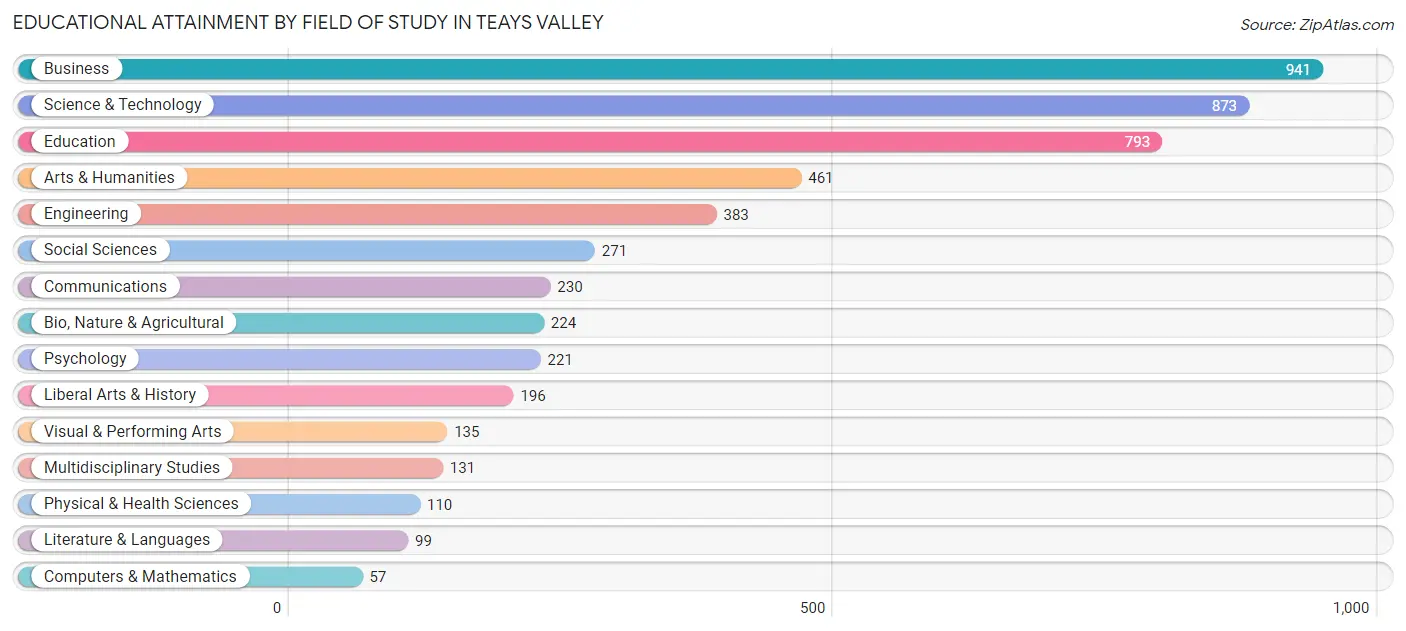
Educational Attainment by Field of Study in Teays Valley
Business (941 | 18.4%), science & technology (873 | 17.0%), education (793 | 15.5%), arts & humanities (461 | 9.0%), and engineering (383 | 7.5%) are the most common fields of study among 5,125 individuals in Teays Valley who have obtained a bachelor's degree or higher.
| Field of Study | # Graduates | % Graduates |
| Computers & Mathematics | 57 | 1.1% |
| Bio, Nature & Agricultural | 224 | 4.4% |
| Physical & Health Sciences | 110 | 2.1% |
| Psychology | 221 | 4.3% |
| Social Sciences | 271 | 5.3% |
| Engineering | 383 | 7.5% |
| Multidisciplinary Studies | 131 | 2.6% |
| Science & Technology | 873 | 17.0% |
| Business | 941 | 18.4% |
| Education | 793 | 15.5% |
| Literature & Languages | 99 | 1.9% |
| Liberal Arts & History | 196 | 3.8% |
| Visual & Performing Arts | 135 | 2.6% |
| Communications | 230 | 4.5% |
| Arts & Humanities | 461 | 9.0% |
| Total | 5,125 | 100.0% |
Transportation & Commute in Teays Valley
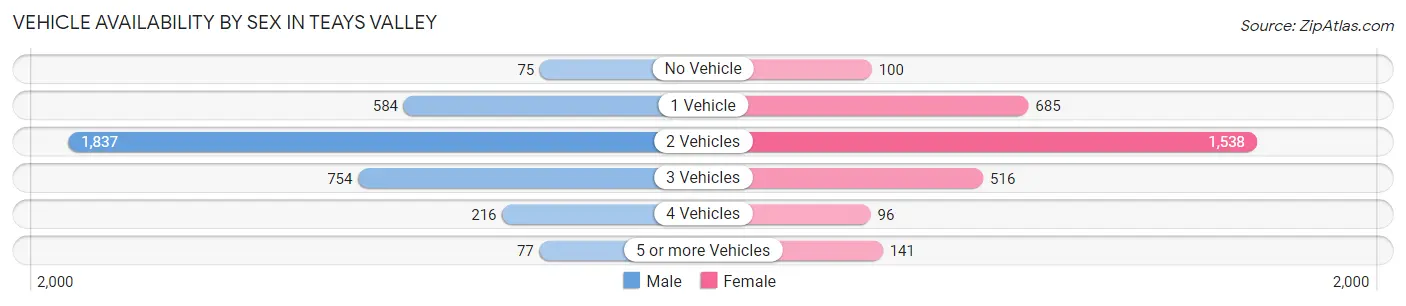
Vehicle Availability by Sex in Teays Valley
The most prevalent vehicle ownership categories in Teays Valley are males with 2 vehicles (1,837, accounting for 51.8%) and females with 2 vehicles (1,538, making up 59.7%).
| Vehicles Available | Male | Female |
| No Vehicle | 75 (2.1%) | 100 (3.3%) |
| 1 Vehicle | 584 (16.5%) | 685 (22.3%) |
| 2 Vehicles | 1,837 (51.8%) | 1,538 (50.0%) |
| 3 Vehicles | 754 (21.3%) | 516 (16.8%) |
| 4 Vehicles | 216 (6.1%) | 96 (3.1%) |
| 5 or more Vehicles | 77 (2.2%) | 141 (4.6%) |
| Total | 3,543 (100.0%) | 3,076 (100.0%) |
Commute Time in Teays Valley
The most frequently occuring commute durations in Teays Valley are 30 to 34 minutes (1,181 commuters, 19.8%), 20 to 24 minutes (827 commuters, 13.9%), and 15 to 19 minutes (639 commuters, 10.7%).
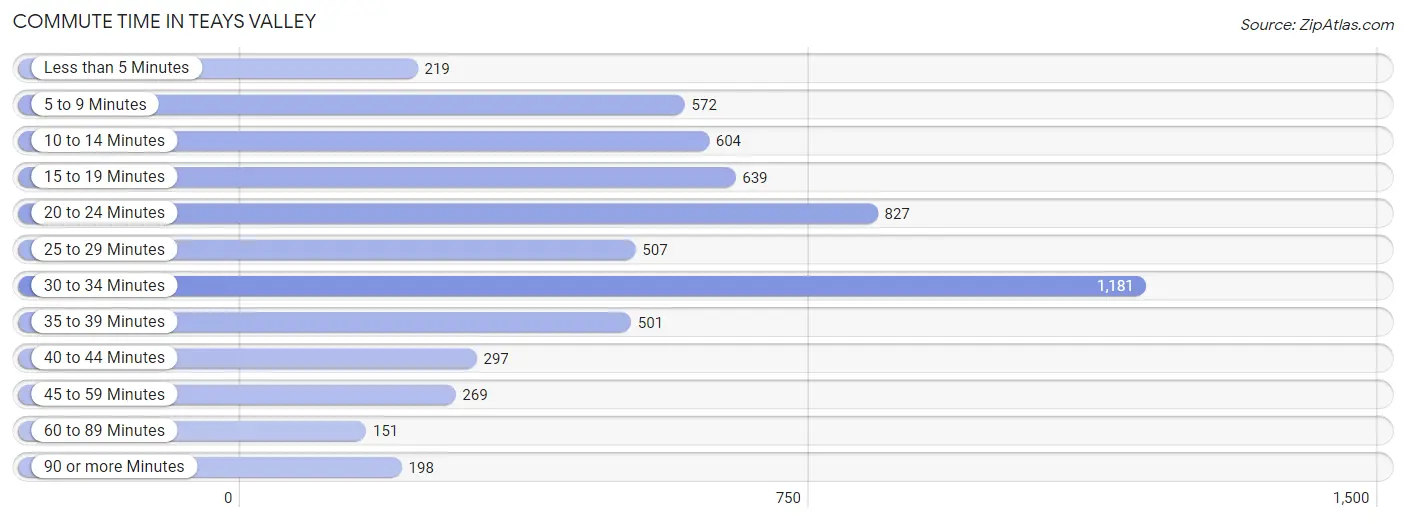
| Commute Time | # Commuters | % Commuters |
| Less than 5 Minutes | 219 | 3.7% |
| 5 to 9 Minutes | 572 | 9.6% |
| 10 to 14 Minutes | 604 | 10.1% |
| 15 to 19 Minutes | 639 | 10.7% |
| 20 to 24 Minutes | 827 | 13.9% |
| 25 to 29 Minutes | 507 | 8.5% |
| 30 to 34 Minutes | 1,181 | 19.8% |
| 35 to 39 Minutes | 501 | 8.4% |
| 40 to 44 Minutes | 297 | 5.0% |
| 45 to 59 Minutes | 269 | 4.5% |
| 60 to 89 Minutes | 151 | 2.5% |
| 90 or more Minutes | 198 | 3.3% |
Commute Time by Sex in Teays Valley
The most common commute times in Teays Valley are 30 to 34 minutes (714 commuters, 22.0%) for males and 30 to 34 minutes (467 commuters, 17.1%) for females.
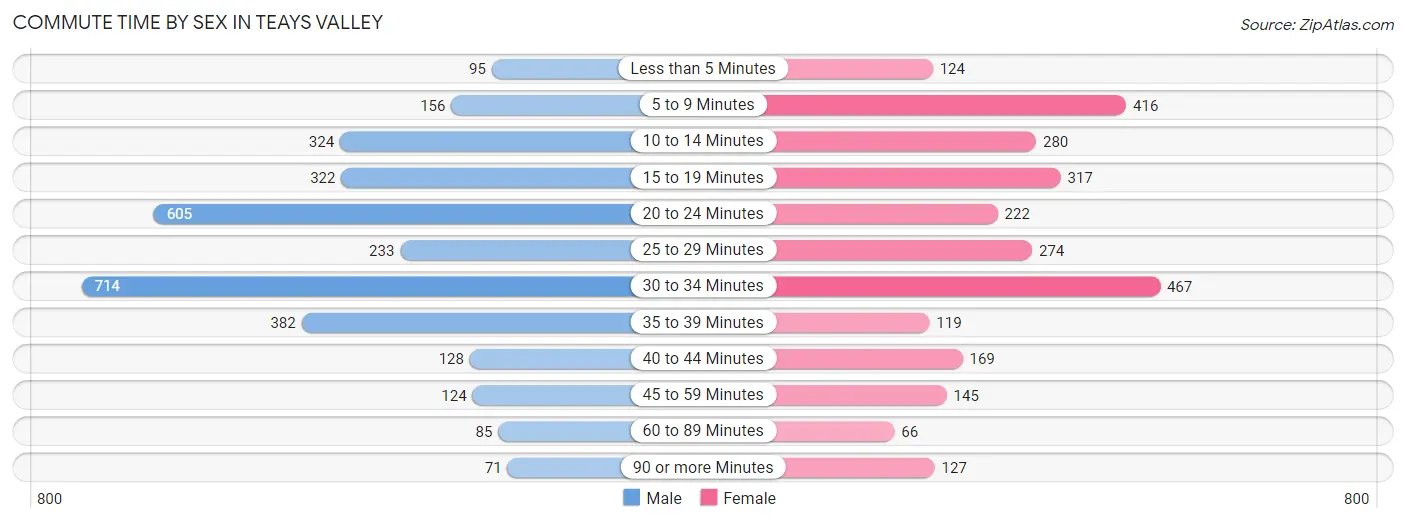
| Commute Time | Male | Female |
| Less than 5 Minutes | 95 (2.9%) | 124 (4.5%) |
| 5 to 9 Minutes | 156 (4.8%) | 416 (15.3%) |
| 10 to 14 Minutes | 324 (10.0%) | 280 (10.3%) |
| 15 to 19 Minutes | 322 (9.9%) | 317 (11.6%) |
| 20 to 24 Minutes | 605 (18.7%) | 222 (8.1%) |
| 25 to 29 Minutes | 233 (7.2%) | 274 (10.1%) |
| 30 to 34 Minutes | 714 (22.0%) | 467 (17.1%) |
| 35 to 39 Minutes | 382 (11.8%) | 119 (4.4%) |
| 40 to 44 Minutes | 128 (4.0%) | 169 (6.2%) |
| 45 to 59 Minutes | 124 (3.8%) | 145 (5.3%) |
| 60 to 89 Minutes | 85 (2.6%) | 66 (2.4%) |
| 90 or more Minutes | 71 (2.2%) | 127 (4.7%) |
Time of Departure to Work by Sex in Teays Valley
The most frequent times of departure to work in Teays Valley are 8:00 AM to 8:29 AM (594, 18.3%) for males and 7:00 AM to 7:29 AM (521, 19.1%) for females.
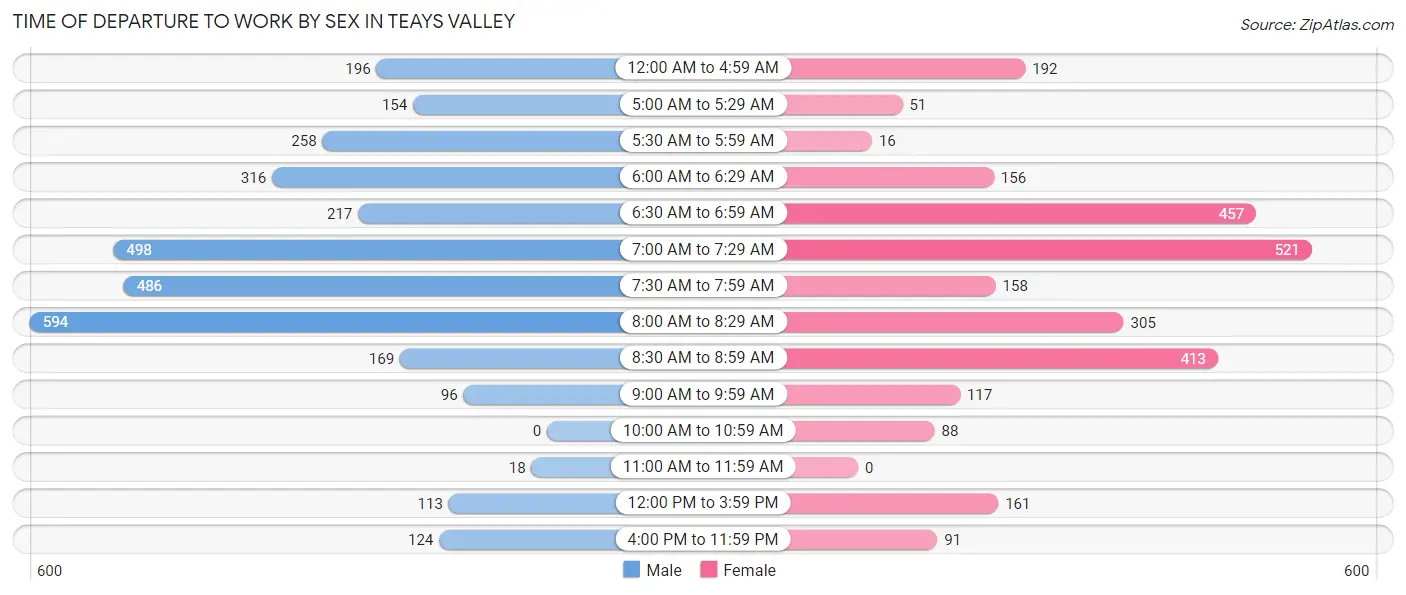
| Time of Departure | Male | Female |
| 12:00 AM to 4:59 AM | 196 (6.0%) | 192 (7.0%) |
| 5:00 AM to 5:29 AM | 154 (4.8%) | 51 (1.9%) |
| 5:30 AM to 5:59 AM | 258 (8.0%) | 16 (0.6%) |
| 6:00 AM to 6:29 AM | 316 (9.8%) | 156 (5.7%) |
| 6:30 AM to 6:59 AM | 217 (6.7%) | 457 (16.8%) |
| 7:00 AM to 7:29 AM | 498 (15.4%) | 521 (19.1%) |
| 7:30 AM to 7:59 AM | 486 (15.0%) | 158 (5.8%) |
| 8:00 AM to 8:29 AM | 594 (18.3%) | 305 (11.2%) |
| 8:30 AM to 8:59 AM | 169 (5.2%) | 413 (15.1%) |
| 9:00 AM to 9:59 AM | 96 (3.0%) | 117 (4.3%) |
| 10:00 AM to 10:59 AM | 0 (0.0%) | 88 (3.2%) |
| 11:00 AM to 11:59 AM | 18 (0.6%) | 0 (0.0%) |
| 12:00 PM to 3:59 PM | 113 (3.5%) | 161 (5.9%) |
| 4:00 PM to 11:59 PM | 124 (3.8%) | 91 (3.3%) |
| Total | 3,239 (100.0%) | 2,726 (100.0%) |
Housing Occupancy in Teays Valley
Occupancy by Ownership in Teays Valley
Of the total 5,517 dwellings in Teays Valley, owner-occupied units account for 4,337 (78.6%), while renter-occupied units make up 1,180 (21.4%).
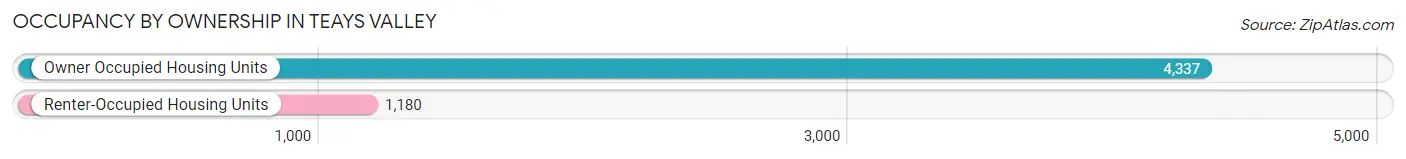
| Occupancy | # Housing Units | % Housing Units |
| Owner Occupied Housing Units | 4,337 | 78.6% |
| Renter-Occupied Housing Units | 1,180 | 21.4% |
| Total Occupied Housing Units | 5,517 | 100.0% |
Occupancy by Household Size in Teays Valley
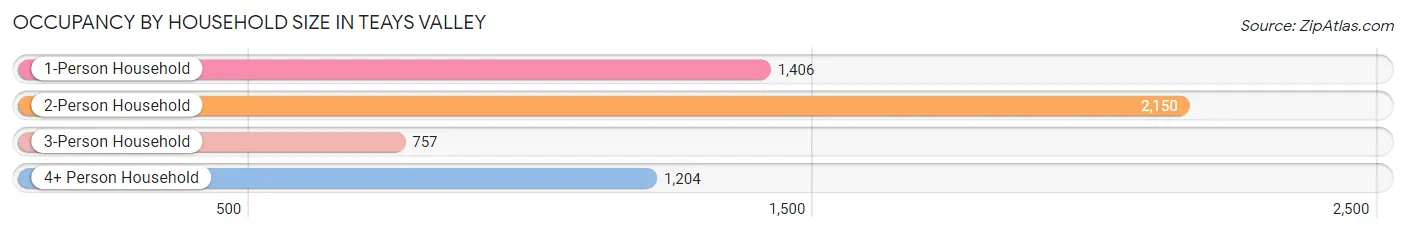
| Household Size | # Housing Units | % Housing Units |
| 1-Person Household | 1,406 | 25.5% |
| 2-Person Household | 2,150 | 39.0% |
| 3-Person Household | 757 | 13.7% |
| 4+ Person Household | 1,204 | 21.8% |
| Total Housing Units | 5,517 | 100.0% |
Occupancy by Ownership by Household Size in Teays Valley
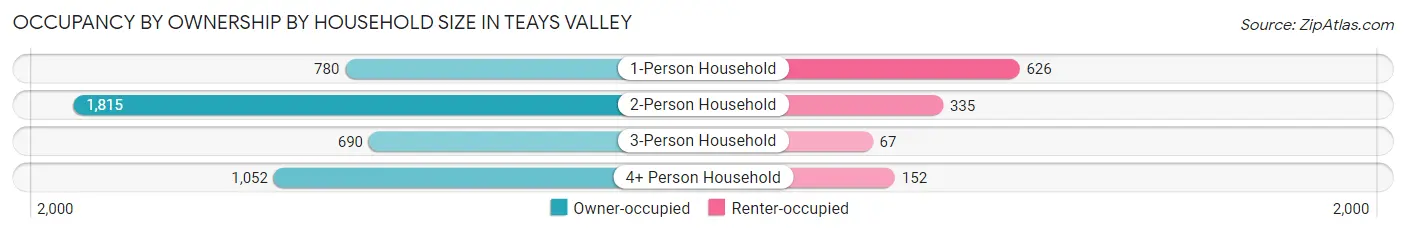
| Household Size | Owner-occupied | Renter-occupied |
| 1-Person Household | 780 (55.5%) | 626 (44.5%) |
| 2-Person Household | 1,815 (84.4%) | 335 (15.6%) |
| 3-Person Household | 690 (91.1%) | 67 (8.8%) |
| 4+ Person Household | 1,052 (87.4%) | 152 (12.6%) |
| Total Housing Units | 4,337 (78.6%) | 1,180 (21.4%) |
Occupancy by Educational Attainment in Teays Valley
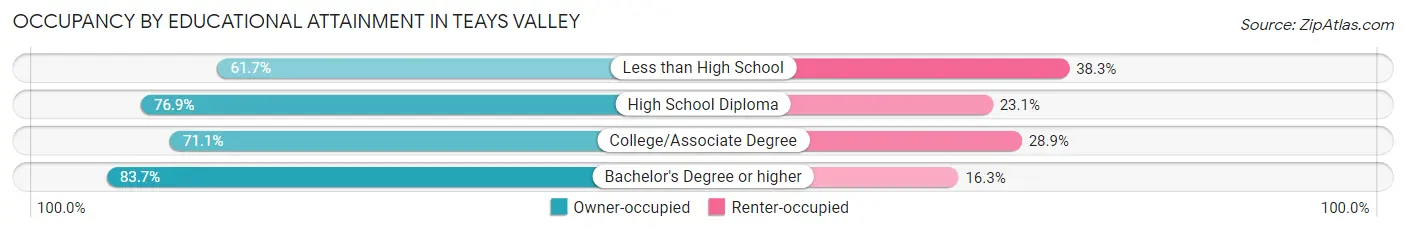
| Household Size | Owner-occupied | Renter-occupied |
| Less than High School | 50 (61.7%) | 31 (38.3%) |
| High School Diploma | 722 (76.9%) | 217 (23.1%) |
| College/Associate Degree | 1,124 (71.1%) | 456 (28.9%) |
| Bachelor's Degree or higher | 2,441 (83.7%) | 476 (16.3%) |
Occupancy by Age of Householder in Teays Valley
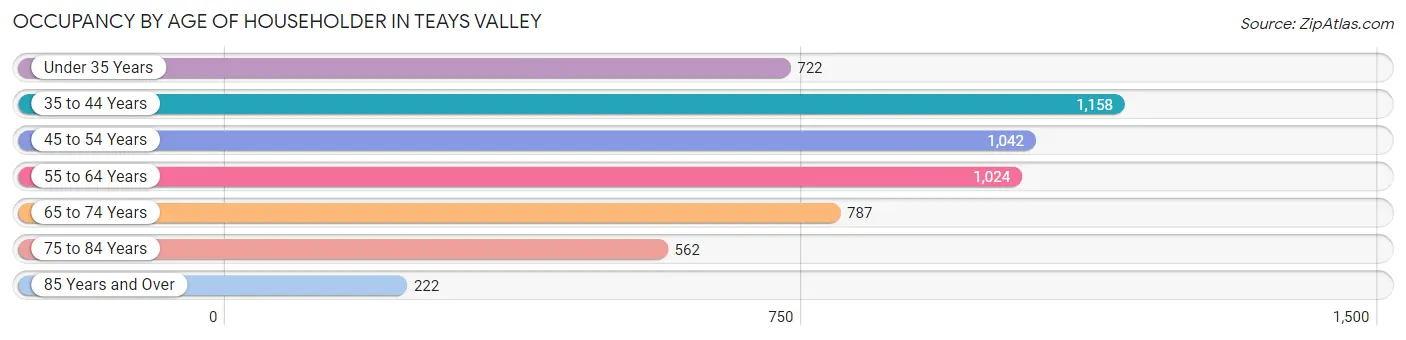
| Age Bracket | # Households | % Households |
| Under 35 Years | 722 | 13.1% |
| 35 to 44 Years | 1,158 | 21.0% |
| 45 to 54 Years | 1,042 | 18.9% |
| 55 to 64 Years | 1,024 | 18.6% |
| 65 to 74 Years | 787 | 14.3% |
| 75 to 84 Years | 562 | 10.2% |
| 85 Years and Over | 222 | 4.0% |
| Total | 5,517 | 100.0% |
Housing Finances in Teays Valley
Median Income by Occupancy in Teays Valley
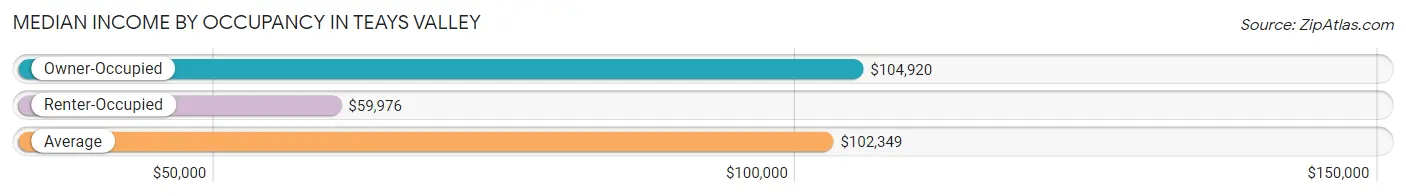
| Occupancy Type | # Households | Median Income |
| Owner-Occupied | 4,337 (78.6%) | $104,920 |
| Renter-Occupied | 1,180 (21.4%) | $59,976 |
| Average | 5,517 (100.0%) | $102,349 |
Occupancy by Householder Income Bracket in Teays Valley
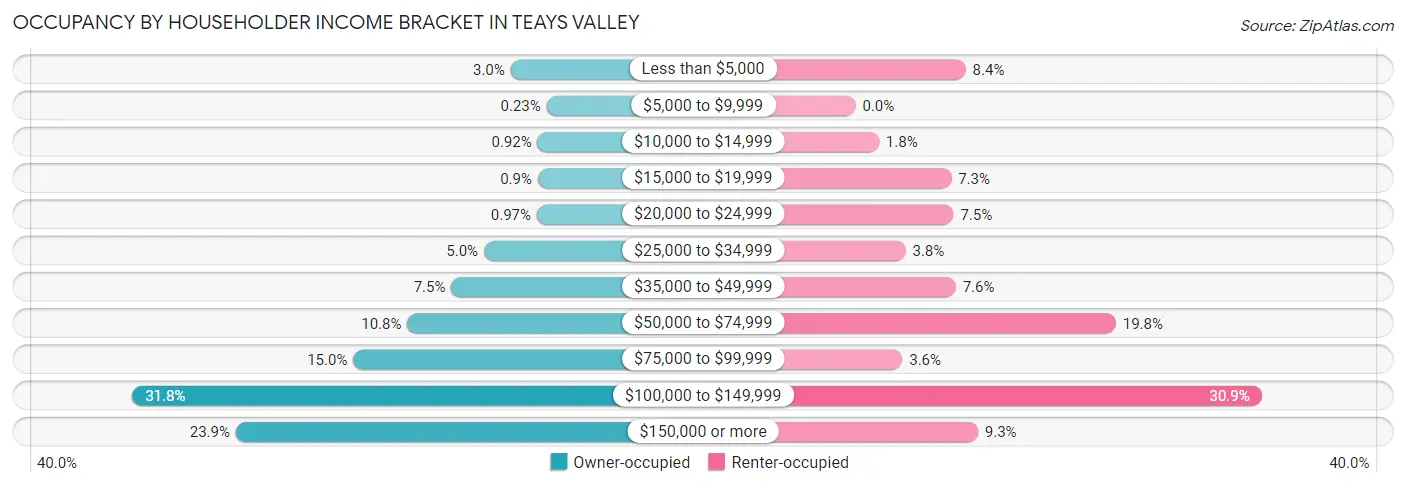
| Income Bracket | Owner-occupied | Renter-occupied |
| Less than $5,000 | 129 (3.0%) | 99 (8.4%) |
| $5,000 to $9,999 | 10 (0.2%) | 0 (0.0%) |
| $10,000 to $14,999 | 40 (0.9%) | 21 (1.8%) |
| $15,000 to $19,999 | 39 (0.9%) | 86 (7.3%) |
| $20,000 to $24,999 | 42 (1.0%) | 88 (7.5%) |
| $25,000 to $34,999 | 217 (5.0%) | 45 (3.8%) |
| $35,000 to $49,999 | 325 (7.5%) | 90 (7.6%) |
| $50,000 to $74,999 | 470 (10.8%) | 234 (19.8%) |
| $75,000 to $99,999 | 649 (15.0%) | 42 (3.6%) |
| $100,000 to $149,999 | 1,379 (31.8%) | 365 (30.9%) |
| $150,000 or more | 1,037 (23.9%) | 110 (9.3%) |
| Total | 4,337 (100.0%) | 1,180 (100.0%) |
Monthly Housing Cost Tiers in Teays Valley
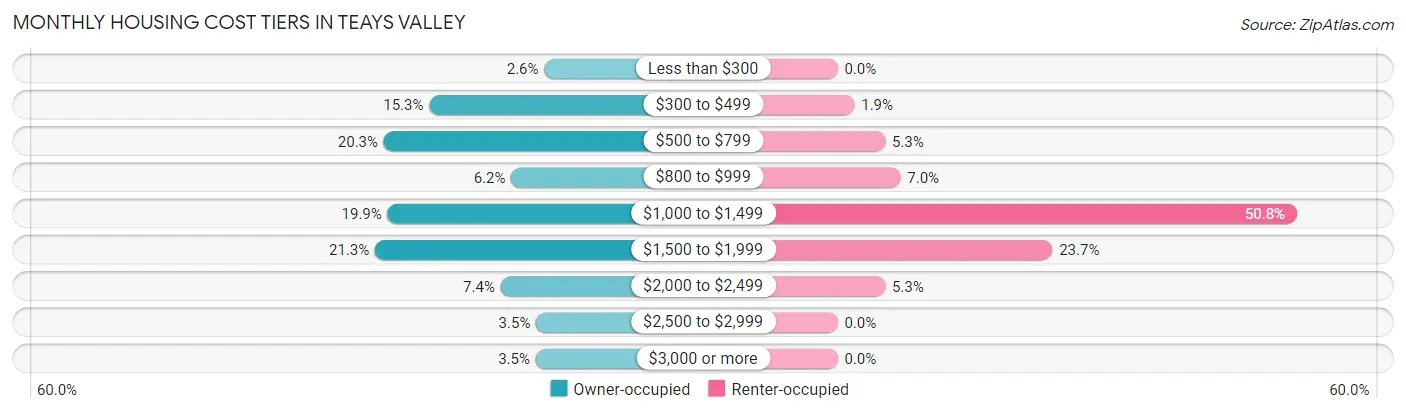
| Monthly Cost | Owner-occupied | Renter-occupied |
| Less than $300 | 112 (2.6%) | 0 (0.0%) |
| $300 to $499 | 663 (15.3%) | 22 (1.9%) |
| $500 to $799 | 881 (20.3%) | 62 (5.2%) |
| $800 to $999 | 270 (6.2%) | 82 (7.0%) |
| $1,000 to $1,499 | 863 (19.9%) | 599 (50.8%) |
| $1,500 to $1,999 | 923 (21.3%) | 280 (23.7%) |
| $2,000 to $2,499 | 321 (7.4%) | 62 (5.2%) |
| $2,500 to $2,999 | 151 (3.5%) | 0 (0.0%) |
| $3,000 or more | 153 (3.5%) | 0 (0.0%) |
| Total | 4,337 (100.0%) | 1,180 (100.0%) |
Physical Housing Characteristics in Teays Valley
Housing Structures in Teays Valley
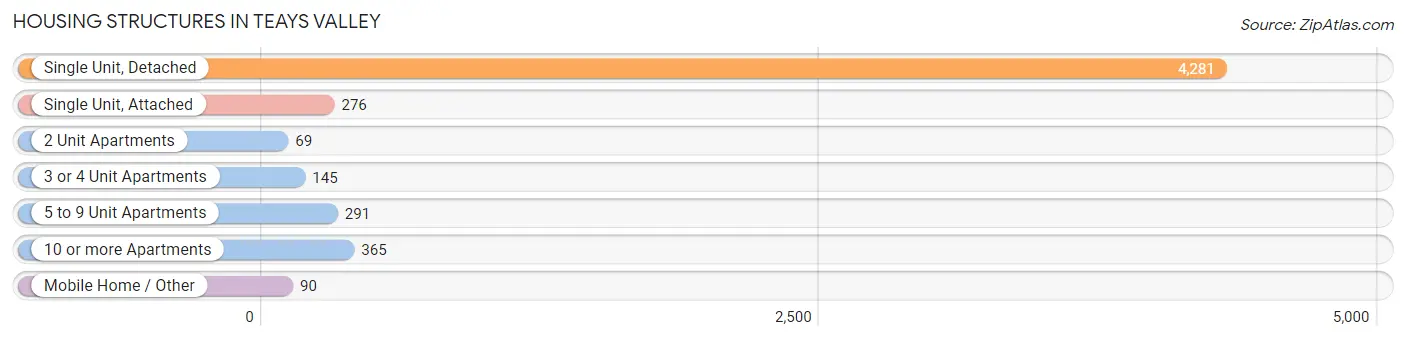
| Structure Type | # Housing Units | % Housing Units |
| Single Unit, Detached | 4,281 | 77.6% |
| Single Unit, Attached | 276 | 5.0% |
| 2 Unit Apartments | 69 | 1.3% |
| 3 or 4 Unit Apartments | 145 | 2.6% |
| 5 to 9 Unit Apartments | 291 | 5.3% |
| 10 or more Apartments | 365 | 6.6% |
| Mobile Home / Other | 90 | 1.6% |
| Total | 5,517 | 100.0% |
Housing Structures by Occupancy in Teays Valley
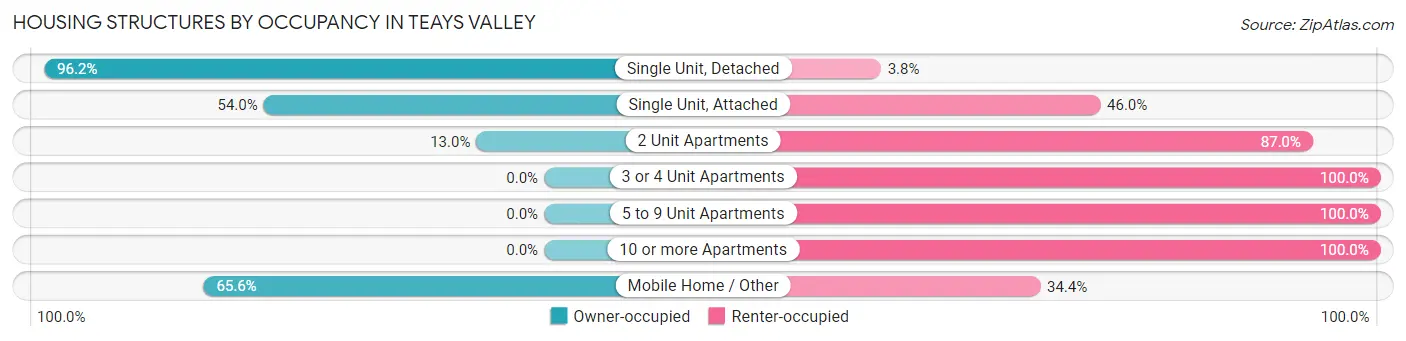
| Structure Type | Owner-occupied | Renter-occupied |
| Single Unit, Detached | 4,120 (96.2%) | 161 (3.8%) |
| Single Unit, Attached | 149 (54.0%) | 127 (46.0%) |
| 2 Unit Apartments | 9 (13.0%) | 60 (87.0%) |
| 3 or 4 Unit Apartments | 0 (0.0%) | 145 (100.0%) |
| 5 to 9 Unit Apartments | 0 (0.0%) | 291 (100.0%) |
| 10 or more Apartments | 0 (0.0%) | 365 (100.0%) |
| Mobile Home / Other | 59 (65.6%) | 31 (34.4%) |
| Total | 4,337 (78.6%) | 1,180 (21.4%) |
Housing Structures by Number of Rooms in Teays Valley
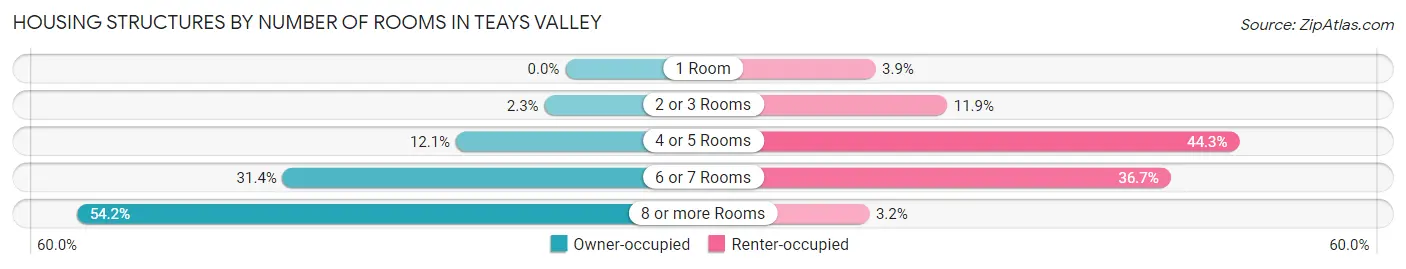
| Number of Rooms | Owner-occupied | Renter-occupied |
| 1 Room | 0 (0.0%) | 46 (3.9%) |
| 2 or 3 Rooms | 100 (2.3%) | 140 (11.9%) |
| 4 or 5 Rooms | 526 (12.1%) | 523 (44.3%) |
| 6 or 7 Rooms | 1,360 (31.4%) | 433 (36.7%) |
| 8 or more Rooms | 2,351 (54.2%) | 38 (3.2%) |
| Total | 4,337 (100.0%) | 1,180 (100.0%) |
Housing Structure by Heating Type in Teays Valley
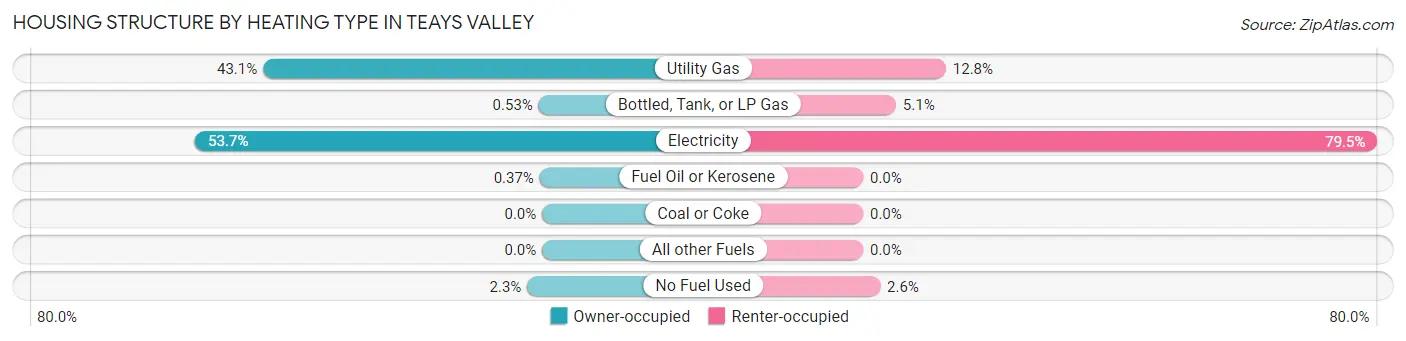
| Heating Type | Owner-occupied | Renter-occupied |
| Utility Gas | 1,871 (43.1%) | 151 (12.8%) |
| Bottled, Tank, or LP Gas | 23 (0.5%) | 60 (5.1%) |
| Electricity | 2,327 (53.6%) | 938 (79.5%) |
| Fuel Oil or Kerosene | 16 (0.4%) | 0 (0.0%) |
| Coal or Coke | 0 (0.0%) | 0 (0.0%) |
| All other Fuels | 0 (0.0%) | 0 (0.0%) |
| No Fuel Used | 100 (2.3%) | 31 (2.6%) |
| Total | 4,337 (100.0%) | 1,180 (100.0%) |
Household Vehicle Usage in Teays Valley
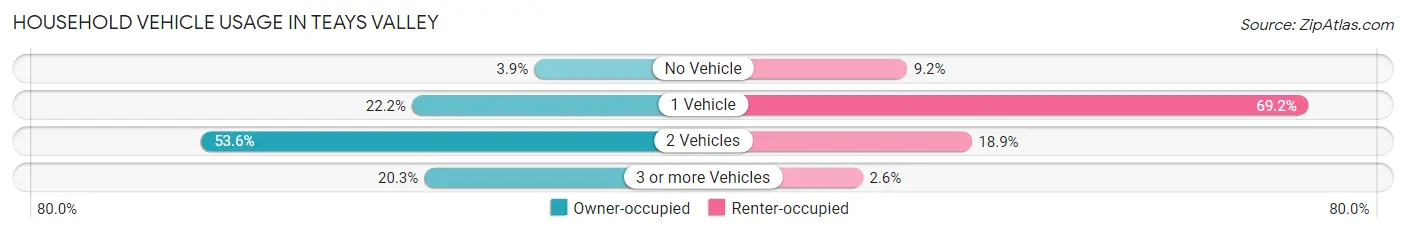
| Vehicles per Household | Owner-occupied | Renter-occupied |
| No Vehicle | 169 (3.9%) | 109 (9.2%) |
| 1 Vehicle | 961 (22.2%) | 817 (69.2%) |
| 2 Vehicles | 2,325 (53.6%) | 223 (18.9%) |
| 3 or more Vehicles | 882 (20.3%) | 31 (2.6%) |
| Total | 4,337 (100.0%) | 1,180 (100.0%) |
Real Estate & Mortgages in Teays Valley
Real Estate and Mortgage Overview in Teays Valley
| Characteristic | Without Mortgage | With Mortgage |
| Housing Units | 1,686 | 2,651 |
| Median Property Value | $277,500 | $254,200 |
| Median Household Income | $86,429 | $647 |
| Monthly Housing Costs | $522 | $153 |
| Real Estate Taxes | $1,537 | $57 |
Property Value by Mortgage Status in Teays Valley
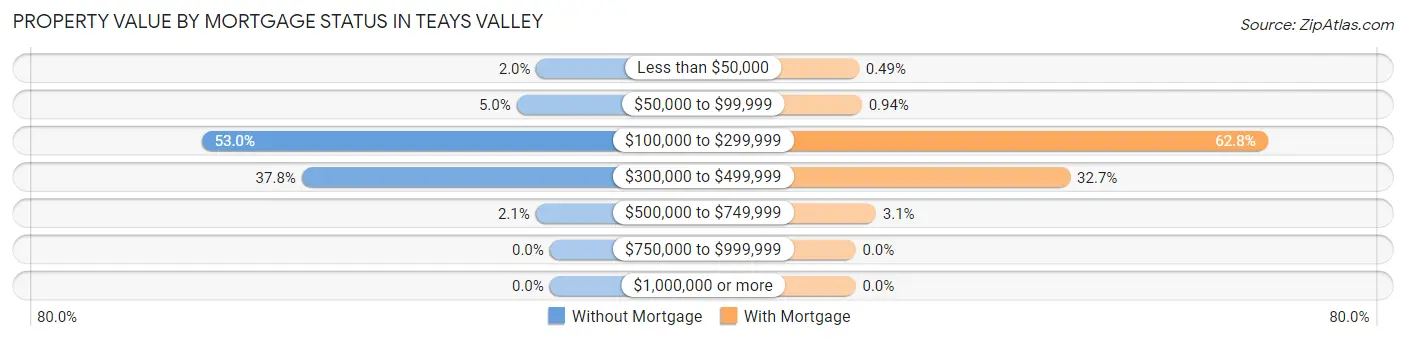
| Property Value | Without Mortgage | With Mortgage |
| Less than $50,000 | 34 (2.0%) | 13 (0.5%) |
| $50,000 to $99,999 | 85 (5.0%) | 25 (0.9%) |
| $100,000 to $299,999 | 894 (53.0%) | 1,664 (62.8%) |
| $300,000 to $499,999 | 637 (37.8%) | 867 (32.7%) |
| $500,000 to $749,999 | 36 (2.1%) | 82 (3.1%) |
| $750,000 to $999,999 | 0 (0.0%) | 0 (0.0%) |
| $1,000,000 or more | 0 (0.0%) | 0 (0.0%) |
| Total | 1,686 (100.0%) | 2,651 (100.0%) |
Household Income by Mortgage Status in Teays Valley
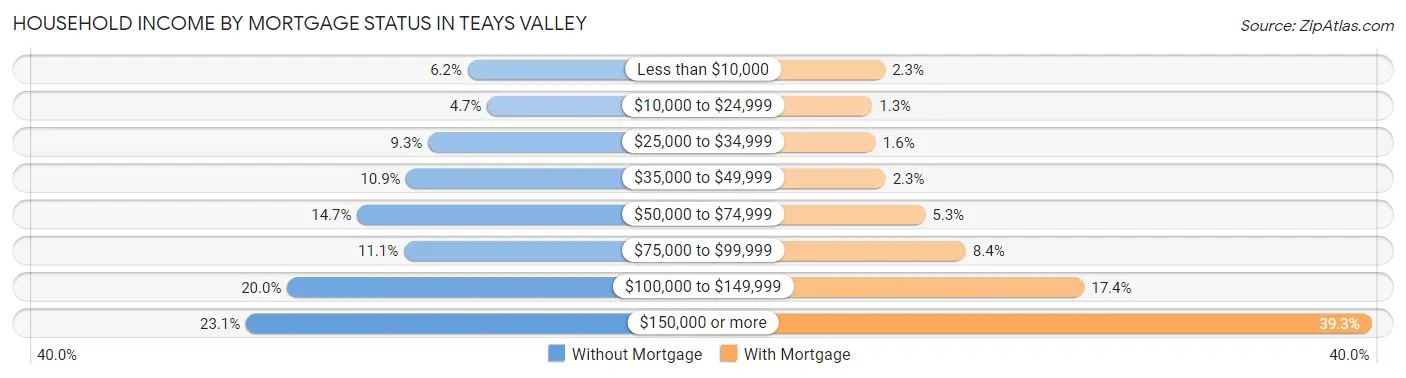
| Household Income | Without Mortgage | With Mortgage |
| Less than $10,000 | 105 (6.2%) | 60 (2.3%) |
| $10,000 to $24,999 | 80 (4.7%) | 34 (1.3%) |
| $25,000 to $34,999 | 156 (9.2%) | 41 (1.5%) |
| $35,000 to $49,999 | 184 (10.9%) | 61 (2.3%) |
| $50,000 to $74,999 | 247 (14.6%) | 141 (5.3%) |
| $75,000 to $99,999 | 187 (11.1%) | 223 (8.4%) |
| $100,000 to $149,999 | 337 (20.0%) | 462 (17.4%) |
| $150,000 or more | 390 (23.1%) | 1,042 (39.3%) |
| Total | 1,686 (100.0%) | 2,651 (100.0%) |
Property Value to Household Income Ratio in Teays Valley
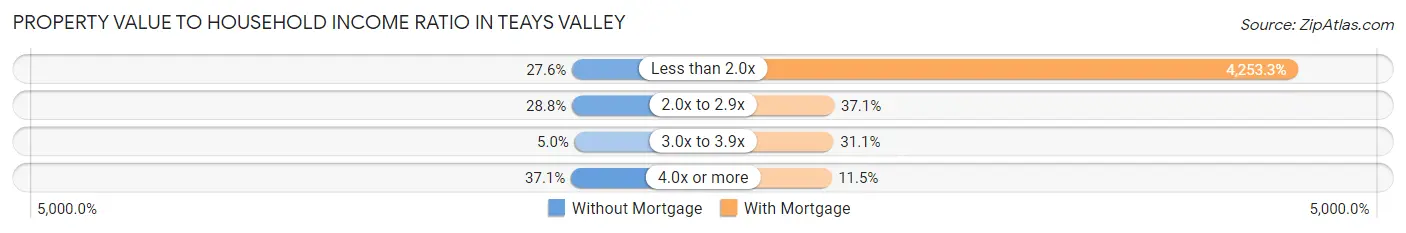
| Value-to-Income Ratio | Without Mortgage | With Mortgage |
| Less than 2.0x | 465 (27.6%) | 112,755 (4,253.3%) |
| 2.0x to 2.9x | 485 (28.8%) | 984 (37.1%) |
| 3.0x to 3.9x | 85 (5.0%) | 824 (31.1%) |
| 4.0x or more | 626 (37.1%) | 305 (11.5%) |
| Total | 1,686 (100.0%) | 2,651 (100.0%) |
Real Estate Taxes by Mortgage Status in Teays Valley
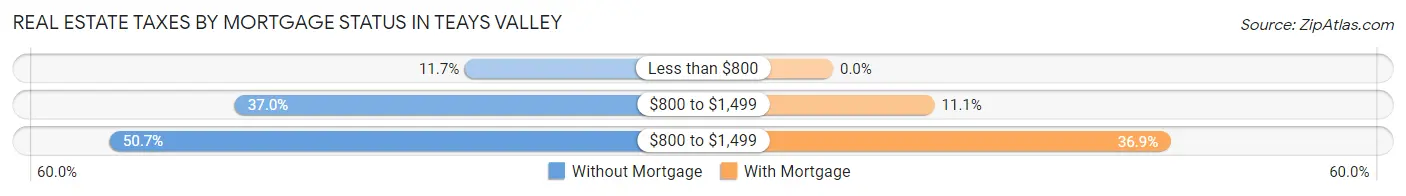
| Property Taxes | Without Mortgage | With Mortgage |
| Less than $800 | 198 (11.7%) | 0 (0.0%) |
| $800 to $1,499 | 623 (36.9%) | 295 (11.1%) |
| $800 to $1,499 | 854 (50.6%) | 979 (36.9%) |
| Total | 1,686 (100.0%) | 2,651 (100.0%) |
Health & Disability in Teays Valley
Health Insurance Coverage by Age in Teays Valley
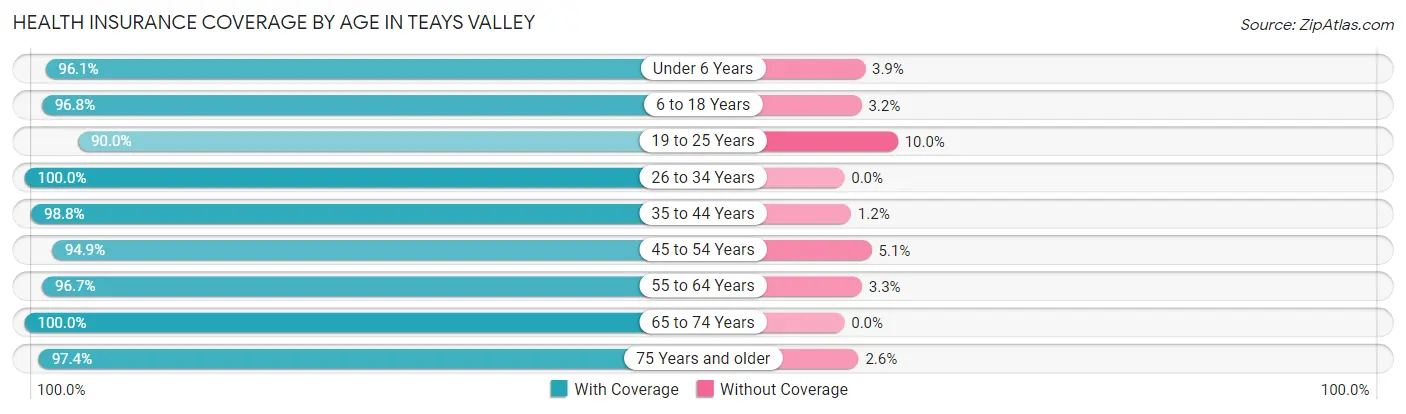
| Age Bracket | With Coverage | Without Coverage |
| Under 6 Years | 770 (96.1%) | 31 (3.9%) |
| 6 to 18 Years | 2,422 (96.8%) | 80 (3.2%) |
| 19 to 25 Years | 723 (90.0%) | 80 (10.0%) |
| 26 to 34 Years | 1,191 (100.0%) | 0 (0.0%) |
| 35 to 44 Years | 2,007 (98.8%) | 25 (1.2%) |
| 45 to 54 Years | 1,717 (94.9%) | 92 (5.1%) |
| 55 to 64 Years | 1,826 (96.7%) | 62 (3.3%) |
| 65 to 74 Years | 1,304 (100.0%) | 0 (0.0%) |
| 75 Years and older | 1,144 (97.4%) | 31 (2.6%) |
| Total | 13,104 (97.0%) | 401 (3.0%) |
Health Insurance Coverage by Citizenship Status in Teays Valley
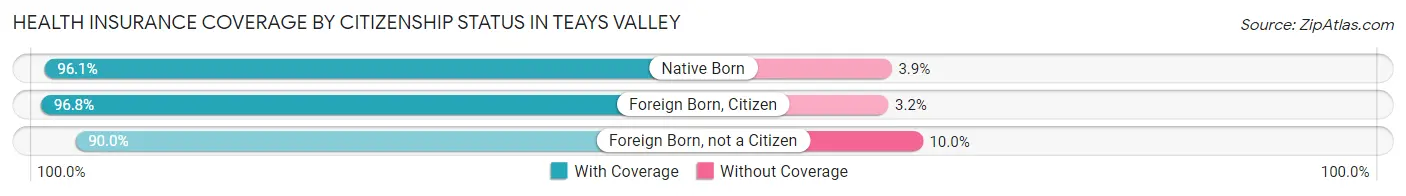
| Citizenship Status | With Coverage | Without Coverage |
| Native Born | 770 (96.1%) | 31 (3.9%) |
| Foreign Born, Citizen | 2,422 (96.8%) | 80 (3.2%) |
| Foreign Born, not a Citizen | 723 (90.0%) | 80 (10.0%) |
Health Insurance Coverage by Household Income in Teays Valley
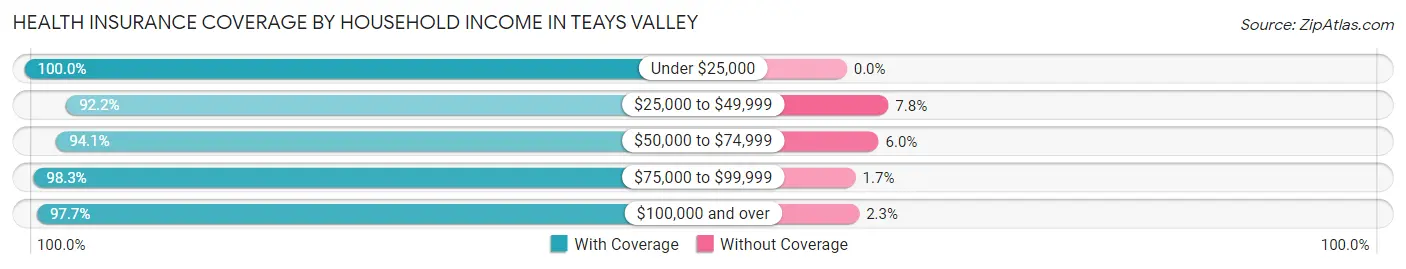
| Household Income | With Coverage | Without Coverage |
| Under $25,000 | 841 (100.0%) | 0 (0.0%) |
| $25,000 to $49,999 | 1,040 (92.2%) | 88 (7.8%) |
| $50,000 to $74,999 | 1,470 (94.1%) | 93 (5.9%) |
| $75,000 to $99,999 | 1,773 (98.3%) | 30 (1.7%) |
| $100,000 and over | 7,980 (97.7%) | 190 (2.3%) |
Public vs Private Health Insurance Coverage by Age in Teays Valley
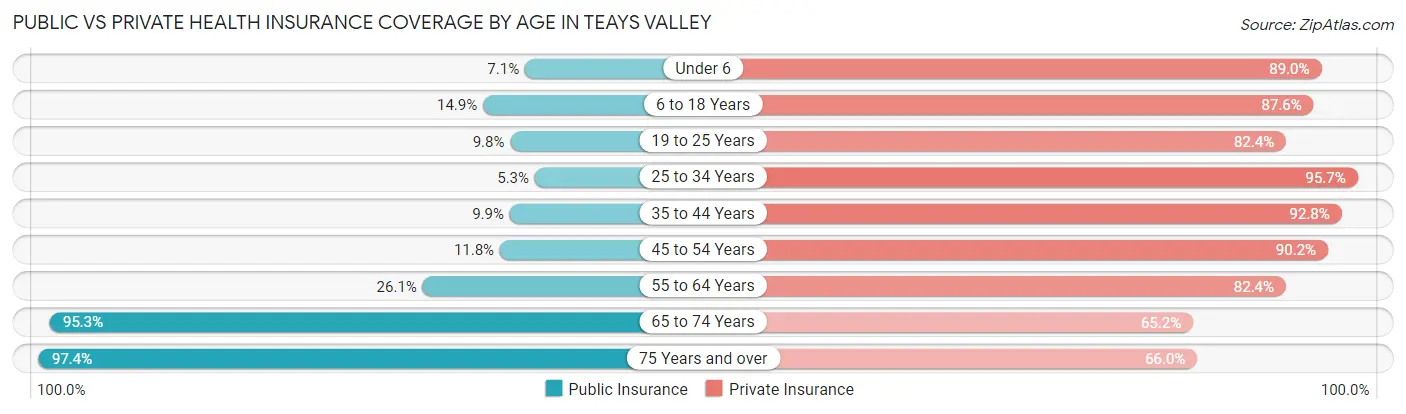
| Age Bracket | Public Insurance | Private Insurance |
| Under 6 | 57 (7.1%) | 713 (89.0%) |
| 6 to 18 Years | 373 (14.9%) | 2,191 (87.6%) |
| 19 to 25 Years | 79 (9.8%) | 662 (82.4%) |
| 25 to 34 Years | 63 (5.3%) | 1,140 (95.7%) |
| 35 to 44 Years | 202 (9.9%) | 1,885 (92.8%) |
| 45 to 54 Years | 213 (11.8%) | 1,632 (90.2%) |
| 55 to 64 Years | 493 (26.1%) | 1,556 (82.4%) |
| 65 to 74 Years | 1,243 (95.3%) | 850 (65.2%) |
| 75 Years and over | 1,144 (97.4%) | 775 (66.0%) |
| Total | 3,867 (28.6%) | 11,404 (84.4%) |
Disability Status by Sex by Age in Teays Valley
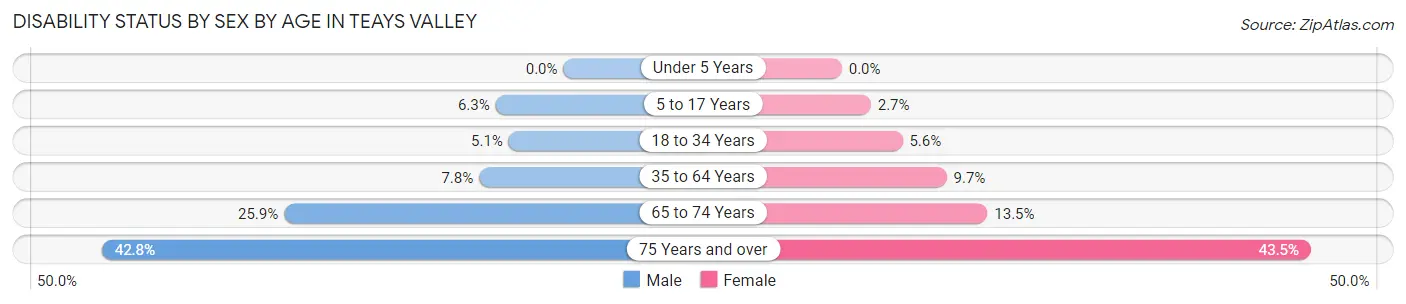
| Age Bracket | Male | Female |
| Under 5 Years | 0 (0.0%) | 0 (0.0%) |
| 5 to 17 Years | 97 (6.3%) | 25 (2.7%) |
| 18 to 34 Years | 50 (5.1%) | 71 (5.6%) |
| 35 to 64 Years | 227 (7.8%) | 275 (9.7%) |
| 65 to 74 Years | 148 (25.9%) | 99 (13.5%) |
| 75 Years and over | 212 (42.8%) | 296 (43.5%) |
Disability Class by Sex by Age in Teays Valley
Disability Class: Hearing Difficulty
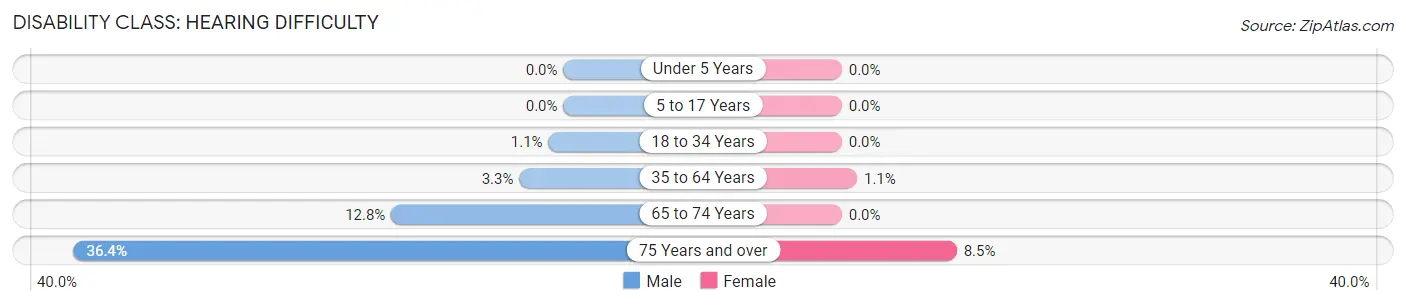
| Age Bracket | Male | Female |
| Under 5 Years | 0 (0.0%) | 0 (0.0%) |
| 5 to 17 Years | 0 (0.0%) | 0 (0.0%) |
| 18 to 34 Years | 11 (1.1%) | 0 (0.0%) |
| 35 to 64 Years | 95 (3.3%) | 32 (1.1%) |
| 65 to 74 Years | 73 (12.8%) | 0 (0.0%) |
| 75 Years and over | 180 (36.4%) | 58 (8.5%) |
Disability Class: Vision Difficulty
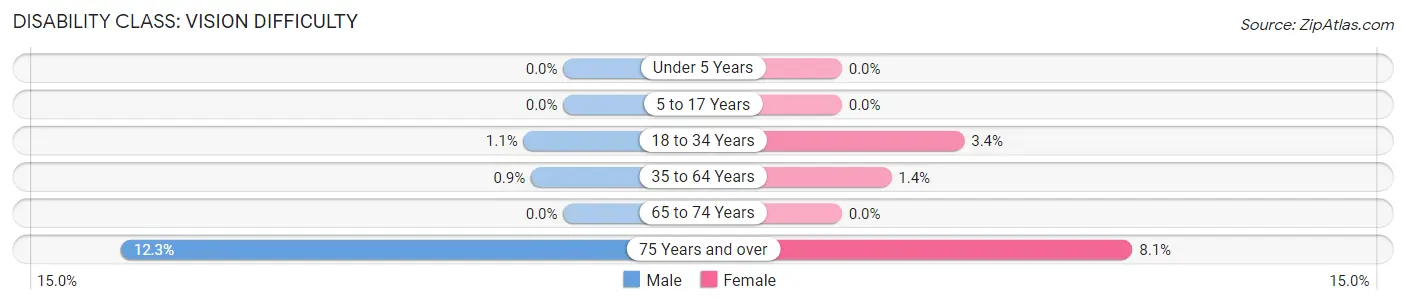
| Age Bracket | Male | Female |
| Under 5 Years | 0 (0.0%) | 0 (0.0%) |
| 5 to 17 Years | 0 (0.0%) | 0 (0.0%) |
| 18 to 34 Years | 11 (1.1%) | 43 (3.4%) |
| 35 to 64 Years | 26 (0.9%) | 39 (1.4%) |
| 65 to 74 Years | 0 (0.0%) | 0 (0.0%) |
| 75 Years and over | 61 (12.3%) | 55 (8.1%) |
Disability Class: Cognitive Difficulty
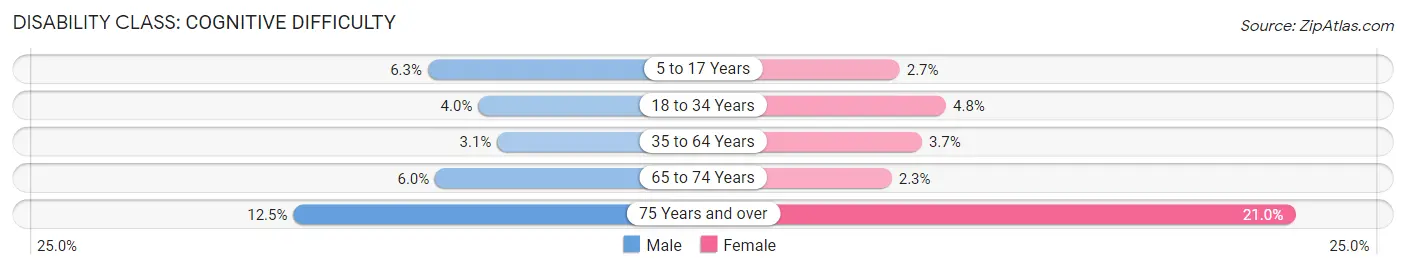
| Age Bracket | Male | Female |
| 5 to 17 Years | 97 (6.3%) | 25 (2.7%) |
| 18 to 34 Years | 39 (4.0%) | 61 (4.8%) |
| 35 to 64 Years | 89 (3.1%) | 105 (3.7%) |
| 65 to 74 Years | 34 (5.9%) | 17 (2.3%) |
| 75 Years and over | 62 (12.5%) | 143 (21.0%) |
Disability Class: Ambulatory Difficulty
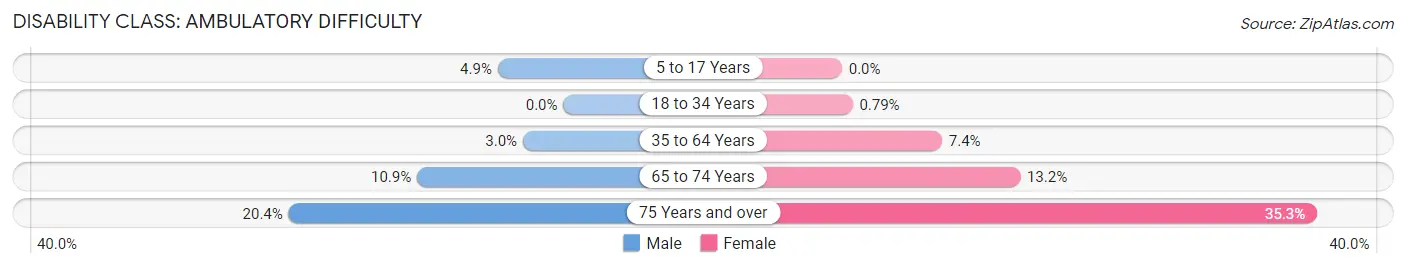
| Age Bracket | Male | Female |
| 5 to 17 Years | 75 (4.9%) | 0 (0.0%) |
| 18 to 34 Years | 0 (0.0%) | 10 (0.8%) |
| 35 to 64 Years | 87 (3.0%) | 210 (7.4%) |
| 65 to 74 Years | 62 (10.9%) | 97 (13.2%) |
| 75 Years and over | 101 (20.4%) | 240 (35.3%) |
Disability Class: Self-Care Difficulty
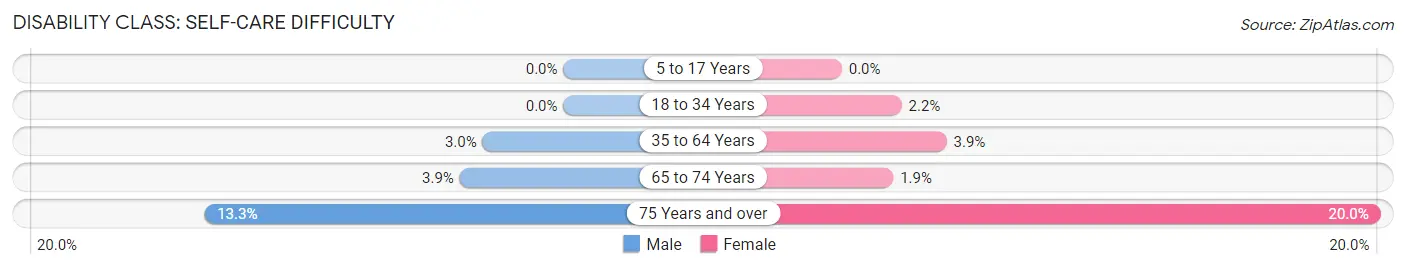
| Age Bracket | Male | Female |
| 5 to 17 Years | 0 (0.0%) | 0 (0.0%) |
| 18 to 34 Years | 0 (0.0%) | 28 (2.2%) |
| 35 to 64 Years | 87 (3.0%) | 110 (3.9%) |
| 65 to 74 Years | 22 (3.8%) | 14 (1.9%) |
| 75 Years and over | 66 (13.3%) | 136 (20.0%) |
Technology Access in Teays Valley
Computing Device Access in Teays Valley
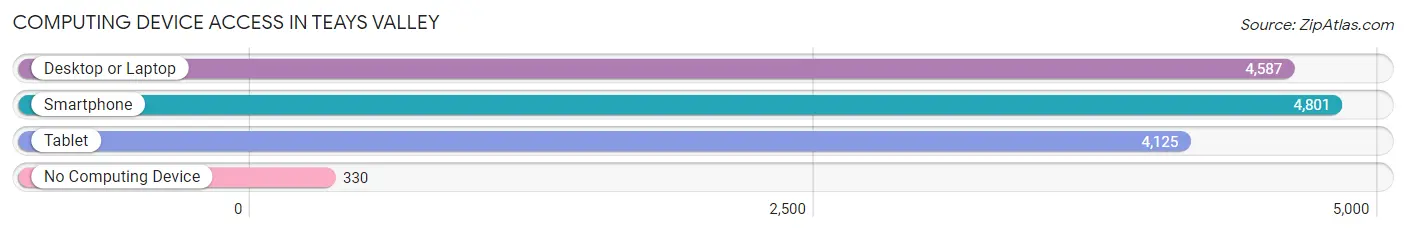
| Device Type | # Households | % Households |
| Desktop or Laptop | 4,587 | 83.1% |
| Smartphone | 4,801 | 87.0% |
| Tablet | 4,125 | 74.8% |
| No Computing Device | 330 | 6.0% |
| Total | 5,517 | 100.0% |
Internet Access in Teays Valley
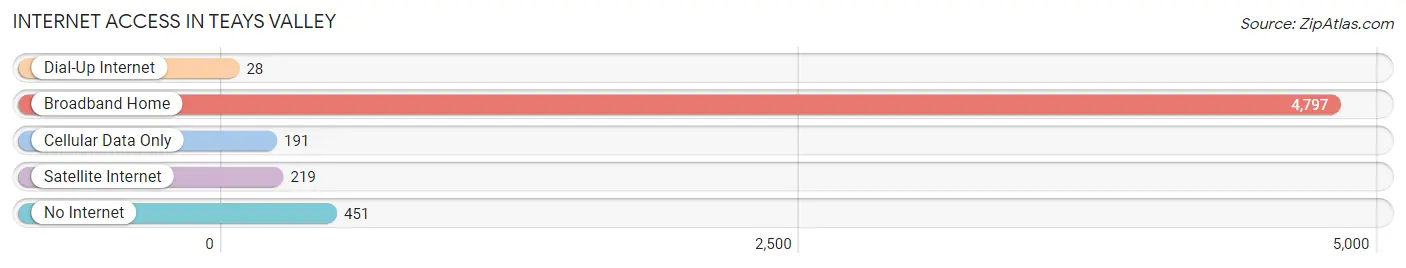
| Internet Type | # Households | % Households |
| Dial-Up Internet | 28 | 0.5% |
| Broadband Home | 4,797 | 87.0% |
| Cellular Data Only | 191 | 3.5% |
| Satellite Internet | 219 | 4.0% |
| No Internet | 451 | 8.2% |
| Total | 5,517 | 100.0% |
Teays Valley Summary
Teays Valley is a small unincorporated community located in Putnam County, West Virginia. It is situated along the banks of the Teays River, which is a tributary of the Kanawha River. The community is located approximately 25 miles south of Charleston, the state capital.
History
The area that is now Teays Valley was first settled in the late 1700s by European settlers. The area was originally known as “Teays’s Bottom”, named after the Teays River. The area was primarily used for farming and was home to a few small businesses.
In the early 1900s, the area began to experience rapid growth due to the development of the coal industry. The Chesapeake and Ohio Railway (C&O) built a line through the area, connecting it to the larger cities of Charleston and Huntington. This allowed for the transportation of coal and other goods to and from the area.
The town of Teays Valley was officially incorporated in 1921. The town was named after the Teays River, which runs through the area. The town quickly grew in size and population, reaching a peak population of 1,500 in the 1950s.
Geography
Teays Valley is located in Putnam County, West Virginia. It is situated along the banks of the Teays River, which is a tributary of the Kanawha River. The area is mostly rural, with rolling hills and forests. The climate is humid and subtropical, with hot summers and mild winters.
The town of Teays Valley is located approximately 25 miles south of Charleston, the state capital. It is also located approximately 30 miles east of Huntington, the largest city in the state.
Economy
The economy of Teays Valley is largely based on agriculture and tourism. The area is home to several farms, which produce a variety of crops, including corn, soybeans, and hay. The area is also home to several wineries, which produce a variety of wines.
The town of Teays Valley is also home to several small businesses, including restaurants, shops, and other services. The town is also home to a few manufacturing companies, which produce a variety of products, including furniture and clothing.
Demographics
As of the 2010 census, the population of Teays Valley was 1,093. The population is primarily white (97.2%), with a small percentage of African Americans (1.2%) and Hispanics (1.6%). The median household income is $41,250, and the median home value is $117,000.
Conclusion
Teays Valley is a small unincorporated community located in Putnam County, West Virginia. It is situated along the banks of the Teays River, which is a tributary of the Kanawha River. The area was first settled in the late 1700s and was officially incorporated in 1921. The economy of Teays Valley is largely based on agriculture and tourism. As of the 2010 census, the population of Teays Valley was 1,093. The population is primarily white, with a small percentage of African Americans and Hispanics.
Common Questions
What is the Total Population of Teays Valley?
Total Population of Teays Valley is 13,816.
What is the Total Male Population of Teays Valley?
Total Male Population of Teays Valley is 6,915.
What is the Total Female Population of Teays Valley?
Total Female Population of Teays Valley is 6,901.
What is the Ratio of Males per 100 Females in Teays Valley?
There are 100.20 Males per 100 Females in Teays Valley.
What is the Ratio of Females per 100 Males in Teays Valley?
There are 99.80 Females per 100 Males in Teays Valley.
What is the Median Population Age in Teays Valley?
Median Population Age in Teays Valley is 42.4 Years.
What is the Average Family Size in Teays Valley
Average Family Size in Teays Valley is 3.0 People.
What is the Average Household Size in Teays Valley
Average Household Size in Teays Valley is 2.5 People.
What is Per Capita Income in Teays Valley?
Per Capita income in Teays Valley is $47,520.
What is the Median Family Income in Teays Valley?
Median Family Income in Teays Valley is $110,469.
What is the Median Household income in Teays Valley?
Median Household Income in Teays Valley is $102,349.
What is Income or Wage Gap in Teays Valley?
Income or Wage Gap in Teays Valley is 35.8%.
Women in Teays Valley earn 64.2 cents for every dollar earned by a man.
What is Family Income Deficit in Teays Valley?
Family Income Deficit in Teays Valley is $16,541.
Families that are below poverty line in Teays Valley earn $16,541 less on average than the poverty threshold level.
What is Inequality or Gini Index in Teays Valley?
Inequality or Gini Index in Teays Valley is 0.39.
How Large is the Labor Force in Teays Valley?
There are 6,884 People in the Labor Forcein in Teays Valley.
What is the Percentage of People in the Labor Force in Teays Valley?
62.5% of People are in the Labor Force in Teays Valley.
What is the Unemployment Rate in Teays Valley?
Unemployment Rate in Teays Valley is 3.4%.