Cities with the Highest Percentage of Population with a Degree in Literature and Languages in West Virginia
RELATED REPORTS & OPTIONS
Literature and Languages
West Virginia
Compare Cities
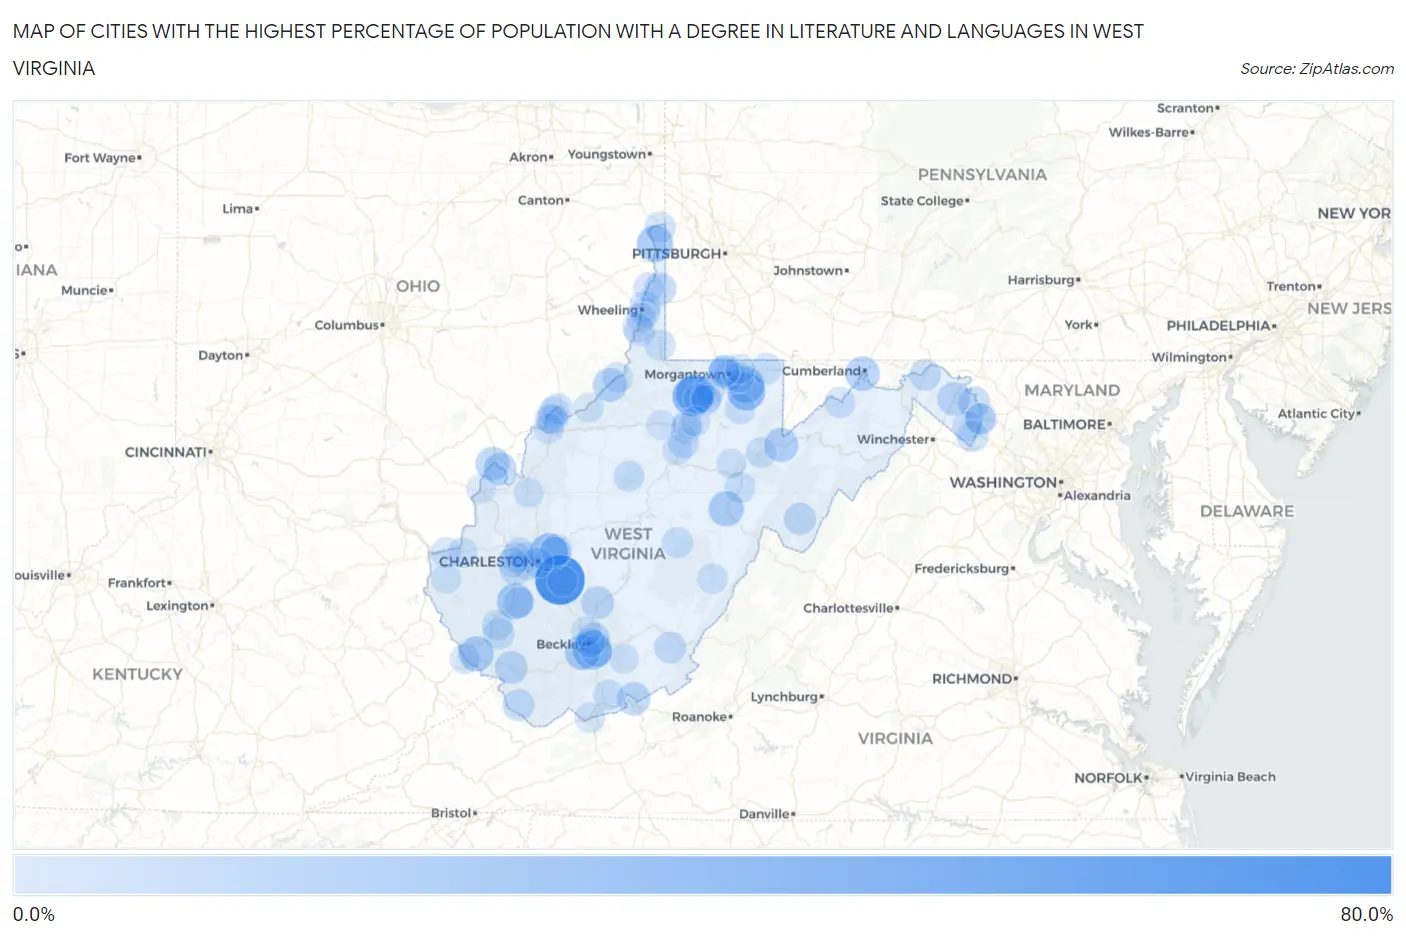
Map of Cities with the Highest Percentage of Population with a Degree in Literature and Languages in West Virginia
0.0%
80.0%
Cities with the Highest Percentage of Population with a Degree in Literature and Languages in West Virginia
| City | % Graduates | vs State | vs National | |
| 1. | Cedar Grove | 68.8% | 2.9%(+65.8)#1 | 4.4%(+64.3)#48 |
| 2. | Institute | 42.3% | 2.9%(+39.4)#2 | 4.4%(+37.9)#139 |
| 3. | Malden | 36.9% | 2.9%(+34.0)#3 | 4.4%(+32.5)#188 |
| 4. | Carolina | 35.5% | 2.9%(+32.5)#4 | 4.4%(+31.1)#206 |
| 5. | Idamay | 31.3% | 2.9%(+28.4)#5 | 4.4%(+26.9)#283 |
| 6. | Beaver | 30.7% | 2.9%(+27.8)#6 | 4.4%(+26.3)#292 |
| 7. | Big Chimney | 29.5% | 2.9%(+26.6)#7 | 4.4%(+25.1)#312 |
| 8. | Reedsville | 28.6% | 2.9%(+25.6)#8 | 4.4%(+24.2)#334 |
| 9. | Masontown | 23.2% | 2.9%(+20.3)#9 | 4.4%(+18.8)#498 |
| 10. | New Cumberland | 22.8% | 2.9%(+19.9)#10 | 4.4%(+18.4)#511 |
| 11. | Danville | 21.6% | 2.9%(+18.6)#11 | 4.4%(+17.2)#557 |
| 12. | Huttonsville | 18.8% | 2.9%(+15.8)#12 | 4.4%(+14.3)#730 |
| 13. | Delbarton | 18.4% | 2.9%(+15.4)#13 | 4.4%(+14.0)#754 |
| 14. | Sophia | 18.3% | 2.9%(+15.4)#14 | 4.4%(+13.9)#759 |
| 15. | Carpendale | 16.7% | 2.9%(+13.7)#15 | 4.4%(+12.3)#876 |
| 16. | Thomas | 15.6% | 2.9%(+12.7)#16 | 4.4%(+11.2)#990 |
| 17. | Sistersville | 15.0% | 2.9%(+12.1)#17 | 4.4%(+10.6)#1,056 |
| 18. | Mason | 14.1% | 2.9%(+11.1)#18 | 4.4%(+9.65)#1,208 |
| 19. | Peterstown | 13.2% | 2.9%(+10.3)#19 | 4.4%(+8.80)#1,367 |
| 20. | Martinsburg | 12.7% | 2.9%(+9.72)#20 | 4.4%(+8.25)#1,450 |
| 21. | New Haven | 11.9% | 2.9%(+8.98)#21 | 4.4%(+7.51)#1,584 |
| 22. | Fayetteville | 11.2% | 2.9%(+8.28)#22 | 4.4%(+6.81)#1,739 |
| 23. | Gilbert | 10.7% | 2.9%(+7.78)#23 | 4.4%(+6.30)#1,910 |
| 24. | Bethany | 9.9% | 2.9%(+6.99)#24 | 4.4%(+5.52)#2,182 |
| 25. | Shepherdstown | 8.7% | 2.9%(+5.76)#25 | 4.4%(+4.29)#2,745 |
| 26. | Franklin | 8.7% | 2.9%(+5.72)#26 | 4.4%(+4.25)#2,774 |
| 27. | Stanaford | 8.5% | 2.9%(+5.55)#27 | 4.4%(+4.08)#2,881 |
| 28. | Elkview | 7.7% | 2.9%(+4.80)#28 | 4.4%(+3.33)#3,322 |
| 29. | Granville | 7.5% | 2.9%(+4.56)#29 | 4.4%(+3.09)#3,507 |
| 30. | Bath Berkeley Springs | 7.3% | 2.9%(+4.35)#30 | 4.4%(+2.88)#3,674 |
| 31. | Ronceverte | 7.2% | 2.9%(+4.31)#31 | 4.4%(+2.84)#3,700 |
| 32. | Bradshaw | 7.1% | 2.9%(+4.20)#32 | 4.4%(+2.73)#3,808 |
| 33. | Pinch | 6.8% | 2.9%(+3.89)#33 | 4.4%(+2.41)#4,118 |
| 34. | Harpers Ferry | 6.8% | 2.9%(+3.85)#34 | 4.4%(+2.38)#4,153 |
| 35. | Logan | 6.6% | 2.9%(+3.69)#35 | 4.4%(+2.22)#4,309 |
| 36. | Shannondale | 6.3% | 2.9%(+3.38)#36 | 4.4%(+1.91)#4,636 |
| 37. | Lost Creek | 6.2% | 2.9%(+3.31)#37 | 4.4%(+1.84)#4,721 |
| 38. | Daniels | 6.2% | 2.9%(+3.23)#38 | 4.4%(+1.76)#4,819 |
| 39. | Wheeling | 6.0% | 2.9%(+3.08)#39 | 4.4%(+1.61)#5,011 |
| 40. | Chester | 5.9% | 2.9%(+2.93)#40 | 4.4%(+1.46)#5,211 |
| 41. | Brandonville | 5.7% | 2.9%(+2.72)#41 | 4.4%(+1.25)#5,474 |
| 42. | Beverly | 5.6% | 2.9%(+2.62)#42 | 4.4%(+1.15)#5,619 |
| 43. | Rivesville | 5.6% | 2.9%(+2.62)#43 | 4.4%(+1.15)#5,620 |
| 44. | Addison Webster Springs | 5.5% | 2.9%(+2.56)#44 | 4.4%(+1.08)#5,711 |
| 45. | Boaz | 5.2% | 2.9%(+2.29)#45 | 4.4%(+0.814)#6,146 |
| 46. | Mitchell Heights | 5.1% | 2.9%(+2.16)#46 | 4.4%(+0.692)#6,349 |
| 47. | Glenville | 5.1% | 2.9%(+2.16)#47 | 4.4%(+0.688)#6,357 |
| 48. | Morgantown | 5.0% | 2.9%(+2.08)#48 | 4.4%(+0.610)#6,501 |
| 49. | Keyser | 5.0% | 2.9%(+2.02)#49 | 4.4%(+0.553)#6,603 |
| 50. | Athens | 4.8% | 2.9%(+1.91)#50 | 4.4%(+0.435)#6,817 |
| 51. | Cameron | 4.8% | 2.9%(+1.90)#51 | 4.4%(+0.429)#6,833 |
| 52. | Madison | 4.7% | 2.9%(+1.76)#52 | 4.4%(+0.285)#7,113 |
| 53. | South Charleston | 4.6% | 2.9%(+1.69)#53 | 4.4%(+0.221)#7,230 |
| 54. | Newburg | 4.5% | 2.9%(+1.61)#54 | 4.4%(+0.136)#7,388 |
| 55. | Alum Creek | 4.5% | 2.9%(+1.58)#55 | 4.4%(+0.113)#7,428 |
| 56. | Williamstown | 4.3% | 2.9%(+1.34)#56 | 4.4%(-0.128)#7,914 |
| 57. | Moundsville | 4.2% | 2.9%(+1.28)#57 | 4.4%(-0.191)#8,064 |
| 58. | Dunbar | 4.2% | 2.9%(+1.28)#58 | 4.4%(-0.196)#8,076 |
| 59. | Huntington | 4.2% | 2.9%(+1.23)#59 | 4.4%(-0.245)#8,197 |
| 60. | St Albans | 4.0% | 2.9%(+1.09)#60 | 4.4%(-0.379)#8,480 |
| 61. | Marlinton | 4.0% | 2.9%(+1.03)#61 | 4.4%(-0.441)#8,634 |
| 62. | Nutter Fort | 3.9% | 2.9%(+0.983)#62 | 4.4%(-0.488)#8,721 |
| 63. | Bolivar | 3.9% | 2.9%(+0.968)#63 | 4.4%(-0.503)#8,767 |
| 64. | Parsons | 3.9% | 2.9%(+0.933)#64 | 4.4%(-0.539)#8,863 |
| 65. | Bluefield | 3.9% | 2.9%(+0.922)#65 | 4.4%(-0.549)#8,885 |
| 66. | North Hills | 3.9% | 2.9%(+0.919)#66 | 4.4%(-0.552)#8,892 |
| 67. | Beech Bottom | 3.8% | 2.9%(+0.908)#67 | 4.4%(-0.563)#8,933 |
| 68. | Star City | 3.8% | 2.9%(+0.896)#68 | 4.4%(-0.576)#8,970 |
| 69. | Charleston | 3.8% | 2.9%(+0.895)#69 | 4.4%(-0.576)#8,971 |
| 70. | Ranson Corporation | 3.8% | 2.9%(+0.877)#70 | 4.4%(-0.594)#9,001 |
| 71. | Brookhaven | 3.7% | 2.9%(+0.753)#71 | 4.4%(-0.719)#9,282 |
| 72. | Charles Town | 3.6% | 2.9%(+0.710)#72 | 4.4%(-0.761)#9,368 |
| 73. | Fairmont | 3.6% | 2.9%(+0.698)#73 | 4.4%(-0.773)#9,391 |
| 74. | Westover | 3.6% | 2.9%(+0.675)#74 | 4.4%(-0.796)#9,468 |
| 75. | Nitro | 3.6% | 2.9%(+0.628)#75 | 4.4%(-0.844)#9,589 |
| 76. | Glen Dale | 3.3% | 2.9%(+0.337)#76 | 4.4%(-1.13)#10,268 |
| 77. | Tornado | 3.3% | 2.9%(+0.323)#77 | 4.4%(-1.15)#10,300 |
| 78. | Barboursville | 3.2% | 2.9%(+0.308)#78 | 4.4%(-1.16)#10,338 |
| 79. | Pleasant Valley | 3.2% | 2.9%(+0.255)#79 | 4.4%(-1.22)#10,465 |
| 80. | Williamson | 3.2% | 2.9%(+0.253)#80 | 4.4%(-1.22)#10,469 |
| 81. | Paden City | 3.2% | 2.9%(+0.226)#81 | 4.4%(-1.25)#10,532 |
| 82. | Jane Lew | 3.0% | 2.9%(+0.092)#82 | 4.4%(-1.38)#10,831 |
| 83. | Parkersburg | 3.0% | 2.9%(+0.076)#83 | 4.4%(-1.40)#10,869 |
| 84. | Bradley | 2.9% | 2.9%(-0.081)#84 | 4.4%(-1.55)#11,227 |
| 85. | Clarksburg | 2.8% | 2.9%(-0.112)#85 | 4.4%(-1.58)#11,294 |
| 86. | Bethlehem | 2.8% | 2.9%(-0.114)#86 | 4.4%(-1.59)#11,303 |
| 87. | Ripley | 2.8% | 2.9%(-0.130)#87 | 4.4%(-1.60)#11,330 |
| 88. | Monongah | 2.6% | 2.9%(-0.307)#88 | 4.4%(-1.78)#11,758 |
| 89. | Vienna | 2.6% | 2.9%(-0.308)#89 | 4.4%(-1.78)#11,778 |
| 90. | Beckley | 2.6% | 2.9%(-0.313)#90 | 4.4%(-1.78)#11,788 |
| 91. | Glasgow | 2.6% | 2.9%(-0.374)#91 | 4.4%(-1.85)#11,924 |
| 92. | St Marys | 2.5% | 2.9%(-0.429)#92 | 4.4%(-1.90)#12,046 |
| 93. | Hinton | 2.3% | 2.9%(-0.597)#93 | 4.4%(-2.07)#12,448 |
| 94. | Salem | 2.3% | 2.9%(-0.648)#94 | 4.4%(-2.12)#12,565 |
| 95. | Wayne | 2.3% | 2.9%(-0.666)#95 | 4.4%(-2.14)#12,608 |
| 96. | Cheat Lake | 2.2% | 2.9%(-0.719)#96 | 4.4%(-2.19)#12,750 |
| 97. | Benwood | 2.1% | 2.9%(-0.811)#97 | 4.4%(-2.28)#12,984 |
| 98. | Bridgeport | 2.1% | 2.9%(-0.874)#98 | 4.4%(-2.35)#13,142 |
| 99. | Belington | 2.1% | 2.9%(-0.884)#99 | 4.4%(-2.35)#13,171 |
| 100. | Point Pleasant | 2.0% | 2.9%(-0.903)#100 | 4.4%(-2.37)#13,208 |
Common Questions
What are the Top 10 Cities with the Highest Percentage of Population with a Degree in Literature and Languages in West Virginia?
Top 10 Cities with the Highest Percentage of Population with a Degree in Literature and Languages in West Virginia are:
#1
68.8%
#2
35.5%
#3
31.3%
#4
30.7%
#5
29.5%
#6
28.6%
#7
23.2%
#8
22.8%
#9
21.6%
#10
18.8%
What city has the Highest Percentage of Population with a Degree in Literature and Languages in West Virginia?
Cedar Grove has the Highest Percentage of Population with a Degree in Literature and Languages in West Virginia with 68.8%.
What is the Percentage of Population with a Degree in Literature and Languages in the State of West Virginia?
Percentage of Population with a Degree in Literature and Languages in West Virginia is 2.9%.
What is the Percentage of Population with a Degree in Literature and Languages in the United States?
Percentage of Population with a Degree in Literature and Languages in the United States is 4.4%.