Cities with the Lowest Poverty Level Among Single Females in West Virginia
RELATED REPORTS & OPTIONS
Lowest Poverty | Single Female
West Virginia
Compare Cities
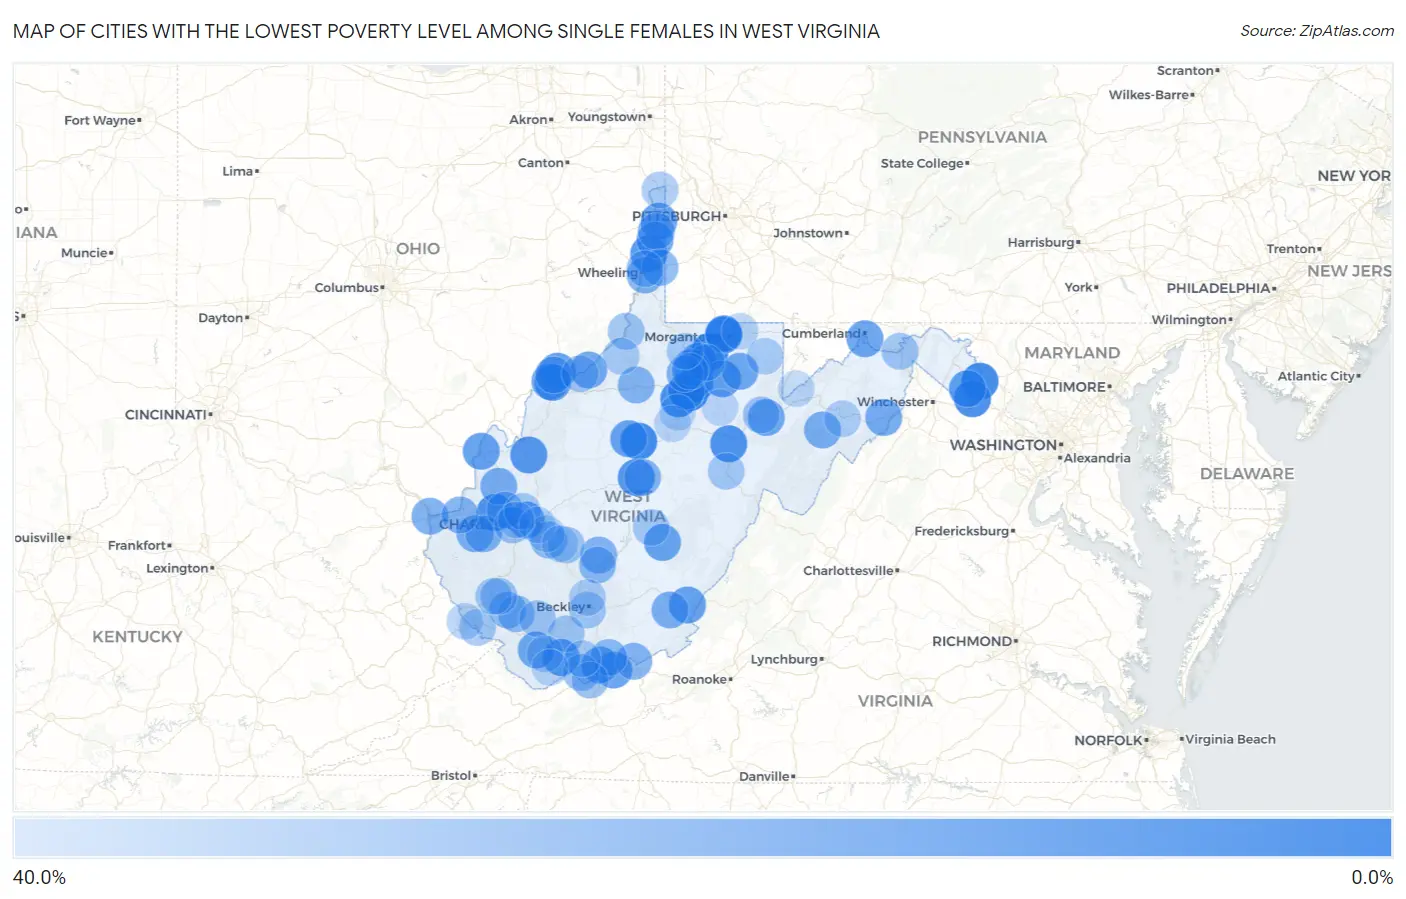
Map of Cities with the Lowest Poverty Level Among Single Females in West Virginia
40.0%
0.0%
Cities with the Lowest Poverty Level Among Single Females in West Virginia
| City | Single Female Poverty | vs State | vs National | |
| 1. | Stonewood | 4.4% | 31.7%(-27.3)#1 | 24.1%(-19.7)#536 |
| 2. | Rivesville | 6.1% | 31.7%(-25.6)#2 | 24.1%(-18.0)#1,022 |
| 3. | Sand Fork | 6.7% | 31.7%(-25.0)#3 | 24.1%(-17.4)#1,244 |
| 4. | Bolivar | 7.0% | 31.7%(-24.7)#4 | 24.1%(-17.1)#1,321 |
| 5. | Westover | 7.6% | 31.7%(-24.0)#5 | 24.1%(-16.4)#1,548 |
| 6. | West Milford | 8.0% | 31.7%(-23.7)#6 | 24.1%(-16.1)#1,712 |
| 7. | Shannondale | 8.8% | 31.7%(-22.9)#7 | 24.1%(-15.3)#1,973 |
| 8. | Womelsdorf Coalton | 9.1% | 31.7%(-22.6)#8 | 24.1%(-15.0)#2,102 |
| 9. | Hurricane | 9.2% | 31.7%(-22.5)#9 | 24.1%(-14.8)#2,140 |
| 10. | Bridgeport | 10.3% | 31.7%(-21.4)#10 | 24.1%(-13.8)#2,545 |
| 11. | Windsor Heights | 10.5% | 31.7%(-21.2)#11 | 24.1%(-13.6)#2,644 |
| 12. | Gassaway | 11.1% | 31.7%(-20.6)#12 | 24.1%(-13.0)#2,879 |
| 13. | Nutter Fort | 11.2% | 31.7%(-20.5)#13 | 24.1%(-12.9)#2,943 |
| 14. | Ripley | 11.2% | 31.7%(-20.5)#14 | 24.1%(-12.8)#2,947 |
| 15. | Charles Town | 12.4% | 31.7%(-19.2)#15 | 24.1%(-11.6)#3,370 |
| 16. | Northfork | 12.5% | 31.7%(-19.2)#16 | 24.1%(-11.6)#3,424 |
| 17. | Monongah | 13.7% | 31.7%(-18.0)#17 | 24.1%(-10.4)#3,920 |
| 18. | Williamstown | 14.0% | 31.7%(-17.7)#18 | 24.1%(-10.1)#4,006 |
| 19. | Grafton | 14.0% | 31.7%(-17.7)#19 | 24.1%(-10.1)#4,030 |
| 20. | Dunbar | 14.1% | 31.7%(-17.6)#20 | 24.1%(-10.00)#4,046 |
| 21. | Point Pleasant | 14.3% | 31.7%(-17.4)#21 | 24.1%(-9.79)#4,104 |
| 22. | White Sulphur Springs | 14.3% | 31.7%(-17.4)#22 | 24.1%(-9.79)#4,109 |
| 23. | Oakvale | 14.3% | 31.7%(-17.4)#23 | 24.1%(-9.79)#4,194 |
| 24. | Weirton | 14.7% | 31.7%(-17.0)#24 | 24.1%(-9.42)#4,328 |
| 25. | Vienna | 14.8% | 31.7%(-16.9)#25 | 24.1%(-9.32)#4,360 |
| 26. | Glenville | 15.0% | 31.7%(-16.7)#26 | 24.1%(-9.08)#4,453 |
| 27. | North Hills | 15.0% | 31.7%(-16.7)#27 | 24.1%(-9.08)#4,457 |
| 28. | Wellsburg | 15.3% | 31.7%(-16.4)#28 | 24.1%(-8.75)#4,569 |
| 29. | Wiley Ford | 15.6% | 31.7%(-16.1)#29 | 24.1%(-8.45)#4,722 |
| 30. | Richwood | 15.7% | 31.7%(-16.0)#30 | 24.1%(-8.39)#4,739 |
| 31. | Hendricks | 16.7% | 31.7%(-15.0)#31 | 24.1%(-7.41)#5,157 |
| 32. | Davy | 16.7% | 31.7%(-15.0)#32 | 24.1%(-7.41)#5,170 |
| 33. | Newburg | 16.7% | 31.7%(-15.0)#33 | 24.1%(-7.41)#5,179 |
| 34. | Princeton | 17.0% | 31.7%(-14.7)#34 | 24.1%(-7.10)#5,290 |
| 35. | St Marys | 17.1% | 31.7%(-14.5)#35 | 24.1%(-6.93)#5,360 |
| 36. | Granville | 17.5% | 31.7%(-14.2)#36 | 24.1%(-6.58)#5,516 |
| 37. | Wardensville | 18.5% | 31.7%(-13.2)#37 | 24.1%(-5.56)#5,935 |
| 38. | Enterprise | 18.5% | 31.7%(-13.1)#38 | 24.1%(-5.53)#5,942 |
| 39. | Buffalo | 18.8% | 31.7%(-12.9)#39 | 24.1%(-5.33)#6,029 |
| 40. | Petersburg | 18.9% | 31.7%(-12.8)#40 | 24.1%(-5.14)#6,109 |
| 41. | West Hamlin | 19.2% | 31.7%(-12.5)#41 | 24.1%(-4.85)#6,230 |
| 42. | Ronceverte | 19.3% | 31.7%(-12.4)#42 | 24.1%(-4.81)#6,245 |
| 43. | Kenova | 19.6% | 31.7%(-12.1)#43 | 24.1%(-4.51)#6,361 |
| 44. | Pleasant Valley | 19.7% | 31.7%(-12.0)#44 | 24.1%(-4.41)#6,409 |
| 45. | Boaz | 20.0% | 31.7%(-11.7)#45 | 24.1%(-4.08)#6,513 |
| 46. | Bethlehem | 20.5% | 31.7%(-11.2)#46 | 24.1%(-3.56)#6,794 |
| 47. | Lumberport | 20.8% | 31.7%(-10.9)#47 | 24.1%(-3.32)#6,885 |
| 48. | Hamlin | 20.9% | 31.7%(-10.8)#48 | 24.1%(-3.21)#6,928 |
| 49. | Sutton | 21.1% | 31.7%(-10.6)#49 | 24.1%(-3.02)#6,999 |
| 50. | West Union | 21.1% | 31.7%(-10.6)#50 | 24.1%(-3.02)#7,000 |
| 51. | Peterstown | 21.4% | 31.7%(-10.3)#51 | 24.1%(-2.65)#7,142 |
| 52. | Ansted | 21.5% | 31.7%(-10.2)#52 | 24.1%(-2.58)#7,172 |
| 53. | Pea Ridge | 21.5% | 31.7%(-10.2)#53 | 24.1%(-2.57)#7,174 |
| 54. | Fayetteville | 22.7% | 31.7%(-9.01)#54 | 24.1%(-1.40)#7,676 |
| 55. | Follansbee | 22.9% | 31.7%(-8.83)#55 | 24.1%(-1.22)#7,744 |
| 56. | Belle | 23.1% | 31.7%(-8.61)#56 | 24.1%(-1.000)#7,843 |
| 57. | Valley Grove | 23.1% | 31.7%(-8.61)#57 | 24.1%(-1.000)#7,866 |
| 58. | Athens | 23.2% | 31.7%(-8.47)#58 | 24.1%(-0.862)#7,919 |
| 59. | Teays Valley | 23.3% | 31.7%(-8.36)#59 | 24.1%(-0.748)#7,958 |
| 60. | Man | 23.9% | 31.7%(-7.77)#60 | 24.1%(-0.163)#8,183 |
| 61. | Mallory | 24.5% | 31.7%(-7.17)#61 | 24.1%(+0.440)#8,409 |
| 62. | Bluewell | 25.0% | 31.7%(-6.68)#62 | 24.1%(+0.924)#8,562 |
| 63. | Wheeling | 26.0% | 31.7%(-5.66)#63 | 24.1%(+1.95)#9,032 |
| 64. | Bluefield | 26.0% | 31.7%(-5.65)#64 | 24.1%(+1.96)#9,040 |
| 65. | Tornado | 26.1% | 31.7%(-5.60)#65 | 24.1%(+2.01)#9,069 |
| 66. | Logan | 26.5% | 31.7%(-5.14)#66 | 24.1%(+2.46)#9,222 |
| 67. | Parsons | 26.8% | 31.7%(-4.92)#67 | 24.1%(+2.68)#9,320 |
| 68. | Shinnston | 26.9% | 31.7%(-4.76)#68 | 24.1%(+2.85)#9,372 |
| 69. | Pratt | 26.9% | 31.7%(-4.76)#69 | 24.1%(+2.85)#9,381 |
| 70. | New Martinsville | 27.0% | 31.7%(-4.72)#70 | 24.1%(+2.88)#9,390 |
| 71. | Paw Paw | 27.3% | 31.7%(-4.41)#71 | 24.1%(+3.20)#9,507 |
| 72. | Ranson Corporation | 27.4% | 31.7%(-4.27)#72 | 24.1%(+3.34)#9,555 |
| 73. | Oceana | 27.5% | 31.7%(-4.18)#73 | 24.1%(+3.42)#9,582 |
| 74. | Macarthur | 27.8% | 31.7%(-3.91)#74 | 24.1%(+3.70)#9,668 |
| 75. | Mullens | 27.9% | 31.7%(-3.82)#75 | 24.1%(+3.79)#9,710 |
| 76. | Belmont | 28.0% | 31.7%(-3.68)#76 | 24.1%(+3.92)#9,754 |
| 77. | Matewan | 28.6% | 31.7%(-3.11)#77 | 24.1%(+4.49)#9,965 |
| 78. | Huttonsville | 28.6% | 31.7%(-3.11)#78 | 24.1%(+4.49)#10,019 |
| 79. | Mount Gay Shamrock | 28.9% | 31.7%(-2.74)#79 | 24.1%(+4.87)#10,121 |
| 80. | Craigsville | 29.0% | 31.7%(-2.68)#80 | 24.1%(+4.92)#10,137 |
| 81. | Chester | 29.6% | 31.7%(-2.12)#81 | 24.1%(+5.49)#10,319 |
| 82. | Cross Lanes | 29.6% | 31.7%(-2.05)#82 | 24.1%(+5.55)#10,334 |
| 83. | Mannington | 30.0% | 31.7%(-1.68)#83 | 24.1%(+5.92)#10,448 |
| 84. | Middlebourne | 30.0% | 31.7%(-1.68)#84 | 24.1%(+5.92)#10,460 |
| 85. | Albright | 30.0% | 31.7%(-1.68)#85 | 24.1%(+5.92)#10,481 |
| 86. | Matoaka | 30.0% | 31.7%(-1.68)#86 | 24.1%(+5.92)#10,503 |
| 87. | Prosperity | 30.3% | 31.7%(-1.38)#87 | 24.1%(+6.23)#10,583 |
| 88. | Welch | 30.6% | 31.7%(-1.07)#88 | 24.1%(+6.54)#10,691 |
| 89. | Moorefield | 30.7% | 31.7%(-0.961)#89 | 24.1%(+6.65)#10,722 |
| 90. | Rand | 31.6% | 31.7%(-0.105)#90 | 24.1%(+7.50)#11,000 |
| 91. | Charleston | 32.0% | 31.7%(+0.298)#91 | 24.1%(+7.91)#11,123 |
| 92. | Williamson | 32.0% | 31.7%(+0.338)#92 | 24.1%(+7.95)#11,147 |
| 93. | St Albans | 32.3% | 31.7%(+0.609)#93 | 24.1%(+8.22)#11,234 |
| 94. | Cheat Lake | 32.8% | 31.7%(+1.07)#94 | 24.1%(+8.68)#11,355 |
| 95. | East Bank | 32.9% | 31.7%(+1.26)#95 | 24.1%(+8.86)#11,406 |
| 96. | Weston | 33.2% | 31.7%(+1.47)#96 | 24.1%(+9.08)#11,460 |
| 97. | Philippi | 33.3% | 31.7%(+1.65)#97 | 24.1%(+9.26)#11,493 |
| 98. | Gary | 33.3% | 31.7%(+1.65)#98 | 24.1%(+9.26)#11,540 |
| 99. | Jane Lew | 33.3% | 31.7%(+1.65)#99 | 24.1%(+9.26)#11,579 |
| 100. | Bayard | 33.3% | 31.7%(+1.65)#100 | 24.1%(+9.26)#11,677 |
Common Questions
What are the Top 10 Cities with the Lowest Poverty Level Among Single Females in West Virginia?
Top 10 Cities with the Lowest Poverty Level Among Single Females in West Virginia are:
#1
4.4%
#2
6.1%
#3
6.7%
#4
7.0%
#5
7.6%
#6
8.0%
#7
8.8%
#8
9.1%
#9
9.2%
#10
10.3%
What city has the Lowest Poverty Level Among Single Females in West Virginia?
Stonewood has the Lowest Poverty Level Among Single Females in West Virginia with 4.4%.
What is the Poverty Level Among Single Females in the State of West Virginia?
Poverty Level Among Single Females in West Virginia is 31.7%.
What is the Poverty Level Among Single Females in the United States?
Poverty Level Among Single Females in the United States is 24.1%.