Cities with the Most Immigrants from South Central Asia in West Virginia
RELATED REPORTS & OPTIONS
South Central Asia
West Virginia
Compare Cities
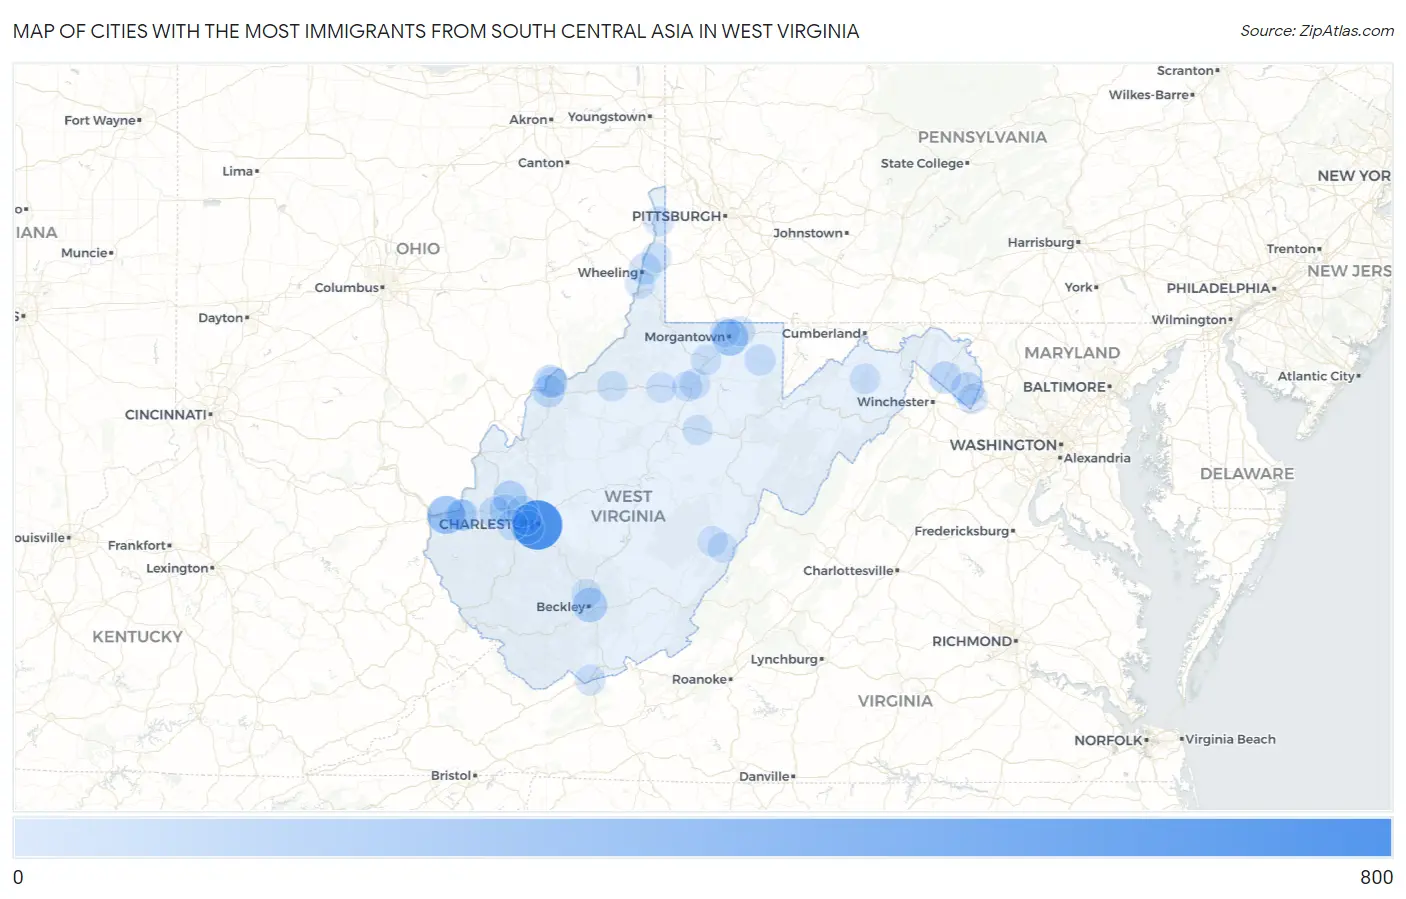
Map of Cities with the Most Immigrants from South Central Asia in West Virginia
0
800
Cities with the Most Immigrants from South Central Asia in West Virginia
| City | South Central Asia | vs State | vs National | |
| 1. | Charleston | 616 | 3,165(19.46%)#1 | 4,330,976(0.01%)#999 |
| 2. | Huntington | 243 | 3,165(7.68%)#2 | 4,330,976(0.01%)#1,785 |
| 3. | Morgantown | 194 | 3,165(6.13%)#3 | 4,330,976(0.00%)#2,030 |
| 4. | Beckley | 134 | 3,165(4.23%)#4 | 4,330,976(0.00%)#2,448 |
| 5. | Winfield | 109 | 3,165(3.44%)#5 | 4,330,976(0.00%)#2,707 |
| 6. | South Charleston | 100 | 3,165(3.16%)#6 | 4,330,976(0.00%)#2,820 |
| 7. | Charles Town | 87 | 3,165(2.75%)#7 | 4,330,976(0.00%)#3,025 |
| 8. | Vienna | 71 | 3,165(2.24%)#8 | 4,330,976(0.00%)#3,283 |
| 9. | Parkersburg | 65 | 3,165(2.05%)#9 | 4,330,976(0.00%)#3,391 |
| 10. | Inwood | 65 | 3,165(2.05%)#10 | 4,330,976(0.00%)#3,408 |
| 11. | Hurricane | 54 | 3,165(1.71%)#11 | 4,330,976(0.00%)#3,648 |
| 12. | Teays Valley | 46 | 3,165(1.45%)#12 | 4,330,976(0.00%)#3,877 |
| 13. | Wheeling | 45 | 3,165(1.42%)#13 | 4,330,976(0.00%)#3,894 |
| 14. | Pea Ridge | 45 | 3,165(1.42%)#14 | 4,330,976(0.00%)#3,913 |
| 15. | Cross Lanes | 39 | 3,165(1.23%)#15 | 4,330,976(0.00%)#4,081 |
| 16. | Barboursville | 33 | 3,165(1.04%)#16 | 4,330,976(0.00%)#4,317 |
| 17. | Kingwood | 31 | 3,165(0.98%)#17 | 4,330,976(0.00%)#4,404 |
| 18. | Bluefield | 18 | 3,165(0.57%)#18 | 4,330,976(0.00%)#5,150 |
| 19. | Tornado | 17 | 3,165(0.54%)#19 | 4,330,976(0.00%)#5,276 |
| 20. | North Hills | 14 | 3,165(0.44%)#20 | 4,330,976(0.00%)#5,496 |
| 21. | Bridgeport | 12 | 3,165(0.38%)#21 | 4,330,976(0.00%)#5,635 |
| 22. | Romney | 11 | 3,165(0.35%)#22 | 4,330,976(0.00%)#5,787 |
| 23. | Clarksburg | 10 | 3,165(0.32%)#23 | 4,330,976(0.00%)#5,838 |
| 24. | Salem | 10 | 3,165(0.32%)#24 | 4,330,976(0.00%)#5,913 |
| 25. | Shannondale | 9 | 3,165(0.28%)#25 | 4,330,976(0.00%)#6,017 |
| 26. | Marlinton | 9 | 3,165(0.28%)#26 | 4,330,976(0.00%)#6,057 |
| 27. | Fairmont | 8 | 3,165(0.25%)#27 | 4,330,976(0.00%)#6,093 |
| 28. | Pennsboro | 8 | 3,165(0.25%)#28 | 4,330,976(0.00%)#6,178 |
| 29. | Buckhannon | 6 | 3,165(0.19%)#29 | 4,330,976(0.00%)#6,371 |
| 30. | Cheat Lake | 5 | 3,165(0.16%)#30 | 4,330,976(0.00%)#6,478 |
| 31. | Weirton | 4 | 3,165(0.13%)#31 | 4,330,976(0.00%)#6,598 |
| 32. | West Liberty | 3 | 3,165(0.09%)#32 | 4,330,976(0.00%)#6,777 |
| 33. | Dunbar | 2 | 3,165(0.06%)#33 | 4,330,976(0.00%)#6,889 |
| 34. | Bradley | 2 | 3,165(0.06%)#34 | 4,330,976(0.00%)#6,917 |
| 35. | Huntersville | 2 | 3,165(0.06%)#35 | 4,330,976(0.00%)#7,031 |
| 36. | Star City | 1 | 3,165(0.03%)#36 | 4,330,976(0.00%)#7,074 |
| 37. | Mcmechen | 1 | 3,165(0.03%)#37 | 4,330,976(0.00%)#7,082 |
1
2Common Questions
What are the Top 10 Cities with the Most Immigrants from South Central Asia in West Virginia?
Top 10 Cities with the Most Immigrants from South Central Asia in West Virginia are:
#1
616
#2
243
#3
194
#4
134
#5
109
#6
100
#7
87
#8
71
#9
65
#10
65
What city has the Most Immigrants from South Central Asia in West Virginia?
Charleston has the Most Immigrants from South Central Asia in West Virginia with 616.
What is the Total Immigrants from South Central Asia in the State of West Virginia?
Total Immigrants from South Central Asia in West Virginia is 3,165.
What is the Total Immigrants from South Central Asia in the United States?
Total Immigrants from South Central Asia in the United States is 4,330,976.