Pleasant Valley, WV
Pleasant Valley Map
Pleasant Valley Overview
3,480
TOTAL POPULATION
1,533
MALE POPULATION
1,947
FEMALE POPULATION
78.74
MALES / 100 FEMALES
127.01
FEMALES / 100 MALES
38.7
MEDIAN AGE
2.9
AVG FAMILY SIZE
2.4
AVG HOUSEHOLD SIZE
$35,158
PER CAPITA INCOME
$63,878
AVG FAMILY INCOME
$61,067
AVG HOUSEHOLD INCOME
1.3%
WAGE / INCOME GAP [ % ]
98.7¢/ $1
WAGE / INCOME GAP [ $ ]
0.45
INEQUALITY / GINI INDEX
1,559
LABOR FORCE [ PEOPLE ]
58.4%
PERCENT IN LABOR FORCE
1.6%
UNEMPLOYMENT RATE
Race in Pleasant Valley
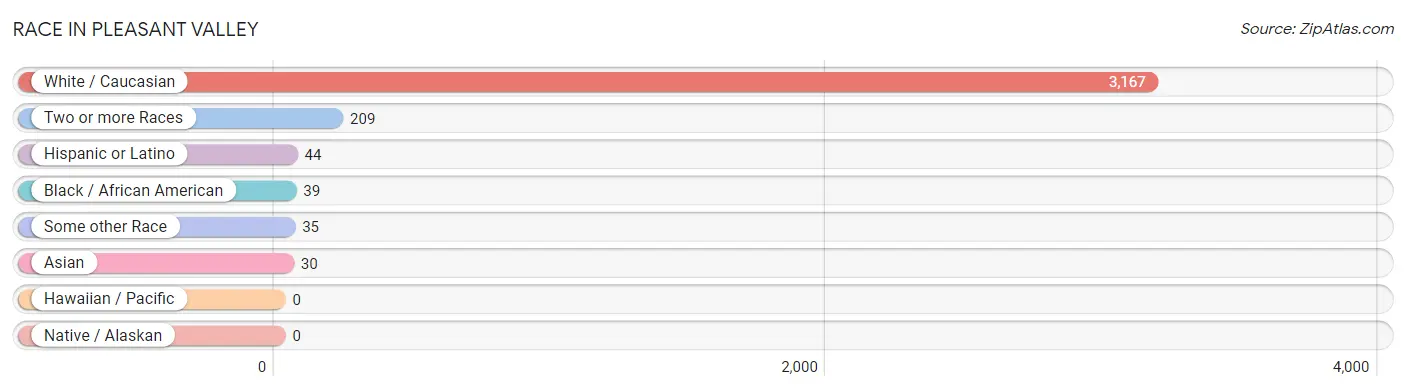
The most populous races in Pleasant Valley are White / Caucasian (3,167 | 91.0%), Two or more Races (209 | 6.0%), and Hispanic or Latino (44 | 1.3%).
| Race | # Population | % Population |
| Asian | 30 | 0.9% |
| Black / African American | 39 | 1.1% |
| Hawaiian / Pacific | 0 | 0.0% |
| Hispanic or Latino | 44 | 1.3% |
| Native / Alaskan | 0 | 0.0% |
| White / Caucasian | 3,167 | 91.0% |
| Two or more Races | 209 | 6.0% |
| Some other Race | 35 | 1.0% |
| Total | 3,480 | 100.0% |
Ancestry in Pleasant Valley
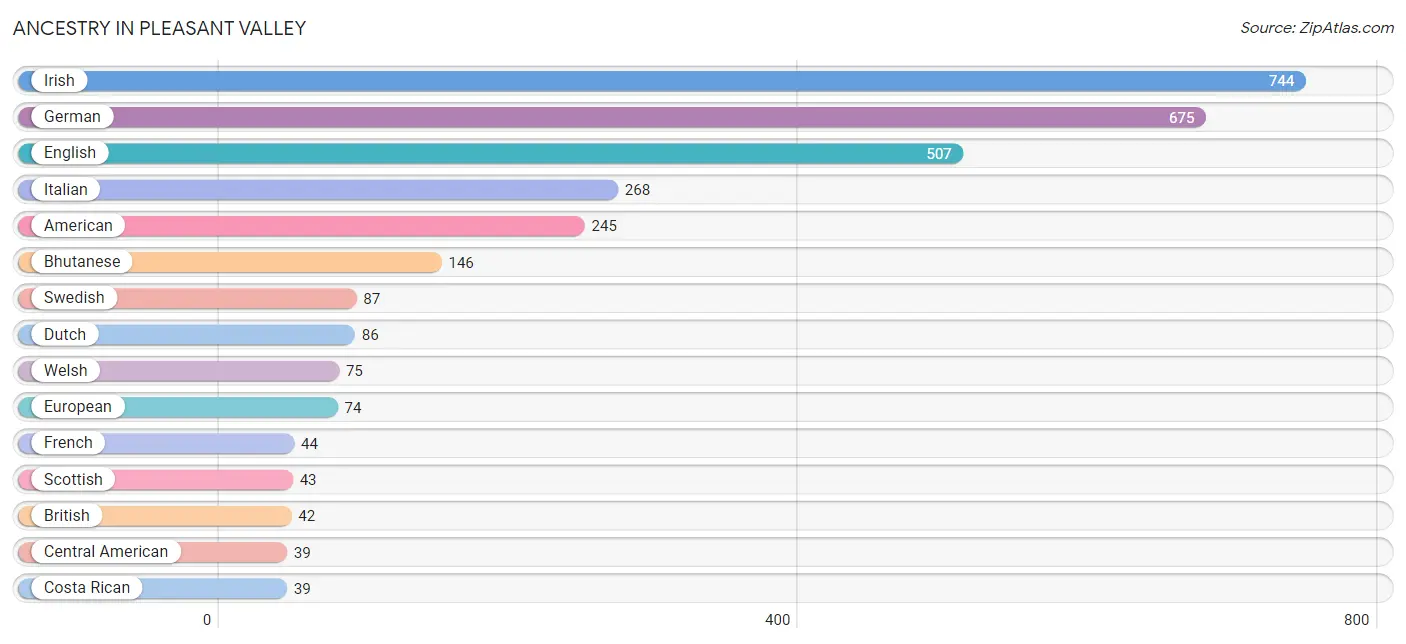
The most populous ancestries reported in Pleasant Valley are Irish (744 | 21.4%), German (675 | 19.4%), English (507 | 14.6%), Italian (268 | 7.7%), and American (245 | 7.0%), together accounting for 70.1% of all Pleasant Valley residents.
| Ancestry | # Population | % Population |
| American | 245 | 7.0% |
| Bhutanese | 146 | 4.2% |
| British | 42 | 1.2% |
| Central American | 39 | 1.1% |
| Cherokee | 9 | 0.3% |
| Costa Rican | 39 | 1.1% |
| Croatian | 7 | 0.2% |
| Dutch | 86 | 2.5% |
| English | 507 | 14.6% |
| European | 74 | 2.1% |
| French | 44 | 1.3% |
| French Canadian | 7 | 0.2% |
| German | 675 | 19.4% |
| Hungarian | 8 | 0.2% |
| Irish | 744 | 21.4% |
| Italian | 268 | 7.7% |
| Latvian | 13 | 0.4% |
| Nigerian | 7 | 0.2% |
| Northern European | 8 | 0.2% |
| Polish | 34 | 1.0% |
| Puerto Rican | 5 | 0.1% |
| Russian | 16 | 0.5% |
| Scotch-Irish | 13 | 0.4% |
| Scottish | 43 | 1.2% |
| Slavic | 15 | 0.4% |
| Slovak | 22 | 0.6% |
| Subsaharan African | 7 | 0.2% |
| Swedish | 87 | 2.5% |
| Thai | 14 | 0.4% |
| Welsh | 75 | 2.2% |
| Yugoslavian | 9 | 0.3% | View All 31 Rows |
Immigrants in Pleasant Valley
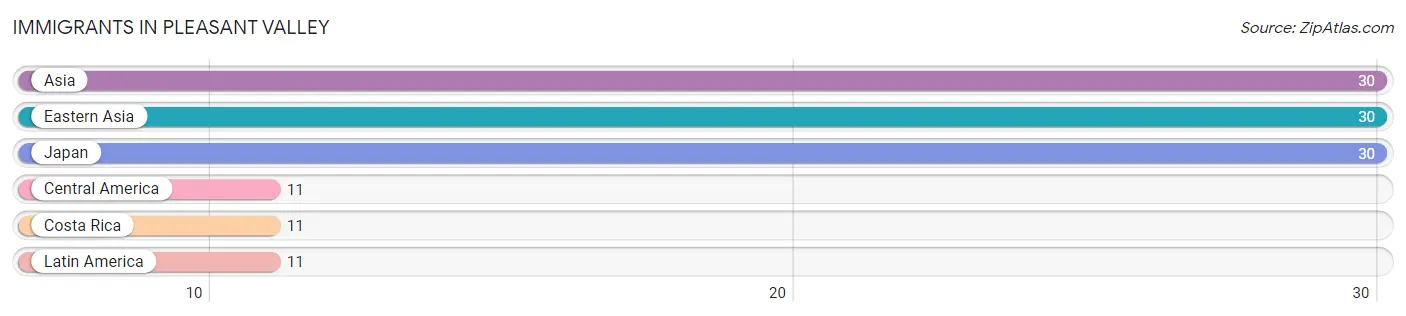
The most numerous immigrant groups reported in Pleasant Valley came from Asia (30 | 0.9%), Eastern Asia (30 | 0.9%), Japan (30 | 0.9%), Central America (11 | 0.3%), and Costa Rica (11 | 0.3%), together accounting for 3.2% of all Pleasant Valley residents.
| Immigration Origin | # Population | % Population |
| Asia | 30 | 0.9% |
| Central America | 11 | 0.3% |
| Costa Rica | 11 | 0.3% |
| Eastern Asia | 30 | 0.9% |
| Japan | 30 | 0.9% |
| Latin America | 11 | 0.3% | View All 6 Rows |
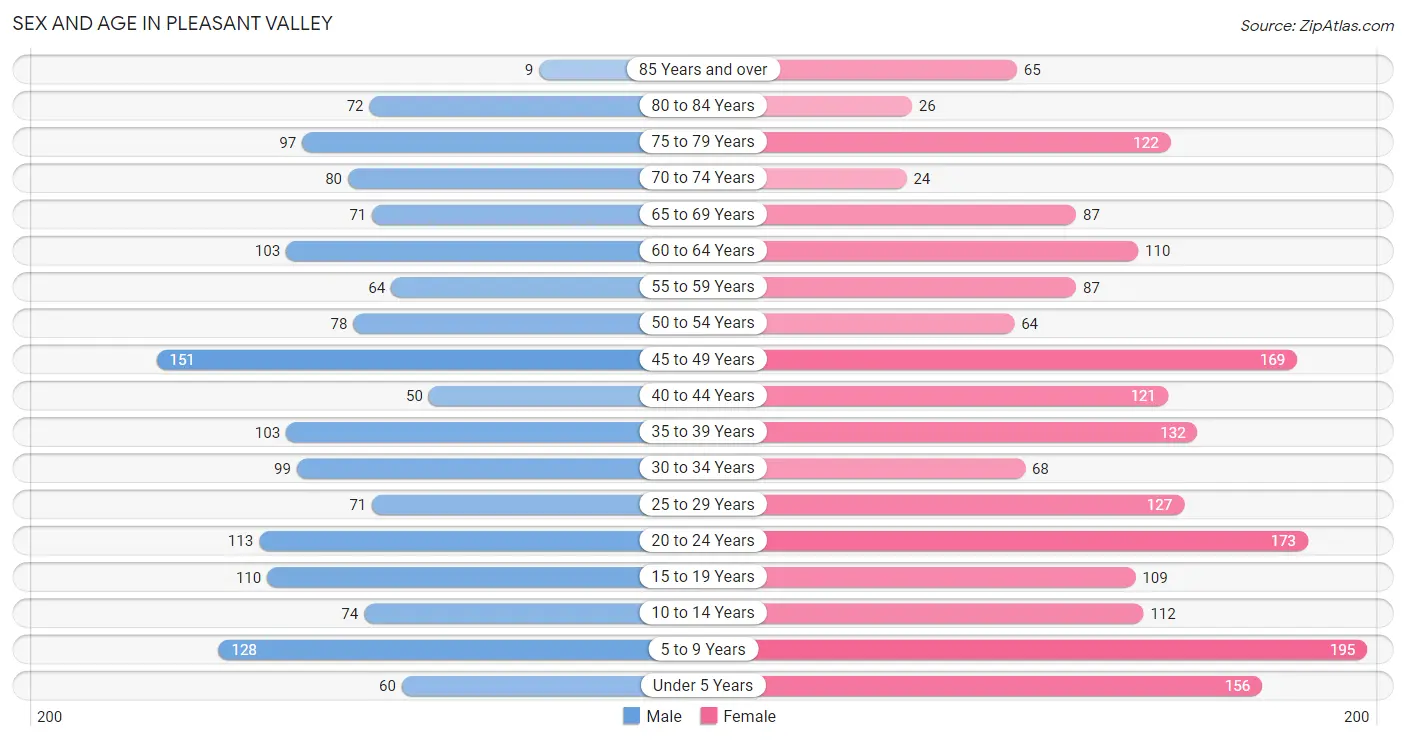
Sex and Age in Pleasant Valley
Sex and Age in Pleasant Valley
The most populous age groups in Pleasant Valley are 45 to 49 Years (151 | 9.9%) for men and 5 to 9 Years (195 | 10.0%) for women.
| Age Bracket | Male | Female |
| Under 5 Years | 60 (3.9%) | 156 (8.0%) |
| 5 to 9 Years | 128 (8.4%) | 195 (10.0%) |
| 10 to 14 Years | 74 (4.8%) | 112 (5.8%) |
| 15 to 19 Years | 110 (7.2%) | 109 (5.6%) |
| 20 to 24 Years | 113 (7.4%) | 173 (8.9%) |
| 25 to 29 Years | 71 (4.6%) | 127 (6.5%) |
| 30 to 34 Years | 99 (6.5%) | 68 (3.5%) |
| 35 to 39 Years | 103 (6.7%) | 132 (6.8%) |
| 40 to 44 Years | 50 (3.3%) | 121 (6.2%) |
| 45 to 49 Years | 151 (9.9%) | 169 (8.7%) |
| 50 to 54 Years | 78 (5.1%) | 64 (3.3%) |
| 55 to 59 Years | 64 (4.2%) | 87 (4.5%) |
| 60 to 64 Years | 103 (6.7%) | 110 (5.7%) |
| 65 to 69 Years | 71 (4.6%) | 87 (4.5%) |
| 70 to 74 Years | 80 (5.2%) | 24 (1.2%) |
| 75 to 79 Years | 97 (6.3%) | 122 (6.3%) |
| 80 to 84 Years | 72 (4.7%) | 26 (1.3%) |
| 85 Years and over | 9 (0.6%) | 65 (3.3%) |
| Total | 1,533 (100.0%) | 1,947 (100.0%) |
Families and Households in Pleasant Valley
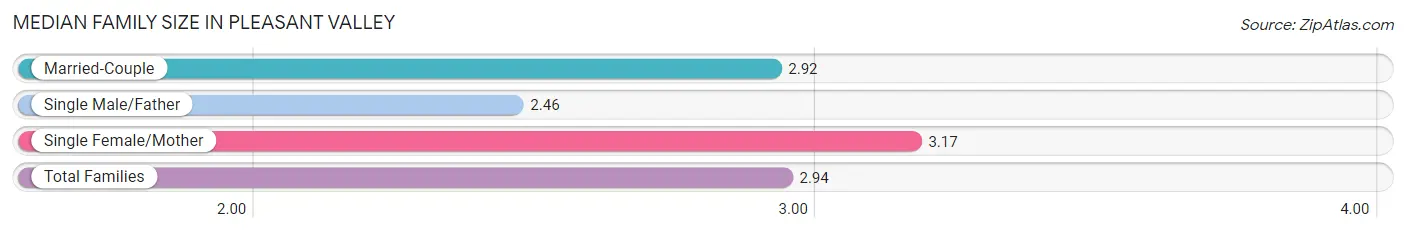
Median Family Size in Pleasant Valley
The median family size in Pleasant Valley is 2.94 persons per family, with single female/mother families (178 | 17.6%) accounting for the largest median family size of 3.17 persons per family. On the other hand, single male/father families (57 | 5.6%) represent the smallest median family size with 2.46 persons per family.
| Family Type | # Families | Family Size |
| Married-Couple | 778 (76.8%) | 2.92 |
| Single Male/Father | 57 (5.6%) | 2.46 |
| Single Female/Mother | 178 (17.6%) | 3.17 |
| Total Families | 1,013 (100.0%) | 2.94 |
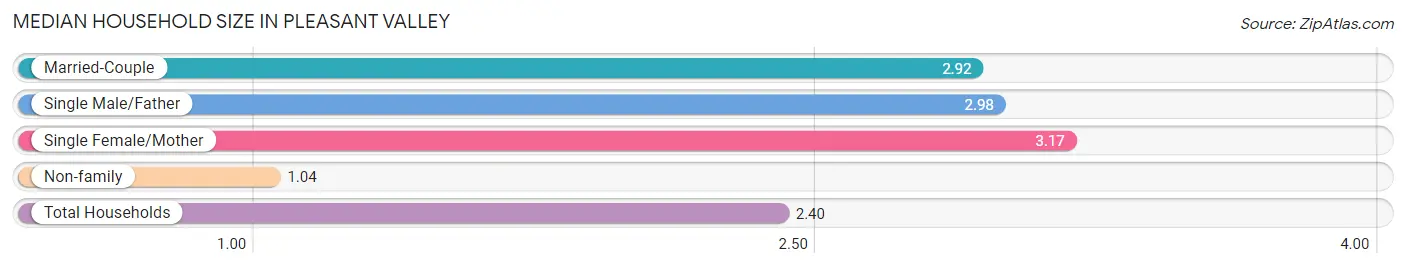
Median Household Size in Pleasant Valley
The median household size in Pleasant Valley is 2.40 persons per household, with single female/mother households (178 | 12.4%) accounting for the largest median household size of 3.17 persons per household. non-family households (422 | 29.4%) represent the smallest median household size with 1.04 persons per household.
| Household Type | # Households | Household Size |
| Married-Couple | 778 (54.2%) | 2.92 |
| Single Male/Father | 57 (4.0%) | 2.98 |
| Single Female/Mother | 178 (12.4%) | 3.17 |
| Non-family | 422 (29.4%) | 1.04 |
| Total Households | 1,435 (100.0%) | 2.40 |
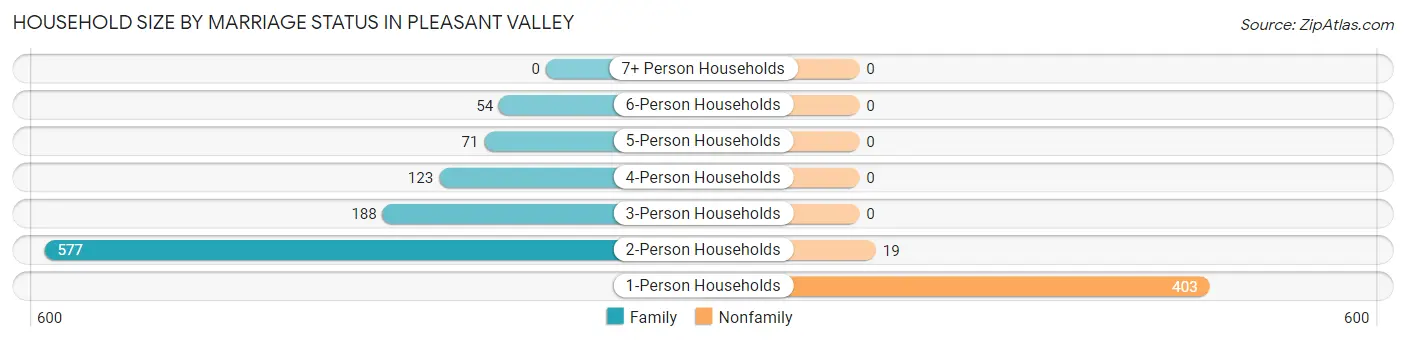
Household Size by Marriage Status in Pleasant Valley
Out of a total of 1,435 households in Pleasant Valley, 1,013 (70.6%) are family households, while 422 (29.4%) are nonfamily households. The most numerous type of family households are 2-person households, comprising 577, and the most common type of nonfamily households are 1-person households, comprising 403.
| Household Size | Family Households | Nonfamily Households |
| 1-Person Households | - | 403 (28.1%) |
| 2-Person Households | 577 (40.2%) | 19 (1.3%) |
| 3-Person Households | 188 (13.1%) | 0 (0.0%) |
| 4-Person Households | 123 (8.6%) | 0 (0.0%) |
| 5-Person Households | 71 (5.0%) | 0 (0.0%) |
| 6-Person Households | 54 (3.8%) | 0 (0.0%) |
| 7+ Person Households | 0 (0.0%) | 0 (0.0%) |
| Total | 1,013 (70.6%) | 422 (29.4%) |
Female Fertility in Pleasant Valley
Fertility by Age in Pleasant Valley
Average fertility rate in Pleasant Valley is 38.0 births per 1,000 women. Women in the age bracket of 20 to 34 years have the highest fertility rate with 95.0 births per 1,000 women. Women in the age bracket of 20 to 34 years acount for 100.0% of all women with births.
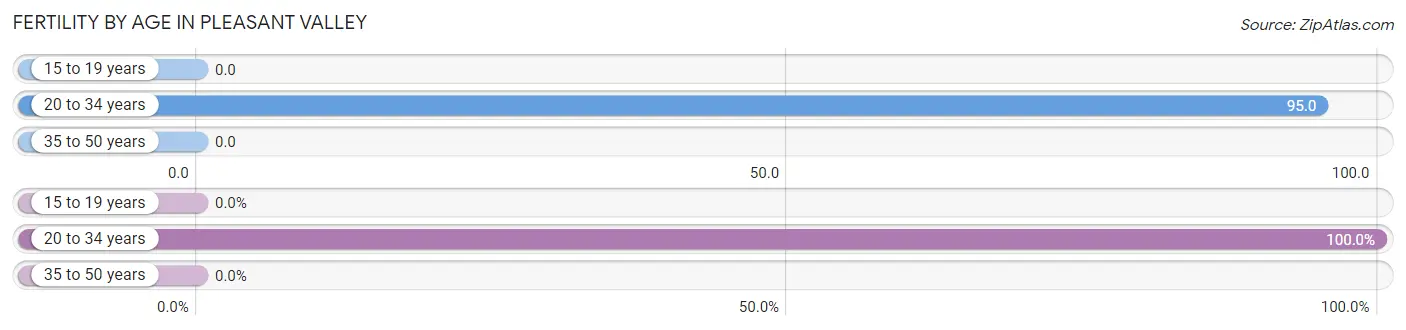
| Age Bracket | Women with Births | Births / 1,000 Women |
| 15 to 19 years | 0 (0.0%) | 0.0 |
| 20 to 34 years | 35 (100.0%) | 95.0 |
| 35 to 50 years | 0 (0.0%) | 0.0 |
| Total | 35 (100.0%) | 38.0 |
Fertility by Age by Marriage Status in Pleasant Valley
74.3% of women with births (35) in Pleasant Valley are married. The highest percentage of unmarried women with births falls into 20 to 34 years age bracket with 25.7% of them unmarried at the time of birth, while the lowest percentage of unmarried women with births belong to 20 to 34 years age bracket with 25.7% of them unmarried.
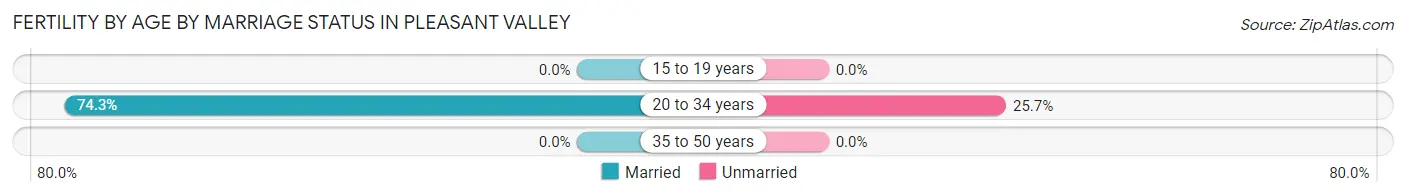
| Age Bracket | Married | Unmarried |
| 15 to 19 years | 0 (0.0%) | 0 (0.0%) |
| 20 to 34 years | 26 (74.3%) | 9 (25.7%) |
| 35 to 50 years | 0 (0.0%) | 0 (0.0%) |
| Total | 26 (74.3%) | 9 (25.7%) |
Fertility by Education in Pleasant Valley
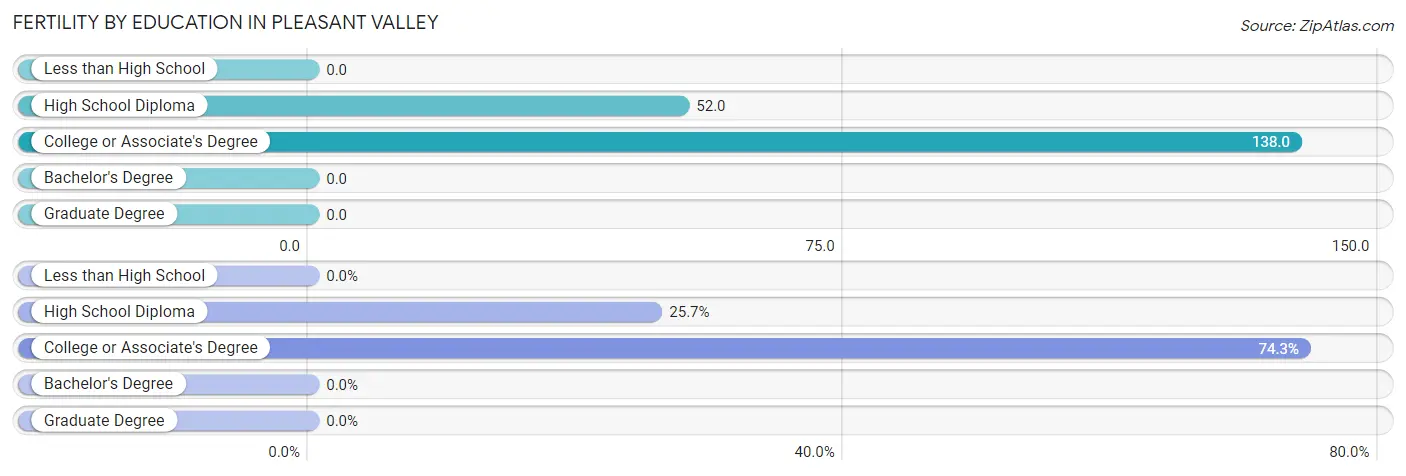
| Educational Attainment | Women with Births | Births / 1,000 Women |
| Less than High School | 0 (0.0%) | 0.0 |
| High School Diploma | 9 (25.7%) | 52.0 |
| College or Associate's Degree | 26 (74.3%) | 138.0 |
| Bachelor's Degree | 0 (0.0%) | 0.0 |
| Graduate Degree | 0 (0.0%) | 0.0 |
| Total | 35 (100.0%) | 38.0 |
Fertility by Education by Marriage Status in Pleasant Valley
25.7% of women with births in Pleasant Valley are unmarried. Women with the educational attainment of college or associate's degree are most likely to be married with 100.0% of them married at childbirth, while women with the educational attainment of high school diploma are least likely to be married with 100.0% of them unmarried at childbirth.
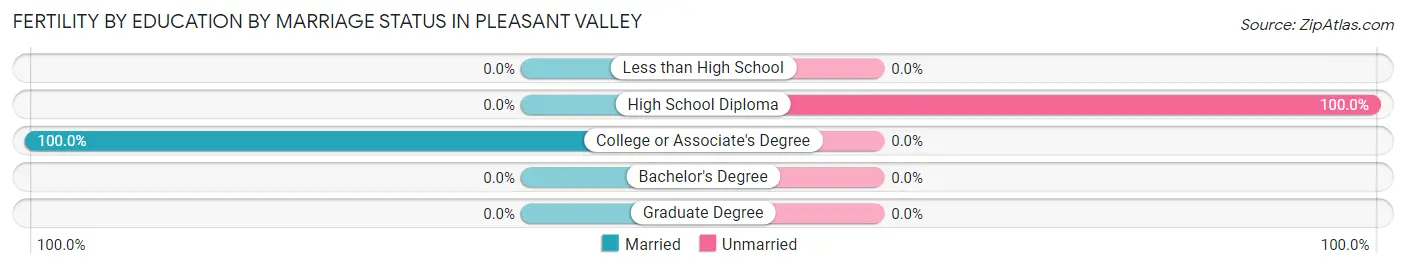
| Educational Attainment | Married | Unmarried |
| Less than High School | 0 (0.0%) | 0 (0.0%) |
| High School Diploma | 0 (0.0%) | 9 (100.0%) |
| College or Associate's Degree | 26 (100.0%) | 0 (0.0%) |
| Bachelor's Degree | 0 (0.0%) | 0 (0.0%) |
| Graduate Degree | 0 (0.0%) | 0 (0.0%) |
| Total | 26 (74.3%) | 9 (25.7%) |
Income in Pleasant Valley
Income Overview in Pleasant Valley
Per Capita Income in Pleasant Valley is $35,158, while median incomes of families and households are $63,878 and $61,067 respectively.
| Characteristic | Number | Measure |
| Per Capita Income | 3,480 | $35,158 |
| Median Family Income | 1,013 | $63,878 |
| Mean Family Income | 1,013 | $89,832 |
| Median Household Income | 1,435 | $61,067 |
| Mean Household Income | 1,435 | $82,558 |
| Income Deficit | 1,013 | $0 |
| Wage / Income Gap (%) | 3,480 | 1.34% |
| Wage / Income Gap ($) | 3,480 | 98.66¢ per $1 |
| Gini / Inequality Index | 3,480 | 0.45 |
Earnings by Sex in Pleasant Valley
Average Earnings in Pleasant Valley are $48,885, $48,529 for men and $49,188 for women, a difference of 1.3%.
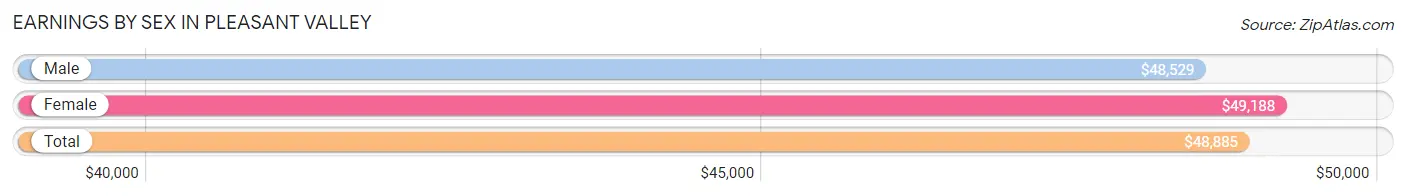
| Sex | Number | Average Earnings |
| Male | 840 (51.9%) | $48,529 |
| Female | 777 (48.0%) | $49,188 |
| Total | 1,617 (100.0%) | $48,885 |
Earnings by Sex by Income Bracket in Pleasant Valley
The most common earnings brackets in Pleasant Valley are $100,000+ for men (151 | 18.0%) and $75,000 to $99,999 for women (91 | 11.7%).
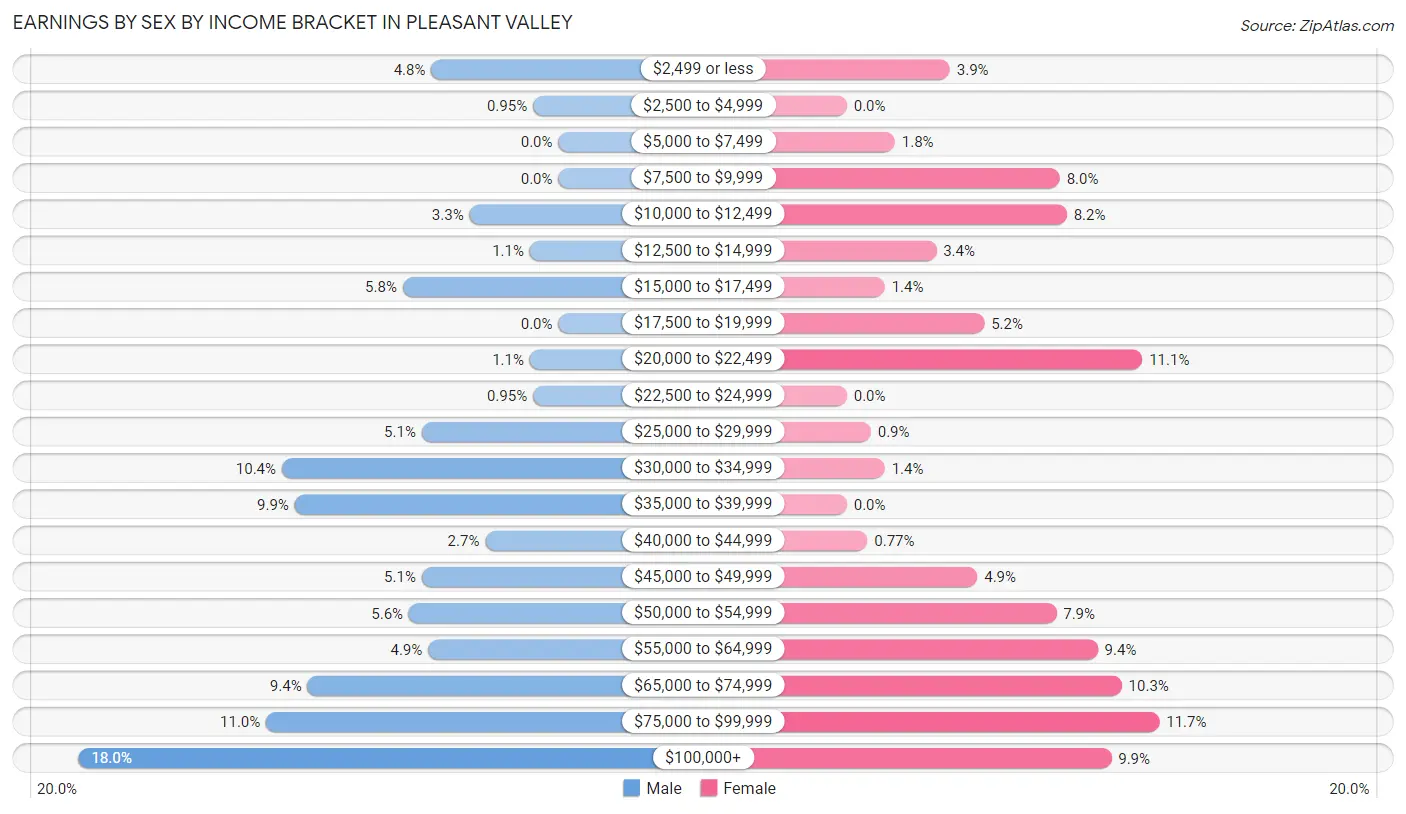
| Income | Male | Female |
| $2,499 or less | 40 (4.8%) | 30 (3.9%) |
| $2,500 to $4,999 | 8 (0.9%) | 0 (0.0%) |
| $5,000 to $7,499 | 0 (0.0%) | 14 (1.8%) |
| $7,500 to $9,999 | 0 (0.0%) | 62 (8.0%) |
| $10,000 to $12,499 | 28 (3.3%) | 64 (8.2%) |
| $12,500 to $14,999 | 9 (1.1%) | 26 (3.4%) |
| $15,000 to $17,499 | 49 (5.8%) | 11 (1.4%) |
| $17,500 to $19,999 | 0 (0.0%) | 40 (5.1%) |
| $20,000 to $22,499 | 9 (1.1%) | 86 (11.1%) |
| $22,500 to $24,999 | 8 (0.9%) | 0 (0.0%) |
| $25,000 to $29,999 | 43 (5.1%) | 7 (0.9%) |
| $30,000 to $34,999 | 87 (10.4%) | 11 (1.4%) |
| $35,000 to $39,999 | 83 (9.9%) | 0 (0.0%) |
| $40,000 to $44,999 | 23 (2.7%) | 6 (0.8%) |
| $45,000 to $49,999 | 43 (5.1%) | 38 (4.9%) |
| $50,000 to $54,999 | 47 (5.6%) | 61 (7.9%) |
| $55,000 to $64,999 | 41 (4.9%) | 73 (9.4%) |
| $65,000 to $74,999 | 79 (9.4%) | 80 (10.3%) |
| $75,000 to $99,999 | 92 (11.0%) | 91 (11.7%) |
| $100,000+ | 151 (18.0%) | 77 (9.9%) |
| Total | 840 (100.0%) | 777 (100.0%) |
Earnings by Sex by Educational Attainment in Pleasant Valley
Average earnings in Pleasant Valley are $60,250 for men and $57,981 for women, a difference of 3.8%. Men with an educational attainment of graduate degree enjoy the highest average annual earnings of $97,284, while those with college or associate's degree education earn the least with $45,721. Women with an educational attainment of graduate degree earn the most with the average annual earnings of $71,786, while those with college or associate's degree education have the smallest earnings of $52,794.
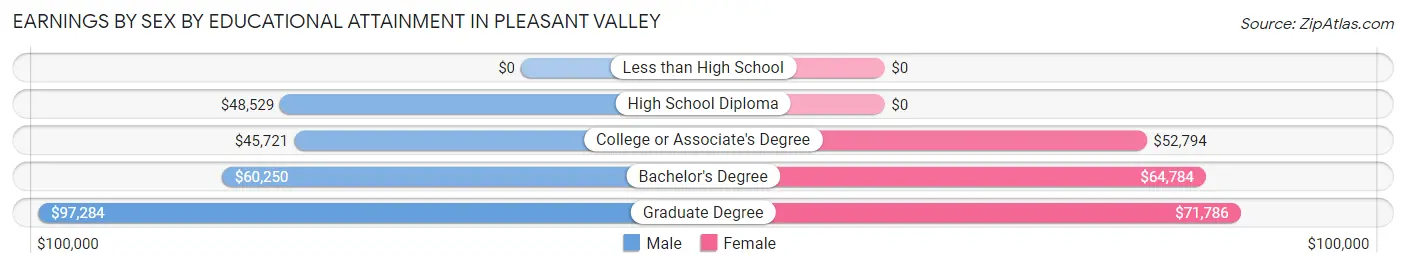
| Educational Attainment | Male Income | Female Income |
| Less than High School | - | - |
| High School Diploma | $48,529 | $0 |
| College or Associate's Degree | $45,721 | $52,794 |
| Bachelor's Degree | $60,250 | $64,784 |
| Graduate Degree | $97,284 | $71,786 |
| Total | $60,250 | $57,981 |
Family Income in Pleasant Valley
Family Income Brackets in Pleasant Valley
According to the Pleasant Valley family income data, there are 340 families falling into the $50,000 to $74,999 income range, which is the most common income bracket and makes up 33.6% of all families. Conversely, the $10,000 to $14,999 income bracket is the least frequent group with only 9 families (0.9%) belonging to this category.
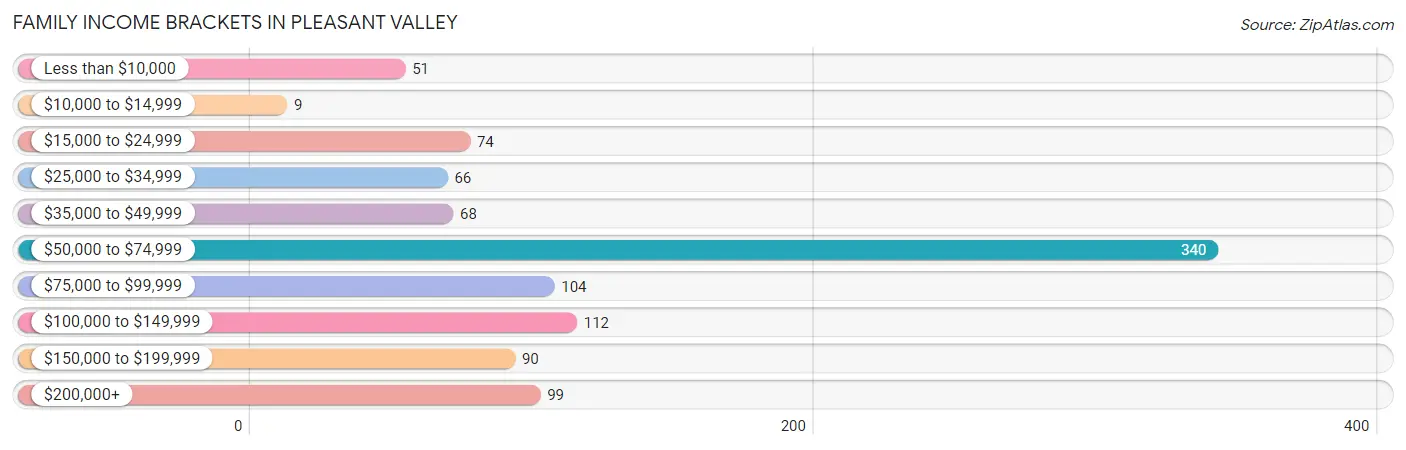
| Income Bracket | # Families | % Families |
| Less than $10,000 | 51 | 5.0% |
| $10,000 to $14,999 | 9 | 0.9% |
| $15,000 to $24,999 | 74 | 7.3% |
| $25,000 to $34,999 | 66 | 6.5% |
| $35,000 to $49,999 | 68 | 6.7% |
| $50,000 to $74,999 | 340 | 33.6% |
| $75,000 to $99,999 | 104 | 10.3% |
| $100,000 to $149,999 | 112 | 11.1% |
| $150,000 to $199,999 | 90 | 8.9% |
| $200,000+ | 99 | 9.8% |
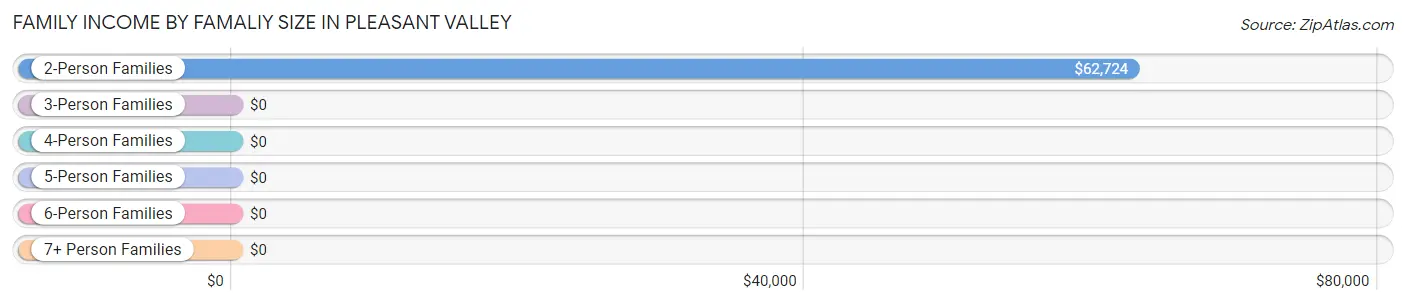
Family Income by Famaliy Size in Pleasant Valley
2-person families (585 | 57.8%) account for the highest median family income in Pleasant Valley with $62,724 per family, while 2-person families (585 | 57.8%) have the highest median income of $31,362 per family member.
| Income Bracket | # Families | Median Income |
| 2-Person Families | 585 (57.8%) | $62,724 |
| 3-Person Families | 192 (19.0%) | $0 |
| 4-Person Families | 123 (12.1%) | $0 |
| 5-Person Families | 59 (5.8%) | $0 |
| 6-Person Families | 54 (5.3%) | $0 |
| 7+ Person Families | 0 (0.0%) | $0 |
| Total | 1,013 (100.0%) | $63,878 |
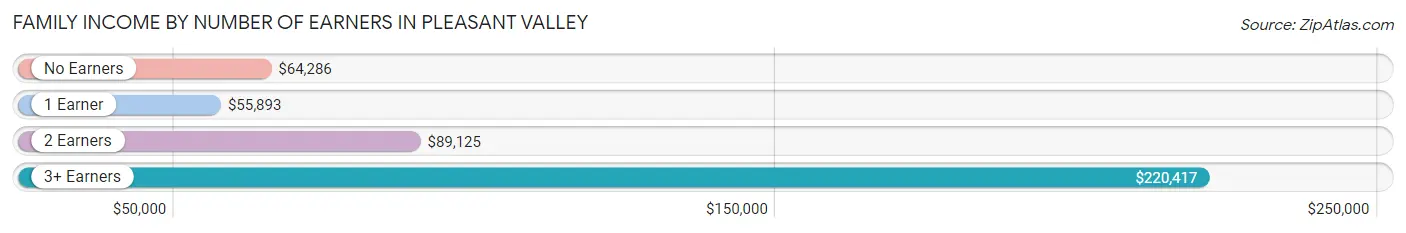
Family Income by Number of Earners in Pleasant Valley
The median family income in Pleasant Valley is $63,878, with families comprising 3+ earners (74) having the highest median family income of $220,417, while families with 1 earner (436) have the lowest median family income of $55,893, accounting for 7.3% and 43.0% of families, respectively.
| Number of Earners | # Families | Median Income |
| No Earners | 218 (21.5%) | $64,286 |
| 1 Earner | 436 (43.0%) | $55,893 |
| 2 Earners | 285 (28.1%) | $89,125 |
| 3+ Earners | 74 (7.3%) | $220,417 |
| Total | 1,013 (100.0%) | $63,878 |
Household Income in Pleasant Valley
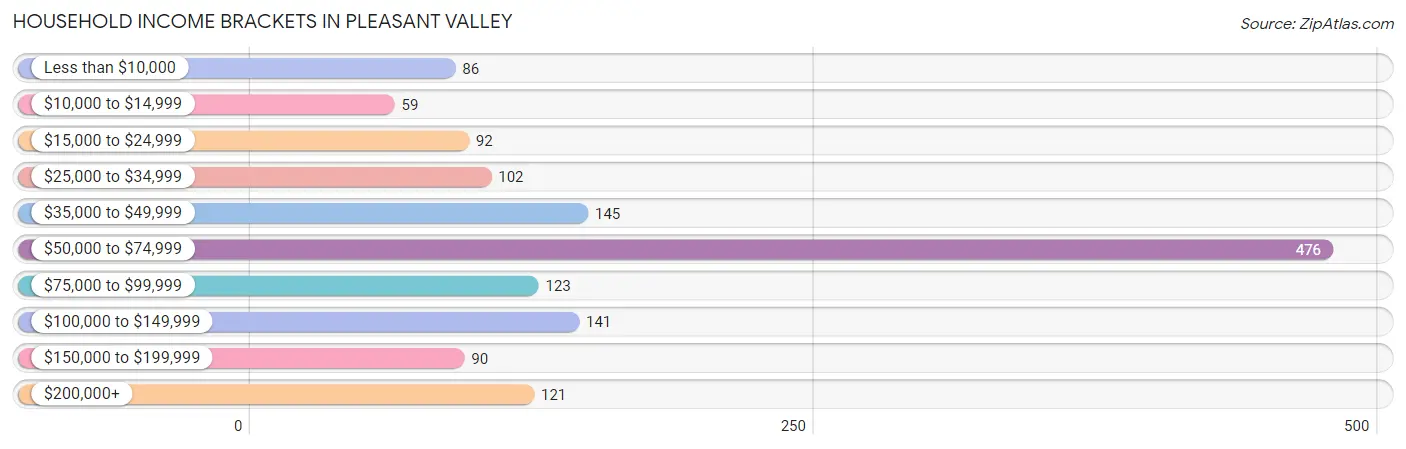
Household Income Brackets in Pleasant Valley
With 476 households falling in the category, the $50,000 to $74,999 income range is the most frequent in Pleasant Valley, accounting for 33.2% of all households. In contrast, only 59 households (4.1%) fall into the $10,000 to $14,999 income bracket, making it the least populous group.
| Income Bracket | # Households | % Households |
| Less than $10,000 | 86 | 6.0% |
| $10,000 to $14,999 | 59 | 4.1% |
| $15,000 to $24,999 | 92 | 6.4% |
| $25,000 to $34,999 | 102 | 7.1% |
| $35,000 to $49,999 | 145 | 10.1% |
| $50,000 to $74,999 | 476 | 33.2% |
| $75,000 to $99,999 | 123 | 8.6% |
| $100,000 to $149,999 | 141 | 9.8% |
| $150,000 to $199,999 | 90 | 6.3% |
| $200,000+ | 121 | 8.4% |
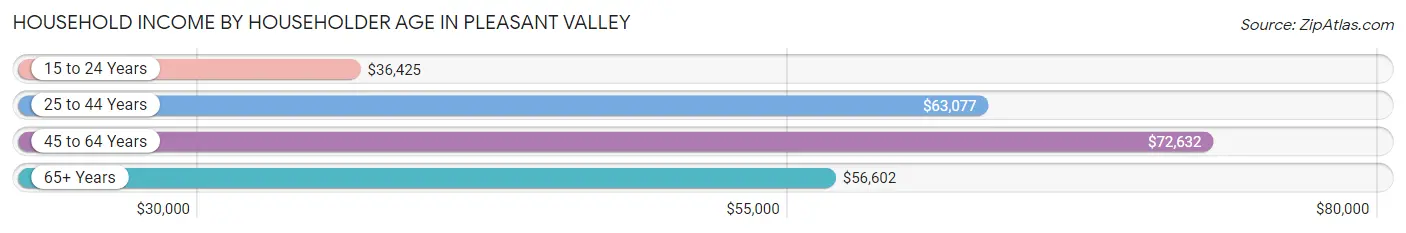
Household Income by Householder Age in Pleasant Valley
The median household income in Pleasant Valley is $61,067, with the highest median household income of $72,632 found in the 45 to 64 years age bracket for the primary householder. A total of 434 households (30.2%) fall into this category. Meanwhile, the 15 to 24 years age bracket for the primary householder has the lowest median household income of $36,425, with 123 households (8.6%) in this group.
| Income Bracket | # Households | Median Income |
| 15 to 24 Years | 123 (8.6%) | $36,425 |
| 25 to 44 Years | 446 (31.1%) | $63,077 |
| 45 to 64 Years | 434 (30.2%) | $72,632 |
| 65+ Years | 432 (30.1%) | $56,602 |
| Total | 1,435 (100.0%) | $61,067 |
Poverty in Pleasant Valley
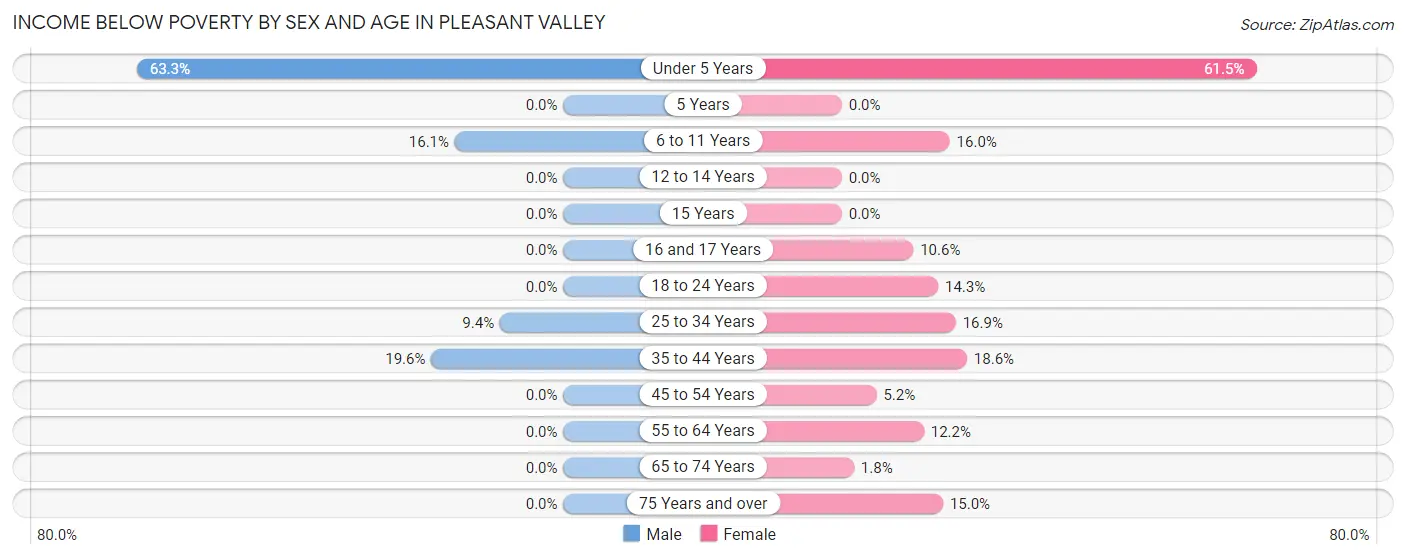
Income Below Poverty by Sex and Age in Pleasant Valley
With 7.1% poverty level for males and 16.5% for females among the residents of Pleasant Valley, under 5 year old males and under 5 year old females are the most vulnerable to poverty, with 38 males (63.3%) and 96 females (61.5%) in their respective age groups living below the poverty level.
| Age Bracket | Male | Female |
| Under 5 Years | 38 (63.3%) | 96 (61.5%) |
| 5 Years | 0 (0.0%) | 0 (0.0%) |
| 6 to 11 Years | 24 (16.1%) | 37 (16.0%) |
| 12 to 14 Years | 0 (0.0%) | 0 (0.0%) |
| 15 Years | 0 (0.0%) | 0 (0.0%) |
| 16 and 17 Years | 0 (0.0%) | 7 (10.6%) |
| 18 to 24 Years | 0 (0.0%) | 26 (14.3%) |
| 25 to 34 Years | 16 (9.4%) | 33 (16.9%) |
| 35 to 44 Years | 30 (19.6%) | 47 (18.6%) |
| 45 to 54 Years | 0 (0.0%) | 12 (5.1%) |
| 55 to 64 Years | 0 (0.0%) | 24 (12.2%) |
| 65 to 74 Years | 0 (0.0%) | 2 (1.8%) |
| 75 Years and over | 0 (0.0%) | 32 (15.0%) |
| Total | 108 (7.1%) | 316 (16.5%) |
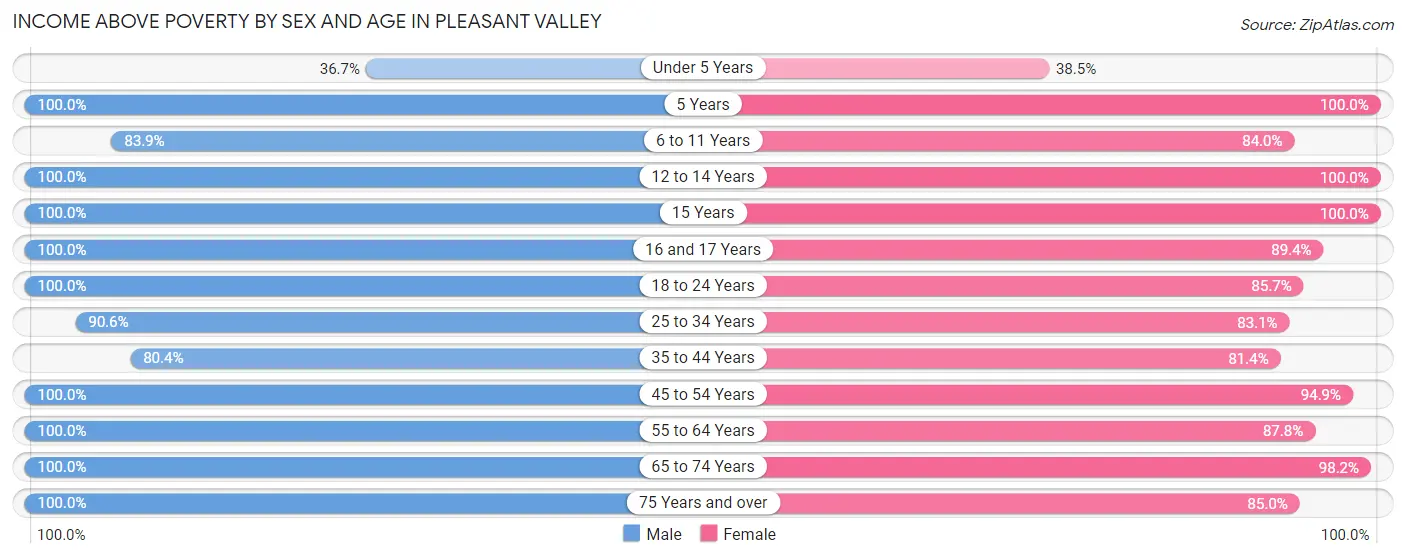
Income Above Poverty by Sex and Age in Pleasant Valley
According to the poverty statistics in Pleasant Valley, males aged 5 years and females aged 5 years are the age groups that are most secure financially, with 100.0% of males and 100.0% of females in these age groups living above the poverty line.
| Age Bracket | Male | Female |
| Under 5 Years | 22 (36.7%) | 60 (38.5%) |
| 5 Years | 24 (100.0%) | 24 (100.0%) |
| 6 to 11 Years | 125 (83.9%) | 194 (84.0%) |
| 12 to 14 Years | 25 (100.0%) | 31 (100.0%) |
| 15 Years | 47 (100.0%) | 28 (100.0%) |
| 16 and 17 Years | 6 (100.0%) | 59 (89.4%) |
| 18 to 24 Years | 161 (100.0%) | 156 (85.7%) |
| 25 to 34 Years | 154 (90.6%) | 162 (83.1%) |
| 35 to 44 Years | 123 (80.4%) | 206 (81.4%) |
| 45 to 54 Years | 229 (100.0%) | 221 (94.9%) |
| 55 to 64 Years | 167 (100.0%) | 173 (87.8%) |
| 65 to 74 Years | 151 (100.0%) | 109 (98.2%) |
| 75 Years and over | 178 (100.0%) | 181 (85.0%) |
| Total | 1,412 (92.9%) | 1,604 (83.5%) |
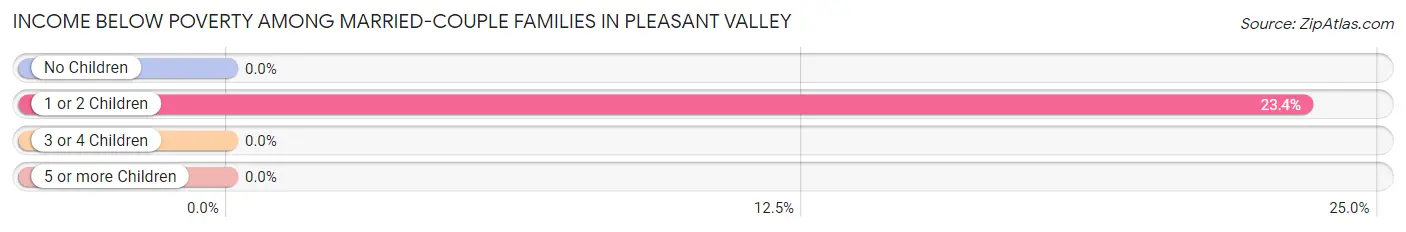
Income Below Poverty Among Married-Couple Families in Pleasant Valley
The poverty statistics for married-couple families in Pleasant Valley show that 6.6% or 51 of the total 778 families live below the poverty line. Families with 1 or 2 children have the highest poverty rate of 23.4%, comprising of 51 families. On the other hand, families with no children have the lowest poverty rate of 0.0%, which includes 0 families.
| Children | Above Poverty | Below Poverty |
| No Children | 518 (100.0%) | 0 (0.0%) |
| 1 or 2 Children | 167 (76.6%) | 51 (23.4%) |
| 3 or 4 Children | 42 (100.0%) | 0 (0.0%) |
| 5 or more Children | 0 (0.0%) | 0 (0.0%) |
| Total | 727 (93.4%) | 51 (6.6%) |
Income Below Poverty Among Single-Parent Households in Pleasant Valley
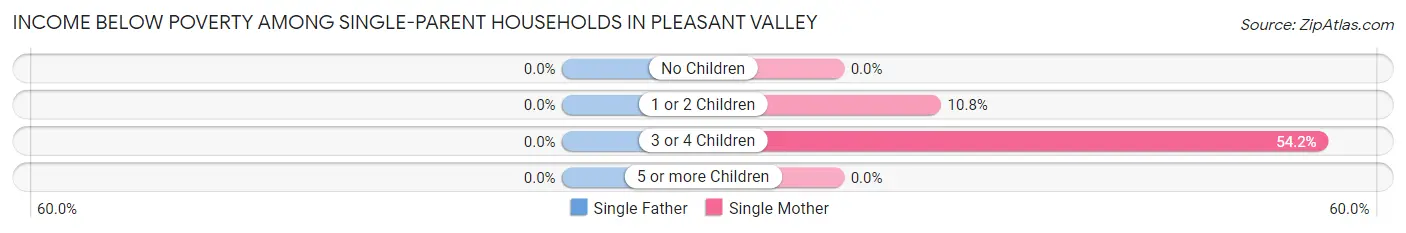
| Children | Single Father | Single Mother |
| No Children | 0 (0.0%) | 0 (0.0%) |
| 1 or 2 Children | 0 (0.0%) | 9 (10.8%) |
| 3 or 4 Children | 0 (0.0%) | 26 (54.2%) |
| 5 or more Children | 0 (0.0%) | 0 (0.0%) |
| Total | 0 (0.0%) | 35 (19.7%) |
Income Below Poverty Among Married-Couple vs Single-Parent Households in Pleasant Valley
The poverty data for Pleasant Valley shows that 51 of the married-couple family households (6.6%) and 35 of the single-parent households (14.9%) are living below the poverty level. Within the married-couple family households, those with 1 or 2 children have the highest poverty rate, with 51 households (23.4%) falling below the poverty line. Among the single-parent households, those with 3 or 4 children have the highest poverty rate, with 26 household (54.2%) living below poverty.
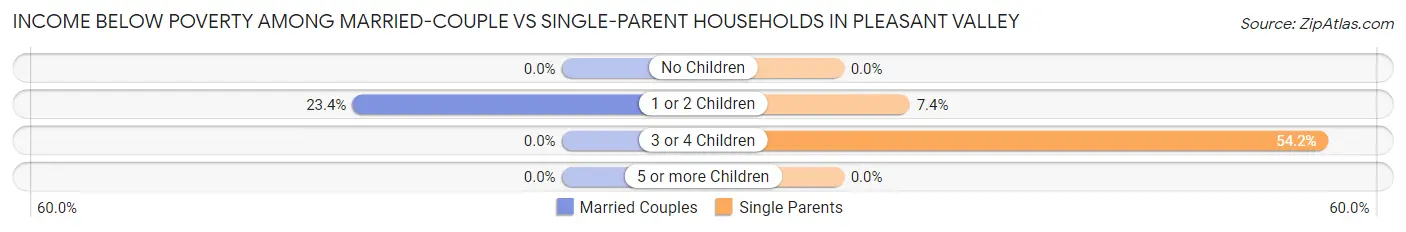
| Children | Married-Couple Families | Single-Parent Households |
| No Children | 0 (0.0%) | 0 (0.0%) |
| 1 or 2 Children | 51 (23.4%) | 9 (7.4%) |
| 3 or 4 Children | 0 (0.0%) | 26 (54.2%) |
| 5 or more Children | 0 (0.0%) | 0 (0.0%) |
| Total | 51 (6.6%) | 35 (14.9%) |
Employment Characteristics in Pleasant Valley
Employment by Class of Employer in Pleasant Valley
Among the 1,533 employed individuals in Pleasant Valley, private company employees (1,096 | 71.5%), federal government employees (178 | 11.6%), and state government employees (113 | 7.4%) make up the most common classes of employment.
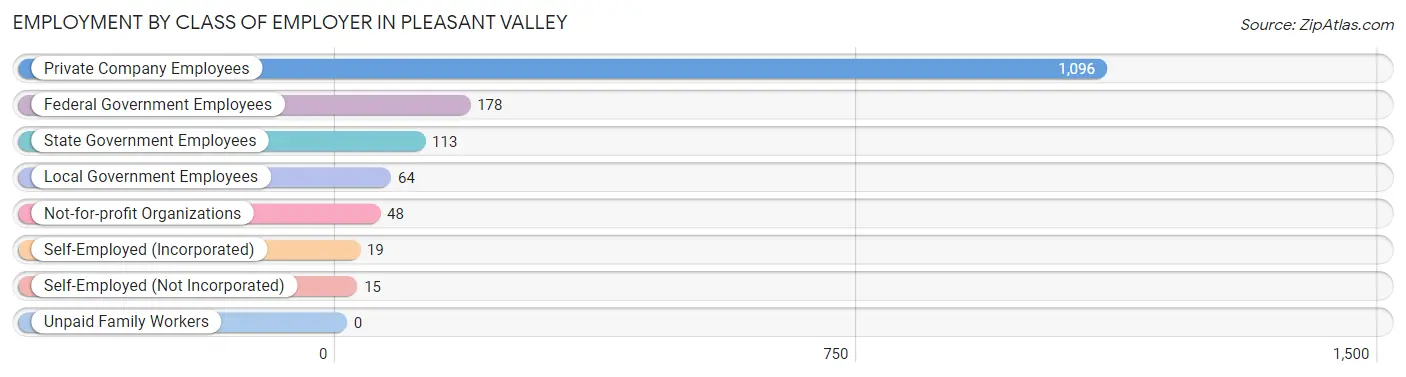
| Employer Class | # Employees | % Employees |
| Private Company Employees | 1,096 | 71.5% |
| Self-Employed (Incorporated) | 19 | 1.2% |
| Self-Employed (Not Incorporated) | 15 | 1.0% |
| Not-for-profit Organizations | 48 | 3.1% |
| Local Government Employees | 64 | 4.2% |
| State Government Employees | 113 | 7.4% |
| Federal Government Employees | 178 | 11.6% |
| Unpaid Family Workers | 0 | 0.0% |
| Total | 1,533 | 100.0% |
Employment Status by Age in Pleasant Valley
According to the labor force statistics for Pleasant Valley, out of the total population over 16 years of age (2,670), 58.4% or 1,559 individuals are in the labor force, with 1.6% or 25 of them unemployed. The age group with the highest labor force participation rate is 30 to 34 years, with 88.0% or 147 individuals in the labor force. Within the labor force, the 30 to 34 years age range has the highest percentage of unemployed individuals, with 8.1% or 12 of them being unemployed.
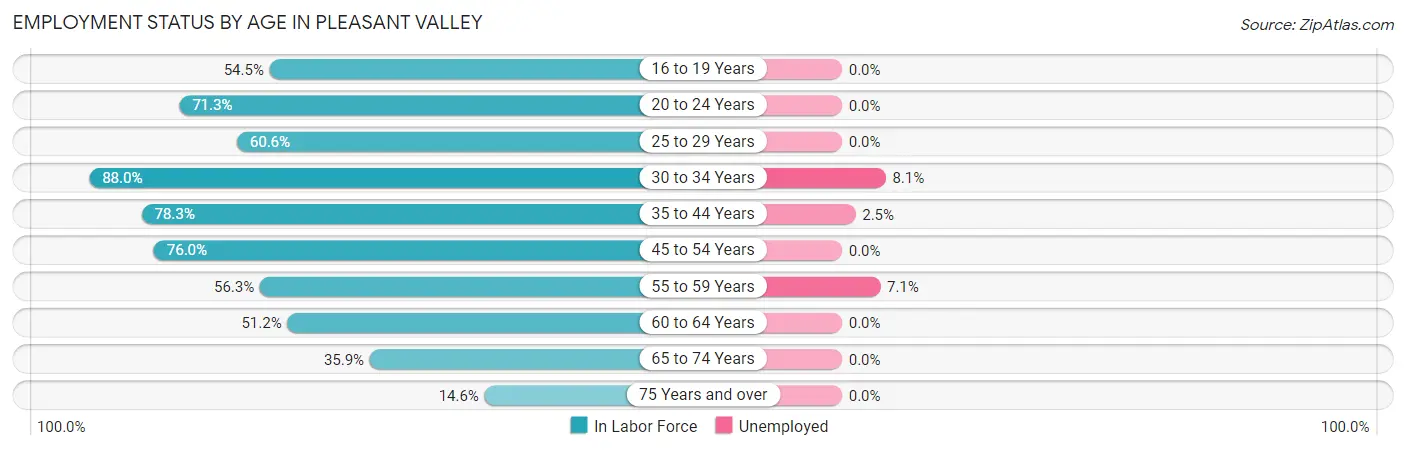
| Age Bracket | In Labor Force | Unemployed |
| 16 to 19 Years | 73 (54.5%) | 0 (0.0%) |
| 20 to 24 Years | 204 (71.3%) | 0 (0.0%) |
| 25 to 29 Years | 120 (60.6%) | 0 (0.0%) |
| 30 to 34 Years | 147 (88.0%) | 12 (8.1%) |
| 35 to 44 Years | 318 (78.3%) | 8 (2.5%) |
| 45 to 54 Years | 351 (76.0%) | 0 (0.0%) |
| 55 to 59 Years | 85 (56.3%) | 6 (7.1%) |
| 60 to 64 Years | 109 (51.2%) | 0 (0.0%) |
| 65 to 74 Years | 94 (35.9%) | 0 (0.0%) |
| 75 Years and over | 57 (14.6%) | 0 (0.0%) |
| Total | 1,559 (58.4%) | 25 (1.6%) |
Employment Status by Educational Attainment in Pleasant Valley
According to labor force statistics for Pleasant Valley, 70.8% of individuals (1,131) out of the total population between 25 and 64 years of age (1,597) are in the labor force, with 2.2% or 25 of them being unemployed. The group with the highest labor force participation rate are those with the educational attainment of bachelor's degree or higher, with 92.7% or 671 individuals in the labor force. Within the labor force, individuals with college / associate degree education have the highest percentage of unemployment, with 8.7% or 19 of them being unemployed.
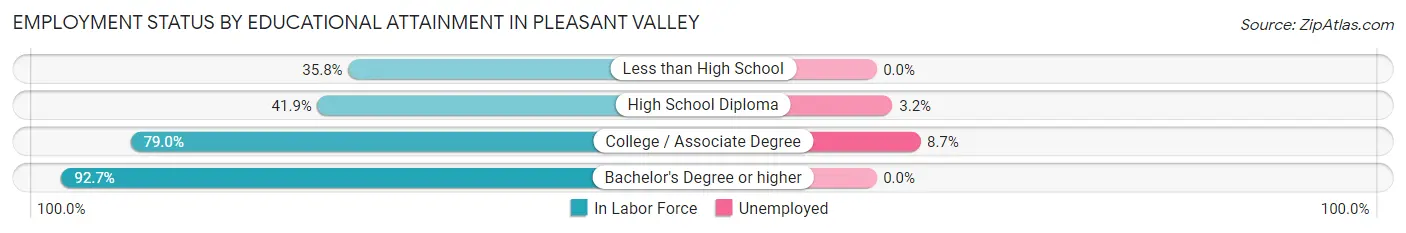
| Educational Attainment | In Labor Force | Unemployed |
| Less than High School | 53 (35.8%) | 0 (0.0%) |
| High School Diploma | 188 (41.9%) | 14 (3.2%) |
| College / Associate Degree | 218 (79.0%) | 24 (8.7%) |
| Bachelor's Degree or higher | 671 (92.7%) | 0 (0.0%) |
| Total | 1,131 (70.8%) | 35 (2.2%) |
Employment Occupations by Sex in Pleasant Valley
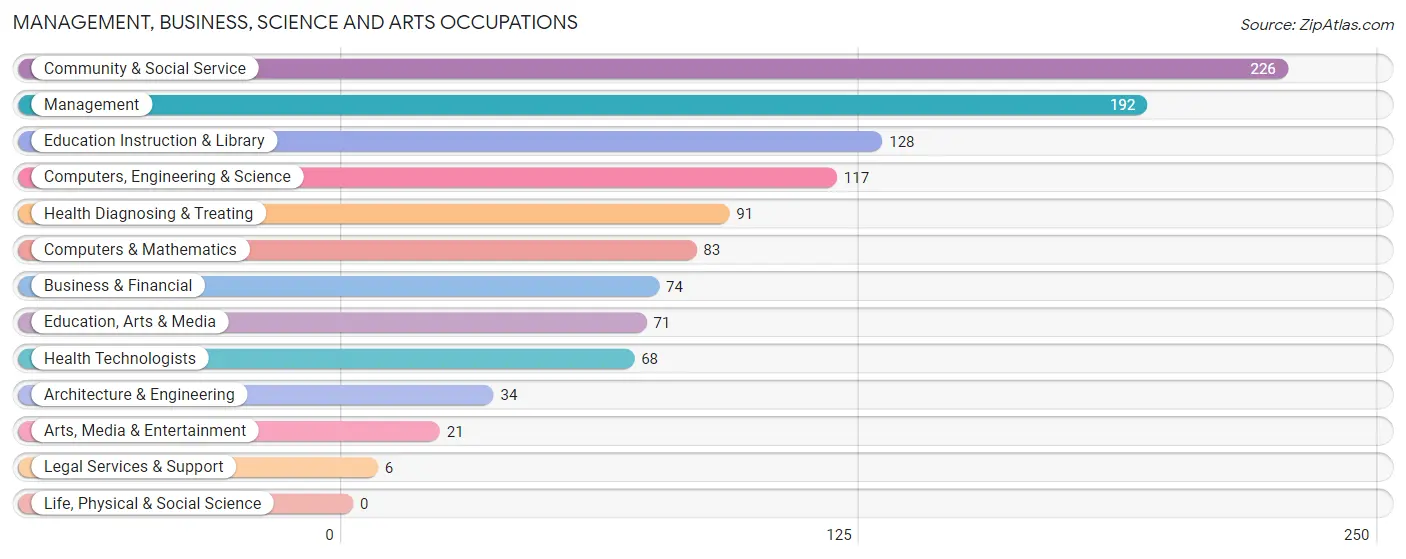
Management, Business, Science and Arts Occupations
The most common Management, Business, Science and Arts occupations in Pleasant Valley are Community & Social Service (226 | 14.9%), Management (192 | 12.6%), Education Instruction & Library (128 | 8.4%), Computers, Engineering & Science (117 | 7.7%), and Health Diagnosing & Treating (91 | 6.0%).
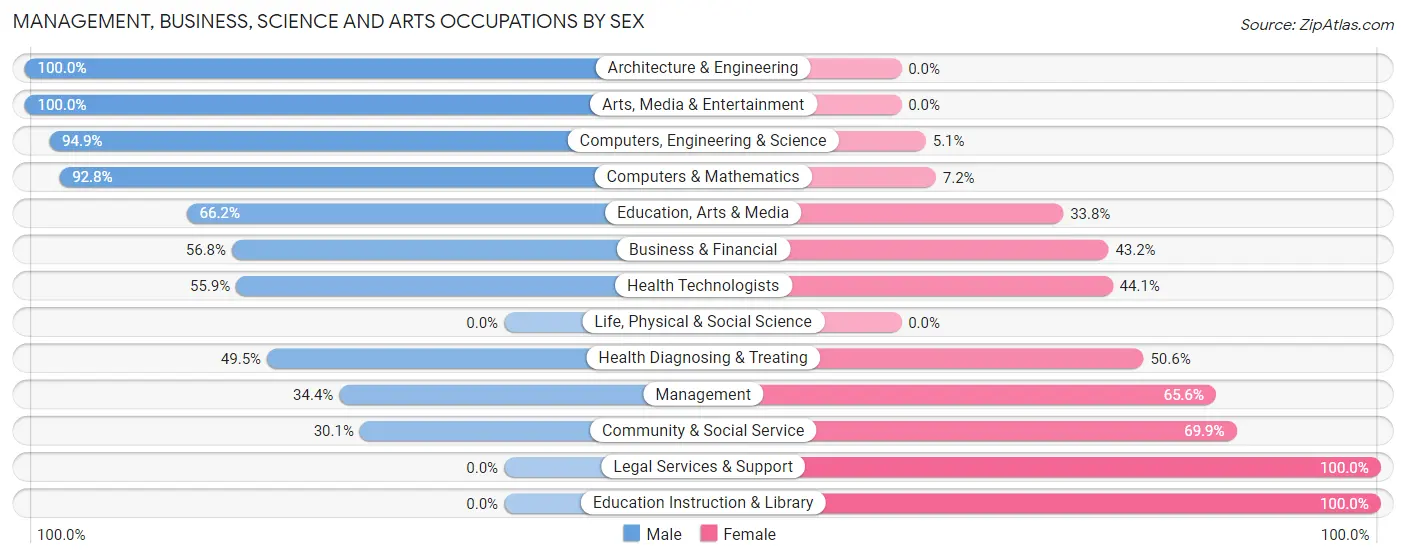
Management, Business, Science and Arts Occupations by Sex
Within the Management, Business, Science and Arts occupations in Pleasant Valley, the most male-oriented occupations are Architecture & Engineering (100.0%), Arts, Media & Entertainment (100.0%), and Computers, Engineering & Science (94.9%), while the most female-oriented occupations are Legal Services & Support (100.0%), Education Instruction & Library (100.0%), and Community & Social Service (69.9%).
| Occupation | Male | Female |
| Management | 66 (34.4%) | 126 (65.6%) |
| Business & Financial | 42 (56.8%) | 32 (43.2%) |
| Computers, Engineering & Science | 111 (94.9%) | 6 (5.1%) |
| Computers & Mathematics | 77 (92.8%) | 6 (7.2%) |
| Architecture & Engineering | 34 (100.0%) | 0 (0.0%) |
| Life, Physical & Social Science | 0 (0.0%) | 0 (0.0%) |
| Community & Social Service | 68 (30.1%) | 158 (69.9%) |
| Education, Arts & Media | 47 (66.2%) | 24 (33.8%) |
| Legal Services & Support | 0 (0.0%) | 6 (100.0%) |
| Education Instruction & Library | 0 (0.0%) | 128 (100.0%) |
| Arts, Media & Entertainment | 21 (100.0%) | 0 (0.0%) |
| Health Diagnosing & Treating | 45 (49.4%) | 46 (50.5%) |
| Health Technologists | 38 (55.9%) | 30 (44.1%) |
| Total (Category) | 332 (47.4%) | 368 (52.6%) |
| Total (Overall) | 755 (49.6%) | 766 (50.4%) |
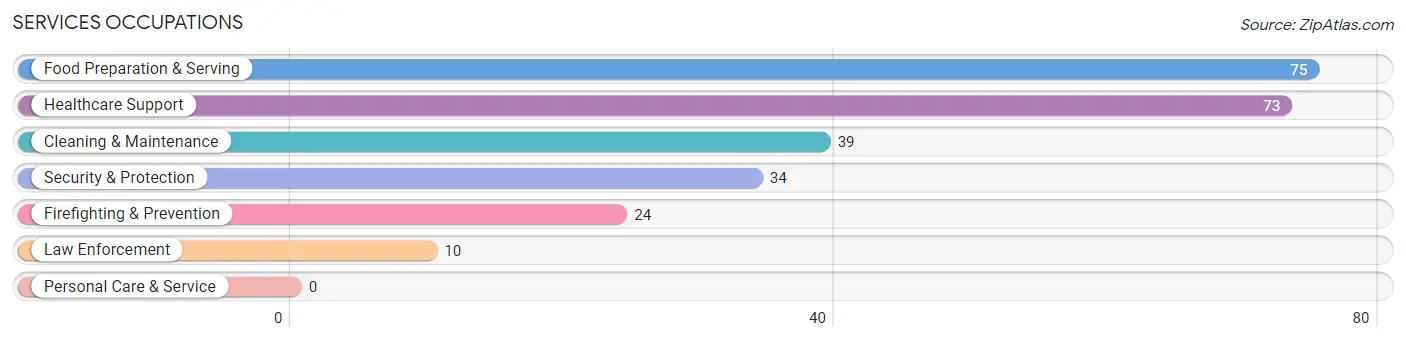
Services Occupations
The most common Services occupations in Pleasant Valley are Food Preparation & Serving (75 | 4.9%), Healthcare Support (73 | 4.8%), Cleaning & Maintenance (39 | 2.6%), Security & Protection (34 | 2.2%), and Firefighting & Prevention (24 | 1.6%).
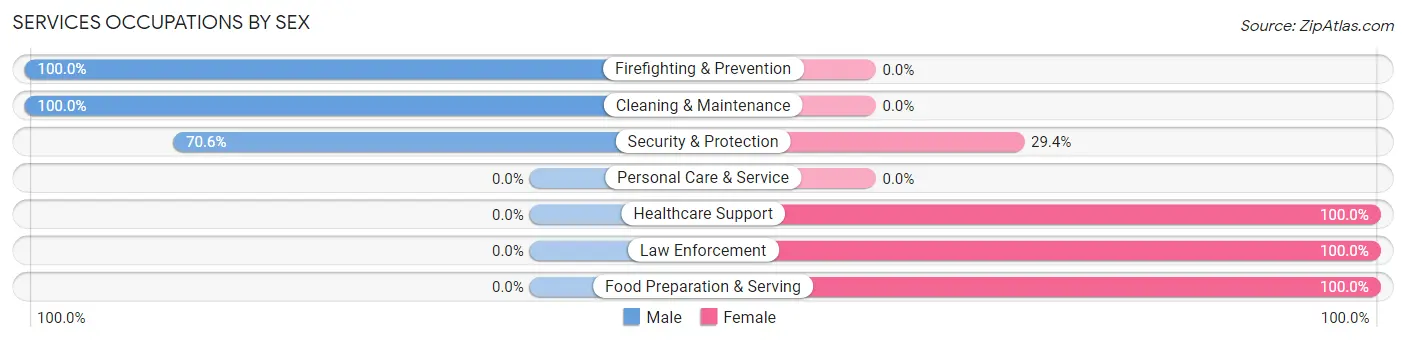
Services Occupations by Sex
Within the Services occupations in Pleasant Valley, the most male-oriented occupations are Firefighting & Prevention (100.0%), Cleaning & Maintenance (100.0%), and Security & Protection (70.6%), while the most female-oriented occupations are Healthcare Support (100.0%), Law Enforcement (100.0%), and Food Preparation & Serving (100.0%).
| Occupation | Male | Female |
| Healthcare Support | 0 (0.0%) | 73 (100.0%) |
| Security & Protection | 24 (70.6%) | 10 (29.4%) |
| Firefighting & Prevention | 24 (100.0%) | 0 (0.0%) |
| Law Enforcement | 0 (0.0%) | 10 (100.0%) |
| Food Preparation & Serving | 0 (0.0%) | 75 (100.0%) |
| Cleaning & Maintenance | 39 (100.0%) | 0 (0.0%) |
| Personal Care & Service | 0 (0.0%) | 0 (0.0%) |
| Total (Category) | 63 (28.5%) | 158 (71.5%) |
| Total (Overall) | 755 (49.6%) | 766 (50.4%) |
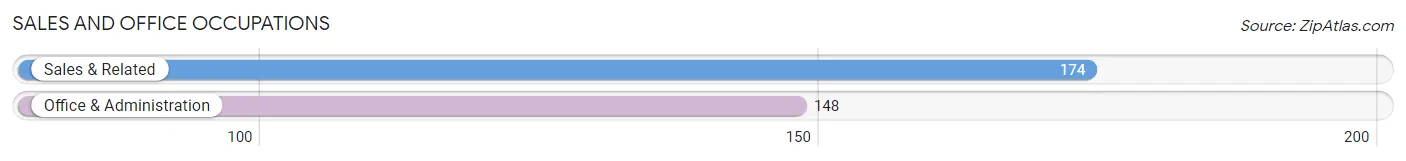
Sales and Office Occupations
The most common Sales and Office occupations in Pleasant Valley are Sales & Related (174 | 11.4%), and Office & Administration (148 | 9.7%).
Sales and Office Occupations by Sex
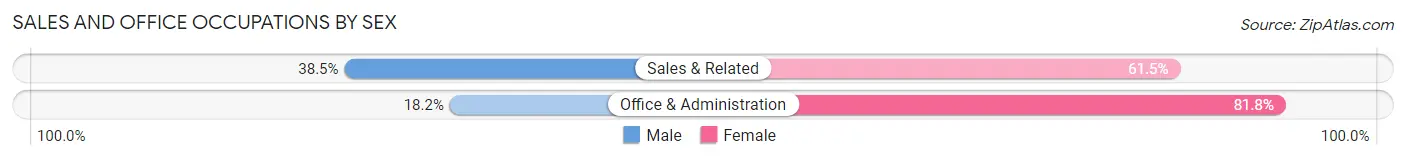
| Occupation | Male | Female |
| Sales & Related | 67 (38.5%) | 107 (61.5%) |
| Office & Administration | 27 (18.2%) | 121 (81.8%) |
| Total (Category) | 94 (29.2%) | 228 (70.8%) |
| Total (Overall) | 755 (49.6%) | 766 (50.4%) |
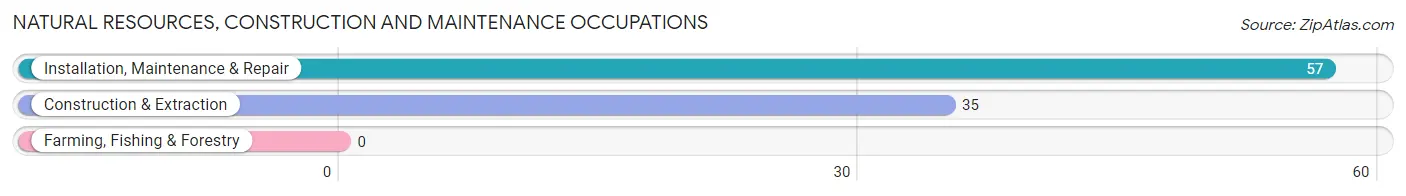
Natural Resources, Construction and Maintenance Occupations
The most common Natural Resources, Construction and Maintenance occupations in Pleasant Valley are Installation, Maintenance & Repair (57 | 3.7%), and Construction & Extraction (35 | 2.3%).
Natural Resources, Construction and Maintenance Occupations by Sex
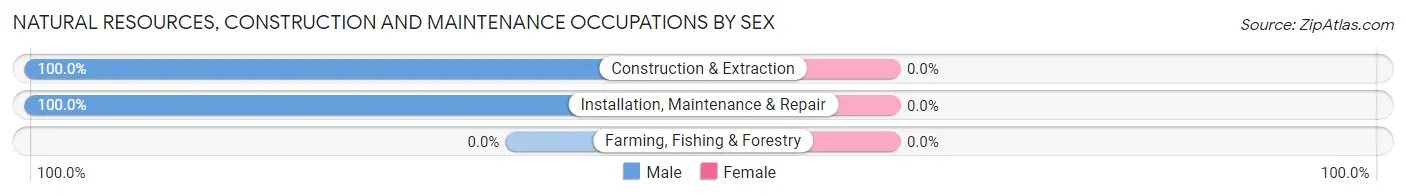
| Occupation | Male | Female |
| Farming, Fishing & Forestry | 0 (0.0%) | 0 (0.0%) |
| Construction & Extraction | 35 (100.0%) | 0 (0.0%) |
| Installation, Maintenance & Repair | 57 (100.0%) | 0 (0.0%) |
| Total (Category) | 92 (100.0%) | 0 (0.0%) |
| Total (Overall) | 755 (49.6%) | 766 (50.4%) |
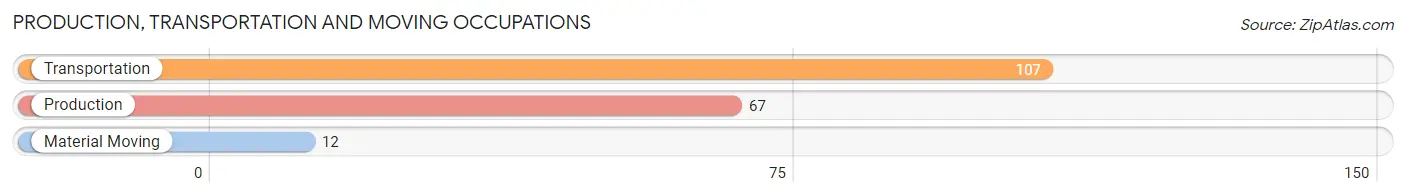
Production, Transportation and Moving Occupations
The most common Production, Transportation and Moving occupations in Pleasant Valley are Transportation (107 | 7.0%), Production (67 | 4.4%), and Material Moving (12 | 0.8%).
Production, Transportation and Moving Occupations by Sex
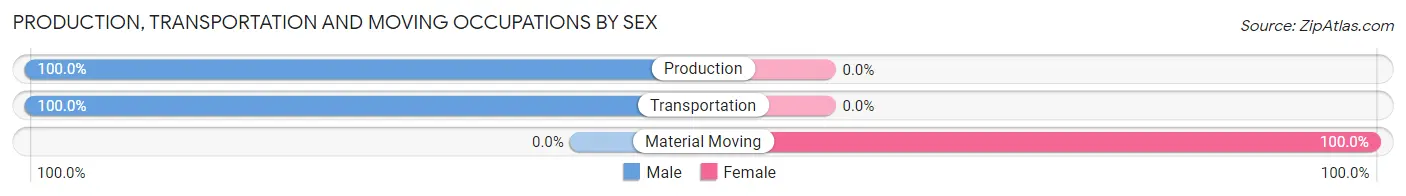
| Occupation | Male | Female |
| Production | 67 (100.0%) | 0 (0.0%) |
| Transportation | 107 (100.0%) | 0 (0.0%) |
| Material Moving | 0 (0.0%) | 12 (100.0%) |
| Total (Category) | 174 (93.5%) | 12 (6.5%) |
| Total (Overall) | 755 (49.6%) | 766 (50.4%) |
Employment Industries by Sex in Pleasant Valley
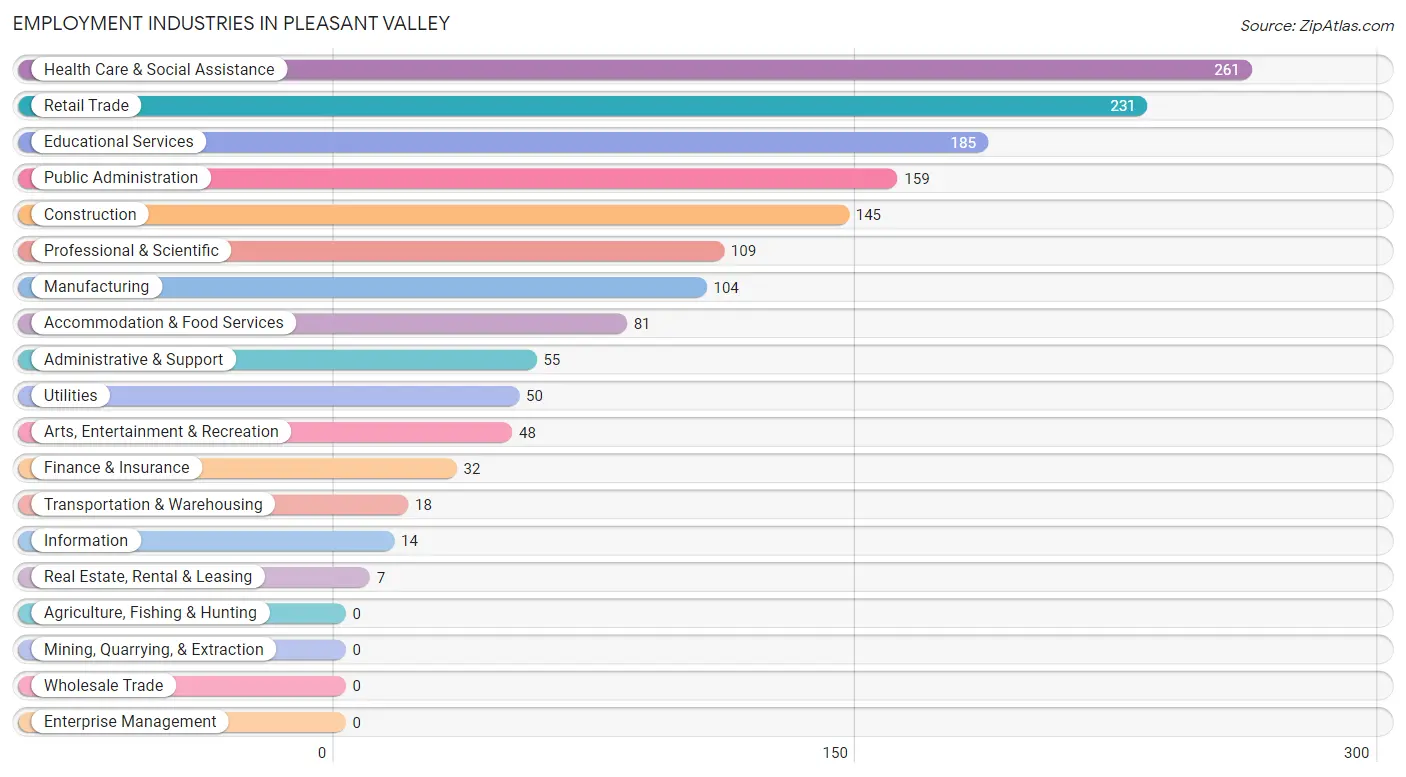
Employment Industries in Pleasant Valley
The major employment industries in Pleasant Valley include Health Care & Social Assistance (261 | 17.2%), Retail Trade (231 | 15.2%), Educational Services (185 | 12.2%), Public Administration (159 | 10.4%), and Construction (145 | 9.5%).
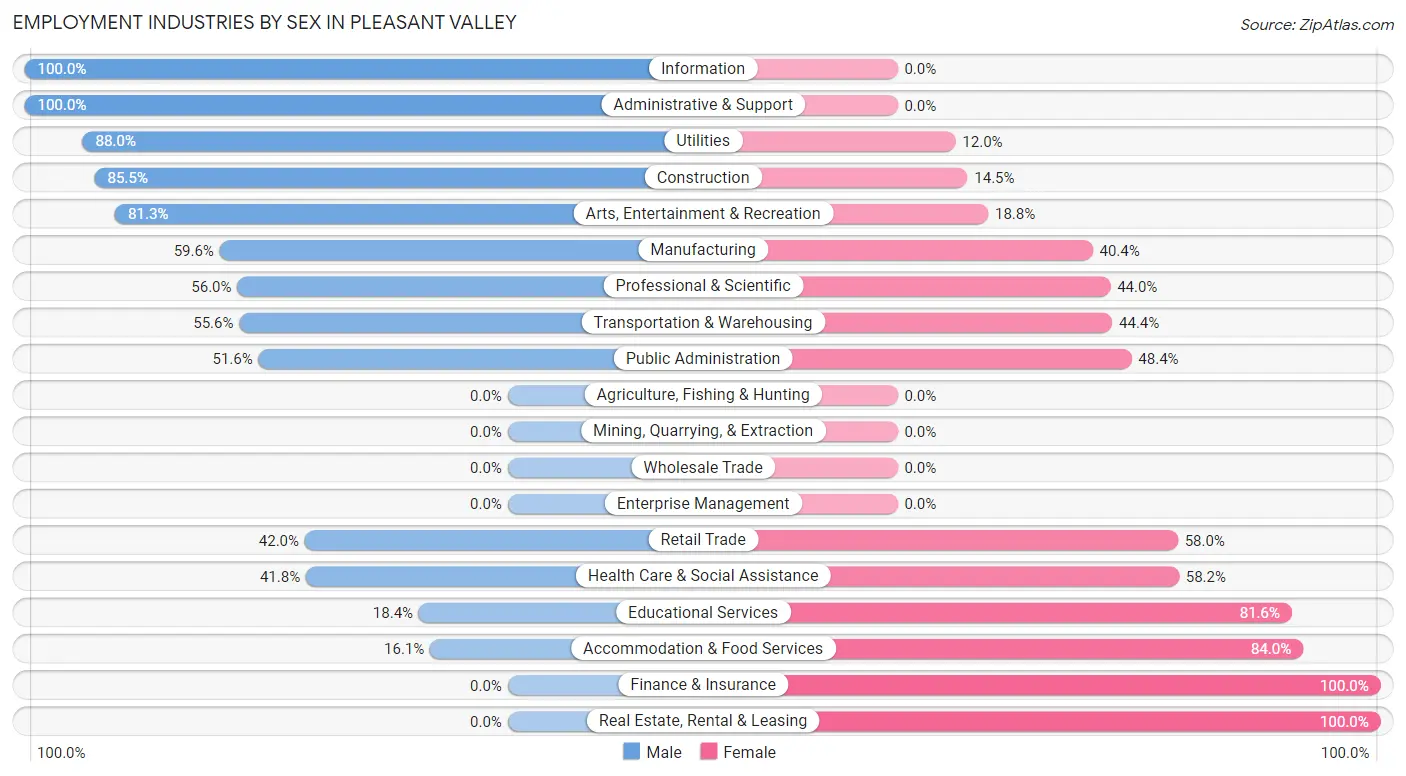
Employment Industries by Sex in Pleasant Valley
The Pleasant Valley industries that see more men than women are Information (100.0%), Administrative & Support (100.0%), and Utilities (88.0%), whereas the industries that tend to have a higher number of women are Finance & Insurance (100.0%), Real Estate, Rental & Leasing (100.0%), and Accommodation & Food Services (84.0%).
| Industry | Male | Female |
| Agriculture, Fishing & Hunting | 0 (0.0%) | 0 (0.0%) |
| Mining, Quarrying, & Extraction | 0 (0.0%) | 0 (0.0%) |
| Construction | 124 (85.5%) | 21 (14.5%) |
| Manufacturing | 62 (59.6%) | 42 (40.4%) |
| Wholesale Trade | 0 (0.0%) | 0 (0.0%) |
| Retail Trade | 97 (42.0%) | 134 (58.0%) |
| Transportation & Warehousing | 10 (55.6%) | 8 (44.4%) |
| Utilities | 44 (88.0%) | 6 (12.0%) |
| Information | 14 (100.0%) | 0 (0.0%) |
| Finance & Insurance | 0 (0.0%) | 32 (100.0%) |
| Real Estate, Rental & Leasing | 0 (0.0%) | 7 (100.0%) |
| Professional & Scientific | 61 (56.0%) | 48 (44.0%) |
| Enterprise Management | 0 (0.0%) | 0 (0.0%) |
| Administrative & Support | 55 (100.0%) | 0 (0.0%) |
| Educational Services | 34 (18.4%) | 151 (81.6%) |
| Health Care & Social Assistance | 109 (41.8%) | 152 (58.2%) |
| Arts, Entertainment & Recreation | 39 (81.2%) | 9 (18.8%) |
| Accommodation & Food Services | 13 (16.1%) | 68 (84.0%) |
| Public Administration | 82 (51.6%) | 77 (48.4%) |
| Total | 755 (49.6%) | 766 (50.4%) |
Education in Pleasant Valley
School Enrollment in Pleasant Valley
The most common levels of schooling among the 829 students in Pleasant Valley are elementary school (215 | 25.9%), college / undergraduate (169 | 20.4%), and middle school (157 | 18.9%).
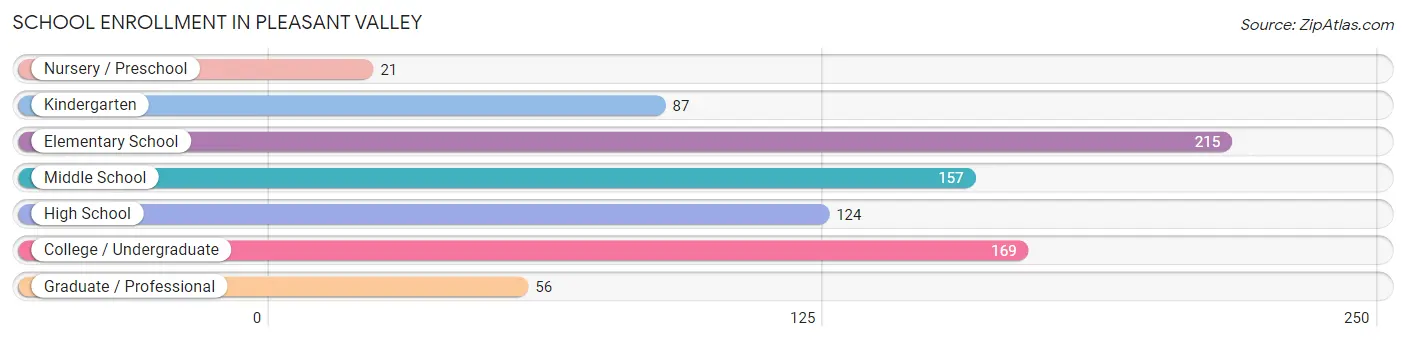
| School Level | # Students | % Students |
| Nursery / Preschool | 21 | 2.5% |
| Kindergarten | 87 | 10.5% |
| Elementary School | 215 | 25.9% |
| Middle School | 157 | 18.9% |
| High School | 124 | 15.0% |
| College / Undergraduate | 169 | 20.4% |
| Graduate / Professional | 56 | 6.8% |
| Total | 829 | 100.0% |
School Enrollment by Age by Funding Source in Pleasant Valley
Out of a total of 829 students who are enrolled in schools in Pleasant Valley, 107 (12.9%) attend a private institution, while the remaining 722 (87.1%) are enrolled in public schools. The age group of 3 to 4 year olds has the highest likelihood of being enrolled in private schools, with 21 (100.0% in the age bracket) enrolled. Conversely, the age group of 15 to 17 year olds has the lowest likelihood of being enrolled in a private school, with 158 (100.0% in the age bracket) attending a public institution.
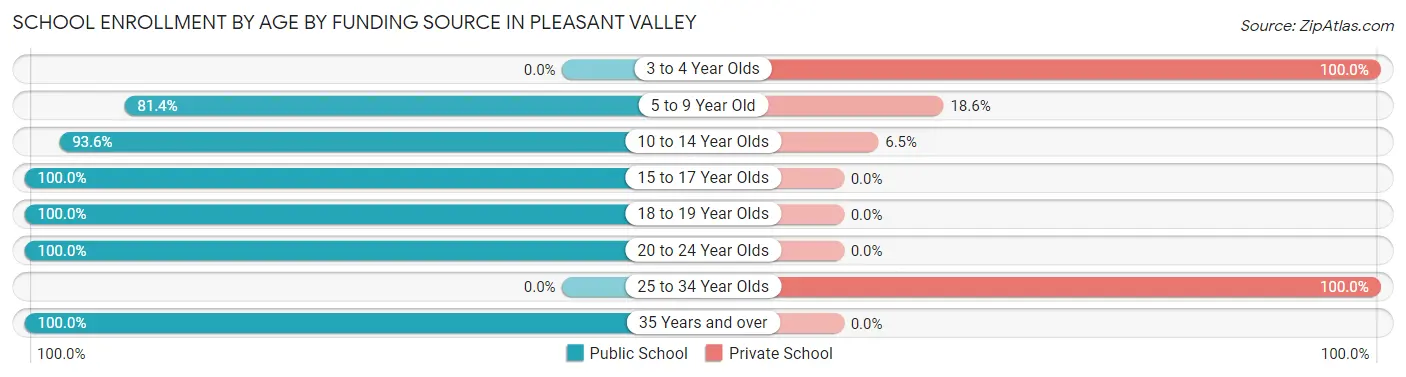
| Age Bracket | Public School | Private School |
| 3 to 4 Year Olds | 0 (0.0%) | 21 (100.0%) |
| 5 to 9 Year Old | 219 (81.4%) | 50 (18.6%) |
| 10 to 14 Year Olds | 174 (93.5%) | 12 (6.5%) |
| 15 to 17 Year Olds | 158 (100.0%) | 0 (0.0%) |
| 18 to 19 Year Olds | 49 (100.0%) | 0 (0.0%) |
| 20 to 24 Year Olds | 68 (100.0%) | 0 (0.0%) |
| 25 to 34 Year Olds | 0 (0.0%) | 24 (100.0%) |
| 35 Years and over | 54 (100.0%) | 0 (0.0%) |
| Total | 722 (87.1%) | 107 (12.9%) |
Educational Attainment by Field of Study in Pleasant Valley
Science & technology (195 | 19.5%), education (162 | 16.2%), business (150 | 15.0%), arts & humanities (72 | 7.2%), and social sciences (66 | 6.6%) are the most common fields of study among 1,002 individuals in Pleasant Valley who have obtained a bachelor's degree or higher.
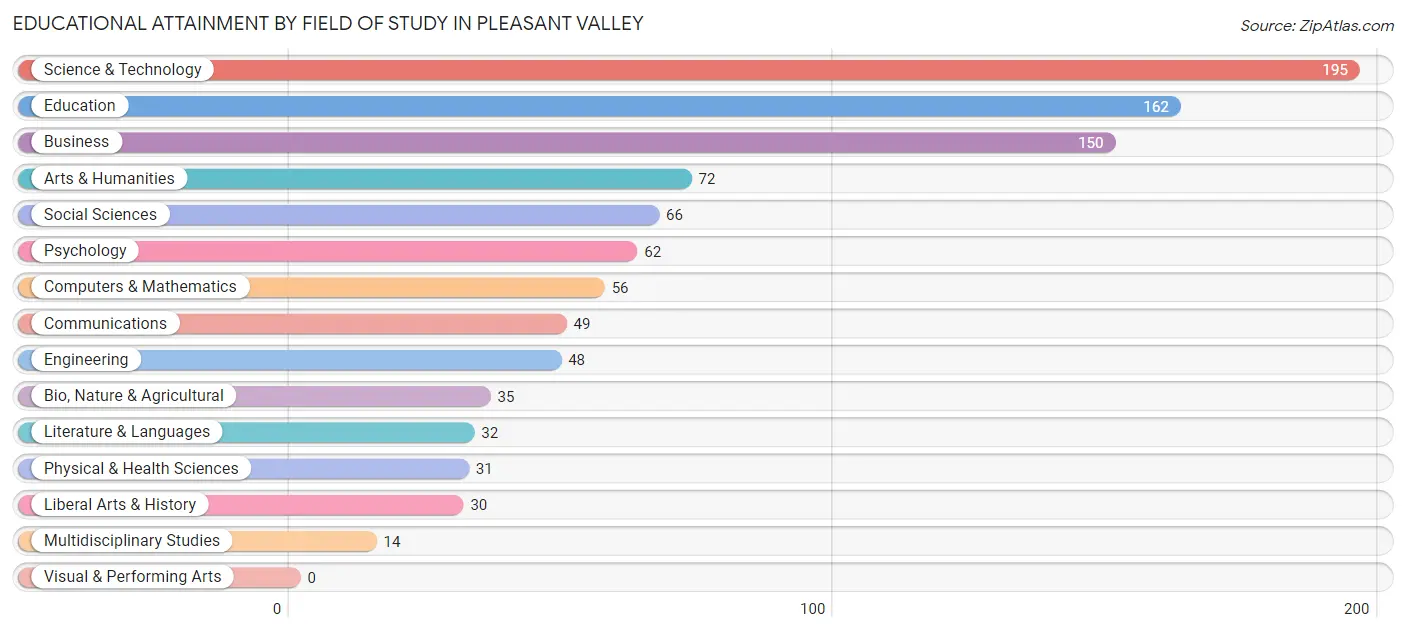
| Field of Study | # Graduates | % Graduates |
| Computers & Mathematics | 56 | 5.6% |
| Bio, Nature & Agricultural | 35 | 3.5% |
| Physical & Health Sciences | 31 | 3.1% |
| Psychology | 62 | 6.2% |
| Social Sciences | 66 | 6.6% |
| Engineering | 48 | 4.8% |
| Multidisciplinary Studies | 14 | 1.4% |
| Science & Technology | 195 | 19.5% |
| Business | 150 | 15.0% |
| Education | 162 | 16.2% |
| Literature & Languages | 32 | 3.2% |
| Liberal Arts & History | 30 | 3.0% |
| Visual & Performing Arts | 0 | 0.0% |
| Communications | 49 | 4.9% |
| Arts & Humanities | 72 | 7.2% |
| Total | 1,002 | 100.0% |
Transportation & Commute in Pleasant Valley
Vehicle Availability by Sex in Pleasant Valley
The most prevalent vehicle ownership categories in Pleasant Valley are males with 1 vehicle (280, accounting for 36.5%) and females with 1 vehicle (220, making up 36.5%).
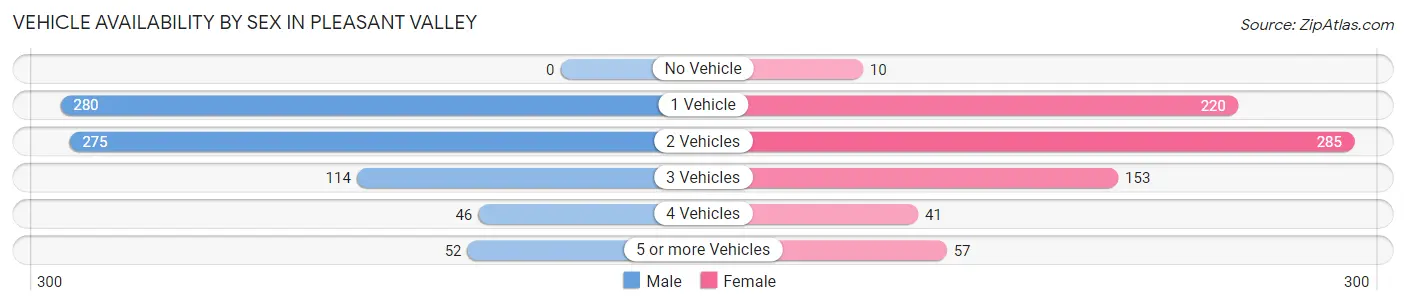
| Vehicles Available | Male | Female |
| No Vehicle | 0 (0.0%) | 10 (1.3%) |
| 1 Vehicle | 280 (36.5%) | 220 (28.7%) |
| 2 Vehicles | 275 (35.8%) | 285 (37.2%) |
| 3 Vehicles | 114 (14.9%) | 153 (20.0%) |
| 4 Vehicles | 46 (6.0%) | 41 (5.3%) |
| 5 or more Vehicles | 52 (6.8%) | 57 (7.4%) |
| Total | 767 (100.0%) | 766 (100.0%) |
Commute Time in Pleasant Valley
The most frequently occuring commute durations in Pleasant Valley are 10 to 14 minutes (348 commuters, 25.5%), 5 to 9 minutes (283 commuters, 20.7%), and 20 to 24 minutes (189 commuters, 13.9%).
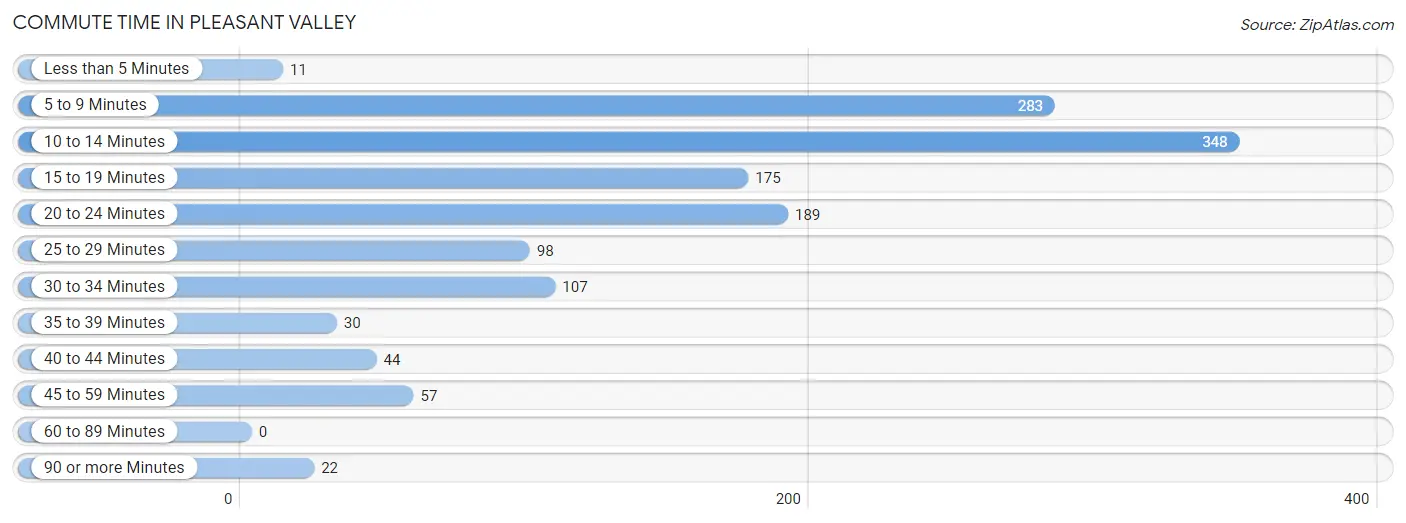
| Commute Time | # Commuters | % Commuters |
| Less than 5 Minutes | 11 | 0.8% |
| 5 to 9 Minutes | 283 | 20.7% |
| 10 to 14 Minutes | 348 | 25.5% |
| 15 to 19 Minutes | 175 | 12.8% |
| 20 to 24 Minutes | 189 | 13.9% |
| 25 to 29 Minutes | 98 | 7.2% |
| 30 to 34 Minutes | 107 | 7.8% |
| 35 to 39 Minutes | 30 | 2.2% |
| 40 to 44 Minutes | 44 | 3.2% |
| 45 to 59 Minutes | 57 | 4.2% |
| 60 to 89 Minutes | 0 | 0.0% |
| 90 or more Minutes | 22 | 1.6% |
Commute Time by Sex in Pleasant Valley
The most common commute times in Pleasant Valley are 5 to 9 minutes (199 commuters, 29.0%) for males and 10 to 14 minutes (225 commuters, 33.2%) for females.
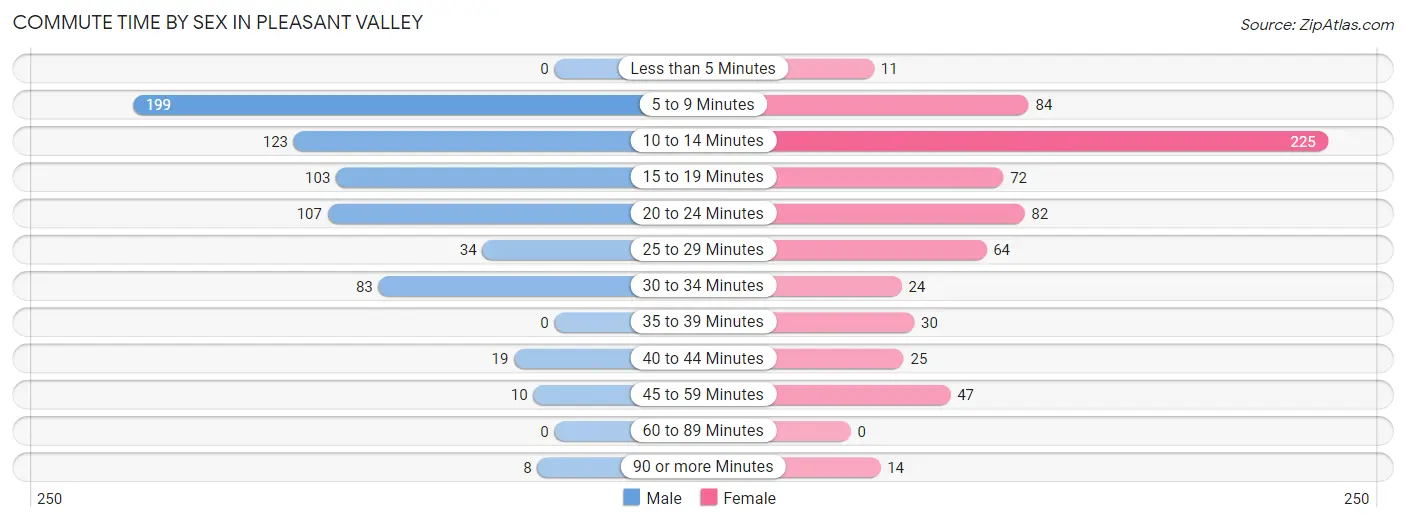
| Commute Time | Male | Female |
| Less than 5 Minutes | 0 (0.0%) | 11 (1.6%) |
| 5 to 9 Minutes | 199 (29.0%) | 84 (12.4%) |
| 10 to 14 Minutes | 123 (17.9%) | 225 (33.2%) |
| 15 to 19 Minutes | 103 (15.0%) | 72 (10.6%) |
| 20 to 24 Minutes | 107 (15.6%) | 82 (12.1%) |
| 25 to 29 Minutes | 34 (5.0%) | 64 (9.4%) |
| 30 to 34 Minutes | 83 (12.1%) | 24 (3.5%) |
| 35 to 39 Minutes | 0 (0.0%) | 30 (4.4%) |
| 40 to 44 Minutes | 19 (2.8%) | 25 (3.7%) |
| 45 to 59 Minutes | 10 (1.5%) | 47 (6.9%) |
| 60 to 89 Minutes | 0 (0.0%) | 0 (0.0%) |
| 90 or more Minutes | 8 (1.2%) | 14 (2.1%) |
Time of Departure to Work by Sex in Pleasant Valley
The most frequent times of departure to work in Pleasant Valley are 7:30 AM to 7:59 AM (158, 23.0%) for males and 6:30 AM to 6:59 AM (148, 21.8%) for females.
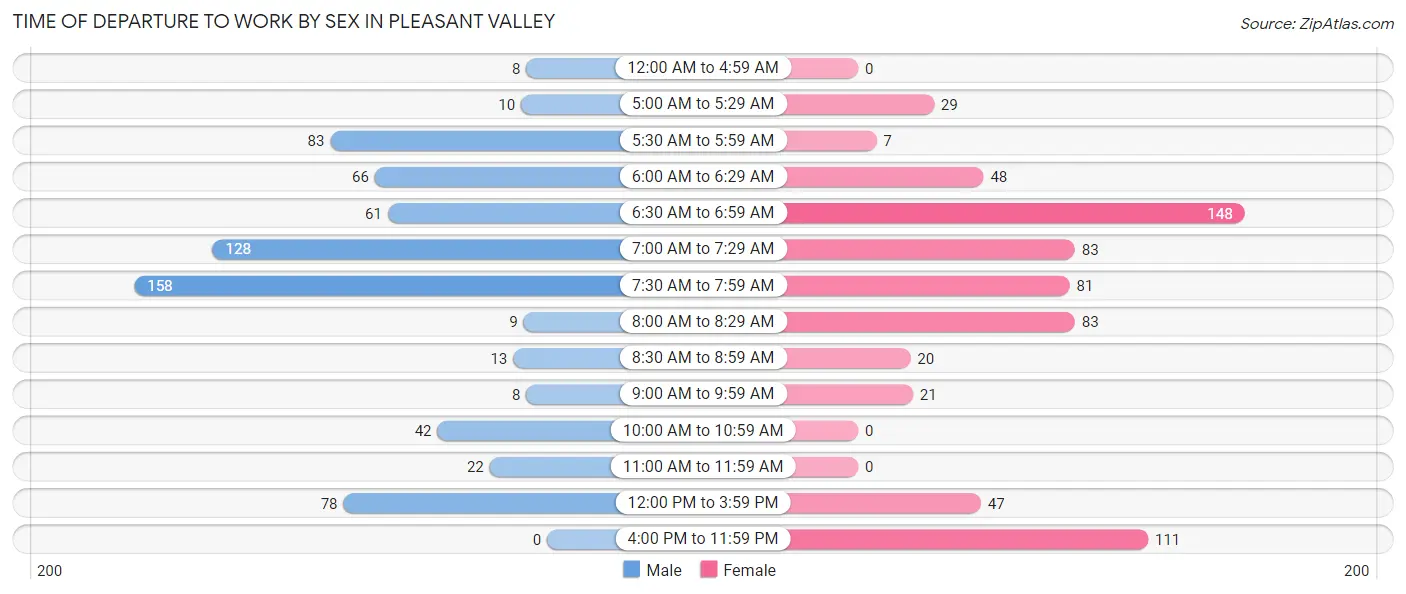
| Time of Departure | Male | Female |
| 12:00 AM to 4:59 AM | 8 (1.2%) | 0 (0.0%) |
| 5:00 AM to 5:29 AM | 10 (1.5%) | 29 (4.3%) |
| 5:30 AM to 5:59 AM | 83 (12.1%) | 7 (1.0%) |
| 6:00 AM to 6:29 AM | 66 (9.6%) | 48 (7.1%) |
| 6:30 AM to 6:59 AM | 61 (8.9%) | 148 (21.8%) |
| 7:00 AM to 7:29 AM | 128 (18.7%) | 83 (12.2%) |
| 7:30 AM to 7:59 AM | 158 (23.0%) | 81 (11.9%) |
| 8:00 AM to 8:29 AM | 9 (1.3%) | 83 (12.2%) |
| 8:30 AM to 8:59 AM | 13 (1.9%) | 20 (2.9%) |
| 9:00 AM to 9:59 AM | 8 (1.2%) | 21 (3.1%) |
| 10:00 AM to 10:59 AM | 42 (6.1%) | 0 (0.0%) |
| 11:00 AM to 11:59 AM | 22 (3.2%) | 0 (0.0%) |
| 12:00 PM to 3:59 PM | 78 (11.4%) | 47 (6.9%) |
| 4:00 PM to 11:59 PM | 0 (0.0%) | 111 (16.4%) |
| Total | 686 (100.0%) | 678 (100.0%) |
Housing Occupancy in Pleasant Valley
Occupancy by Ownership in Pleasant Valley
Of the total 1,435 dwellings in Pleasant Valley, owner-occupied units account for 1,046 (72.9%), while renter-occupied units make up 389 (27.1%).
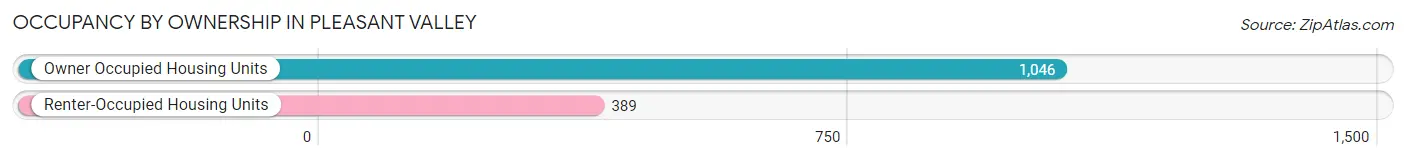
| Occupancy | # Housing Units | % Housing Units |
| Owner Occupied Housing Units | 1,046 | 72.9% |
| Renter-Occupied Housing Units | 389 | 27.1% |
| Total Occupied Housing Units | 1,435 | 100.0% |
Occupancy by Household Size in Pleasant Valley
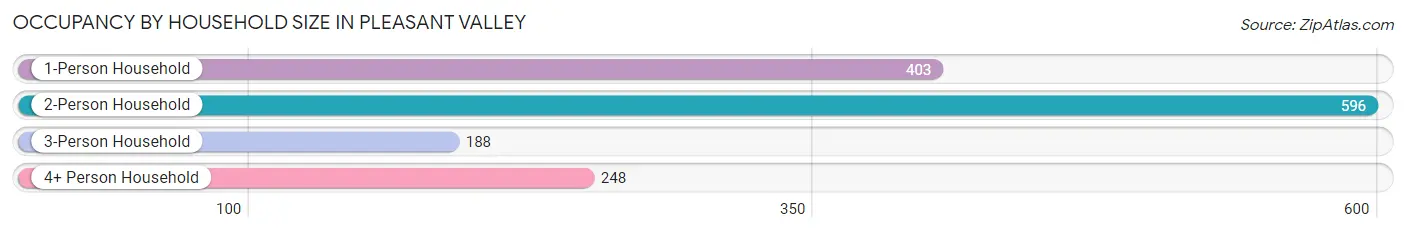
| Household Size | # Housing Units | % Housing Units |
| 1-Person Household | 403 | 28.1% |
| 2-Person Household | 596 | 41.5% |
| 3-Person Household | 188 | 13.1% |
| 4+ Person Household | 248 | 17.3% |
| Total Housing Units | 1,435 | 100.0% |
Occupancy by Ownership by Household Size in Pleasant Valley
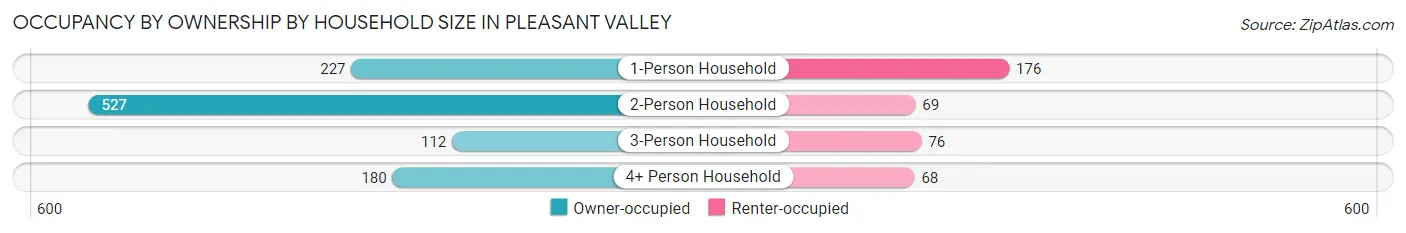
| Household Size | Owner-occupied | Renter-occupied |
| 1-Person Household | 227 (56.3%) | 176 (43.7%) |
| 2-Person Household | 527 (88.4%) | 69 (11.6%) |
| 3-Person Household | 112 (59.6%) | 76 (40.4%) |
| 4+ Person Household | 180 (72.6%) | 68 (27.4%) |
| Total Housing Units | 1,046 (72.9%) | 389 (27.1%) |
Occupancy by Educational Attainment in Pleasant Valley
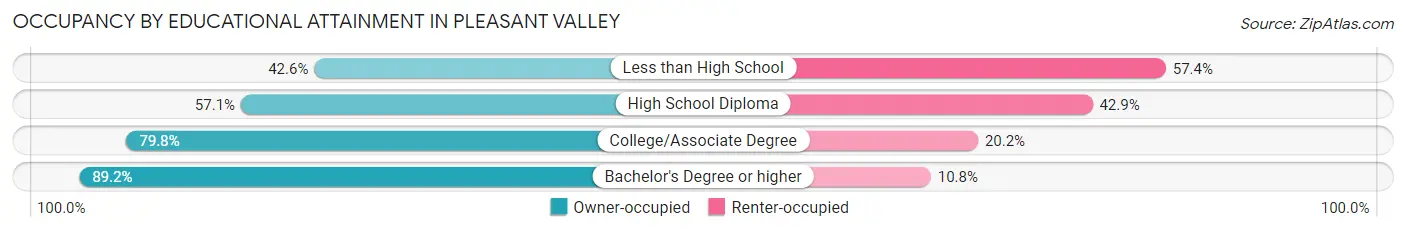
| Household Size | Owner-occupied | Renter-occupied |
| Less than High School | 66 (42.6%) | 89 (57.4%) |
| High School Diploma | 233 (57.1%) | 175 (42.9%) |
| College/Associate Degree | 261 (79.8%) | 66 (20.2%) |
| Bachelor's Degree or higher | 486 (89.2%) | 59 (10.8%) |
Occupancy by Age of Householder in Pleasant Valley
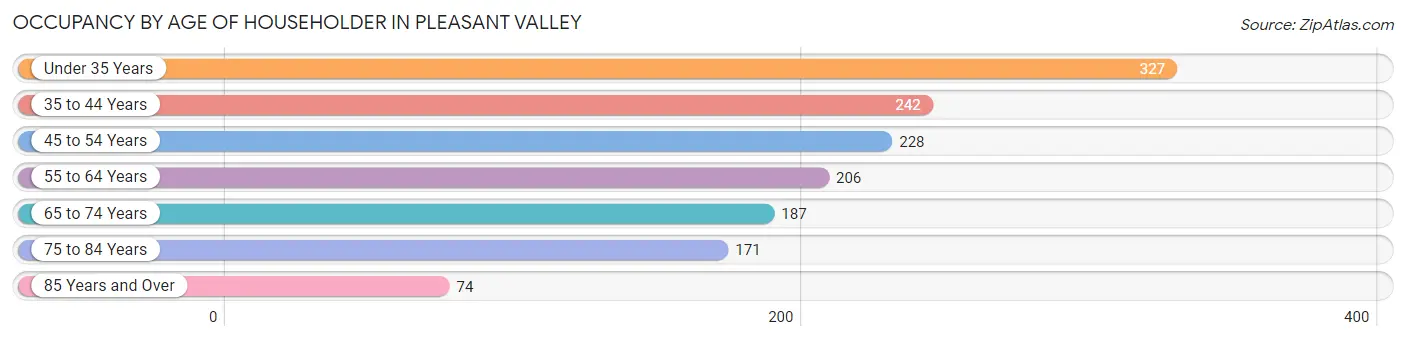
| Age Bracket | # Households | % Households |
| Under 35 Years | 327 | 22.8% |
| 35 to 44 Years | 242 | 16.9% |
| 45 to 54 Years | 228 | 15.9% |
| 55 to 64 Years | 206 | 14.4% |
| 65 to 74 Years | 187 | 13.0% |
| 75 to 84 Years | 171 | 11.9% |
| 85 Years and Over | 74 | 5.2% |
| Total | 1,435 | 100.0% |
Housing Finances in Pleasant Valley
Median Income by Occupancy in Pleasant Valley
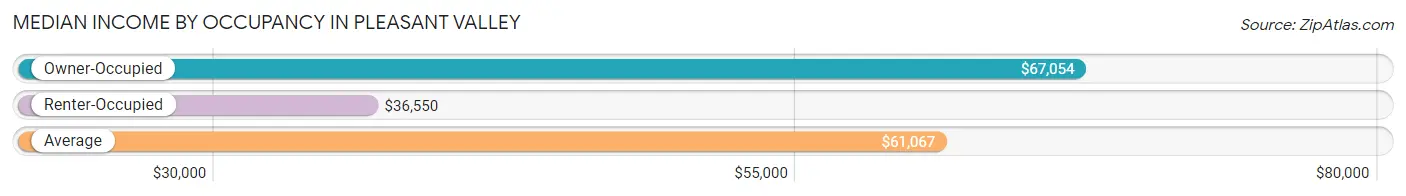
| Occupancy Type | # Households | Median Income |
| Owner-Occupied | 1,046 (72.9%) | $67,054 |
| Renter-Occupied | 389 (27.1%) | $36,550 |
| Average | 1,435 (100.0%) | $61,067 |
Occupancy by Householder Income Bracket in Pleasant Valley
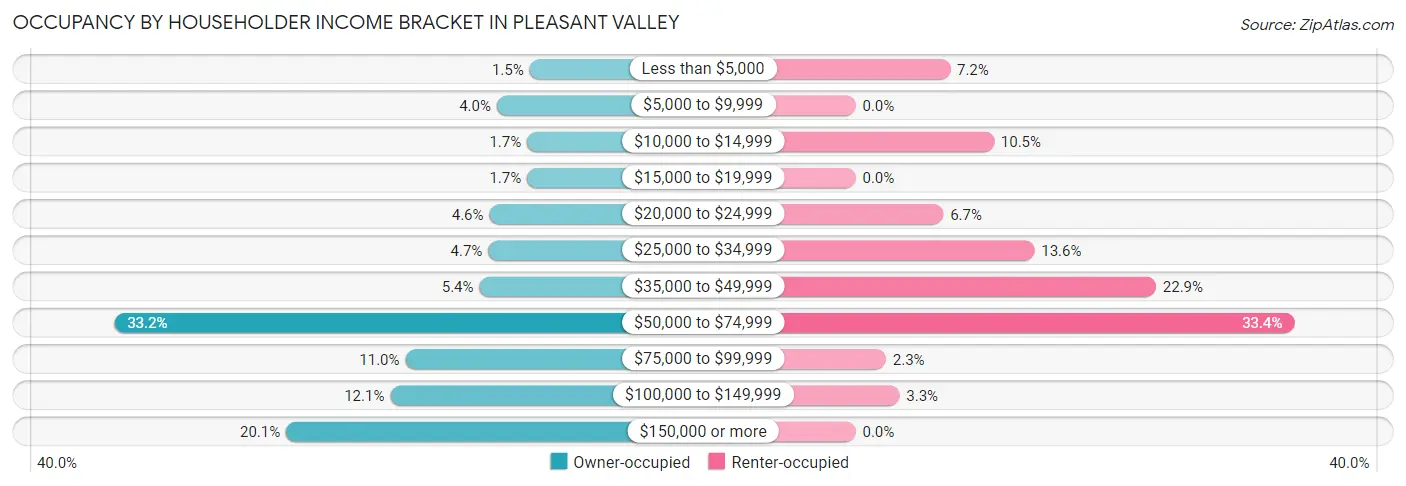
| Income Bracket | Owner-occupied | Renter-occupied |
| Less than $5,000 | 16 (1.5%) | 28 (7.2%) |
| $5,000 to $9,999 | 42 (4.0%) | 0 (0.0%) |
| $10,000 to $14,999 | 18 (1.7%) | 41 (10.5%) |
| $15,000 to $19,999 | 18 (1.7%) | 0 (0.0%) |
| $20,000 to $24,999 | 48 (4.6%) | 26 (6.7%) |
| $25,000 to $34,999 | 49 (4.7%) | 53 (13.6%) |
| $35,000 to $49,999 | 56 (5.3%) | 89 (22.9%) |
| $50,000 to $74,999 | 347 (33.2%) | 130 (33.4%) |
| $75,000 to $99,999 | 115 (11.0%) | 9 (2.3%) |
| $100,000 to $149,999 | 127 (12.1%) | 13 (3.3%) |
| $150,000 or more | 210 (20.1%) | 0 (0.0%) |
| Total | 1,046 (100.0%) | 389 (100.0%) |
Monthly Housing Cost Tiers in Pleasant Valley
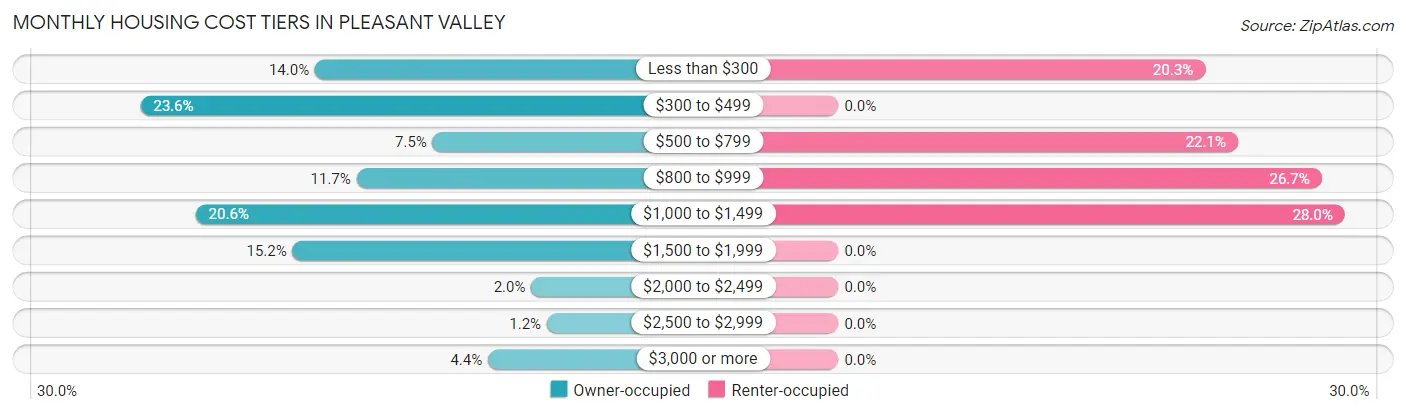
| Monthly Cost | Owner-occupied | Renter-occupied |
| Less than $300 | 146 (14.0%) | 79 (20.3%) |
| $300 to $499 | 247 (23.6%) | 0 (0.0%) |
| $500 to $799 | 78 (7.5%) | 86 (22.1%) |
| $800 to $999 | 122 (11.7%) | 104 (26.7%) |
| $1,000 to $1,499 | 215 (20.5%) | 109 (28.0%) |
| $1,500 to $1,999 | 159 (15.2%) | 0 (0.0%) |
| $2,000 to $2,499 | 21 (2.0%) | 0 (0.0%) |
| $2,500 to $2,999 | 12 (1.1%) | 0 (0.0%) |
| $3,000 or more | 46 (4.4%) | 0 (0.0%) |
| Total | 1,046 (100.0%) | 389 (100.0%) |
Physical Housing Characteristics in Pleasant Valley
Housing Structures in Pleasant Valley
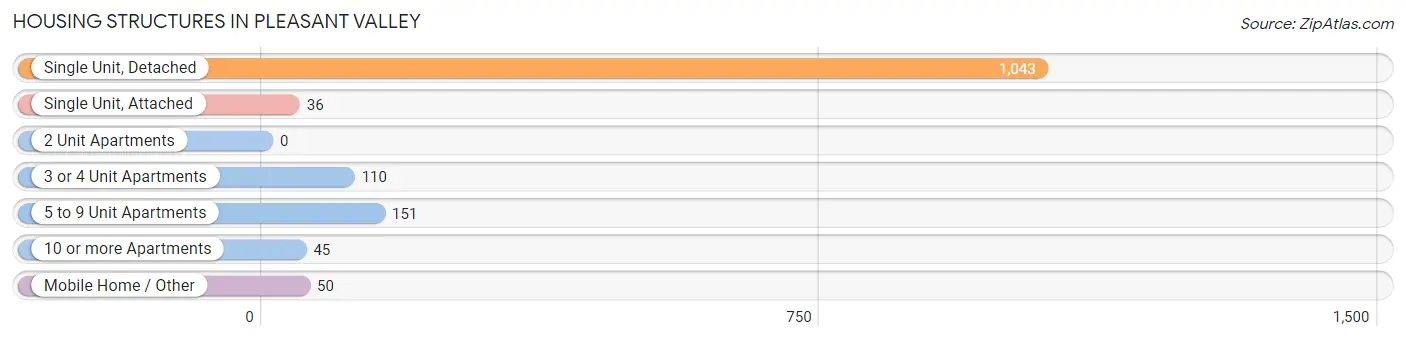
| Structure Type | # Housing Units | % Housing Units |
| Single Unit, Detached | 1,043 | 72.7% |
| Single Unit, Attached | 36 | 2.5% |
| 2 Unit Apartments | 0 | 0.0% |
| 3 or 4 Unit Apartments | 110 | 7.7% |
| 5 to 9 Unit Apartments | 151 | 10.5% |
| 10 or more Apartments | 45 | 3.1% |
| Mobile Home / Other | 50 | 3.5% |
| Total | 1,435 | 100.0% |
Housing Structures by Occupancy in Pleasant Valley
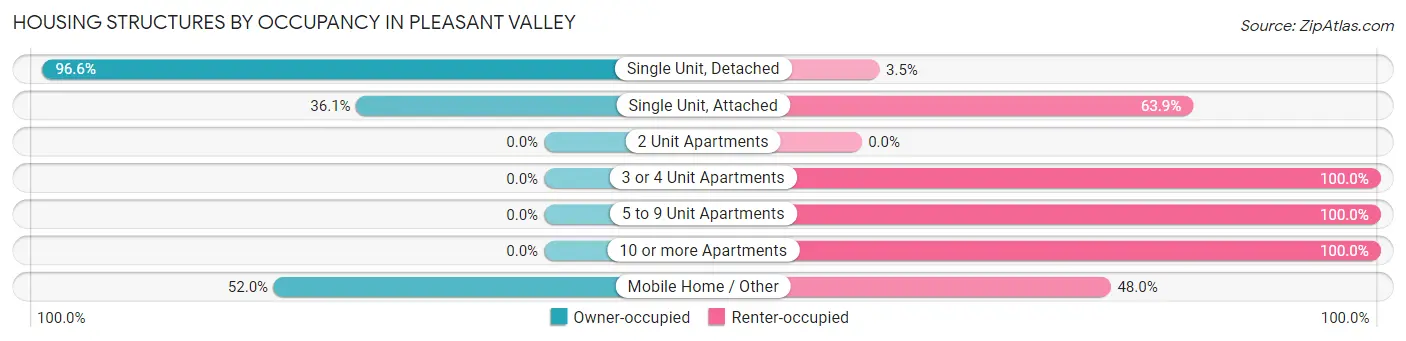
| Structure Type | Owner-occupied | Renter-occupied |
| Single Unit, Detached | 1,007 (96.6%) | 36 (3.5%) |
| Single Unit, Attached | 13 (36.1%) | 23 (63.9%) |
| 2 Unit Apartments | 0 (0.0%) | 0 (0.0%) |
| 3 or 4 Unit Apartments | 0 (0.0%) | 110 (100.0%) |
| 5 to 9 Unit Apartments | 0 (0.0%) | 151 (100.0%) |
| 10 or more Apartments | 0 (0.0%) | 45 (100.0%) |
| Mobile Home / Other | 26 (52.0%) | 24 (48.0%) |
| Total | 1,046 (72.9%) | 389 (27.1%) |
Housing Structures by Number of Rooms in Pleasant Valley
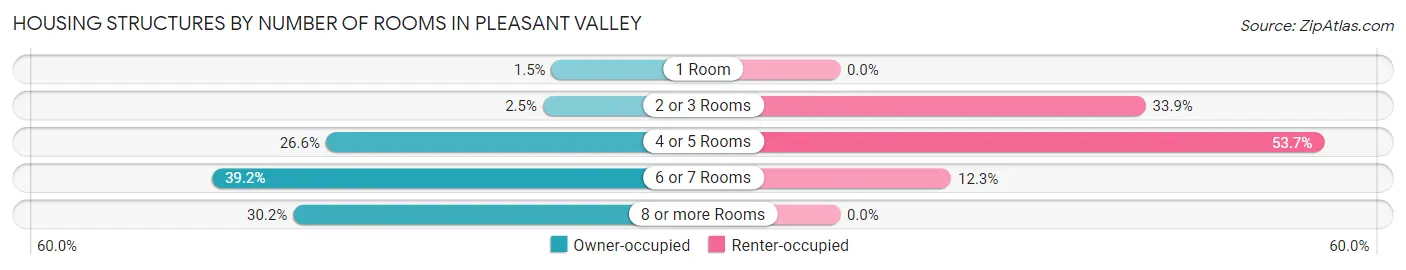
| Number of Rooms | Owner-occupied | Renter-occupied |
| 1 Room | 16 (1.5%) | 0 (0.0%) |
| 2 or 3 Rooms | 26 (2.5%) | 132 (33.9%) |
| 4 or 5 Rooms | 278 (26.6%) | 209 (53.7%) |
| 6 or 7 Rooms | 410 (39.2%) | 48 (12.3%) |
| 8 or more Rooms | 316 (30.2%) | 0 (0.0%) |
| Total | 1,046 (100.0%) | 389 (100.0%) |
Housing Structure by Heating Type in Pleasant Valley
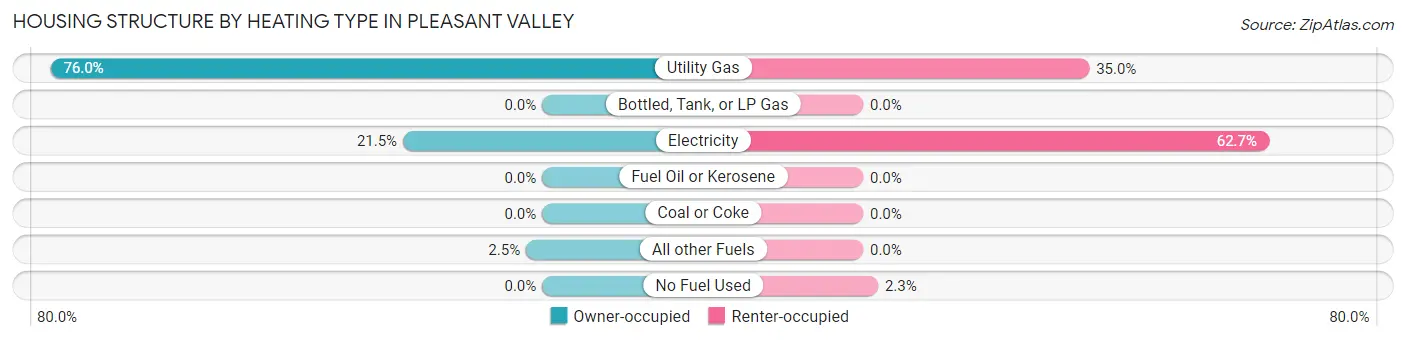
| Heating Type | Owner-occupied | Renter-occupied |
| Utility Gas | 795 (76.0%) | 136 (35.0%) |
| Bottled, Tank, or LP Gas | 0 (0.0%) | 0 (0.0%) |
| Electricity | 225 (21.5%) | 244 (62.7%) |
| Fuel Oil or Kerosene | 0 (0.0%) | 0 (0.0%) |
| Coal or Coke | 0 (0.0%) | 0 (0.0%) |
| All other Fuels | 26 (2.5%) | 0 (0.0%) |
| No Fuel Used | 0 (0.0%) | 9 (2.3%) |
| Total | 1,046 (100.0%) | 389 (100.0%) |
Household Vehicle Usage in Pleasant Valley
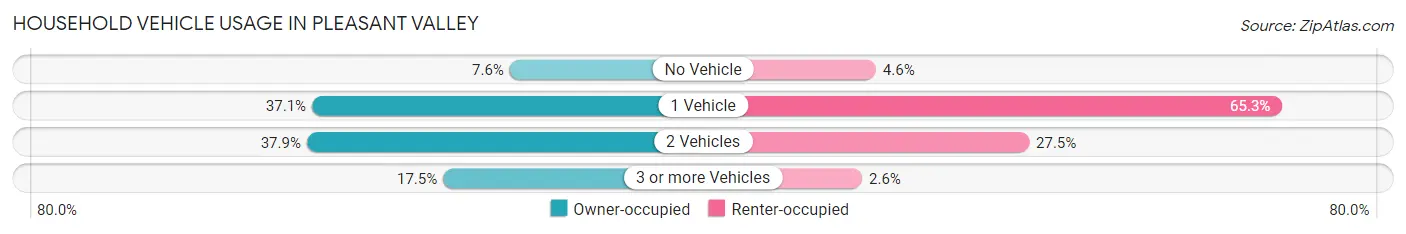
| Vehicles per Household | Owner-occupied | Renter-occupied |
| No Vehicle | 79 (7.5%) | 18 (4.6%) |
| 1 Vehicle | 388 (37.1%) | 254 (65.3%) |
| 2 Vehicles | 396 (37.9%) | 107 (27.5%) |
| 3 or more Vehicles | 183 (17.5%) | 10 (2.6%) |
| Total | 1,046 (100.0%) | 389 (100.0%) |
Real Estate & Mortgages in Pleasant Valley
Real Estate and Mortgage Overview in Pleasant Valley
| Characteristic | Without Mortgage | With Mortgage |
| Housing Units | 451 | 595 |
| Median Property Value | $167,000 | $206,000 |
| Median Household Income | $60,402 | $147 |
| Monthly Housing Costs | $372 | $46 |
| Real Estate Taxes | $788 | $43 |
Property Value by Mortgage Status in Pleasant Valley
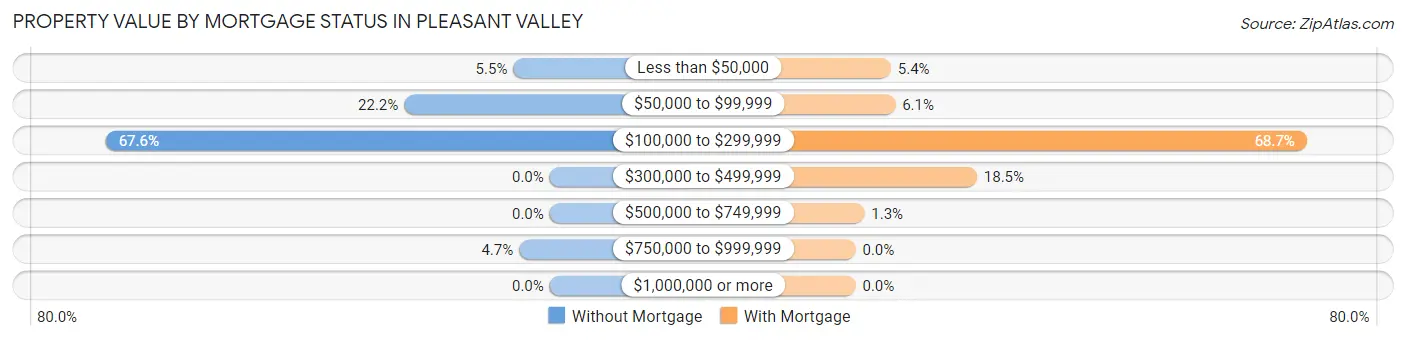
| Property Value | Without Mortgage | With Mortgage |
| Less than $50,000 | 25 (5.5%) | 32 (5.4%) |
| $50,000 to $99,999 | 100 (22.2%) | 36 (6.0%) |
| $100,000 to $299,999 | 305 (67.6%) | 409 (68.7%) |
| $300,000 to $499,999 | 0 (0.0%) | 110 (18.5%) |
| $500,000 to $749,999 | 0 (0.0%) | 8 (1.3%) |
| $750,000 to $999,999 | 21 (4.7%) | 0 (0.0%) |
| $1,000,000 or more | 0 (0.0%) | 0 (0.0%) |
| Total | 451 (100.0%) | 595 (100.0%) |
Household Income by Mortgage Status in Pleasant Valley
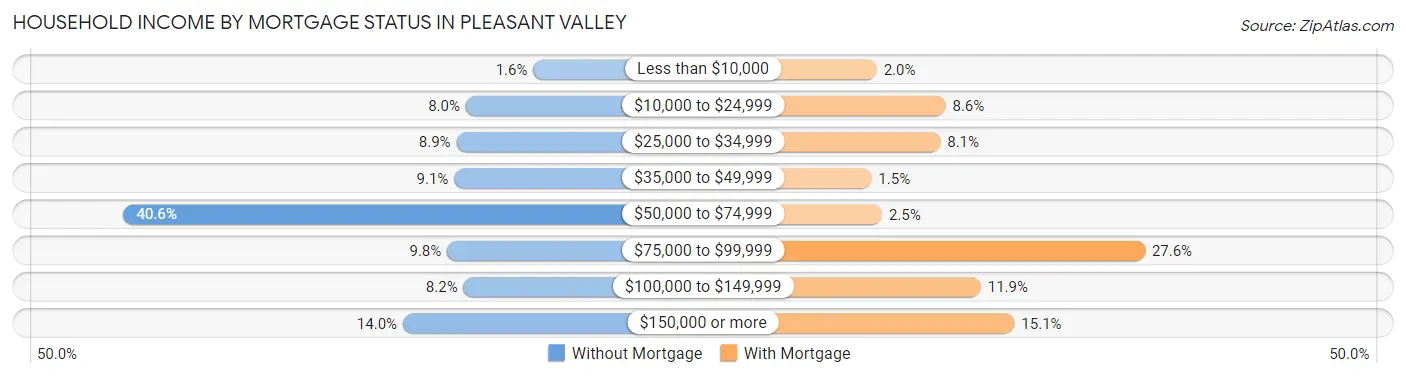
| Household Income | Without Mortgage | With Mortgage |
| Less than $10,000 | 7 (1.5%) | 12 (2.0%) |
| $10,000 to $24,999 | 36 (8.0%) | 51 (8.6%) |
| $25,000 to $34,999 | 40 (8.9%) | 48 (8.1%) |
| $35,000 to $49,999 | 41 (9.1%) | 9 (1.5%) |
| $50,000 to $74,999 | 183 (40.6%) | 15 (2.5%) |
| $75,000 to $99,999 | 44 (9.8%) | 164 (27.6%) |
| $100,000 to $149,999 | 37 (8.2%) | 71 (11.9%) |
| $150,000 or more | 63 (14.0%) | 90 (15.1%) |
| Total | 451 (100.0%) | 595 (100.0%) |
Property Value to Household Income Ratio in Pleasant Valley
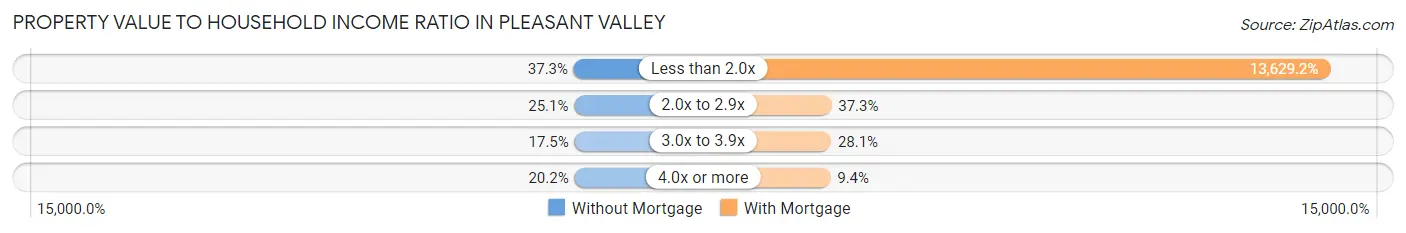
| Value-to-Income Ratio | Without Mortgage | With Mortgage |
| Less than 2.0x | 168 (37.2%) | 81,094 (13,629.2%) |
| 2.0x to 2.9x | 113 (25.1%) | 222 (37.3%) |
| 3.0x to 3.9x | 79 (17.5%) | 167 (28.1%) |
| 4.0x or more | 91 (20.2%) | 56 (9.4%) |
| Total | 451 (100.0%) | 595 (100.0%) |
Real Estate Taxes by Mortgage Status in Pleasant Valley
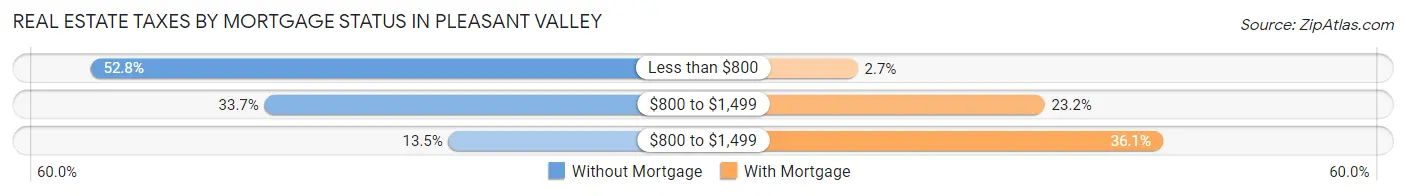
| Property Taxes | Without Mortgage | With Mortgage |
| Less than $800 | 238 (52.8%) | 16 (2.7%) |
| $800 to $1,499 | 152 (33.7%) | 138 (23.2%) |
| $800 to $1,499 | 61 (13.5%) | 215 (36.1%) |
| Total | 451 (100.0%) | 595 (100.0%) |
Health & Disability in Pleasant Valley
Health Insurance Coverage by Age in Pleasant Valley
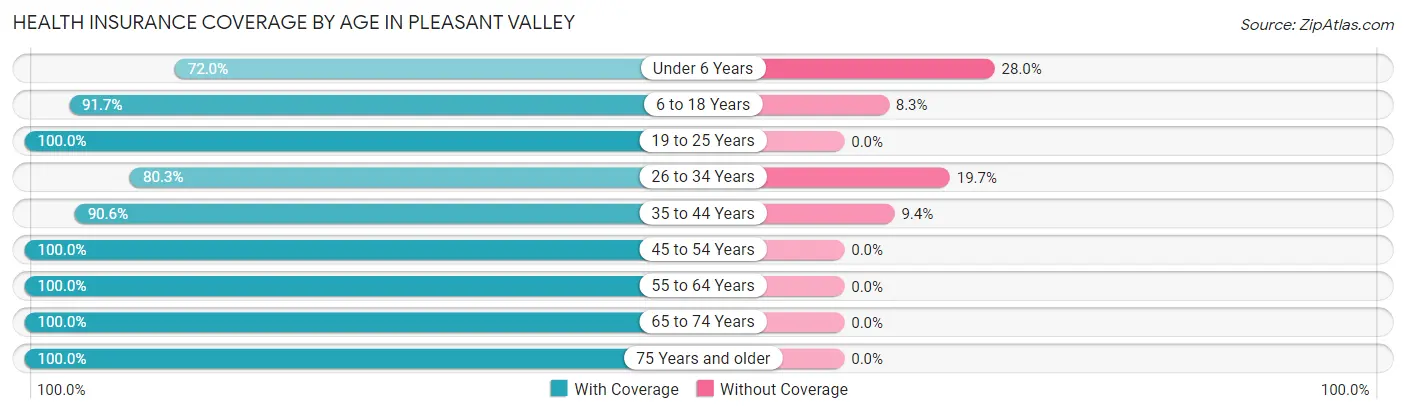
| Age Bracket | With Coverage | Without Coverage |
| Under 6 Years | 190 (72.0%) | 74 (28.0%) |
| 6 to 18 Years | 553 (91.7%) | 50 (8.3%) |
| 19 to 25 Years | 377 (100.0%) | 0 (0.0%) |
| 26 to 34 Years | 249 (80.3%) | 61 (19.7%) |
| 35 to 44 Years | 368 (90.6%) | 38 (9.4%) |
| 45 to 54 Years | 462 (100.0%) | 0 (0.0%) |
| 55 to 64 Years | 364 (100.0%) | 0 (0.0%) |
| 65 to 74 Years | 262 (100.0%) | 0 (0.0%) |
| 75 Years and older | 391 (100.0%) | 0 (0.0%) |
| Total | 3,216 (93.5%) | 223 (6.5%) |
Health Insurance Coverage by Citizenship Status in Pleasant Valley
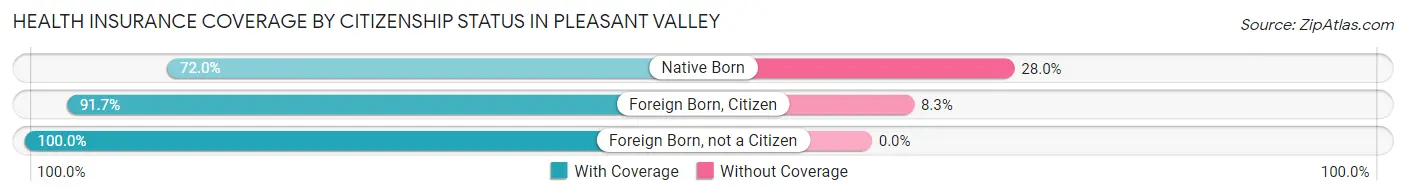
| Citizenship Status | With Coverage | Without Coverage |
| Native Born | 190 (72.0%) | 74 (28.0%) |
| Foreign Born, Citizen | 553 (91.7%) | 50 (8.3%) |
| Foreign Born, not a Citizen | 377 (100.0%) | 0 (0.0%) |
Health Insurance Coverage by Household Income in Pleasant Valley
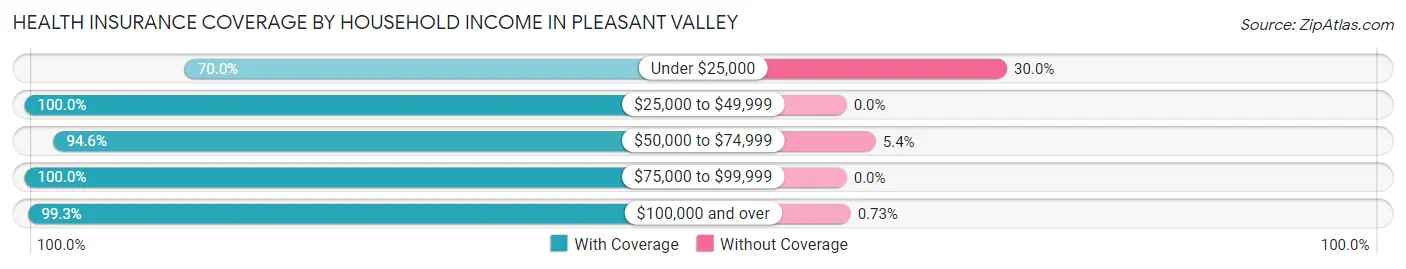
| Household Income | With Coverage | Without Coverage |
| Under $25,000 | 368 (70.0%) | 158 (30.0%) |
| $25,000 to $49,999 | 454 (100.0%) | 0 (0.0%) |
| $50,000 to $74,999 | 990 (94.6%) | 57 (5.4%) |
| $75,000 to $99,999 | 308 (100.0%) | 0 (0.0%) |
| $100,000 and over | 1,091 (99.3%) | 8 (0.7%) |
Public vs Private Health Insurance Coverage by Age in Pleasant Valley
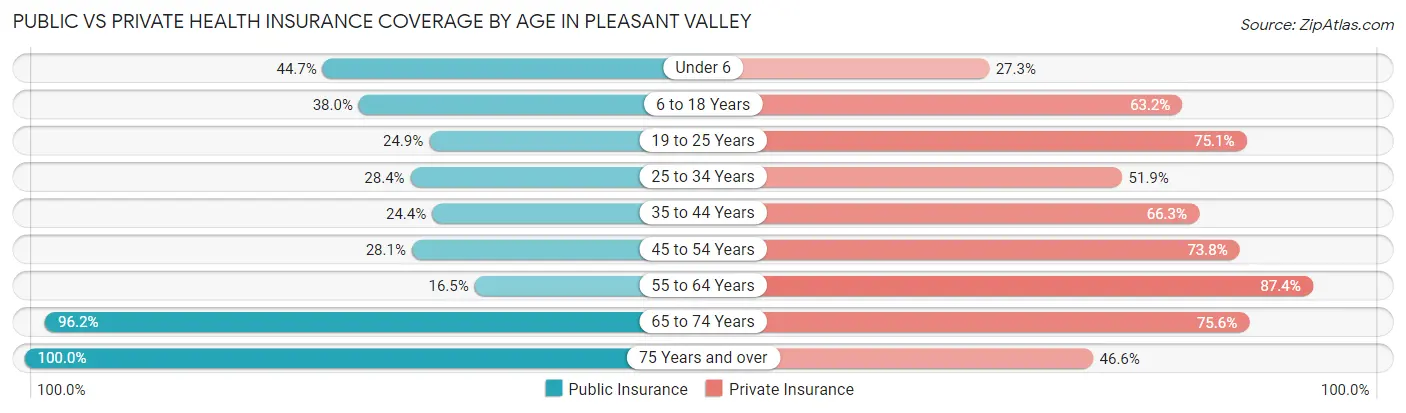
| Age Bracket | Public Insurance | Private Insurance |
| Under 6 | 118 (44.7%) | 72 (27.3%) |
| 6 to 18 Years | 229 (38.0%) | 381 (63.2%) |
| 19 to 25 Years | 94 (24.9%) | 283 (75.1%) |
| 25 to 34 Years | 88 (28.4%) | 161 (51.9%) |
| 35 to 44 Years | 99 (24.4%) | 269 (66.3%) |
| 45 to 54 Years | 130 (28.1%) | 341 (73.8%) |
| 55 to 64 Years | 60 (16.5%) | 318 (87.4%) |
| 65 to 74 Years | 252 (96.2%) | 198 (75.6%) |
| 75 Years and over | 391 (100.0%) | 182 (46.6%) |
| Total | 1,461 (42.5%) | 2,205 (64.1%) |
Disability Status by Sex by Age in Pleasant Valley
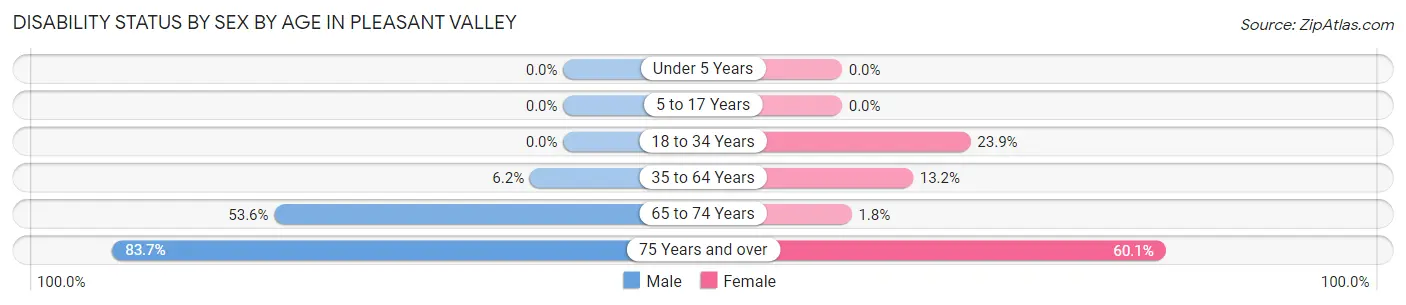
| Age Bracket | Male | Female |
| Under 5 Years | 0 (0.0%) | 0 (0.0%) |
| 5 to 17 Years | 0 (0.0%) | 0 (0.0%) |
| 18 to 34 Years | 0 (0.0%) | 90 (23.9%) |
| 35 to 64 Years | 34 (6.2%) | 90 (13.2%) |
| 65 to 74 Years | 81 (53.6%) | 2 (1.8%) |
| 75 Years and over | 149 (83.7%) | 128 (60.1%) |
Disability Class by Sex by Age in Pleasant Valley
Disability Class: Hearing Difficulty
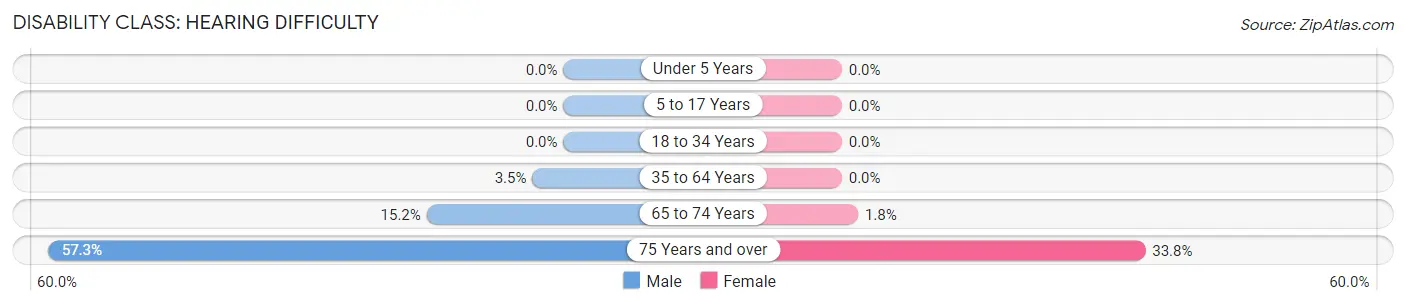
| Age Bracket | Male | Female |
| Under 5 Years | 0 (0.0%) | 0 (0.0%) |
| 5 to 17 Years | 0 (0.0%) | 0 (0.0%) |
| 18 to 34 Years | 0 (0.0%) | 0 (0.0%) |
| 35 to 64 Years | 19 (3.5%) | 0 (0.0%) |
| 65 to 74 Years | 23 (15.2%) | 2 (1.8%) |
| 75 Years and over | 102 (57.3%) | 72 (33.8%) |
Disability Class: Vision Difficulty
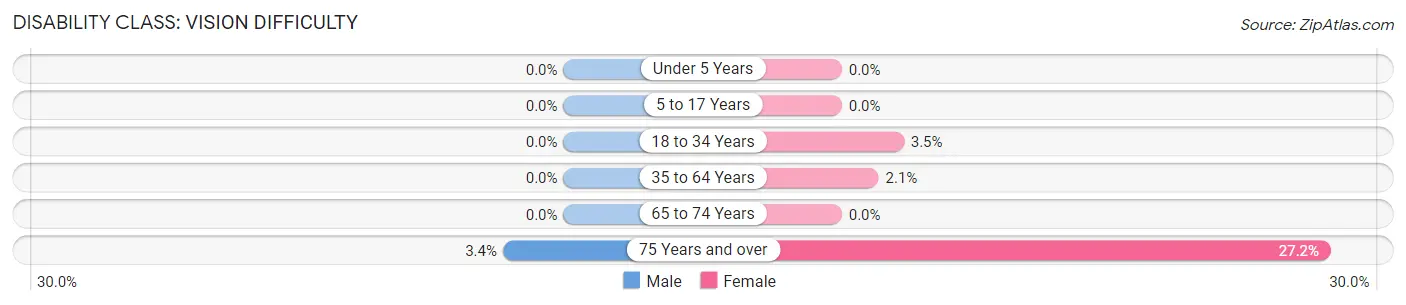
| Age Bracket | Male | Female |
| Under 5 Years | 0 (0.0%) | 0 (0.0%) |
| 5 to 17 Years | 0 (0.0%) | 0 (0.0%) |
| 18 to 34 Years | 0 (0.0%) | 13 (3.5%) |
| 35 to 64 Years | 0 (0.0%) | 14 (2.1%) |
| 65 to 74 Years | 0 (0.0%) | 0 (0.0%) |
| 75 Years and over | 6 (3.4%) | 58 (27.2%) |
Disability Class: Cognitive Difficulty
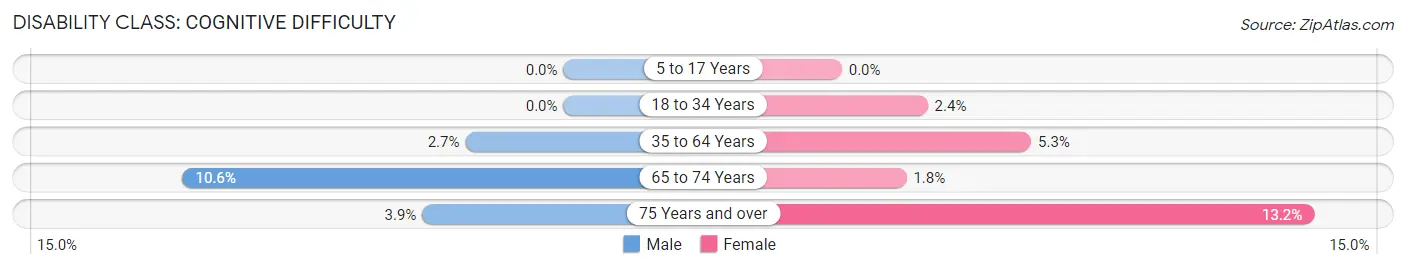
| Age Bracket | Male | Female |
| 5 to 17 Years | 0 (0.0%) | 0 (0.0%) |
| 18 to 34 Years | 0 (0.0%) | 9 (2.4%) |
| 35 to 64 Years | 15 (2.7%) | 36 (5.3%) |
| 65 to 74 Years | 16 (10.6%) | 2 (1.8%) |
| 75 Years and over | 7 (3.9%) | 28 (13.2%) |
Disability Class: Ambulatory Difficulty
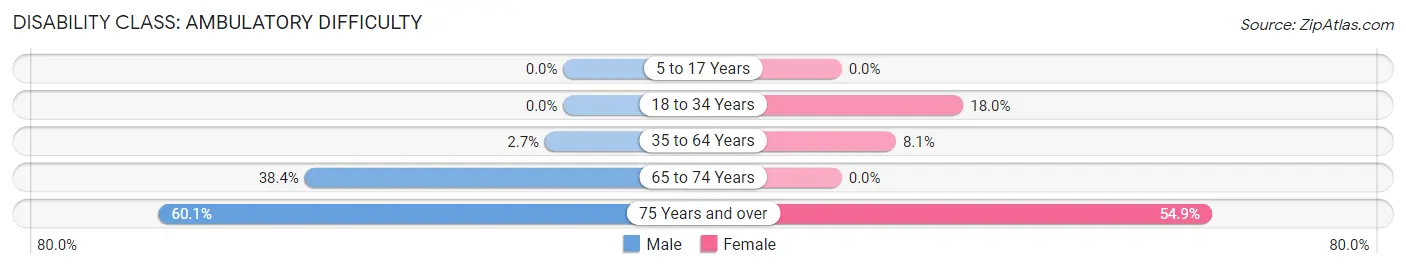
| Age Bracket | Male | Female |
| 5 to 17 Years | 0 (0.0%) | 0 (0.0%) |
| 18 to 34 Years | 0 (0.0%) | 68 (18.0%) |
| 35 to 64 Years | 15 (2.7%) | 55 (8.1%) |
| 65 to 74 Years | 58 (38.4%) | 0 (0.0%) |
| 75 Years and over | 107 (60.1%) | 117 (54.9%) |
Disability Class: Self-Care Difficulty
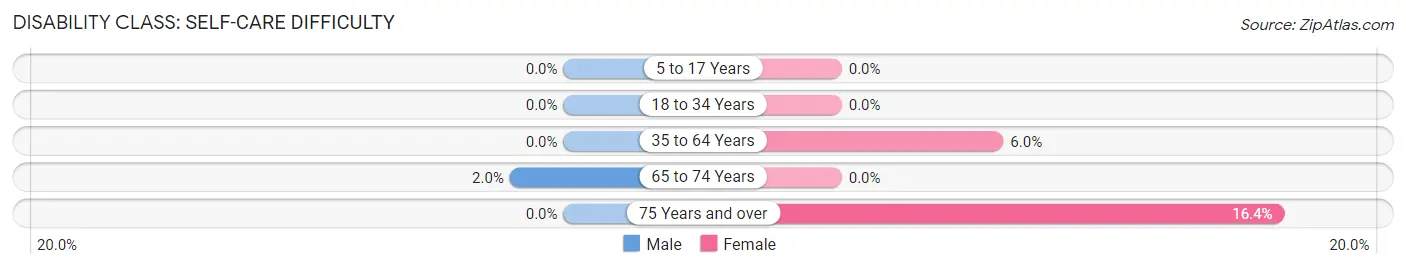
| Age Bracket | Male | Female |
| 5 to 17 Years | 0 (0.0%) | 0 (0.0%) |
| 18 to 34 Years | 0 (0.0%) | 0 (0.0%) |
| 35 to 64 Years | 0 (0.0%) | 41 (6.0%) |
| 65 to 74 Years | 3 (2.0%) | 0 (0.0%) |
| 75 Years and over | 0 (0.0%) | 35 (16.4%) |
Technology Access in Pleasant Valley
Computing Device Access in Pleasant Valley
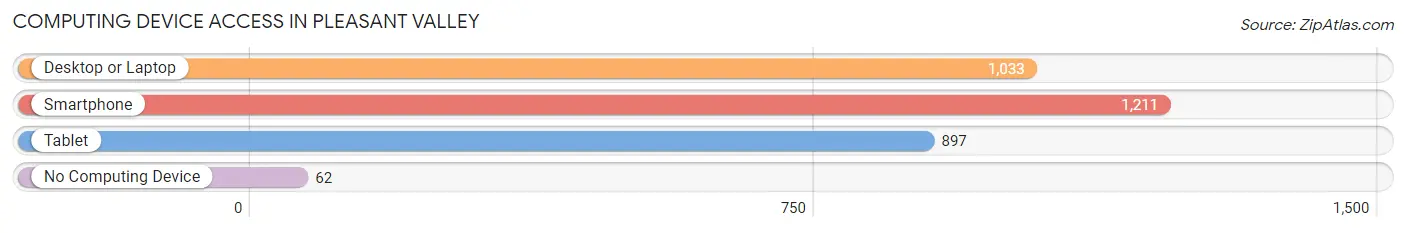
| Device Type | # Households | % Households |
| Desktop or Laptop | 1,033 | 72.0% |
| Smartphone | 1,211 | 84.4% |
| Tablet | 897 | 62.5% |
| No Computing Device | 62 | 4.3% |
| Total | 1,435 | 100.0% |
Internet Access in Pleasant Valley
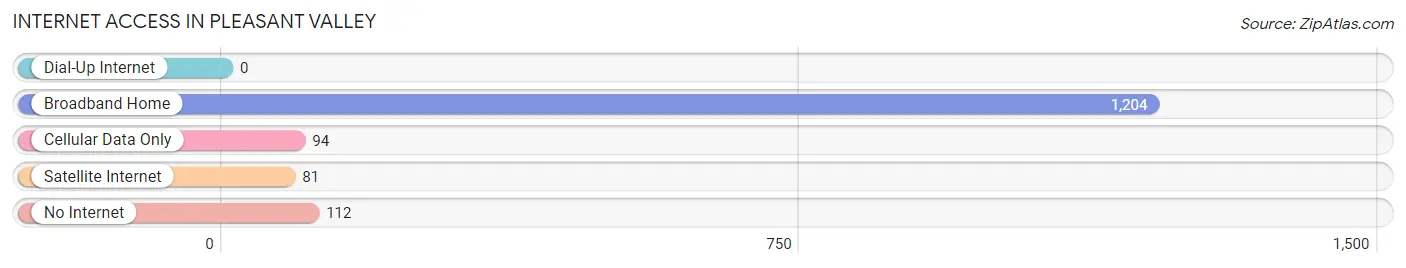
| Internet Type | # Households | % Households |
| Dial-Up Internet | 0 | 0.0% |
| Broadband Home | 1,204 | 83.9% |
| Cellular Data Only | 94 | 6.6% |
| Satellite Internet | 81 | 5.6% |
| No Internet | 112 | 7.8% |
| Total | 1,435 | 100.0% |
Pleasant Valley Summary
Pleasant Valley, West Virginia is a small unincorporated community located in the eastern panhandle of the state. It is situated in Berkeley County, approximately five miles south of Martinsburg and two miles east of the Potomac River. The community is bordered by the towns of Hedgesville to the north, Falling Waters to the east, and Gerrardstown to the south.
History
The area that is now Pleasant Valley was first settled in the late 1700s by German immigrants. The community was originally known as “Germantown” and was home to a number of small farms. In the early 1800s, the area was renamed “Pleasant Valley” and the community began to grow. The first post office was established in 1845 and the first school was built in 1848.
In the late 1800s, the area experienced a period of rapid growth. The Baltimore and Ohio Railroad built a line through the area in 1872, connecting Pleasant Valley to the larger cities of Martinsburg and Winchester. This allowed for the easy transportation of goods and people, and the area began to develop into a small town.
In the early 1900s, the town experienced a period of decline. The railroad line was abandoned in the 1920s and the population began to decline. The town was further impacted by the Great Depression and World War II.
Geography
Pleasant Valley is located in the eastern panhandle of West Virginia. It is situated in Berkeley County, approximately five miles south of Martinsburg and two miles east of the Potomac River. The community is bordered by the towns of Hedgesville to the north, Falling Waters to the east, and Gerrardstown to the south.
The area is characterized by rolling hills and valleys, with the highest point in the area being the summit of Pleasant Valley Mountain, which rises to an elevation of 1,845 feet. The area is home to a number of small streams, including the Opequon Creek, which flows through the town.
Economy
Pleasant Valley is a small, rural community with a population of approximately 1,000 people. The town is primarily a bedroom community, with most of its residents commuting to nearby cities for work. The town does not have any major industries or businesses, but there are a number of small businesses in the area, including a few restaurants, a grocery store, and a few small shops.
The town is also home to a number of farms, which produce a variety of crops, including corn, soybeans, and hay. The area is also home to a number of wineries, which produce a variety of wines.
Demographics
As of the 2010 census, the population of Pleasant Valley was 1,039. The racial makeup of the town was 94.3% White, 2.7% African American, 0.3% Native American, 0.3% Asian, 0.1% Pacific Islander, 0.7% from other races, and 1.6% from two or more races. Hispanic or Latino of any race were 1.7% of the population.
The median household income in the town was $45,000, and the median family income was $50,000. The per capita income for the town was $20,000. About 8.3% of families and 10.2% of the population were below the poverty line, including 14.3% of those under age 18 and 6.3% of those age 65 or over.
Conclusion
Pleasant Valley is a small, rural community located in the eastern panhandle of West Virginia. The area was first settled in the late 1700s and has a long history of farming and small businesses. The town is primarily a bedroom community, with most of its residents commuting to nearby cities for work. The population of the town is approximately 1,000 people, with a median household income of $45,000. The town is home to a number of small businesses, farms, and wineries.
Common Questions
What is the Total Population of Pleasant Valley?
Total Population of Pleasant Valley is 3,480.
What is the Total Male Population of Pleasant Valley?
Total Male Population of Pleasant Valley is 1,533.
What is the Total Female Population of Pleasant Valley?
Total Female Population of Pleasant Valley is 1,947.
What is the Ratio of Males per 100 Females in Pleasant Valley?
There are 78.74 Males per 100 Females in Pleasant Valley.
What is the Ratio of Females per 100 Males in Pleasant Valley?
There are 127.01 Females per 100 Males in Pleasant Valley.
What is the Median Population Age in Pleasant Valley?
Median Population Age in Pleasant Valley is 38.7 Years.
What is the Average Family Size in Pleasant Valley
Average Family Size in Pleasant Valley is 2.9 People.
What is the Average Household Size in Pleasant Valley
Average Household Size in Pleasant Valley is 2.4 People.
What is Per Capita Income in Pleasant Valley?
Per Capita income in Pleasant Valley is $35,158.
What is the Median Family Income in Pleasant Valley?
Median Family Income in Pleasant Valley is $63,878.
What is the Median Household income in Pleasant Valley?
Median Household Income in Pleasant Valley is $61,067.
What is Income or Wage Gap in Pleasant Valley?
Income or Wage Gap in Pleasant Valley is 1.3%.
Women in Pleasant Valley earn 98.7 cents for every dollar earned by a man.
What is Inequality or Gini Index in Pleasant Valley?
Inequality or Gini Index in Pleasant Valley is 0.45.
How Large is the Labor Force in Pleasant Valley?
There are 1,559 People in the Labor Forcein in Pleasant Valley.
What is the Percentage of People in the Labor Force in Pleasant Valley?
58.4% of People are in the Labor Force in Pleasant Valley.
What is the Unemployment Rate in Pleasant Valley?
Unemployment Rate in Pleasant Valley is 1.6%.