Clearview, WV
Clearview Map
Clearview Overview
592
TOTAL POPULATION
305
MALE POPULATION
287
FEMALE POPULATION
106.27
MALES / 100 FEMALES
94.10
FEMALES / 100 MALES
39.4
MEDIAN AGE
3.1
AVG FAMILY SIZE
2.5
AVG HOUSEHOLD SIZE
$39,252
PER CAPITA INCOME
$101,250
AVG FAMILY INCOME
$79,688
AVG HOUSEHOLD INCOME
45.8%
WAGE / INCOME GAP [ % ]
54.2¢/ $1
WAGE / INCOME GAP [ $ ]
0.42
INEQUALITY / GINI INDEX
307
LABOR FORCE [ PEOPLE ]
65.2%
PERCENT IN LABOR FORCE
2.3%
UNEMPLOYMENT RATE
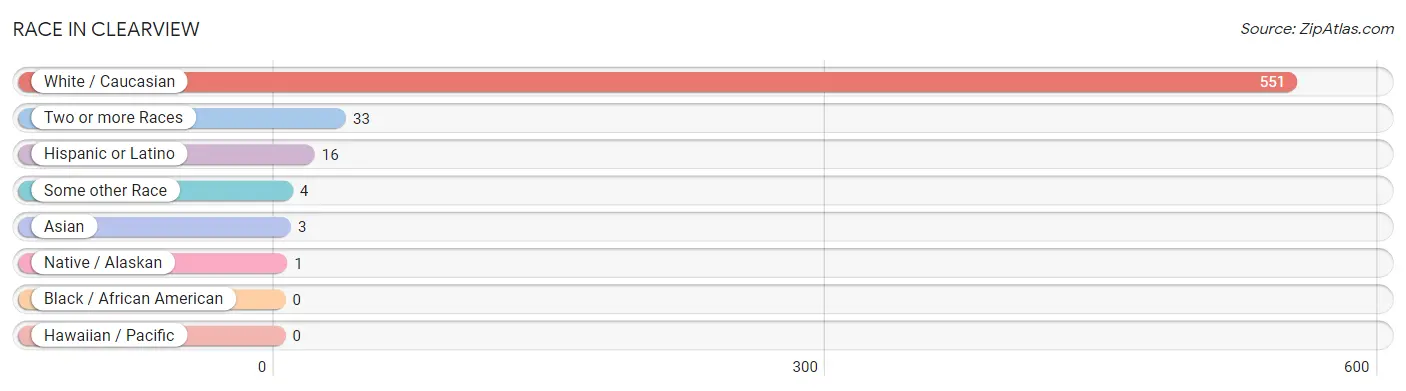
Race in Clearview
The most populous races in Clearview are White / Caucasian (551 | 93.1%), Two or more Races (33 | 5.6%), and Hispanic or Latino (16 | 2.7%).
| Race | # Population | % Population |
| Asian | 3 | 0.5% |
| Black / African American | 0 | 0.0% |
| Hawaiian / Pacific | 0 | 0.0% |
| Hispanic or Latino | 16 | 2.7% |
| Native / Alaskan | 1 | 0.2% |
| White / Caucasian | 551 | 93.1% |
| Two or more Races | 33 | 5.6% |
| Some other Race | 4 | 0.7% |
| Total | 592 | 100.0% |
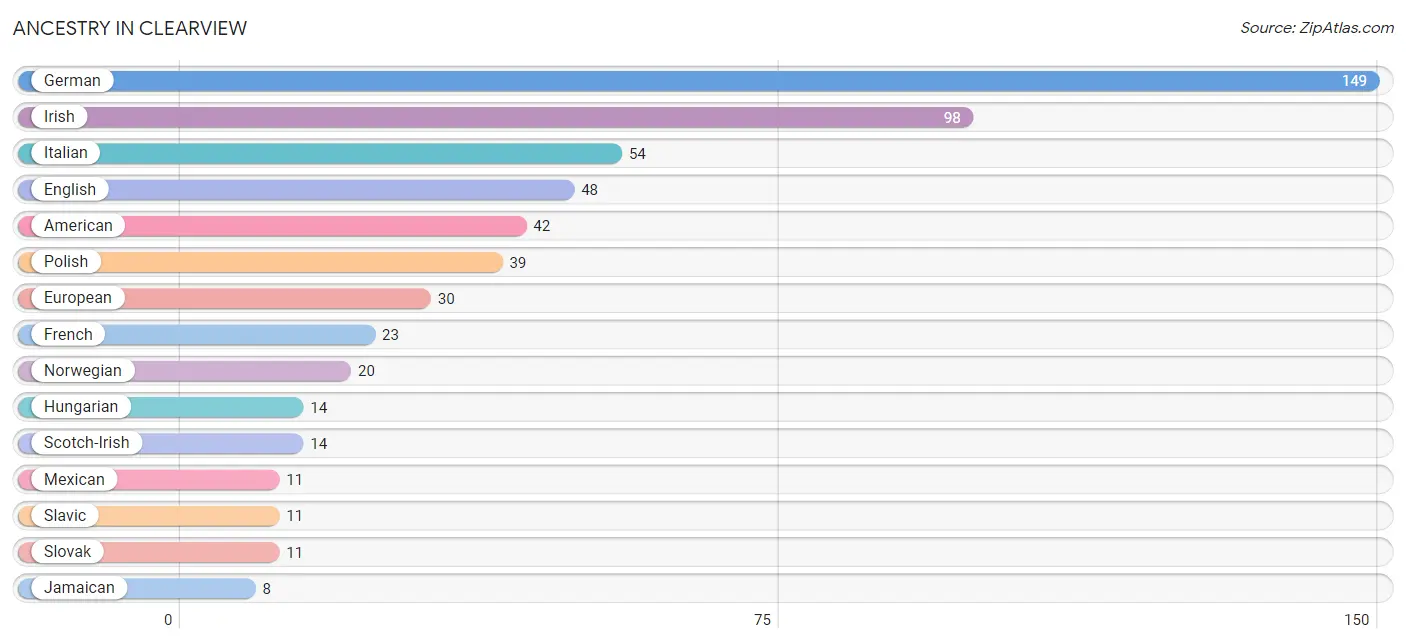
Ancestry in Clearview
The most populous ancestries reported in Clearview are German (149 | 25.2%), Irish (98 | 16.6%), Italian (54 | 9.1%), English (48 | 8.1%), and American (42 | 7.1%), together accounting for 66.0% of all Clearview residents.
| Ancestry | # Population | % Population |
| American | 42 | 7.1% |
| Arab | 2 | 0.3% |
| British | 5 | 0.8% |
| Cherokee | 1 | 0.2% |
| Czech | 5 | 0.8% |
| English | 48 | 8.1% |
| European | 30 | 5.1% |
| French | 23 | 3.9% |
| German | 149 | 25.2% |
| Greek | 3 | 0.5% |
| Guamanian / Chamorro | 4 | 0.7% |
| Hungarian | 14 | 2.4% |
| Irish | 98 | 16.6% |
| Italian | 54 | 9.1% |
| Jamaican | 8 | 1.3% |
| Korean | 7 | 1.2% |
| Lebanese | 2 | 0.3% |
| Mexican | 11 | 1.9% |
| Mexican American Indian | 1 | 0.2% |
| Norwegian | 20 | 3.4% |
| Polish | 39 | 6.6% |
| Puerto Rican | 2 | 0.3% |
| Russian | 5 | 0.8% |
| Scotch-Irish | 14 | 2.4% |
| Scottish | 2 | 0.3% |
| Slavic | 11 | 1.9% |
| Slovak | 11 | 1.9% |
| Spanish | 3 | 0.5% |
| Ukrainian | 1 | 0.2% |
| Welsh | 1 | 0.2% | View All 30 Rows |
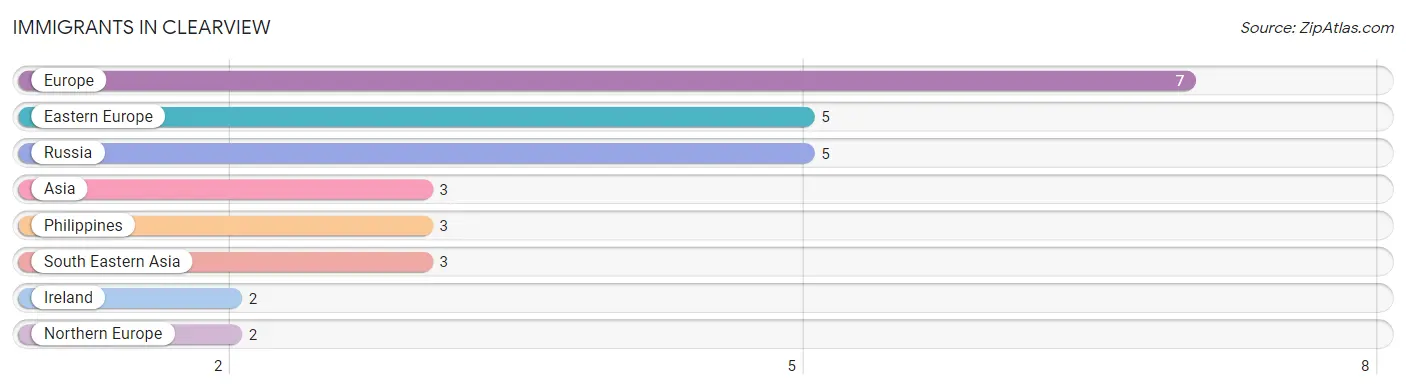
Immigrants in Clearview
The most numerous immigrant groups reported in Clearview came from Europe (7 | 1.2%), Eastern Europe (5 | 0.8%), Russia (5 | 0.8%), Asia (3 | 0.5%), and Philippines (3 | 0.5%), together accounting for 3.9% of all Clearview residents.
| Immigration Origin | # Population | % Population |
| Asia | 3 | 0.5% |
| Eastern Europe | 5 | 0.8% |
| Europe | 7 | 1.2% |
| Ireland | 2 | 0.3% |
| Northern Europe | 2 | 0.3% |
| Philippines | 3 | 0.5% |
| Russia | 5 | 0.8% |
| South Eastern Asia | 3 | 0.5% | View All 8 Rows |
Sex and Age in Clearview
Sex and Age in Clearview
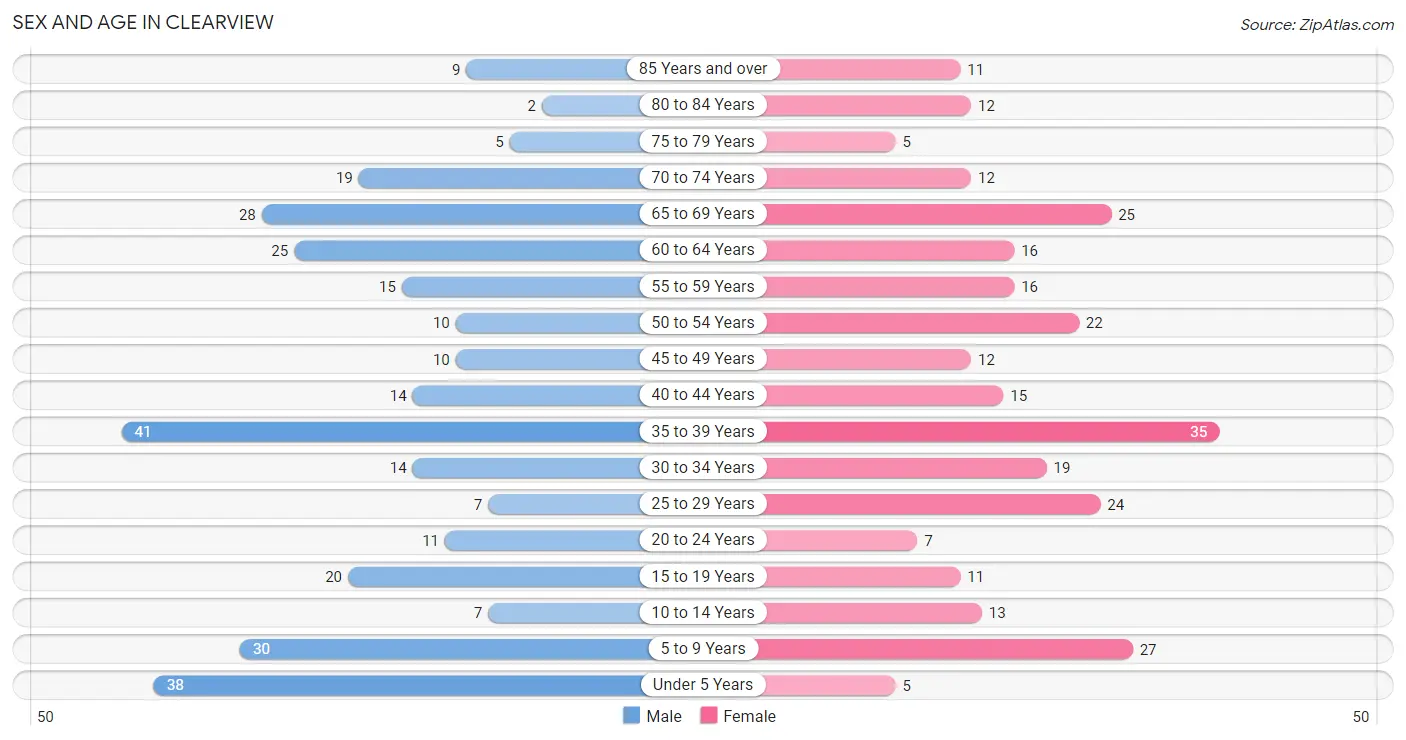
The most populous age groups in Clearview are 35 to 39 Years (41 | 13.4%) for men and 35 to 39 Years (35 | 12.2%) for women.
| Age Bracket | Male | Female |
| Under 5 Years | 38 (12.5%) | 5 (1.7%) |
| 5 to 9 Years | 30 (9.8%) | 27 (9.4%) |
| 10 to 14 Years | 7 (2.3%) | 13 (4.5%) |
| 15 to 19 Years | 20 (6.6%) | 11 (3.8%) |
| 20 to 24 Years | 11 (3.6%) | 7 (2.4%) |
| 25 to 29 Years | 7 (2.3%) | 24 (8.4%) |
| 30 to 34 Years | 14 (4.6%) | 19 (6.6%) |
| 35 to 39 Years | 41 (13.4%) | 35 (12.2%) |
| 40 to 44 Years | 14 (4.6%) | 15 (5.2%) |
| 45 to 49 Years | 10 (3.3%) | 12 (4.2%) |
| 50 to 54 Years | 10 (3.3%) | 22 (7.7%) |
| 55 to 59 Years | 15 (4.9%) | 16 (5.6%) |
| 60 to 64 Years | 25 (8.2%) | 16 (5.6%) |
| 65 to 69 Years | 28 (9.2%) | 25 (8.7%) |
| 70 to 74 Years | 19 (6.2%) | 12 (4.2%) |
| 75 to 79 Years | 5 (1.6%) | 5 (1.7%) |
| 80 to 84 Years | 2 (0.7%) | 12 (4.2%) |
| 85 Years and over | 9 (2.9%) | 11 (3.8%) |
| Total | 305 (100.0%) | 287 (100.0%) |
Families and Households in Clearview
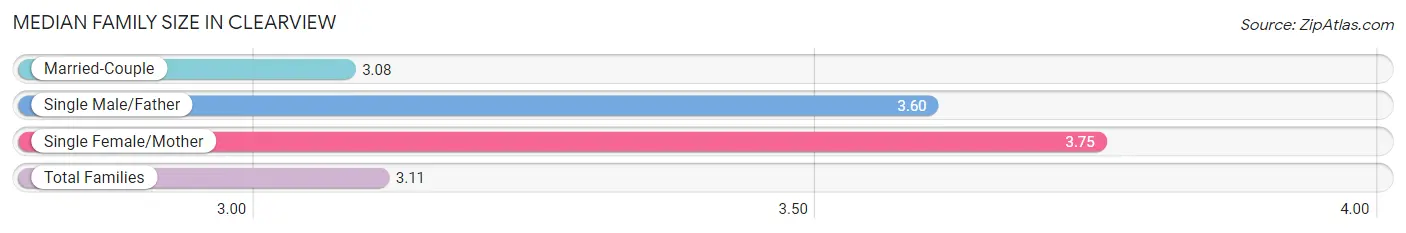
Median Family Size in Clearview
The median family size in Clearview is 3.11 persons per family, with single female/mother families (4 | 2.5%) accounting for the largest median family size of 3.75 persons per family. On the other hand, married-couple families (151 | 94.4%) represent the smallest median family size with 3.08 persons per family.
| Family Type | # Families | Family Size |
| Married-Couple | 151 (94.4%) | 3.08 |
| Single Male/Father | 5 (3.1%) | 3.60 |
| Single Female/Mother | 4 (2.5%) | 3.75 |
| Total Families | 160 (100.0%) | 3.11 |
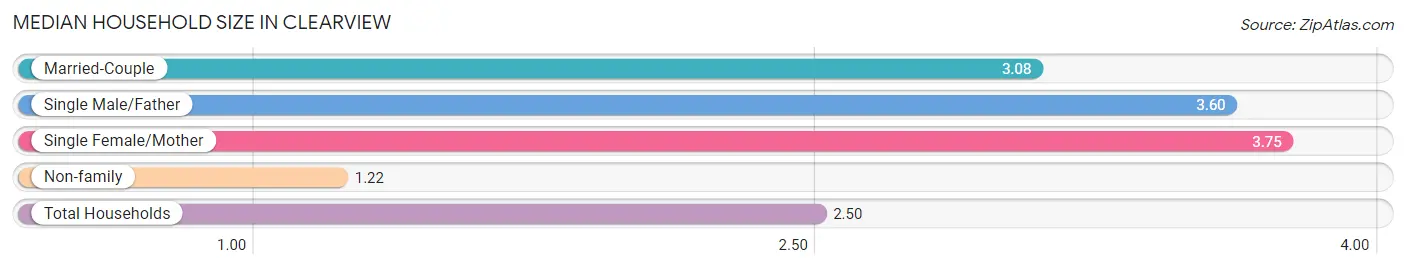
Median Household Size in Clearview
The median household size in Clearview is 2.50 persons per household, with single female/mother households (4 | 1.7%) accounting for the largest median household size of 3.75 persons per household. non-family households (77 | 32.5%) represent the smallest median household size with 1.22 persons per household.
| Household Type | # Households | Household Size |
| Married-Couple | 151 (63.7%) | 3.08 |
| Single Male/Father | 5 (2.1%) | 3.60 |
| Single Female/Mother | 4 (1.7%) | 3.75 |
| Non-family | 77 (32.5%) | 1.22 |
| Total Households | 237 (100.0%) | 2.50 |
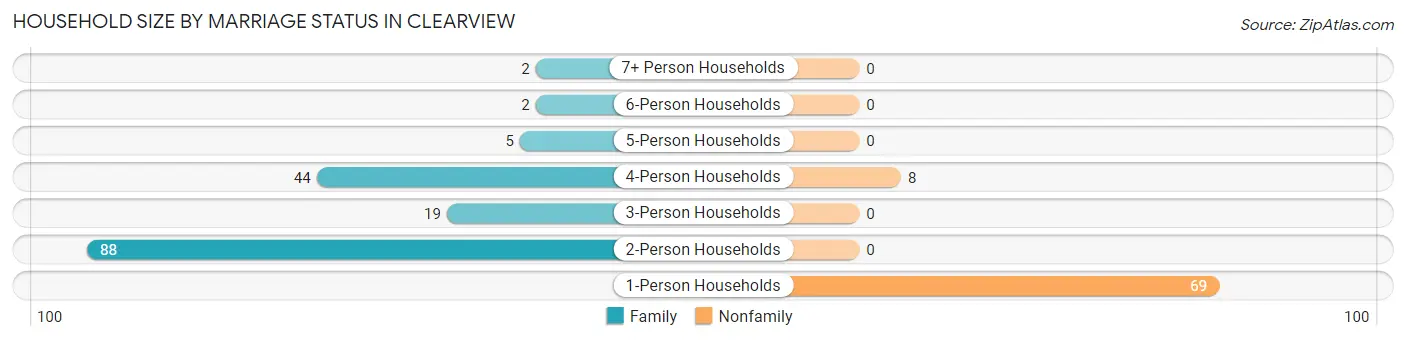
Household Size by Marriage Status in Clearview
Out of a total of 237 households in Clearview, 160 (67.5%) are family households, while 77 (32.5%) are nonfamily households. The most numerous type of family households are 2-person households, comprising 88, and the most common type of nonfamily households are 1-person households, comprising 69.
| Household Size | Family Households | Nonfamily Households |
| 1-Person Households | - | 69 (29.1%) |
| 2-Person Households | 88 (37.1%) | 0 (0.0%) |
| 3-Person Households | 19 (8.0%) | 0 (0.0%) |
| 4-Person Households | 44 (18.6%) | 8 (3.4%) |
| 5-Person Households | 5 (2.1%) | 0 (0.0%) |
| 6-Person Households | 2 (0.8%) | 0 (0.0%) |
| 7+ Person Households | 2 (0.8%) | 0 (0.0%) |
| Total | 160 (67.5%) | 77 (32.5%) |
Female Fertility in Clearview
Fertility by Age in Clearview
Average fertility rate in Clearview is 31.0 births per 1,000 women. Women in the age bracket of 20 to 34 years have the highest fertility rate with 80.0 births per 1,000 women. Women in the age bracket of 20 to 34 years acount for 100.0% of all women with births.
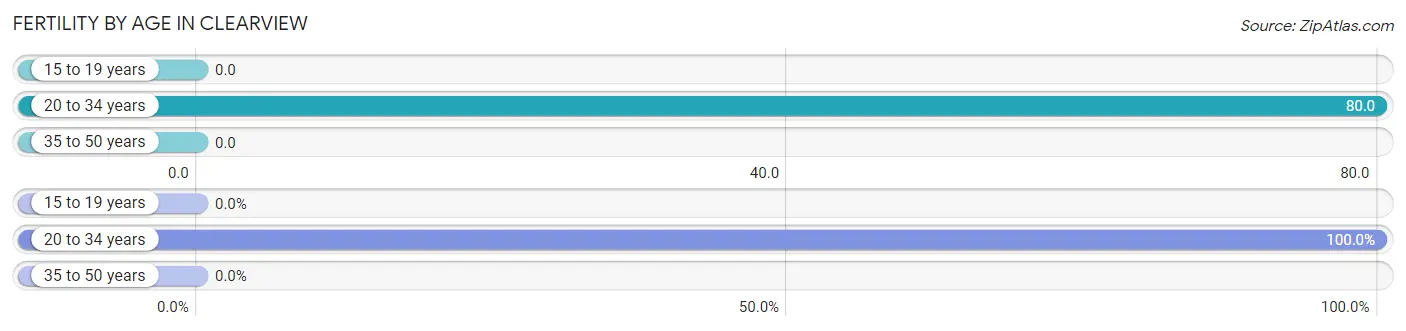
| Age Bracket | Women with Births | Births / 1,000 Women |
| 15 to 19 years | 0 (0.0%) | 0.0 |
| 20 to 34 years | 4 (100.0%) | 80.0 |
| 35 to 50 years | 0 (0.0%) | 0.0 |
| Total | 4 (100.0%) | 31.0 |
Fertility by Age by Marriage Status in Clearview
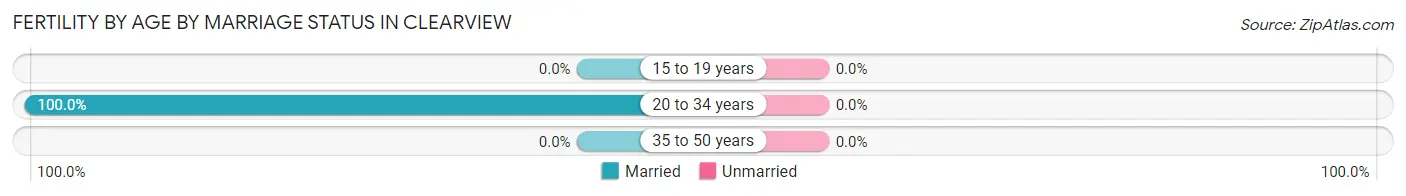
| Age Bracket | Married | Unmarried |
| 15 to 19 years | 0 (0.0%) | 0 (0.0%) |
| 20 to 34 years | 4 (100.0%) | 0 (0.0%) |
| 35 to 50 years | 0 (0.0%) | 0 (0.0%) |
| Total | 4 (100.0%) | 0 (0.0%) |
Fertility by Education in Clearview
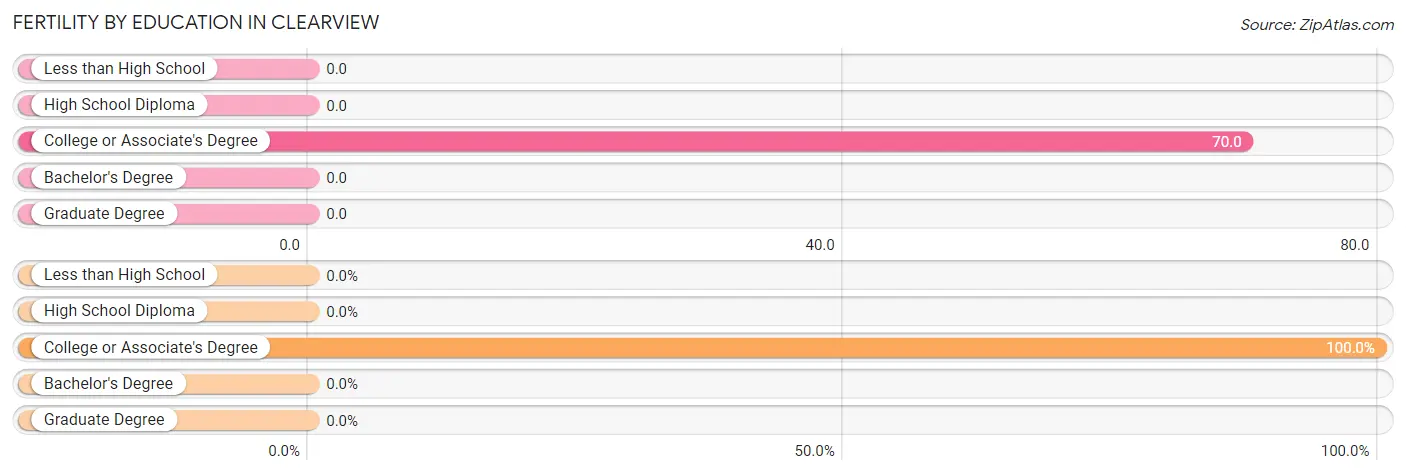
| Educational Attainment | Women with Births | Births / 1,000 Women |
| Less than High School | 0 (0.0%) | 0.0 |
| High School Diploma | 0 (0.0%) | 0.0 |
| College or Associate's Degree | 4 (100.0%) | 70.0 |
| Bachelor's Degree | 0 (0.0%) | 0.0 |
| Graduate Degree | 0 (0.0%) | 0.0 |
| Total | 4 (100.0%) | 31.0 |
Fertility by Education by Marriage Status in Clearview
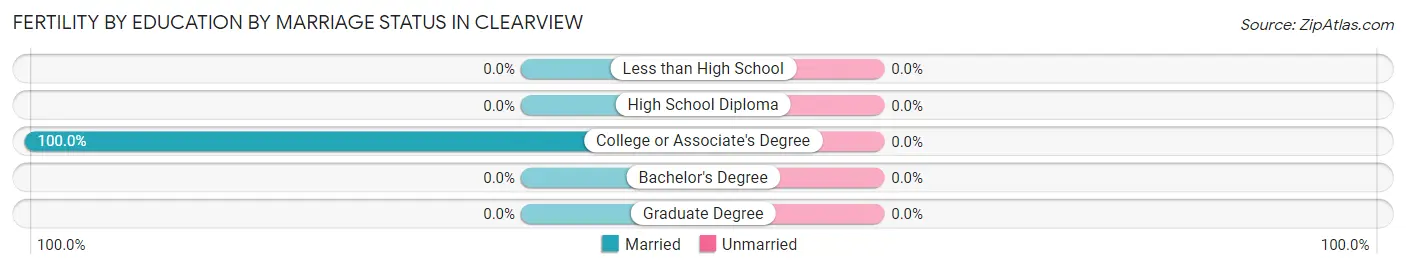
| Educational Attainment | Married | Unmarried |
| Less than High School | 0 (0.0%) | 0 (0.0%) |
| High School Diploma | 0 (0.0%) | 0 (0.0%) |
| College or Associate's Degree | 4 (100.0%) | 0 (0.0%) |
| Bachelor's Degree | 0 (0.0%) | 0 (0.0%) |
| Graduate Degree | 0 (0.0%) | 0 (0.0%) |
| Total | 4 (100.0%) | 0 (0.0%) |
Income in Clearview
Income Overview in Clearview
Per Capita Income in Clearview is $39,252, while median incomes of families and households are $101,250 and $79,688 respectively.
| Characteristic | Number | Measure |
| Per Capita Income | 592 | $39,252 |
| Median Family Income | 160 | $101,250 |
| Mean Family Income | 160 | $113,558 |
| Median Household Income | 237 | $79,688 |
| Mean Household Income | 237 | $95,000 |
| Income Deficit | 160 | $0 |
| Wage / Income Gap (%) | 592 | 45.83% |
| Wage / Income Gap ($) | 592 | 54.17¢ per $1 |
| Gini / Inequality Index | 592 | 0.42 |
Earnings by Sex in Clearview
Average Earnings in Clearview are $40,333, $60,000 for men and $32,500 for women, a difference of 45.8%.
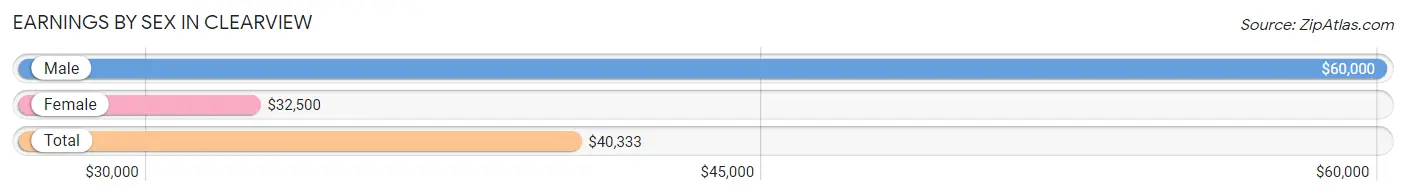
| Sex | Number | Average Earnings |
| Male | 164 (51.9%) | $60,000 |
| Female | 152 (48.1%) | $32,500 |
| Total | 316 (100.0%) | $40,333 |
Earnings by Sex by Income Bracket in Clearview
The most common earnings brackets in Clearview are $100,000+ for men (42 | 25.6%) and $30,000 to $34,999 for women (16 | 10.5%).
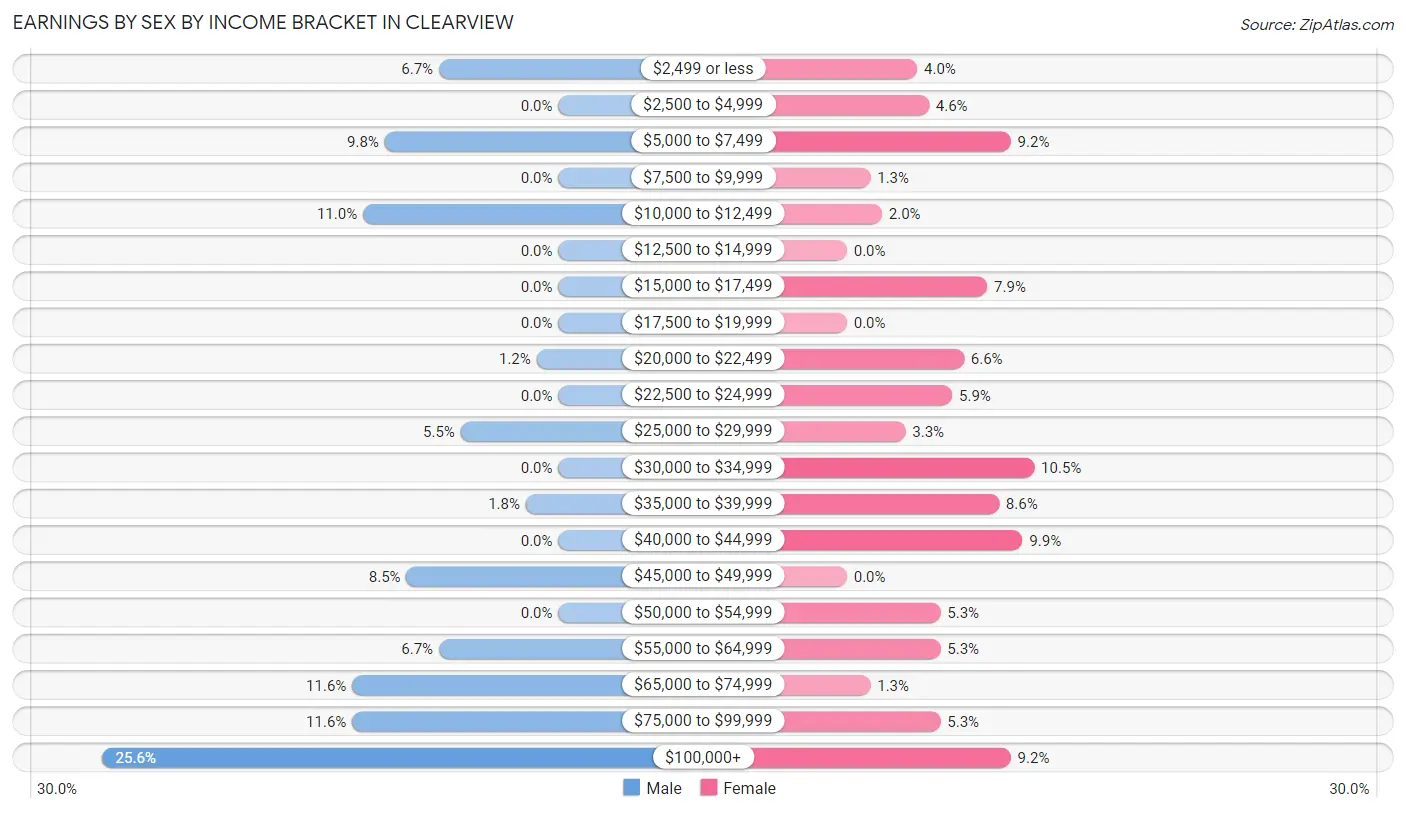
| Income | Male | Female |
| $2,499 or less | 11 (6.7%) | 6 (4.0%) |
| $2,500 to $4,999 | 0 (0.0%) | 7 (4.6%) |
| $5,000 to $7,499 | 16 (9.8%) | 14 (9.2%) |
| $7,500 to $9,999 | 0 (0.0%) | 2 (1.3%) |
| $10,000 to $12,499 | 18 (11.0%) | 3 (2.0%) |
| $12,500 to $14,999 | 0 (0.0%) | 0 (0.0%) |
| $15,000 to $17,499 | 0 (0.0%) | 12 (7.9%) |
| $17,500 to $19,999 | 0 (0.0%) | 0 (0.0%) |
| $20,000 to $22,499 | 2 (1.2%) | 10 (6.6%) |
| $22,500 to $24,999 | 0 (0.0%) | 9 (5.9%) |
| $25,000 to $29,999 | 9 (5.5%) | 5 (3.3%) |
| $30,000 to $34,999 | 0 (0.0%) | 16 (10.5%) |
| $35,000 to $39,999 | 3 (1.8%) | 13 (8.6%) |
| $40,000 to $44,999 | 0 (0.0%) | 15 (9.9%) |
| $45,000 to $49,999 | 14 (8.5%) | 0 (0.0%) |
| $50,000 to $54,999 | 0 (0.0%) | 8 (5.3%) |
| $55,000 to $64,999 | 11 (6.7%) | 8 (5.3%) |
| $65,000 to $74,999 | 19 (11.6%) | 2 (1.3%) |
| $75,000 to $99,999 | 19 (11.6%) | 8 (5.3%) |
| $100,000+ | 42 (25.6%) | 14 (9.2%) |
| Total | 164 (100.0%) | 152 (100.0%) |
Earnings by Sex by Educational Attainment in Clearview
Average earnings in Clearview are $71,000 for men and $33,281 for women, a difference of 53.1%. Men with an educational attainment of bachelor's degree enjoy the highest average annual earnings of $90,694, while those with bachelor's degree education earn the least with $90,694. Women with an educational attainment of bachelor's degree earn the most with the average annual earnings of $41,500, while those with high school diploma education have the smallest earnings of $17,000.
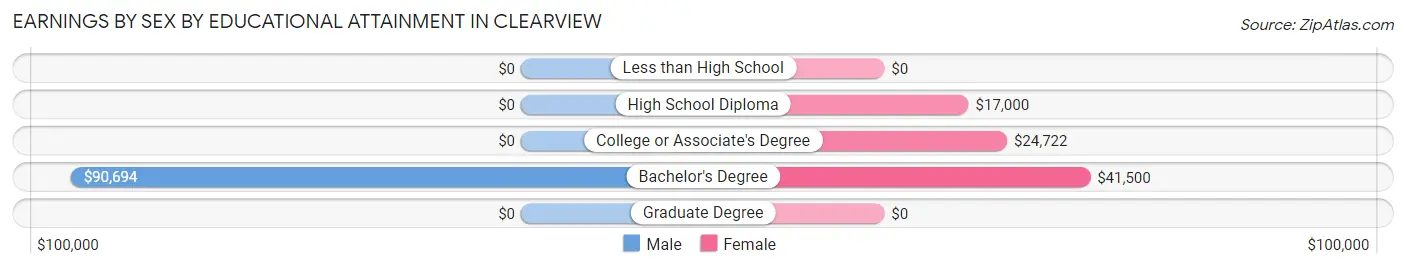
| Educational Attainment | Male Income | Female Income |
| Less than High School | - | - |
| High School Diploma | - | - |
| College or Associate's Degree | - | - |
| Bachelor's Degree | $90,694 | $41,500 |
| Graduate Degree | - | - |
| Total | $71,000 | $33,281 |
Family Income in Clearview
Family Income Brackets in Clearview
According to the Clearview family income data, there are 40 families falling into the $100,000 to $149,999 income range, which is the most common income bracket and makes up 25.0% of all families.
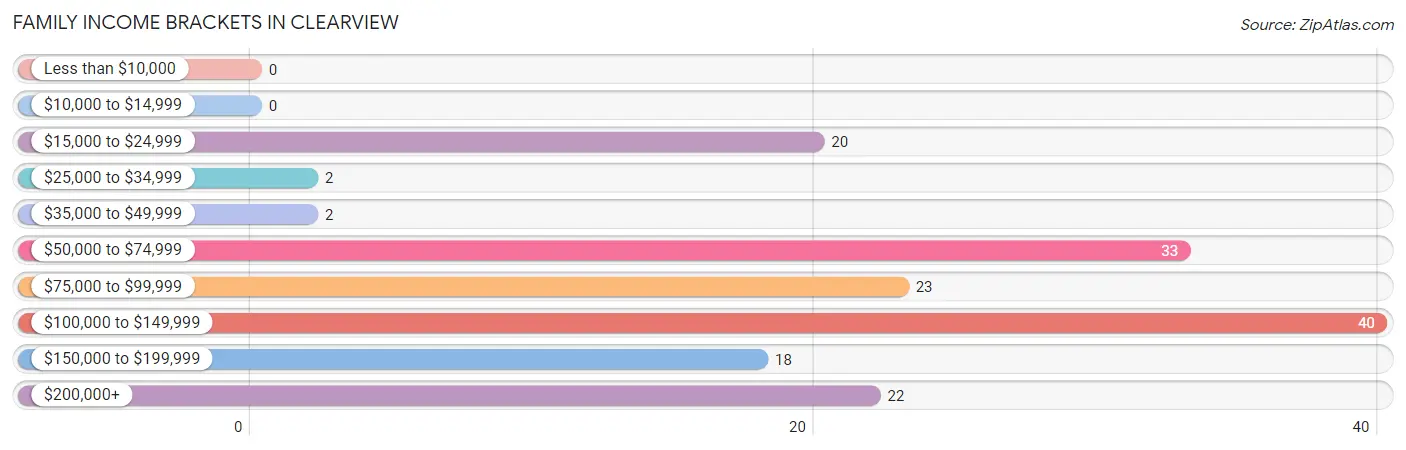
| Income Bracket | # Families | % Families |
| Less than $10,000 | 0 | 0.0% |
| $10,000 to $14,999 | 0 | 0.0% |
| $15,000 to $24,999 | 20 | 12.5% |
| $25,000 to $34,999 | 2 | 1.3% |
| $35,000 to $49,999 | 2 | 1.3% |
| $50,000 to $74,999 | 33 | 20.6% |
| $75,000 to $99,999 | 23 | 14.4% |
| $100,000 to $149,999 | 40 | 25.0% |
| $150,000 to $199,999 | 18 | 11.3% |
| $200,000+ | 22 | 13.8% |
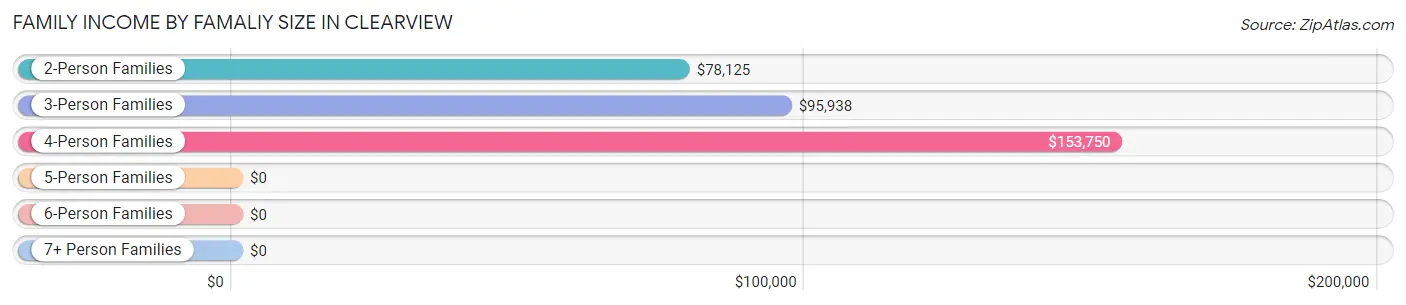
Family Income by Famaliy Size in Clearview
4-person families (44 | 27.5%) account for the highest median family income in Clearview with $153,750 per family, while 2-person families (88 | 55.0%) have the highest median income of $39,062 per family member.
| Income Bracket | # Families | Median Income |
| 2-Person Families | 88 (55.0%) | $78,125 |
| 3-Person Families | 19 (11.9%) | $95,938 |
| 4-Person Families | 44 (27.5%) | $153,750 |
| 5-Person Families | 5 (3.1%) | $0 |
| 6-Person Families | 2 (1.3%) | $0 |
| 7+ Person Families | 2 (1.3%) | $0 |
| Total | 160 (100.0%) | $101,250 |
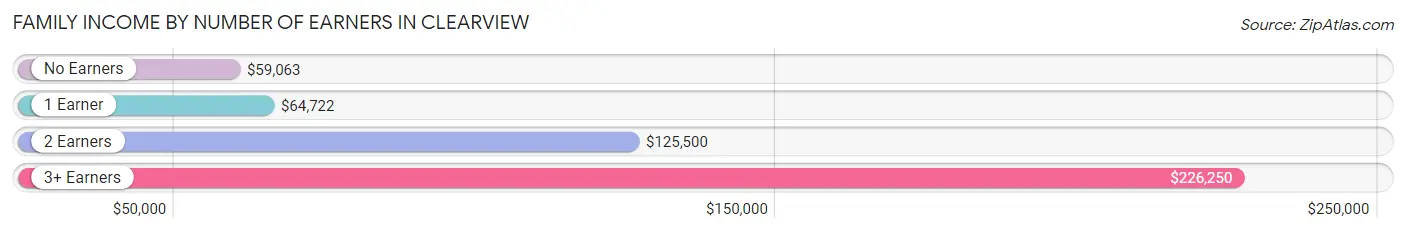
Family Income by Number of Earners in Clearview
The median family income in Clearview is $101,250, with families comprising 3+ earners (17) having the highest median family income of $226,250, while families with no earners (17) have the lowest median family income of $59,063, accounting for 10.6% and 10.6% of families, respectively.
| Number of Earners | # Families | Median Income |
| No Earners | 17 (10.6%) | $59,063 |
| 1 Earner | 40 (25.0%) | $64,722 |
| 2 Earners | 86 (53.7%) | $125,500 |
| 3+ Earners | 17 (10.6%) | $226,250 |
| Total | 160 (100.0%) | $101,250 |
Household Income in Clearview
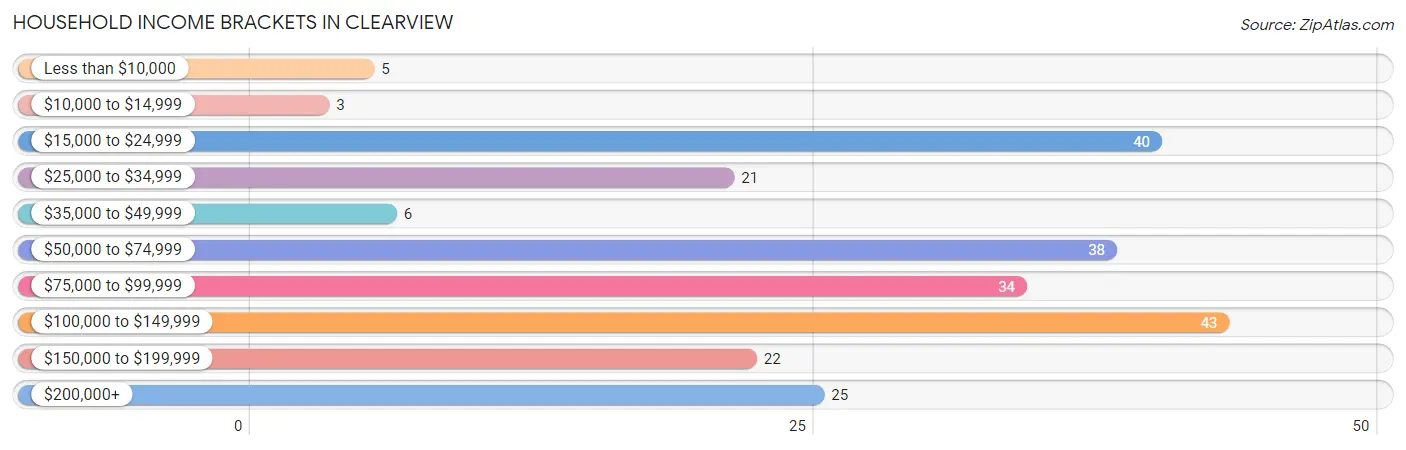
Household Income Brackets in Clearview
With 43 households falling in the category, the $100,000 to $149,999 income range is the most frequent in Clearview, accounting for 18.1% of all households. In contrast, only 3 households (1.3%) fall into the $10,000 to $14,999 income bracket, making it the least populous group.
| Income Bracket | # Households | % Households |
| Less than $10,000 | 5 | 2.1% |
| $10,000 to $14,999 | 3 | 1.3% |
| $15,000 to $24,999 | 40 | 16.9% |
| $25,000 to $34,999 | 21 | 8.9% |
| $35,000 to $49,999 | 6 | 2.5% |
| $50,000 to $74,999 | 38 | 16.0% |
| $75,000 to $99,999 | 34 | 14.3% |
| $100,000 to $149,999 | 43 | 18.1% |
| $150,000 to $199,999 | 22 | 9.3% |
| $200,000+ | 25 | 10.5% |
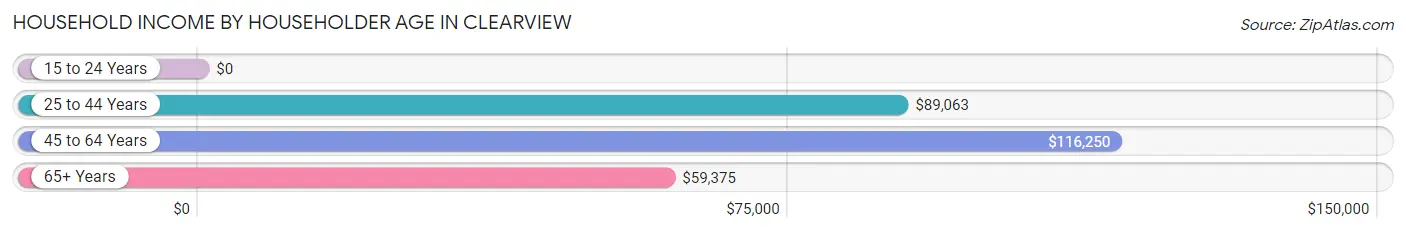
Household Income by Householder Age in Clearview
The median household income in Clearview is $79,688, with the highest median household income of $116,250 found in the 45 to 64 years age bracket for the primary householder. A total of 68 households (28.7%) fall into this category.
| Income Bracket | # Households | Median Income |
| 15 to 24 Years | 0 (0.0%) | $0 |
| 25 to 44 Years | 79 (33.3%) | $89,063 |
| 45 to 64 Years | 68 (28.7%) | $116,250 |
| 65+ Years | 90 (38.0%) | $59,375 |
| Total | 237 (100.0%) | $79,688 |
Poverty in Clearview
Income Below Poverty by Sex and Age in Clearview
With 6.9% poverty level for males and 5.6% for females among the residents of Clearview, 25 to 34 year old males and 16 and 17 year old females are the most vulnerable to poverty, with 8 males (38.1%) and 4 females (50.0%) in their respective age groups living below the poverty level.
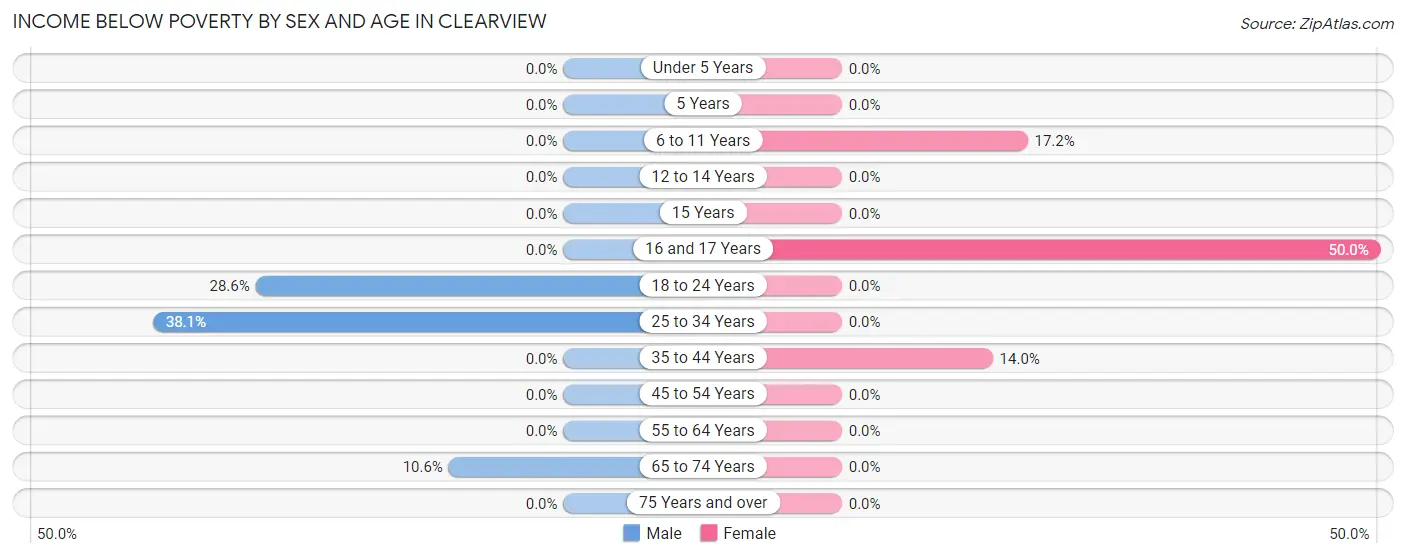
| Age Bracket | Male | Female |
| Under 5 Years | 0 (0.0%) | 0 (0.0%) |
| 5 Years | 0 (0.0%) | 0 (0.0%) |
| 6 to 11 Years | 0 (0.0%) | 5 (17.2%) |
| 12 to 14 Years | 0 (0.0%) | 0 (0.0%) |
| 15 Years | 0 (0.0%) | 0 (0.0%) |
| 16 and 17 Years | 0 (0.0%) | 4 (50.0%) |
| 18 to 24 Years | 8 (28.6%) | 0 (0.0%) |
| 25 to 34 Years | 8 (38.1%) | 0 (0.0%) |
| 35 to 44 Years | 0 (0.0%) | 7 (14.0%) |
| 45 to 54 Years | 0 (0.0%) | 0 (0.0%) |
| 55 to 64 Years | 0 (0.0%) | 0 (0.0%) |
| 65 to 74 Years | 5 (10.6%) | 0 (0.0%) |
| 75 Years and over | 0 (0.0%) | 0 (0.0%) |
| Total | 21 (6.9%) | 16 (5.6%) |
Income Above Poverty by Sex and Age in Clearview
According to the poverty statistics in Clearview, males aged under 5 years and females aged under 5 years are the age groups that are most secure financially, with 100.0% of males and 100.0% of females in these age groups living above the poverty line.
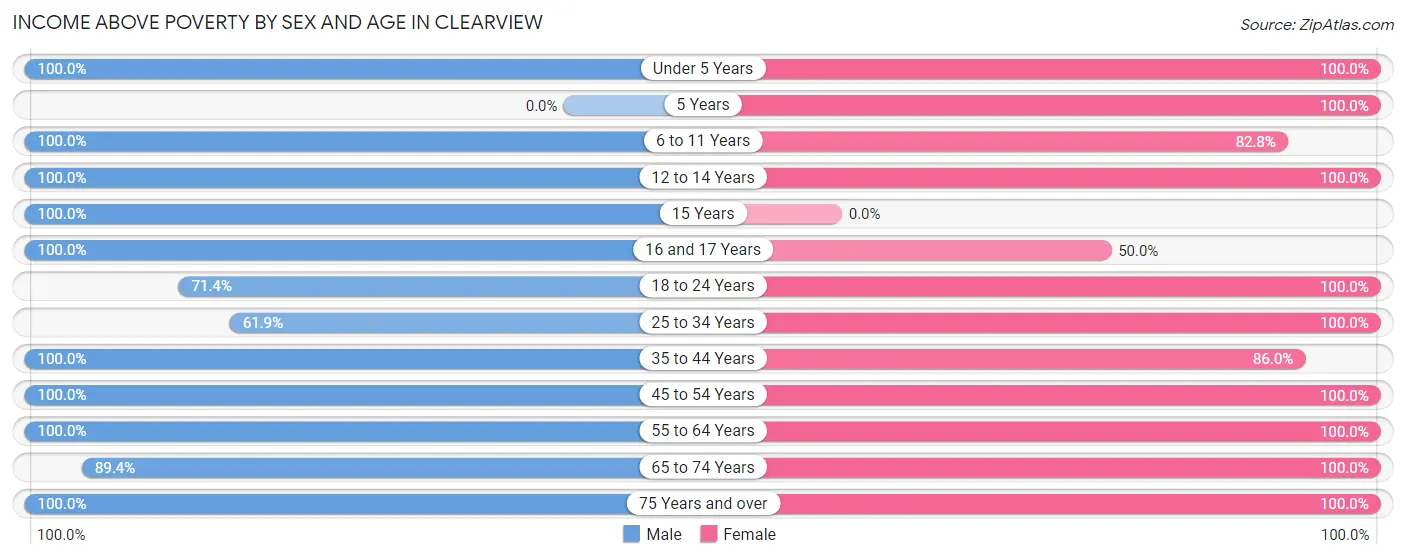
| Age Bracket | Male | Female |
| Under 5 Years | 38 (100.0%) | 5 (100.0%) |
| 5 Years | 0 (0.0%) | 4 (100.0%) |
| 6 to 11 Years | 30 (100.0%) | 24 (82.8%) |
| 12 to 14 Years | 7 (100.0%) | 7 (100.0%) |
| 15 Years | 1 (100.0%) | 0 (0.0%) |
| 16 and 17 Years | 2 (100.0%) | 4 (50.0%) |
| 18 to 24 Years | 20 (71.4%) | 10 (100.0%) |
| 25 to 34 Years | 13 (61.9%) | 43 (100.0%) |
| 35 to 44 Years | 55 (100.0%) | 43 (86.0%) |
| 45 to 54 Years | 20 (100.0%) | 34 (100.0%) |
| 55 to 64 Years | 40 (100.0%) | 32 (100.0%) |
| 65 to 74 Years | 42 (89.4%) | 37 (100.0%) |
| 75 Years and over | 16 (100.0%) | 28 (100.0%) |
| Total | 284 (93.1%) | 271 (94.4%) |
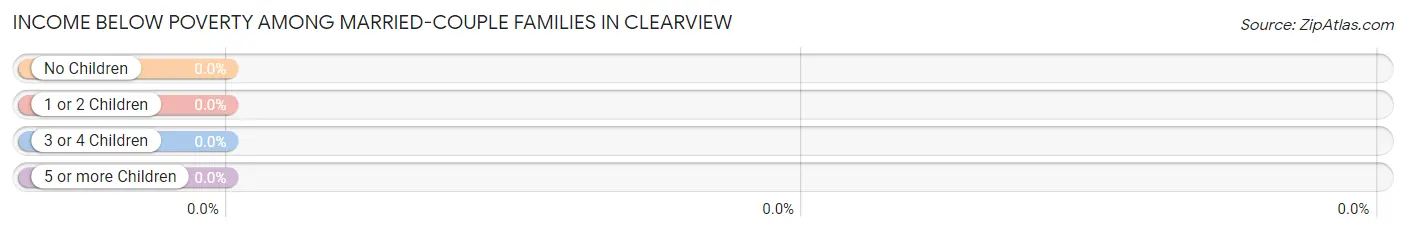
Income Below Poverty Among Married-Couple Families in Clearview
| Children | Above Poverty | Below Poverty |
| No Children | 98 (100.0%) | 0 (0.0%) |
| 1 or 2 Children | 51 (100.0%) | 0 (0.0%) |
| 3 or 4 Children | 2 (100.0%) | 0 (0.0%) |
| 5 or more Children | 0 (0.0%) | 0 (0.0%) |
| Total | 151 (100.0%) | 0 (0.0%) |
Income Below Poverty Among Single-Parent Households in Clearview
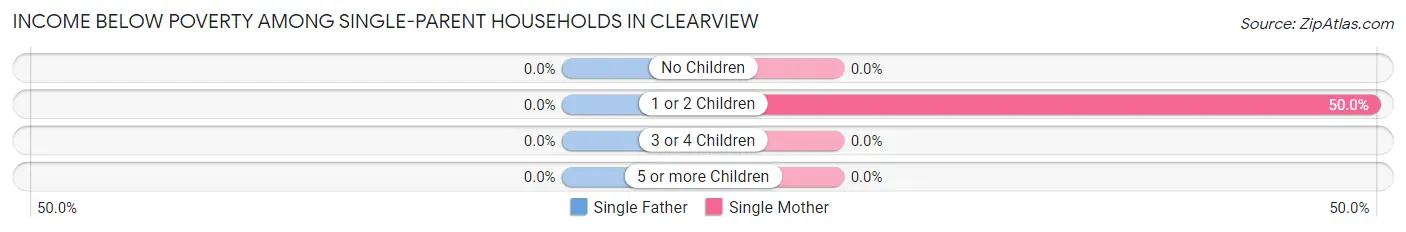
| Children | Single Father | Single Mother |
| No Children | 0 (0.0%) | 0 (0.0%) |
| 1 or 2 Children | 0 (0.0%) | 2 (50.0%) |
| 3 or 4 Children | 0 (0.0%) | 0 (0.0%) |
| 5 or more Children | 0 (0.0%) | 0 (0.0%) |
| Total | 0 (0.0%) | 2 (50.0%) |
Income Below Poverty Among Married-Couple vs Single-Parent Households in Clearview
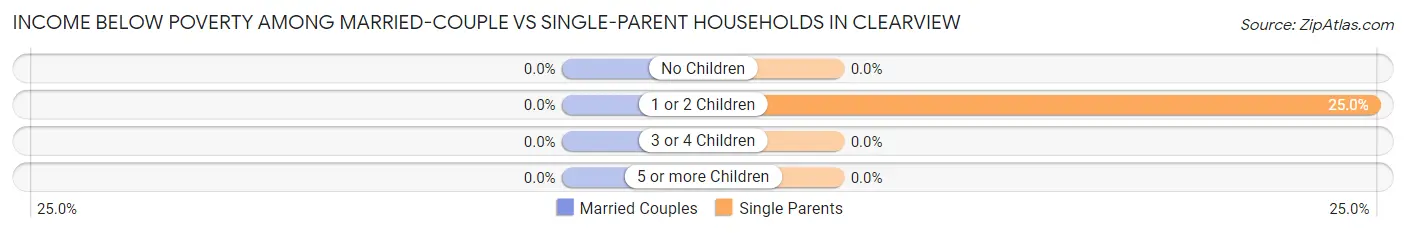
| Children | Married-Couple Families | Single-Parent Households |
| No Children | 0 (0.0%) | 0 (0.0%) |
| 1 or 2 Children | 0 (0.0%) | 2 (25.0%) |
| 3 or 4 Children | 0 (0.0%) | 0 (0.0%) |
| 5 or more Children | 0 (0.0%) | 0 (0.0%) |
| Total | 0 (0.0%) | 2 (22.2%) |
Employment Characteristics in Clearview
Employment by Class of Employer in Clearview
Among the 300 employed individuals in Clearview, private company employees (220 | 73.3%), local government employees (36 | 12.0%), and not-for-profit organizations (23 | 7.7%) make up the most common classes of employment.
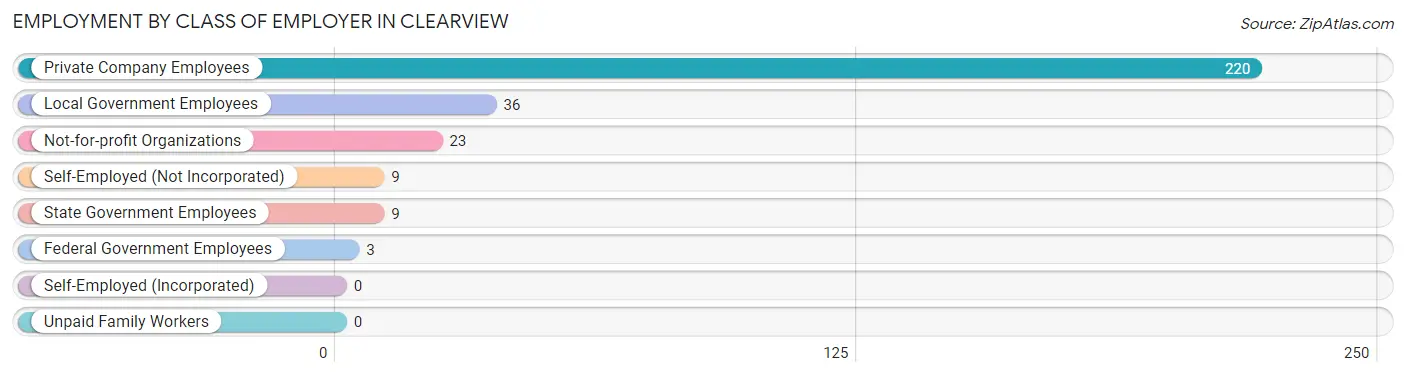
| Employer Class | # Employees | % Employees |
| Private Company Employees | 220 | 73.3% |
| Self-Employed (Incorporated) | 0 | 0.0% |
| Self-Employed (Not Incorporated) | 9 | 3.0% |
| Not-for-profit Organizations | 23 | 7.7% |
| Local Government Employees | 36 | 12.0% |
| State Government Employees | 9 | 3.0% |
| Federal Government Employees | 3 | 1.0% |
| Unpaid Family Workers | 0 | 0.0% |
| Total | 300 | 100.0% |
Employment Status by Age in Clearview
According to the labor force statistics for Clearview, out of the total population over 16 years of age (471), 65.2% or 307 individuals are in the labor force, with 2.3% or 7 of them unemployed. The age group with the highest labor force participation rate is 25 to 29 years, with 100.0% or 31 individuals in the labor force. Within the labor force, the 25 to 29 years age range has the highest percentage of unemployed individuals, with 22.6% or 7 of them being unemployed.
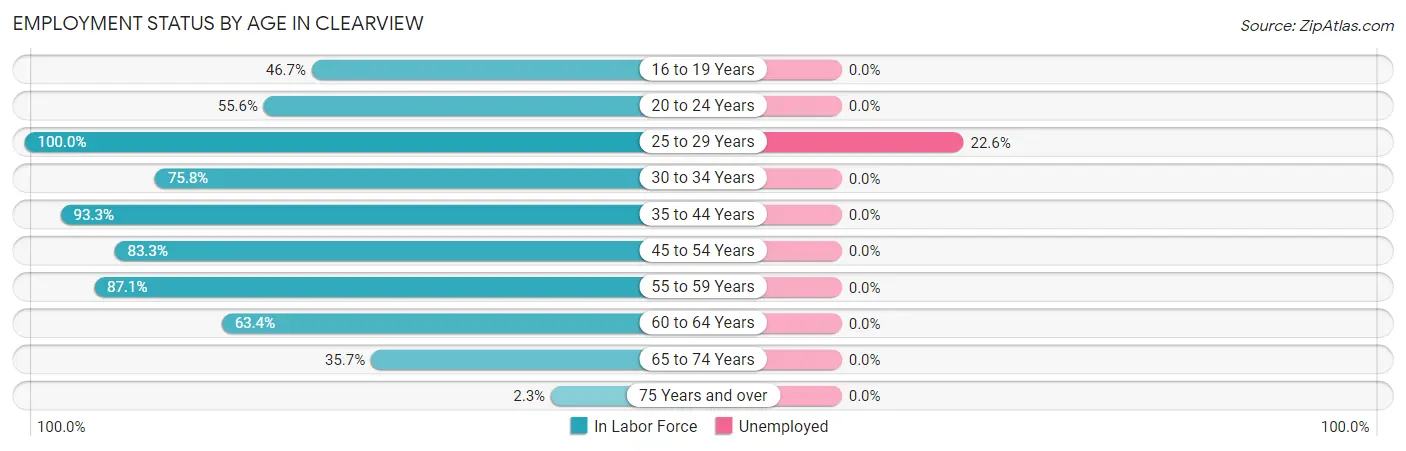
| Age Bracket | In Labor Force | Unemployed |
| 16 to 19 Years | 14 (46.7%) | 0 (0.0%) |
| 20 to 24 Years | 10 (55.6%) | 0 (0.0%) |
| 25 to 29 Years | 31 (100.0%) | 7 (22.6%) |
| 30 to 34 Years | 25 (75.8%) | 0 (0.0%) |
| 35 to 44 Years | 98 (93.3%) | 0 (0.0%) |
| 45 to 54 Years | 45 (83.3%) | 0 (0.0%) |
| 55 to 59 Years | 27 (87.1%) | 0 (0.0%) |
| 60 to 64 Years | 26 (63.4%) | 0 (0.0%) |
| 65 to 74 Years | 30 (35.7%) | 0 (0.0%) |
| 75 Years and over | 1 (2.3%) | 0 (0.0%) |
| Total | 307 (65.2%) | 7 (2.3%) |
Employment Status by Educational Attainment in Clearview
According to labor force statistics for Clearview, 85.4% of individuals (252) out of the total population between 25 and 64 years of age (295) are in the labor force, with 2.8% or 7 of them being unemployed. The group with the highest labor force participation rate are those with the educational attainment of bachelor's degree or higher, with 86.9% or 113 individuals in the labor force. Within the labor force, individuals with high school diploma education have the highest percentage of unemployment, with 15.9% or 7 of them being unemployed.
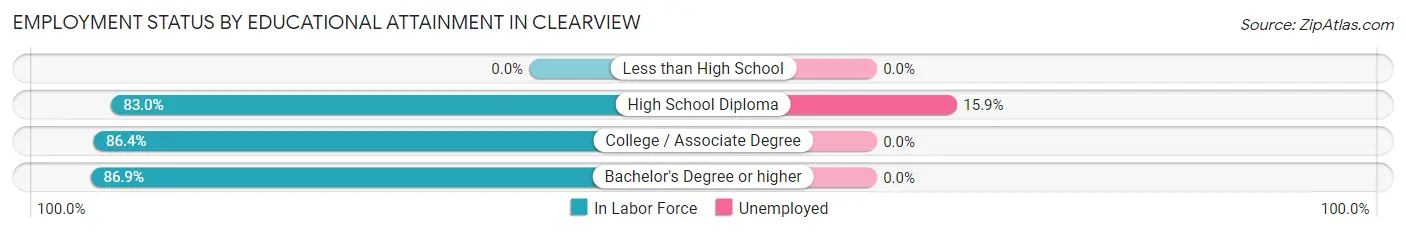
| Educational Attainment | In Labor Force | Unemployed |
| Less than High School | 0 (0.0%) | 0 (0.0%) |
| High School Diploma | 44 (83.0%) | 8 (15.9%) |
| College / Associate Degree | 95 (86.4%) | 0 (0.0%) |
| Bachelor's Degree or higher | 113 (86.9%) | 0 (0.0%) |
| Total | 252 (85.4%) | 8 (2.8%) |
Employment Occupations by Sex in Clearview
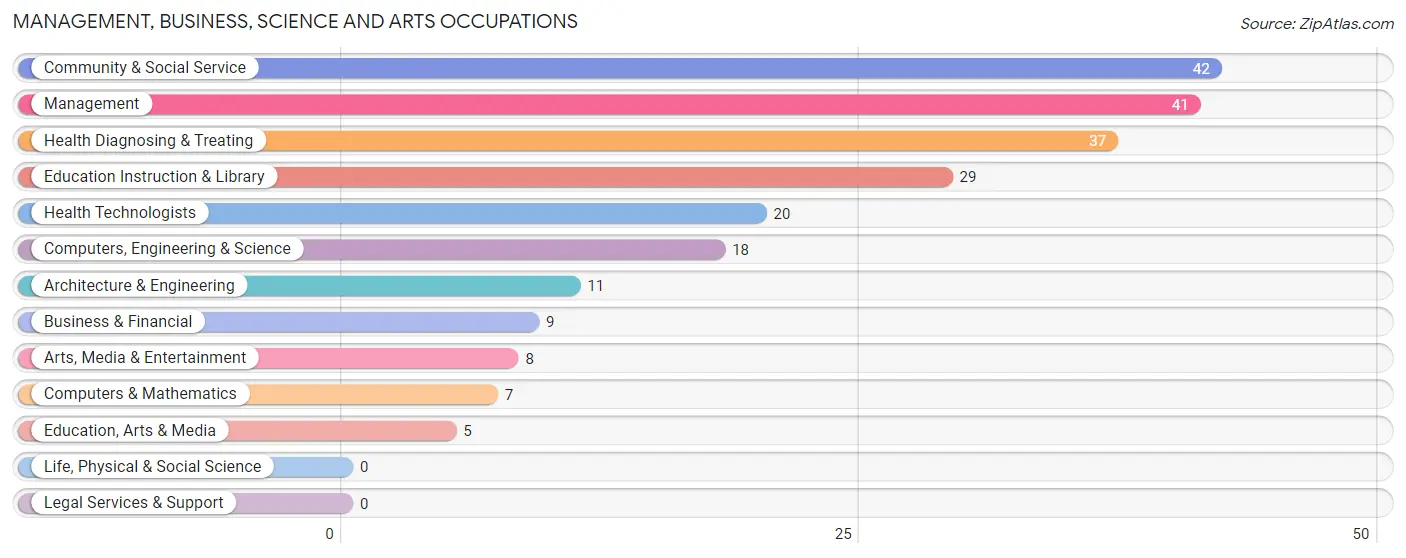
Management, Business, Science and Arts Occupations
The most common Management, Business, Science and Arts occupations in Clearview are Community & Social Service (42 | 14.0%), Management (41 | 13.7%), Health Diagnosing & Treating (37 | 12.3%), Education Instruction & Library (29 | 9.7%), and Health Technologists (20 | 6.7%).
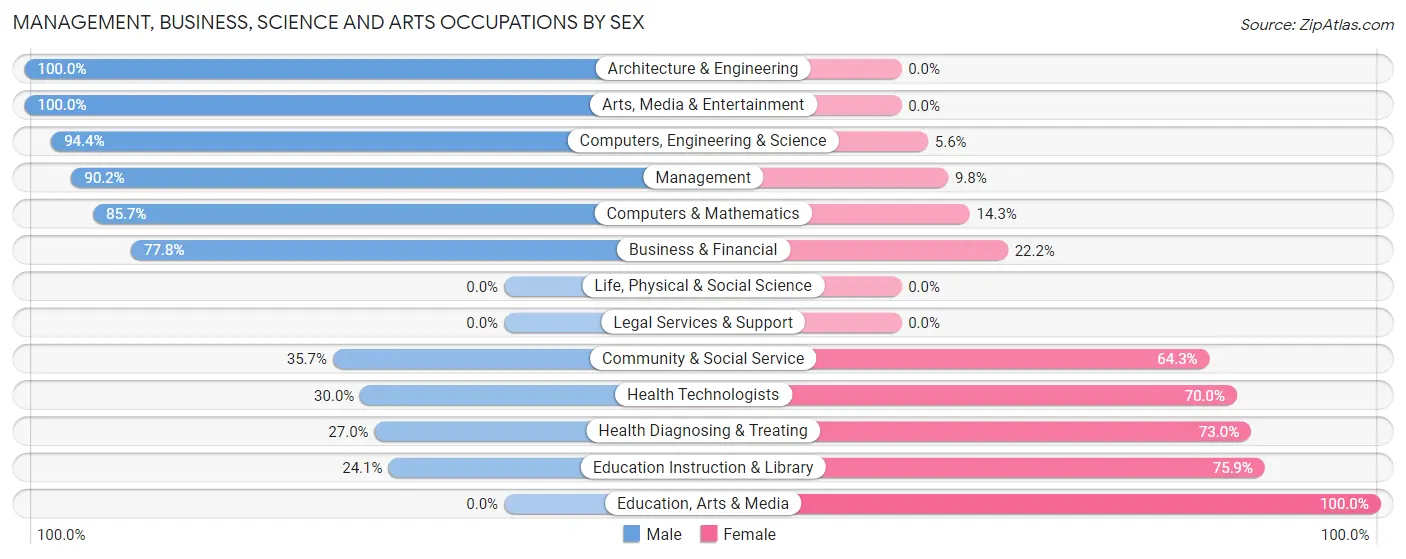
Management, Business, Science and Arts Occupations by Sex
Within the Management, Business, Science and Arts occupations in Clearview, the most male-oriented occupations are Architecture & Engineering (100.0%), Arts, Media & Entertainment (100.0%), and Computers, Engineering & Science (94.4%), while the most female-oriented occupations are Education, Arts & Media (100.0%), Education Instruction & Library (75.9%), and Health Diagnosing & Treating (73.0%).
| Occupation | Male | Female |
| Management | 37 (90.2%) | 4 (9.8%) |
| Business & Financial | 7 (77.8%) | 2 (22.2%) |
| Computers, Engineering & Science | 17 (94.4%) | 1 (5.6%) |
| Computers & Mathematics | 6 (85.7%) | 1 (14.3%) |
| Architecture & Engineering | 11 (100.0%) | 0 (0.0%) |
| Life, Physical & Social Science | 0 (0.0%) | 0 (0.0%) |
| Community & Social Service | 15 (35.7%) | 27 (64.3%) |
| Education, Arts & Media | 0 (0.0%) | 5 (100.0%) |
| Legal Services & Support | 0 (0.0%) | 0 (0.0%) |
| Education Instruction & Library | 7 (24.1%) | 22 (75.9%) |
| Arts, Media & Entertainment | 8 (100.0%) | 0 (0.0%) |
| Health Diagnosing & Treating | 10 (27.0%) | 27 (73.0%) |
| Health Technologists | 6 (30.0%) | 14 (70.0%) |
| Total (Category) | 86 (58.5%) | 61 (41.5%) |
| Total (Overall) | 155 (51.7%) | 145 (48.3%) |
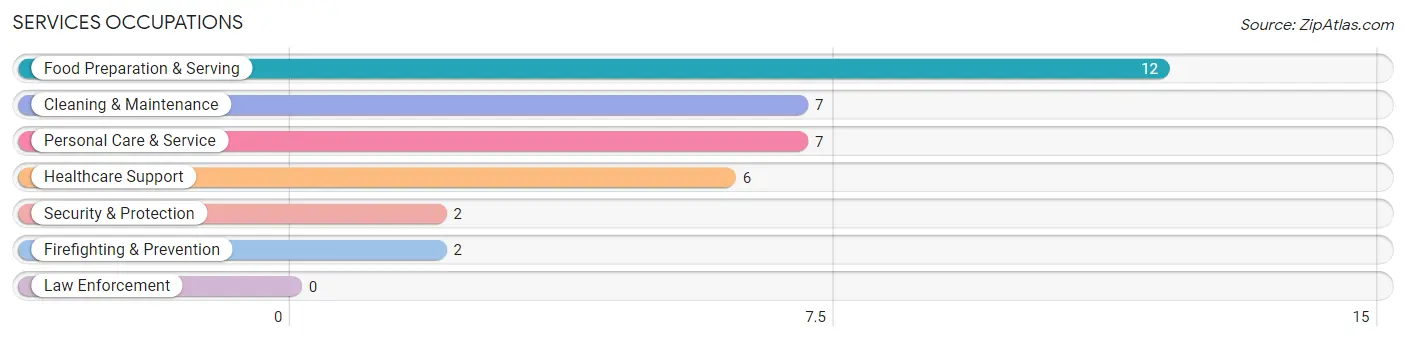
Services Occupations
The most common Services occupations in Clearview are Food Preparation & Serving (12 | 4.0%), Cleaning & Maintenance (7 | 2.3%), Personal Care & Service (7 | 2.3%), Healthcare Support (6 | 2.0%), and Security & Protection (2 | 0.7%).
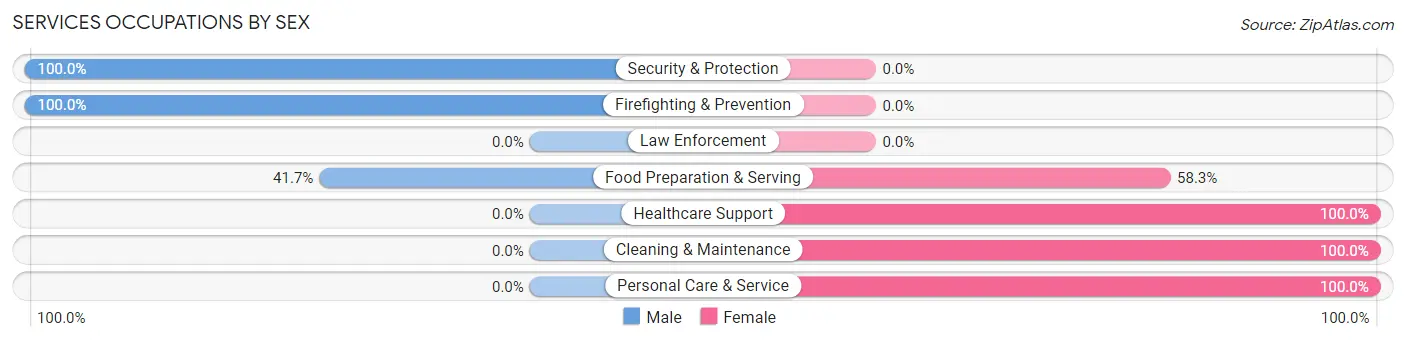
Services Occupations by Sex
Within the Services occupations in Clearview, the most male-oriented occupations are Security & Protection (100.0%), Firefighting & Prevention (100.0%), and Food Preparation & Serving (41.7%), while the most female-oriented occupations are Healthcare Support (100.0%), Cleaning & Maintenance (100.0%), and Personal Care & Service (100.0%).
| Occupation | Male | Female |
| Healthcare Support | 0 (0.0%) | 6 (100.0%) |
| Security & Protection | 2 (100.0%) | 0 (0.0%) |
| Firefighting & Prevention | 2 (100.0%) | 0 (0.0%) |
| Law Enforcement | 0 (0.0%) | 0 (0.0%) |
| Food Preparation & Serving | 5 (41.7%) | 7 (58.3%) |
| Cleaning & Maintenance | 0 (0.0%) | 7 (100.0%) |
| Personal Care & Service | 0 (0.0%) | 7 (100.0%) |
| Total (Category) | 7 (20.6%) | 27 (79.4%) |
| Total (Overall) | 155 (51.7%) | 145 (48.3%) |
Sales and Office Occupations
The most common Sales and Office occupations in Clearview are Office & Administration (52 | 17.3%), and Sales & Related (12 | 4.0%).

Sales and Office Occupations by Sex

| Occupation | Male | Female |
| Sales & Related | 5 (41.7%) | 7 (58.3%) |
| Office & Administration | 6 (11.5%) | 46 (88.5%) |
| Total (Category) | 11 (17.2%) | 53 (82.8%) |
| Total (Overall) | 155 (51.7%) | 145 (48.3%) |
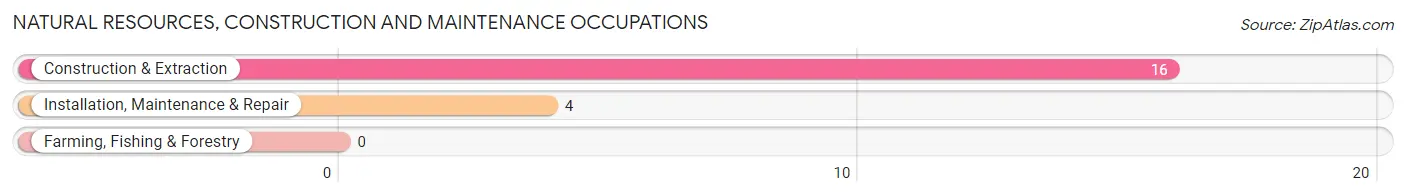
Natural Resources, Construction and Maintenance Occupations
The most common Natural Resources, Construction and Maintenance occupations in Clearview are Construction & Extraction (16 | 5.3%), and Installation, Maintenance & Repair (4 | 1.3%).
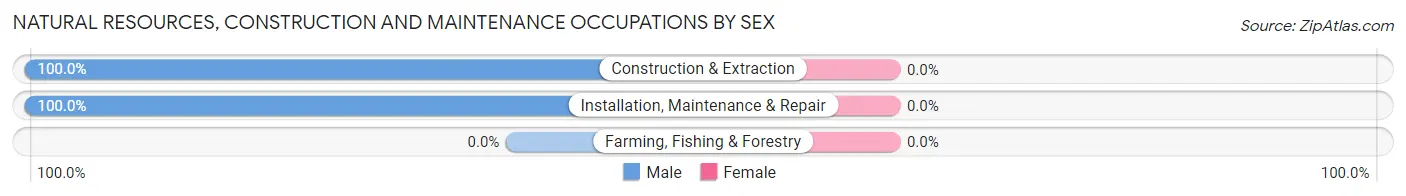
Natural Resources, Construction and Maintenance Occupations by Sex
| Occupation | Male | Female |
| Farming, Fishing & Forestry | 0 (0.0%) | 0 (0.0%) |
| Construction & Extraction | 16 (100.0%) | 0 (0.0%) |
| Installation, Maintenance & Repair | 4 (100.0%) | 0 (0.0%) |
| Total (Category) | 20 (100.0%) | 0 (0.0%) |
| Total (Overall) | 155 (51.7%) | 145 (48.3%) |
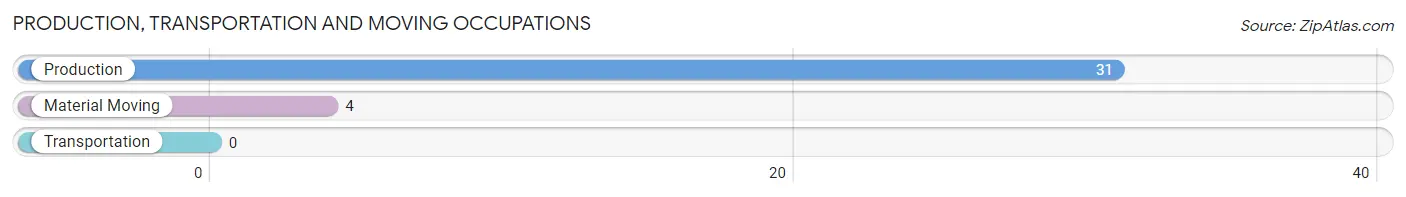
Production, Transportation and Moving Occupations
The most common Production, Transportation and Moving occupations in Clearview are Production (31 | 10.3%), and Material Moving (4 | 1.3%).
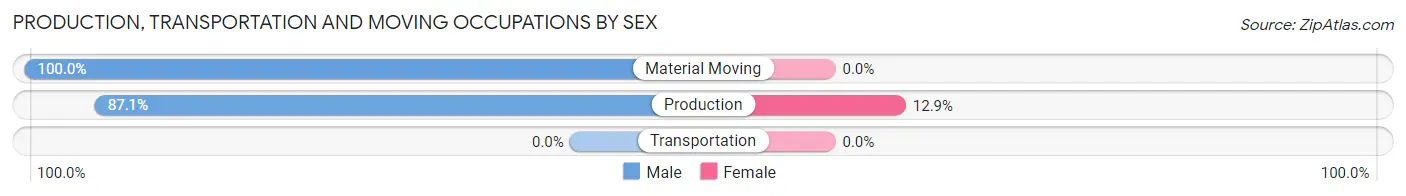
Production, Transportation and Moving Occupations by Sex
| Occupation | Male | Female |
| Production | 27 (87.1%) | 4 (12.9%) |
| Transportation | 0 (0.0%) | 0 (0.0%) |
| Material Moving | 4 (100.0%) | 0 (0.0%) |
| Total (Category) | 31 (88.6%) | 4 (11.4%) |
| Total (Overall) | 155 (51.7%) | 145 (48.3%) |
Employment Industries by Sex in Clearview
Employment Industries in Clearview
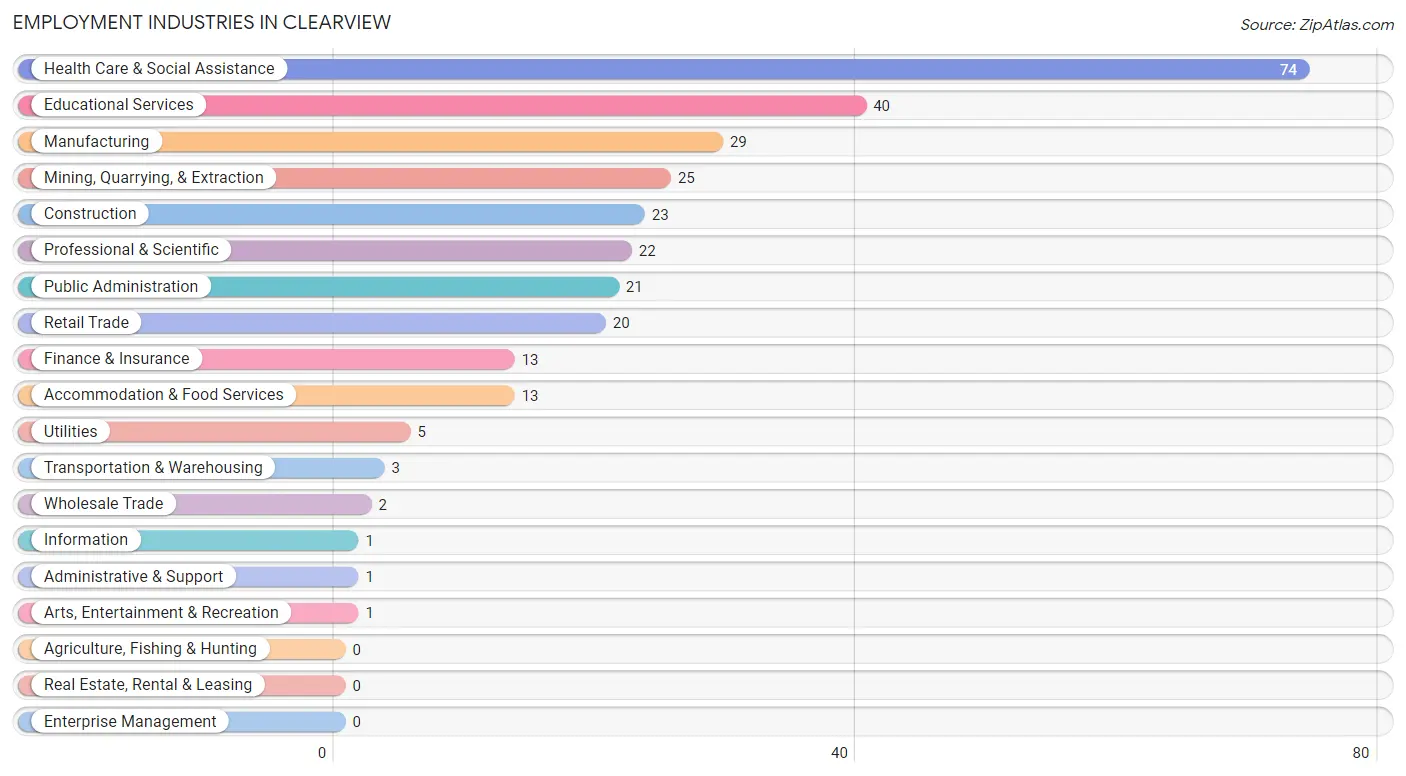
The major employment industries in Clearview include Health Care & Social Assistance (74 | 24.7%), Educational Services (40 | 13.3%), Manufacturing (29 | 9.7%), Mining, Quarrying, & Extraction (25 | 8.3%), and Construction (23 | 7.7%).
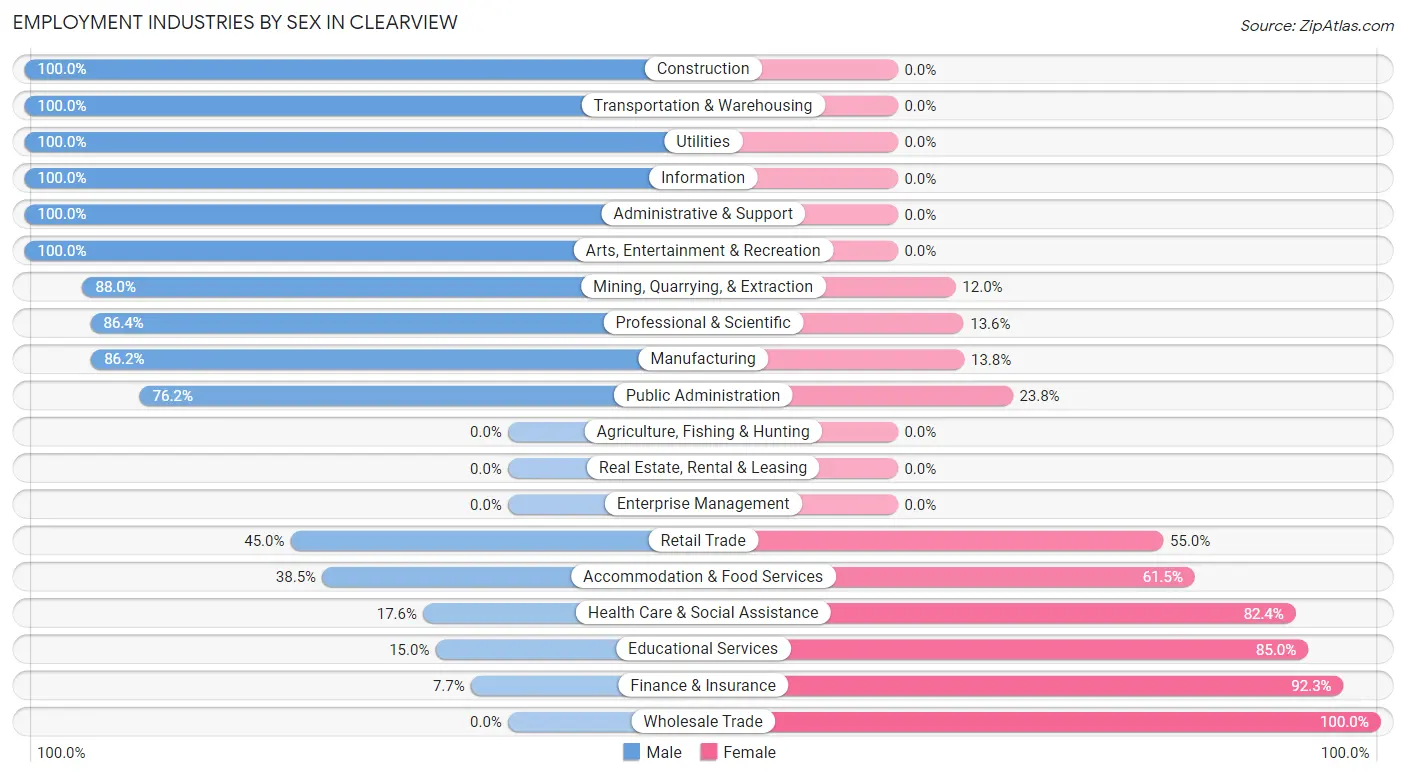
Employment Industries by Sex in Clearview
The Clearview industries that see more men than women are Construction (100.0%), Transportation & Warehousing (100.0%), and Utilities (100.0%), whereas the industries that tend to have a higher number of women are Wholesale Trade (100.0%), Finance & Insurance (92.3%), and Educational Services (85.0%).
| Industry | Male | Female |
| Agriculture, Fishing & Hunting | 0 (0.0%) | 0 (0.0%) |
| Mining, Quarrying, & Extraction | 22 (88.0%) | 3 (12.0%) |
| Construction | 23 (100.0%) | 0 (0.0%) |
| Manufacturing | 25 (86.2%) | 4 (13.8%) |
| Wholesale Trade | 0 (0.0%) | 2 (100.0%) |
| Retail Trade | 9 (45.0%) | 11 (55.0%) |
| Transportation & Warehousing | 3 (100.0%) | 0 (0.0%) |
| Utilities | 5 (100.0%) | 0 (0.0%) |
| Information | 1 (100.0%) | 0 (0.0%) |
| Finance & Insurance | 1 (7.7%) | 12 (92.3%) |
| Real Estate, Rental & Leasing | 0 (0.0%) | 0 (0.0%) |
| Professional & Scientific | 19 (86.4%) | 3 (13.6%) |
| Enterprise Management | 0 (0.0%) | 0 (0.0%) |
| Administrative & Support | 1 (100.0%) | 0 (0.0%) |
| Educational Services | 6 (15.0%) | 34 (85.0%) |
| Health Care & Social Assistance | 13 (17.6%) | 61 (82.4%) |
| Arts, Entertainment & Recreation | 1 (100.0%) | 0 (0.0%) |
| Accommodation & Food Services | 5 (38.5%) | 8 (61.5%) |
| Public Administration | 16 (76.2%) | 5 (23.8%) |
| Total | 155 (51.7%) | 145 (48.3%) |
Education in Clearview
School Enrollment in Clearview
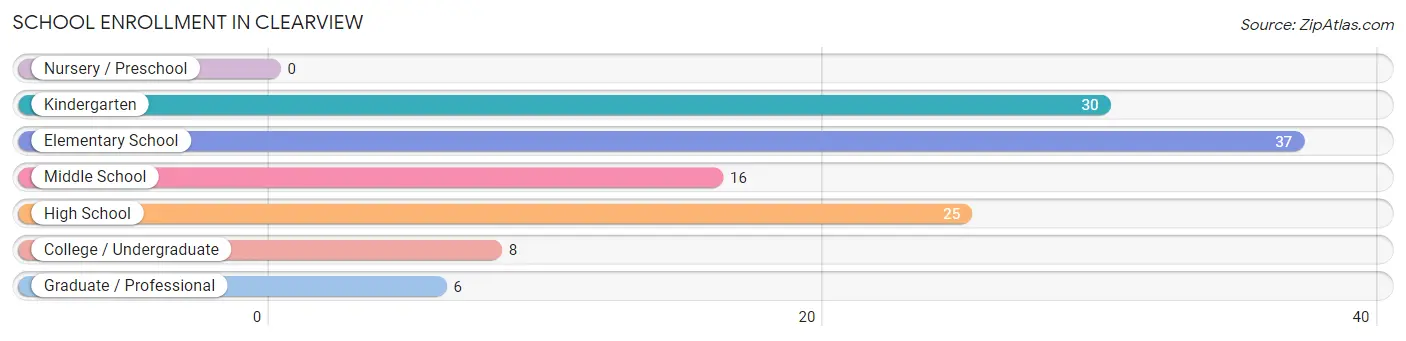
The most common levels of schooling among the 122 students in Clearview are elementary school (37 | 30.3%), kindergarten (30 | 24.6%), and high school (25 | 20.5%).
| School Level | # Students | % Students |
| Nursery / Preschool | 0 | 0.0% |
| Kindergarten | 30 | 24.6% |
| Elementary School | 37 | 30.3% |
| Middle School | 16 | 13.1% |
| High School | 25 | 20.5% |
| College / Undergraduate | 8 | 6.6% |
| Graduate / Professional | 6 | 4.9% |
| Total | 122 | 100.0% |
School Enrollment by Age by Funding Source in Clearview
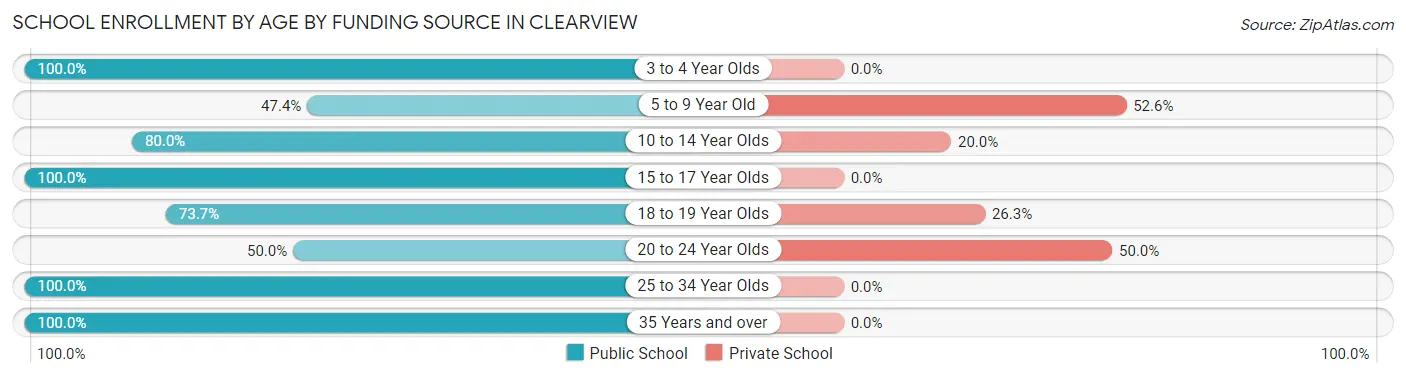
Out of a total of 122 students who are enrolled in schools in Clearview, 41 (33.6%) attend a private institution, while the remaining 81 (66.4%) are enrolled in public schools. The age group of 5 to 9 year old has the highest likelihood of being enrolled in private schools, with 30 (52.6% in the age bracket) enrolled. Conversely, the age group of 3 to 4 year olds has the lowest likelihood of being enrolled in a private school, with 9 (100.0% in the age bracket) attending a public institution.
| Age Bracket | Public School | Private School |
| 3 to 4 Year Olds | 9 (100.0%) | 0 (0.0%) |
| 5 to 9 Year Old | 27 (47.4%) | 30 (52.6%) |
| 10 to 14 Year Olds | 16 (80.0%) | 4 (20.0%) |
| 15 to 17 Year Olds | 5 (100.0%) | 0 (0.0%) |
| 18 to 19 Year Olds | 14 (73.7%) | 5 (26.3%) |
| 20 to 24 Year Olds | 2 (50.0%) | 2 (50.0%) |
| 25 to 34 Year Olds | 6 (100.0%) | 0 (0.0%) |
| 35 Years and over | 2 (100.0%) | 0 (0.0%) |
| Total | 81 (66.4%) | 41 (33.6%) |
Educational Attainment by Field of Study in Clearview
Education (39 | 23.9%), bio, nature & agricultural (34 | 20.9%), business (21 | 12.9%), science & technology (20 | 12.3%), and engineering (15 | 9.2%) are the most common fields of study among 163 individuals in Clearview who have obtained a bachelor's degree or higher.
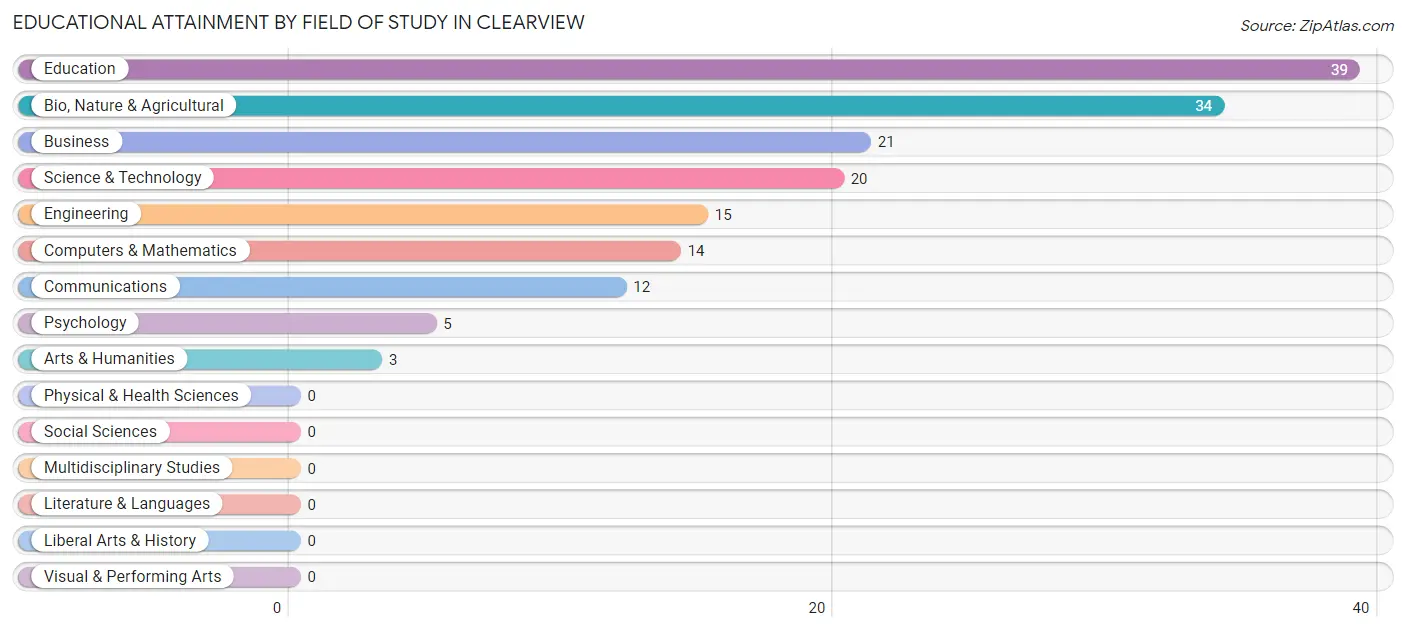
| Field of Study | # Graduates | % Graduates |
| Computers & Mathematics | 14 | 8.6% |
| Bio, Nature & Agricultural | 34 | 20.9% |
| Physical & Health Sciences | 0 | 0.0% |
| Psychology | 5 | 3.1% |
| Social Sciences | 0 | 0.0% |
| Engineering | 15 | 9.2% |
| Multidisciplinary Studies | 0 | 0.0% |
| Science & Technology | 20 | 12.3% |
| Business | 21 | 12.9% |
| Education | 39 | 23.9% |
| Literature & Languages | 0 | 0.0% |
| Liberal Arts & History | 0 | 0.0% |
| Visual & Performing Arts | 0 | 0.0% |
| Communications | 12 | 7.4% |
| Arts & Humanities | 3 | 1.8% |
| Total | 163 | 100.0% |
Transportation & Commute in Clearview
Vehicle Availability by Sex in Clearview
The most prevalent vehicle ownership categories in Clearview are males with 2 vehicles (100, accounting for 64.5%) and females with 2 vehicles (85, making up 69.0%).
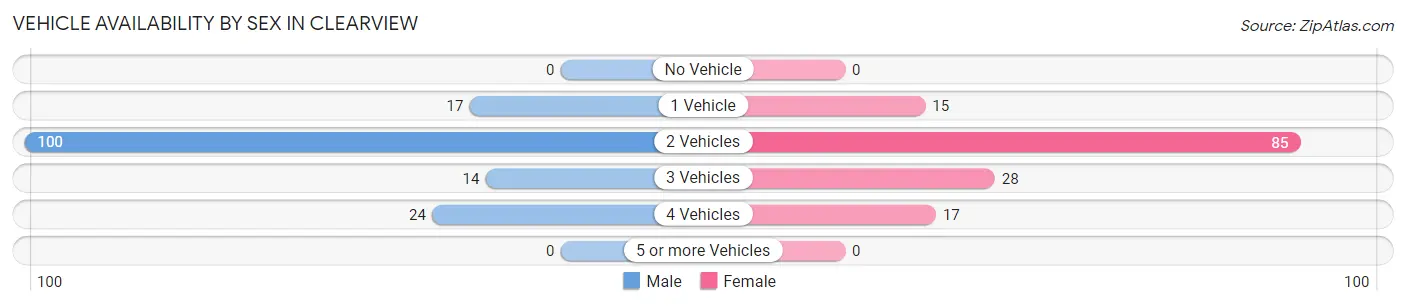
| Vehicles Available | Male | Female |
| No Vehicle | 0 (0.0%) | 0 (0.0%) |
| 1 Vehicle | 17 (11.0%) | 15 (10.3%) |
| 2 Vehicles | 100 (64.5%) | 85 (58.6%) |
| 3 Vehicles | 14 (9.0%) | 28 (19.3%) |
| 4 Vehicles | 24 (15.5%) | 17 (11.7%) |
| 5 or more Vehicles | 0 (0.0%) | 0 (0.0%) |
| Total | 155 (100.0%) | 145 (100.0%) |
Commute Time in Clearview
The most frequently occuring commute durations in Clearview are 20 to 24 minutes (80 commuters, 28.1%), 15 to 19 minutes (40 commuters, 14.0%), and 25 to 29 minutes (37 commuters, 13.0%).
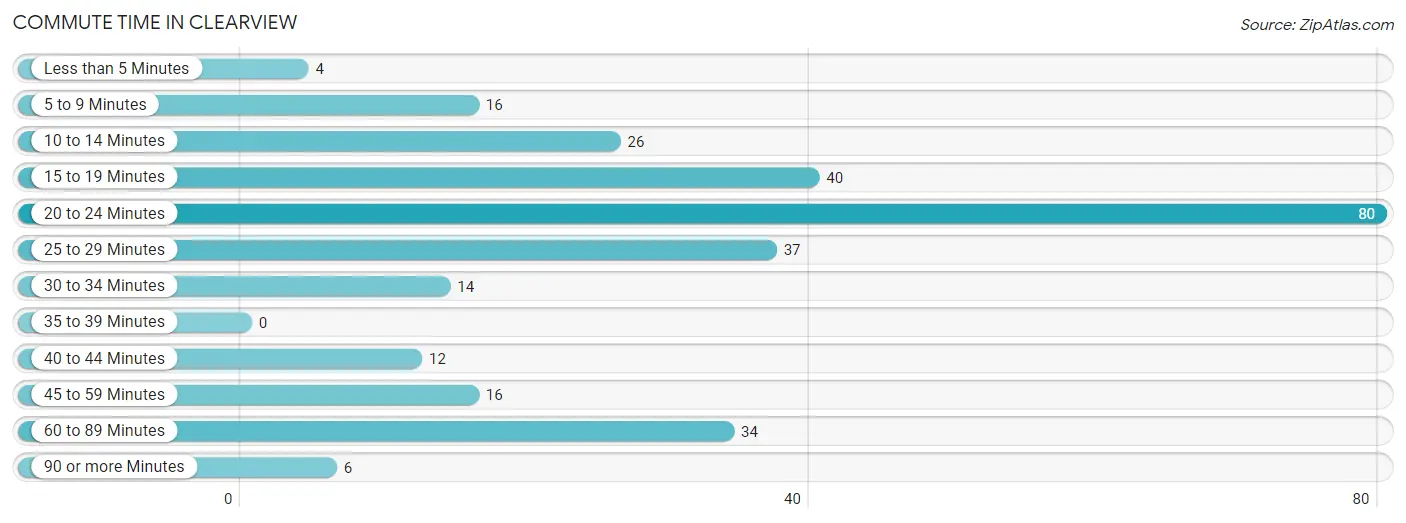
| Commute Time | # Commuters | % Commuters |
| Less than 5 Minutes | 4 | 1.4% |
| 5 to 9 Minutes | 16 | 5.6% |
| 10 to 14 Minutes | 26 | 9.1% |
| 15 to 19 Minutes | 40 | 14.0% |
| 20 to 24 Minutes | 80 | 28.1% |
| 25 to 29 Minutes | 37 | 13.0% |
| 30 to 34 Minutes | 14 | 4.9% |
| 35 to 39 Minutes | 0 | 0.0% |
| 40 to 44 Minutes | 12 | 4.2% |
| 45 to 59 Minutes | 16 | 5.6% |
| 60 to 89 Minutes | 34 | 11.9% |
| 90 or more Minutes | 6 | 2.1% |
Commute Time by Sex in Clearview
The most common commute times in Clearview are 25 to 29 minutes (27 commuters, 18.1%) for males and 20 to 24 minutes (61 commuters, 44.9%) for females.
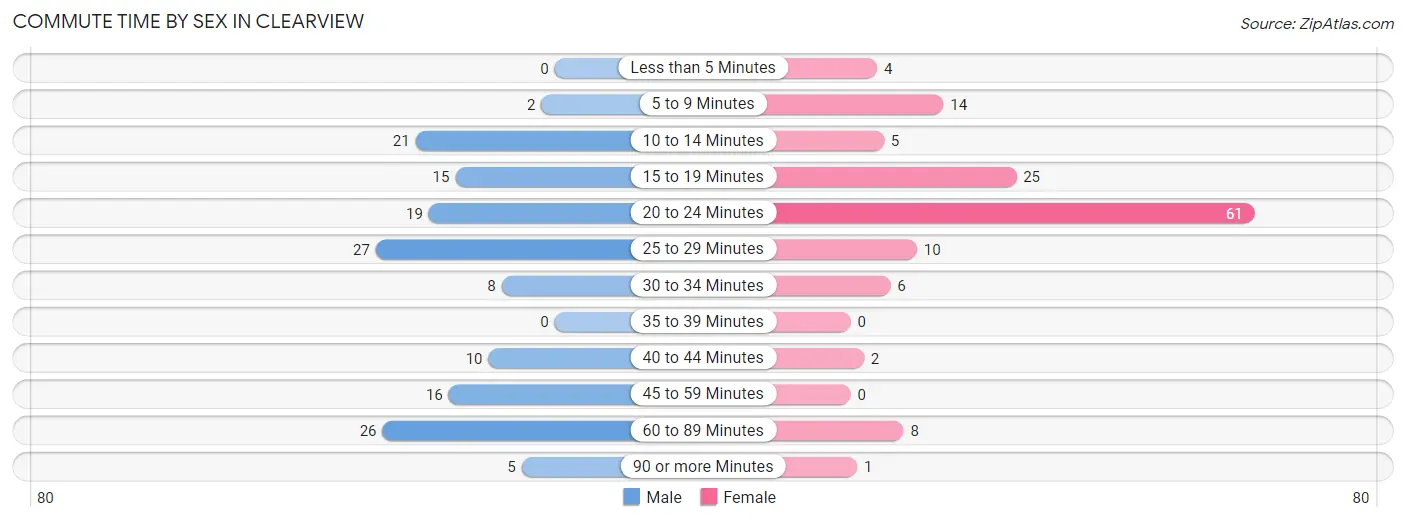
| Commute Time | Male | Female |
| Less than 5 Minutes | 0 (0.0%) | 4 (2.9%) |
| 5 to 9 Minutes | 2 (1.3%) | 14 (10.3%) |
| 10 to 14 Minutes | 21 (14.1%) | 5 (3.7%) |
| 15 to 19 Minutes | 15 (10.1%) | 25 (18.4%) |
| 20 to 24 Minutes | 19 (12.8%) | 61 (44.9%) |
| 25 to 29 Minutes | 27 (18.1%) | 10 (7.3%) |
| 30 to 34 Minutes | 8 (5.4%) | 6 (4.4%) |
| 35 to 39 Minutes | 0 (0.0%) | 0 (0.0%) |
| 40 to 44 Minutes | 10 (6.7%) | 2 (1.5%) |
| 45 to 59 Minutes | 16 (10.7%) | 0 (0.0%) |
| 60 to 89 Minutes | 26 (17.4%) | 8 (5.9%) |
| 90 or more Minutes | 5 (3.4%) | 1 (0.7%) |
Time of Departure to Work by Sex in Clearview
The most frequent times of departure to work in Clearview are 6:30 AM to 6:59 AM (40, 26.9%) for males and 8:00 AM to 8:29 AM (29, 21.3%) for females.
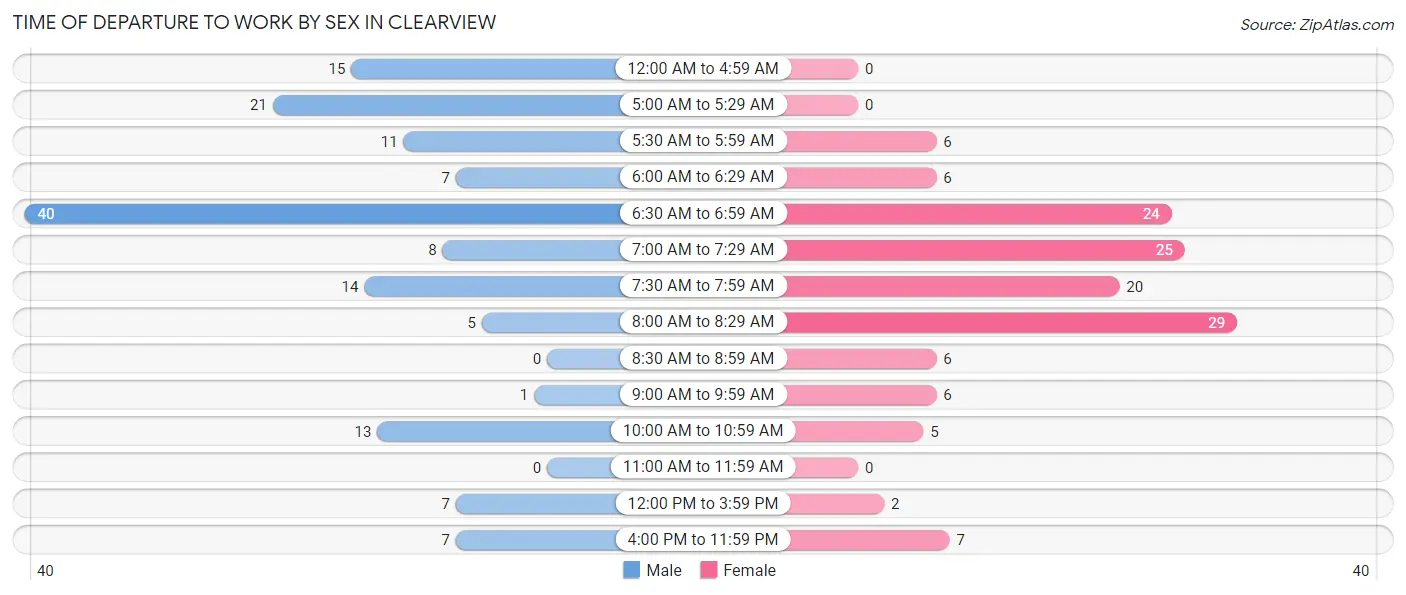
| Time of Departure | Male | Female |
| 12:00 AM to 4:59 AM | 15 (10.1%) | 0 (0.0%) |
| 5:00 AM to 5:29 AM | 21 (14.1%) | 0 (0.0%) |
| 5:30 AM to 5:59 AM | 11 (7.4%) | 6 (4.4%) |
| 6:00 AM to 6:29 AM | 7 (4.7%) | 6 (4.4%) |
| 6:30 AM to 6:59 AM | 40 (26.9%) | 24 (17.6%) |
| 7:00 AM to 7:29 AM | 8 (5.4%) | 25 (18.4%) |
| 7:30 AM to 7:59 AM | 14 (9.4%) | 20 (14.7%) |
| 8:00 AM to 8:29 AM | 5 (3.4%) | 29 (21.3%) |
| 8:30 AM to 8:59 AM | 0 (0.0%) | 6 (4.4%) |
| 9:00 AM to 9:59 AM | 1 (0.7%) | 6 (4.4%) |
| 10:00 AM to 10:59 AM | 13 (8.7%) | 5 (3.7%) |
| 11:00 AM to 11:59 AM | 0 (0.0%) | 0 (0.0%) |
| 12:00 PM to 3:59 PM | 7 (4.7%) | 2 (1.5%) |
| 4:00 PM to 11:59 PM | 7 (4.7%) | 7 (5.1%) |
| Total | 149 (100.0%) | 136 (100.0%) |
Housing Occupancy in Clearview
Occupancy by Ownership in Clearview
Of the total 237 dwellings in Clearview, owner-occupied units account for 215 (90.7%), while renter-occupied units make up 22 (9.3%).
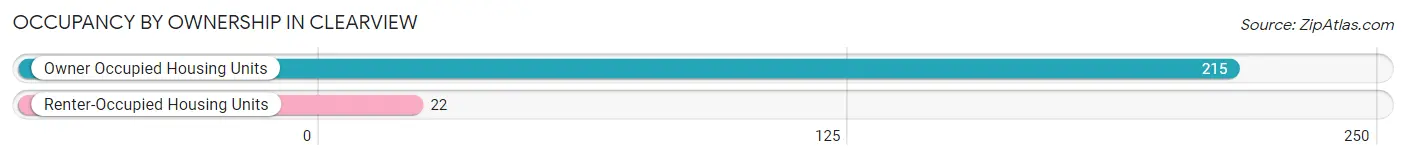
| Occupancy | # Housing Units | % Housing Units |
| Owner Occupied Housing Units | 215 | 90.7% |
| Renter-Occupied Housing Units | 22 | 9.3% |
| Total Occupied Housing Units | 237 | 100.0% |
Occupancy by Household Size in Clearview
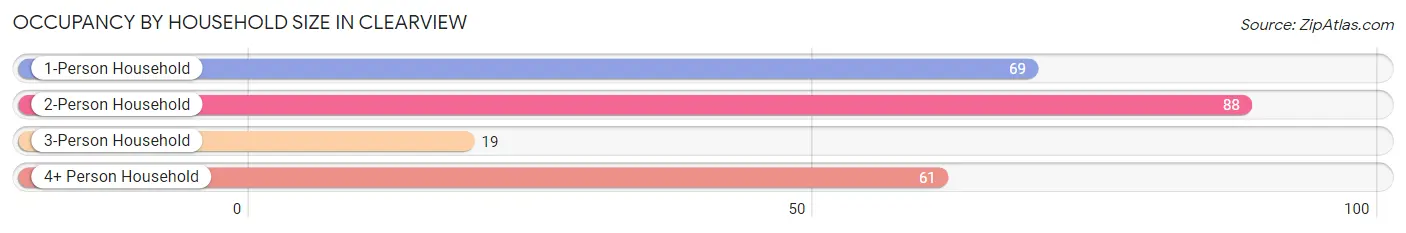
| Household Size | # Housing Units | % Housing Units |
| 1-Person Household | 69 | 29.1% |
| 2-Person Household | 88 | 37.1% |
| 3-Person Household | 19 | 8.0% |
| 4+ Person Household | 61 | 25.7% |
| Total Housing Units | 237 | 100.0% |
Occupancy by Ownership by Household Size in Clearview
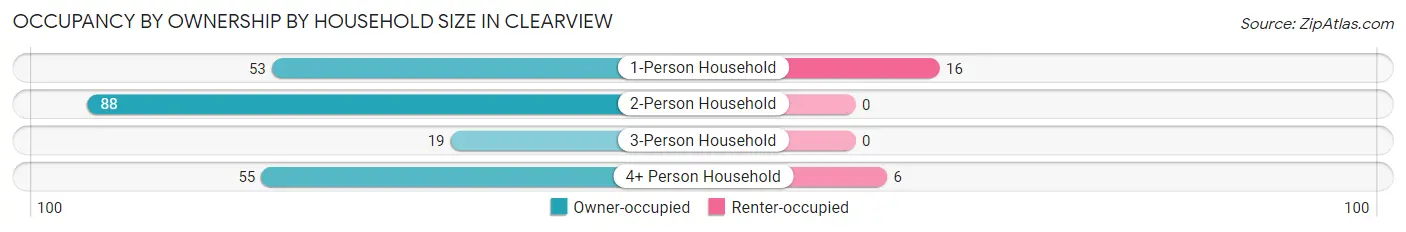
| Household Size | Owner-occupied | Renter-occupied |
| 1-Person Household | 53 (76.8%) | 16 (23.2%) |
| 2-Person Household | 88 (100.0%) | 0 (0.0%) |
| 3-Person Household | 19 (100.0%) | 0 (0.0%) |
| 4+ Person Household | 55 (90.2%) | 6 (9.8%) |
| Total Housing Units | 215 (90.7%) | 22 (9.3%) |
Occupancy by Educational Attainment in Clearview
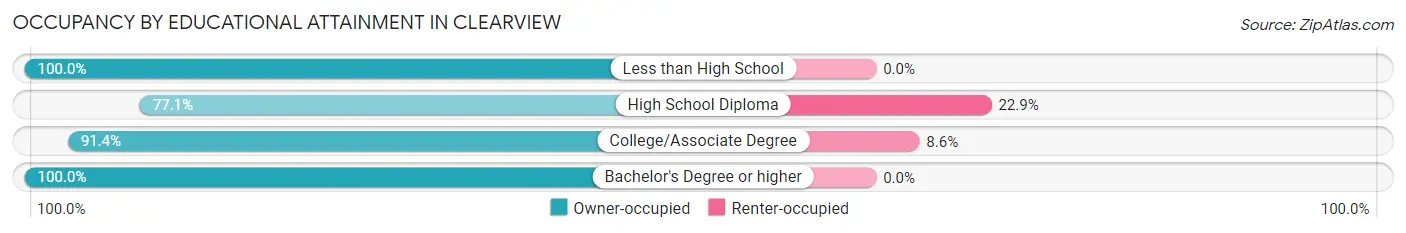
| Household Size | Owner-occupied | Renter-occupied |
| Less than High School | 4 (100.0%) | 0 (0.0%) |
| High School Diploma | 54 (77.1%) | 16 (22.9%) |
| College/Associate Degree | 64 (91.4%) | 6 (8.6%) |
| Bachelor's Degree or higher | 93 (100.0%) | 0 (0.0%) |
Occupancy by Age of Householder in Clearview
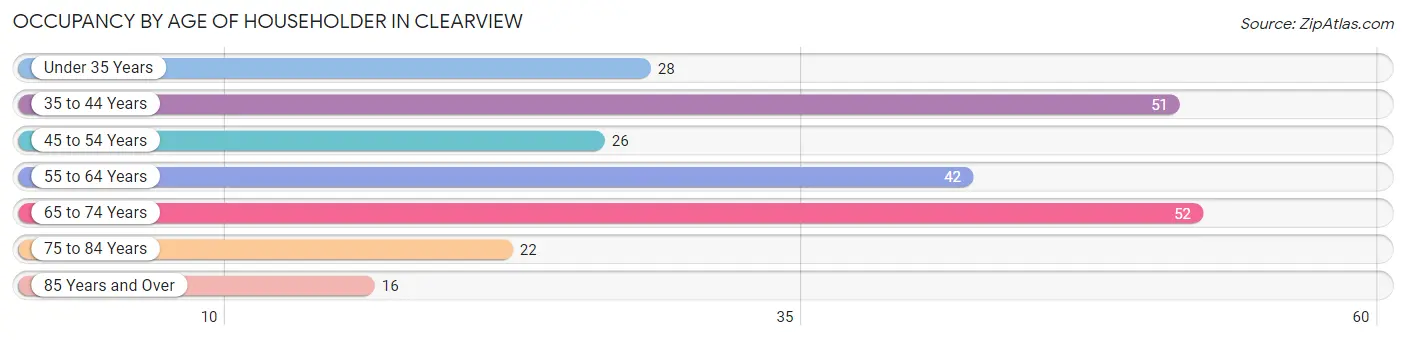
| Age Bracket | # Households | % Households |
| Under 35 Years | 28 | 11.8% |
| 35 to 44 Years | 51 | 21.5% |
| 45 to 54 Years | 26 | 11.0% |
| 55 to 64 Years | 42 | 17.7% |
| 65 to 74 Years | 52 | 21.9% |
| 75 to 84 Years | 22 | 9.3% |
| 85 Years and Over | 16 | 6.8% |
| Total | 237 | 100.0% |
Housing Finances in Clearview
Median Income by Occupancy in Clearview
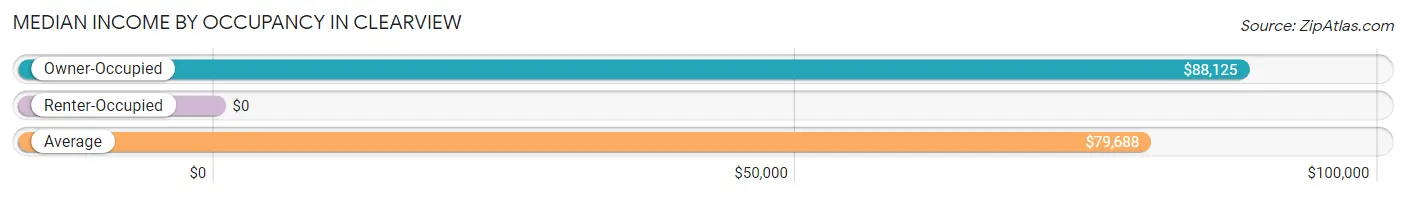
| Occupancy Type | # Households | Median Income |
| Owner-Occupied | 215 (90.7%) | $88,125 |
| Renter-Occupied | 22 (9.3%) | $0 |
| Average | 237 (100.0%) | $79,688 |
Occupancy by Householder Income Bracket in Clearview
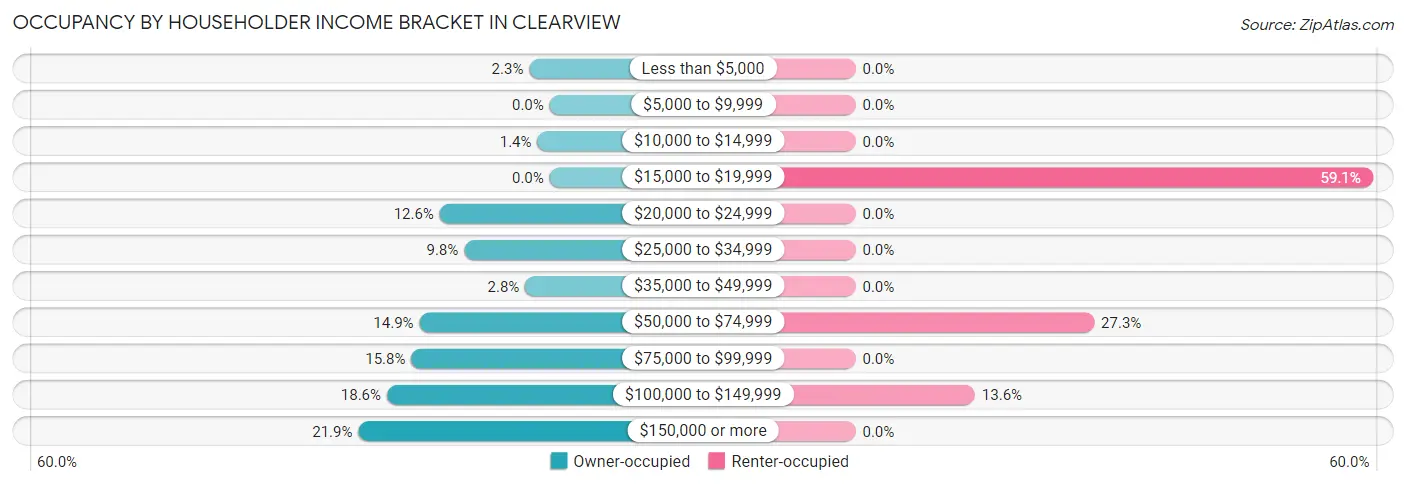
| Income Bracket | Owner-occupied | Renter-occupied |
| Less than $5,000 | 5 (2.3%) | 0 (0.0%) |
| $5,000 to $9,999 | 0 (0.0%) | 0 (0.0%) |
| $10,000 to $14,999 | 3 (1.4%) | 0 (0.0%) |
| $15,000 to $19,999 | 0 (0.0%) | 13 (59.1%) |
| $20,000 to $24,999 | 27 (12.6%) | 0 (0.0%) |
| $25,000 to $34,999 | 21 (9.8%) | 0 (0.0%) |
| $35,000 to $49,999 | 6 (2.8%) | 0 (0.0%) |
| $50,000 to $74,999 | 32 (14.9%) | 6 (27.3%) |
| $75,000 to $99,999 | 34 (15.8%) | 0 (0.0%) |
| $100,000 to $149,999 | 40 (18.6%) | 3 (13.6%) |
| $150,000 or more | 47 (21.9%) | 0 (0.0%) |
| Total | 215 (100.0%) | 22 (100.0%) |
Monthly Housing Cost Tiers in Clearview
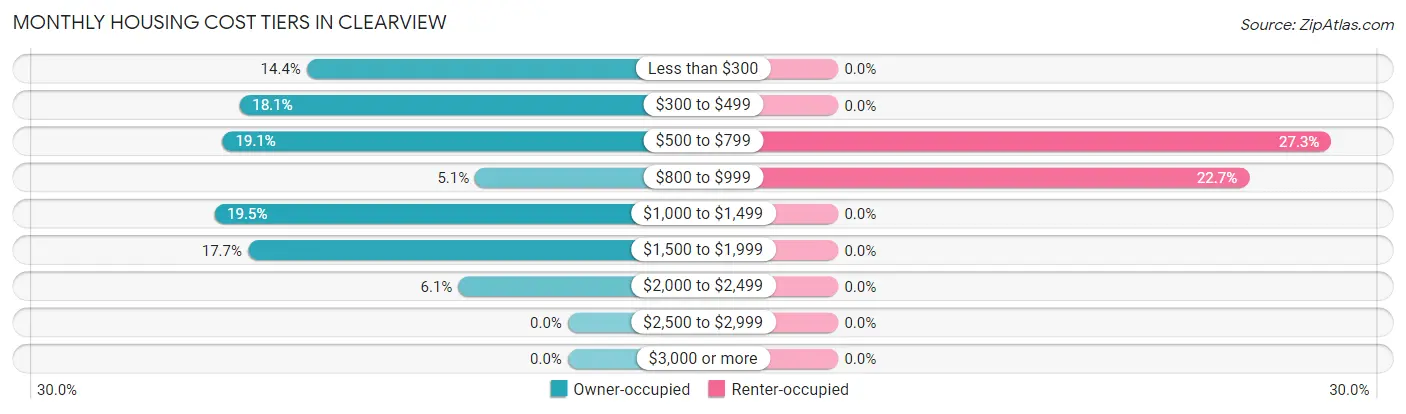
| Monthly Cost | Owner-occupied | Renter-occupied |
| Less than $300 | 31 (14.4%) | 0 (0.0%) |
| $300 to $499 | 39 (18.1%) | 0 (0.0%) |
| $500 to $799 | 41 (19.1%) | 6 (27.3%) |
| $800 to $999 | 11 (5.1%) | 5 (22.7%) |
| $1,000 to $1,499 | 42 (19.5%) | 0 (0.0%) |
| $1,500 to $1,999 | 38 (17.7%) | 0 (0.0%) |
| $2,000 to $2,499 | 13 (6.0%) | 0 (0.0%) |
| $2,500 to $2,999 | 0 (0.0%) | 0 (0.0%) |
| $3,000 or more | 0 (0.0%) | 0 (0.0%) |
| Total | 215 (100.0%) | 22 (100.0%) |
Physical Housing Characteristics in Clearview
Housing Structures in Clearview
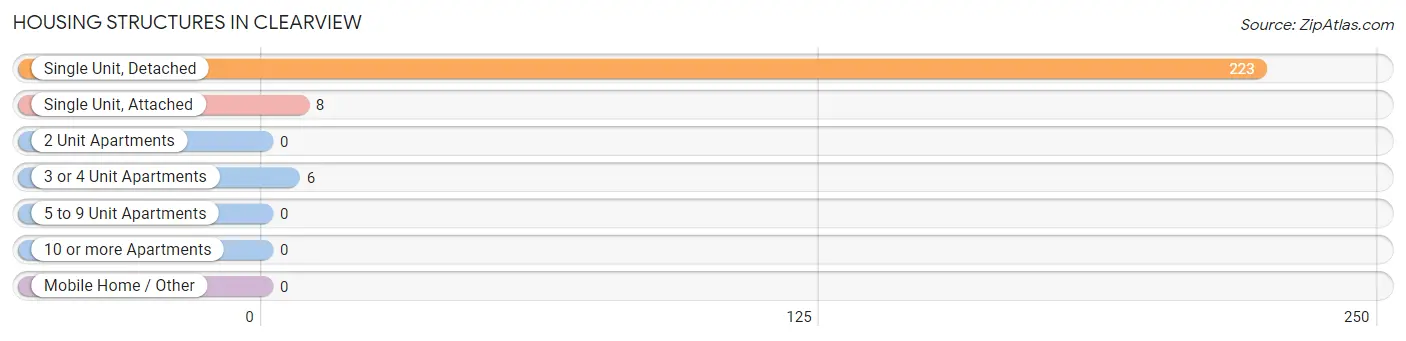
| Structure Type | # Housing Units | % Housing Units |
| Single Unit, Detached | 223 | 94.1% |
| Single Unit, Attached | 8 | 3.4% |
| 2 Unit Apartments | 0 | 0.0% |
| 3 or 4 Unit Apartments | 6 | 2.5% |
| 5 to 9 Unit Apartments | 0 | 0.0% |
| 10 or more Apartments | 0 | 0.0% |
| Mobile Home / Other | 0 | 0.0% |
| Total | 237 | 100.0% |
Housing Structures by Occupancy in Clearview
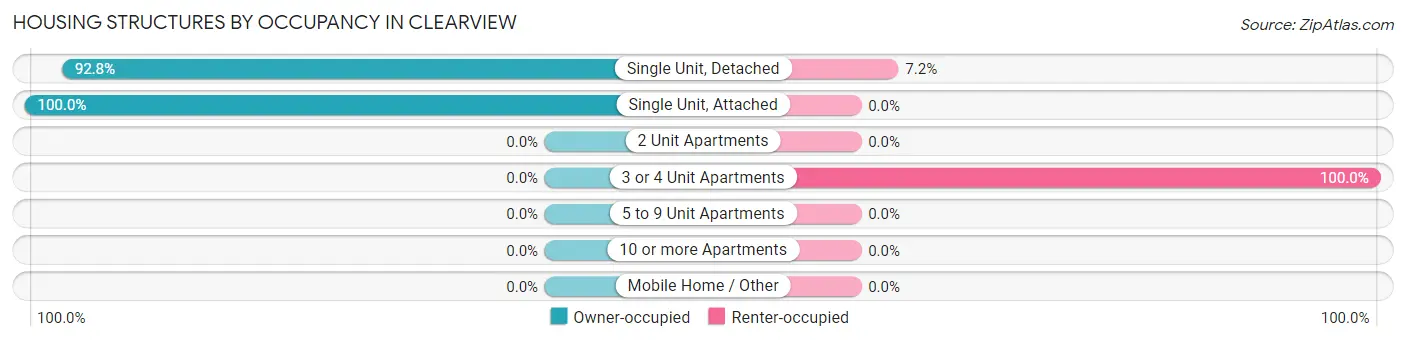
| Structure Type | Owner-occupied | Renter-occupied |
| Single Unit, Detached | 207 (92.8%) | 16 (7.2%) |
| Single Unit, Attached | 8 (100.0%) | 0 (0.0%) |
| 2 Unit Apartments | 0 (0.0%) | 0 (0.0%) |
| 3 or 4 Unit Apartments | 0 (0.0%) | 6 (100.0%) |
| 5 to 9 Unit Apartments | 0 (0.0%) | 0 (0.0%) |
| 10 or more Apartments | 0 (0.0%) | 0 (0.0%) |
| Mobile Home / Other | 0 (0.0%) | 0 (0.0%) |
| Total | 215 (90.7%) | 22 (9.3%) |
Housing Structures by Number of Rooms in Clearview
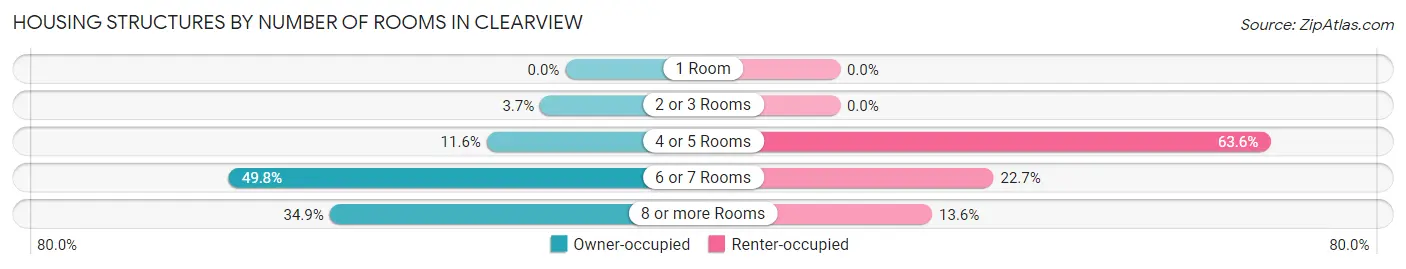
| Number of Rooms | Owner-occupied | Renter-occupied |
| 1 Room | 0 (0.0%) | 0 (0.0%) |
| 2 or 3 Rooms | 8 (3.7%) | 0 (0.0%) |
| 4 or 5 Rooms | 25 (11.6%) | 14 (63.6%) |
| 6 or 7 Rooms | 107 (49.8%) | 5 (22.7%) |
| 8 or more Rooms | 75 (34.9%) | 3 (13.6%) |
| Total | 215 (100.0%) | 22 (100.0%) |
Housing Structure by Heating Type in Clearview
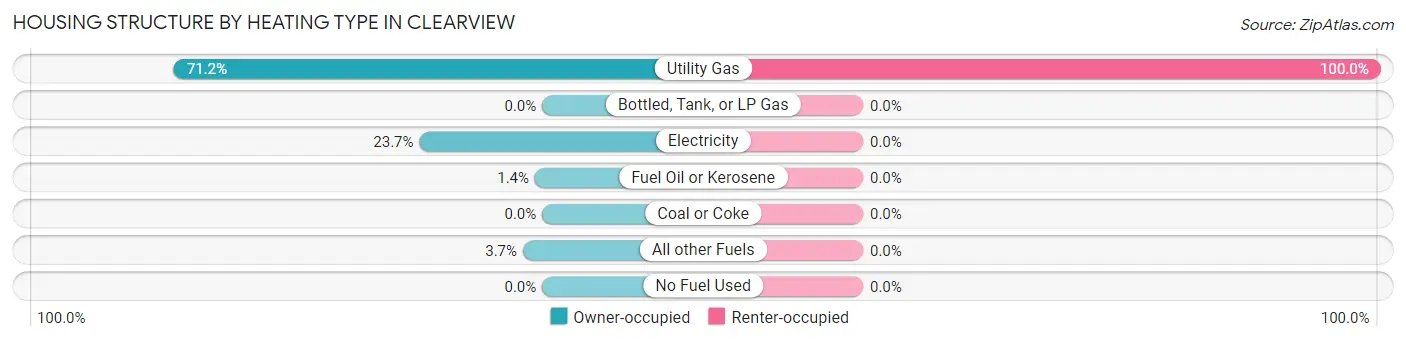
| Heating Type | Owner-occupied | Renter-occupied |
| Utility Gas | 153 (71.2%) | 22 (100.0%) |
| Bottled, Tank, or LP Gas | 0 (0.0%) | 0 (0.0%) |
| Electricity | 51 (23.7%) | 0 (0.0%) |
| Fuel Oil or Kerosene | 3 (1.4%) | 0 (0.0%) |
| Coal or Coke | 0 (0.0%) | 0 (0.0%) |
| All other Fuels | 8 (3.7%) | 0 (0.0%) |
| No Fuel Used | 0 (0.0%) | 0 (0.0%) |
| Total | 215 (100.0%) | 22 (100.0%) |
Household Vehicle Usage in Clearview
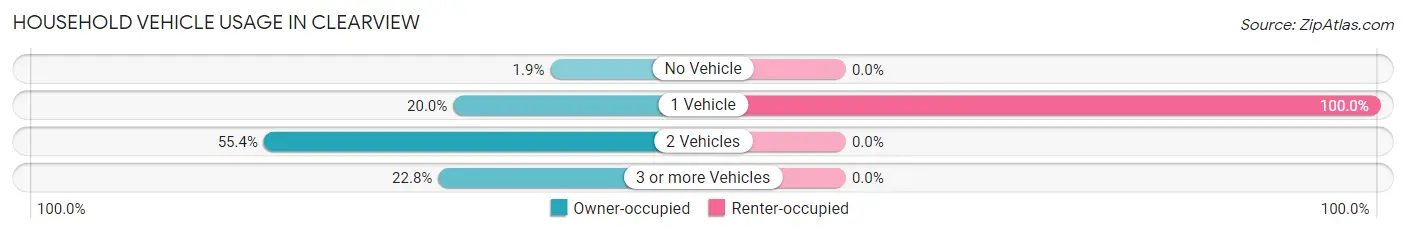
| Vehicles per Household | Owner-occupied | Renter-occupied |
| No Vehicle | 4 (1.9%) | 0 (0.0%) |
| 1 Vehicle | 43 (20.0%) | 22 (100.0%) |
| 2 Vehicles | 119 (55.3%) | 0 (0.0%) |
| 3 or more Vehicles | 49 (22.8%) | 0 (0.0%) |
| Total | 215 (100.0%) | 22 (100.0%) |
Real Estate & Mortgages in Clearview
Real Estate and Mortgage Overview in Clearview
| Characteristic | Without Mortgage | With Mortgage |
| Housing Units | 106 | 109 |
| Median Property Value | $175,000 | $227,200 |
| Median Household Income | $65,000 | $32 |
| Monthly Housing Costs | $432 | $0 |
| Real Estate Taxes | $1,080 | $1 |
Property Value by Mortgage Status in Clearview
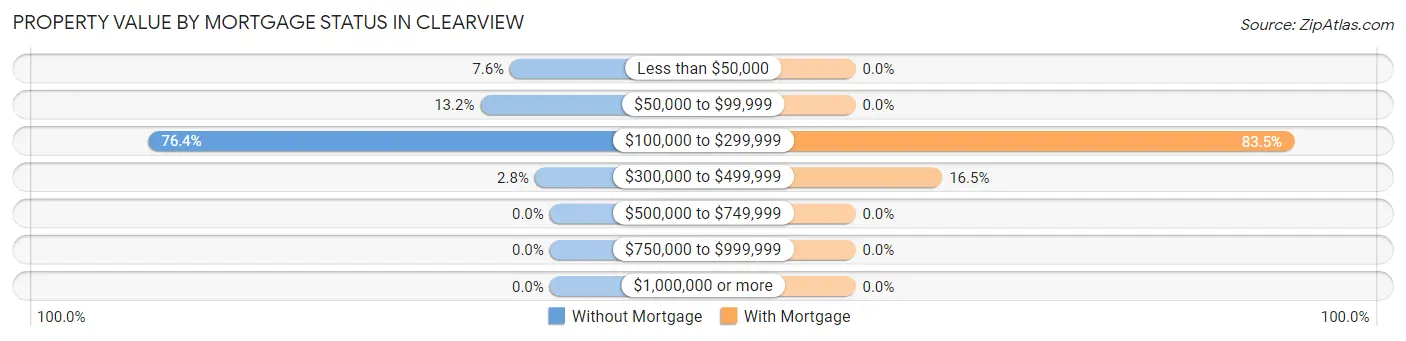
| Property Value | Without Mortgage | With Mortgage |
| Less than $50,000 | 8 (7.5%) | 0 (0.0%) |
| $50,000 to $99,999 | 14 (13.2%) | 0 (0.0%) |
| $100,000 to $299,999 | 81 (76.4%) | 91 (83.5%) |
| $300,000 to $499,999 | 3 (2.8%) | 18 (16.5%) |
| $500,000 to $749,999 | 0 (0.0%) | 0 (0.0%) |
| $750,000 to $999,999 | 0 (0.0%) | 0 (0.0%) |
| $1,000,000 or more | 0 (0.0%) | 0 (0.0%) |
| Total | 106 (100.0%) | 109 (100.0%) |
Household Income by Mortgage Status in Clearview
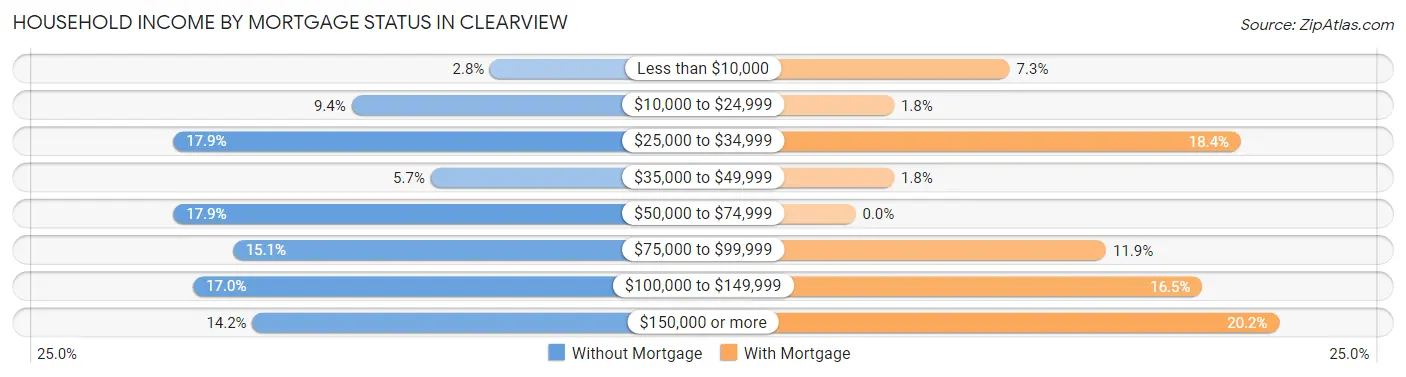
| Household Income | Without Mortgage | With Mortgage |
| Less than $10,000 | 3 (2.8%) | 8 (7.3%) |
| $10,000 to $24,999 | 10 (9.4%) | 2 (1.8%) |
| $25,000 to $34,999 | 19 (17.9%) | 20 (18.3%) |
| $35,000 to $49,999 | 6 (5.7%) | 2 (1.8%) |
| $50,000 to $74,999 | 19 (17.9%) | 0 (0.0%) |
| $75,000 to $99,999 | 16 (15.1%) | 13 (11.9%) |
| $100,000 to $149,999 | 18 (17.0%) | 18 (16.5%) |
| $150,000 or more | 15 (14.1%) | 22 (20.2%) |
| Total | 106 (100.0%) | 109 (100.0%) |
Property Value to Household Income Ratio in Clearview
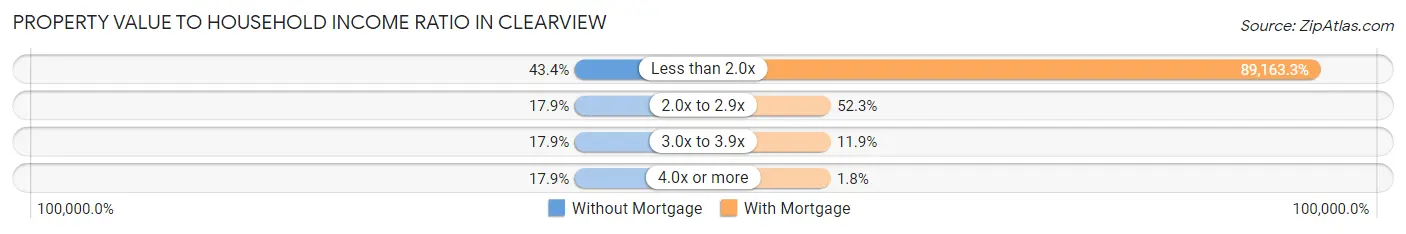
| Value-to-Income Ratio | Without Mortgage | With Mortgage |
| Less than 2.0x | 46 (43.4%) | 97,188 (89,163.3%) |
| 2.0x to 2.9x | 19 (17.9%) | 57 (52.3%) |
| 3.0x to 3.9x | 19 (17.9%) | 13 (11.9%) |
| 4.0x or more | 19 (17.9%) | 2 (1.8%) |
| Total | 106 (100.0%) | 109 (100.0%) |
Real Estate Taxes by Mortgage Status in Clearview
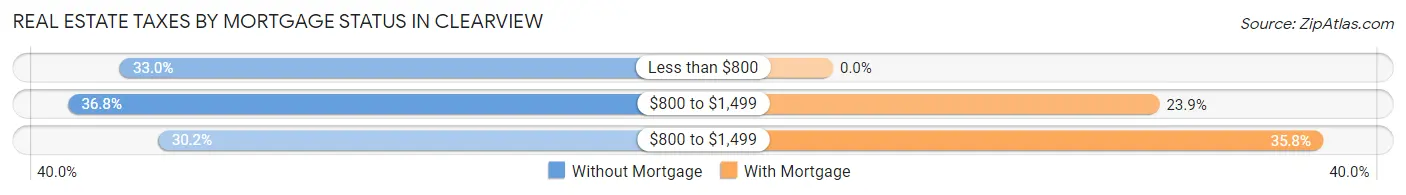
| Property Taxes | Without Mortgage | With Mortgage |
| Less than $800 | 35 (33.0%) | 0 (0.0%) |
| $800 to $1,499 | 39 (36.8%) | 26 (23.8%) |
| $800 to $1,499 | 32 (30.2%) | 39 (35.8%) |
| Total | 106 (100.0%) | 109 (100.0%) |
Health & Disability in Clearview
Health Insurance Coverage by Age in Clearview
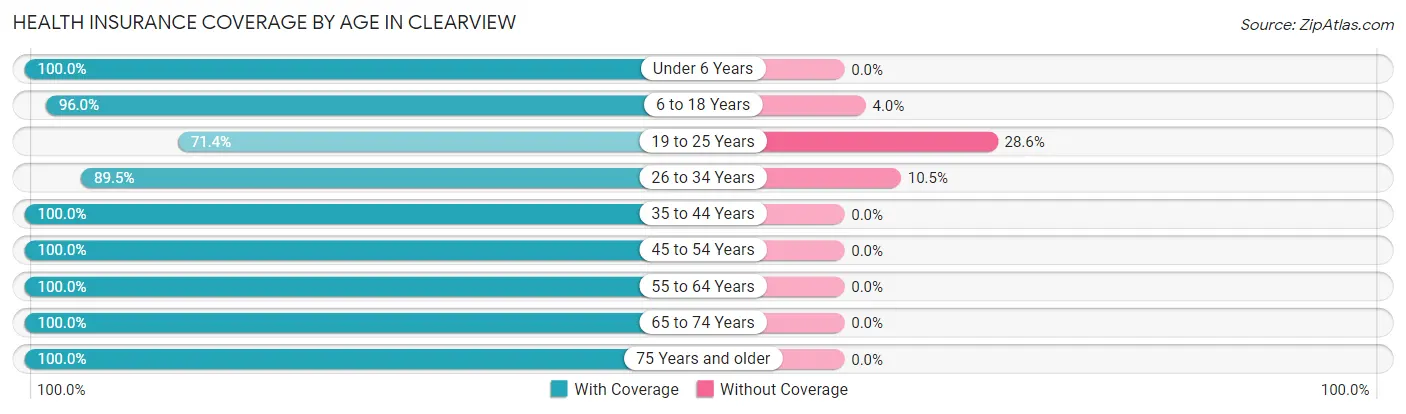
| Age Bracket | With Coverage | Without Coverage |
| Under 6 Years | 47 (100.0%) | 0 (0.0%) |
| 6 to 18 Years | 97 (96.0%) | 4 (4.0%) |
| 19 to 25 Years | 20 (71.4%) | 8 (28.6%) |
| 26 to 34 Years | 51 (89.5%) | 6 (10.5%) |
| 35 to 44 Years | 105 (100.0%) | 0 (0.0%) |
| 45 to 54 Years | 54 (100.0%) | 0 (0.0%) |
| 55 to 64 Years | 72 (100.0%) | 0 (0.0%) |
| 65 to 74 Years | 84 (100.0%) | 0 (0.0%) |
| 75 Years and older | 44 (100.0%) | 0 (0.0%) |
| Total | 574 (97.0%) | 18 (3.0%) |
Health Insurance Coverage by Citizenship Status in Clearview
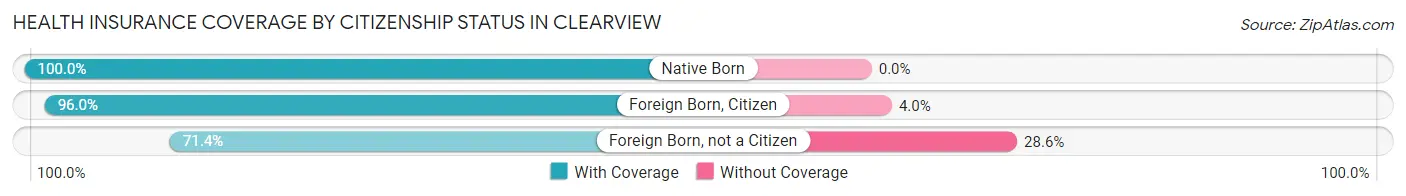
| Citizenship Status | With Coverage | Without Coverage |
| Native Born | 47 (100.0%) | 0 (0.0%) |
| Foreign Born, Citizen | 97 (96.0%) | 4 (4.0%) |
| Foreign Born, not a Citizen | 20 (71.4%) | 8 (28.6%) |
Health Insurance Coverage by Household Income in Clearview
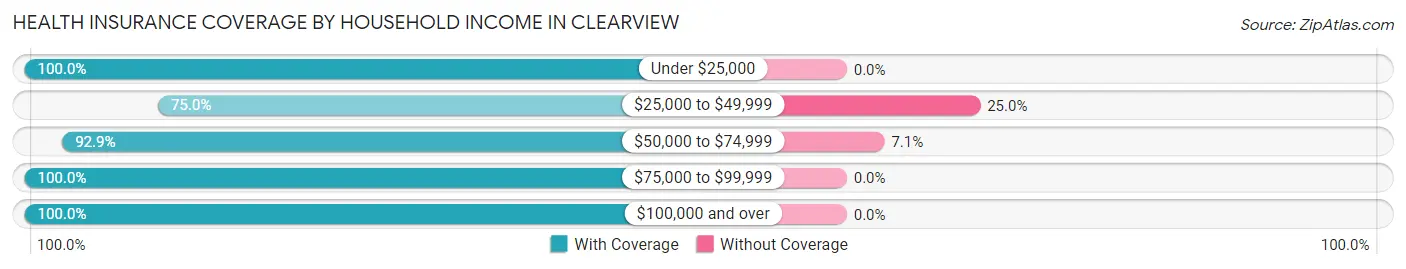
| Household Income | With Coverage | Without Coverage |
| Under $25,000 | 73 (100.0%) | 0 (0.0%) |
| $25,000 to $49,999 | 36 (75.0%) | 12 (25.0%) |
| $50,000 to $74,999 | 79 (92.9%) | 6 (7.1%) |
| $75,000 to $99,999 | 57 (100.0%) | 0 (0.0%) |
| $100,000 and over | 329 (100.0%) | 0 (0.0%) |
Public vs Private Health Insurance Coverage by Age in Clearview
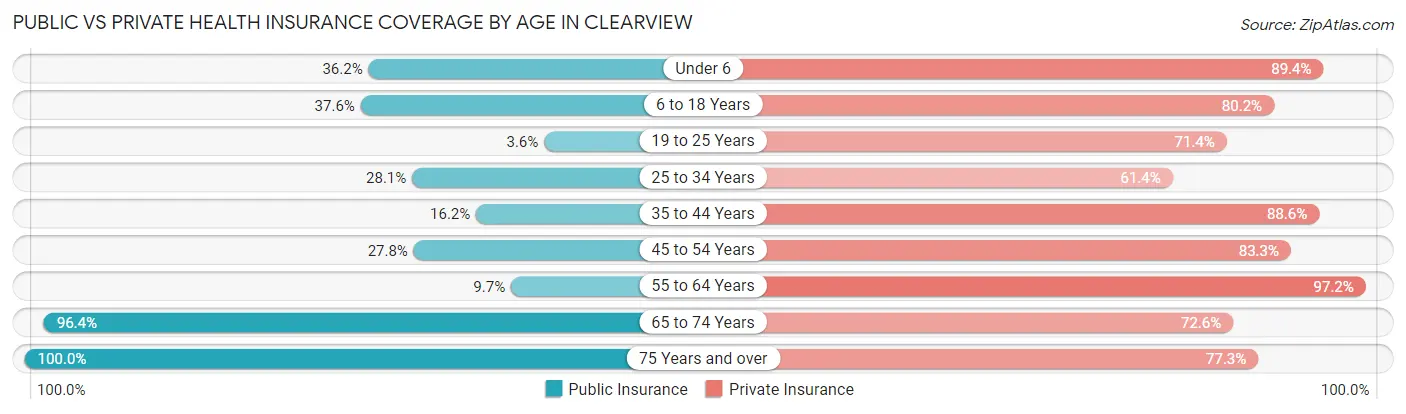
| Age Bracket | Public Insurance | Private Insurance |
| Under 6 | 17 (36.2%) | 42 (89.4%) |
| 6 to 18 Years | 38 (37.6%) | 81 (80.2%) |
| 19 to 25 Years | 1 (3.6%) | 20 (71.4%) |
| 25 to 34 Years | 16 (28.1%) | 35 (61.4%) |
| 35 to 44 Years | 17 (16.2%) | 93 (88.6%) |
| 45 to 54 Years | 15 (27.8%) | 45 (83.3%) |
| 55 to 64 Years | 7 (9.7%) | 70 (97.2%) |
| 65 to 74 Years | 81 (96.4%) | 61 (72.6%) |
| 75 Years and over | 44 (100.0%) | 34 (77.3%) |
| Total | 236 (39.9%) | 481 (81.2%) |
Disability Status by Sex by Age in Clearview
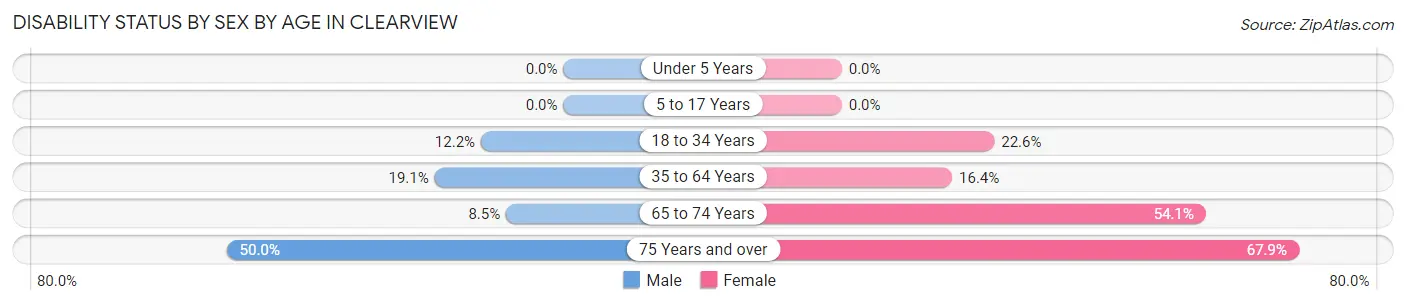
| Age Bracket | Male | Female |
| Under 5 Years | 0 (0.0%) | 0 (0.0%) |
| 5 to 17 Years | 0 (0.0%) | 0 (0.0%) |
| 18 to 34 Years | 6 (12.2%) | 12 (22.6%) |
| 35 to 64 Years | 22 (19.1%) | 19 (16.4%) |
| 65 to 74 Years | 4 (8.5%) | 20 (54.0%) |
| 75 Years and over | 8 (50.0%) | 19 (67.9%) |
Disability Class by Sex by Age in Clearview
Disability Class: Hearing Difficulty
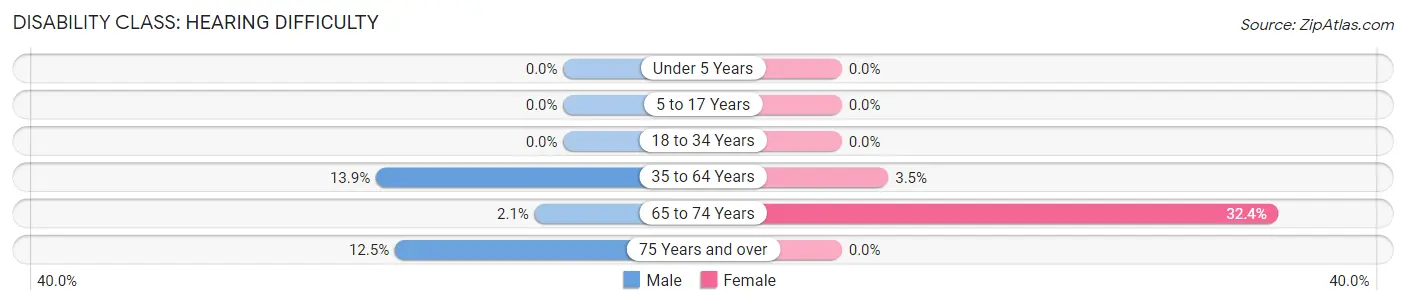
| Age Bracket | Male | Female |
| Under 5 Years | 0 (0.0%) | 0 (0.0%) |
| 5 to 17 Years | 0 (0.0%) | 0 (0.0%) |
| 18 to 34 Years | 0 (0.0%) | 0 (0.0%) |
| 35 to 64 Years | 16 (13.9%) | 4 (3.5%) |
| 65 to 74 Years | 1 (2.1%) | 12 (32.4%) |
| 75 Years and over | 2 (12.5%) | 0 (0.0%) |
Disability Class: Vision Difficulty
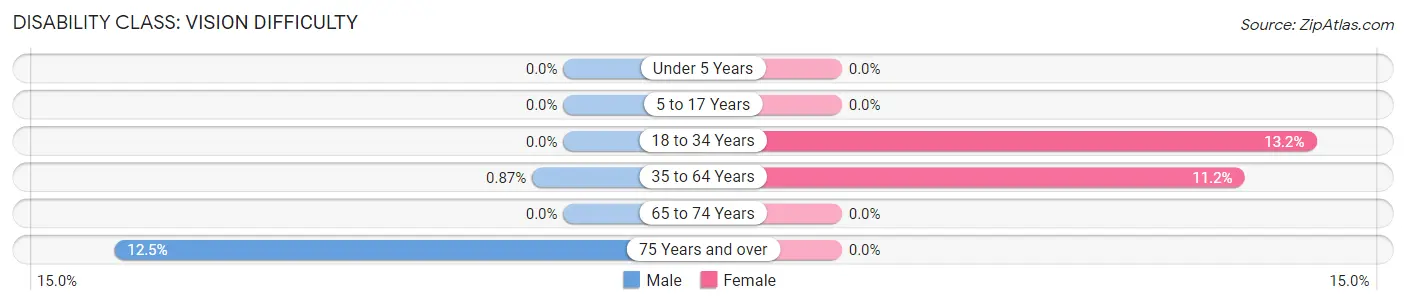
| Age Bracket | Male | Female |
| Under 5 Years | 0 (0.0%) | 0 (0.0%) |
| 5 to 17 Years | 0 (0.0%) | 0 (0.0%) |
| 18 to 34 Years | 0 (0.0%) | 7 (13.2%) |
| 35 to 64 Years | 1 (0.9%) | 13 (11.2%) |
| 65 to 74 Years | 0 (0.0%) | 0 (0.0%) |
| 75 Years and over | 2 (12.5%) | 0 (0.0%) |
Disability Class: Cognitive Difficulty
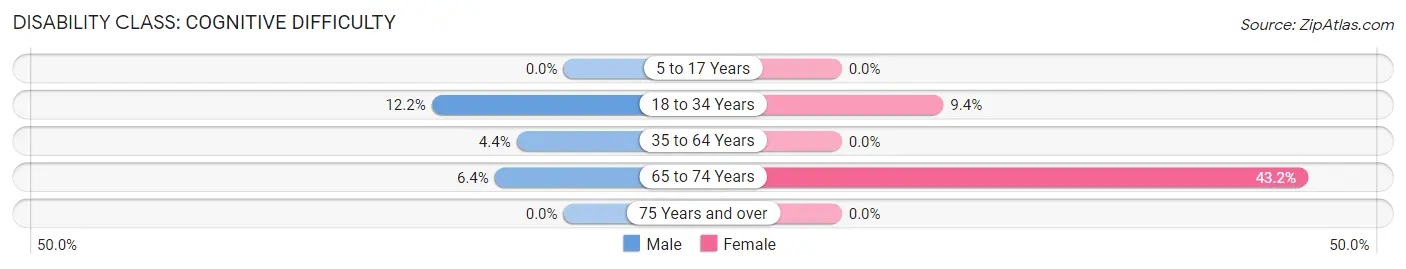
| Age Bracket | Male | Female |
| 5 to 17 Years | 0 (0.0%) | 0 (0.0%) |
| 18 to 34 Years | 6 (12.2%) | 5 (9.4%) |
| 35 to 64 Years | 5 (4.3%) | 0 (0.0%) |
| 65 to 74 Years | 3 (6.4%) | 16 (43.2%) |
| 75 Years and over | 0 (0.0%) | 0 (0.0%) |
Disability Class: Ambulatory Difficulty
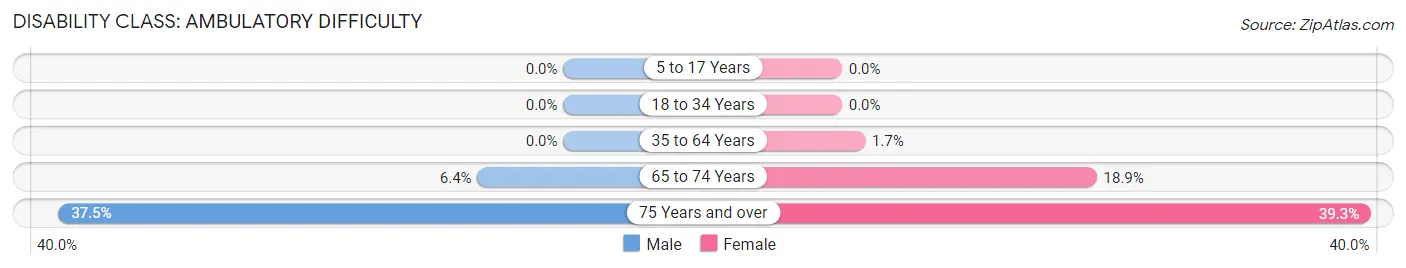
| Age Bracket | Male | Female |
| 5 to 17 Years | 0 (0.0%) | 0 (0.0%) |
| 18 to 34 Years | 0 (0.0%) | 0 (0.0%) |
| 35 to 64 Years | 0 (0.0%) | 2 (1.7%) |
| 65 to 74 Years | 3 (6.4%) | 7 (18.9%) |
| 75 Years and over | 6 (37.5%) | 11 (39.3%) |
Disability Class: Self-Care Difficulty
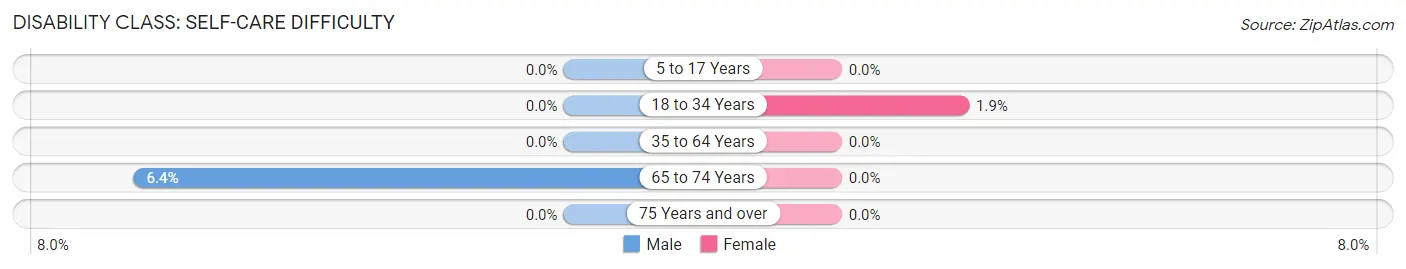
| Age Bracket | Male | Female |
| 5 to 17 Years | 0 (0.0%) | 0 (0.0%) |
| 18 to 34 Years | 0 (0.0%) | 1 (1.9%) |
| 35 to 64 Years | 0 (0.0%) | 0 (0.0%) |
| 65 to 74 Years | 3 (6.4%) | 0 (0.0%) |
| 75 Years and over | 0 (0.0%) | 0 (0.0%) |
Technology Access in Clearview
Computing Device Access in Clearview
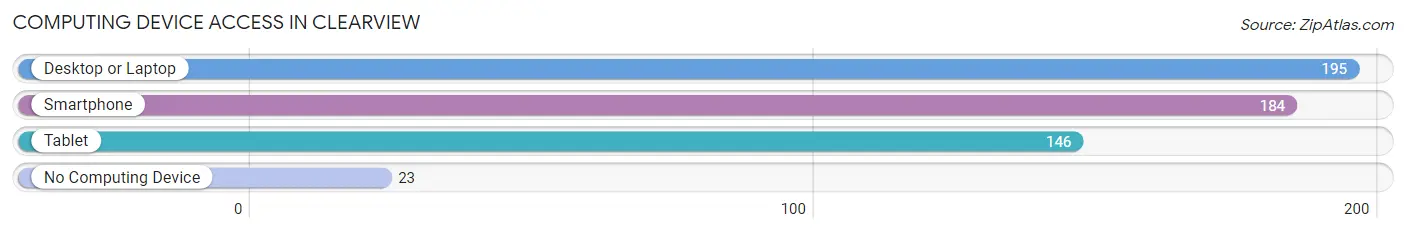
| Device Type | # Households | % Households |
| Desktop or Laptop | 195 | 82.3% |
| Smartphone | 184 | 77.6% |
| Tablet | 146 | 61.6% |
| No Computing Device | 23 | 9.7% |
| Total | 237 | 100.0% |
Internet Access in Clearview
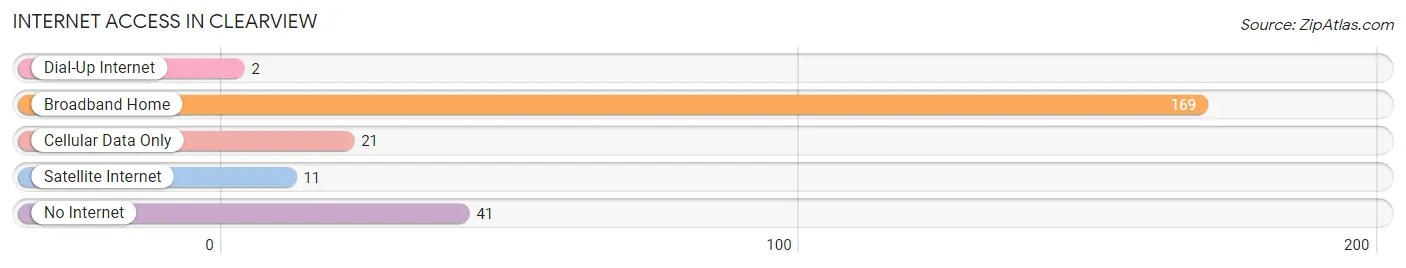
| Internet Type | # Households | % Households |
| Dial-Up Internet | 2 | 0.8% |
| Broadband Home | 169 | 71.3% |
| Cellular Data Only | 21 | 8.9% |
| Satellite Internet | 11 | 4.6% |
| No Internet | 41 | 17.3% |
| Total | 237 | 100.0% |
Clearview Summary
History
Clearview, West Virginia is a small unincorporated community located in the eastern part of the state. It is situated in the Appalachian Mountains, and is part of the larger region known as the Potomac Highlands. The area was first settled in the late 1700s by settlers from Pennsylvania and Virginia. The town was originally known as “Clearview Station”, and was a stop on the Baltimore and Ohio Railroad. The town was officially incorporated in 1891, and the name was changed to Clearview.
Clearview has a rich history of coal mining and timber production. The town was home to several coal mines, and the timber industry was a major employer in the area. The town was also home to several sawmills, which provided lumber for the local economy. The town was also home to several churches, including the Clearview Methodist Church, which was founded in 1891.
The town was also home to several schools, including the Clearview High School, which was established in 1891. The school was closed in the late 1960s, and the building is now used as a community center.
Geography
Clearview is located in the eastern part of West Virginia, in the Appalachian Mountains. The town is situated in the Potomac Highlands region, and is surrounded by the Monongahela National Forest. The town is located at an elevation of 1,890 feet, and is approximately 25 miles from the state capital of Charleston.
The town is located in a rural area, and is surrounded by rolling hills and forests. The town is located near several rivers, including the Potomac River, the Shenandoah River, and the Monongahela River. The town is also located near several state parks, including the Monongahela National Forest, the George Washington National Forest, and the Dolly Sods Wilderness Area.
Economy
The economy of Clearview is largely based on agriculture and tourism. The town is home to several farms, which produce a variety of crops, including corn, soybeans, and hay. The town is also home to several wineries, which produce a variety of wines.
The town is also home to several small businesses, including restaurants, shops, and lodging. The town is also home to several bed and breakfasts, which cater to tourists visiting the area.
Demographics
As of the 2010 census, the population of Clearview was 1,890. The town is predominantly white, with 95.3% of the population identifying as white. The town is also home to a small African American population, with 2.2% of the population identifying as African American. The town is also home to a small Hispanic population, with 1.2% of the population identifying as Hispanic or Latino.
The median household income in Clearview is $37,500, and the median home value is $90,000. The town has a poverty rate of 16.3%, and the unemployment rate is 5.3%. The town is served by the Clearview Public Schools, which includes one elementary school, one middle school, and one high school.
Common Questions
What is the Total Population of Clearview?
Total Population of Clearview is 592.
What is the Total Male Population of Clearview?
Total Male Population of Clearview is 305.
What is the Total Female Population of Clearview?
Total Female Population of Clearview is 287.
What is the Ratio of Males per 100 Females in Clearview?
There are 106.27 Males per 100 Females in Clearview.
What is the Ratio of Females per 100 Males in Clearview?
There are 94.10 Females per 100 Males in Clearview.
What is the Median Population Age in Clearview?
Median Population Age in Clearview is 39.4 Years.
What is the Average Family Size in Clearview
Average Family Size in Clearview is 3.1 People.
What is the Average Household Size in Clearview
Average Household Size in Clearview is 2.5 People.
What is Per Capita Income in Clearview?
Per Capita income in Clearview is $39,252.
What is the Median Family Income in Clearview?
Median Family Income in Clearview is $101,250.
What is the Median Household income in Clearview?
Median Household Income in Clearview is $79,688.
What is Income or Wage Gap in Clearview?
Income or Wage Gap in Clearview is 45.8%.
Women in Clearview earn 54.2 cents for every dollar earned by a man.
What is Inequality or Gini Index in Clearview?
Inequality or Gini Index in Clearview is 0.42.
How Large is the Labor Force in Clearview?
There are 307 People in the Labor Forcein in Clearview.
What is the Percentage of People in the Labor Force in Clearview?
65.2% of People are in the Labor Force in Clearview.
What is the Unemployment Rate in Clearview?
Unemployment Rate in Clearview is 2.3%.