New Haven, WV
New Haven Map
New Haven Overview
1,761
TOTAL POPULATION
746
MALE POPULATION
1,015
FEMALE POPULATION
73.50
MALES / 100 FEMALES
136.06
FEMALES / 100 MALES
48.3
MEDIAN AGE
3.3
AVG FAMILY SIZE
2.5
AVG HOUSEHOLD SIZE
$46,248
PER CAPITA INCOME
$83,966
AVG FAMILY INCOME
$58,533
AVG HOUSEHOLD INCOME
34.1%
WAGE / INCOME GAP [ % ]
65.9¢/ $1
WAGE / INCOME GAP [ $ ]
0.59
INEQUALITY / GINI INDEX
840
LABOR FORCE [ PEOPLE ]
54.3%
PERCENT IN LABOR FORCE
4.4%
UNEMPLOYMENT RATE
New Haven Zip Codes
New Haven Area Codes
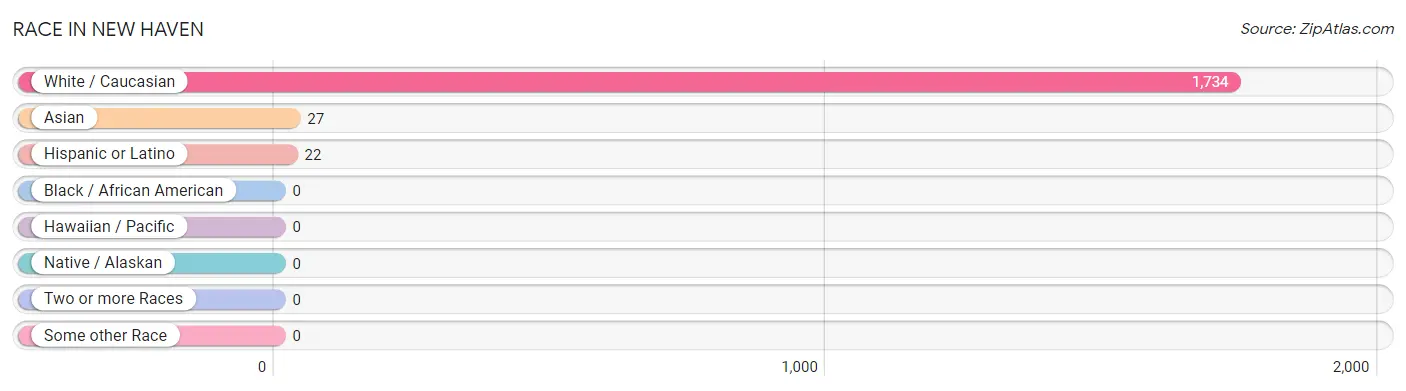
Race in New Haven
The most populous races in New Haven are White / Caucasian (1,734 | 98.5%), Asian (27 | 1.5%), and Hispanic or Latino (22 | 1.3%).
| Race | # Population | % Population |
| Asian | 27 | 1.5% |
| Black / African American | 0 | 0.0% |
| Hawaiian / Pacific | 0 | 0.0% |
| Hispanic or Latino | 22 | 1.3% |
| Native / Alaskan | 0 | 0.0% |
| White / Caucasian | 1,734 | 98.5% |
| Two or more Races | 0 | 0.0% |
| Some other Race | 0 | 0.0% |
| Total | 1,761 | 100.0% |
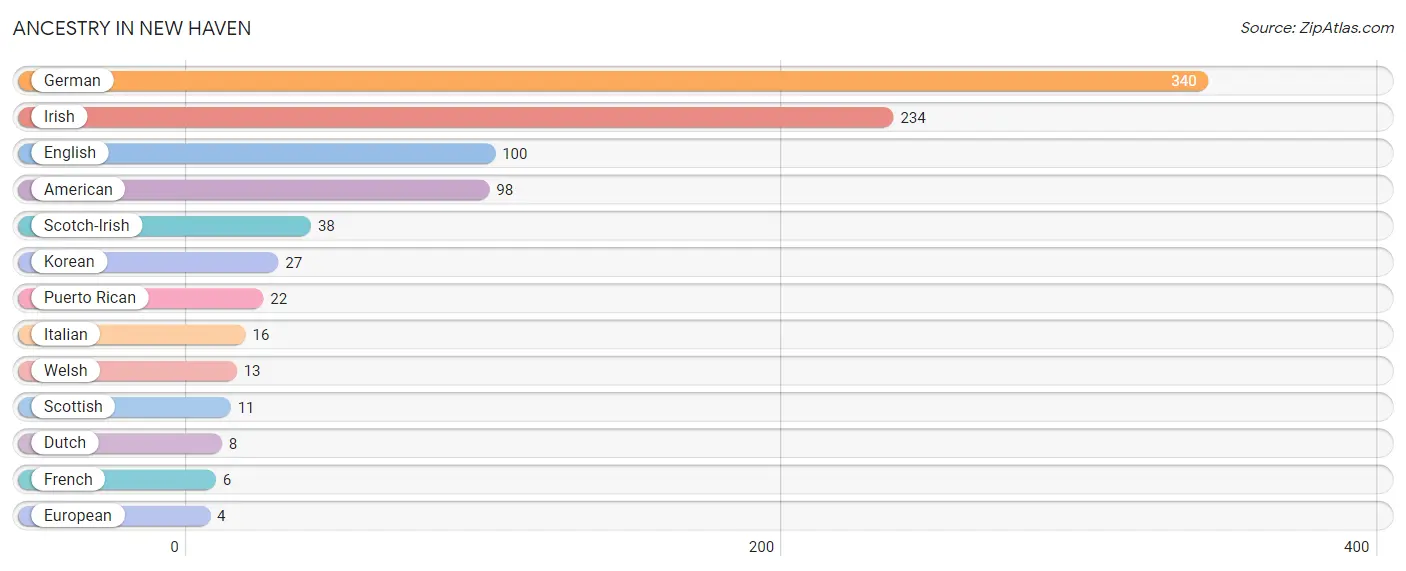
Ancestry in New Haven
The most populous ancestries reported in New Haven are German (340 | 19.3%), Irish (234 | 13.3%), English (100 | 5.7%), American (98 | 5.6%), and Scotch-Irish (38 | 2.2%), together accounting for 46.0% of all New Haven residents.
| Ancestry | # Population | % Population |
| American | 98 | 5.6% |
| Dutch | 8 | 0.4% |
| English | 100 | 5.7% |
| European | 4 | 0.2% |
| French | 6 | 0.3% |
| German | 340 | 19.3% |
| Irish | 234 | 13.3% |
| Italian | 16 | 0.9% |
| Korean | 27 | 1.5% |
| Puerto Rican | 22 | 1.3% |
| Scotch-Irish | 38 | 2.2% |
| Scottish | 11 | 0.6% |
| Welsh | 13 | 0.7% | View All 13 Rows |
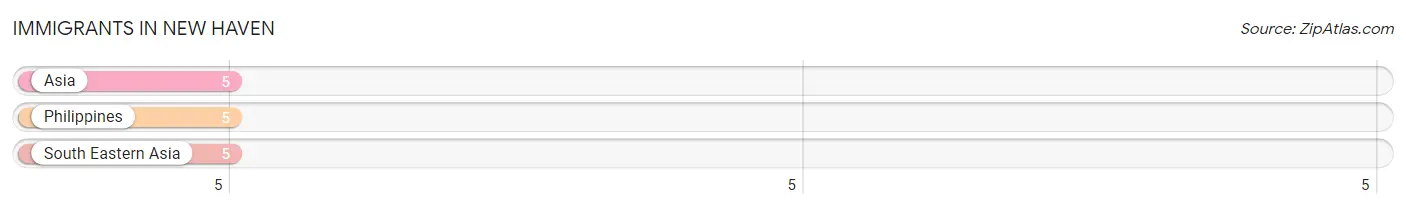
Immigrants in New Haven
The most numerous immigrant groups reported in New Haven came from Asia (5 | 0.3%), Philippines (5 | 0.3%), and South Eastern Asia (5 | 0.3%), together accounting for 0.8% of all New Haven residents.
| Immigration Origin | # Population | % Population |
| Asia | 5 | 0.3% |
| Philippines | 5 | 0.3% |
| South Eastern Asia | 5 | 0.3% | View All 3 Rows |
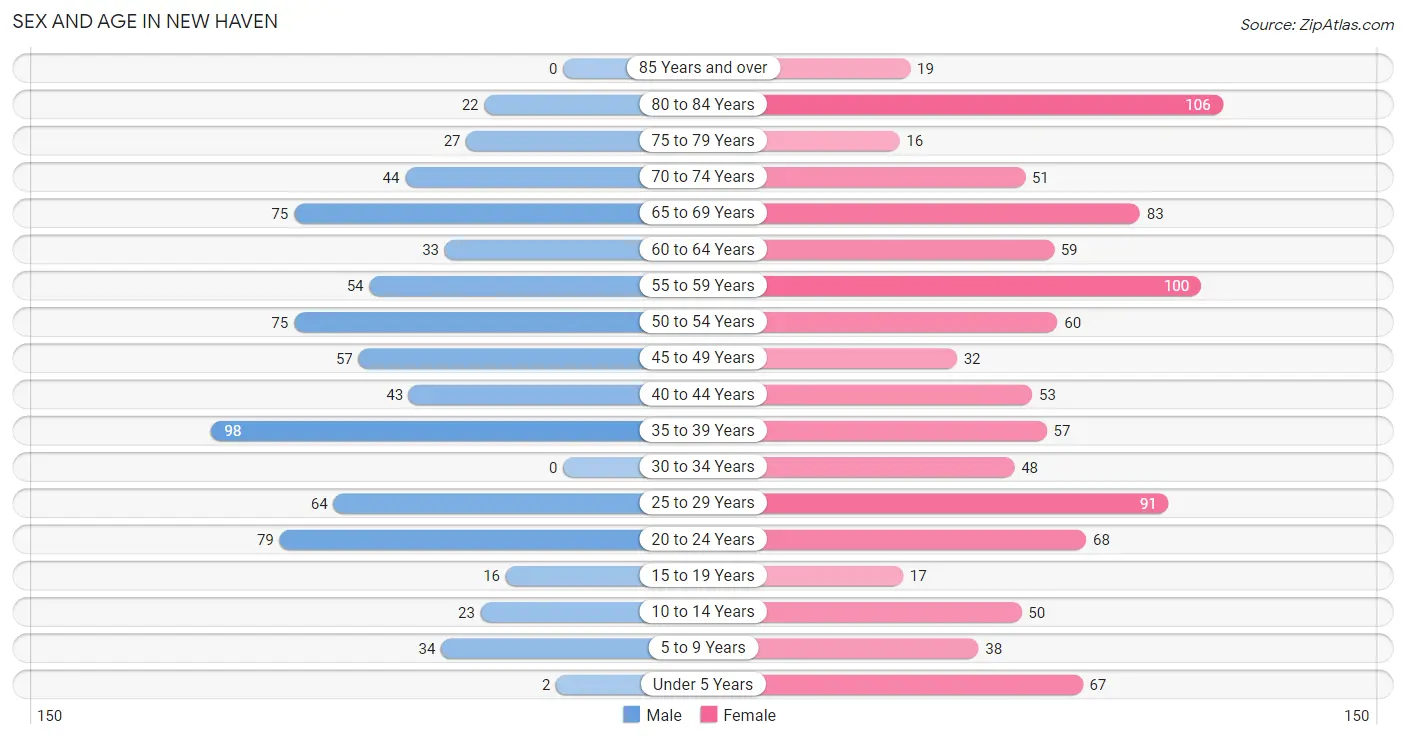
Sex and Age in New Haven
Sex and Age in New Haven
The most populous age groups in New Haven are 35 to 39 Years (98 | 13.1%) for men and 80 to 84 Years (106 | 10.4%) for women.
| Age Bracket | Male | Female |
| Under 5 Years | 2 (0.3%) | 67 (6.6%) |
| 5 to 9 Years | 34 (4.6%) | 38 (3.7%) |
| 10 to 14 Years | 23 (3.1%) | 50 (4.9%) |
| 15 to 19 Years | 16 (2.1%) | 17 (1.7%) |
| 20 to 24 Years | 79 (10.6%) | 68 (6.7%) |
| 25 to 29 Years | 64 (8.6%) | 91 (9.0%) |
| 30 to 34 Years | 0 (0.0%) | 48 (4.7%) |
| 35 to 39 Years | 98 (13.1%) | 57 (5.6%) |
| 40 to 44 Years | 43 (5.8%) | 53 (5.2%) |
| 45 to 49 Years | 57 (7.6%) | 32 (3.2%) |
| 50 to 54 Years | 75 (10.1%) | 60 (5.9%) |
| 55 to 59 Years | 54 (7.2%) | 100 (9.9%) |
| 60 to 64 Years | 33 (4.4%) | 59 (5.8%) |
| 65 to 69 Years | 75 (10.1%) | 83 (8.2%) |
| 70 to 74 Years | 44 (5.9%) | 51 (5.0%) |
| 75 to 79 Years | 27 (3.6%) | 16 (1.6%) |
| 80 to 84 Years | 22 (2.9%) | 106 (10.4%) |
| 85 Years and over | 0 (0.0%) | 19 (1.9%) |
| Total | 746 (100.0%) | 1,015 (100.0%) |
Families and Households in New Haven
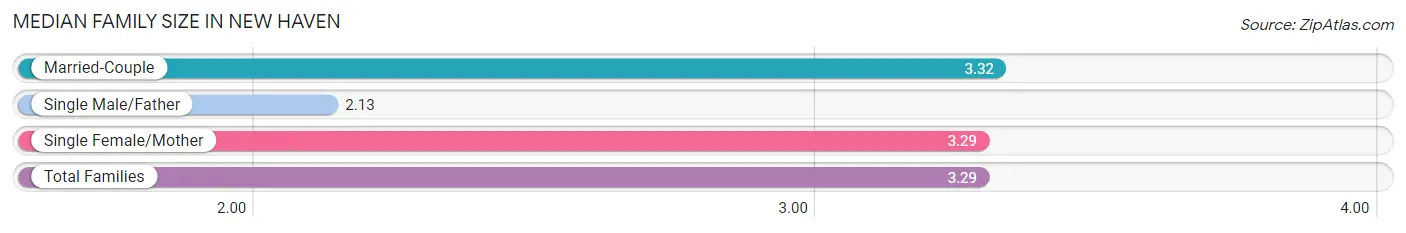
Median Family Size in New Haven
The median family size in New Haven is 3.29 persons per family, with married-couple families (306 | 71.5%) accounting for the largest median family size of 3.32 persons per family. On the other hand, single male/father families (8 | 1.9%) represent the smallest median family size with 2.13 persons per family.
| Family Type | # Families | Family Size |
| Married-Couple | 306 (71.5%) | 3.32 |
| Single Male/Father | 8 (1.9%) | 2.13 |
| Single Female/Mother | 114 (26.6%) | 3.29 |
| Total Families | 428 (100.0%) | 3.29 |
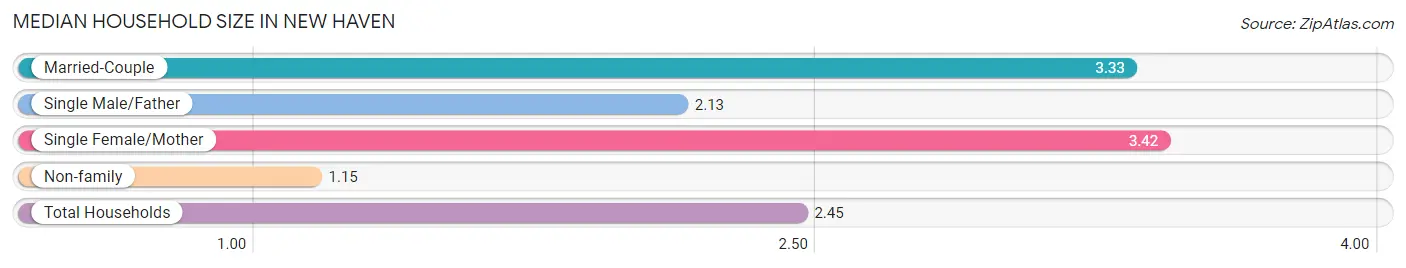
Median Household Size in New Haven
The median household size in New Haven is 2.45 persons per household, with single female/mother households (114 | 15.9%) accounting for the largest median household size of 3.42 persons per household. non-family households (291 | 40.5%) represent the smallest median household size with 1.15 persons per household.
| Household Type | # Households | Household Size |
| Married-Couple | 306 (42.6%) | 3.33 |
| Single Male/Father | 8 (1.1%) | 2.13 |
| Single Female/Mother | 114 (15.9%) | 3.42 |
| Non-family | 291 (40.5%) | 1.15 |
| Total Households | 719 (100.0%) | 2.45 |
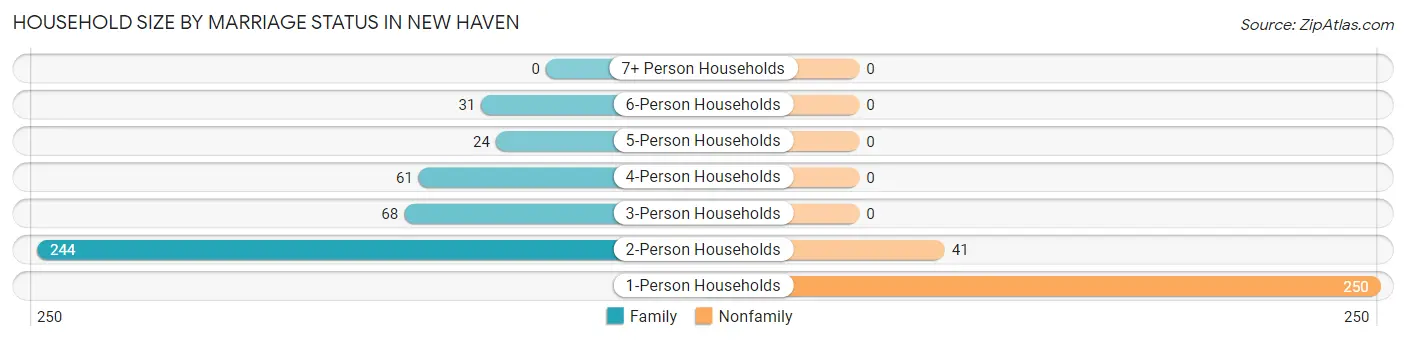
Household Size by Marriage Status in New Haven
Out of a total of 719 households in New Haven, 428 (59.5%) are family households, while 291 (40.5%) are nonfamily households. The most numerous type of family households are 2-person households, comprising 244, and the most common type of nonfamily households are 1-person households, comprising 250.
| Household Size | Family Households | Nonfamily Households |
| 1-Person Households | - | 250 (34.8%) |
| 2-Person Households | 244 (33.9%) | 41 (5.7%) |
| 3-Person Households | 68 (9.5%) | 0 (0.0%) |
| 4-Person Households | 61 (8.5%) | 0 (0.0%) |
| 5-Person Households | 24 (3.3%) | 0 (0.0%) |
| 6-Person Households | 31 (4.3%) | 0 (0.0%) |
| 7+ Person Households | 0 (0.0%) | 0 (0.0%) |
| Total | 428 (59.5%) | 291 (40.5%) |
Female Fertility in New Haven
Fertility by Age in New Haven
Average fertility rate in New Haven is 41.0 births per 1,000 women. Women in the age bracket of 20 to 34 years have the highest fertility rate with 72.0 births per 1,000 women. Women in the age bracket of 20 to 34 years acount for 100.0% of all women with births.
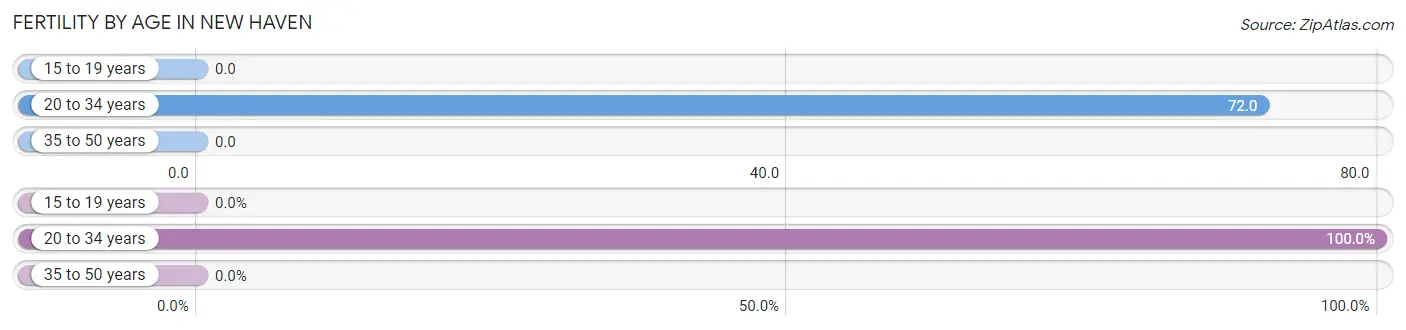
| Age Bracket | Women with Births | Births / 1,000 Women |
| 15 to 19 years | 0 (0.0%) | 0.0 |
| 20 to 34 years | 15 (100.0%) | 72.0 |
| 35 to 50 years | 0 (0.0%) | 0.0 |
| Total | 15 (100.0%) | 41.0 |
Fertility by Age by Marriage Status in New Haven
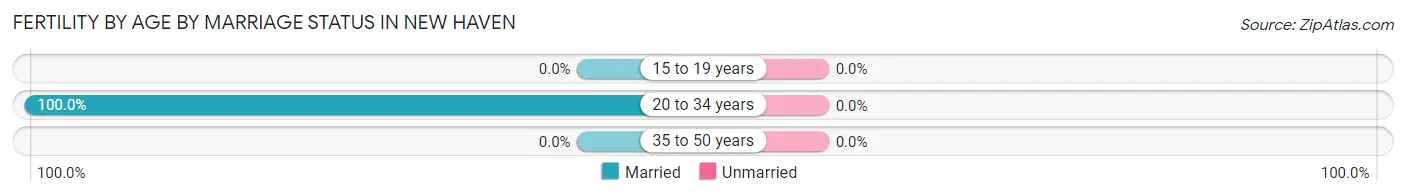
| Age Bracket | Married | Unmarried |
| 15 to 19 years | 0 (0.0%) | 0 (0.0%) |
| 20 to 34 years | 15 (100.0%) | 0 (0.0%) |
| 35 to 50 years | 0 (0.0%) | 0 (0.0%) |
| Total | 15 (100.0%) | 0 (0.0%) |
Fertility by Education in New Haven
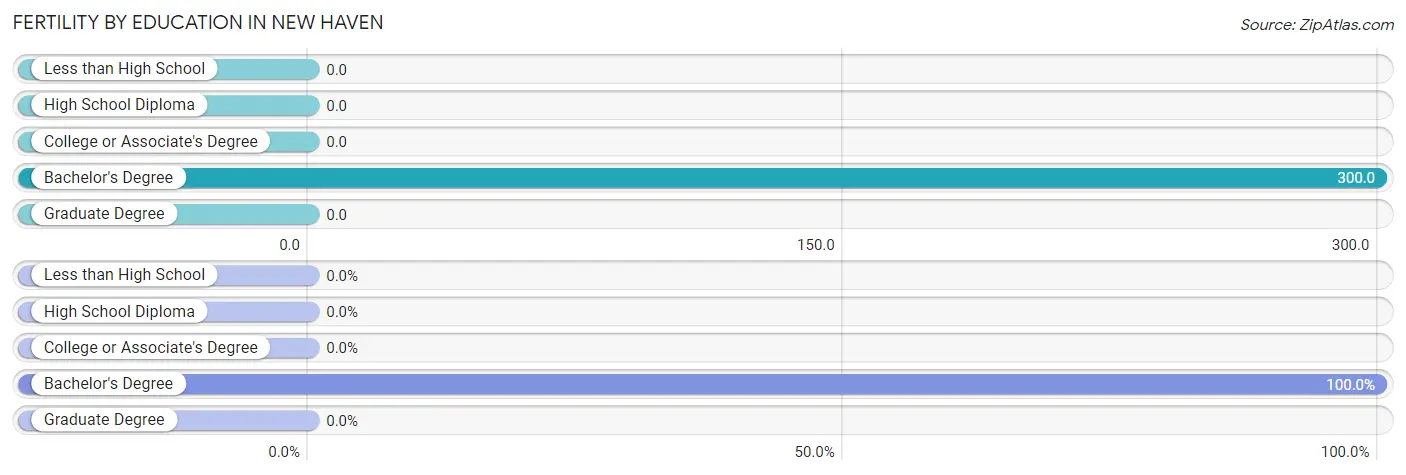
| Educational Attainment | Women with Births | Births / 1,000 Women |
| Less than High School | 0 (0.0%) | 0.0 |
| High School Diploma | 0 (0.0%) | 0.0 |
| College or Associate's Degree | 0 (0.0%) | 0.0 |
| Bachelor's Degree | 15 (100.0%) | 300.0 |
| Graduate Degree | 0 (0.0%) | 0.0 |
| Total | 15 (100.0%) | 41.0 |
Fertility by Education by Marriage Status in New Haven
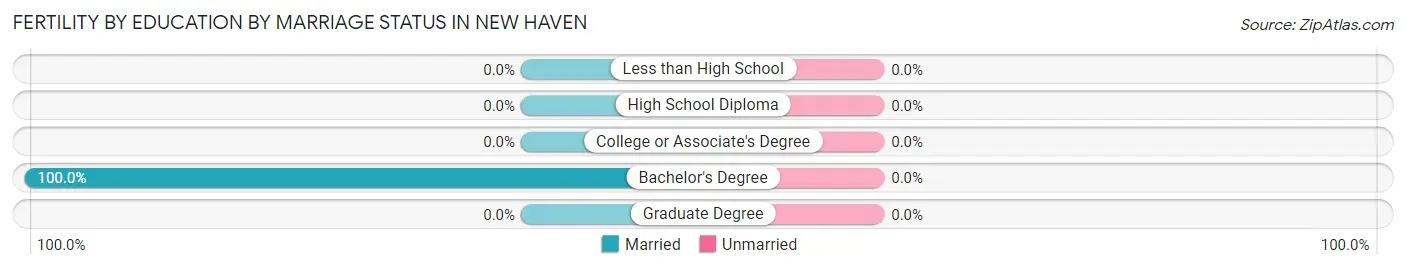
| Educational Attainment | Married | Unmarried |
| Less than High School | 0 (0.0%) | 0 (0.0%) |
| High School Diploma | 0 (0.0%) | 0 (0.0%) |
| College or Associate's Degree | 0 (0.0%) | 0 (0.0%) |
| Bachelor's Degree | 15 (100.0%) | 0 (0.0%) |
| Graduate Degree | 0 (0.0%) | 0 (0.0%) |
| Total | 15 (100.0%) | 0 (0.0%) |
Income in New Haven
Income Overview in New Haven
Per Capita Income in New Haven is $46,248, while median incomes of families and households are $83,966 and $58,533 respectively.
| Characteristic | Number | Measure |
| Per Capita Income | 1,761 | $46,248 |
| Median Family Income | 428 | $83,966 |
| Mean Family Income | 428 | $149,596 |
| Median Household Income | 719 | $58,533 |
| Mean Household Income | 719 | $105,327 |
| Income Deficit | 428 | $0 |
| Wage / Income Gap (%) | 1,761 | 34.08% |
| Wage / Income Gap ($) | 1,761 | 65.92¢ per $1 |
| Gini / Inequality Index | 1,761 | 0.59 |
Earnings by Sex in New Haven
Average Earnings in New Haven are $32,336, $43,462 for men and $28,652 for women, a difference of 34.1%.
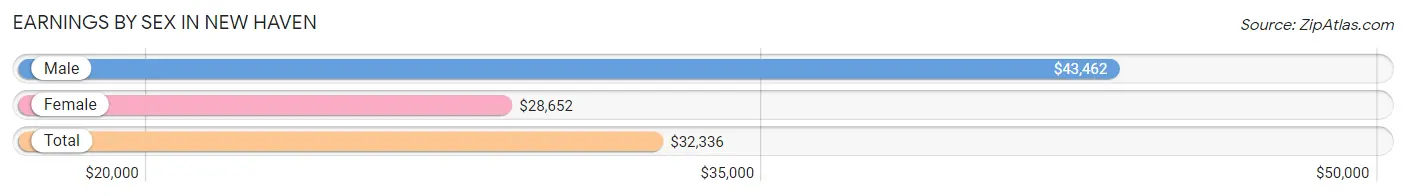
| Sex | Number | Average Earnings |
| Male | 428 (47.9%) | $43,462 |
| Female | 465 (52.1%) | $28,652 |
| Total | 893 (100.0%) | $32,336 |
Earnings by Sex by Income Bracket in New Haven
The most common earnings brackets in New Haven are $100,000+ for men (111 | 25.9%) and $25,000 to $29,999 for women (98 | 21.1%).
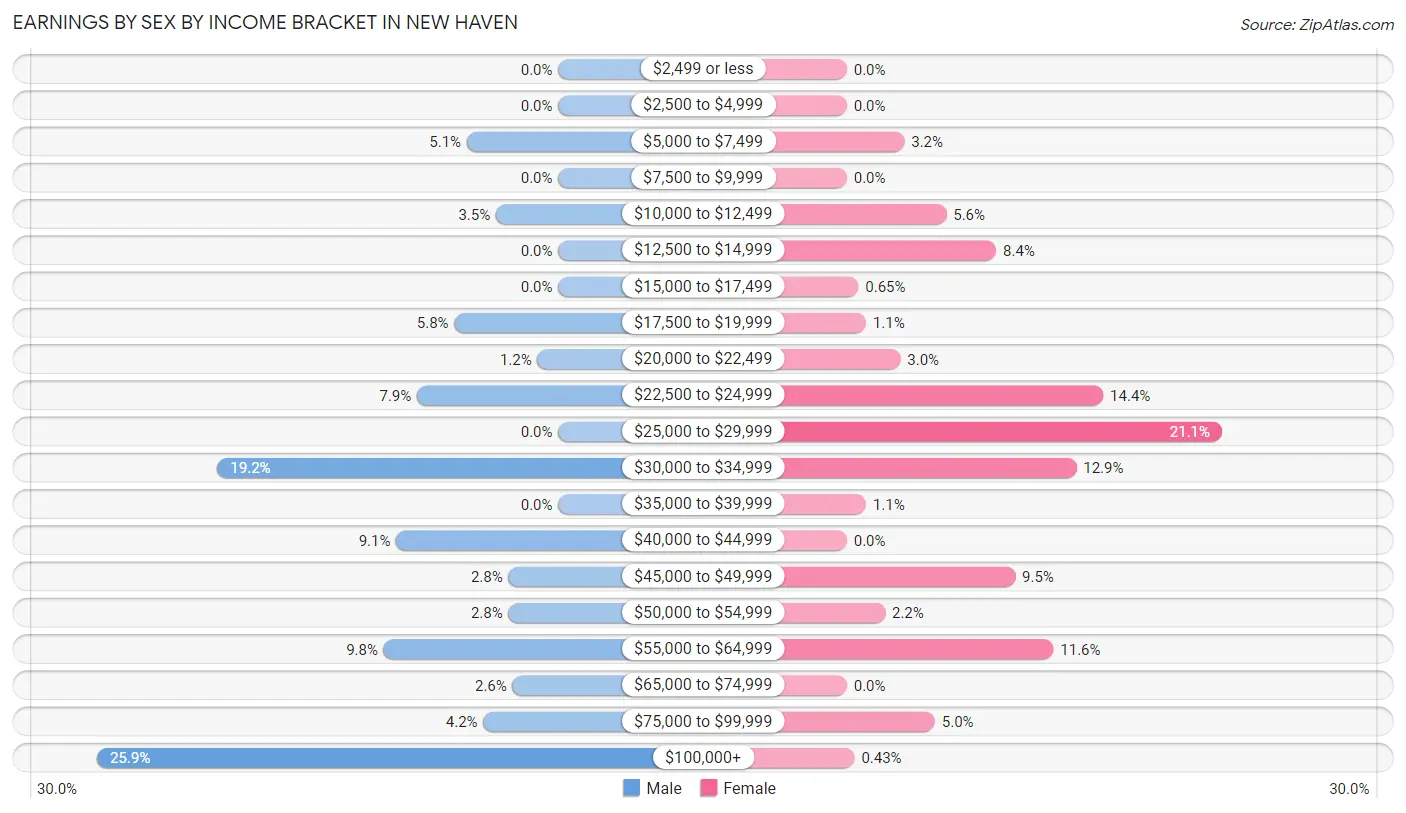
| Income | Male | Female |
| $2,499 or less | 0 (0.0%) | 0 (0.0%) |
| $2,500 to $4,999 | 0 (0.0%) | 0 (0.0%) |
| $5,000 to $7,499 | 22 (5.1%) | 15 (3.2%) |
| $7,500 to $9,999 | 0 (0.0%) | 0 (0.0%) |
| $10,000 to $12,499 | 15 (3.5%) | 26 (5.6%) |
| $12,500 to $14,999 | 0 (0.0%) | 39 (8.4%) |
| $15,000 to $17,499 | 0 (0.0%) | 3 (0.6%) |
| $17,500 to $19,999 | 25 (5.8%) | 5 (1.1%) |
| $20,000 to $22,499 | 5 (1.2%) | 14 (3.0%) |
| $22,500 to $24,999 | 34 (7.9%) | 67 (14.4%) |
| $25,000 to $29,999 | 0 (0.0%) | 98 (21.1%) |
| $30,000 to $34,999 | 82 (19.2%) | 60 (12.9%) |
| $35,000 to $39,999 | 0 (0.0%) | 5 (1.1%) |
| $40,000 to $44,999 | 39 (9.1%) | 0 (0.0%) |
| $45,000 to $49,999 | 12 (2.8%) | 44 (9.5%) |
| $50,000 to $54,999 | 12 (2.8%) | 10 (2.1%) |
| $55,000 to $64,999 | 42 (9.8%) | 54 (11.6%) |
| $65,000 to $74,999 | 11 (2.6%) | 0 (0.0%) |
| $75,000 to $99,999 | 18 (4.2%) | 23 (5.0%) |
| $100,000+ | 111 (25.9%) | 2 (0.4%) |
| Total | 428 (100.0%) | 465 (100.0%) |
Earnings by Sex by Educational Attainment in New Haven
Average earnings in New Haven are $51,563 for men and $29,785 for women, a difference of 42.2%. Men with an educational attainment of bachelor's degree enjoy the highest average annual earnings of $108,125, while those with college or associate's degree education earn the least with $41,319. Women with an educational attainment of bachelor's degree earn the most with the average annual earnings of $47,381, while those with high school diploma education have the smallest earnings of $28,250.
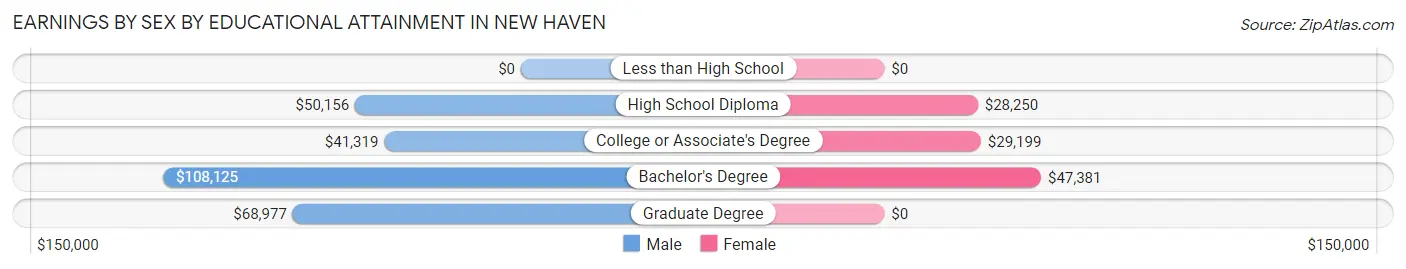
| Educational Attainment | Male Income | Female Income |
| Less than High School | - | - |
| High School Diploma | $50,156 | $28,250 |
| College or Associate's Degree | $41,319 | $29,199 |
| Bachelor's Degree | $108,125 | $47,381 |
| Graduate Degree | $68,977 | $0 |
| Total | $51,563 | $29,785 |
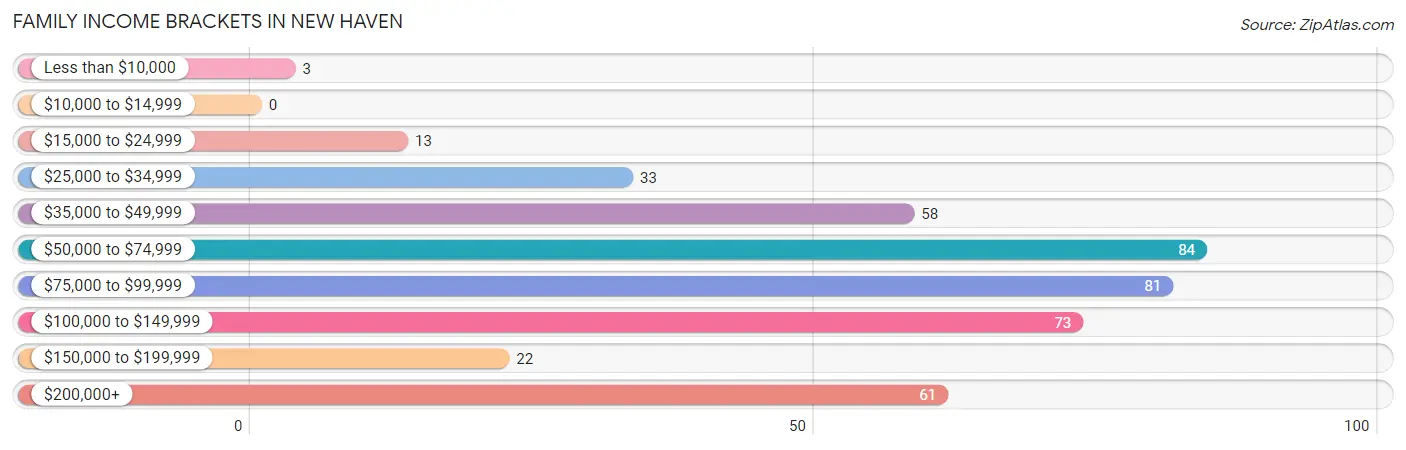
Family Income in New Haven
Family Income Brackets in New Haven
According to the New Haven family income data, there are 84 families falling into the $50,000 to $74,999 income range, which is the most common income bracket and makes up 19.6% of all families.
| Income Bracket | # Families | % Families |
| Less than $10,000 | 3 | 0.7% |
| $10,000 to $14,999 | 0 | 0.0% |
| $15,000 to $24,999 | 13 | 3.0% |
| $25,000 to $34,999 | 33 | 7.7% |
| $35,000 to $49,999 | 58 | 13.6% |
| $50,000 to $74,999 | 84 | 19.6% |
| $75,000 to $99,999 | 81 | 18.9% |
| $100,000 to $149,999 | 73 | 17.1% |
| $150,000 to $199,999 | 22 | 5.1% |
| $200,000+ | 61 | 14.3% |
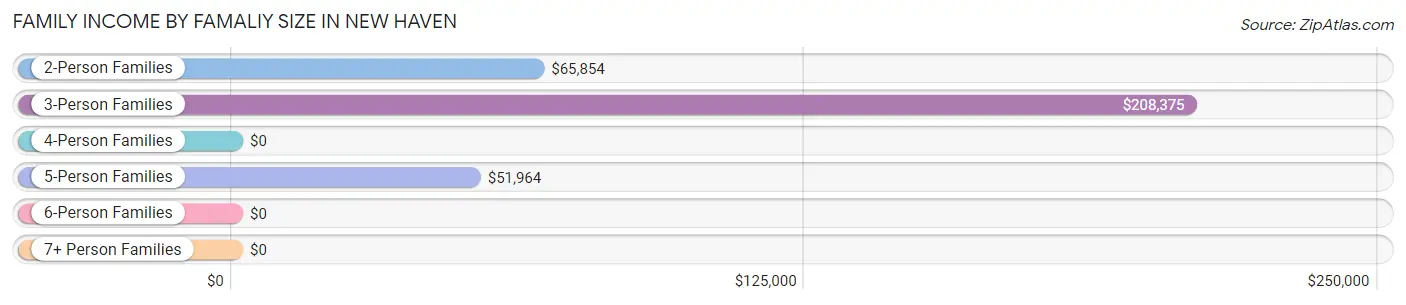
Family Income by Famaliy Size in New Haven
3-person families (71 | 16.6%) account for the highest median family income in New Haven with $208,375 per family, while 3-person families (71 | 16.6%) have the highest median income of $69,458 per family member.
| Income Bracket | # Families | Median Income |
| 2-Person Families | 244 (57.0%) | $65,854 |
| 3-Person Families | 71 (16.6%) | $208,375 |
| 4-Person Families | 58 (13.6%) | $0 |
| 5-Person Families | 35 (8.2%) | $51,964 |
| 6-Person Families | 20 (4.7%) | $0 |
| 7+ Person Families | 0 (0.0%) | $0 |
| Total | 428 (100.0%) | $83,966 |
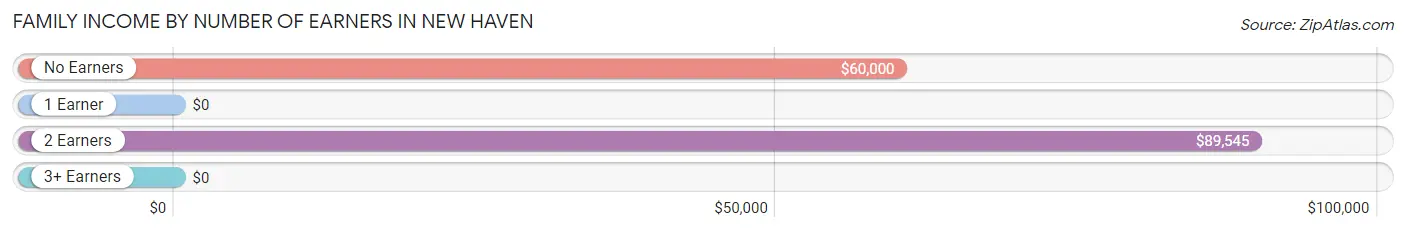
Family Income by Number of Earners in New Haven
| Number of Earners | # Families | Median Income |
| No Earners | 82 (19.2%) | $60,000 |
| 1 Earner | 147 (34.4%) | $0 |
| 2 Earners | 174 (40.6%) | $89,545 |
| 3+ Earners | 25 (5.8%) | $0 |
| Total | 428 (100.0%) | $83,966 |
Household Income in New Haven
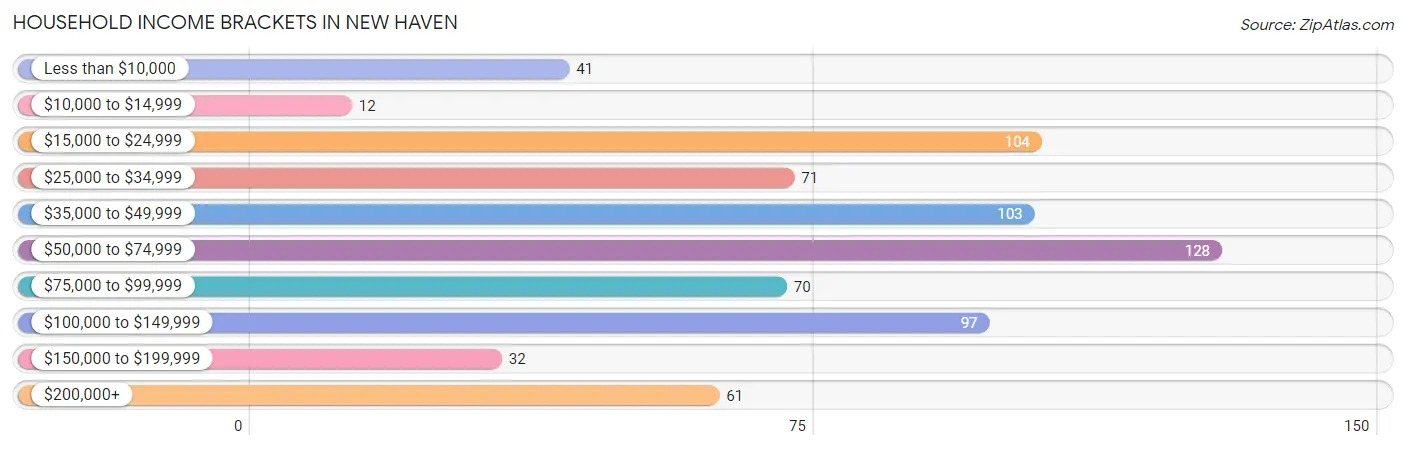
Household Income Brackets in New Haven
With 128 households falling in the category, the $50,000 to $74,999 income range is the most frequent in New Haven, accounting for 17.8% of all households. In contrast, only 12 households (1.7%) fall into the $10,000 to $14,999 income bracket, making it the least populous group.
| Income Bracket | # Households | % Households |
| Less than $10,000 | 41 | 5.7% |
| $10,000 to $14,999 | 12 | 1.7% |
| $15,000 to $24,999 | 104 | 14.5% |
| $25,000 to $34,999 | 71 | 9.9% |
| $35,000 to $49,999 | 103 | 14.3% |
| $50,000 to $74,999 | 128 | 17.8% |
| $75,000 to $99,999 | 70 | 9.7% |
| $100,000 to $149,999 | 97 | 13.5% |
| $150,000 to $199,999 | 32 | 4.5% |
| $200,000+ | 61 | 8.5% |
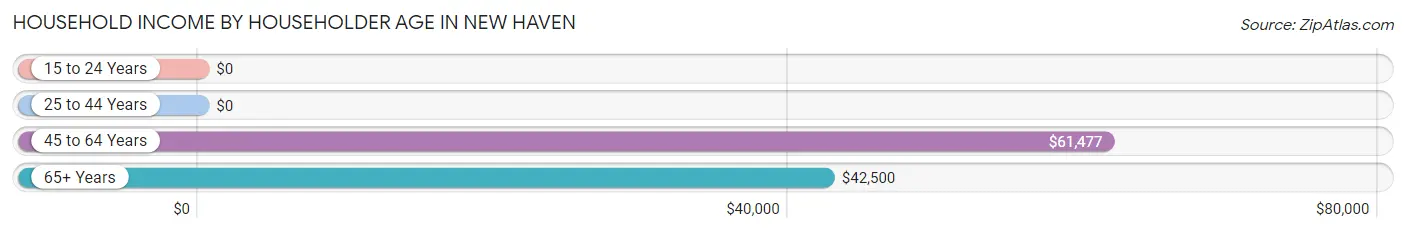
Household Income by Householder Age in New Haven
The median household income in New Haven is $58,533, with the highest median household income of $61,477 found in the 45 to 64 years age bracket for the primary householder. A total of 202 households (28.1%) fall into this category. Meanwhile, the 15 to 24 years age bracket for the primary householder has the lowest median household income of $0, with 21 households (2.9%) in this group.
| Income Bracket | # Households | Median Income |
| 15 to 24 Years | 21 (2.9%) | $0 |
| 25 to 44 Years | 148 (20.6%) | $0 |
| 45 to 64 Years | 202 (28.1%) | $61,477 |
| 65+ Years | 348 (48.4%) | $42,500 |
| Total | 719 (100.0%) | $58,533 |
Poverty in New Haven
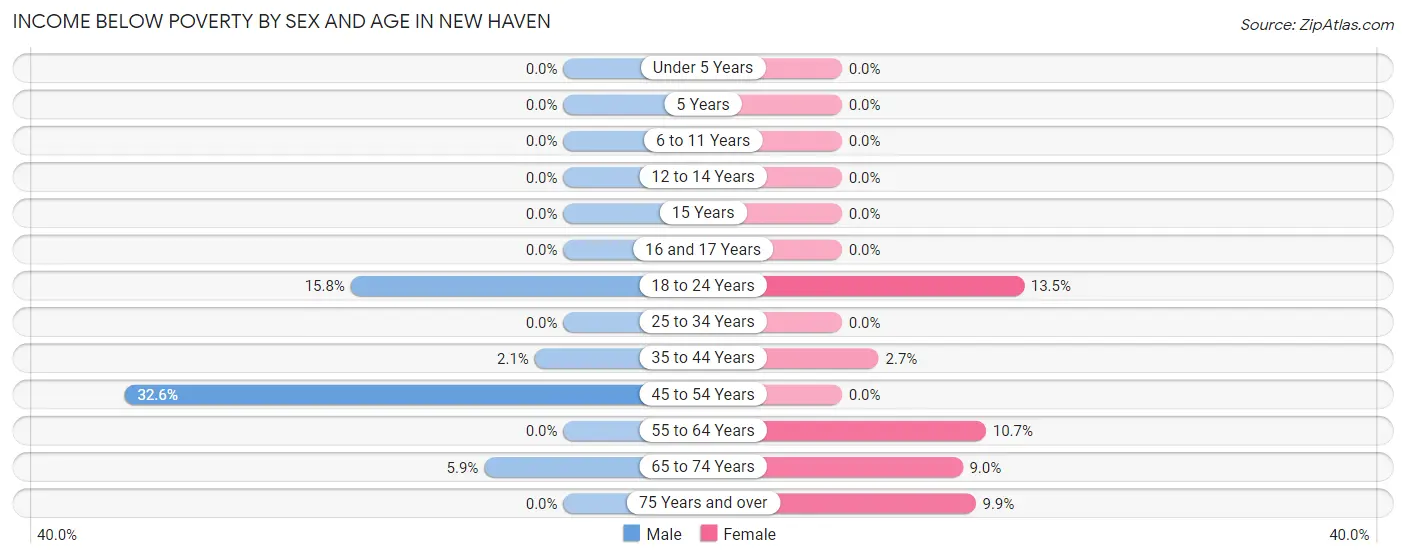
Income Below Poverty by Sex and Age in New Haven
With 9.1% poverty level for males and 5.5% for females among the residents of New Haven, 45 to 54 year old males and 18 to 24 year old females are the most vulnerable to poverty, with 43 males (32.6%) and 10 females (13.5%) in their respective age groups living below the poverty level.
| Age Bracket | Male | Female |
| Under 5 Years | 0 (0.0%) | 0 (0.0%) |
| 5 Years | 0 (0.0%) | 0 (0.0%) |
| 6 to 11 Years | 0 (0.0%) | 0 (0.0%) |
| 12 to 14 Years | 0 (0.0%) | 0 (0.0%) |
| 15 Years | 0 (0.0%) | 0 (0.0%) |
| 16 and 17 Years | 0 (0.0%) | 0 (0.0%) |
| 18 to 24 Years | 15 (15.8%) | 10 (13.5%) |
| 25 to 34 Years | 0 (0.0%) | 0 (0.0%) |
| 35 to 44 Years | 3 (2.1%) | 3 (2.7%) |
| 45 to 54 Years | 43 (32.6%) | 0 (0.0%) |
| 55 to 64 Years | 0 (0.0%) | 17 (10.7%) |
| 65 to 74 Years | 7 (5.9%) | 12 (9.0%) |
| 75 Years and over | 0 (0.0%) | 14 (9.9%) |
| Total | 68 (9.1%) | 56 (5.5%) |
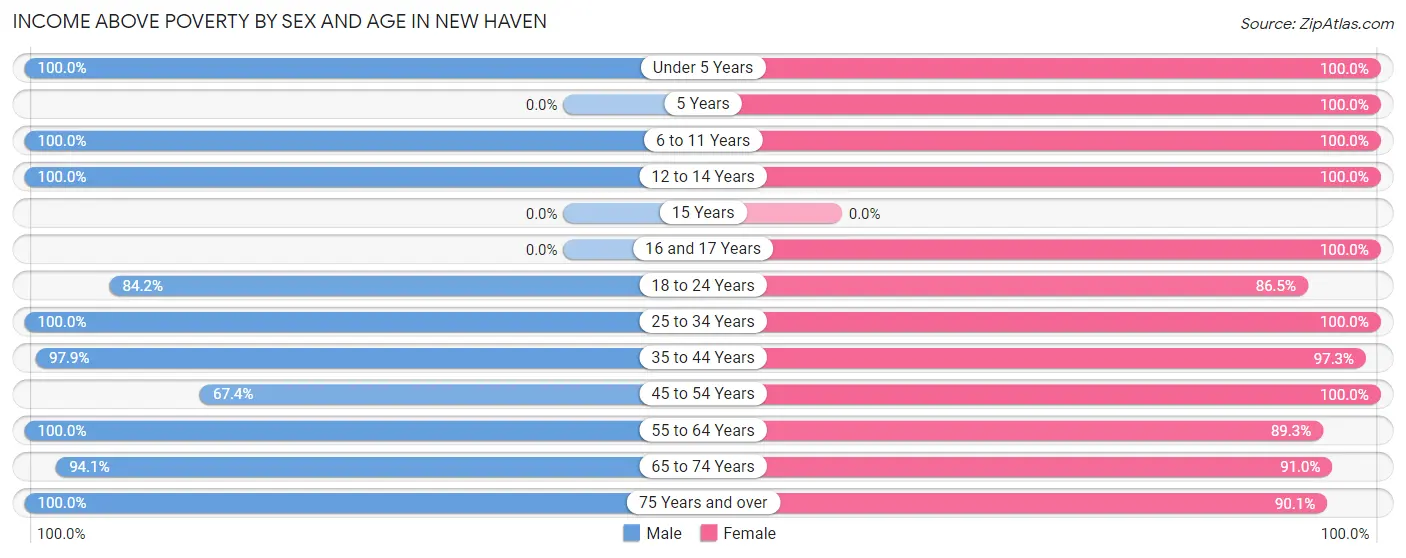
Income Above Poverty by Sex and Age in New Haven
According to the poverty statistics in New Haven, males aged under 5 years and females aged under 5 years are the age groups that are most secure financially, with 100.0% of males and 100.0% of females in these age groups living above the poverty line.
| Age Bracket | Male | Female |
| Under 5 Years | 2 (100.0%) | 67 (100.0%) |
| 5 Years | 0 (0.0%) | 15 (100.0%) |
| 6 to 11 Years | 42 (100.0%) | 36 (100.0%) |
| 12 to 14 Years | 15 (100.0%) | 37 (100.0%) |
| 15 Years | 0 (0.0%) | 0 (0.0%) |
| 16 and 17 Years | 0 (0.0%) | 11 (100.0%) |
| 18 to 24 Years | 80 (84.2%) | 64 (86.5%) |
| 25 to 34 Years | 64 (100.0%) | 139 (100.0%) |
| 35 to 44 Years | 138 (97.9%) | 107 (97.3%) |
| 45 to 54 Years | 89 (67.4%) | 92 (100.0%) |
| 55 to 64 Years | 87 (100.0%) | 142 (89.3%) |
| 65 to 74 Years | 112 (94.1%) | 122 (91.0%) |
| 75 Years and over | 49 (100.0%) | 127 (90.1%) |
| Total | 678 (90.9%) | 959 (94.5%) |
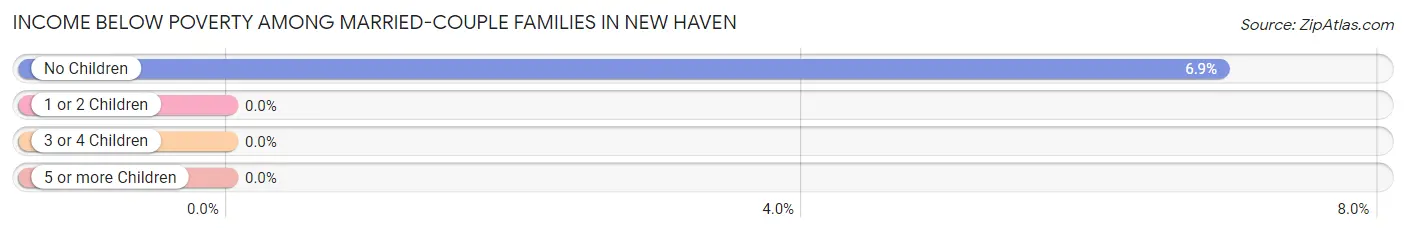
Income Below Poverty Among Married-Couple Families in New Haven
The poverty statistics for married-couple families in New Haven show that 5.2% or 16 of the total 306 families live below the poverty line. Families with no children have the highest poverty rate of 6.9%, comprising of 16 families. On the other hand, families with 1 or 2 children have the lowest poverty rate of 0.0%, which includes 0 families.
| Children | Above Poverty | Below Poverty |
| No Children | 216 (93.1%) | 16 (6.9%) |
| 1 or 2 Children | 62 (100.0%) | 0 (0.0%) |
| 3 or 4 Children | 12 (100.0%) | 0 (0.0%) |
| 5 or more Children | 0 (0.0%) | 0 (0.0%) |
| Total | 290 (94.8%) | 16 (5.2%) |
Income Below Poverty Among Single-Parent Households in New Haven
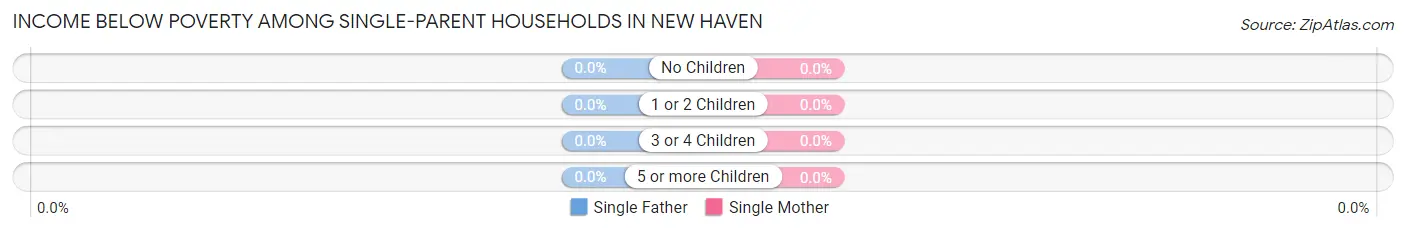
| Children | Single Father | Single Mother |
| No Children | 0 (0.0%) | 0 (0.0%) |
| 1 or 2 Children | 0 (0.0%) | 0 (0.0%) |
| 3 or 4 Children | 0 (0.0%) | 0 (0.0%) |
| 5 or more Children | 0 (0.0%) | 0 (0.0%) |
| Total | 0 (0.0%) | 0 (0.0%) |
Income Below Poverty Among Married-Couple vs Single-Parent Households in New Haven
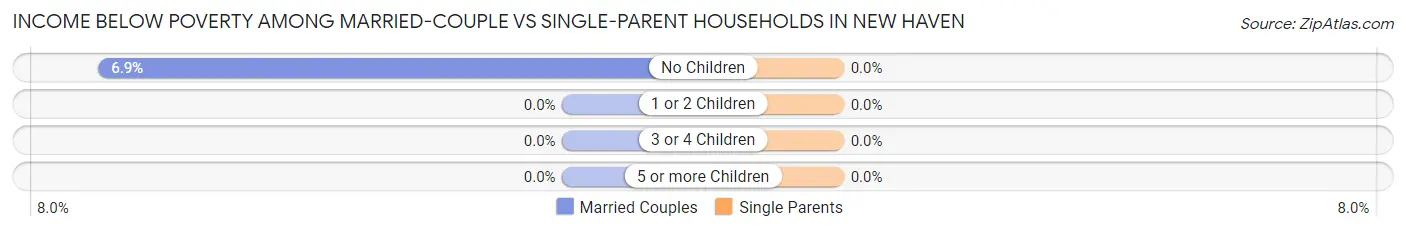
| Children | Married-Couple Families | Single-Parent Households |
| No Children | 16 (6.9%) | 0 (0.0%) |
| 1 or 2 Children | 0 (0.0%) | 0 (0.0%) |
| 3 or 4 Children | 0 (0.0%) | 0 (0.0%) |
| 5 or more Children | 0 (0.0%) | 0 (0.0%) |
| Total | 16 (5.2%) | 0 (0.0%) |
Employment Characteristics in New Haven
Employment by Class of Employer in New Haven
Among the 803 employed individuals in New Haven, private company employees (498 | 62.0%), not-for-profit organizations (138 | 17.2%), and state government employees (78 | 9.7%) make up the most common classes of employment.
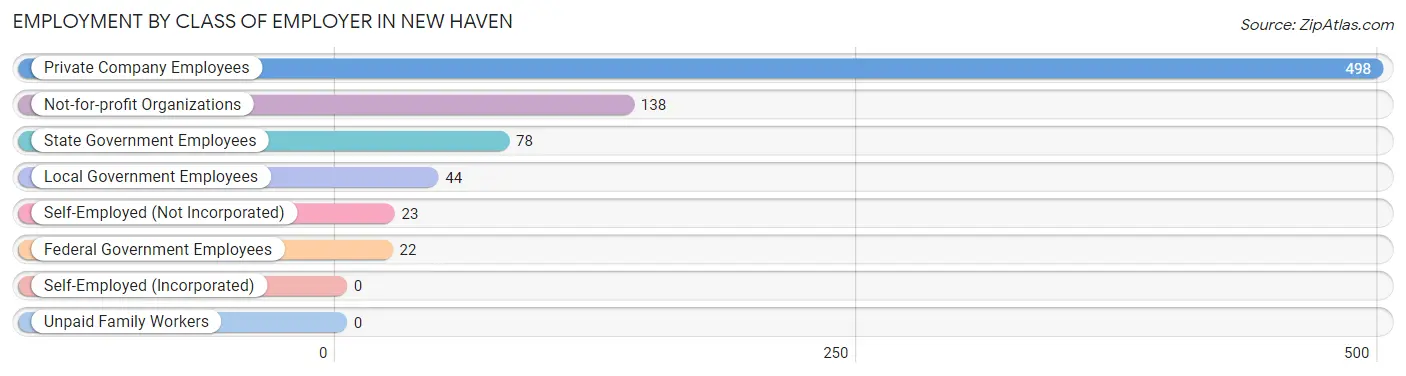
| Employer Class | # Employees | % Employees |
| Private Company Employees | 498 | 62.0% |
| Self-Employed (Incorporated) | 0 | 0.0% |
| Self-Employed (Not Incorporated) | 23 | 2.9% |
| Not-for-profit Organizations | 138 | 17.2% |
| Local Government Employees | 44 | 5.5% |
| State Government Employees | 78 | 9.7% |
| Federal Government Employees | 22 | 2.7% |
| Unpaid Family Workers | 0 | 0.0% |
| Total | 803 | 100.0% |
Employment Status by Age in New Haven
According to the labor force statistics for New Haven, out of the total population over 16 years of age (1,547), 54.3% or 840 individuals are in the labor force, with 4.4% or 37 of them unemployed. The age group with the highest labor force participation rate is 20 to 24 years, with 85.0% or 125 individuals in the labor force. Within the labor force, the 25 to 29 years age range has the highest percentage of unemployed individuals, with 20.0% or 18 of them being unemployed.
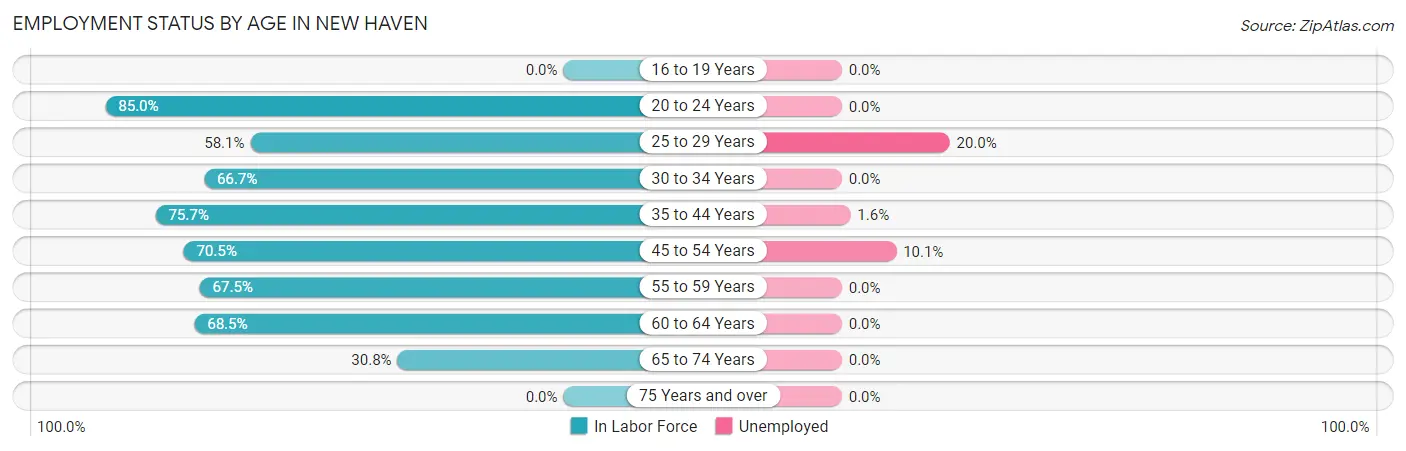
| Age Bracket | In Labor Force | Unemployed |
| 16 to 19 Years | 0 (0.0%) | 0 (0.0%) |
| 20 to 24 Years | 125 (85.0%) | 0 (0.0%) |
| 25 to 29 Years | 90 (58.1%) | 18 (20.0%) |
| 30 to 34 Years | 32 (66.7%) | 0 (0.0%) |
| 35 to 44 Years | 190 (75.7%) | 3 (1.6%) |
| 45 to 54 Years | 158 (70.5%) | 16 (10.1%) |
| 55 to 59 Years | 104 (67.5%) | 0 (0.0%) |
| 60 to 64 Years | 63 (68.5%) | 0 (0.0%) |
| 65 to 74 Years | 78 (30.8%) | 0 (0.0%) |
| 75 Years and over | 0 (0.0%) | 0 (0.0%) |
| Total | 840 (54.3%) | 37 (4.4%) |
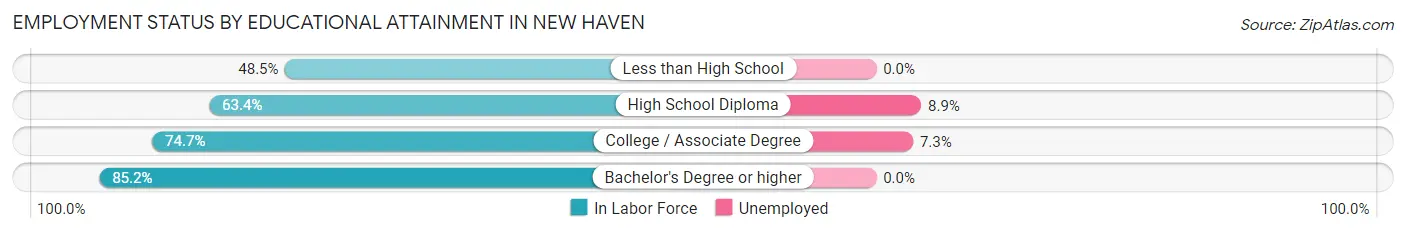
Employment Status by Educational Attainment in New Haven
According to labor force statistics for New Haven, 68.9% of individuals (637) out of the total population between 25 and 64 years of age (924) are in the labor force, with 5.8% or 37 of them being unemployed. The group with the highest labor force participation rate are those with the educational attainment of bachelor's degree or higher, with 85.2% or 132 individuals in the labor force. Within the labor force, individuals with high school diploma education have the highest percentage of unemployment, with 8.9% or 21 of them being unemployed.
| Educational Attainment | In Labor Force | Unemployed |
| Less than High School | 50 (48.5%) | 0 (0.0%) |
| High School Diploma | 237 (63.4%) | 33 (8.9%) |
| College / Associate Degree | 218 (74.7%) | 21 (7.3%) |
| Bachelor's Degree or higher | 132 (85.2%) | 0 (0.0%) |
| Total | 637 (68.9%) | 54 (5.8%) |
Employment Occupations by Sex in New Haven
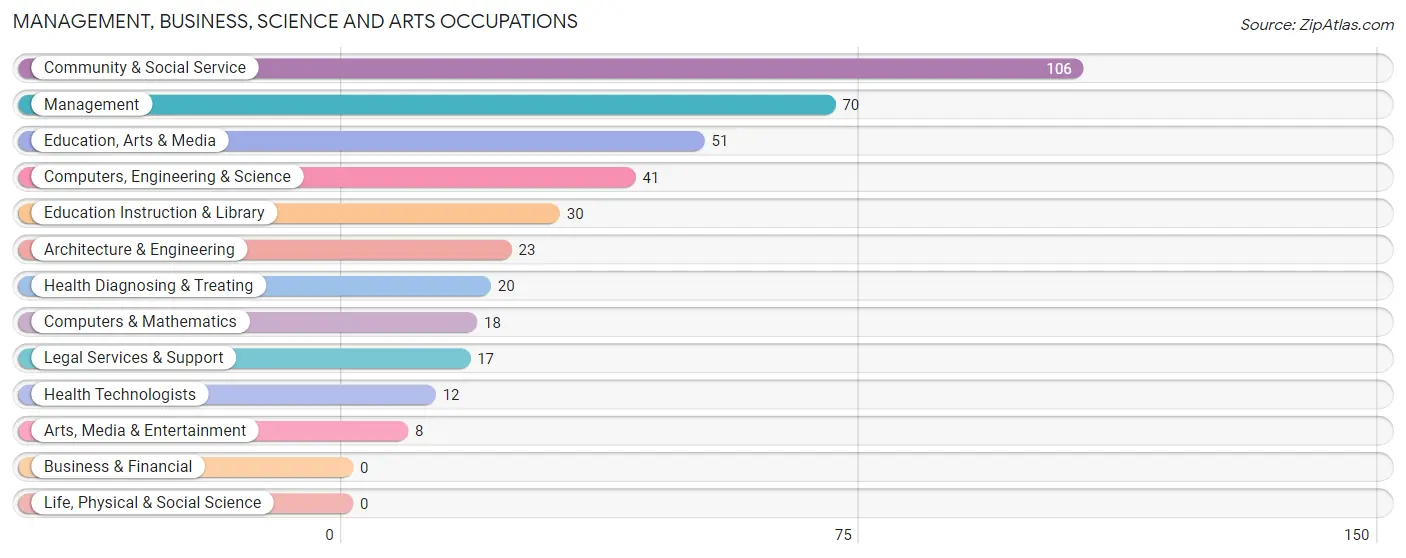
Management, Business, Science and Arts Occupations
The most common Management, Business, Science and Arts occupations in New Haven are Community & Social Service (106 | 13.2%), Management (70 | 8.7%), Education, Arts & Media (51 | 6.4%), Computers, Engineering & Science (41 | 5.1%), and Education Instruction & Library (30 | 3.7%).
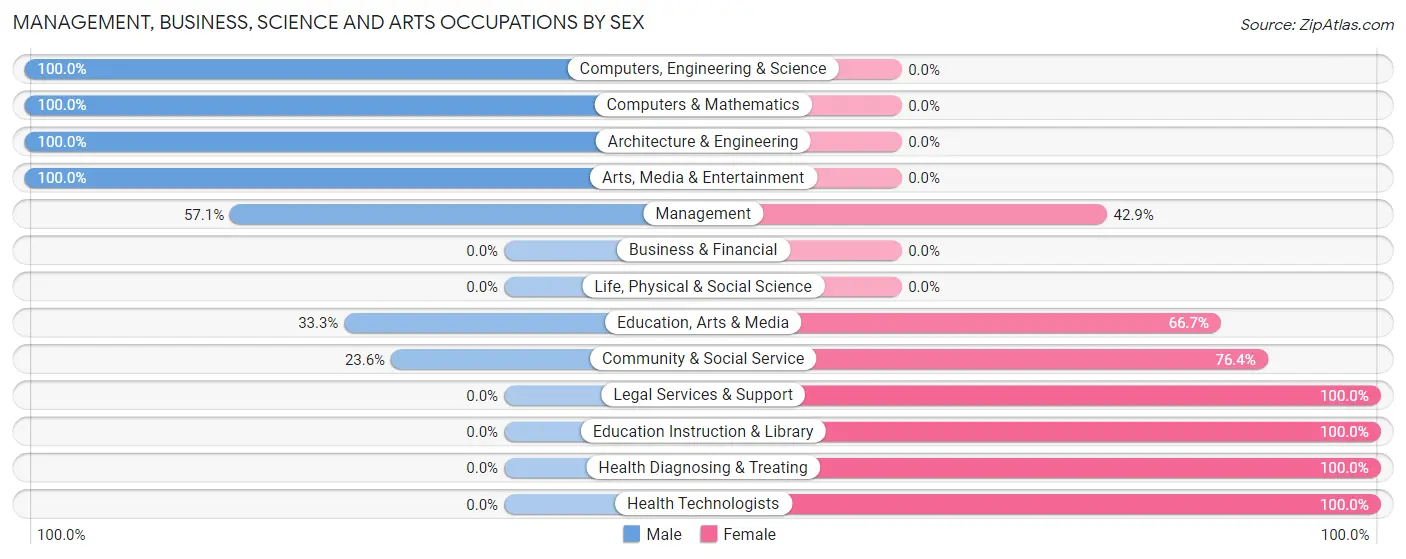
Management, Business, Science and Arts Occupations by Sex
Within the Management, Business, Science and Arts occupations in New Haven, the most male-oriented occupations are Computers, Engineering & Science (100.0%), Computers & Mathematics (100.0%), and Architecture & Engineering (100.0%), while the most female-oriented occupations are Legal Services & Support (100.0%), Education Instruction & Library (100.0%), and Health Diagnosing & Treating (100.0%).
| Occupation | Male | Female |
| Management | 40 (57.1%) | 30 (42.9%) |
| Business & Financial | 0 (0.0%) | 0 (0.0%) |
| Computers, Engineering & Science | 41 (100.0%) | 0 (0.0%) |
| Computers & Mathematics | 18 (100.0%) | 0 (0.0%) |
| Architecture & Engineering | 23 (100.0%) | 0 (0.0%) |
| Life, Physical & Social Science | 0 (0.0%) | 0 (0.0%) |
| Community & Social Service | 25 (23.6%) | 81 (76.4%) |
| Education, Arts & Media | 17 (33.3%) | 34 (66.7%) |
| Legal Services & Support | 0 (0.0%) | 17 (100.0%) |
| Education Instruction & Library | 0 (0.0%) | 30 (100.0%) |
| Arts, Media & Entertainment | 8 (100.0%) | 0 (0.0%) |
| Health Diagnosing & Treating | 0 (0.0%) | 20 (100.0%) |
| Health Technologists | 0 (0.0%) | 12 (100.0%) |
| Total (Category) | 106 (44.7%) | 131 (55.3%) |
| Total (Overall) | 382 (47.6%) | 421 (52.4%) |
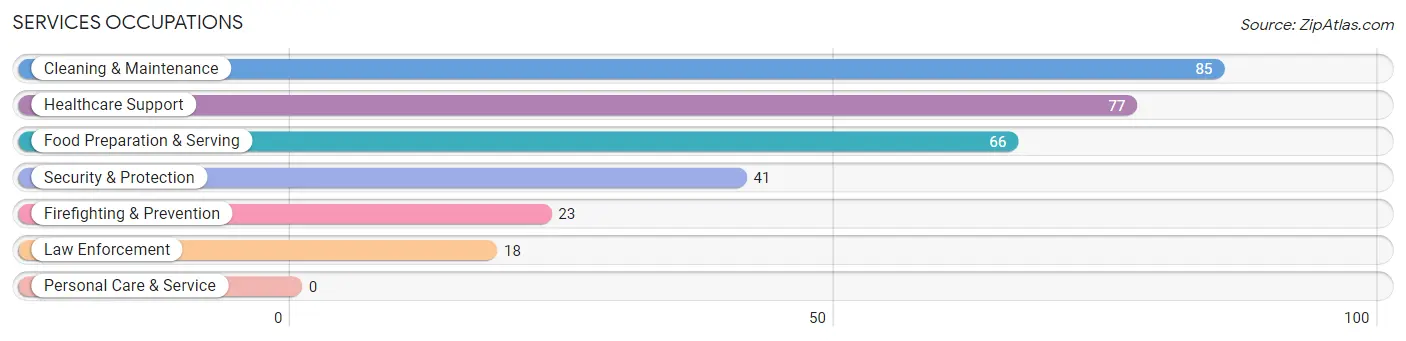
Services Occupations
The most common Services occupations in New Haven are Cleaning & Maintenance (85 | 10.6%), Healthcare Support (77 | 9.6%), Food Preparation & Serving (66 | 8.2%), Security & Protection (41 | 5.1%), and Firefighting & Prevention (23 | 2.9%).
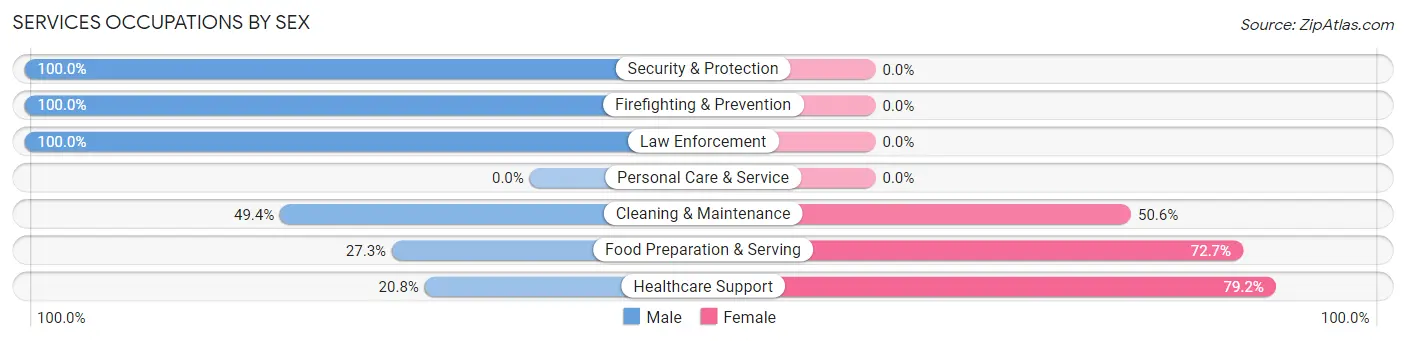
Services Occupations by Sex
Within the Services occupations in New Haven, the most male-oriented occupations are Security & Protection (100.0%), Firefighting & Prevention (100.0%), and Law Enforcement (100.0%), while the most female-oriented occupations are Healthcare Support (79.2%), Food Preparation & Serving (72.7%), and Cleaning & Maintenance (50.6%).
| Occupation | Male | Female |
| Healthcare Support | 16 (20.8%) | 61 (79.2%) |
| Security & Protection | 41 (100.0%) | 0 (0.0%) |
| Firefighting & Prevention | 23 (100.0%) | 0 (0.0%) |
| Law Enforcement | 18 (100.0%) | 0 (0.0%) |
| Food Preparation & Serving | 18 (27.3%) | 48 (72.7%) |
| Cleaning & Maintenance | 42 (49.4%) | 43 (50.6%) |
| Personal Care & Service | 0 (0.0%) | 0 (0.0%) |
| Total (Category) | 117 (43.5%) | 152 (56.5%) |
| Total (Overall) | 382 (47.6%) | 421 (52.4%) |
Sales and Office Occupations
The most common Sales and Office occupations in New Haven are Office & Administration (118 | 14.7%), and Sales & Related (30 | 3.7%).

Sales and Office Occupations by Sex

| Occupation | Male | Female |
| Sales & Related | 0 (0.0%) | 30 (100.0%) |
| Office & Administration | 44 (37.3%) | 74 (62.7%) |
| Total (Category) | 44 (29.7%) | 104 (70.3%) |
| Total (Overall) | 382 (47.6%) | 421 (52.4%) |
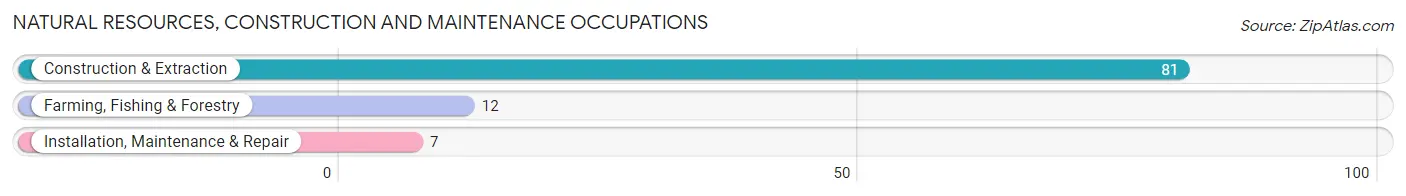
Natural Resources, Construction and Maintenance Occupations
The most common Natural Resources, Construction and Maintenance occupations in New Haven are Construction & Extraction (81 | 10.1%), Farming, Fishing & Forestry (12 | 1.5%), and Installation, Maintenance & Repair (7 | 0.9%).
Natural Resources, Construction and Maintenance Occupations by Sex
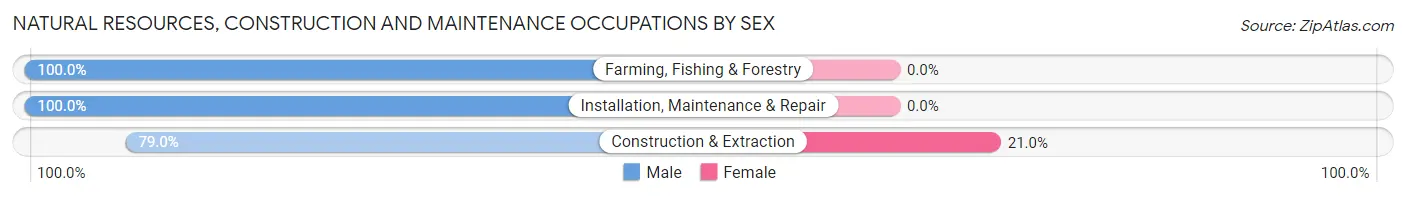
| Occupation | Male | Female |
| Farming, Fishing & Forestry | 12 (100.0%) | 0 (0.0%) |
| Construction & Extraction | 64 (79.0%) | 17 (21.0%) |
| Installation, Maintenance & Repair | 7 (100.0%) | 0 (0.0%) |
| Total (Category) | 83 (83.0%) | 17 (17.0%) |
| Total (Overall) | 382 (47.6%) | 421 (52.4%) |
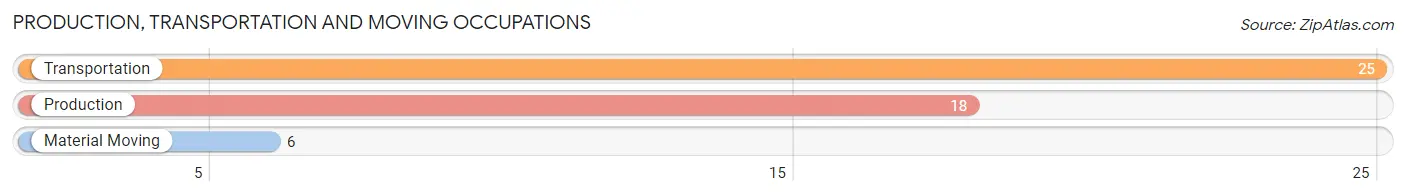
Production, Transportation and Moving Occupations
The most common Production, Transportation and Moving occupations in New Haven are Transportation (25 | 3.1%), Production (18 | 2.2%), and Material Moving (6 | 0.7%).
Production, Transportation and Moving Occupations by Sex
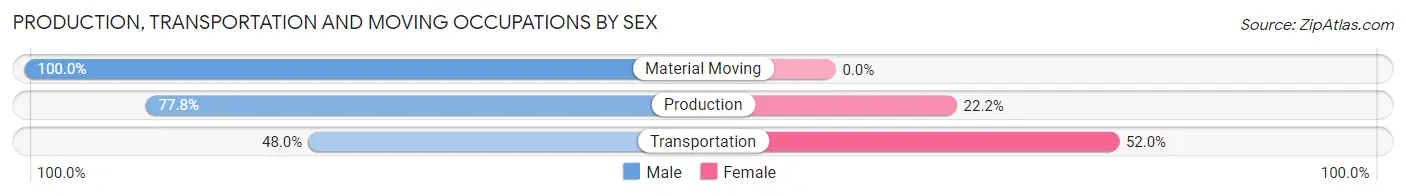
| Occupation | Male | Female |
| Production | 14 (77.8%) | 4 (22.2%) |
| Transportation | 12 (48.0%) | 13 (52.0%) |
| Material Moving | 6 (100.0%) | 0 (0.0%) |
| Total (Category) | 32 (65.3%) | 17 (34.7%) |
| Total (Overall) | 382 (47.6%) | 421 (52.4%) |
Employment Industries by Sex in New Haven
Employment Industries in New Haven
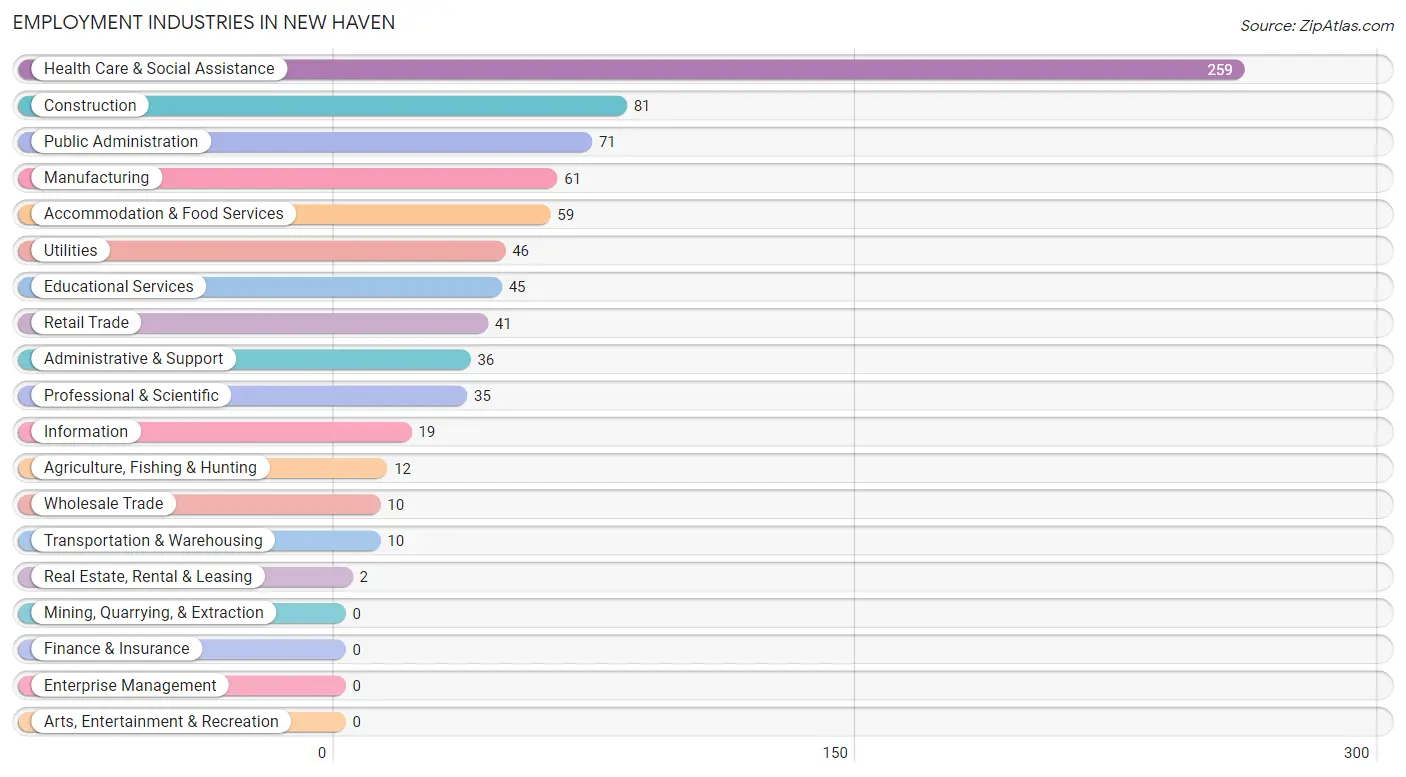
The major employment industries in New Haven include Health Care & Social Assistance (259 | 32.3%), Construction (81 | 10.1%), Public Administration (71 | 8.8%), Manufacturing (61 | 7.6%), and Accommodation & Food Services (59 | 7.3%).
Employment Industries by Sex in New Haven
The New Haven industries that see more men than women are Agriculture, Fishing & Hunting (100.0%), Wholesale Trade (100.0%), and Transportation & Warehousing (100.0%), whereas the industries that tend to have a higher number of women are Health Care & Social Assistance (92.3%), Educational Services (86.7%), and Information (57.9%).
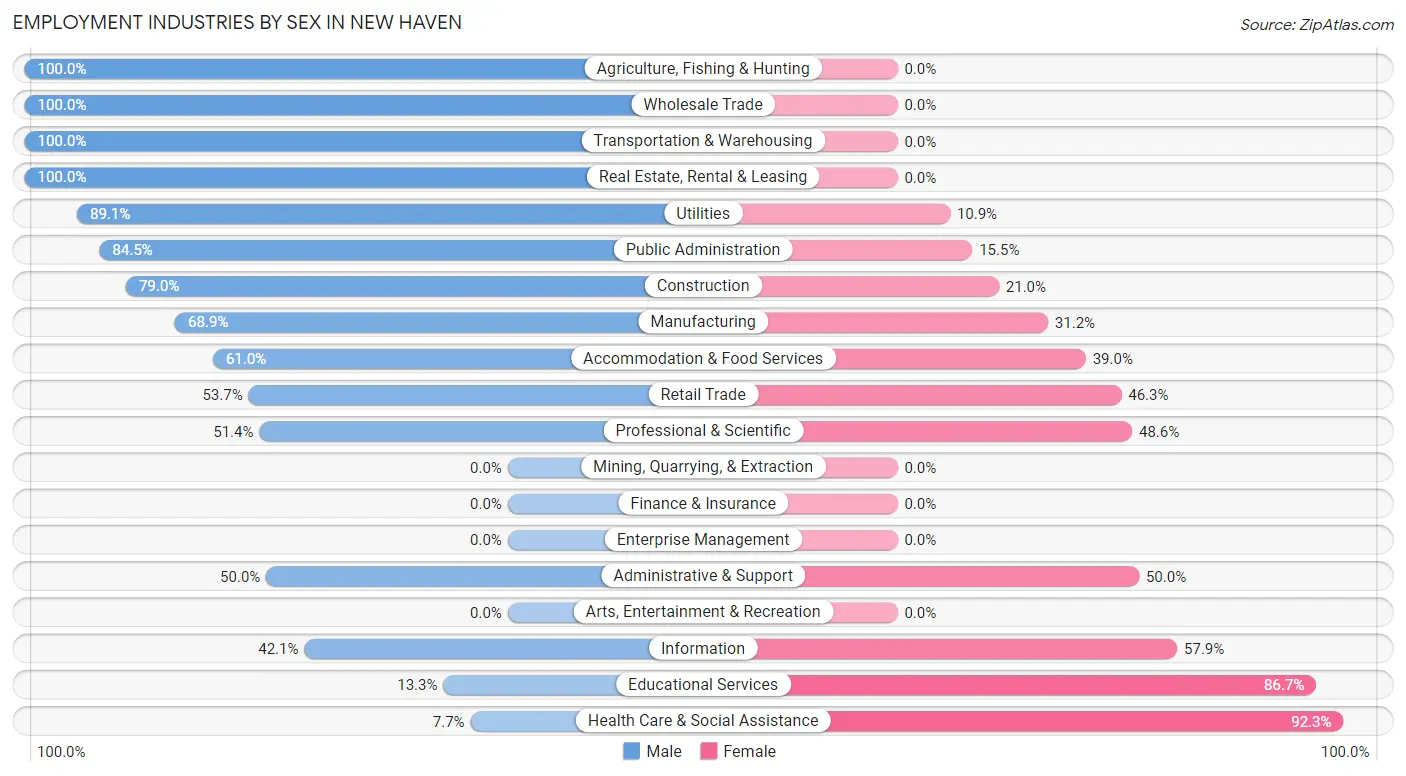
| Industry | Male | Female |
| Agriculture, Fishing & Hunting | 12 (100.0%) | 0 (0.0%) |
| Mining, Quarrying, & Extraction | 0 (0.0%) | 0 (0.0%) |
| Construction | 64 (79.0%) | 17 (21.0%) |
| Manufacturing | 42 (68.9%) | 19 (31.1%) |
| Wholesale Trade | 10 (100.0%) | 0 (0.0%) |
| Retail Trade | 22 (53.7%) | 19 (46.3%) |
| Transportation & Warehousing | 10 (100.0%) | 0 (0.0%) |
| Utilities | 41 (89.1%) | 5 (10.9%) |
| Information | 8 (42.1%) | 11 (57.9%) |
| Finance & Insurance | 0 (0.0%) | 0 (0.0%) |
| Real Estate, Rental & Leasing | 2 (100.0%) | 0 (0.0%) |
| Professional & Scientific | 18 (51.4%) | 17 (48.6%) |
| Enterprise Management | 0 (0.0%) | 0 (0.0%) |
| Administrative & Support | 18 (50.0%) | 18 (50.0%) |
| Educational Services | 6 (13.3%) | 39 (86.7%) |
| Health Care & Social Assistance | 20 (7.7%) | 239 (92.3%) |
| Arts, Entertainment & Recreation | 0 (0.0%) | 0 (0.0%) |
| Accommodation & Food Services | 36 (61.0%) | 23 (39.0%) |
| Public Administration | 60 (84.5%) | 11 (15.5%) |
| Total | 382 (47.6%) | 421 (52.4%) |
Education in New Haven
School Enrollment in New Haven
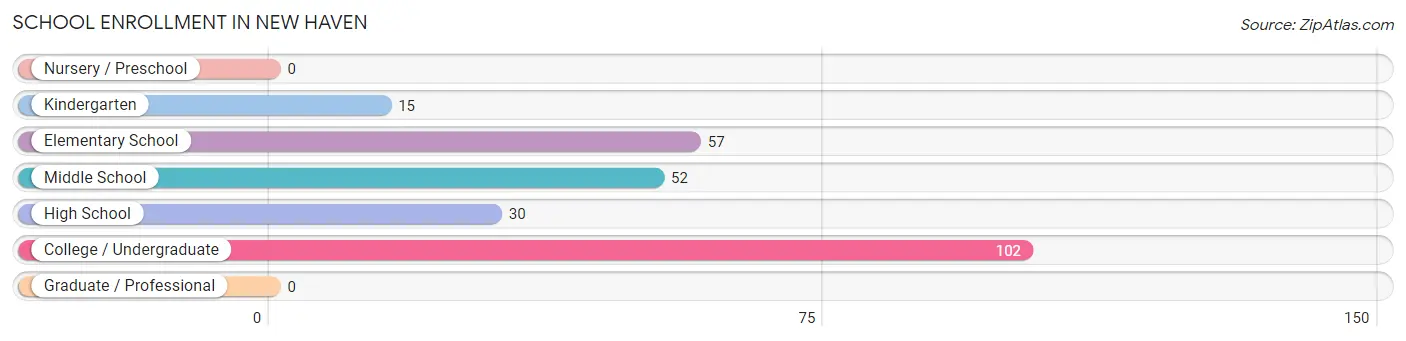
The most common levels of schooling among the 256 students in New Haven are college / undergraduate (102 | 39.8%), elementary school (57 | 22.3%), and middle school (52 | 20.3%).
| School Level | # Students | % Students |
| Nursery / Preschool | 0 | 0.0% |
| Kindergarten | 15 | 5.9% |
| Elementary School | 57 | 22.3% |
| Middle School | 52 | 20.3% |
| High School | 30 | 11.7% |
| College / Undergraduate | 102 | 39.8% |
| Graduate / Professional | 0 | 0.0% |
| Total | 256 | 100.0% |
School Enrollment by Age by Funding Source in New Haven
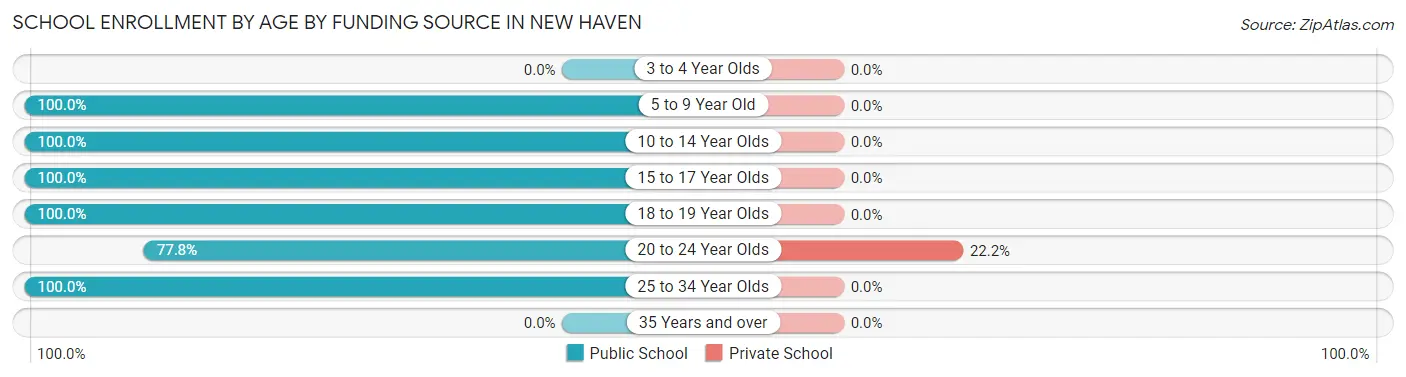
Out of a total of 256 students who are enrolled in schools in New Haven, 14 (5.5%) attend a private institution, while the remaining 242 (94.5%) are enrolled in public schools. The age group of 20 to 24 year olds has the highest likelihood of being enrolled in private schools, with 14 (22.2% in the age bracket) enrolled. Conversely, the age group of 5 to 9 year old has the lowest likelihood of being enrolled in a private school, with 72 (100.0% in the age bracket) attending a public institution.
| Age Bracket | Public School | Private School |
| 3 to 4 Year Olds | 0 (0.0%) | 0 (0.0%) |
| 5 to 9 Year Old | 72 (100.0%) | 0 (0.0%) |
| 10 to 14 Year Olds | 73 (100.0%) | 0 (0.0%) |
| 15 to 17 Year Olds | 3 (100.0%) | 0 (0.0%) |
| 18 to 19 Year Olds | 22 (100.0%) | 0 (0.0%) |
| 20 to 24 Year Olds | 49 (77.8%) | 14 (22.2%) |
| 25 to 34 Year Olds | 23 (100.0%) | 0 (0.0%) |
| 35 Years and over | 0 (0.0%) | 0 (0.0%) |
| Total | 242 (94.5%) | 14 (5.5%) |
Educational Attainment by Field of Study in New Haven
Arts & humanities (41 | 17.4%), education (32 | 13.6%), engineering (29 | 12.3%), literature & languages (28 | 11.9%), and business (26 | 11.1%) are the most common fields of study among 235 individuals in New Haven who have obtained a bachelor's degree or higher.
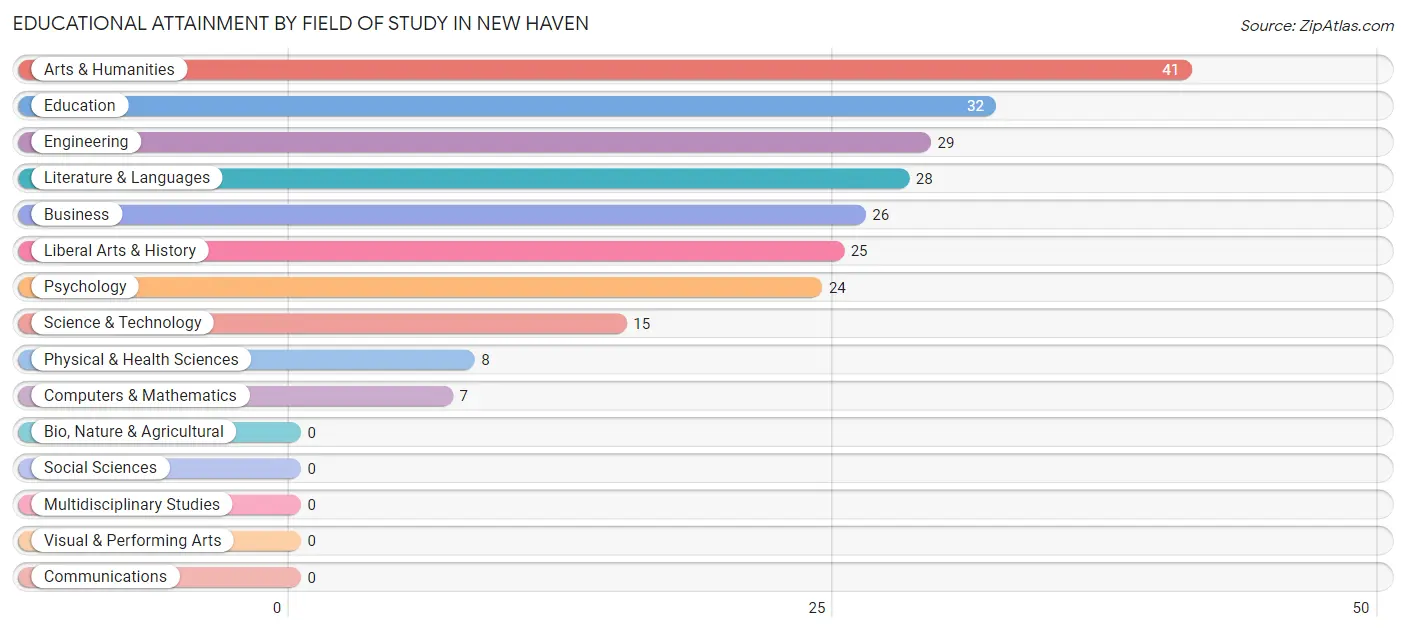
| Field of Study | # Graduates | % Graduates |
| Computers & Mathematics | 7 | 3.0% |
| Bio, Nature & Agricultural | 0 | 0.0% |
| Physical & Health Sciences | 8 | 3.4% |
| Psychology | 24 | 10.2% |
| Social Sciences | 0 | 0.0% |
| Engineering | 29 | 12.3% |
| Multidisciplinary Studies | 0 | 0.0% |
| Science & Technology | 15 | 6.4% |
| Business | 26 | 11.1% |
| Education | 32 | 13.6% |
| Literature & Languages | 28 | 11.9% |
| Liberal Arts & History | 25 | 10.6% |
| Visual & Performing Arts | 0 | 0.0% |
| Communications | 0 | 0.0% |
| Arts & Humanities | 41 | 17.4% |
| Total | 235 | 100.0% |
Transportation & Commute in New Haven
Vehicle Availability by Sex in New Haven
The most prevalent vehicle ownership categories in New Haven are males with 3 vehicles (189, accounting for 49.5%) and females with 3 vehicles (114, making up 44.9%).
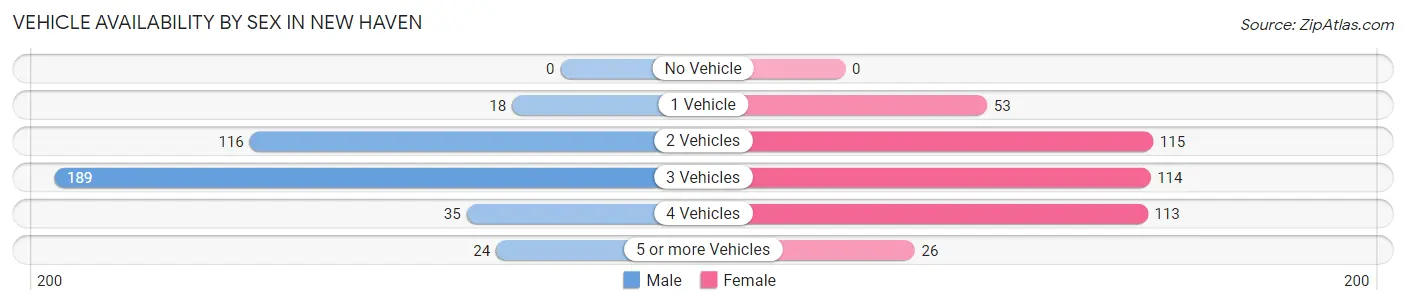
| Vehicles Available | Male | Female |
| No Vehicle | 0 (0.0%) | 0 (0.0%) |
| 1 Vehicle | 18 (4.7%) | 53 (12.6%) |
| 2 Vehicles | 116 (30.4%) | 115 (27.3%) |
| 3 Vehicles | 189 (49.5%) | 114 (27.1%) |
| 4 Vehicles | 35 (9.2%) | 113 (26.8%) |
| 5 or more Vehicles | 24 (6.3%) | 26 (6.2%) |
| Total | 382 (100.0%) | 421 (100.0%) |
Commute Time in New Haven
The most frequently occuring commute durations in New Haven are 30 to 34 minutes (181 commuters, 23.4%), 20 to 24 minutes (122 commuters, 15.7%), and 10 to 14 minutes (87 commuters, 11.2%).
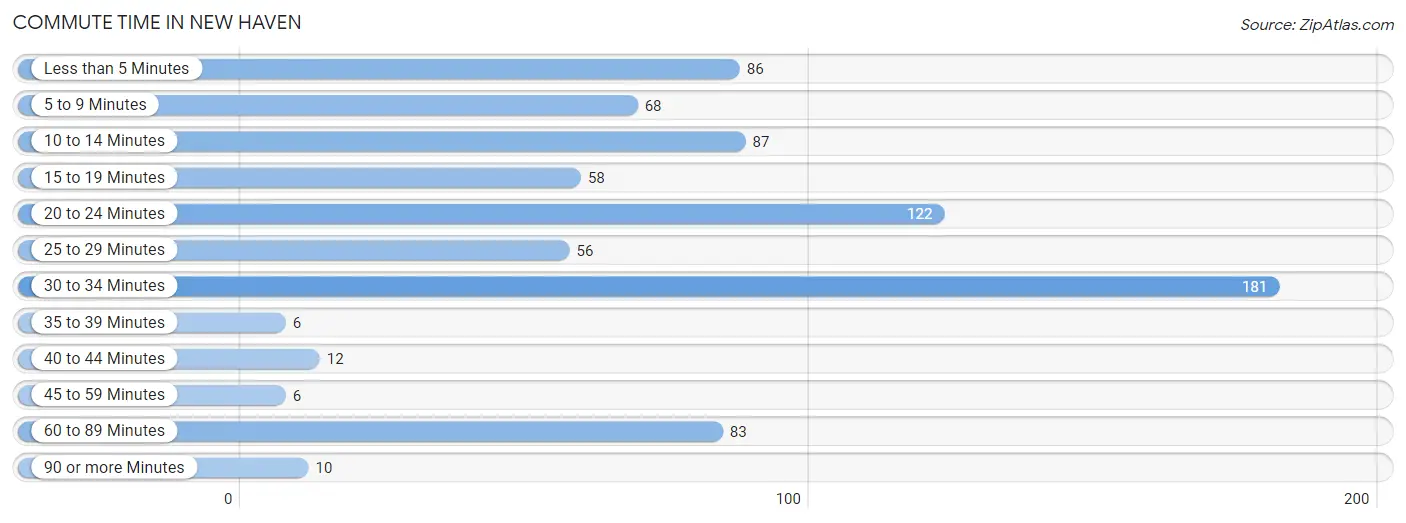
| Commute Time | # Commuters | % Commuters |
| Less than 5 Minutes | 86 | 11.1% |
| 5 to 9 Minutes | 68 | 8.8% |
| 10 to 14 Minutes | 87 | 11.2% |
| 15 to 19 Minutes | 58 | 7.5% |
| 20 to 24 Minutes | 122 | 15.7% |
| 25 to 29 Minutes | 56 | 7.2% |
| 30 to 34 Minutes | 181 | 23.4% |
| 35 to 39 Minutes | 6 | 0.8% |
| 40 to 44 Minutes | 12 | 1.5% |
| 45 to 59 Minutes | 6 | 0.8% |
| 60 to 89 Minutes | 83 | 10.7% |
| 90 or more Minutes | 10 | 1.3% |
Commute Time by Sex in New Haven
The most common commute times in New Haven are 60 to 89 minutes (83 commuters, 22.5%) for males and 30 to 34 minutes (117 commuters, 28.8%) for females.
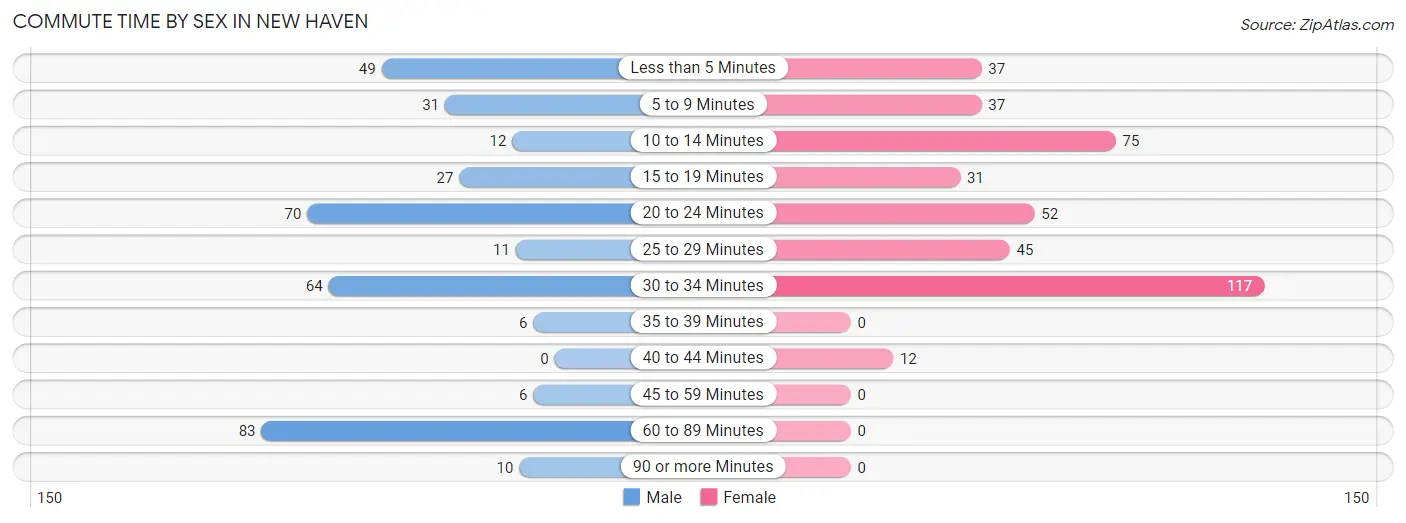
| Commute Time | Male | Female |
| Less than 5 Minutes | 49 (13.3%) | 37 (9.1%) |
| 5 to 9 Minutes | 31 (8.4%) | 37 (9.1%) |
| 10 to 14 Minutes | 12 (3.3%) | 75 (18.5%) |
| 15 to 19 Minutes | 27 (7.3%) | 31 (7.6%) |
| 20 to 24 Minutes | 70 (19.0%) | 52 (12.8%) |
| 25 to 29 Minutes | 11 (3.0%) | 45 (11.1%) |
| 30 to 34 Minutes | 64 (17.3%) | 117 (28.8%) |
| 35 to 39 Minutes | 6 (1.6%) | 0 (0.0%) |
| 40 to 44 Minutes | 0 (0.0%) | 12 (3.0%) |
| 45 to 59 Minutes | 6 (1.6%) | 0 (0.0%) |
| 60 to 89 Minutes | 83 (22.5%) | 0 (0.0%) |
| 90 or more Minutes | 10 (2.7%) | 0 (0.0%) |
Time of Departure to Work by Sex in New Haven
The most frequent times of departure to work in New Haven are 6:30 AM to 6:59 AM (63, 17.1%) for males and 5:30 AM to 5:59 AM (120, 29.6%) for females.
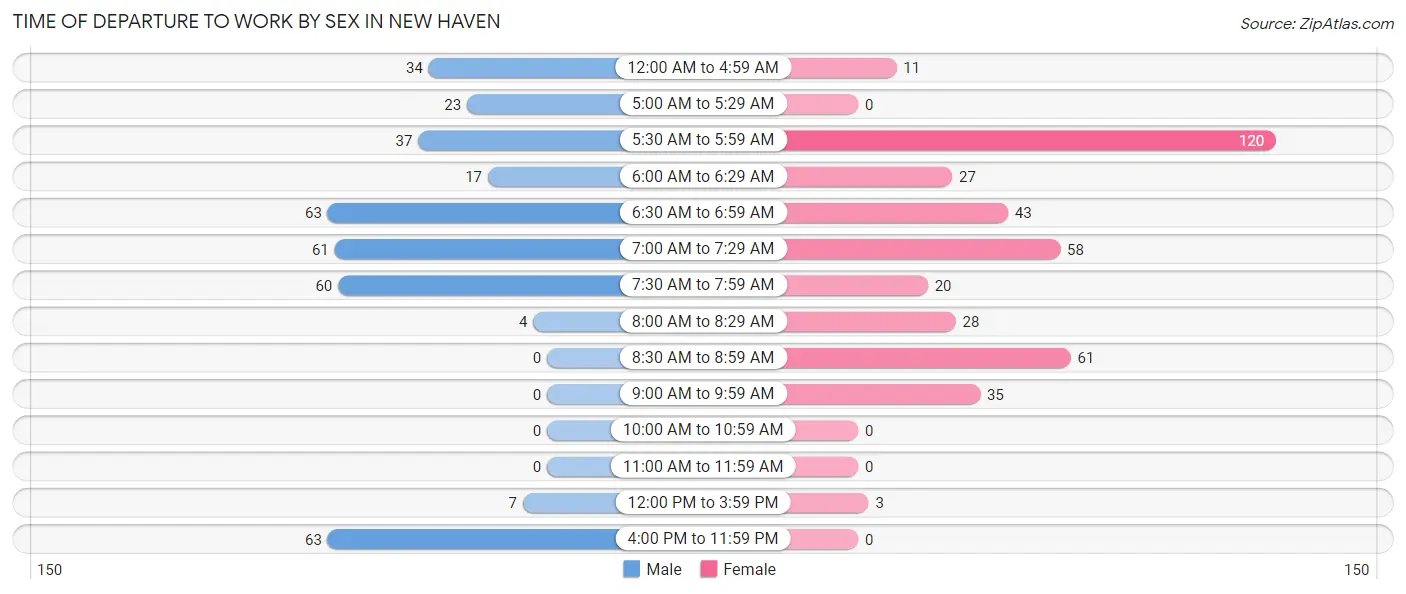
| Time of Departure | Male | Female |
| 12:00 AM to 4:59 AM | 34 (9.2%) | 11 (2.7%) |
| 5:00 AM to 5:29 AM | 23 (6.2%) | 0 (0.0%) |
| 5:30 AM to 5:59 AM | 37 (10.0%) | 120 (29.6%) |
| 6:00 AM to 6:29 AM | 17 (4.6%) | 27 (6.7%) |
| 6:30 AM to 6:59 AM | 63 (17.1%) | 43 (10.6%) |
| 7:00 AM to 7:29 AM | 61 (16.5%) | 58 (14.3%) |
| 7:30 AM to 7:59 AM | 60 (16.3%) | 20 (4.9%) |
| 8:00 AM to 8:29 AM | 4 (1.1%) | 28 (6.9%) |
| 8:30 AM to 8:59 AM | 0 (0.0%) | 61 (15.0%) |
| 9:00 AM to 9:59 AM | 0 (0.0%) | 35 (8.6%) |
| 10:00 AM to 10:59 AM | 0 (0.0%) | 0 (0.0%) |
| 11:00 AM to 11:59 AM | 0 (0.0%) | 0 (0.0%) |
| 12:00 PM to 3:59 PM | 7 (1.9%) | 3 (0.7%) |
| 4:00 PM to 11:59 PM | 63 (17.1%) | 0 (0.0%) |
| Total | 369 (100.0%) | 406 (100.0%) |
Housing Occupancy in New Haven
Occupancy by Ownership in New Haven
Of the total 719 dwellings in New Haven, owner-occupied units account for 630 (87.6%), while renter-occupied units make up 89 (12.4%).
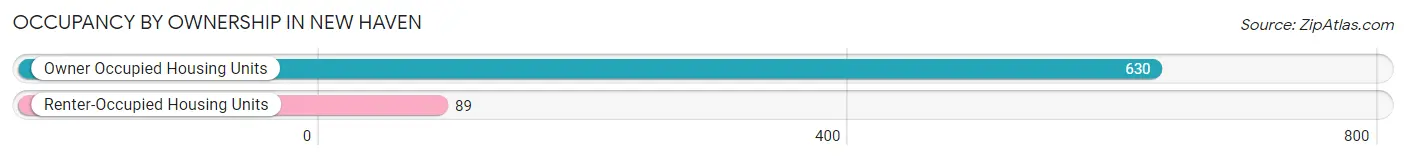
| Occupancy | # Housing Units | % Housing Units |
| Owner Occupied Housing Units | 630 | 87.6% |
| Renter-Occupied Housing Units | 89 | 12.4% |
| Total Occupied Housing Units | 719 | 100.0% |
Occupancy by Household Size in New Haven
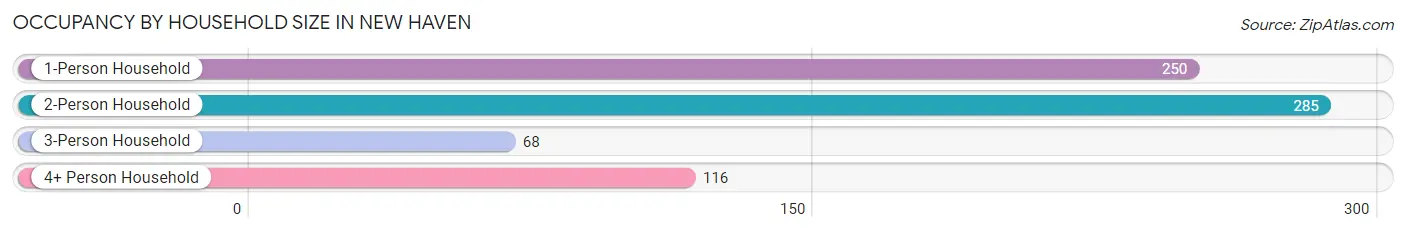
| Household Size | # Housing Units | % Housing Units |
| 1-Person Household | 250 | 34.8% |
| 2-Person Household | 285 | 39.6% |
| 3-Person Household | 68 | 9.5% |
| 4+ Person Household | 116 | 16.1% |
| Total Housing Units | 719 | 100.0% |
Occupancy by Ownership by Household Size in New Haven
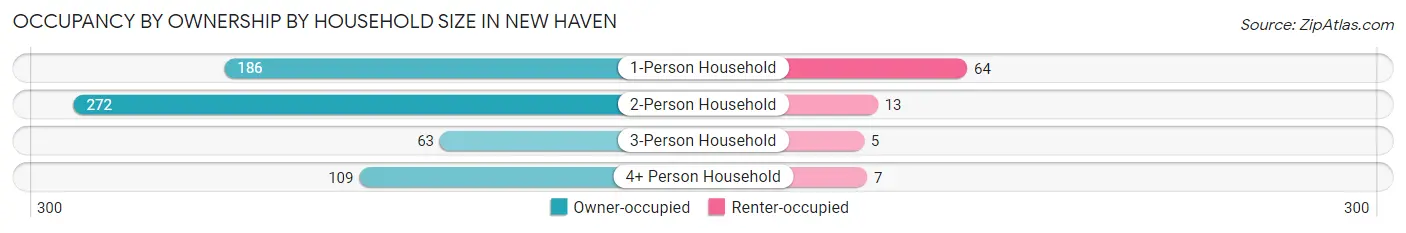
| Household Size | Owner-occupied | Renter-occupied |
| 1-Person Household | 186 (74.4%) | 64 (25.6%) |
| 2-Person Household | 272 (95.4%) | 13 (4.6%) |
| 3-Person Household | 63 (92.6%) | 5 (7.3%) |
| 4+ Person Household | 109 (94.0%) | 7 (6.0%) |
| Total Housing Units | 630 (87.6%) | 89 (12.4%) |
Occupancy by Educational Attainment in New Haven
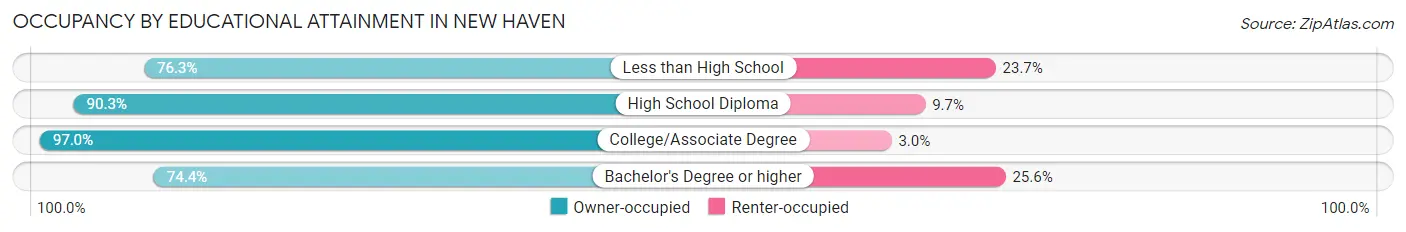
| Household Size | Owner-occupied | Renter-occupied |
| Less than High School | 87 (76.3%) | 27 (23.7%) |
| High School Diploma | 232 (90.3%) | 25 (9.7%) |
| College/Associate Degree | 224 (97.0%) | 7 (3.0%) |
| Bachelor's Degree or higher | 87 (74.4%) | 30 (25.6%) |
Occupancy by Age of Householder in New Haven
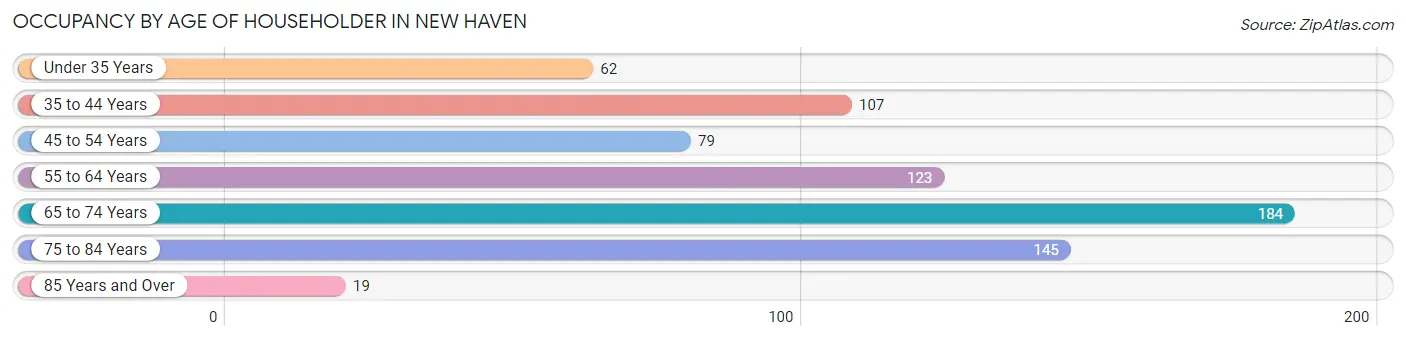
| Age Bracket | # Households | % Households |
| Under 35 Years | 62 | 8.6% |
| 35 to 44 Years | 107 | 14.9% |
| 45 to 54 Years | 79 | 11.0% |
| 55 to 64 Years | 123 | 17.1% |
| 65 to 74 Years | 184 | 25.6% |
| 75 to 84 Years | 145 | 20.2% |
| 85 Years and Over | 19 | 2.6% |
| Total | 719 | 100.0% |
Housing Finances in New Haven
Median Income by Occupancy in New Haven
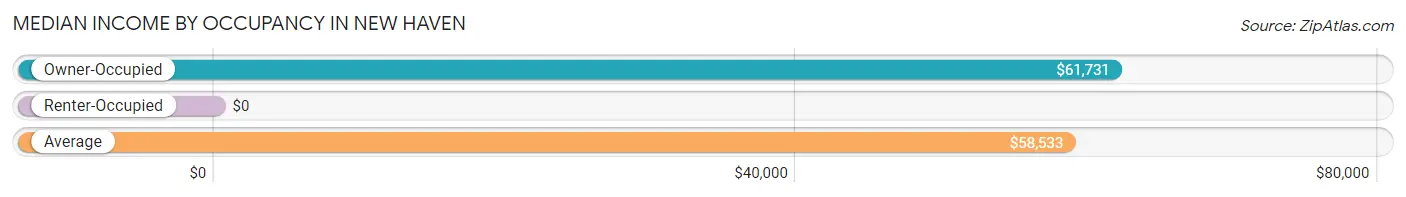
| Occupancy Type | # Households | Median Income |
| Owner-Occupied | 630 (87.6%) | $61,731 |
| Renter-Occupied | 89 (12.4%) | $0 |
| Average | 719 (100.0%) | $58,533 |
Occupancy by Householder Income Bracket in New Haven
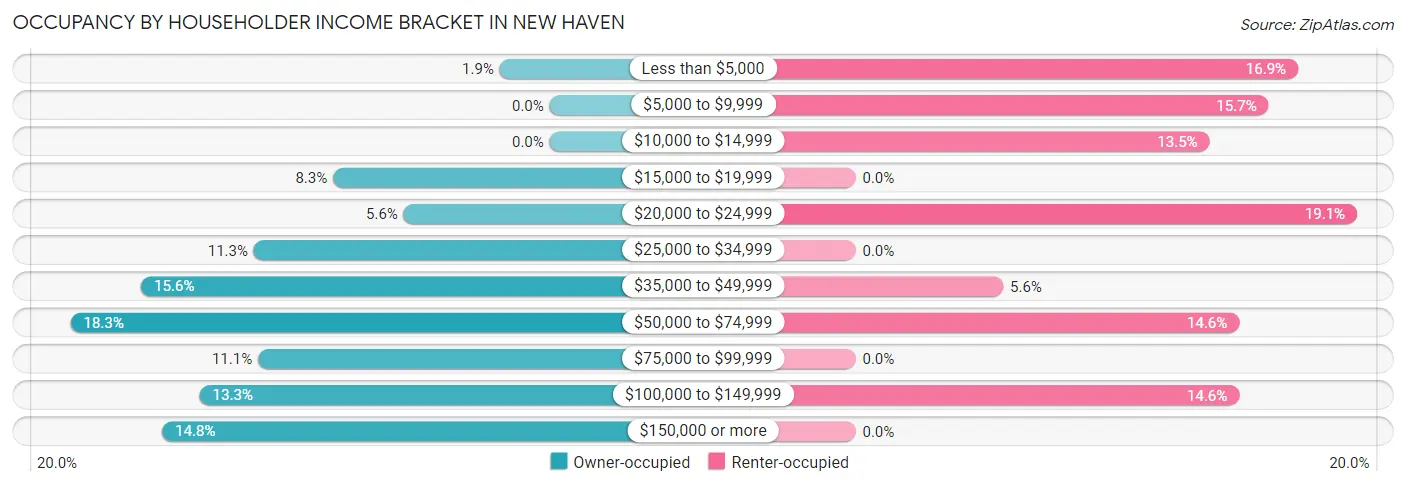
| Income Bracket | Owner-occupied | Renter-occupied |
| Less than $5,000 | 12 (1.9%) | 15 (16.9%) |
| $5,000 to $9,999 | 0 (0.0%) | 14 (15.7%) |
| $10,000 to $14,999 | 0 (0.0%) | 12 (13.5%) |
| $15,000 to $19,999 | 52 (8.3%) | 0 (0.0%) |
| $20,000 to $24,999 | 35 (5.6%) | 17 (19.1%) |
| $25,000 to $34,999 | 71 (11.3%) | 0 (0.0%) |
| $35,000 to $49,999 | 98 (15.6%) | 5 (5.6%) |
| $50,000 to $74,999 | 115 (18.2%) | 13 (14.6%) |
| $75,000 to $99,999 | 70 (11.1%) | 0 (0.0%) |
| $100,000 to $149,999 | 84 (13.3%) | 13 (14.6%) |
| $150,000 or more | 93 (14.8%) | 0 (0.0%) |
| Total | 630 (100.0%) | 89 (100.0%) |
Monthly Housing Cost Tiers in New Haven
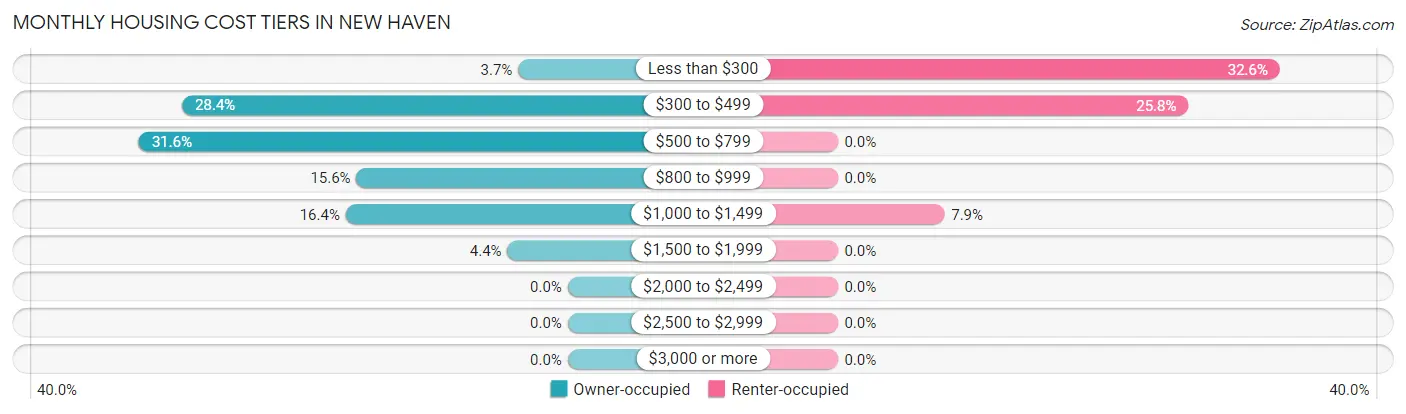
| Monthly Cost | Owner-occupied | Renter-occupied |
| Less than $300 | 23 (3.6%) | 29 (32.6%) |
| $300 to $499 | 179 (28.4%) | 23 (25.8%) |
| $500 to $799 | 199 (31.6%) | 0 (0.0%) |
| $800 to $999 | 98 (15.6%) | 0 (0.0%) |
| $1,000 to $1,499 | 103 (16.4%) | 7 (7.9%) |
| $1,500 to $1,999 | 28 (4.4%) | 0 (0.0%) |
| $2,000 to $2,499 | 0 (0.0%) | 0 (0.0%) |
| $2,500 to $2,999 | 0 (0.0%) | 0 (0.0%) |
| $3,000 or more | 0 (0.0%) | 0 (0.0%) |
| Total | 630 (100.0%) | 89 (100.0%) |
Physical Housing Characteristics in New Haven
Housing Structures in New Haven
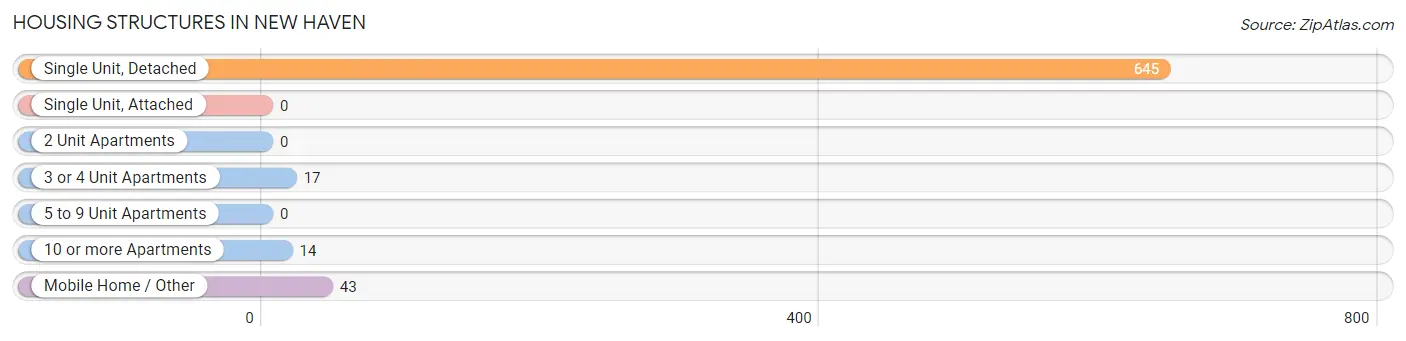
| Structure Type | # Housing Units | % Housing Units |
| Single Unit, Detached | 645 | 89.7% |
| Single Unit, Attached | 0 | 0.0% |
| 2 Unit Apartments | 0 | 0.0% |
| 3 or 4 Unit Apartments | 17 | 2.4% |
| 5 to 9 Unit Apartments | 0 | 0.0% |
| 10 or more Apartments | 14 | 1.9% |
| Mobile Home / Other | 43 | 6.0% |
| Total | 719 | 100.0% |
Housing Structures by Occupancy in New Haven
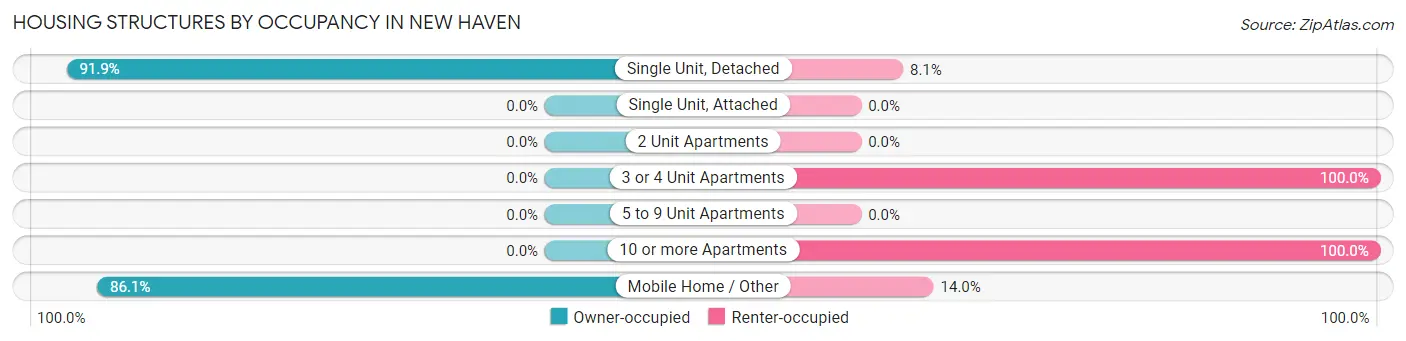
| Structure Type | Owner-occupied | Renter-occupied |
| Single Unit, Detached | 593 (91.9%) | 52 (8.1%) |
| Single Unit, Attached | 0 (0.0%) | 0 (0.0%) |
| 2 Unit Apartments | 0 (0.0%) | 0 (0.0%) |
| 3 or 4 Unit Apartments | 0 (0.0%) | 17 (100.0%) |
| 5 to 9 Unit Apartments | 0 (0.0%) | 0 (0.0%) |
| 10 or more Apartments | 0 (0.0%) | 14 (100.0%) |
| Mobile Home / Other | 37 (86.1%) | 6 (14.0%) |
| Total | 630 (87.6%) | 89 (12.4%) |
Housing Structures by Number of Rooms in New Haven
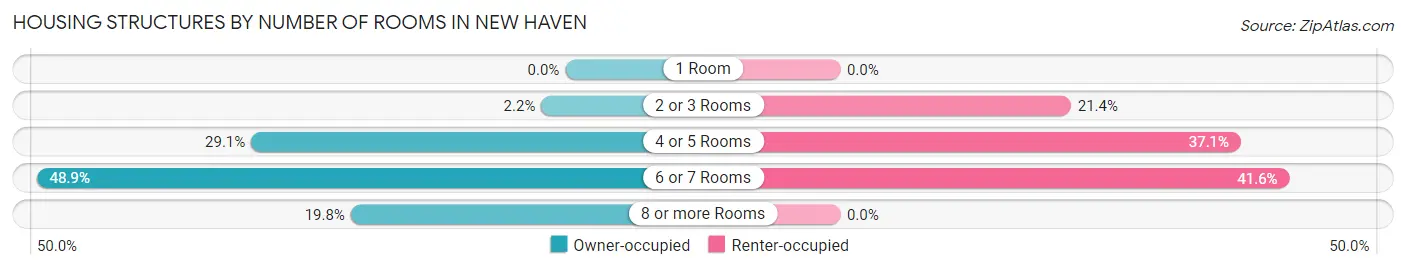
| Number of Rooms | Owner-occupied | Renter-occupied |
| 1 Room | 0 (0.0%) | 0 (0.0%) |
| 2 or 3 Rooms | 14 (2.2%) | 19 (21.3%) |
| 4 or 5 Rooms | 183 (29.0%) | 33 (37.1%) |
| 6 or 7 Rooms | 308 (48.9%) | 37 (41.6%) |
| 8 or more Rooms | 125 (19.8%) | 0 (0.0%) |
| Total | 630 (100.0%) | 89 (100.0%) |
Housing Structure by Heating Type in New Haven
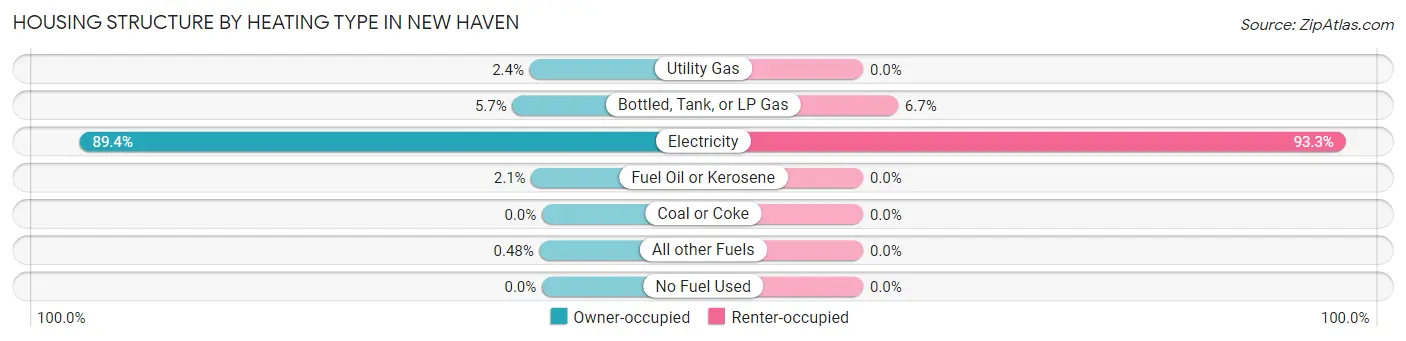
| Heating Type | Owner-occupied | Renter-occupied |
| Utility Gas | 15 (2.4%) | 0 (0.0%) |
| Bottled, Tank, or LP Gas | 36 (5.7%) | 6 (6.7%) |
| Electricity | 563 (89.4%) | 83 (93.3%) |
| Fuel Oil or Kerosene | 13 (2.1%) | 0 (0.0%) |
| Coal or Coke | 0 (0.0%) | 0 (0.0%) |
| All other Fuels | 3 (0.5%) | 0 (0.0%) |
| No Fuel Used | 0 (0.0%) | 0 (0.0%) |
| Total | 630 (100.0%) | 89 (100.0%) |
Household Vehicle Usage in New Haven
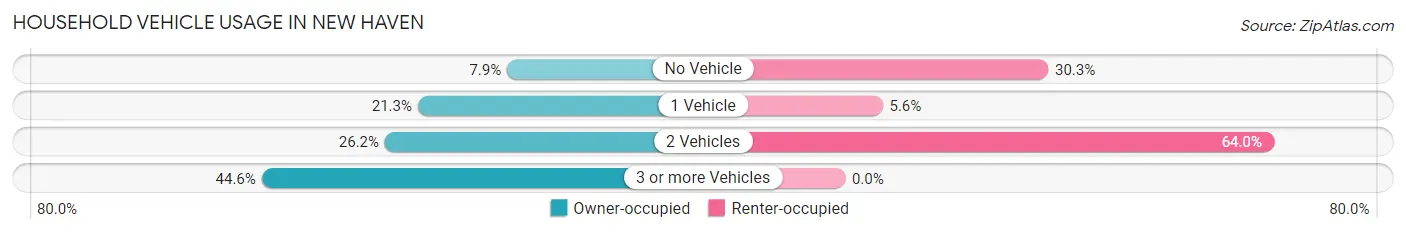
| Vehicles per Household | Owner-occupied | Renter-occupied |
| No Vehicle | 50 (7.9%) | 27 (30.3%) |
| 1 Vehicle | 134 (21.3%) | 5 (5.6%) |
| 2 Vehicles | 165 (26.2%) | 57 (64.0%) |
| 3 or more Vehicles | 281 (44.6%) | 0 (0.0%) |
| Total | 630 (100.0%) | 89 (100.0%) |
Real Estate & Mortgages in New Haven
Real Estate and Mortgage Overview in New Haven
| Characteristic | Without Mortgage | With Mortgage |
| Housing Units | 336 | 294 |
| Median Property Value | $101,400 | $95,600 |
| Median Household Income | $42,073 | $79 |
| Monthly Housing Costs | $466 | $0 |
| Real Estate Taxes | $520 | $0 |
Property Value by Mortgage Status in New Haven
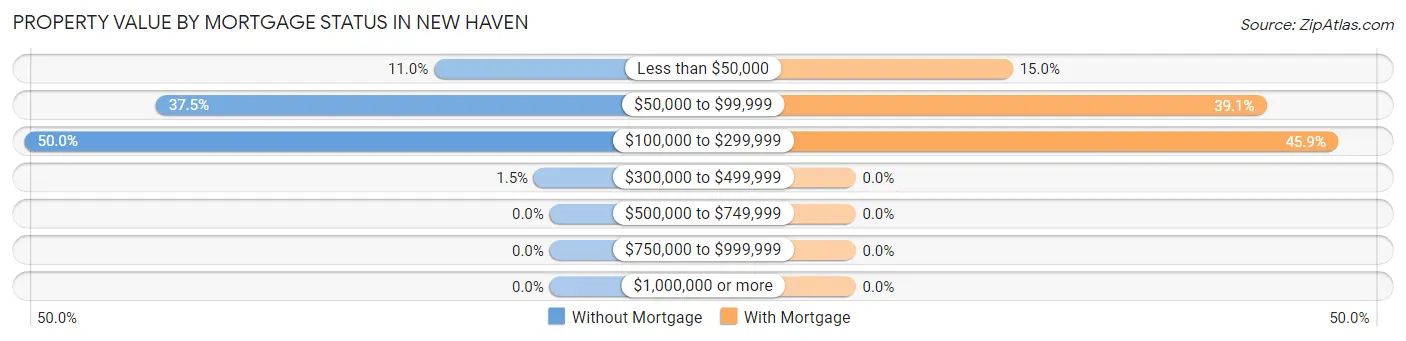
| Property Value | Without Mortgage | With Mortgage |
| Less than $50,000 | 37 (11.0%) | 44 (15.0%) |
| $50,000 to $99,999 | 126 (37.5%) | 115 (39.1%) |
| $100,000 to $299,999 | 168 (50.0%) | 135 (45.9%) |
| $300,000 to $499,999 | 5 (1.5%) | 0 (0.0%) |
| $500,000 to $749,999 | 0 (0.0%) | 0 (0.0%) |
| $750,000 to $999,999 | 0 (0.0%) | 0 (0.0%) |
| $1,000,000 or more | 0 (0.0%) | 0 (0.0%) |
| Total | 336 (100.0%) | 294 (100.0%) |
Household Income by Mortgage Status in New Haven
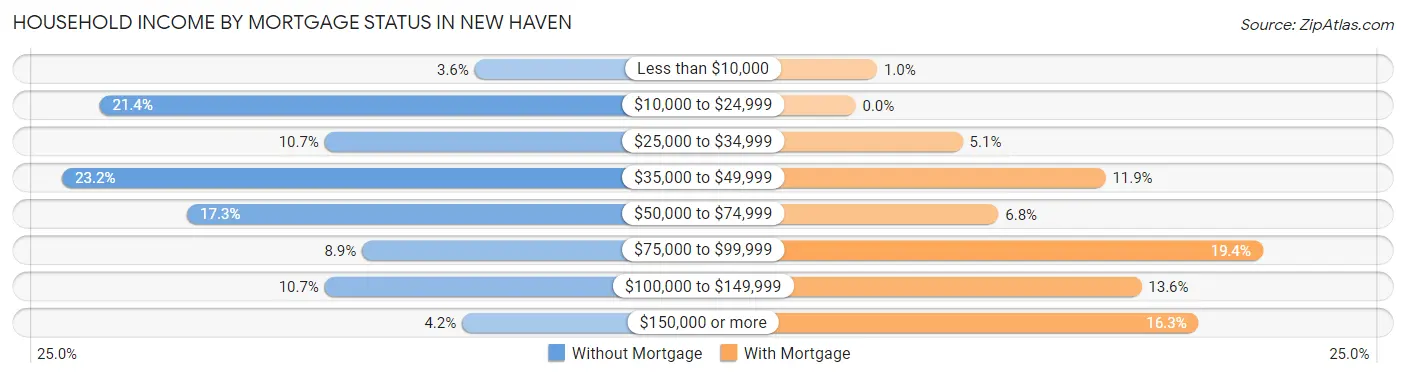
| Household Income | Without Mortgage | With Mortgage |
| Less than $10,000 | 12 (3.6%) | 3 (1.0%) |
| $10,000 to $24,999 | 72 (21.4%) | 0 (0.0%) |
| $25,000 to $34,999 | 36 (10.7%) | 15 (5.1%) |
| $35,000 to $49,999 | 78 (23.2%) | 35 (11.9%) |
| $50,000 to $74,999 | 58 (17.3%) | 20 (6.8%) |
| $75,000 to $99,999 | 30 (8.9%) | 57 (19.4%) |
| $100,000 to $149,999 | 36 (10.7%) | 40 (13.6%) |
| $150,000 or more | 14 (4.2%) | 48 (16.3%) |
| Total | 336 (100.0%) | 294 (100.0%) |
Property Value to Household Income Ratio in New Haven
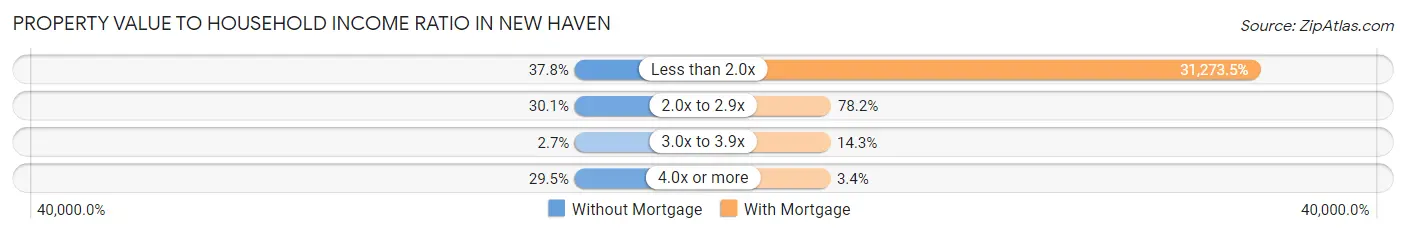
| Value-to-Income Ratio | Without Mortgage | With Mortgage |
| Less than 2.0x | 127 (37.8%) | 91,944 (31,273.5%) |
| 2.0x to 2.9x | 101 (30.1%) | 230 (78.2%) |
| 3.0x to 3.9x | 9 (2.7%) | 42 (14.3%) |
| 4.0x or more | 99 (29.5%) | 10 (3.4%) |
| Total | 336 (100.0%) | 294 (100.0%) |
Real Estate Taxes by Mortgage Status in New Haven
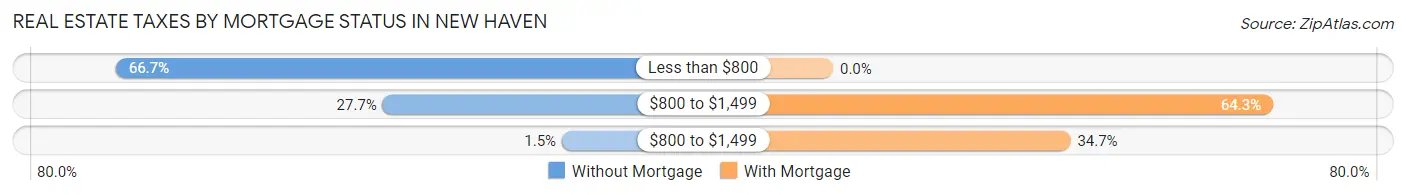
| Property Taxes | Without Mortgage | With Mortgage |
| Less than $800 | 224 (66.7%) | 0 (0.0%) |
| $800 to $1,499 | 93 (27.7%) | 189 (64.3%) |
| $800 to $1,499 | 5 (1.5%) | 102 (34.7%) |
| Total | 336 (100.0%) | 294 (100.0%) |
Health & Disability in New Haven
Health Insurance Coverage by Age in New Haven
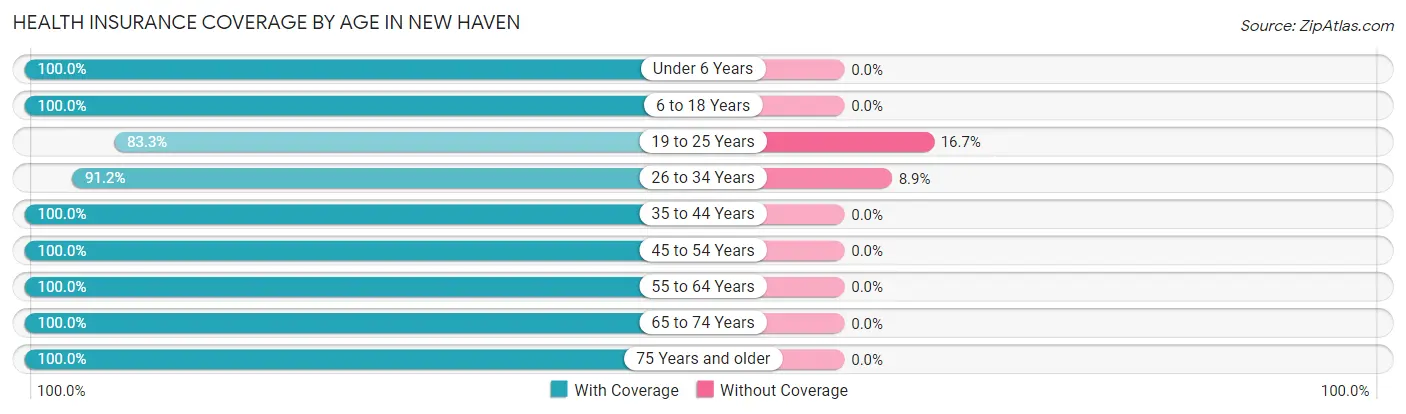
| Age Bracket | With Coverage | Without Coverage |
| Under 6 Years | 84 (100.0%) | 0 (0.0%) |
| 6 to 18 Years | 147 (100.0%) | 0 (0.0%) |
| 19 to 25 Years | 145 (83.3%) | 29 (16.7%) |
| 26 to 34 Years | 175 (91.1%) | 17 (8.8%) |
| 35 to 44 Years | 251 (100.0%) | 0 (0.0%) |
| 45 to 54 Years | 224 (100.0%) | 0 (0.0%) |
| 55 to 64 Years | 246 (100.0%) | 0 (0.0%) |
| 65 to 74 Years | 253 (100.0%) | 0 (0.0%) |
| 75 Years and older | 190 (100.0%) | 0 (0.0%) |
| Total | 1,715 (97.4%) | 46 (2.6%) |
Health Insurance Coverage by Citizenship Status in New Haven
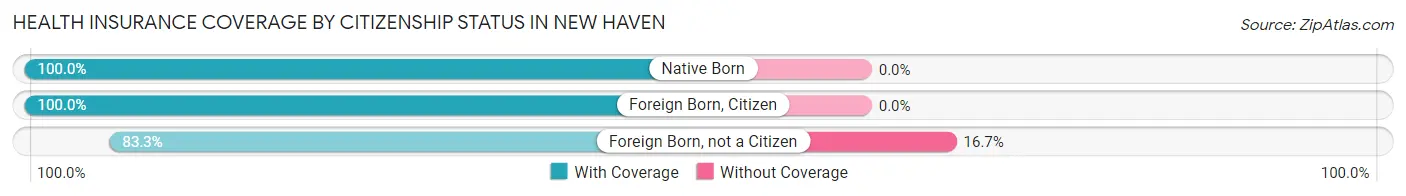
| Citizenship Status | With Coverage | Without Coverage |
| Native Born | 84 (100.0%) | 0 (0.0%) |
| Foreign Born, Citizen | 147 (100.0%) | 0 (0.0%) |
| Foreign Born, not a Citizen | 145 (83.3%) | 29 (16.7%) |
Health Insurance Coverage by Household Income in New Haven
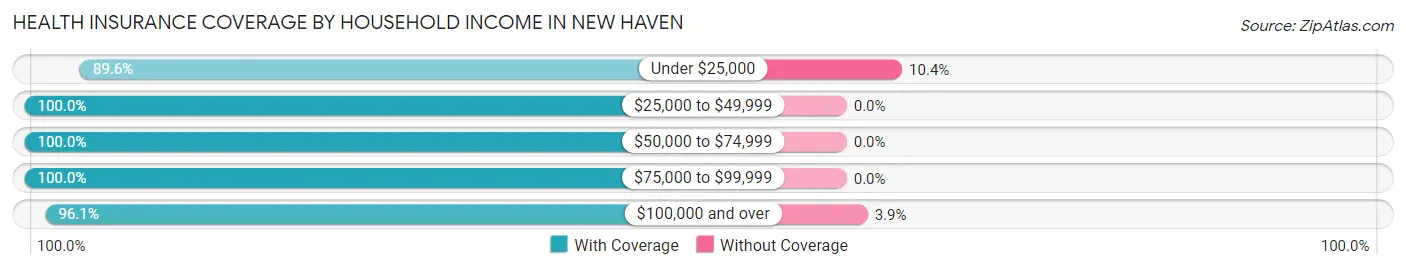
| Household Income | With Coverage | Without Coverage |
| Under $25,000 | 147 (89.6%) | 17 (10.4%) |
| $25,000 to $49,999 | 351 (100.0%) | 0 (0.0%) |
| $50,000 to $74,999 | 296 (100.0%) | 0 (0.0%) |
| $75,000 to $99,999 | 210 (100.0%) | 0 (0.0%) |
| $100,000 and over | 711 (96.1%) | 29 (3.9%) |
Public vs Private Health Insurance Coverage by Age in New Haven
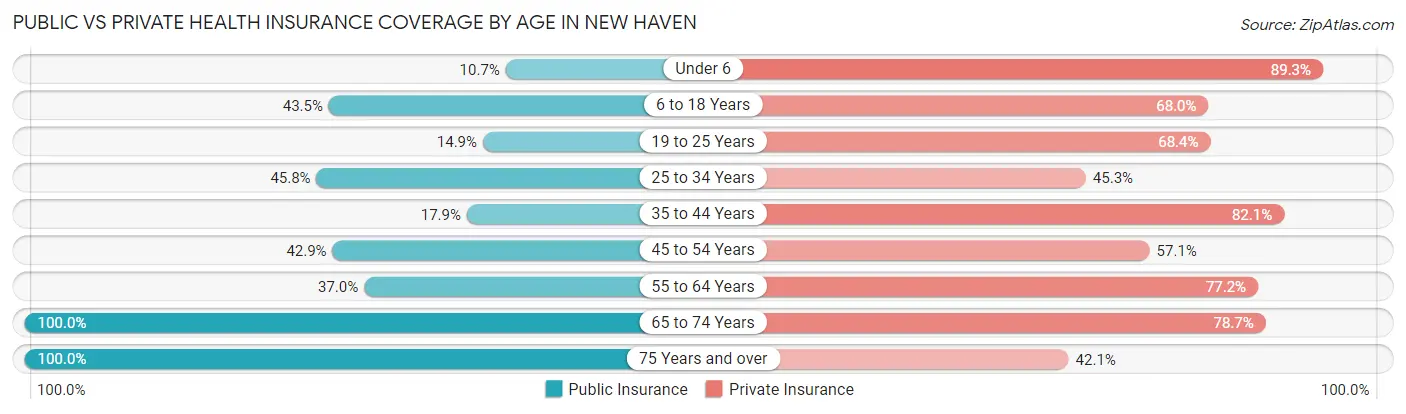
| Age Bracket | Public Insurance | Private Insurance |
| Under 6 | 9 (10.7%) | 75 (89.3%) |
| 6 to 18 Years | 64 (43.5%) | 100 (68.0%) |
| 19 to 25 Years | 26 (14.9%) | 119 (68.4%) |
| 25 to 34 Years | 88 (45.8%) | 87 (45.3%) |
| 35 to 44 Years | 45 (17.9%) | 206 (82.1%) |
| 45 to 54 Years | 96 (42.9%) | 128 (57.1%) |
| 55 to 64 Years | 91 (37.0%) | 190 (77.2%) |
| 65 to 74 Years | 253 (100.0%) | 199 (78.7%) |
| 75 Years and over | 190 (100.0%) | 80 (42.1%) |
| Total | 862 (48.9%) | 1,184 (67.2%) |
Disability Status by Sex by Age in New Haven
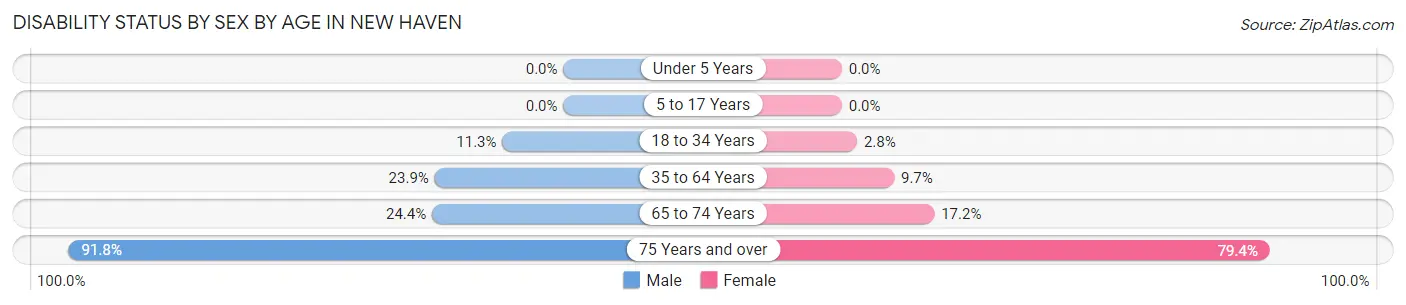
| Age Bracket | Male | Female |
| Under 5 Years | 0 (0.0%) | 0 (0.0%) |
| 5 to 17 Years | 0 (0.0%) | 0 (0.0%) |
| 18 to 34 Years | 18 (11.3%) | 6 (2.8%) |
| 35 to 64 Years | 86 (23.9%) | 35 (9.7%) |
| 65 to 74 Years | 29 (24.4%) | 23 (17.2%) |
| 75 Years and over | 45 (91.8%) | 112 (79.4%) |
Disability Class by Sex by Age in New Haven
Disability Class: Hearing Difficulty
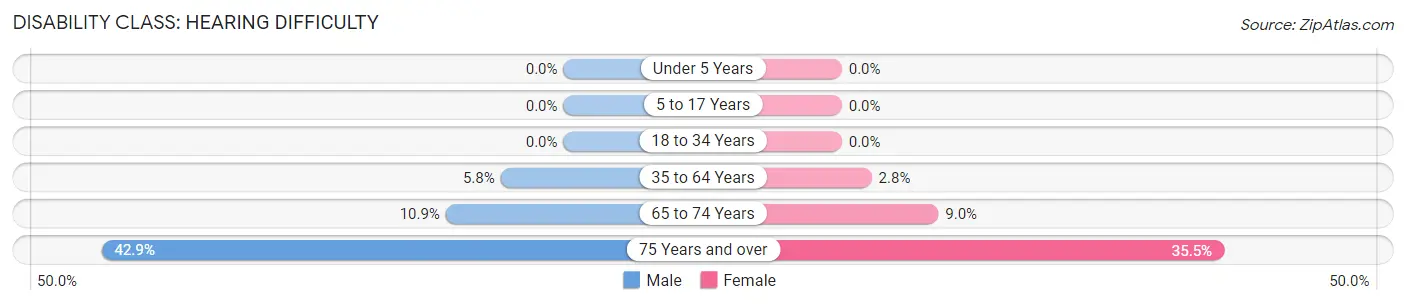
| Age Bracket | Male | Female |
| Under 5 Years | 0 (0.0%) | 0 (0.0%) |
| 5 to 17 Years | 0 (0.0%) | 0 (0.0%) |
| 18 to 34 Years | 0 (0.0%) | 0 (0.0%) |
| 35 to 64 Years | 21 (5.8%) | 10 (2.8%) |
| 65 to 74 Years | 13 (10.9%) | 12 (9.0%) |
| 75 Years and over | 21 (42.9%) | 50 (35.5%) |
Disability Class: Vision Difficulty
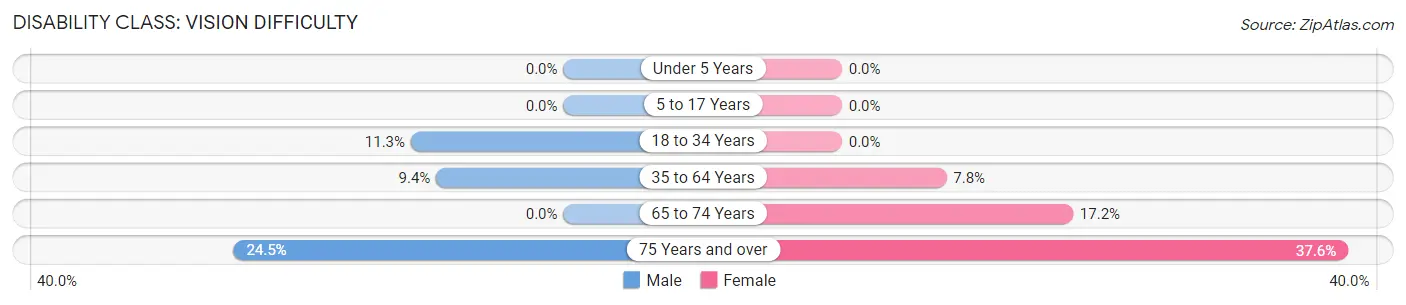
| Age Bracket | Male | Female |
| Under 5 Years | 0 (0.0%) | 0 (0.0%) |
| 5 to 17 Years | 0 (0.0%) | 0 (0.0%) |
| 18 to 34 Years | 18 (11.3%) | 0 (0.0%) |
| 35 to 64 Years | 34 (9.4%) | 28 (7.8%) |
| 65 to 74 Years | 0 (0.0%) | 23 (17.2%) |
| 75 Years and over | 12 (24.5%) | 53 (37.6%) |
Disability Class: Cognitive Difficulty
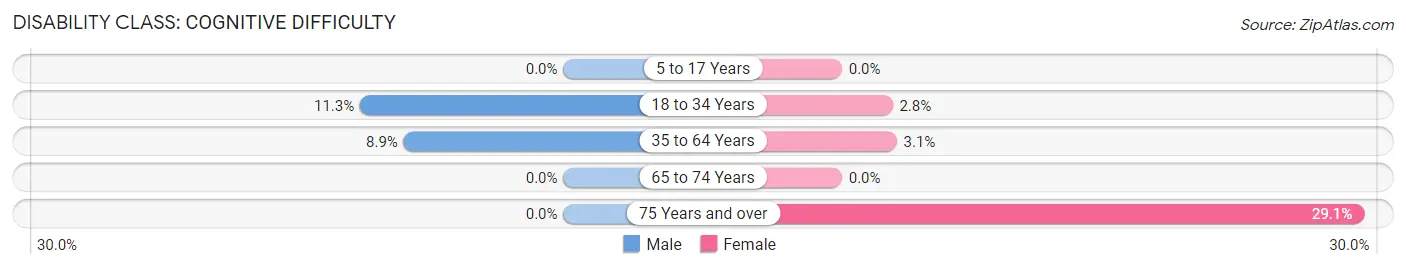
| Age Bracket | Male | Female |
| 5 to 17 Years | 0 (0.0%) | 0 (0.0%) |
| 18 to 34 Years | 18 (11.3%) | 6 (2.8%) |
| 35 to 64 Years | 32 (8.9%) | 11 (3.0%) |
| 65 to 74 Years | 0 (0.0%) | 0 (0.0%) |
| 75 Years and over | 0 (0.0%) | 41 (29.1%) |
Disability Class: Ambulatory Difficulty
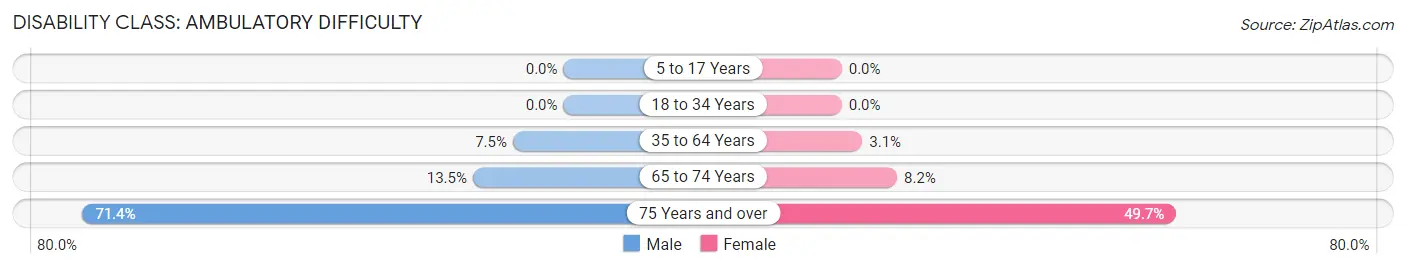
| Age Bracket | Male | Female |
| 5 to 17 Years | 0 (0.0%) | 0 (0.0%) |
| 18 to 34 Years | 0 (0.0%) | 0 (0.0%) |
| 35 to 64 Years | 27 (7.5%) | 11 (3.0%) |
| 65 to 74 Years | 16 (13.5%) | 11 (8.2%) |
| 75 Years and over | 35 (71.4%) | 70 (49.6%) |
Disability Class: Self-Care Difficulty
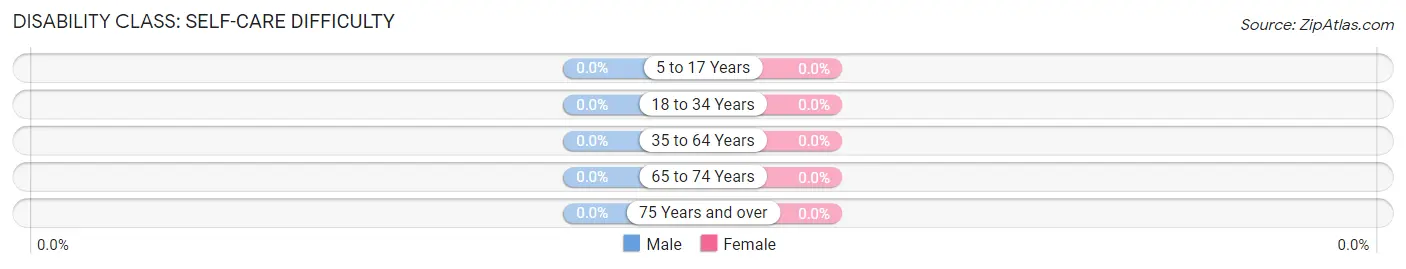
| Age Bracket | Male | Female |
| 5 to 17 Years | 0 (0.0%) | 0 (0.0%) |
| 18 to 34 Years | 0 (0.0%) | 0 (0.0%) |
| 35 to 64 Years | 0 (0.0%) | 0 (0.0%) |
| 65 to 74 Years | 0 (0.0%) | 0 (0.0%) |
| 75 Years and over | 0 (0.0%) | 0 (0.0%) |
Technology Access in New Haven
Computing Device Access in New Haven
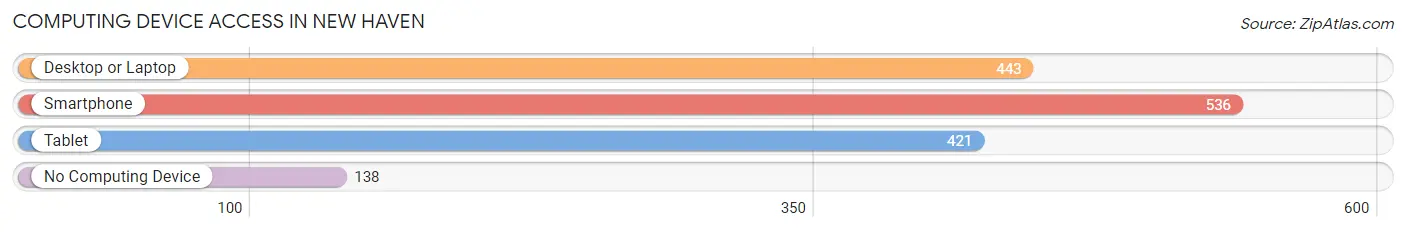
| Device Type | # Households | % Households |
| Desktop or Laptop | 443 | 61.6% |
| Smartphone | 536 | 74.6% |
| Tablet | 421 | 58.6% |
| No Computing Device | 138 | 19.2% |
| Total | 719 | 100.0% |
Internet Access in New Haven
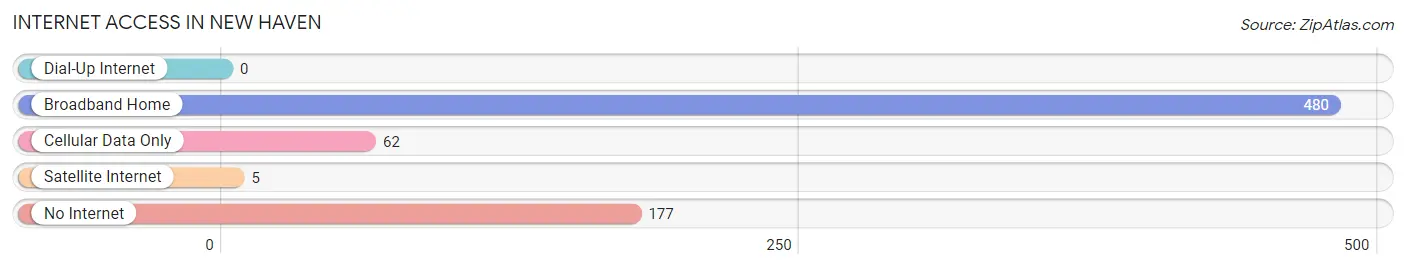
| Internet Type | # Households | % Households |
| Dial-Up Internet | 0 | 0.0% |
| Broadband Home | 480 | 66.8% |
| Cellular Data Only | 62 | 8.6% |
| Satellite Internet | 5 | 0.7% |
| No Internet | 177 | 24.6% |
| Total | 719 | 100.0% |
New Haven Summary
New Haven, West Virginia is a small town located in the northern part of the state, in the heart of the Appalachian Mountains. It is situated in the county of Mason, and is part of the Point Pleasant Micropolitan Statistical Area. The town has a population of just over 1,000 people, and is known for its rural charm and friendly atmosphere.
History
New Haven was founded in 1817 by a group of settlers from Virginia. The town was originally known as “New Haven Station”, and was a stop on the Ohio and Kanawha Turnpike. The town was officially incorporated in 1872, and was named after the city of New Haven, Connecticut.
The town was an important stop on the Ohio and Kanawha Turnpike, and was a major hub for the transportation of goods and services. The town was also a major stop on the Underground Railroad, and was a safe haven for escaped slaves.
Geography
New Haven is located in the northern part of West Virginia, in the heart of the Appalachian Mountains. The town is situated in the county of Mason, and is part of the Point Pleasant Micropolitan Statistical Area. The town is located at the intersection of US Route 35 and West Virginia Route 2.
The town is situated on the banks of the Ohio River, and is surrounded by rolling hills and lush forests. The town is located at an elevation of 845 feet above sea level.
Economy
The economy of New Haven is largely based on agriculture and tourism. The town is home to several small farms, and is known for its production of apples, peaches, and other fruits and vegetables. The town is also home to several small businesses, including restaurants, shops, and other services.
The town is also a popular tourist destination, and is known for its rural charm and friendly atmosphere. The town is home to several historic sites, including the Mason County Courthouse, the Mason County Historical Society, and the Mason County Museum.
Demographics
As of the 2010 census, the population of New Haven was 1,039. The racial makeup of the town was 97.3% White, 0.7% African American, 0.2% Native American, 0.2% Asian, 0.1% Pacific Islander, 0.2% from other races, and 1.3% from two or more races. Hispanic or Latino of any race were 0.7% of the population.
The median income for a household in the town was $30,938, and the median income for a family was $37,500. The per capita income for the town was $15,945. About 16.3% of families and 19.2% of the population were below the poverty line, including 25.2% of those under age 18 and 11.3% of those age 65 or over.
New Haven is a small town with a rich history and a friendly atmosphere. The town is known for its rural charm and its production of fruits and vegetables. The town is also a popular tourist destination, and is home to several historic sites. The town has a population of just over 1,000 people, and is an important part of the Point Pleasant Micropolitan Statistical Area.
Common Questions
What is the Total Population of New Haven?
Total Population of New Haven is 1,761.
What is the Total Male Population of New Haven?
Total Male Population of New Haven is 746.
What is the Total Female Population of New Haven?
Total Female Population of New Haven is 1,015.
What is the Ratio of Males per 100 Females in New Haven?
There are 73.50 Males per 100 Females in New Haven.
What is the Ratio of Females per 100 Males in New Haven?
There are 136.06 Females per 100 Males in New Haven.
What is the Median Population Age in New Haven?
Median Population Age in New Haven is 48.3 Years.
What is the Average Family Size in New Haven
Average Family Size in New Haven is 3.3 People.
What is the Average Household Size in New Haven
Average Household Size in New Haven is 2.5 People.
What is Per Capita Income in New Haven?
Per Capita income in New Haven is $46,248.
What is the Median Family Income in New Haven?
Median Family Income in New Haven is $83,966.
What is the Median Household income in New Haven?
Median Household Income in New Haven is $58,533.
What is Income or Wage Gap in New Haven?
Income or Wage Gap in New Haven is 34.1%.
Women in New Haven earn 65.9 cents for every dollar earned by a man.
What is Inequality or Gini Index in New Haven?
Inequality or Gini Index in New Haven is 0.59.
How Large is the Labor Force in New Haven?
There are 840 People in the Labor Forcein in New Haven.
What is the Percentage of People in the Labor Force in New Haven?
54.3% of People are in the Labor Force in New Haven.
What is the Unemployment Rate in New Haven?
Unemployment Rate in New Haven is 4.4%.