Bolivar, WV
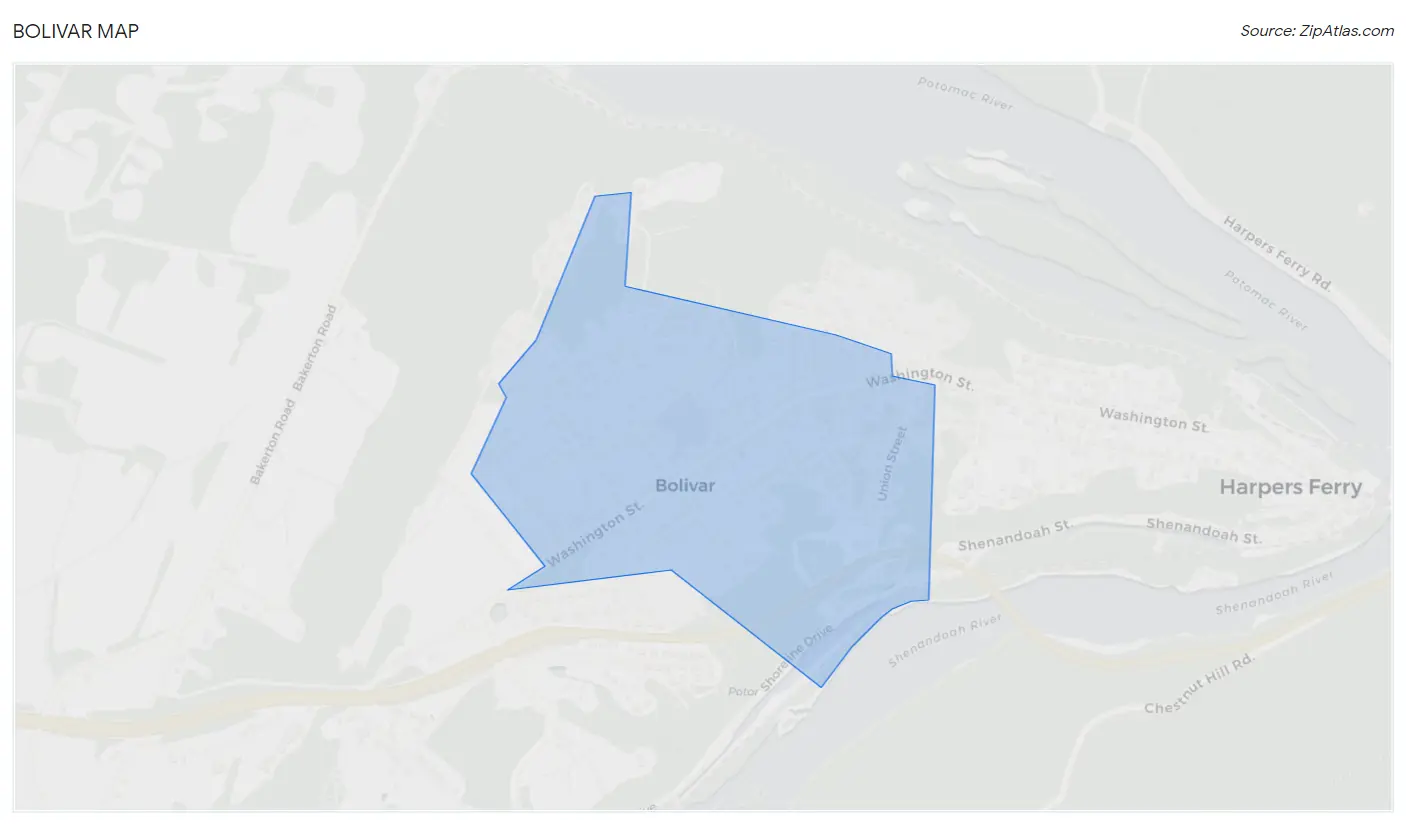
Bolivar Map
Bolivar Overview
1,283
TOTAL POPULATION
662
MALE POPULATION
621
FEMALE POPULATION
106.60
MALES / 100 FEMALES
93.81
FEMALES / 100 MALES
39.9
MEDIAN AGE
3.3
AVG FAMILY SIZE
2.4
AVG HOUSEHOLD SIZE
$37,523
PER CAPITA INCOME
$106,389
AVG FAMILY INCOME
$80,125
AVG HOUSEHOLD INCOME
6.1%
WAGE / INCOME GAP [ % ]
93.9¢/ $1
WAGE / INCOME GAP [ $ ]
0.40
INEQUALITY / GINI INDEX
817
LABOR FORCE [ PEOPLE ]
76.7%
PERCENT IN LABOR FORCE
5.6%
UNEMPLOYMENT RATE
Bolivar Area Codes
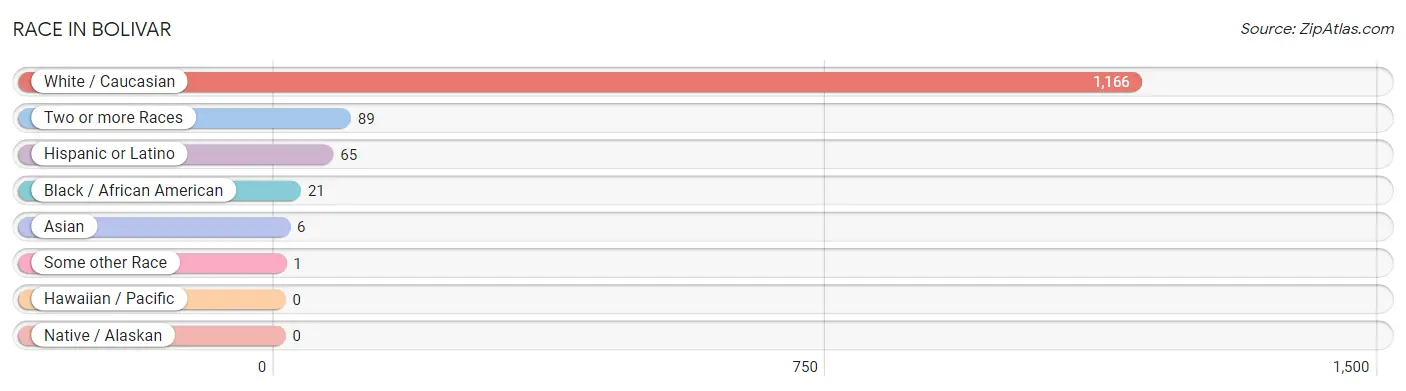
Race in Bolivar
The most populous races in Bolivar are White / Caucasian (1,166 | 90.9%), Two or more Races (89 | 6.9%), and Hispanic or Latino (65 | 5.1%).
| Race | # Population | % Population |
| Asian | 6 | 0.5% |
| Black / African American | 21 | 1.6% |
| Hawaiian / Pacific | 0 | 0.0% |
| Hispanic or Latino | 65 | 5.1% |
| Native / Alaskan | 0 | 0.0% |
| White / Caucasian | 1,166 | 90.9% |
| Two or more Races | 89 | 6.9% |
| Some other Race | 1 | 0.1% |
| Total | 1,283 | 100.0% |
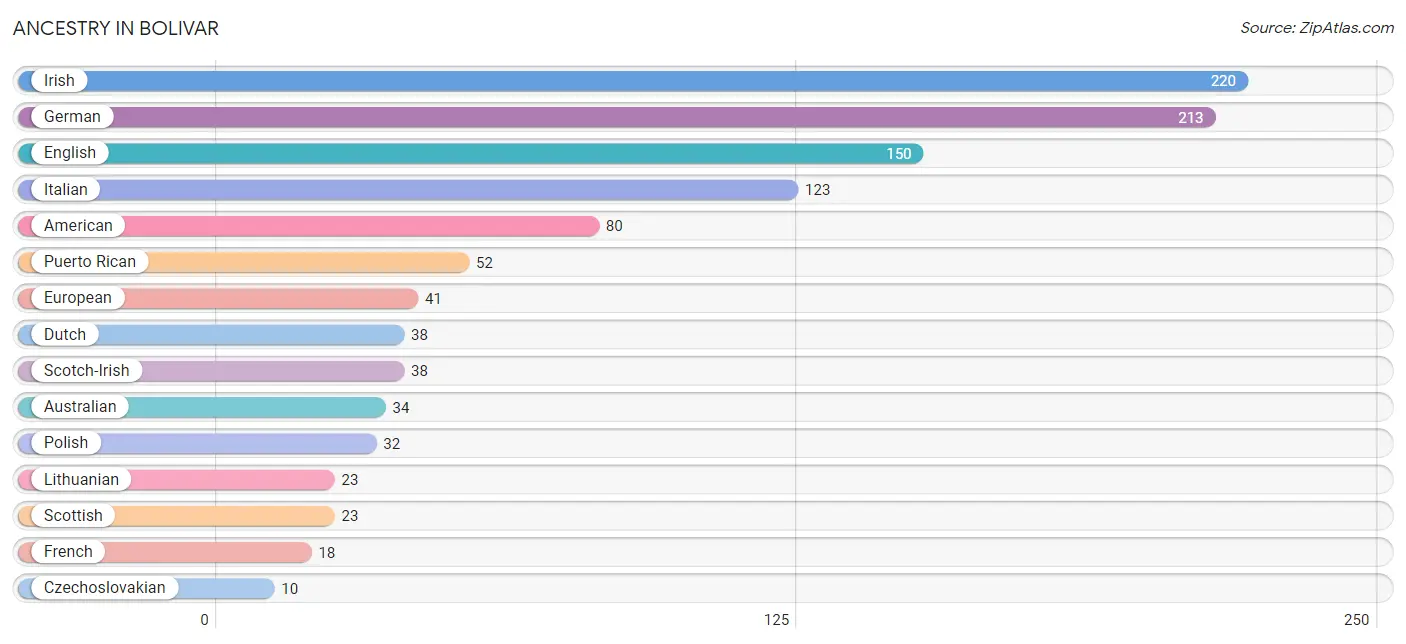
Ancestry in Bolivar
The most populous ancestries reported in Bolivar are Irish (220 | 17.2%), German (213 | 16.6%), English (150 | 11.7%), Italian (123 | 9.6%), and American (80 | 6.2%), together accounting for 61.3% of all Bolivar residents.
| Ancestry | # Population | % Population |
| American | 80 | 6.2% |
| Australian | 34 | 2.6% |
| Austrian | 2 | 0.2% |
| British | 4 | 0.3% |
| Cherokee | 2 | 0.2% |
| Choctaw | 2 | 0.2% |
| Colombian | 1 | 0.1% |
| Croatian | 3 | 0.2% |
| Czechoslovakian | 10 | 0.8% |
| Danish | 4 | 0.3% |
| Dutch | 38 | 3.0% |
| Eastern European | 4 | 0.3% |
| English | 150 | 11.7% |
| European | 41 | 3.2% |
| French | 18 | 1.4% |
| German | 213 | 16.6% |
| Indian (Asian) | 10 | 0.8% |
| Iranian | 3 | 0.2% |
| Irish | 220 | 17.2% |
| Italian | 123 | 9.6% |
| Latvian | 1 | 0.1% |
| Lithuanian | 23 | 1.8% |
| Norwegian | 3 | 0.2% |
| Polish | 32 | 2.5% |
| Puerto Rican | 52 | 4.1% |
| Romanian | 4 | 0.3% |
| Russian | 1 | 0.1% |
| Scandinavian | 9 | 0.7% |
| Scotch-Irish | 38 | 3.0% |
| Scottish | 23 | 1.8% |
| Slovak | 4 | 0.3% |
| Slovene | 3 | 0.2% |
| South American | 1 | 0.1% |
| Spaniard | 6 | 0.5% |
| Spanish | 6 | 0.5% |
| Ukrainian | 3 | 0.2% |
| Welsh | 3 | 0.2% | View All 37 Rows |
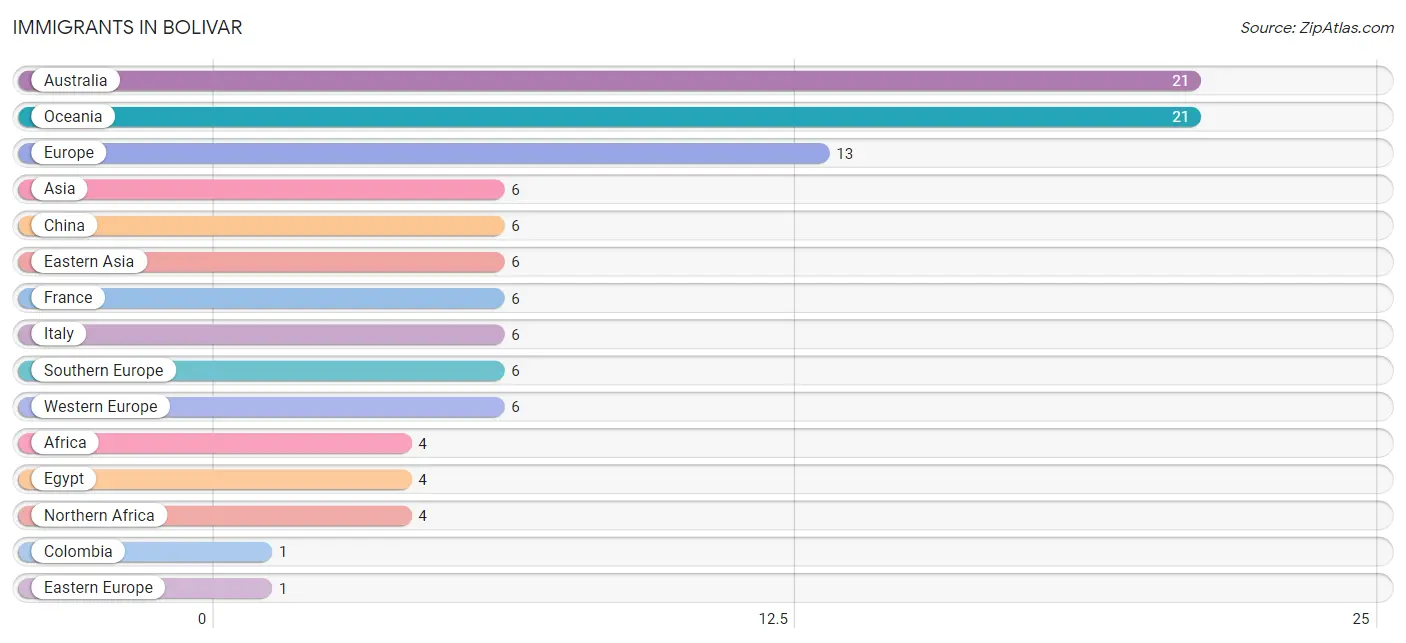
Immigrants in Bolivar
The most numerous immigrant groups reported in Bolivar came from Australia (21 | 1.6%), Oceania (21 | 1.6%), Europe (13 | 1.0%), Asia (6 | 0.5%), and China (6 | 0.5%), together accounting for 5.2% of all Bolivar residents.
| Immigration Origin | # Population | % Population |
| Africa | 4 | 0.3% |
| Asia | 6 | 0.5% |
| Australia | 21 | 1.6% |
| China | 6 | 0.5% |
| Colombia | 1 | 0.1% |
| Eastern Asia | 6 | 0.5% |
| Eastern Europe | 1 | 0.1% |
| Egypt | 4 | 0.3% |
| Europe | 13 | 1.0% |
| France | 6 | 0.5% |
| Italy | 6 | 0.5% |
| Latin America | 1 | 0.1% |
| Latvia | 1 | 0.1% |
| Northern Africa | 4 | 0.3% |
| Oceania | 21 | 1.6% |
| South America | 1 | 0.1% |
| Southern Europe | 6 | 0.5% |
| Western Europe | 6 | 0.5% | View All 18 Rows |
Sex and Age in Bolivar
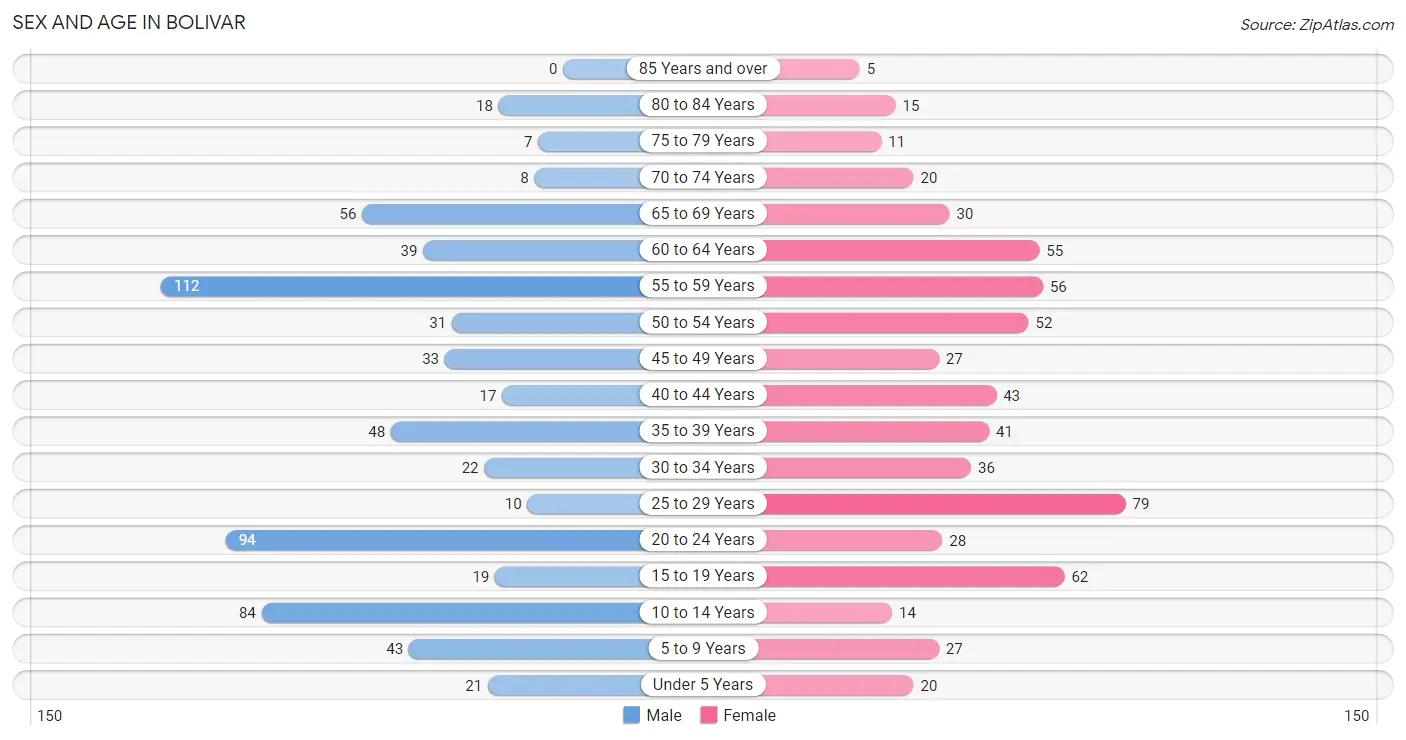
Sex and Age in Bolivar
The most populous age groups in Bolivar are 55 to 59 Years (112 | 16.9%) for men and 25 to 29 Years (79 | 12.7%) for women.
| Age Bracket | Male | Female |
| Under 5 Years | 21 (3.2%) | 20 (3.2%) |
| 5 to 9 Years | 43 (6.5%) | 27 (4.3%) |
| 10 to 14 Years | 84 (12.7%) | 14 (2.2%) |
| 15 to 19 Years | 19 (2.9%) | 62 (10.0%) |
| 20 to 24 Years | 94 (14.2%) | 28 (4.5%) |
| 25 to 29 Years | 10 (1.5%) | 79 (12.7%) |
| 30 to 34 Years | 22 (3.3%) | 36 (5.8%) |
| 35 to 39 Years | 48 (7.2%) | 41 (6.6%) |
| 40 to 44 Years | 17 (2.6%) | 43 (6.9%) |
| 45 to 49 Years | 33 (5.0%) | 27 (4.3%) |
| 50 to 54 Years | 31 (4.7%) | 52 (8.4%) |
| 55 to 59 Years | 112 (16.9%) | 56 (9.0%) |
| 60 to 64 Years | 39 (5.9%) | 55 (8.9%) |
| 65 to 69 Years | 56 (8.5%) | 30 (4.8%) |
| 70 to 74 Years | 8 (1.2%) | 20 (3.2%) |
| 75 to 79 Years | 7 (1.1%) | 11 (1.8%) |
| 80 to 84 Years | 18 (2.7%) | 15 (2.4%) |
| 85 Years and over | 0 (0.0%) | 5 (0.8%) |
| Total | 662 (100.0%) | 621 (100.0%) |
Families and Households in Bolivar
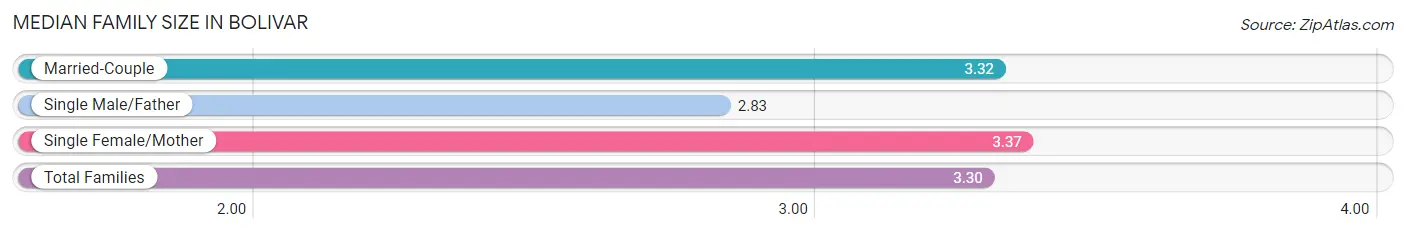
Median Family Size in Bolivar
The median family size in Bolivar is 3.30 persons per family, with single female/mother families (43 | 15.4%) accounting for the largest median family size of 3.37 persons per family. On the other hand, single male/father families (18 | 6.4%) represent the smallest median family size with 2.83 persons per family.
| Family Type | # Families | Family Size |
| Married-Couple | 219 (78.2%) | 3.32 |
| Single Male/Father | 18 (6.4%) | 2.83 |
| Single Female/Mother | 43 (15.4%) | 3.37 |
| Total Families | 280 (100.0%) | 3.30 |
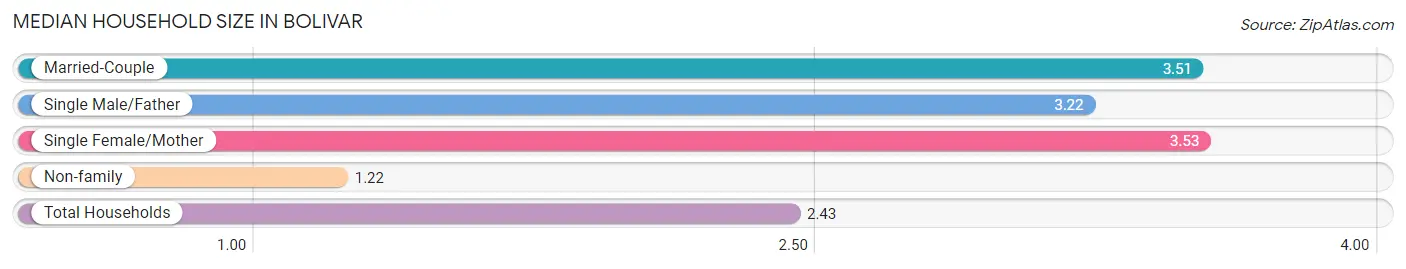
Median Household Size in Bolivar
The median household size in Bolivar is 2.43 persons per household, with single female/mother households (43 | 8.1%) accounting for the largest median household size of 3.53 persons per household. non-family households (249 | 47.1%) represent the smallest median household size with 1.22 persons per household.
| Household Type | # Households | Household Size |
| Married-Couple | 219 (41.4%) | 3.51 |
| Single Male/Father | 18 (3.4%) | 3.22 |
| Single Female/Mother | 43 (8.1%) | 3.53 |
| Non-family | 249 (47.1%) | 1.22 |
| Total Households | 529 (100.0%) | 2.43 |
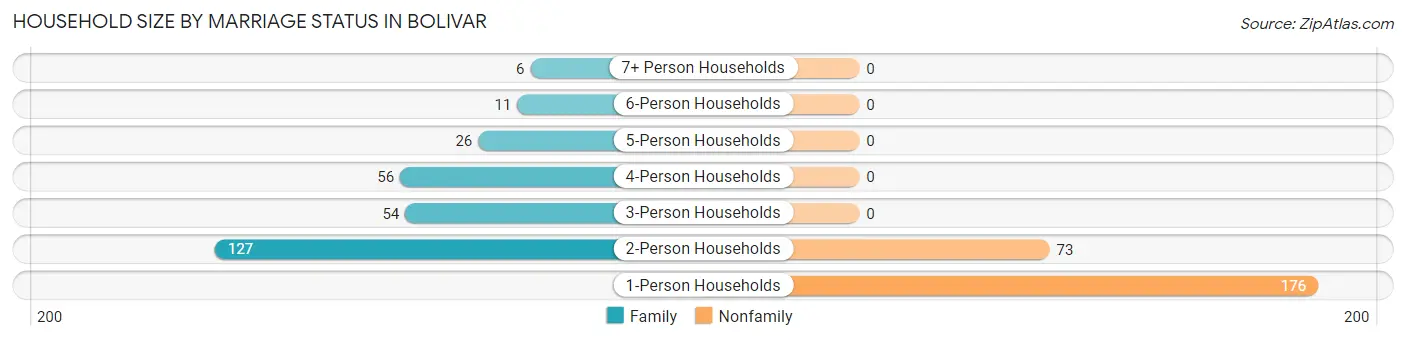
Household Size by Marriage Status in Bolivar
Out of a total of 529 households in Bolivar, 280 (52.9%) are family households, while 249 (47.1%) are nonfamily households. The most numerous type of family households are 2-person households, comprising 127, and the most common type of nonfamily households are 1-person households, comprising 176.
| Household Size | Family Households | Nonfamily Households |
| 1-Person Households | - | 176 (33.3%) |
| 2-Person Households | 127 (24.0%) | 73 (13.8%) |
| 3-Person Households | 54 (10.2%) | 0 (0.0%) |
| 4-Person Households | 56 (10.6%) | 0 (0.0%) |
| 5-Person Households | 26 (4.9%) | 0 (0.0%) |
| 6-Person Households | 11 (2.1%) | 0 (0.0%) |
| 7+ Person Households | 6 (1.1%) | 0 (0.0%) |
| Total | 280 (52.9%) | 249 (47.1%) |
Female Fertility in Bolivar
Fertility by Age in Bolivar
Average fertility rate in Bolivar is 9.0 births per 1,000 women. Women in the age bracket of 20 to 34 years have the highest fertility rate with 21.0 births per 1,000 women. Women in the age bracket of 20 to 34 years acount for 100.0% of all women with births.
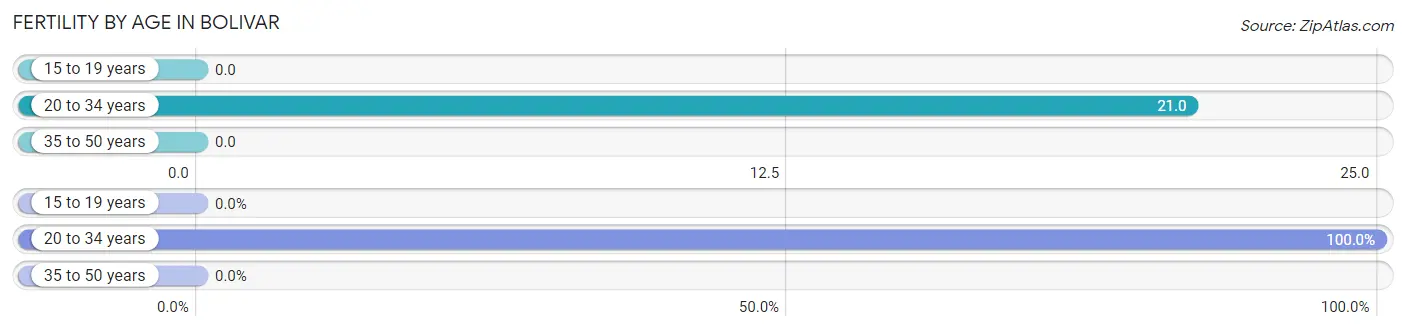
| Age Bracket | Women with Births | Births / 1,000 Women |
| 15 to 19 years | 0 (0.0%) | 0.0 |
| 20 to 34 years | 3 (100.0%) | 21.0 |
| 35 to 50 years | 0 (0.0%) | 0.0 |
| Total | 3 (100.0%) | 9.0 |
Fertility by Age by Marriage Status in Bolivar
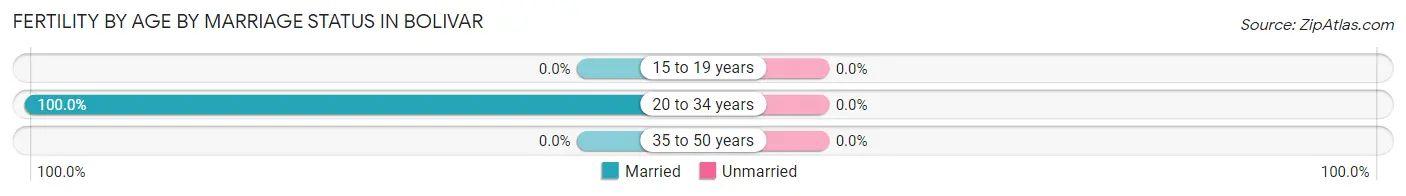
| Age Bracket | Married | Unmarried |
| 15 to 19 years | 0 (0.0%) | 0 (0.0%) |
| 20 to 34 years | 3 (100.0%) | 0 (0.0%) |
| 35 to 50 years | 0 (0.0%) | 0 (0.0%) |
| Total | 3 (100.0%) | 0 (0.0%) |
Fertility by Education in Bolivar
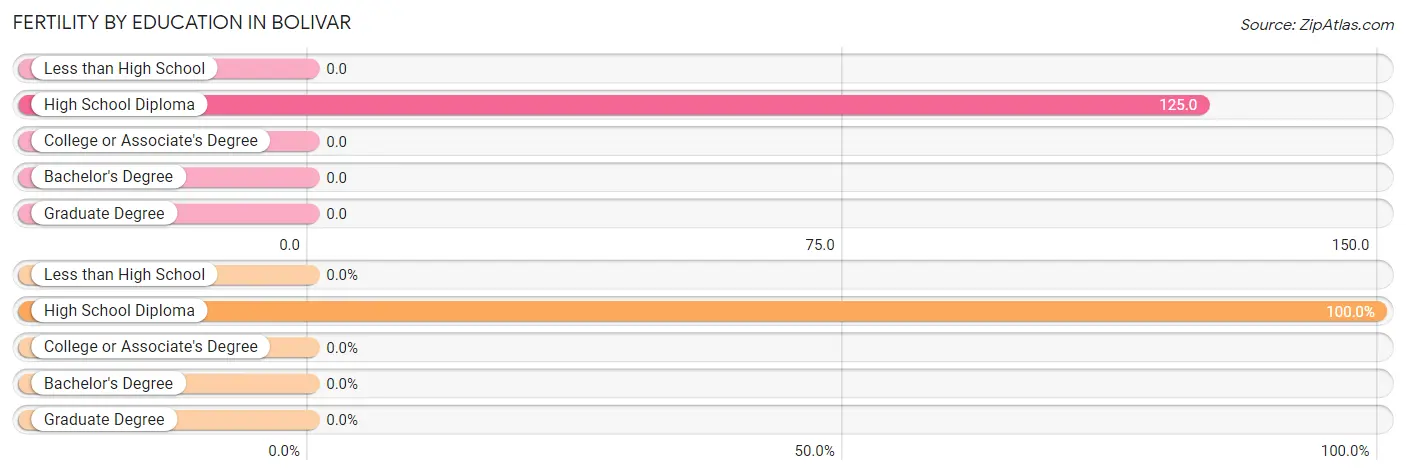
| Educational Attainment | Women with Births | Births / 1,000 Women |
| Less than High School | 0 (0.0%) | 0.0 |
| High School Diploma | 3 (100.0%) | 125.0 |
| College or Associate's Degree | 0 (0.0%) | 0.0 |
| Bachelor's Degree | 0 (0.0%) | 0.0 |
| Graduate Degree | 0 (0.0%) | 0.0 |
| Total | 3 (100.0%) | 9.0 |
Fertility by Education by Marriage Status in Bolivar
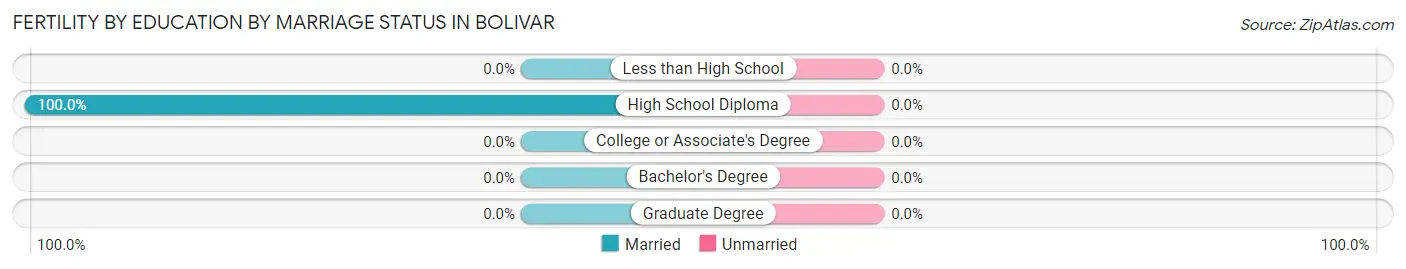
| Educational Attainment | Married | Unmarried |
| Less than High School | 0 (0.0%) | 0 (0.0%) |
| High School Diploma | 3 (100.0%) | 0 (0.0%) |
| College or Associate's Degree | 0 (0.0%) | 0 (0.0%) |
| Bachelor's Degree | 0 (0.0%) | 0 (0.0%) |
| Graduate Degree | 0 (0.0%) | 0 (0.0%) |
| Total | 3 (100.0%) | 0 (0.0%) |
Income in Bolivar
Income Overview in Bolivar
Per Capita Income in Bolivar is $37,523, while median incomes of families and households are $106,389 and $80,125 respectively.
| Characteristic | Number | Measure |
| Per Capita Income | 1,283 | $37,523 |
| Median Family Income | 280 | $106,389 |
| Mean Family Income | 280 | $117,933 |
| Median Household Income | 529 | $80,125 |
| Mean Household Income | 529 | $88,242 |
| Income Deficit | 280 | $0 |
| Wage / Income Gap (%) | 1,283 | 6.15% |
| Wage / Income Gap ($) | 1,283 | 93.85¢ per $1 |
| Gini / Inequality Index | 1,283 | 0.40 |
Earnings by Sex in Bolivar
Average Earnings in Bolivar are $41,192, $43,125 for men and $40,474 for women, a difference of 6.1%.
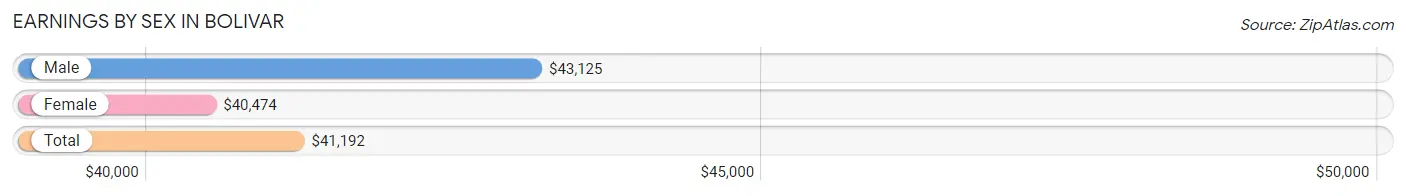
| Sex | Number | Average Earnings |
| Male | 442 (52.8%) | $43,125 |
| Female | 395 (47.2%) | $40,474 |
| Total | 837 (100.0%) | $41,192 |
Earnings by Sex by Income Bracket in Bolivar
The most common earnings brackets in Bolivar are $65,000 to $74,999 for men (59 | 13.4%) and $55,000 to $64,999 for women (121 | 30.6%).
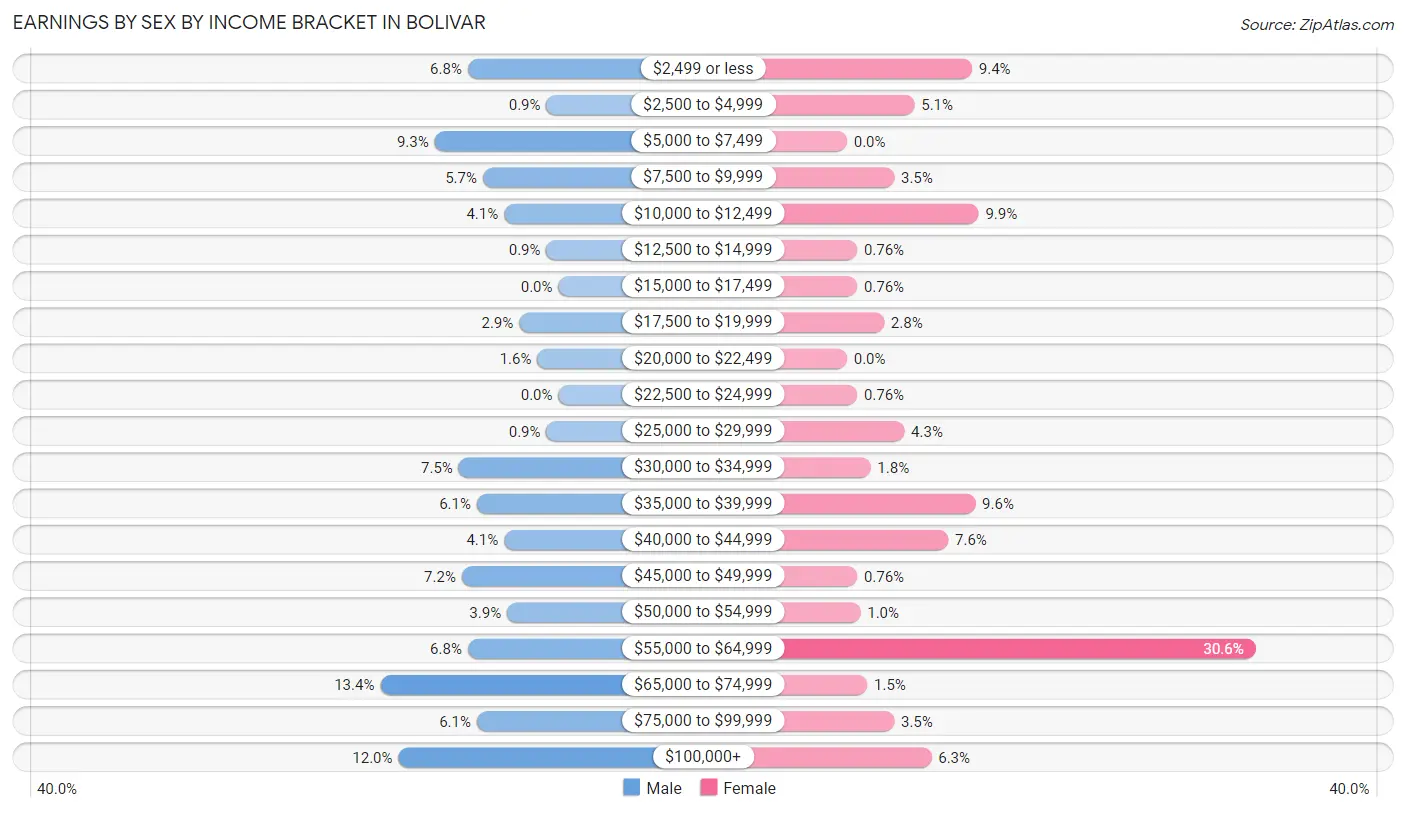
| Income | Male | Female |
| $2,499 or less | 30 (6.8%) | 37 (9.4%) |
| $2,500 to $4,999 | 4 (0.9%) | 20 (5.1%) |
| $5,000 to $7,499 | 41 (9.3%) | 0 (0.0%) |
| $7,500 to $9,999 | 25 (5.7%) | 14 (3.5%) |
| $10,000 to $12,499 | 18 (4.1%) | 39 (9.9%) |
| $12,500 to $14,999 | 4 (0.9%) | 3 (0.8%) |
| $15,000 to $17,499 | 0 (0.0%) | 3 (0.8%) |
| $17,500 to $19,999 | 13 (2.9%) | 11 (2.8%) |
| $20,000 to $22,499 | 7 (1.6%) | 0 (0.0%) |
| $22,500 to $24,999 | 0 (0.0%) | 3 (0.8%) |
| $25,000 to $29,999 | 4 (0.9%) | 17 (4.3%) |
| $30,000 to $34,999 | 33 (7.5%) | 7 (1.8%) |
| $35,000 to $39,999 | 27 (6.1%) | 38 (9.6%) |
| $40,000 to $44,999 | 18 (4.1%) | 30 (7.6%) |
| $45,000 to $49,999 | 32 (7.2%) | 3 (0.8%) |
| $50,000 to $54,999 | 17 (3.8%) | 4 (1.0%) |
| $55,000 to $64,999 | 30 (6.8%) | 121 (30.6%) |
| $65,000 to $74,999 | 59 (13.4%) | 6 (1.5%) |
| $75,000 to $99,999 | 27 (6.1%) | 14 (3.5%) |
| $100,000+ | 53 (12.0%) | 25 (6.3%) |
| Total | 442 (100.0%) | 395 (100.0%) |
Earnings by Sex by Educational Attainment in Bolivar
Average earnings in Bolivar are $52,417 for men and $42,371 for women, a difference of 19.2%. Men with an educational attainment of high school diploma enjoy the highest average annual earnings of $61,172, while those with college or associate's degree education earn the least with $45,956. Women with an educational attainment of graduate degree earn the most with the average annual earnings of $58,722, while those with high school diploma education have the smallest earnings of $35,074.
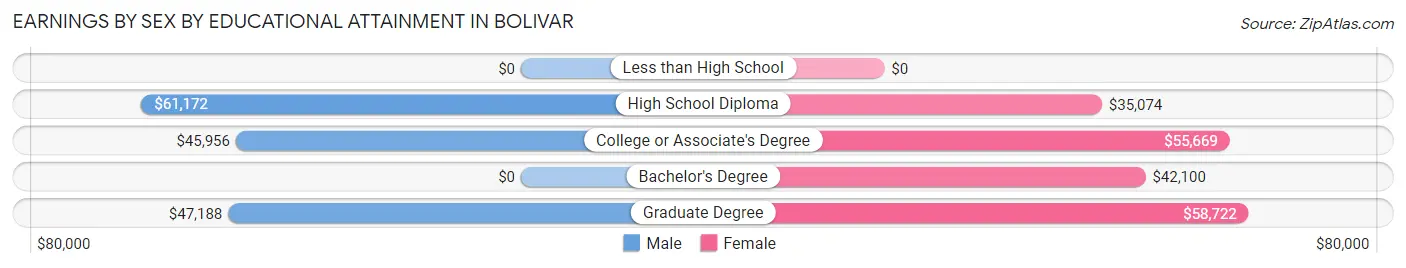
| Educational Attainment | Male Income | Female Income |
| Less than High School | - | - |
| High School Diploma | $61,172 | $35,074 |
| College or Associate's Degree | $45,956 | $55,669 |
| Bachelor's Degree | - | - |
| Graduate Degree | $47,188 | $58,722 |
| Total | $52,417 | $42,371 |
Family Income in Bolivar
Family Income Brackets in Bolivar
According to the Bolivar family income data, there are 71 families falling into the $100,000 to $149,999 income range, which is the most common income bracket and makes up 25.4% of all families.
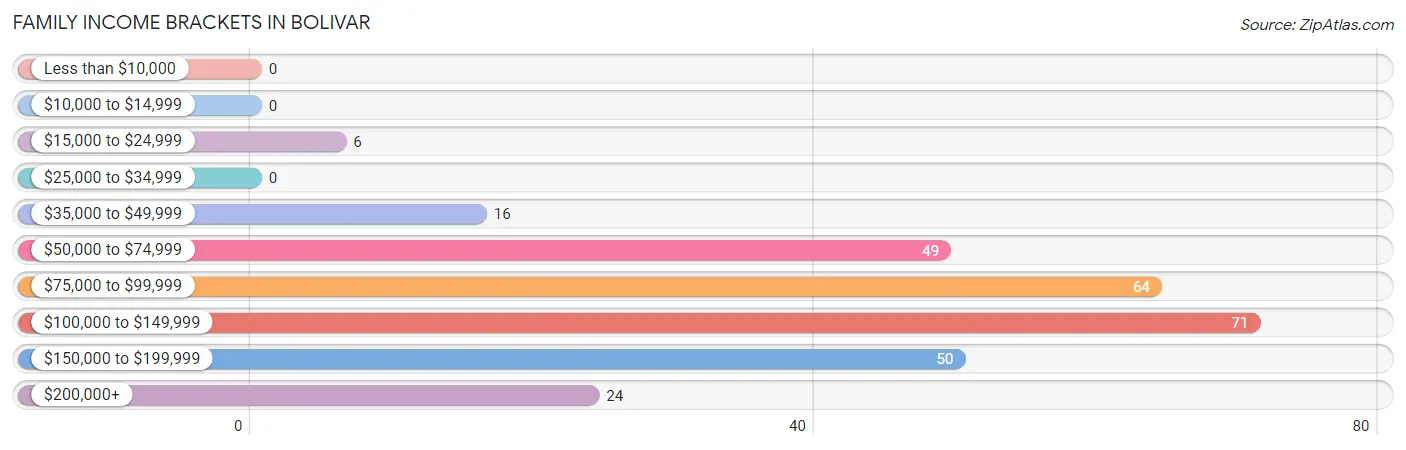
| Income Bracket | # Families | % Families |
| Less than $10,000 | 0 | 0.0% |
| $10,000 to $14,999 | 0 | 0.0% |
| $15,000 to $24,999 | 6 | 2.1% |
| $25,000 to $34,999 | 0 | 0.0% |
| $35,000 to $49,999 | 16 | 5.7% |
| $50,000 to $74,999 | 49 | 17.5% |
| $75,000 to $99,999 | 64 | 22.9% |
| $100,000 to $149,999 | 71 | 25.4% |
| $150,000 to $199,999 | 50 | 17.9% |
| $200,000+ | 24 | 8.6% |
Family Income by Famaliy Size in Bolivar
3-person families (61 | 21.8%) account for the highest median family income in Bolivar with $122,991 per family, while 2-person families (134 | 47.9%) have the highest median income of $49,091 per family member.
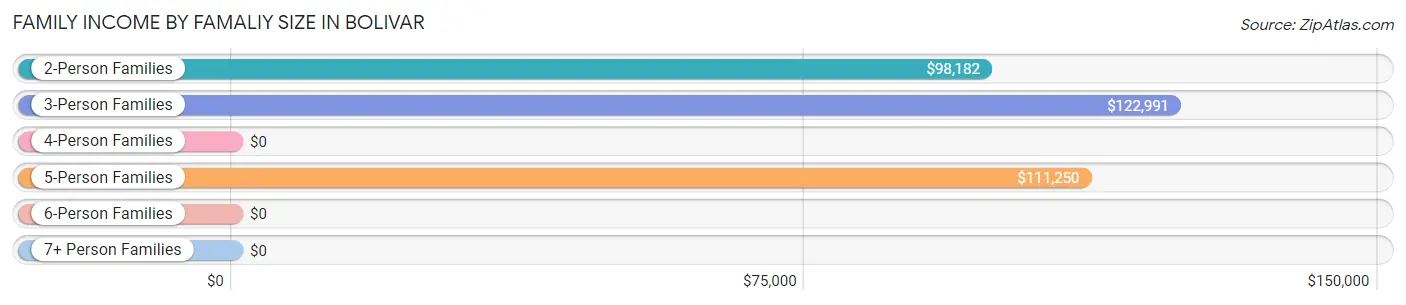
| Income Bracket | # Families | Median Income |
| 2-Person Families | 134 (47.9%) | $98,182 |
| 3-Person Families | 61 (21.8%) | $122,991 |
| 4-Person Families | 51 (18.2%) | $0 |
| 5-Person Families | 26 (9.3%) | $111,250 |
| 6-Person Families | 8 (2.9%) | $0 |
| 7+ Person Families | 0 (0.0%) | $0 |
| Total | 280 (100.0%) | $106,389 |
Family Income by Number of Earners in Bolivar
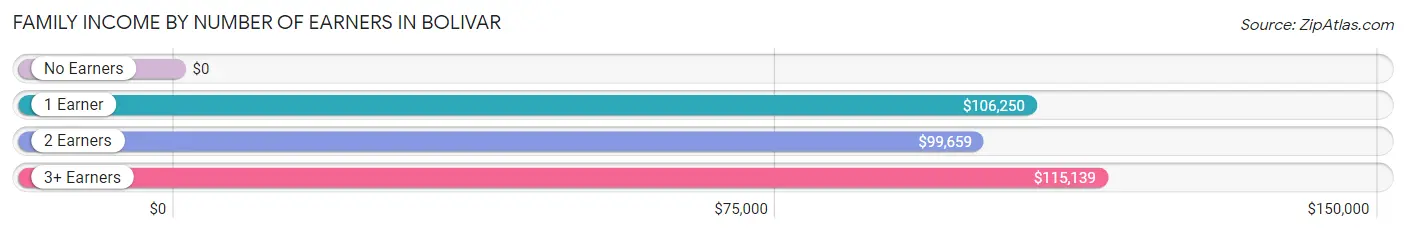
| Number of Earners | # Families | Median Income |
| No Earners | 6 (2.1%) | $0 |
| 1 Earner | 58 (20.7%) | $106,250 |
| 2 Earners | 181 (64.6%) | $99,659 |
| 3+ Earners | 35 (12.5%) | $115,139 |
| Total | 280 (100.0%) | $106,389 |
Household Income in Bolivar
Household Income Brackets in Bolivar
With 125 households falling in the category, the $75,000 to $99,999 income range is the most frequent in Bolivar, accounting for 23.6% of all households. In contrast, only 7 households (1.3%) fall into the $10,000 to $14,999 income bracket, making it the least populous group.
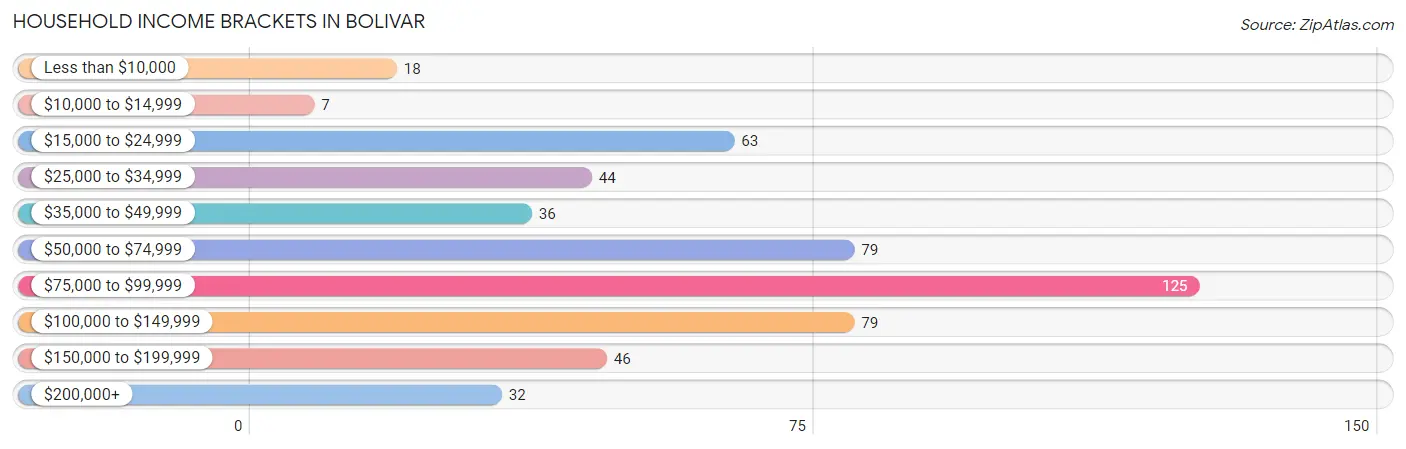
| Income Bracket | # Households | % Households |
| Less than $10,000 | 18 | 3.4% |
| $10,000 to $14,999 | 7 | 1.3% |
| $15,000 to $24,999 | 63 | 11.9% |
| $25,000 to $34,999 | 44 | 8.3% |
| $35,000 to $49,999 | 36 | 6.8% |
| $50,000 to $74,999 | 79 | 14.9% |
| $75,000 to $99,999 | 125 | 23.6% |
| $100,000 to $149,999 | 79 | 14.9% |
| $150,000 to $199,999 | 46 | 8.7% |
| $200,000+ | 32 | 6.0% |
Household Income by Householder Age in Bolivar
The median household income in Bolivar is $80,125, with the highest median household income of $93,861 found in the 25 to 44 years age bracket for the primary householder. A total of 157 households (29.7%) fall into this category. Meanwhile, the 15 to 24 years age bracket for the primary householder has the lowest median household income of $0, with 19 households (3.6%) in this group.
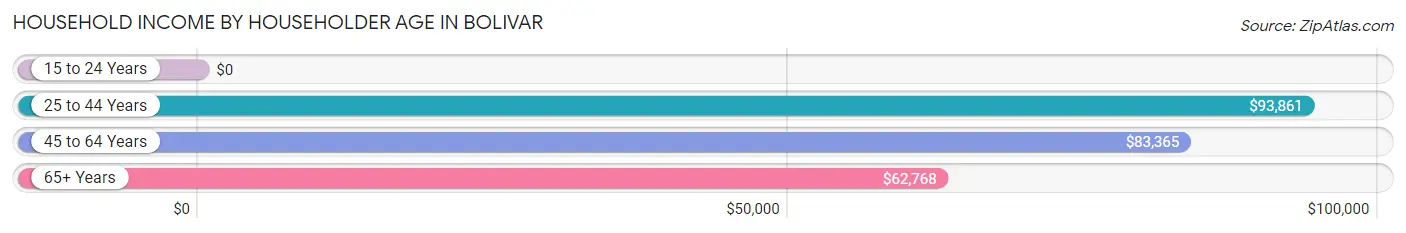
| Income Bracket | # Households | Median Income |
| 15 to 24 Years | 19 (3.6%) | $0 |
| 25 to 44 Years | 157 (29.7%) | $93,861 |
| 45 to 64 Years | 229 (43.3%) | $83,365 |
| 65+ Years | 124 (23.4%) | $62,768 |
| Total | 529 (100.0%) | $80,125 |
Poverty in Bolivar
Income Below Poverty by Sex and Age in Bolivar
With 6.7% poverty level for males and 8.3% for females among the residents of Bolivar, 25 to 34 year old males and under 5 year old females are the most vulnerable to poverty, with 7 males (21.9%) and 7 females (35.0%) in their respective age groups living below the poverty level.
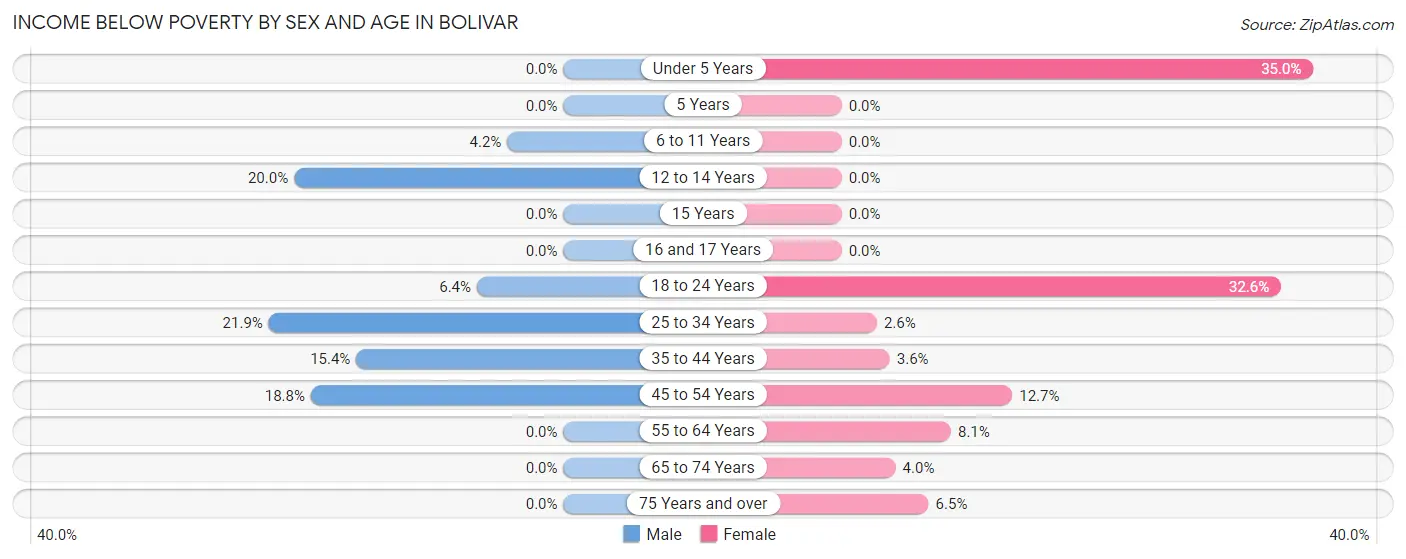
| Age Bracket | Male | Female |
| Under 5 Years | 0 (0.0%) | 7 (35.0%) |
| 5 Years | 0 (0.0%) | 0 (0.0%) |
| 6 to 11 Years | 4 (4.2%) | 0 (0.0%) |
| 12 to 14 Years | 4 (20.0%) | 0 (0.0%) |
| 15 Years | 0 (0.0%) | 0 (0.0%) |
| 16 and 17 Years | 0 (0.0%) | 0 (0.0%) |
| 18 to 24 Years | 7 (6.4%) | 15 (32.6%) |
| 25 to 34 Years | 7 (21.9%) | 3 (2.6%) |
| 35 to 44 Years | 10 (15.4%) | 3 (3.6%) |
| 45 to 54 Years | 12 (18.8%) | 10 (12.7%) |
| 55 to 64 Years | 0 (0.0%) | 9 (8.1%) |
| 65 to 74 Years | 0 (0.0%) | 2 (4.0%) |
| 75 Years and over | 0 (0.0%) | 2 (6.5%) |
| Total | 44 (6.7%) | 51 (8.3%) |
Income Above Poverty by Sex and Age in Bolivar
According to the poverty statistics in Bolivar, males aged under 5 years and females aged 5 years are the age groups that are most secure financially, with 100.0% of males and 100.0% of females in these age groups living above the poverty line.
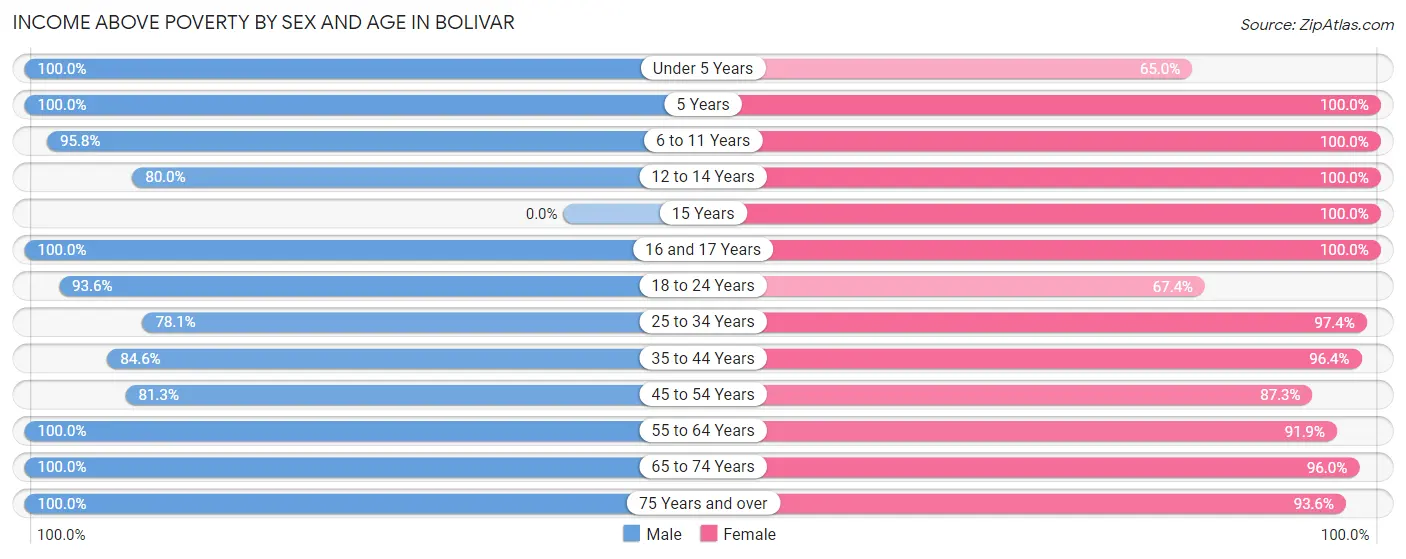
| Age Bracket | Male | Female |
| Under 5 Years | 21 (100.0%) | 13 (65.0%) |
| 5 Years | 4 (100.0%) | 17 (100.0%) |
| 6 to 11 Years | 92 (95.8%) | 4 (100.0%) |
| 12 to 14 Years | 16 (80.0%) | 14 (100.0%) |
| 15 Years | 0 (0.0%) | 9 (100.0%) |
| 16 and 17 Years | 4 (100.0%) | 35 (100.0%) |
| 18 to 24 Years | 102 (93.6%) | 31 (67.4%) |
| 25 to 34 Years | 25 (78.1%) | 112 (97.4%) |
| 35 to 44 Years | 55 (84.6%) | 81 (96.4%) |
| 45 to 54 Years | 52 (81.2%) | 69 (87.3%) |
| 55 to 64 Years | 151 (100.0%) | 102 (91.9%) |
| 65 to 74 Years | 64 (100.0%) | 48 (96.0%) |
| 75 Years and over | 25 (100.0%) | 29 (93.5%) |
| Total | 611 (93.3%) | 564 (91.7%) |
Income Below Poverty Among Married-Couple Families in Bolivar
The poverty statistics for married-couple families in Bolivar show that 1.4% or 3 of the total 219 families live below the poverty line. Families with 1 or 2 children have the highest poverty rate of 4.3%, comprising of 3 families. On the other hand, families with no children have the lowest poverty rate of 0.0%, which includes 0 families.
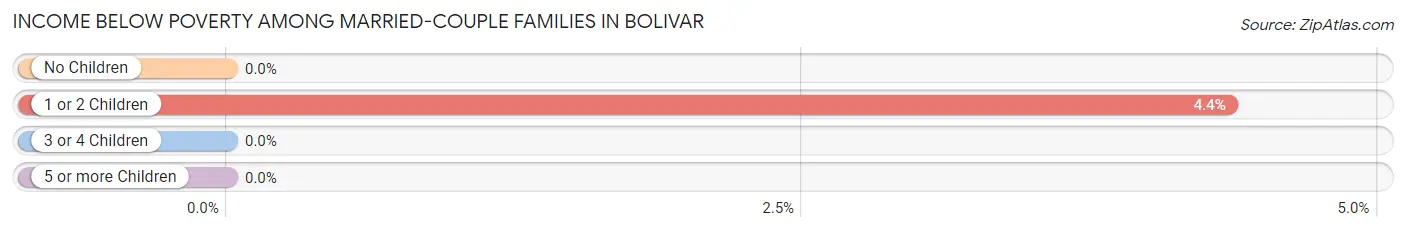
| Children | Above Poverty | Below Poverty |
| No Children | 135 (100.0%) | 0 (0.0%) |
| 1 or 2 Children | 66 (95.7%) | 3 (4.3%) |
| 3 or 4 Children | 15 (100.0%) | 0 (0.0%) |
| 5 or more Children | 0 (0.0%) | 0 (0.0%) |
| Total | 216 (98.6%) | 3 (1.4%) |
Income Below Poverty Among Single-Parent Households in Bolivar
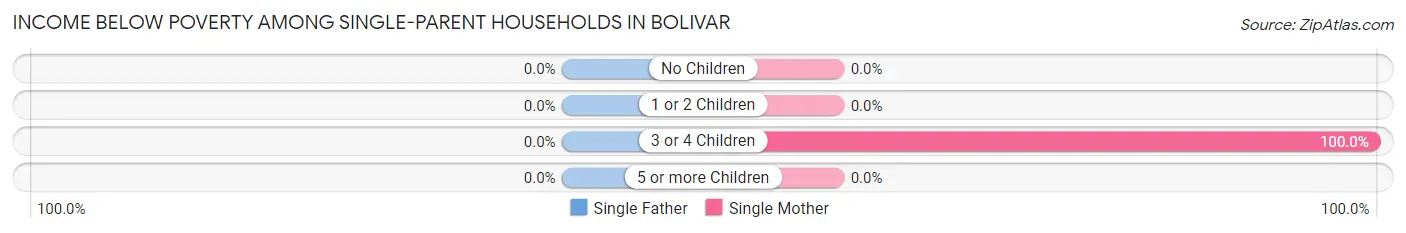
| Children | Single Father | Single Mother |
| No Children | 0 (0.0%) | 0 (0.0%) |
| 1 or 2 Children | 0 (0.0%) | 0 (0.0%) |
| 3 or 4 Children | 0 (0.0%) | 3 (100.0%) |
| 5 or more Children | 0 (0.0%) | 0 (0.0%) |
| Total | 0 (0.0%) | 3 (7.0%) |
Income Below Poverty Among Married-Couple vs Single-Parent Households in Bolivar
The poverty data for Bolivar shows that 3 of the married-couple family households (1.4%) and 3 of the single-parent households (4.9%) are living below the poverty level. Within the married-couple family households, those with 1 or 2 children have the highest poverty rate, with 3 households (4.3%) falling below the poverty line. Among the single-parent households, those with 3 or 4 children have the highest poverty rate, with 3 household (50.0%) living below poverty.
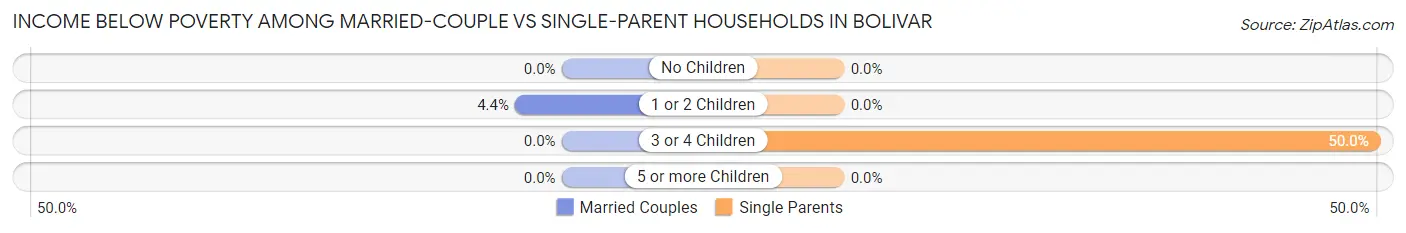
| Children | Married-Couple Families | Single-Parent Households |
| No Children | 0 (0.0%) | 0 (0.0%) |
| 1 or 2 Children | 3 (4.3%) | 0 (0.0%) |
| 3 or 4 Children | 0 (0.0%) | 3 (50.0%) |
| 5 or more Children | 0 (0.0%) | 0 (0.0%) |
| Total | 3 (1.4%) | 3 (4.9%) |
Employment Characteristics in Bolivar
Employment by Class of Employer in Bolivar
Among the 753 employed individuals in Bolivar, private company employees (481 | 63.9%), local government employees (72 | 9.6%), and self-employed (not incorporated) (60 | 8.0%) make up the most common classes of employment.
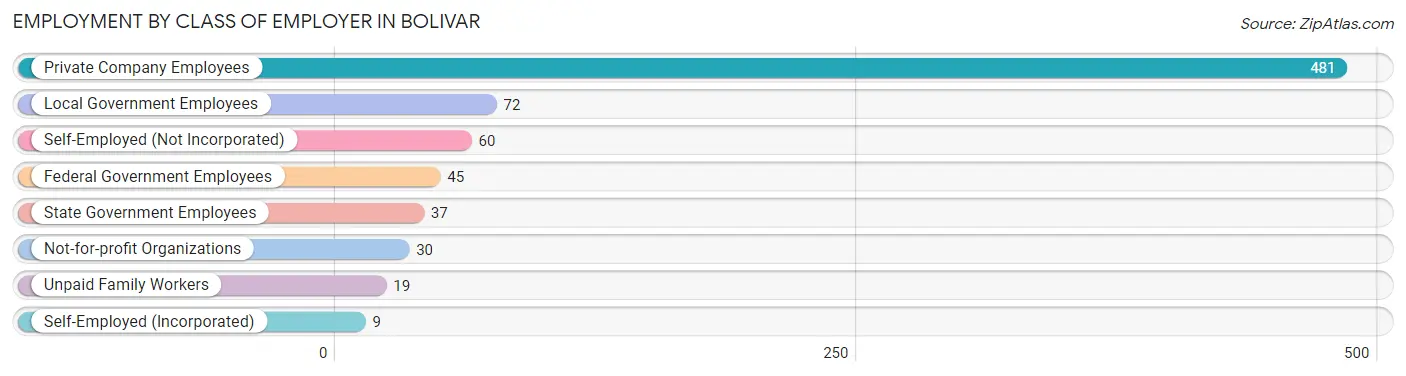
| Employer Class | # Employees | % Employees |
| Private Company Employees | 481 | 63.9% |
| Self-Employed (Incorporated) | 9 | 1.2% |
| Self-Employed (Not Incorporated) | 60 | 8.0% |
| Not-for-profit Organizations | 30 | 4.0% |
| Local Government Employees | 72 | 9.6% |
| State Government Employees | 37 | 4.9% |
| Federal Government Employees | 45 | 6.0% |
| Unpaid Family Workers | 19 | 2.5% |
| Total | 753 | 100.0% |
Employment Status by Age in Bolivar
According to the labor force statistics for Bolivar, out of the total population over 16 years of age (1,065), 76.7% or 817 individuals are in the labor force, with 5.6% or 46 of them unemployed. The age group with the highest labor force participation rate is 35 to 44 years, with 96.6% or 144 individuals in the labor force. Within the labor force, the 16 to 19 years age range has the highest percentage of unemployed individuals, with 26.1% or 12 of them being unemployed.
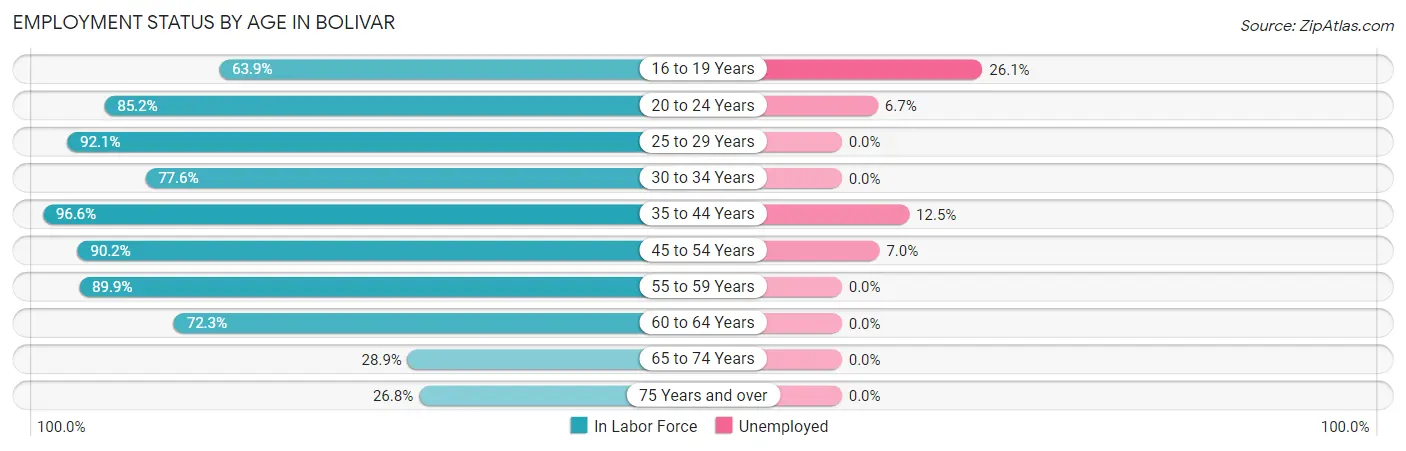
| Age Bracket | In Labor Force | Unemployed |
| 16 to 19 Years | 46 (63.9%) | 12 (26.1%) |
| 20 to 24 Years | 104 (85.2%) | 7 (6.7%) |
| 25 to 29 Years | 82 (92.1%) | 0 (0.0%) |
| 30 to 34 Years | 45 (77.6%) | 0 (0.0%) |
| 35 to 44 Years | 144 (96.6%) | 18 (12.5%) |
| 45 to 54 Years | 129 (90.2%) | 9 (7.0%) |
| 55 to 59 Years | 151 (89.9%) | 0 (0.0%) |
| 60 to 64 Years | 68 (72.3%) | 0 (0.0%) |
| 65 to 74 Years | 33 (28.9%) | 0 (0.0%) |
| 75 Years and over | 15 (26.8%) | 0 (0.0%) |
| Total | 817 (76.7%) | 46 (5.6%) |
Employment Status by Educational Attainment in Bolivar
According to labor force statistics for Bolivar, 88.3% of individuals (619) out of the total population between 25 and 64 years of age (701) are in the labor force, with 4.4% or 27 of them being unemployed. The group with the highest labor force participation rate are those with the educational attainment of bachelor's degree or higher, with 95.5% or 274 individuals in the labor force. Within the labor force, individuals with less than high school education have the highest percentage of unemployment, with 42.9% or 12 of them being unemployed.
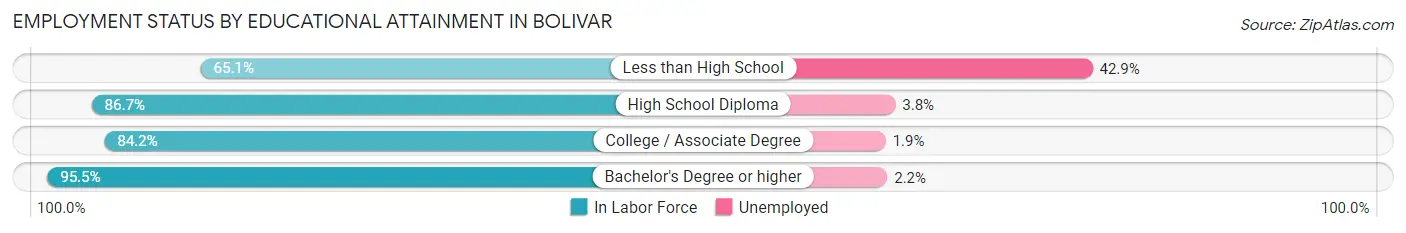
| Educational Attainment | In Labor Force | Unemployed |
| Less than High School | 28 (65.1%) | 18 (42.9%) |
| High School Diploma | 157 (86.7%) | 7 (3.8%) |
| College / Associate Degree | 160 (84.2%) | 4 (1.9%) |
| Bachelor's Degree or higher | 274 (95.5%) | 6 (2.2%) |
| Total | 619 (88.3%) | 31 (4.4%) |
Employment Occupations by Sex in Bolivar
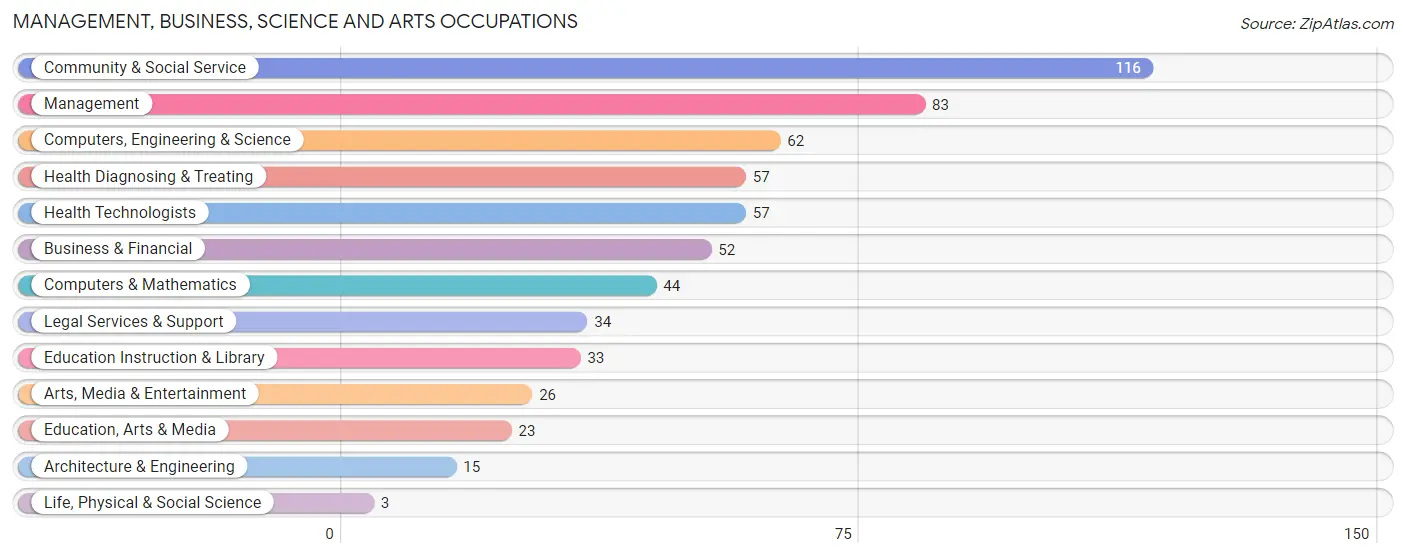
Management, Business, Science and Arts Occupations
The most common Management, Business, Science and Arts occupations in Bolivar are Community & Social Service (116 | 15.0%), Management (83 | 10.8%), Computers, Engineering & Science (62 | 8.0%), Health Diagnosing & Treating (57 | 7.4%), and Health Technologists (57 | 7.4%).
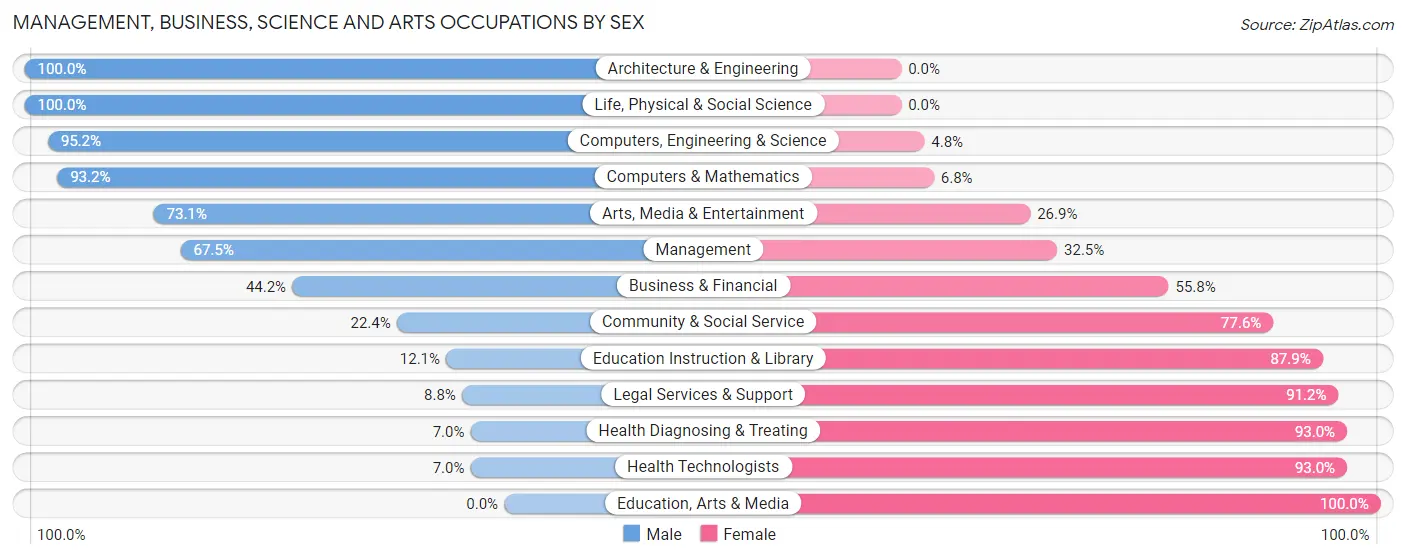
Management, Business, Science and Arts Occupations by Sex
Within the Management, Business, Science and Arts occupations in Bolivar, the most male-oriented occupations are Architecture & Engineering (100.0%), Life, Physical & Social Science (100.0%), and Computers, Engineering & Science (95.2%), while the most female-oriented occupations are Education, Arts & Media (100.0%), Health Diagnosing & Treating (93.0%), and Health Technologists (93.0%).
| Occupation | Male | Female |
| Management | 56 (67.5%) | 27 (32.5%) |
| Business & Financial | 23 (44.2%) | 29 (55.8%) |
| Computers, Engineering & Science | 59 (95.2%) | 3 (4.8%) |
| Computers & Mathematics | 41 (93.2%) | 3 (6.8%) |
| Architecture & Engineering | 15 (100.0%) | 0 (0.0%) |
| Life, Physical & Social Science | 3 (100.0%) | 0 (0.0%) |
| Community & Social Service | 26 (22.4%) | 90 (77.6%) |
| Education, Arts & Media | 0 (0.0%) | 23 (100.0%) |
| Legal Services & Support | 3 (8.8%) | 31 (91.2%) |
| Education Instruction & Library | 4 (12.1%) | 29 (87.9%) |
| Arts, Media & Entertainment | 19 (73.1%) | 7 (26.9%) |
| Health Diagnosing & Treating | 4 (7.0%) | 53 (93.0%) |
| Health Technologists | 4 (7.0%) | 53 (93.0%) |
| Total (Category) | 168 (45.4%) | 202 (54.6%) |
| Total (Overall) | 407 (52.8%) | 364 (47.2%) |
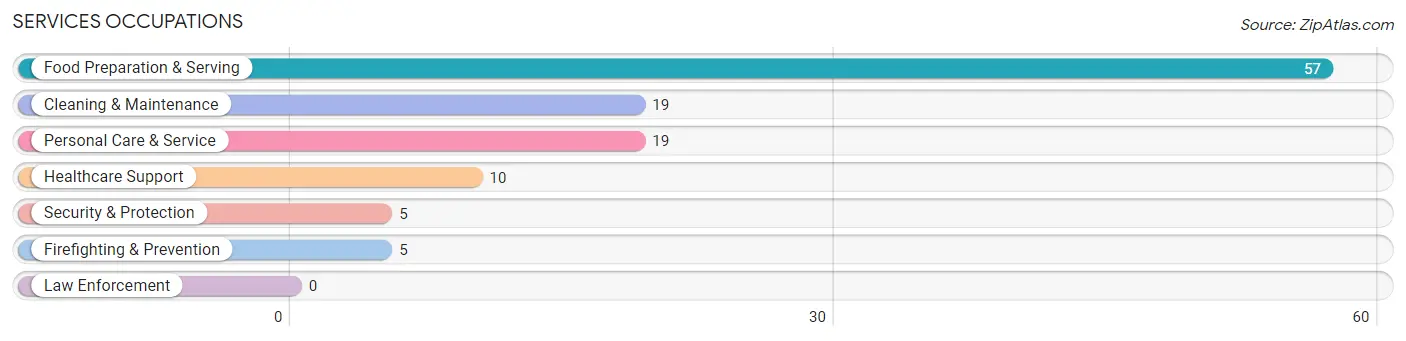
Services Occupations
The most common Services occupations in Bolivar are Food Preparation & Serving (57 | 7.4%), Cleaning & Maintenance (19 | 2.5%), Personal Care & Service (19 | 2.5%), Healthcare Support (10 | 1.3%), and Security & Protection (5 | 0.6%).
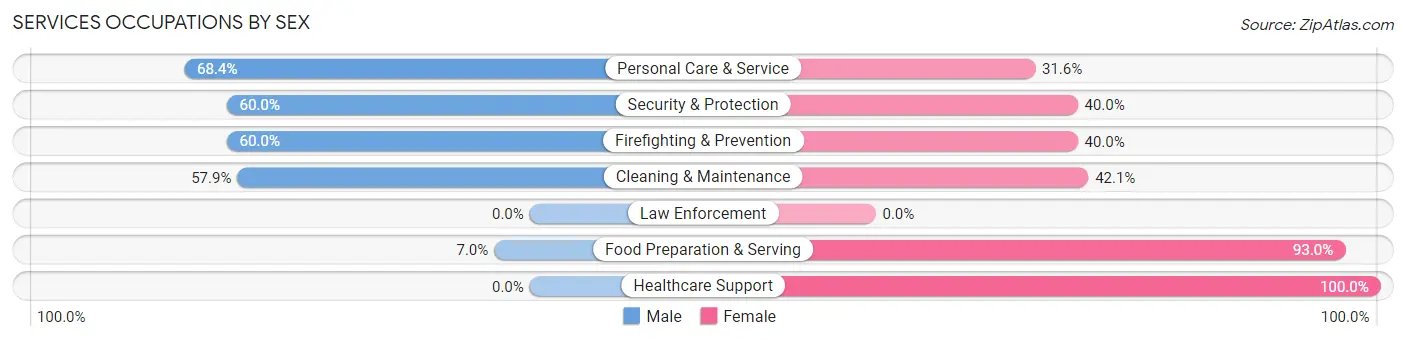
Services Occupations by Sex
Within the Services occupations in Bolivar, the most male-oriented occupations are Personal Care & Service (68.4%), Security & Protection (60.0%), and Firefighting & Prevention (60.0%), while the most female-oriented occupations are Healthcare Support (100.0%), Food Preparation & Serving (93.0%), and Cleaning & Maintenance (42.1%).
| Occupation | Male | Female |
| Healthcare Support | 0 (0.0%) | 10 (100.0%) |
| Security & Protection | 3 (60.0%) | 2 (40.0%) |
| Firefighting & Prevention | 3 (60.0%) | 2 (40.0%) |
| Law Enforcement | 0 (0.0%) | 0 (0.0%) |
| Food Preparation & Serving | 4 (7.0%) | 53 (93.0%) |
| Cleaning & Maintenance | 11 (57.9%) | 8 (42.1%) |
| Personal Care & Service | 13 (68.4%) | 6 (31.6%) |
| Total (Category) | 31 (28.2%) | 79 (71.8%) |
| Total (Overall) | 407 (52.8%) | 364 (47.2%) |
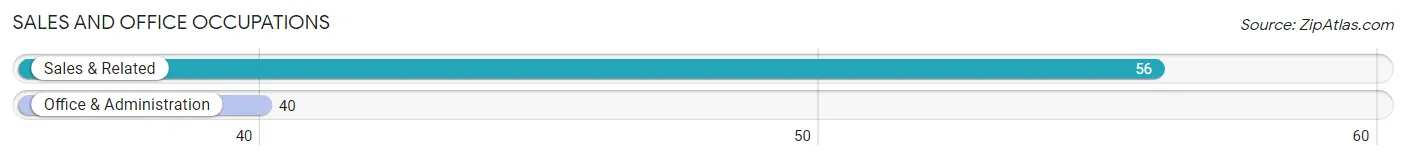
Sales and Office Occupations
The most common Sales and Office occupations in Bolivar are Sales & Related (56 | 7.3%), and Office & Administration (40 | 5.2%).
Sales and Office Occupations by Sex
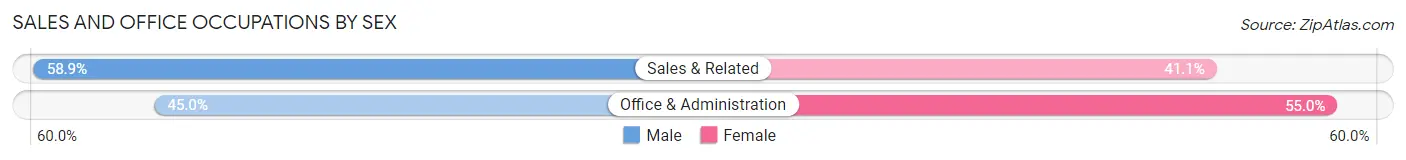
| Occupation | Male | Female |
| Sales & Related | 33 (58.9%) | 23 (41.1%) |
| Office & Administration | 18 (45.0%) | 22 (55.0%) |
| Total (Category) | 51 (53.1%) | 45 (46.9%) |
| Total (Overall) | 407 (52.8%) | 364 (47.2%) |
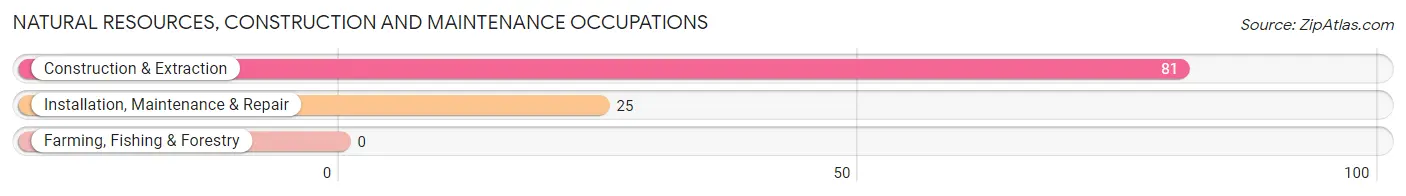
Natural Resources, Construction and Maintenance Occupations
The most common Natural Resources, Construction and Maintenance occupations in Bolivar are Construction & Extraction (81 | 10.5%), and Installation, Maintenance & Repair (25 | 3.2%).
Natural Resources, Construction and Maintenance Occupations by Sex
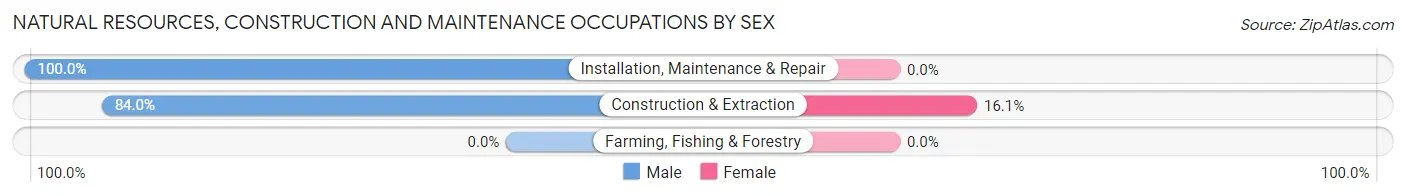
| Occupation | Male | Female |
| Farming, Fishing & Forestry | 0 (0.0%) | 0 (0.0%) |
| Construction & Extraction | 68 (84.0%) | 13 (16.1%) |
| Installation, Maintenance & Repair | 25 (100.0%) | 0 (0.0%) |
| Total (Category) | 93 (87.7%) | 13 (12.3%) |
| Total (Overall) | 407 (52.8%) | 364 (47.2%) |
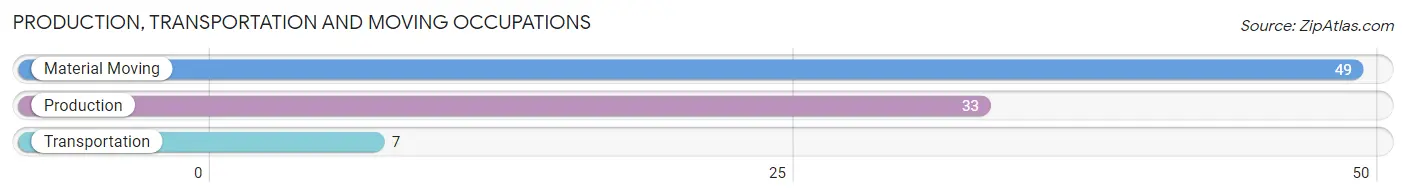
Production, Transportation and Moving Occupations
The most common Production, Transportation and Moving occupations in Bolivar are Material Moving (49 | 6.4%), Production (33 | 4.3%), and Transportation (7 | 0.9%).
Production, Transportation and Moving Occupations by Sex
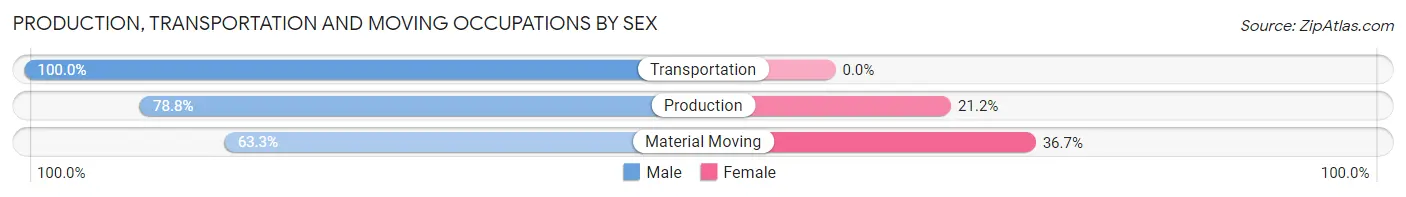
| Occupation | Male | Female |
| Production | 26 (78.8%) | 7 (21.2%) |
| Transportation | 7 (100.0%) | 0 (0.0%) |
| Material Moving | 31 (63.3%) | 18 (36.7%) |
| Total (Category) | 64 (71.9%) | 25 (28.1%) |
| Total (Overall) | 407 (52.8%) | 364 (47.2%) |
Employment Industries by Sex in Bolivar
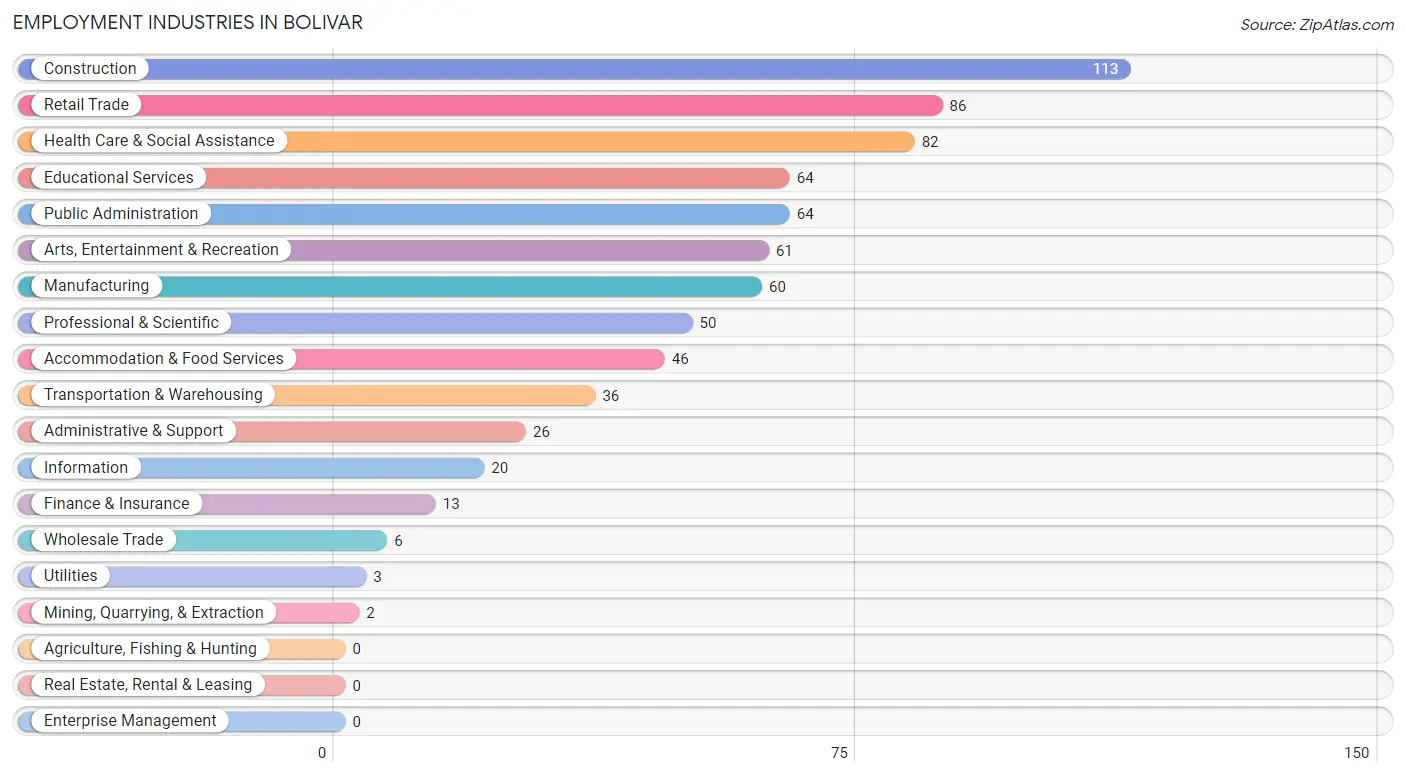
Employment Industries in Bolivar
The major employment industries in Bolivar include Construction (113 | 14.7%), Retail Trade (86 | 11.2%), Health Care & Social Assistance (82 | 10.6%), Educational Services (64 | 8.3%), and Public Administration (64 | 8.3%).
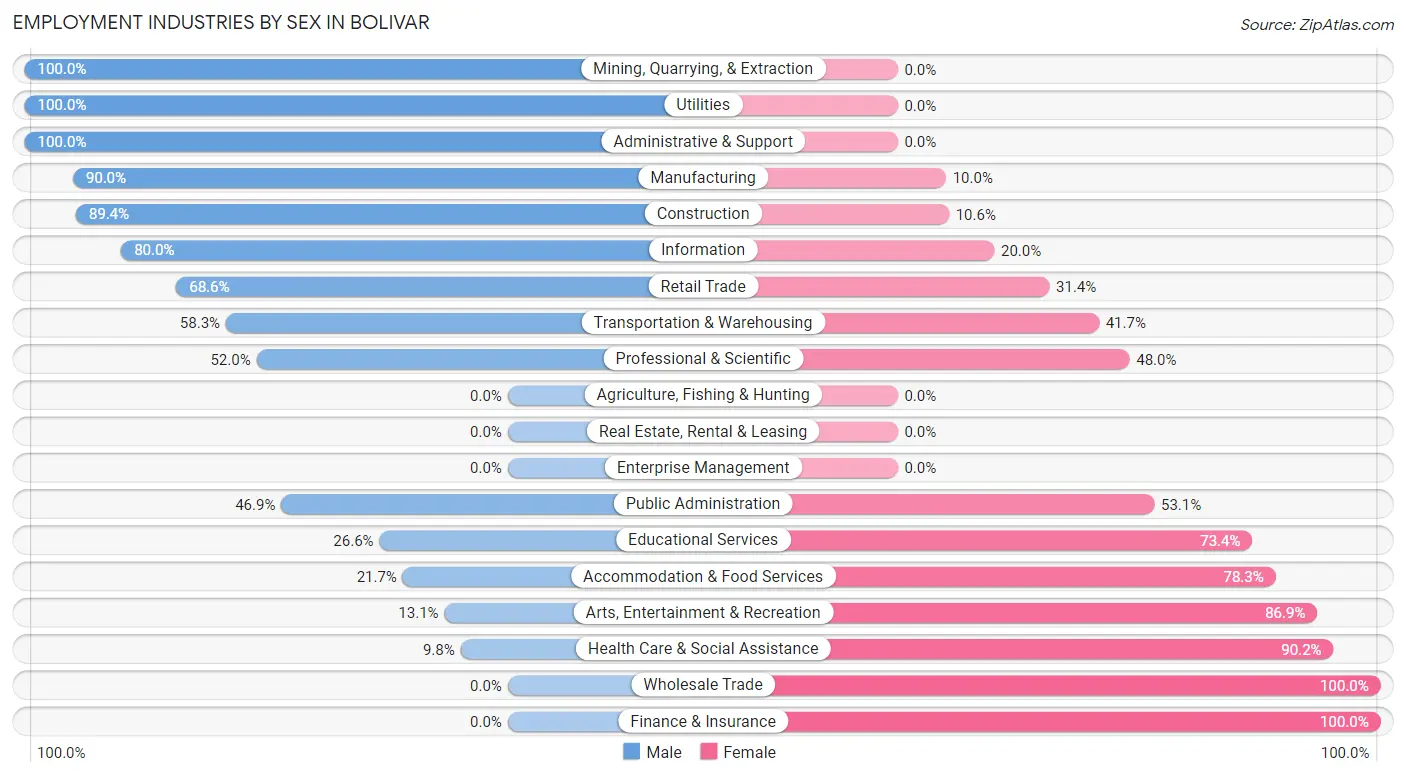
Employment Industries by Sex in Bolivar
The Bolivar industries that see more men than women are Mining, Quarrying, & Extraction (100.0%), Utilities (100.0%), and Administrative & Support (100.0%), whereas the industries that tend to have a higher number of women are Wholesale Trade (100.0%), Finance & Insurance (100.0%), and Health Care & Social Assistance (90.2%).
| Industry | Male | Female |
| Agriculture, Fishing & Hunting | 0 (0.0%) | 0 (0.0%) |
| Mining, Quarrying, & Extraction | 2 (100.0%) | 0 (0.0%) |
| Construction | 101 (89.4%) | 12 (10.6%) |
| Manufacturing | 54 (90.0%) | 6 (10.0%) |
| Wholesale Trade | 0 (0.0%) | 6 (100.0%) |
| Retail Trade | 59 (68.6%) | 27 (31.4%) |
| Transportation & Warehousing | 21 (58.3%) | 15 (41.7%) |
| Utilities | 3 (100.0%) | 0 (0.0%) |
| Information | 16 (80.0%) | 4 (20.0%) |
| Finance & Insurance | 0 (0.0%) | 13 (100.0%) |
| Real Estate, Rental & Leasing | 0 (0.0%) | 0 (0.0%) |
| Professional & Scientific | 26 (52.0%) | 24 (48.0%) |
| Enterprise Management | 0 (0.0%) | 0 (0.0%) |
| Administrative & Support | 26 (100.0%) | 0 (0.0%) |
| Educational Services | 17 (26.6%) | 47 (73.4%) |
| Health Care & Social Assistance | 8 (9.8%) | 74 (90.2%) |
| Arts, Entertainment & Recreation | 8 (13.1%) | 53 (86.9%) |
| Accommodation & Food Services | 10 (21.7%) | 36 (78.3%) |
| Public Administration | 30 (46.9%) | 34 (53.1%) |
| Total | 407 (52.8%) | 364 (47.2%) |
Education in Bolivar
School Enrollment in Bolivar
The most common levels of schooling among the 285 students in Bolivar are elementary school (106 | 37.2%), high school (88 | 30.9%), and college / undergraduate (31 | 10.9%).
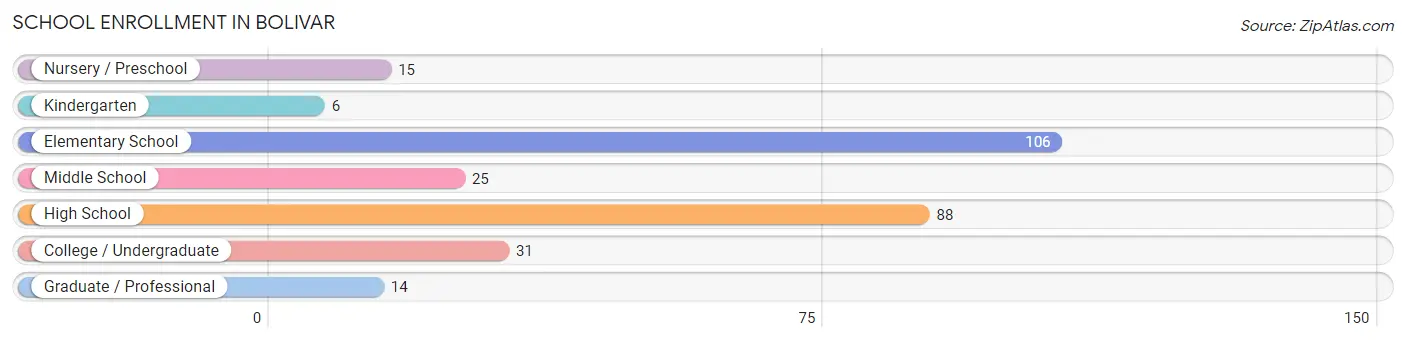
| School Level | # Students | % Students |
| Nursery / Preschool | 15 | 5.3% |
| Kindergarten | 6 | 2.1% |
| Elementary School | 106 | 37.2% |
| Middle School | 25 | 8.8% |
| High School | 88 | 30.9% |
| College / Undergraduate | 31 | 10.9% |
| Graduate / Professional | 14 | 4.9% |
| Total | 285 | 100.0% |
School Enrollment by Age by Funding Source in Bolivar
Out of a total of 285 students who are enrolled in schools in Bolivar, 20 (7.0%) attend a private institution, while the remaining 265 (93.0%) are enrolled in public schools. The age group of 3 to 4 year olds has the highest likelihood of being enrolled in private schools, with 7 (100.0% in the age bracket) enrolled. Conversely, the age group of 10 to 14 year olds has the lowest likelihood of being enrolled in a private school, with 98 (100.0% in the age bracket) attending a public institution.
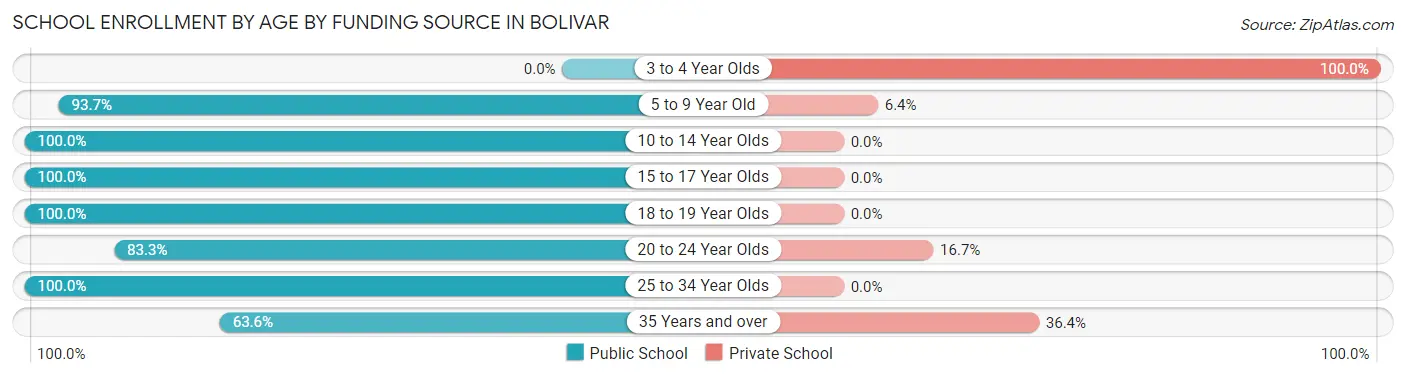
| Age Bracket | Public School | Private School |
| 3 to 4 Year Olds | 0 (0.0%) | 7 (100.0%) |
| 5 to 9 Year Old | 59 (93.6%) | 4 (6.4%) |
| 10 to 14 Year Olds | 98 (100.0%) | 0 (0.0%) |
| 15 to 17 Year Olds | 48 (100.0%) | 0 (0.0%) |
| 18 to 19 Year Olds | 24 (100.0%) | 0 (0.0%) |
| 20 to 24 Year Olds | 25 (83.3%) | 5 (16.7%) |
| 25 to 34 Year Olds | 4 (100.0%) | 0 (0.0%) |
| 35 Years and over | 7 (63.6%) | 4 (36.4%) |
| Total | 265 (93.0%) | 20 (7.0%) |
Educational Attainment by Field of Study in Bolivar
Science & technology (76 | 19.8%), business (60 | 15.6%), arts & humanities (53 | 13.8%), psychology (26 | 6.8%), and education (26 | 6.8%) are the most common fields of study among 384 individuals in Bolivar who have obtained a bachelor's degree or higher.
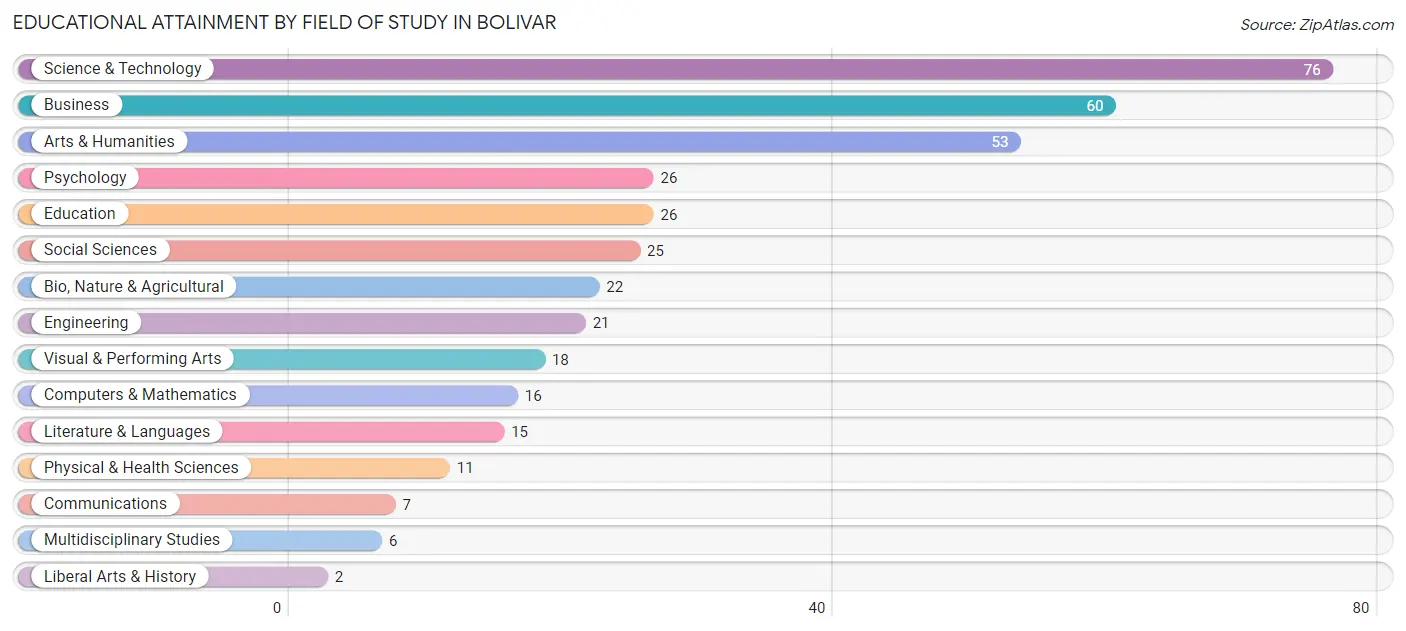
| Field of Study | # Graduates | % Graduates |
| Computers & Mathematics | 16 | 4.2% |
| Bio, Nature & Agricultural | 22 | 5.7% |
| Physical & Health Sciences | 11 | 2.9% |
| Psychology | 26 | 6.8% |
| Social Sciences | 25 | 6.5% |
| Engineering | 21 | 5.5% |
| Multidisciplinary Studies | 6 | 1.6% |
| Science & Technology | 76 | 19.8% |
| Business | 60 | 15.6% |
| Education | 26 | 6.8% |
| Literature & Languages | 15 | 3.9% |
| Liberal Arts & History | 2 | 0.5% |
| Visual & Performing Arts | 18 | 4.7% |
| Communications | 7 | 1.8% |
| Arts & Humanities | 53 | 13.8% |
| Total | 384 | 100.0% |
Transportation & Commute in Bolivar
Vehicle Availability by Sex in Bolivar
The most prevalent vehicle ownership categories in Bolivar are males with 2 vehicles (139, accounting for 35.7%) and females with 2 vehicles (134, making up 38.2%).
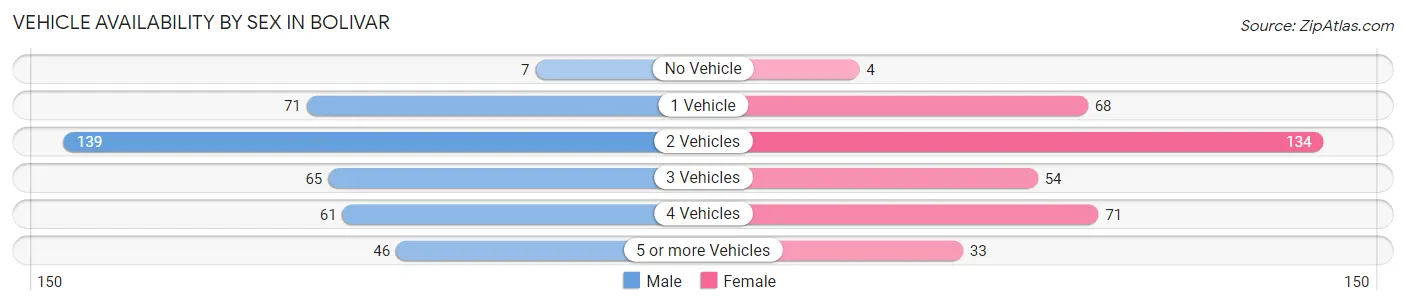
| Vehicles Available | Male | Female |
| No Vehicle | 7 (1.8%) | 4 (1.1%) |
| 1 Vehicle | 71 (18.2%) | 68 (18.7%) |
| 2 Vehicles | 139 (35.7%) | 134 (36.8%) |
| 3 Vehicles | 65 (16.7%) | 54 (14.8%) |
| 4 Vehicles | 61 (15.7%) | 71 (19.5%) |
| 5 or more Vehicles | 46 (11.8%) | 33 (9.1%) |
| Total | 389 (100.0%) | 364 (100.0%) |
Commute Time in Bolivar
The most frequently occuring commute durations in Bolivar are 60 to 89 minutes (156 commuters, 24.5%), 15 to 19 minutes (93 commuters, 14.6%), and 30 to 34 minutes (84 commuters, 13.2%).
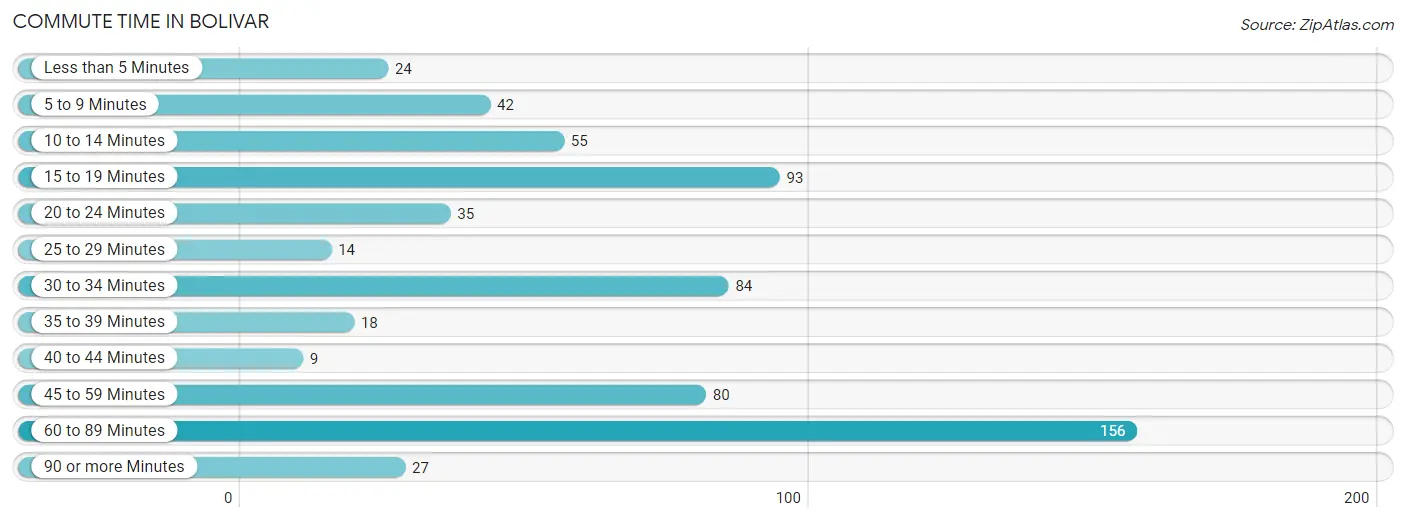
| Commute Time | # Commuters | % Commuters |
| Less than 5 Minutes | 24 | 3.8% |
| 5 to 9 Minutes | 42 | 6.6% |
| 10 to 14 Minutes | 55 | 8.6% |
| 15 to 19 Minutes | 93 | 14.6% |
| 20 to 24 Minutes | 35 | 5.5% |
| 25 to 29 Minutes | 14 | 2.2% |
| 30 to 34 Minutes | 84 | 13.2% |
| 35 to 39 Minutes | 18 | 2.8% |
| 40 to 44 Minutes | 9 | 1.4% |
| 45 to 59 Minutes | 80 | 12.6% |
| 60 to 89 Minutes | 156 | 24.5% |
| 90 or more Minutes | 27 | 4.2% |
Commute Time by Sex in Bolivar
The most common commute times in Bolivar are 60 to 89 minutes (108 commuters, 33.1%) for males and 30 to 34 minutes (51 commuters, 16.4%) for females.
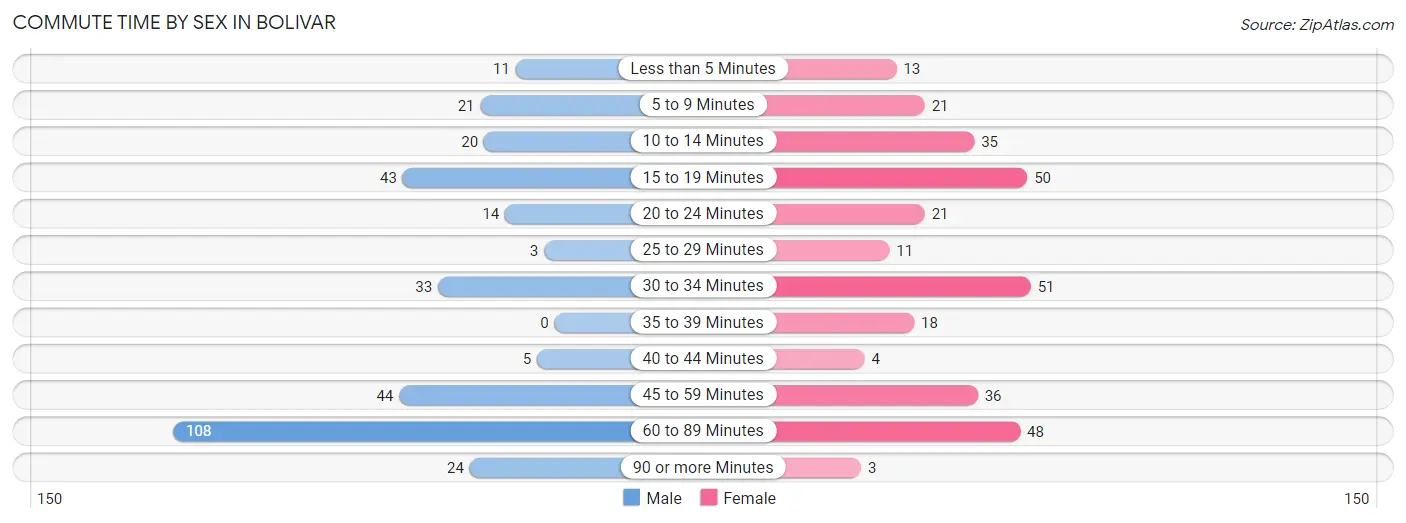
| Commute Time | Male | Female |
| Less than 5 Minutes | 11 (3.4%) | 13 (4.2%) |
| 5 to 9 Minutes | 21 (6.4%) | 21 (6.8%) |
| 10 to 14 Minutes | 20 (6.1%) | 35 (11.3%) |
| 15 to 19 Minutes | 43 (13.2%) | 50 (16.1%) |
| 20 to 24 Minutes | 14 (4.3%) | 21 (6.8%) |
| 25 to 29 Minutes | 3 (0.9%) | 11 (3.5%) |
| 30 to 34 Minutes | 33 (10.1%) | 51 (16.4%) |
| 35 to 39 Minutes | 0 (0.0%) | 18 (5.8%) |
| 40 to 44 Minutes | 5 (1.5%) | 4 (1.3%) |
| 45 to 59 Minutes | 44 (13.5%) | 36 (11.6%) |
| 60 to 89 Minutes | 108 (33.1%) | 48 (15.4%) |
| 90 or more Minutes | 24 (7.4%) | 3 (1.0%) |
Time of Departure to Work by Sex in Bolivar
The most frequent times of departure to work in Bolivar are 6:00 AM to 6:29 AM (74, 22.7%) for males and 7:00 AM to 7:29 AM (83, 26.7%) for females.
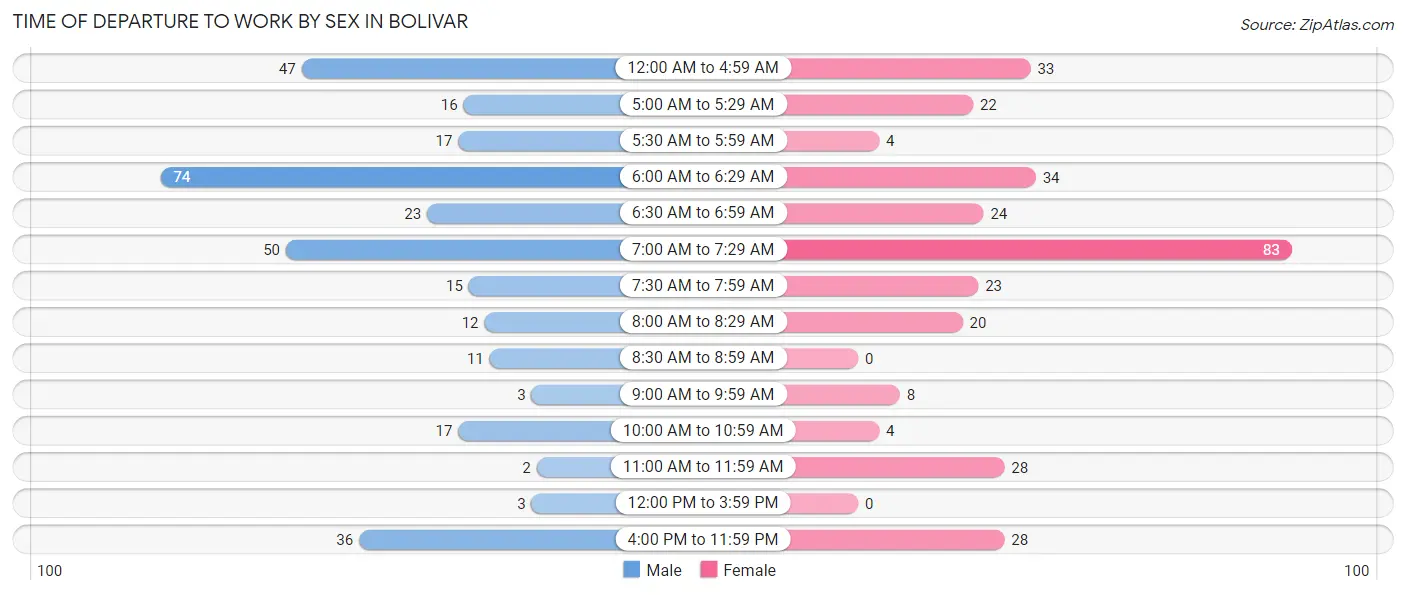
| Time of Departure | Male | Female |
| 12:00 AM to 4:59 AM | 47 (14.4%) | 33 (10.6%) |
| 5:00 AM to 5:29 AM | 16 (4.9%) | 22 (7.1%) |
| 5:30 AM to 5:59 AM | 17 (5.2%) | 4 (1.3%) |
| 6:00 AM to 6:29 AM | 74 (22.7%) | 34 (10.9%) |
| 6:30 AM to 6:59 AM | 23 (7.1%) | 24 (7.7%) |
| 7:00 AM to 7:29 AM | 50 (15.3%) | 83 (26.7%) |
| 7:30 AM to 7:59 AM | 15 (4.6%) | 23 (7.4%) |
| 8:00 AM to 8:29 AM | 12 (3.7%) | 20 (6.4%) |
| 8:30 AM to 8:59 AM | 11 (3.4%) | 0 (0.0%) |
| 9:00 AM to 9:59 AM | 3 (0.9%) | 8 (2.6%) |
| 10:00 AM to 10:59 AM | 17 (5.2%) | 4 (1.3%) |
| 11:00 AM to 11:59 AM | 2 (0.6%) | 28 (9.0%) |
| 12:00 PM to 3:59 PM | 3 (0.9%) | 0 (0.0%) |
| 4:00 PM to 11:59 PM | 36 (11.0%) | 28 (9.0%) |
| Total | 326 (100.0%) | 311 (100.0%) |
Housing Occupancy in Bolivar
Occupancy by Ownership in Bolivar
Of the total 529 dwellings in Bolivar, owner-occupied units account for 320 (60.5%), while renter-occupied units make up 209 (39.5%).
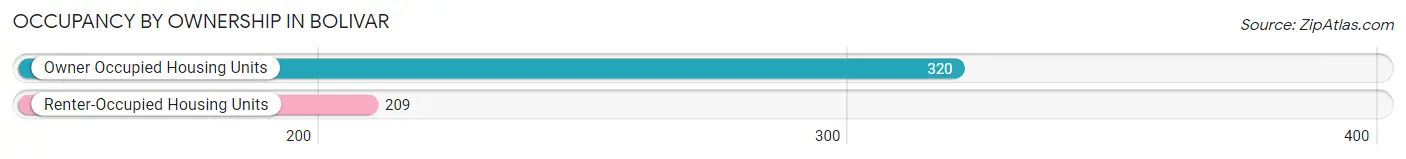
| Occupancy | # Housing Units | % Housing Units |
| Owner Occupied Housing Units | 320 | 60.5% |
| Renter-Occupied Housing Units | 209 | 39.5% |
| Total Occupied Housing Units | 529 | 100.0% |
Occupancy by Household Size in Bolivar
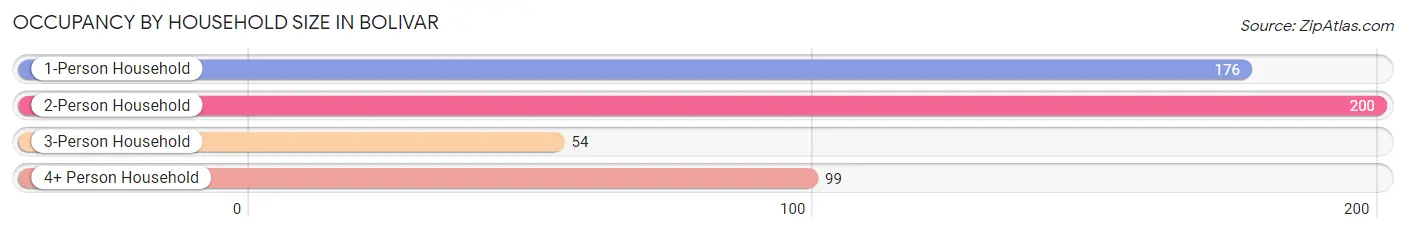
| Household Size | # Housing Units | % Housing Units |
| 1-Person Household | 176 | 33.3% |
| 2-Person Household | 200 | 37.8% |
| 3-Person Household | 54 | 10.2% |
| 4+ Person Household | 99 | 18.7% |
| Total Housing Units | 529 | 100.0% |
Occupancy by Ownership by Household Size in Bolivar
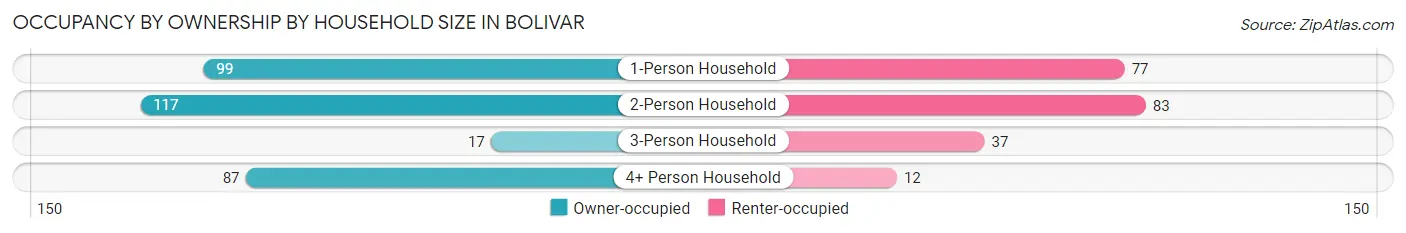
| Household Size | Owner-occupied | Renter-occupied |
| 1-Person Household | 99 (56.2%) | 77 (43.8%) |
| 2-Person Household | 117 (58.5%) | 83 (41.5%) |
| 3-Person Household | 17 (31.5%) | 37 (68.5%) |
| 4+ Person Household | 87 (87.9%) | 12 (12.1%) |
| Total Housing Units | 320 (60.5%) | 209 (39.5%) |
Occupancy by Educational Attainment in Bolivar
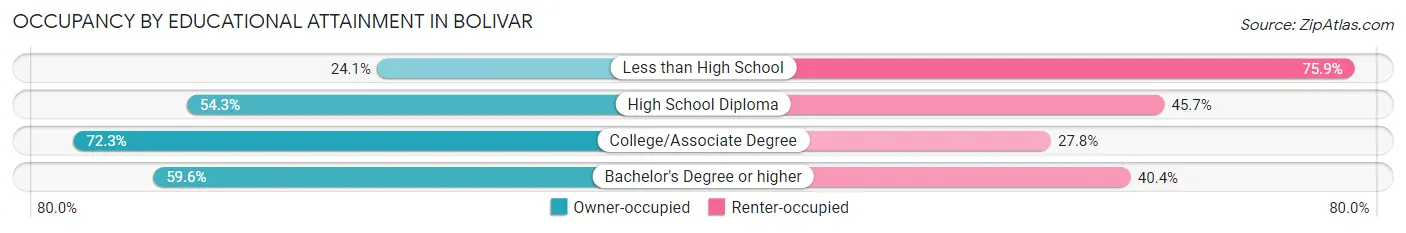
| Household Size | Owner-occupied | Renter-occupied |
| Less than High School | 7 (24.1%) | 22 (75.9%) |
| High School Diploma | 70 (54.3%) | 59 (45.7%) |
| College/Associate Degree | 125 (72.3%) | 48 (27.8%) |
| Bachelor's Degree or higher | 118 (59.6%) | 80 (40.4%) |
Occupancy by Age of Householder in Bolivar
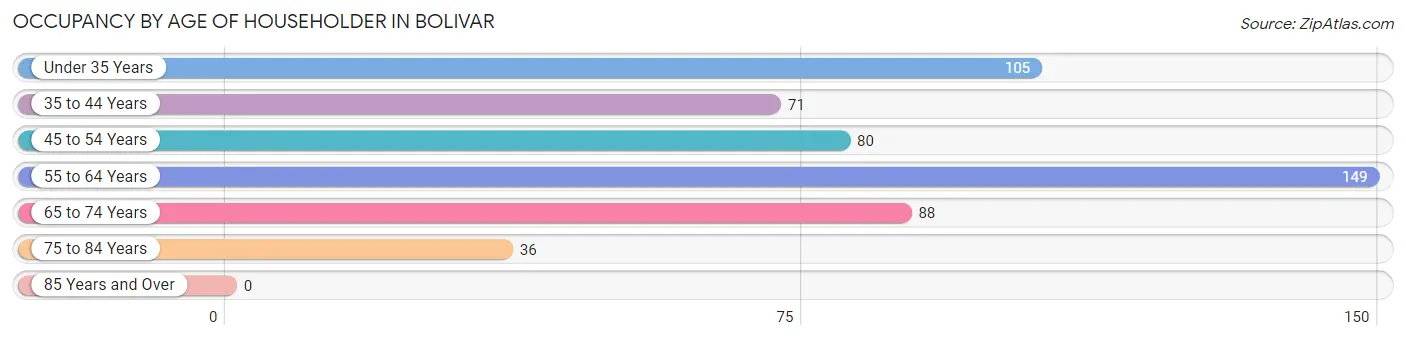
| Age Bracket | # Households | % Households |
| Under 35 Years | 105 | 19.9% |
| 35 to 44 Years | 71 | 13.4% |
| 45 to 54 Years | 80 | 15.1% |
| 55 to 64 Years | 149 | 28.2% |
| 65 to 74 Years | 88 | 16.6% |
| 75 to 84 Years | 36 | 6.8% |
| 85 Years and Over | 0 | 0.0% |
| Total | 529 | 100.0% |
Housing Finances in Bolivar
Median Income by Occupancy in Bolivar
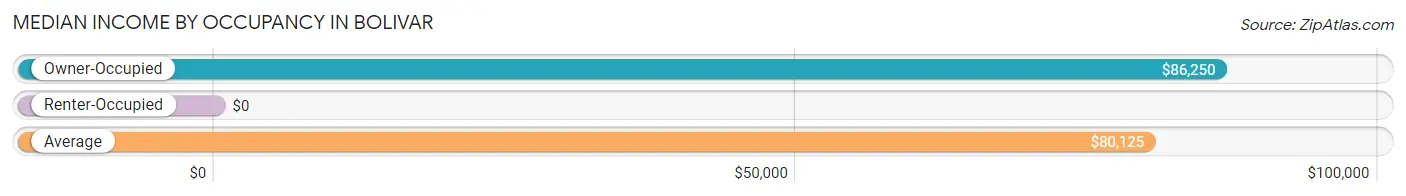
| Occupancy Type | # Households | Median Income |
| Owner-Occupied | 320 (60.5%) | $86,250 |
| Renter-Occupied | 209 (39.5%) | $0 |
| Average | 529 (100.0%) | $80,125 |
Occupancy by Householder Income Bracket in Bolivar
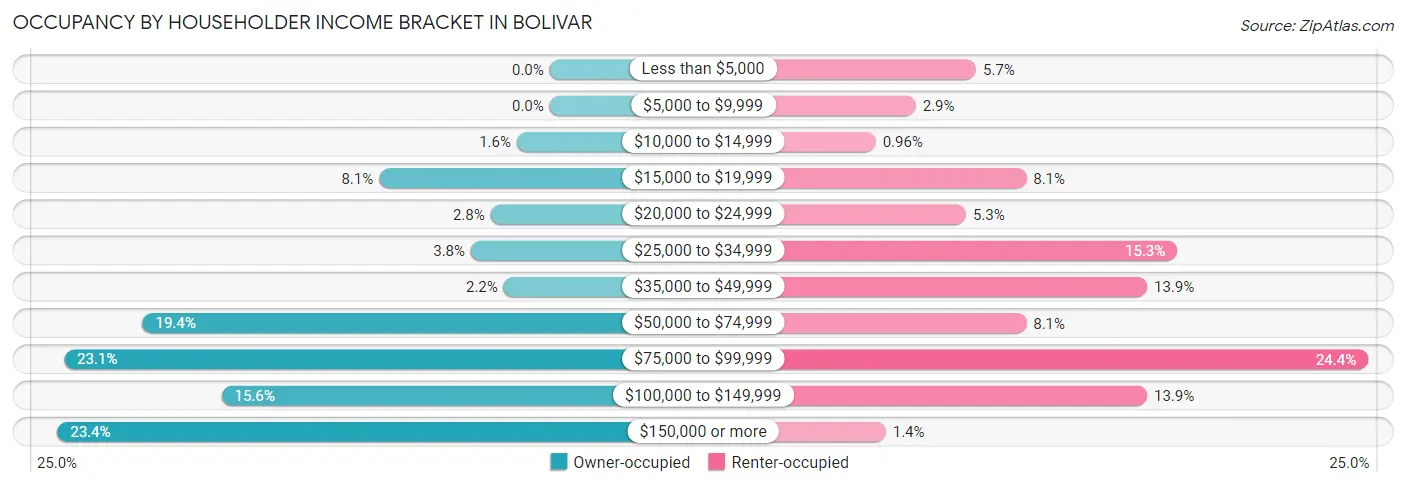
| Income Bracket | Owner-occupied | Renter-occupied |
| Less than $5,000 | 0 (0.0%) | 12 (5.7%) |
| $5,000 to $9,999 | 0 (0.0%) | 6 (2.9%) |
| $10,000 to $14,999 | 5 (1.6%) | 2 (1.0%) |
| $15,000 to $19,999 | 26 (8.1%) | 17 (8.1%) |
| $20,000 to $24,999 | 9 (2.8%) | 11 (5.3%) |
| $25,000 to $34,999 | 12 (3.7%) | 32 (15.3%) |
| $35,000 to $49,999 | 7 (2.2%) | 29 (13.9%) |
| $50,000 to $74,999 | 62 (19.4%) | 17 (8.1%) |
| $75,000 to $99,999 | 74 (23.1%) | 51 (24.4%) |
| $100,000 to $149,999 | 50 (15.6%) | 29 (13.9%) |
| $150,000 or more | 75 (23.4%) | 3 (1.4%) |
| Total | 320 (100.0%) | 209 (100.0%) |
Monthly Housing Cost Tiers in Bolivar
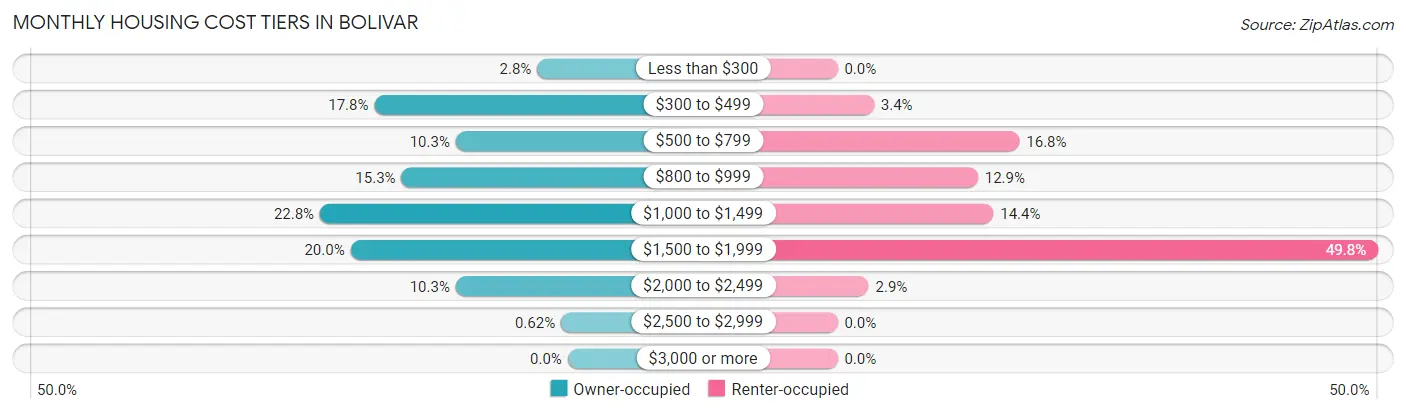
| Monthly Cost | Owner-occupied | Renter-occupied |
| Less than $300 | 9 (2.8%) | 0 (0.0%) |
| $300 to $499 | 57 (17.8%) | 7 (3.4%) |
| $500 to $799 | 33 (10.3%) | 35 (16.8%) |
| $800 to $999 | 49 (15.3%) | 27 (12.9%) |
| $1,000 to $1,499 | 73 (22.8%) | 30 (14.3%) |
| $1,500 to $1,999 | 64 (20.0%) | 104 (49.8%) |
| $2,000 to $2,499 | 33 (10.3%) | 6 (2.9%) |
| $2,500 to $2,999 | 2 (0.6%) | 0 (0.0%) |
| $3,000 or more | 0 (0.0%) | 0 (0.0%) |
| Total | 320 (100.0%) | 209 (100.0%) |
Physical Housing Characteristics in Bolivar
Housing Structures in Bolivar
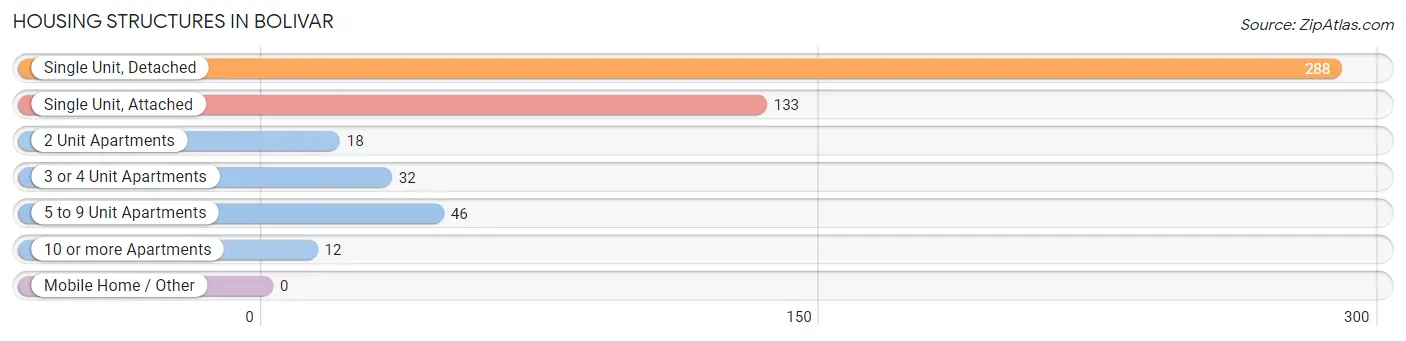
| Structure Type | # Housing Units | % Housing Units |
| Single Unit, Detached | 288 | 54.4% |
| Single Unit, Attached | 133 | 25.1% |
| 2 Unit Apartments | 18 | 3.4% |
| 3 or 4 Unit Apartments | 32 | 6.0% |
| 5 to 9 Unit Apartments | 46 | 8.7% |
| 10 or more Apartments | 12 | 2.3% |
| Mobile Home / Other | 0 | 0.0% |
| Total | 529 | 100.0% |
Housing Structures by Occupancy in Bolivar
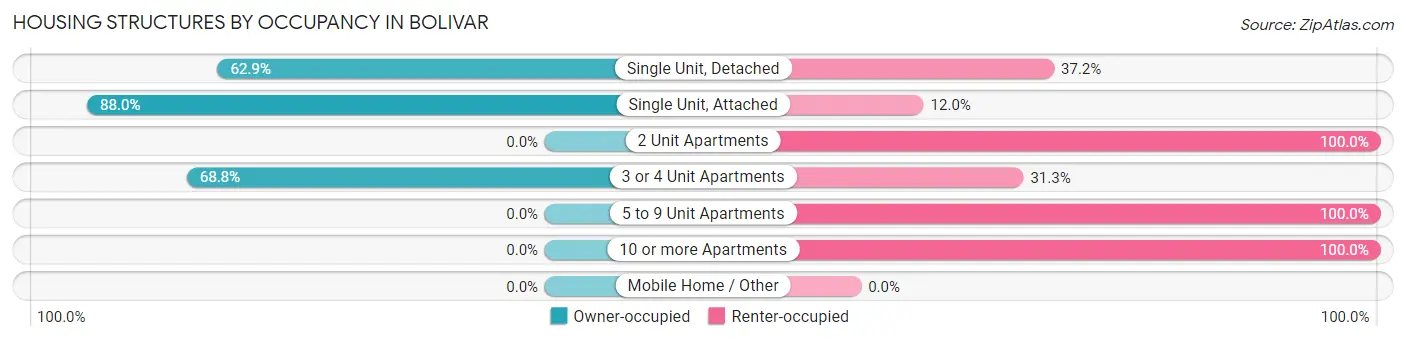
| Structure Type | Owner-occupied | Renter-occupied |
| Single Unit, Detached | 181 (62.8%) | 107 (37.1%) |
| Single Unit, Attached | 117 (88.0%) | 16 (12.0%) |
| 2 Unit Apartments | 0 (0.0%) | 18 (100.0%) |
| 3 or 4 Unit Apartments | 22 (68.8%) | 10 (31.2%) |
| 5 to 9 Unit Apartments | 0 (0.0%) | 46 (100.0%) |
| 10 or more Apartments | 0 (0.0%) | 12 (100.0%) |
| Mobile Home / Other | 0 (0.0%) | 0 (0.0%) |
| Total | 320 (60.5%) | 209 (39.5%) |
Housing Structures by Number of Rooms in Bolivar
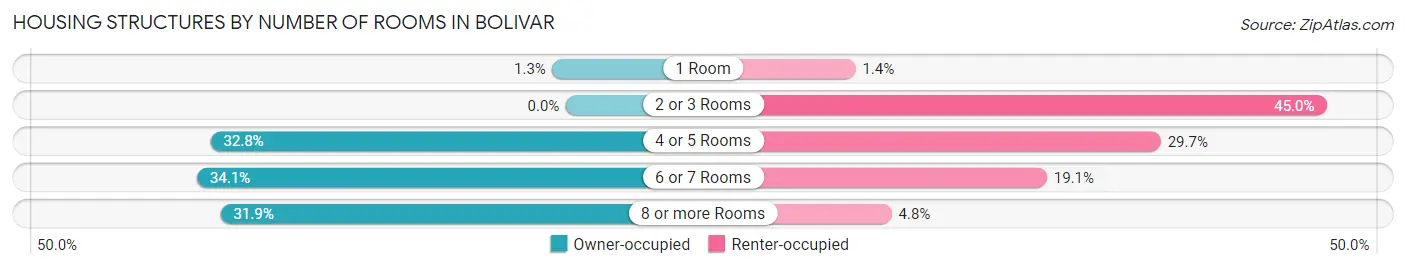
| Number of Rooms | Owner-occupied | Renter-occupied |
| 1 Room | 4 (1.3%) | 3 (1.4%) |
| 2 or 3 Rooms | 0 (0.0%) | 94 (45.0%) |
| 4 or 5 Rooms | 105 (32.8%) | 62 (29.7%) |
| 6 or 7 Rooms | 109 (34.1%) | 40 (19.1%) |
| 8 or more Rooms | 102 (31.9%) | 10 (4.8%) |
| Total | 320 (100.0%) | 209 (100.0%) |
Housing Structure by Heating Type in Bolivar
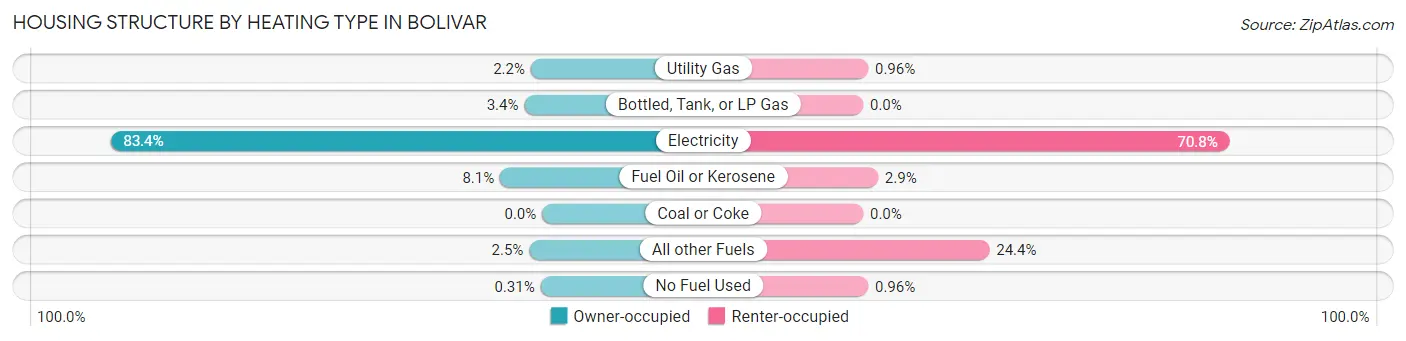
| Heating Type | Owner-occupied | Renter-occupied |
| Utility Gas | 7 (2.2%) | 2 (1.0%) |
| Bottled, Tank, or LP Gas | 11 (3.4%) | 0 (0.0%) |
| Electricity | 267 (83.4%) | 148 (70.8%) |
| Fuel Oil or Kerosene | 26 (8.1%) | 6 (2.9%) |
| Coal or Coke | 0 (0.0%) | 0 (0.0%) |
| All other Fuels | 8 (2.5%) | 51 (24.4%) |
| No Fuel Used | 1 (0.3%) | 2 (1.0%) |
| Total | 320 (100.0%) | 209 (100.0%) |
Household Vehicle Usage in Bolivar
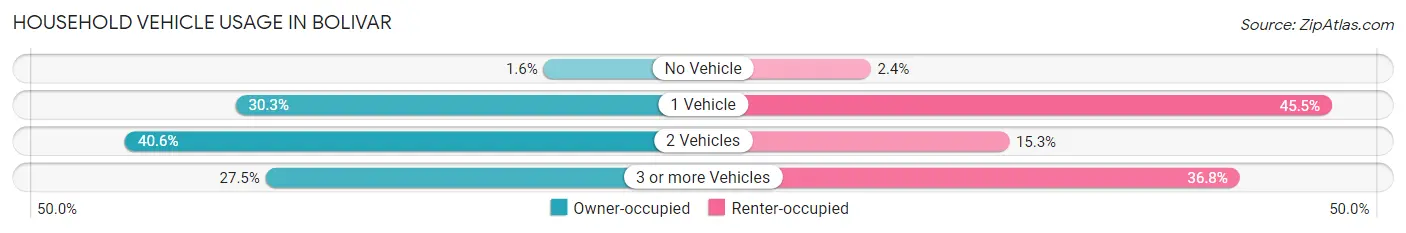
| Vehicles per Household | Owner-occupied | Renter-occupied |
| No Vehicle | 5 (1.6%) | 5 (2.4%) |
| 1 Vehicle | 97 (30.3%) | 95 (45.5%) |
| 2 Vehicles | 130 (40.6%) | 32 (15.3%) |
| 3 or more Vehicles | 88 (27.5%) | 77 (36.8%) |
| Total | 320 (100.0%) | 209 (100.0%) |
Real Estate & Mortgages in Bolivar
Real Estate and Mortgage Overview in Bolivar
| Characteristic | Without Mortgage | With Mortgage |
| Housing Units | 102 | 218 |
| Median Property Value | $234,300 | $245,800 |
| Median Household Income | $64,659 | $49 |
| Monthly Housing Costs | $466 | $0 |
| Real Estate Taxes | $1,302 | $4 |
Property Value by Mortgage Status in Bolivar
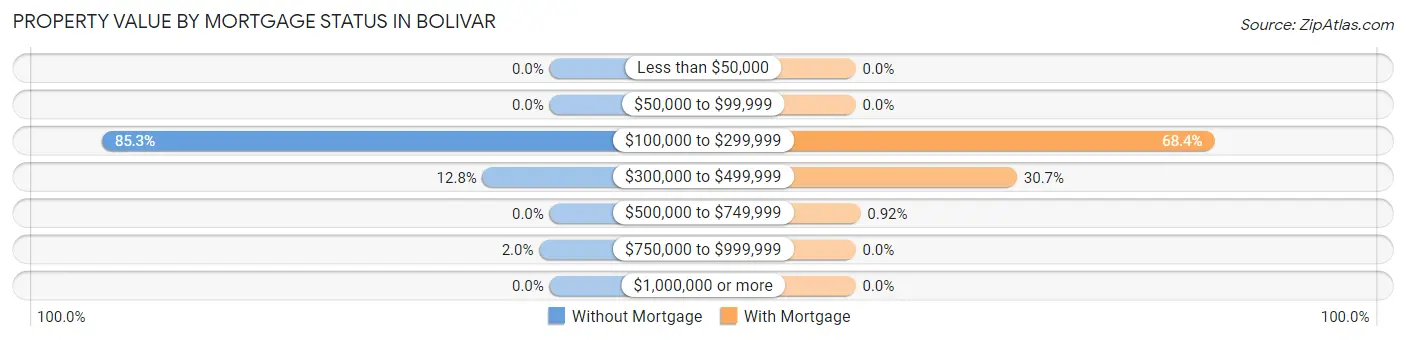
| Property Value | Without Mortgage | With Mortgage |
| Less than $50,000 | 0 (0.0%) | 0 (0.0%) |
| $50,000 to $99,999 | 0 (0.0%) | 0 (0.0%) |
| $100,000 to $299,999 | 87 (85.3%) | 149 (68.3%) |
| $300,000 to $499,999 | 13 (12.8%) | 67 (30.7%) |
| $500,000 to $749,999 | 0 (0.0%) | 2 (0.9%) |
| $750,000 to $999,999 | 2 (2.0%) | 0 (0.0%) |
| $1,000,000 or more | 0 (0.0%) | 0 (0.0%) |
| Total | 102 (100.0%) | 218 (100.0%) |
Household Income by Mortgage Status in Bolivar
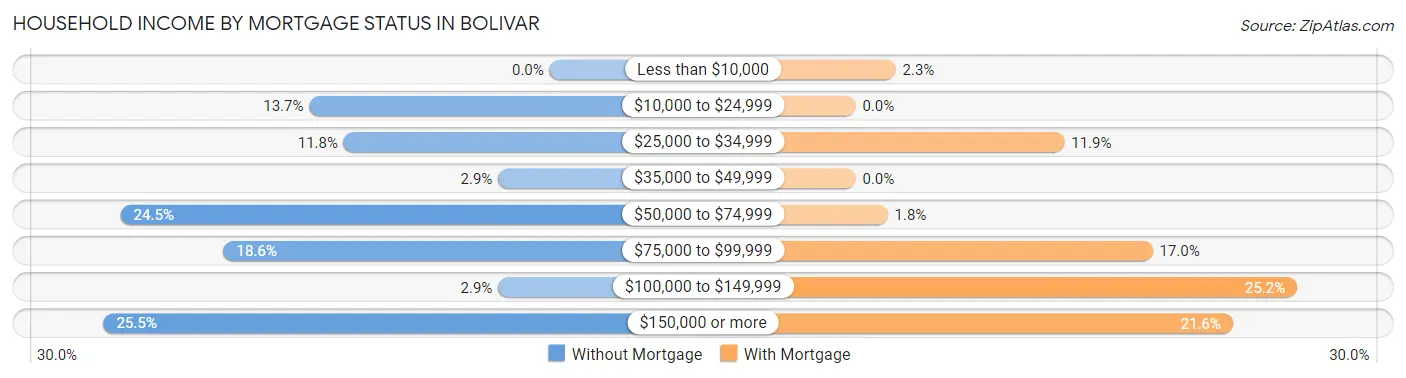
| Household Income | Without Mortgage | With Mortgage |
| Less than $10,000 | 0 (0.0%) | 5 (2.3%) |
| $10,000 to $24,999 | 14 (13.7%) | 0 (0.0%) |
| $25,000 to $34,999 | 12 (11.8%) | 26 (11.9%) |
| $35,000 to $49,999 | 3 (2.9%) | 0 (0.0%) |
| $50,000 to $74,999 | 25 (24.5%) | 4 (1.8%) |
| $75,000 to $99,999 | 19 (18.6%) | 37 (17.0%) |
| $100,000 to $149,999 | 3 (2.9%) | 55 (25.2%) |
| $150,000 or more | 26 (25.5%) | 47 (21.6%) |
| Total | 102 (100.0%) | 218 (100.0%) |
Property Value to Household Income Ratio in Bolivar
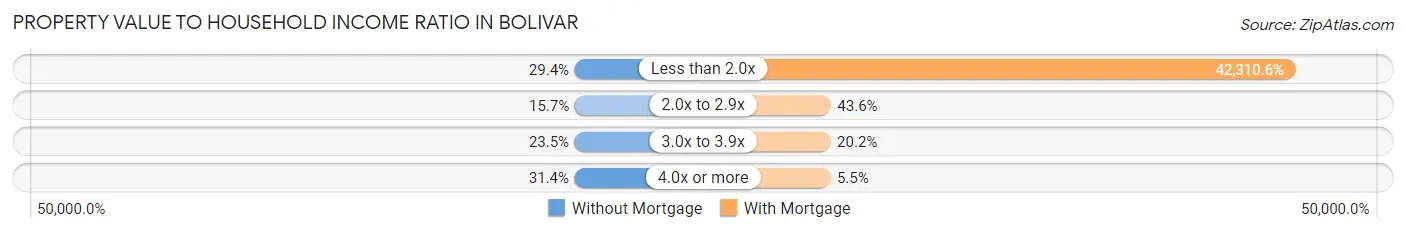
| Value-to-Income Ratio | Without Mortgage | With Mortgage |
| Less than 2.0x | 30 (29.4%) | 92,237 (42,310.6%) |
| 2.0x to 2.9x | 16 (15.7%) | 95 (43.6%) |
| 3.0x to 3.9x | 24 (23.5%) | 44 (20.2%) |
| 4.0x or more | 32 (31.4%) | 12 (5.5%) |
| Total | 102 (100.0%) | 218 (100.0%) |
Real Estate Taxes by Mortgage Status in Bolivar
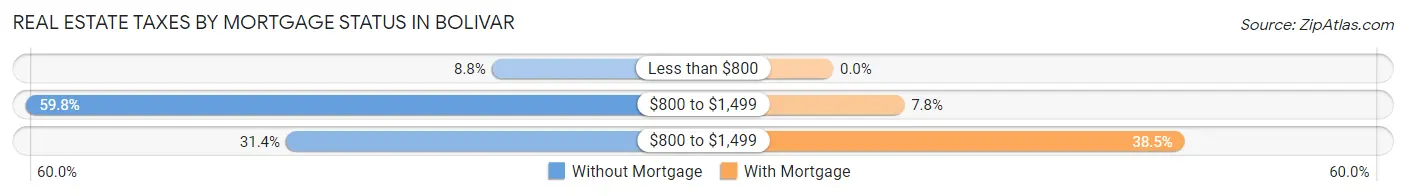
| Property Taxes | Without Mortgage | With Mortgage |
| Less than $800 | 9 (8.8%) | 0 (0.0%) |
| $800 to $1,499 | 61 (59.8%) | 17 (7.8%) |
| $800 to $1,499 | 32 (31.4%) | 84 (38.5%) |
| Total | 102 (100.0%) | 218 (100.0%) |
Health & Disability in Bolivar
Health Insurance Coverage by Age in Bolivar
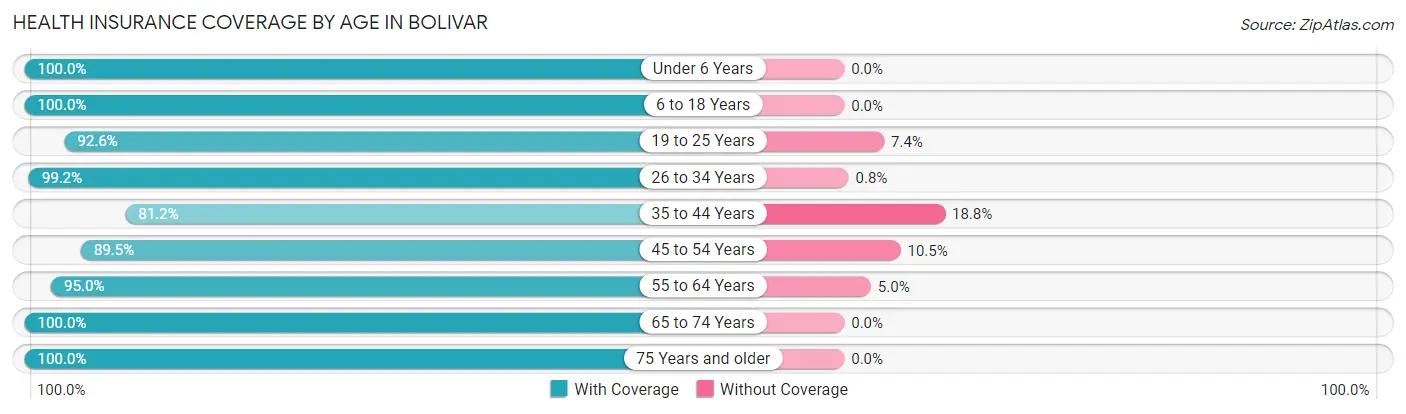
| Age Bracket | With Coverage | Without Coverage |
| Under 6 Years | 62 (100.0%) | 0 (0.0%) |
| 6 to 18 Years | 224 (100.0%) | 0 (0.0%) |
| 19 to 25 Years | 137 (92.6%) | 11 (7.4%) |
| 26 to 34 Years | 124 (99.2%) | 1 (0.8%) |
| 35 to 44 Years | 121 (81.2%) | 28 (18.8%) |
| 45 to 54 Years | 128 (89.5%) | 15 (10.5%) |
| 55 to 64 Years | 249 (95.0%) | 13 (5.0%) |
| 65 to 74 Years | 114 (100.0%) | 0 (0.0%) |
| 75 Years and older | 56 (100.0%) | 0 (0.0%) |
| Total | 1,215 (94.7%) | 68 (5.3%) |
Health Insurance Coverage by Citizenship Status in Bolivar
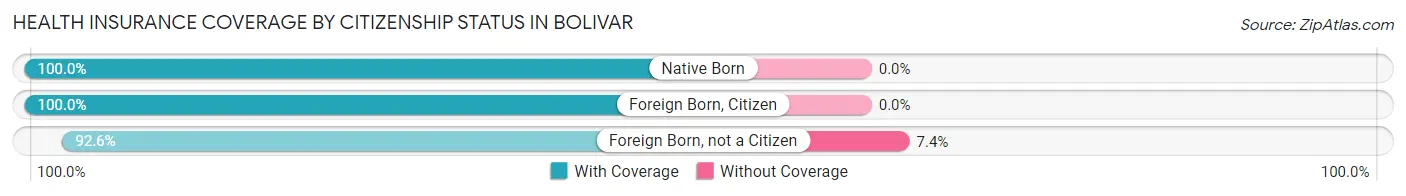
| Citizenship Status | With Coverage | Without Coverage |
| Native Born | 62 (100.0%) | 0 (0.0%) |
| Foreign Born, Citizen | 224 (100.0%) | 0 (0.0%) |
| Foreign Born, not a Citizen | 137 (92.6%) | 11 (7.4%) |
Health Insurance Coverage by Household Income in Bolivar
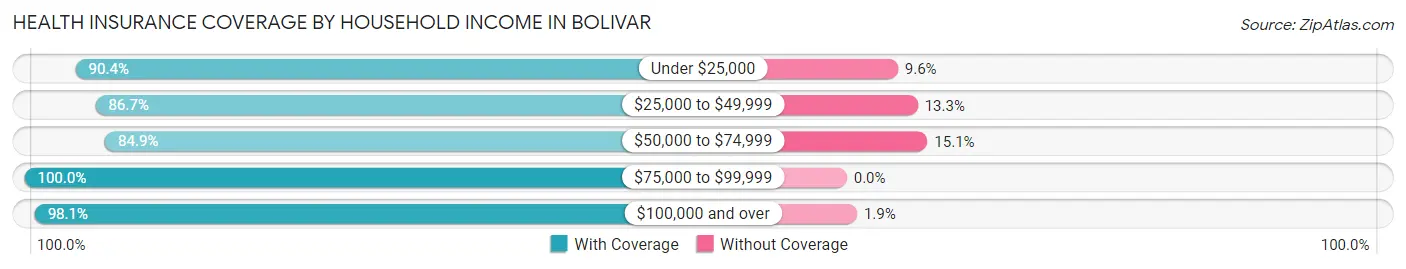
| Household Income | With Coverage | Without Coverage |
| Under $25,000 | 85 (90.4%) | 9 (9.6%) |
| $25,000 to $49,999 | 124 (86.7%) | 19 (13.3%) |
| $50,000 to $74,999 | 163 (84.9%) | 29 (15.1%) |
| $75,000 to $99,999 | 276 (100.0%) | 0 (0.0%) |
| $100,000 and over | 567 (98.1%) | 11 (1.9%) |
Public vs Private Health Insurance Coverage by Age in Bolivar
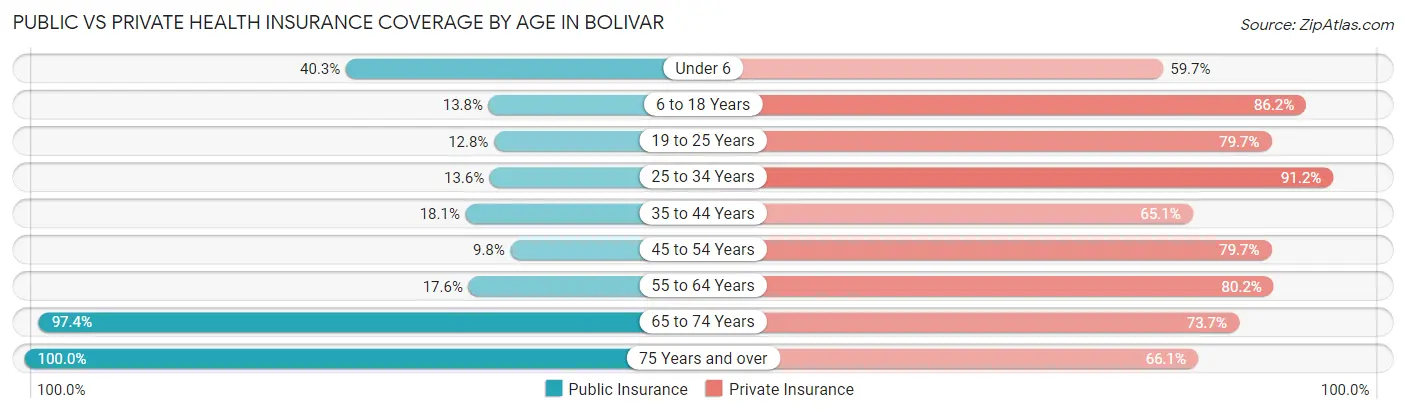
| Age Bracket | Public Insurance | Private Insurance |
| Under 6 | 25 (40.3%) | 37 (59.7%) |
| 6 to 18 Years | 31 (13.8%) | 193 (86.2%) |
| 19 to 25 Years | 19 (12.8%) | 118 (79.7%) |
| 25 to 34 Years | 17 (13.6%) | 114 (91.2%) |
| 35 to 44 Years | 27 (18.1%) | 97 (65.1%) |
| 45 to 54 Years | 14 (9.8%) | 114 (79.7%) |
| 55 to 64 Years | 46 (17.6%) | 210 (80.1%) |
| 65 to 74 Years | 111 (97.4%) | 84 (73.7%) |
| 75 Years and over | 56 (100.0%) | 37 (66.1%) |
| Total | 346 (27.0%) | 1,004 (78.2%) |
Disability Status by Sex by Age in Bolivar
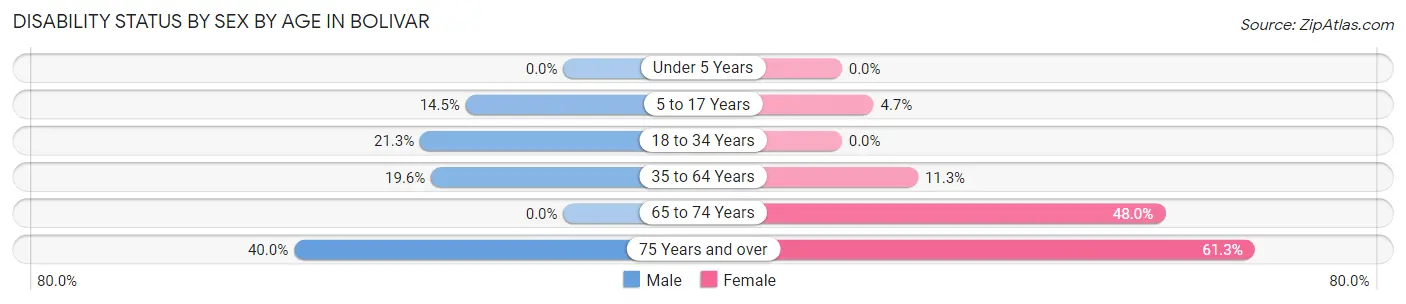
| Age Bracket | Male | Female |
| Under 5 Years | 0 (0.0%) | 0 (0.0%) |
| 5 to 17 Years | 19 (14.5%) | 4 (4.7%) |
| 18 to 34 Years | 30 (21.3%) | 0 (0.0%) |
| 35 to 64 Years | 55 (19.6%) | 31 (11.3%) |
| 65 to 74 Years | 0 (0.0%) | 24 (48.0%) |
| 75 Years and over | 10 (40.0%) | 19 (61.3%) |
Disability Class by Sex by Age in Bolivar
Disability Class: Hearing Difficulty
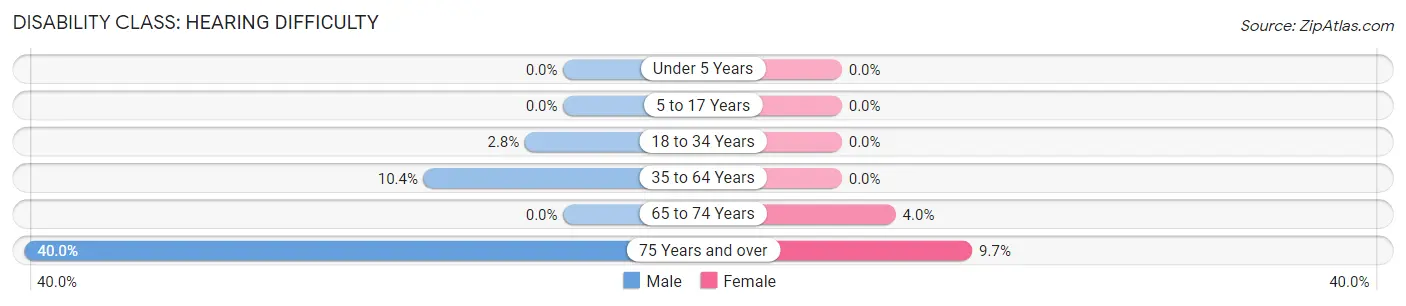
| Age Bracket | Male | Female |
| Under 5 Years | 0 (0.0%) | 0 (0.0%) |
| 5 to 17 Years | 0 (0.0%) | 0 (0.0%) |
| 18 to 34 Years | 4 (2.8%) | 0 (0.0%) |
| 35 to 64 Years | 29 (10.4%) | 0 (0.0%) |
| 65 to 74 Years | 0 (0.0%) | 2 (4.0%) |
| 75 Years and over | 10 (40.0%) | 3 (9.7%) |
Disability Class: Vision Difficulty
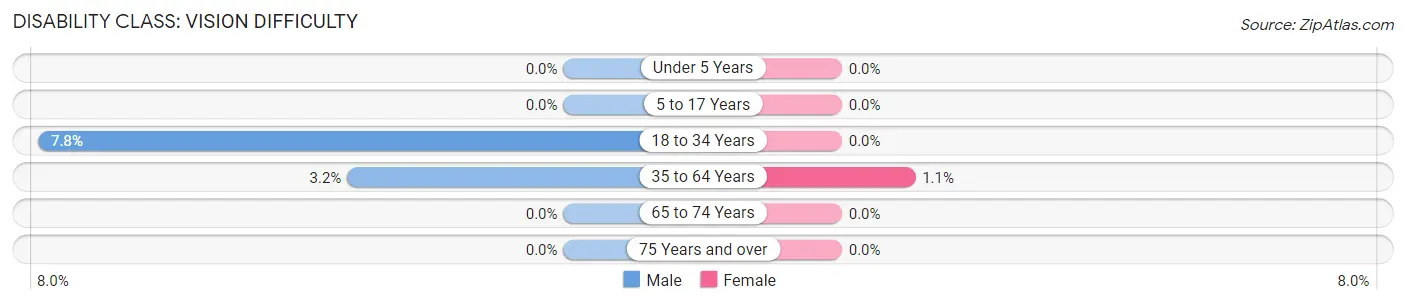
| Age Bracket | Male | Female |
| Under 5 Years | 0 (0.0%) | 0 (0.0%) |
| 5 to 17 Years | 0 (0.0%) | 0 (0.0%) |
| 18 to 34 Years | 11 (7.8%) | 0 (0.0%) |
| 35 to 64 Years | 9 (3.2%) | 3 (1.1%) |
| 65 to 74 Years | 0 (0.0%) | 0 (0.0%) |
| 75 Years and over | 0 (0.0%) | 0 (0.0%) |
Disability Class: Cognitive Difficulty
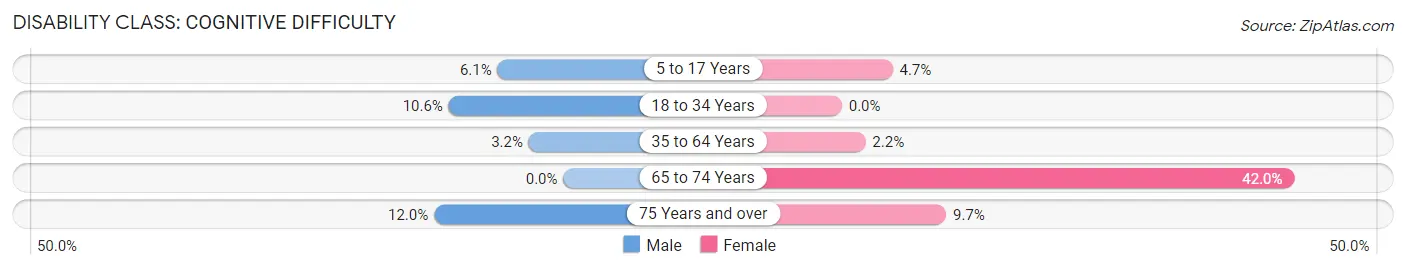
| Age Bracket | Male | Female |
| 5 to 17 Years | 8 (6.1%) | 4 (4.7%) |
| 18 to 34 Years | 15 (10.6%) | 0 (0.0%) |
| 35 to 64 Years | 9 (3.2%) | 6 (2.2%) |
| 65 to 74 Years | 0 (0.0%) | 21 (42.0%) |
| 75 Years and over | 3 (12.0%) | 3 (9.7%) |
Disability Class: Ambulatory Difficulty
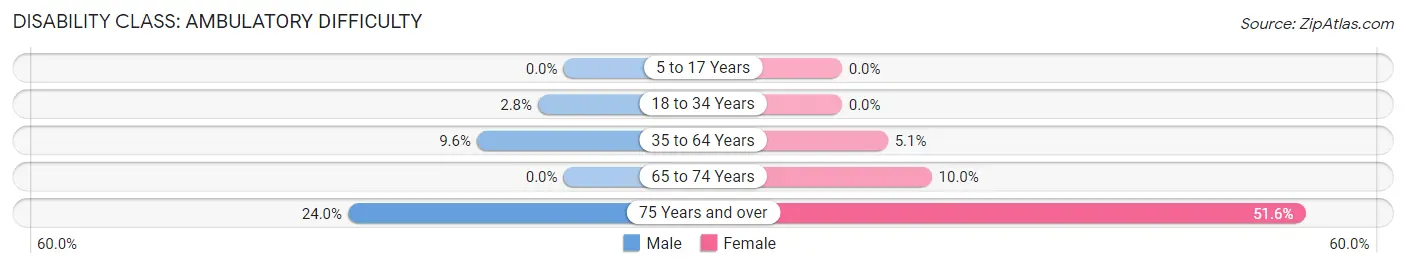
| Age Bracket | Male | Female |
| 5 to 17 Years | 0 (0.0%) | 0 (0.0%) |
| 18 to 34 Years | 4 (2.8%) | 0 (0.0%) |
| 35 to 64 Years | 27 (9.6%) | 14 (5.1%) |
| 65 to 74 Years | 0 (0.0%) | 5 (10.0%) |
| 75 Years and over | 6 (24.0%) | 16 (51.6%) |
Disability Class: Self-Care Difficulty
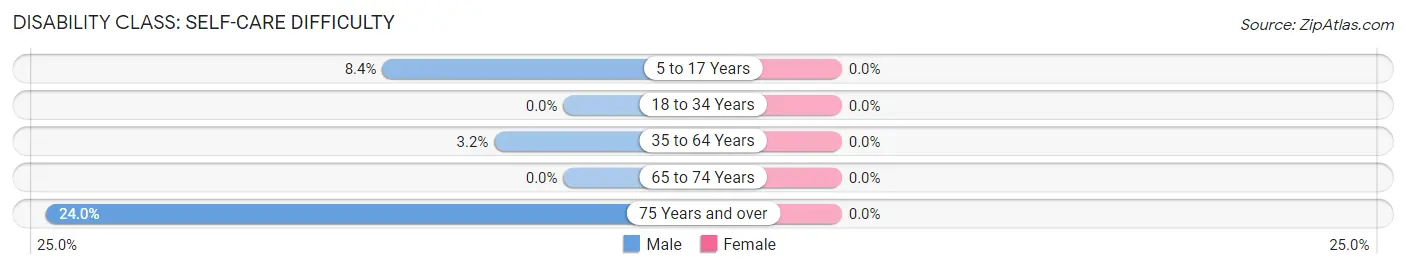
| Age Bracket | Male | Female |
| 5 to 17 Years | 11 (8.4%) | 0 (0.0%) |
| 18 to 34 Years | 0 (0.0%) | 0 (0.0%) |
| 35 to 64 Years | 9 (3.2%) | 0 (0.0%) |
| 65 to 74 Years | 0 (0.0%) | 0 (0.0%) |
| 75 Years and over | 6 (24.0%) | 0 (0.0%) |
Technology Access in Bolivar
Computing Device Access in Bolivar
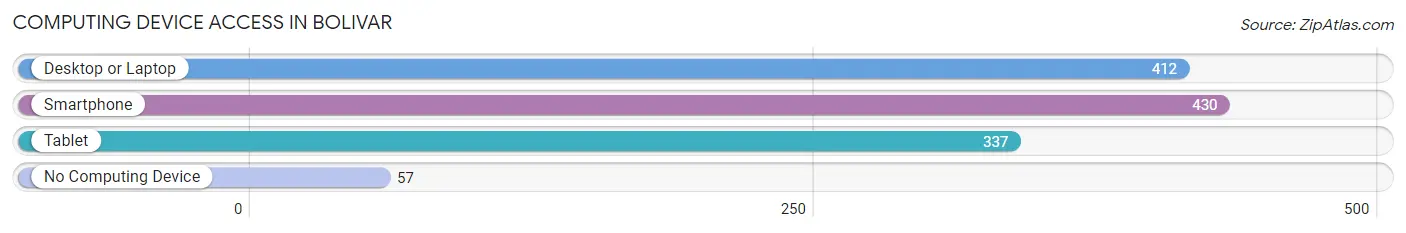
| Device Type | # Households | % Households |
| Desktop or Laptop | 412 | 77.9% |
| Smartphone | 430 | 81.3% |
| Tablet | 337 | 63.7% |
| No Computing Device | 57 | 10.8% |
| Total | 529 | 100.0% |
Internet Access in Bolivar
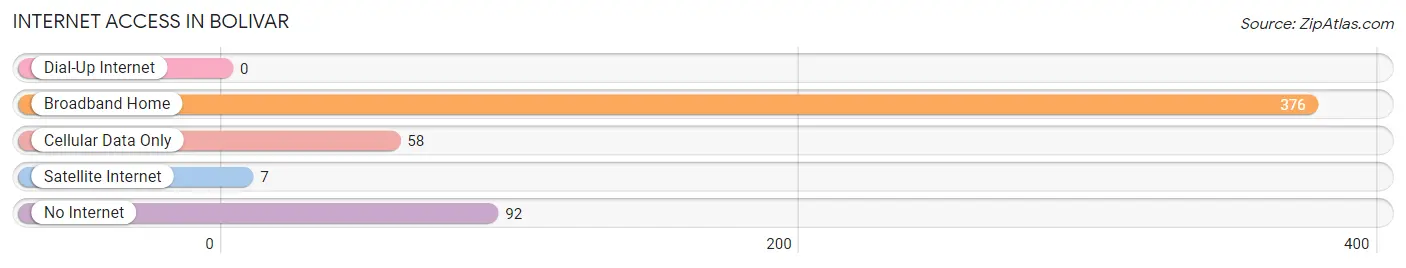
| Internet Type | # Households | % Households |
| Dial-Up Internet | 0 | 0.0% |
| Broadband Home | 376 | 71.1% |
| Cellular Data Only | 58 | 11.0% |
| Satellite Internet | 7 | 1.3% |
| No Internet | 92 | 17.4% |
| Total | 529 | 100.0% |
Bolivar Summary
Bolivar is a small town located in the eastern panhandle of West Virginia, United States. It is situated in the northern part of the state, near the border with Maryland and Pennsylvania. The town is part of the Washington-Arlington-Alexandria metropolitan area, and is located in the county of Jefferson. The population of Bolivar was 1,845 at the 2010 census.
Geography
Bolivar is located at 39°20'45" North, 77°51'45" West (39.3458, -77.8625). According to the United States Census Bureau, the town has a total area of 0.7 square miles (1.8 km2), all of it land.
History
The town of Bolivar was founded in 1817 by a group of settlers from Pennsylvania. The town was named after Simón Bolívar, a Venezuelan military and political leader who led the struggle for independence in South America. The town was incorporated in 1832.
In the late 19th century, Bolivar was a thriving agricultural community. The town was home to several mills, including a flour mill, a sawmill, and a gristmill. The town also had a brickyard, a tannery, and a blacksmith shop.
In the early 20th century, Bolivar was a popular tourist destination. The town was home to several resorts, including the Bolivar Hotel, which was built in 1906. The hotel was a popular destination for visitors from Washington, D.C. and Baltimore.
Economy
The economy of Bolivar is largely based on agriculture and tourism. The town is home to several farms, which produce a variety of crops, including corn, soybeans, wheat, and hay. The town is also home to several wineries, which produce a variety of wines.
The town is also home to several tourist attractions, including the Bolivar Historic District, which is listed on the National Register of Historic Places. The district includes several historic buildings, including the Bolivar Hotel, the Bolivar Presbyterian Church, and the Bolivar Post Office.
Demographics
As of the 2010 census, there were 1,845 people, 745 households, and 486 families residing in the town. The population density was 2,637.3 people per square mile (1,017.2/km2). There were 817 housing units at an average density of 1,164.3 per square mile (449.2/km2). The racial makeup of the town was 95.2% White, 1.2% African American, 0.2% Native American, 0.7% Asian, 0.1% Pacific Islander, 0.7% from other races, and 1.9% from two or more races. Hispanic or Latino of any race were 2.2% of the population.
There were 745 households, out of which 28.2% had children under the age of 18 living with them, 48.2% were married couples living together, 11.7% had a female householder with no husband present, and 35.3% were non-families. 29.7% of all households were made up of individuals, and 12.2% had someone living alone who was 65 years of age or older. The average household size was 2.45 and the average family size was 3.03.
In the town, the population was spread out, with 24.2% under the age of 18, 8.2% from 18 to 24, 28.2% from 25 to 44, 24.2% from 45 to 64, and 15.2% who were 65 years of age or older. The median age was 38 years. For every 100 females, there were 94.2 males. For every 100 females age 18 and over, there were 91.2 males.
The median income for a household in the town was $37,500, and the median income for a family was $45,000. Males had a median income of $31,250 versus $25,000 for females. The per capita income for the town was $18,945. About 8.2% of families and 10.2% of the population were below the poverty line, including 14.2% of those under age 18 and 8.2% of those age 65 or over.
Common Questions
What is the Total Population of Bolivar?
Total Population of Bolivar is 1,283.
What is the Total Male Population of Bolivar?
Total Male Population of Bolivar is 662.
What is the Total Female Population of Bolivar?
Total Female Population of Bolivar is 621.
What is the Ratio of Males per 100 Females in Bolivar?
There are 106.60 Males per 100 Females in Bolivar.
What is the Ratio of Females per 100 Males in Bolivar?
There are 93.81 Females per 100 Males in Bolivar.
What is the Median Population Age in Bolivar?
Median Population Age in Bolivar is 39.9 Years.
What is the Average Family Size in Bolivar
Average Family Size in Bolivar is 3.3 People.
What is the Average Household Size in Bolivar
Average Household Size in Bolivar is 2.4 People.
What is Per Capita Income in Bolivar?
Per Capita income in Bolivar is $37,523.
What is the Median Family Income in Bolivar?
Median Family Income in Bolivar is $106,389.
What is the Median Household income in Bolivar?
Median Household Income in Bolivar is $80,125.
What is Income or Wage Gap in Bolivar?
Income or Wage Gap in Bolivar is 6.1%.
Women in Bolivar earn 93.9 cents for every dollar earned by a man.
What is Inequality or Gini Index in Bolivar?
Inequality or Gini Index in Bolivar is 0.40.
How Large is the Labor Force in Bolivar?
There are 817 People in the Labor Forcein in Bolivar.
What is the Percentage of People in the Labor Force in Bolivar?
76.7% of People are in the Labor Force in Bolivar.
What is the Unemployment Rate in Bolivar?
Unemployment Rate in Bolivar is 5.6%.