Spanish Fork, UT
Spanish Fork Map
Spanish Fork Overview
42,694
TOTAL POPULATION
21,662
MALE POPULATION
21,032
FEMALE POPULATION
103.00
MALES / 100 FEMALES
97.09
FEMALES / 100 MALES
27.4
MEDIAN AGE
3.9
AVG FAMILY SIZE
3.6
AVG HOUSEHOLD SIZE
$30,832
PER CAPITA INCOME
$102,514
AVG FAMILY INCOME
$93,989
AVG HOUSEHOLD INCOME
52.4%
WAGE / INCOME GAP [ % ]
47.6¢/ $1
WAGE / INCOME GAP [ $ ]
$13,688
FAMILY INCOME DEFICIT
0.35
INEQUALITY / GINI INDEX
20,933
LABOR FORCE [ PEOPLE ]
71.5%
PERCENT IN LABOR FORCE
1.9%
UNEMPLOYMENT RATE
Spanish Fork Zip Codes
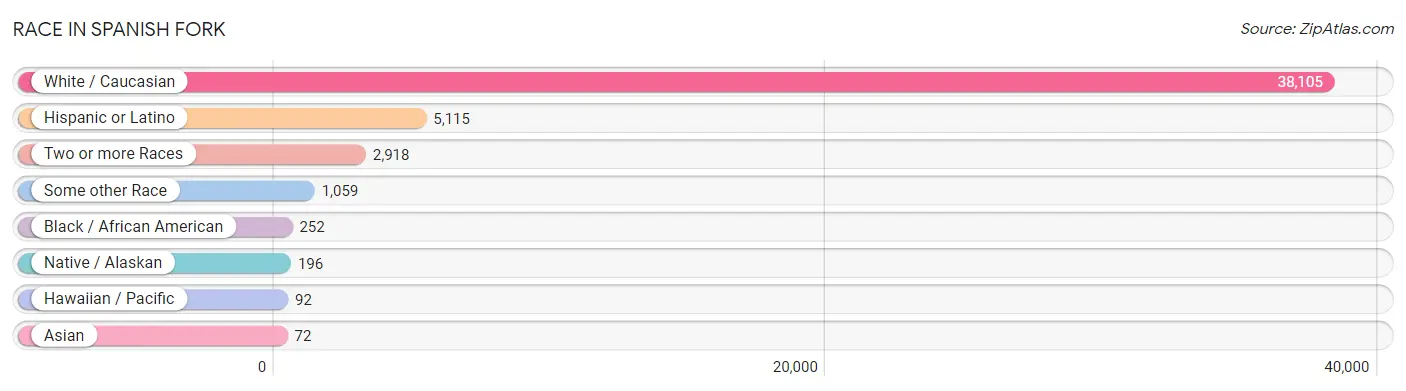
Race in Spanish Fork
The most populous races in Spanish Fork are White / Caucasian (38,105 | 89.2%), Hispanic or Latino (5,115 | 12.0%), and Two or more Races (2,918 | 6.8%).
| Race | # Population | % Population |
| Asian | 72 | 0.2% |
| Black / African American | 252 | 0.6% |
| Hawaiian / Pacific | 92 | 0.2% |
| Hispanic or Latino | 5,115 | 12.0% |
| Native / Alaskan | 196 | 0.5% |
| White / Caucasian | 38,105 | 89.2% |
| Two or more Races | 2,918 | 6.8% |
| Some other Race | 1,059 | 2.5% |
| Total | 42,694 | 100.0% |
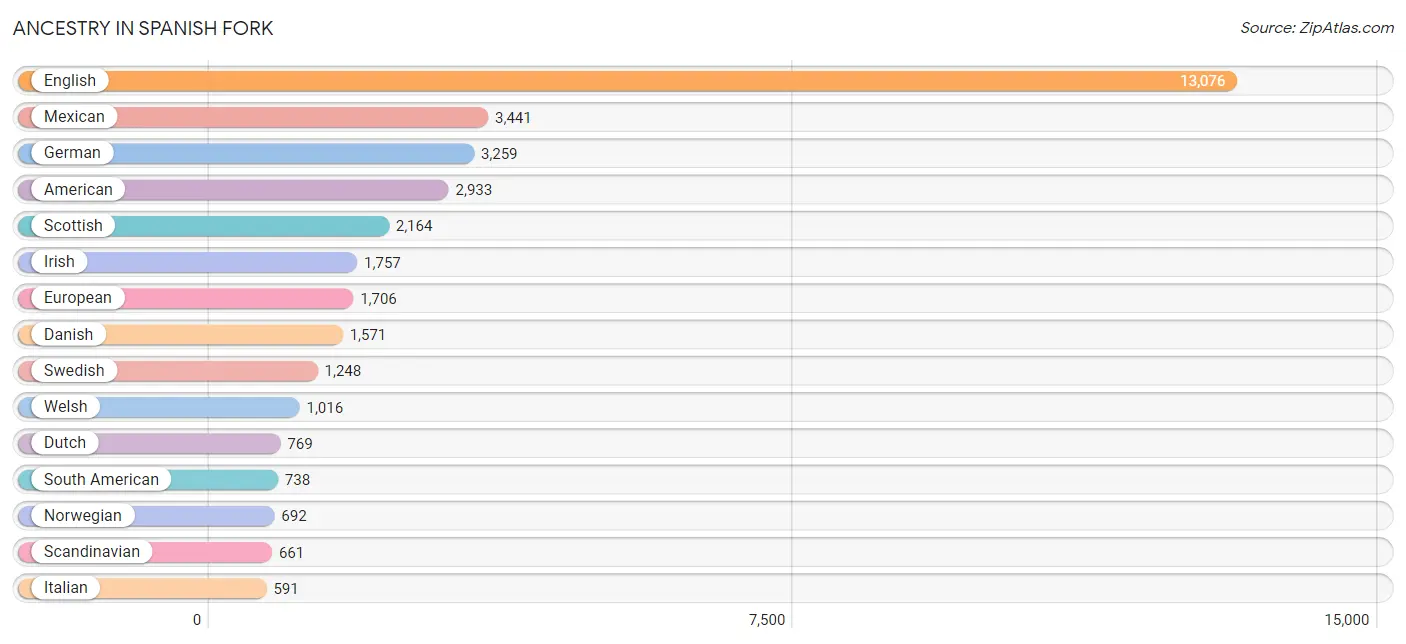
Ancestry in Spanish Fork
The most populous ancestries reported in Spanish Fork are English (13,076 | 30.6%), Mexican (3,441 | 8.1%), German (3,259 | 7.6%), American (2,933 | 6.9%), and Scottish (2,164 | 5.1%), together accounting for 58.3% of all Spanish Fork residents.
| Ancestry | # Population | % Population |
| African | 55 | 0.1% |
| American | 2,933 | 6.9% |
| Apache | 6 | 0.0% |
| Arab | 142 | 0.3% |
| Argentinean | 189 | 0.4% |
| Armenian | 7 | 0.0% |
| Australian | 48 | 0.1% |
| Austrian | 77 | 0.2% |
| Basque | 24 | 0.1% |
| Bhutanese | 47 | 0.1% |
| Bolivian | 47 | 0.1% |
| Brazilian | 142 | 0.3% |
| British | 507 | 1.2% |
| Burmese | 48 | 0.1% |
| Canadian | 295 | 0.7% |
| Central American | 440 | 1.0% |
| Cherokee | 12 | 0.0% |
| Cheyenne | 2 | 0.0% |
| Chickasaw | 112 | 0.3% |
| Chilean | 109 | 0.3% |
| Colombian | 40 | 0.1% |
| Costa Rican | 19 | 0.0% |
| Cuban | 9 | 0.0% |
| Czech | 50 | 0.1% |
| Danish | 1,571 | 3.7% |
| Dutch | 769 | 1.8% |
| Eastern European | 4 | 0.0% |
| Ecuadorian | 50 | 0.1% |
| English | 13,076 | 30.6% |
| Estonian | 12 | 0.0% |
| European | 1,706 | 4.0% |
| French | 454 | 1.1% |
| French Canadian | 88 | 0.2% |
| German | 3,259 | 7.6% |
| Greek | 202 | 0.5% |
| Guatemalan | 9 | 0.0% |
| Haitian | 2 | 0.0% |
| Honduran | 56 | 0.1% |
| Hopi | 6 | 0.0% |
| Hungarian | 16 | 0.0% |
| Icelander | 356 | 0.8% |
| Indian (Asian) | 344 | 0.8% |
| Irish | 1,757 | 4.1% |
| Iroquois | 56 | 0.1% |
| Israeli | 27 | 0.1% |
| Italian | 591 | 1.4% |
| Korean | 205 | 0.5% |
| Lebanese | 27 | 0.1% |
| Malaysian | 11 | 0.0% |
| Maltese | 7 | 0.0% |
| Marshallese | 120 | 0.3% |
| Mexican | 3,441 | 8.1% |
| Mexican American Indian | 52 | 0.1% |
| Native Hawaiian | 356 | 0.8% |
| Navajo | 115 | 0.3% |
| Nicaraguan | 41 | 0.1% |
| Northern European | 39 | 0.1% |
| Norwegian | 692 | 1.6% |
| Pakistani | 12 | 0.0% |
| Paraguayan | 33 | 0.1% |
| Peruvian | 146 | 0.3% |
| Pima | 67 | 0.2% |
| Polish | 201 | 0.5% |
| Portuguese | 24 | 0.1% |
| Puerto Rican | 28 | 0.1% |
| Romanian | 17 | 0.0% |
| Russian | 49 | 0.1% |
| Salvadoran | 315 | 0.7% |
| Samoan | 241 | 0.6% |
| Scandinavian | 661 | 1.5% |
| Scotch-Irish | 232 | 0.5% |
| Scottish | 2,164 | 5.1% |
| Serbian | 53 | 0.1% |
| Sioux | 20 | 0.1% |
| Slavic | 22 | 0.1% |
| Slovak | 4 | 0.0% |
| Slovene | 25 | 0.1% |
| South American | 738 | 1.7% |
| Spaniard | 85 | 0.2% |
| Spanish | 264 | 0.6% |
| Sri Lankan | 6 | 0.0% |
| Subsaharan African | 55 | 0.1% |
| Swedish | 1,248 | 2.9% |
| Swiss | 378 | 0.9% |
| Syrian | 44 | 0.1% |
| Thai | 25 | 0.1% |
| Ute | 58 | 0.1% |
| Venezuelan | 124 | 0.3% |
| Welsh | 1,016 | 2.4% |
| Yugoslavian | 13 | 0.0% | View All 90 Rows |
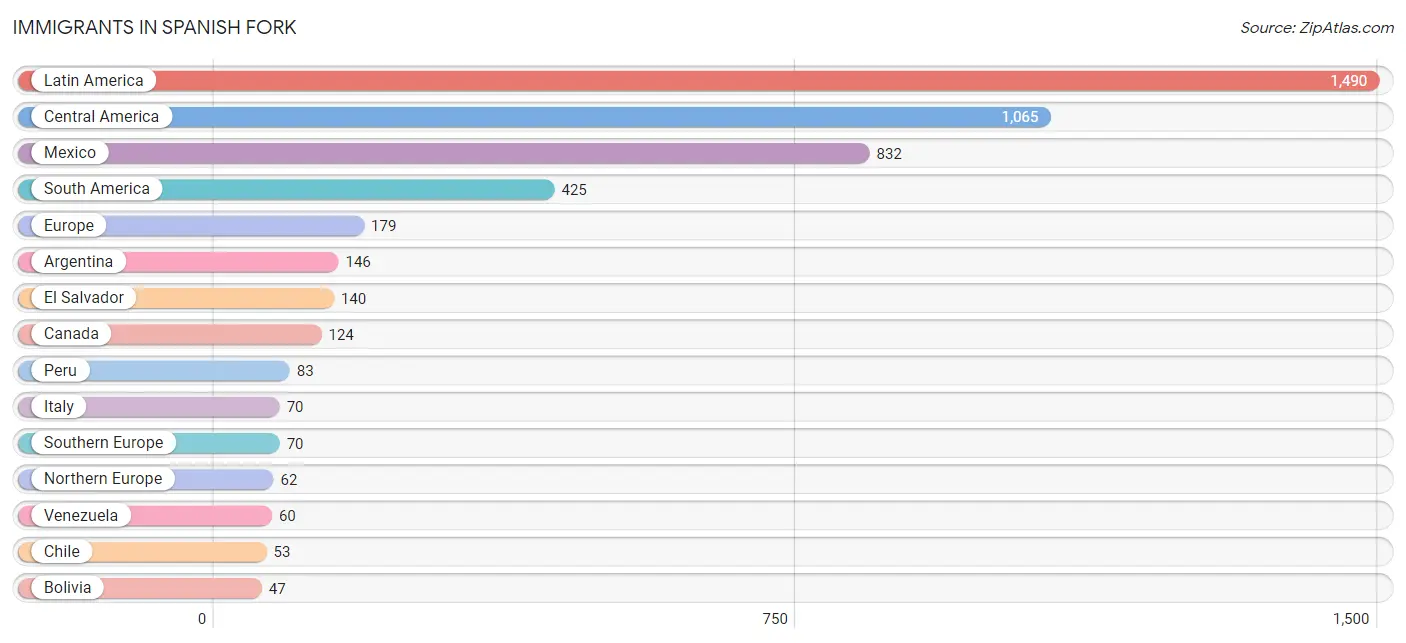
Immigrants in Spanish Fork
The most numerous immigrant groups reported in Spanish Fork came from Latin America (1,490 | 3.5%), Central America (1,065 | 2.5%), Mexico (832 | 1.9%), South America (425 | 1.0%), and Europe (179 | 0.4%), together accounting for 9.3% of all Spanish Fork residents.
| Immigration Origin | # Population | % Population |
| Africa | 7 | 0.0% |
| Argentina | 146 | 0.3% |
| Asia | 40 | 0.1% |
| Bolivia | 47 | 0.1% |
| Brazil | 3 | 0.0% |
| Canada | 124 | 0.3% |
| Central America | 1,065 | 2.5% |
| Chile | 53 | 0.1% |
| Colombia | 14 | 0.0% |
| Costa Rica | 11 | 0.0% |
| Eastern Asia | 28 | 0.1% |
| Eastern Europe | 12 | 0.0% |
| Ecuador | 19 | 0.0% |
| El Salvador | 140 | 0.3% |
| England | 33 | 0.1% |
| Europe | 179 | 0.4% |
| Fiji | 7 | 0.0% |
| France | 17 | 0.0% |
| Germany | 5 | 0.0% |
| Guatemala | 9 | 0.0% |
| Honduras | 32 | 0.1% |
| Italy | 70 | 0.2% |
| Japan | 10 | 0.0% |
| Korea | 18 | 0.0% |
| Latin America | 1,490 | 3.5% |
| Mexico | 832 | 1.9% |
| Netherlands | 13 | 0.0% |
| Nicaragua | 41 | 0.1% |
| Northern Europe | 62 | 0.2% |
| Oceania | 16 | 0.0% |
| Peru | 83 | 0.2% |
| Romania | 12 | 0.0% |
| South Africa | 7 | 0.0% |
| South America | 425 | 1.0% |
| South Eastern Asia | 12 | 0.0% |
| Southern Europe | 70 | 0.2% |
| Thailand | 12 | 0.0% |
| Venezuela | 60 | 0.1% |
| Western Europe | 35 | 0.1% | View All 39 Rows |
Sex and Age in Spanish Fork
Sex and Age in Spanish Fork
The most populous age groups in Spanish Fork are 15 to 19 Years (2,429 | 11.2%) for men and Under 5 Years (2,248 | 10.7%) for women.
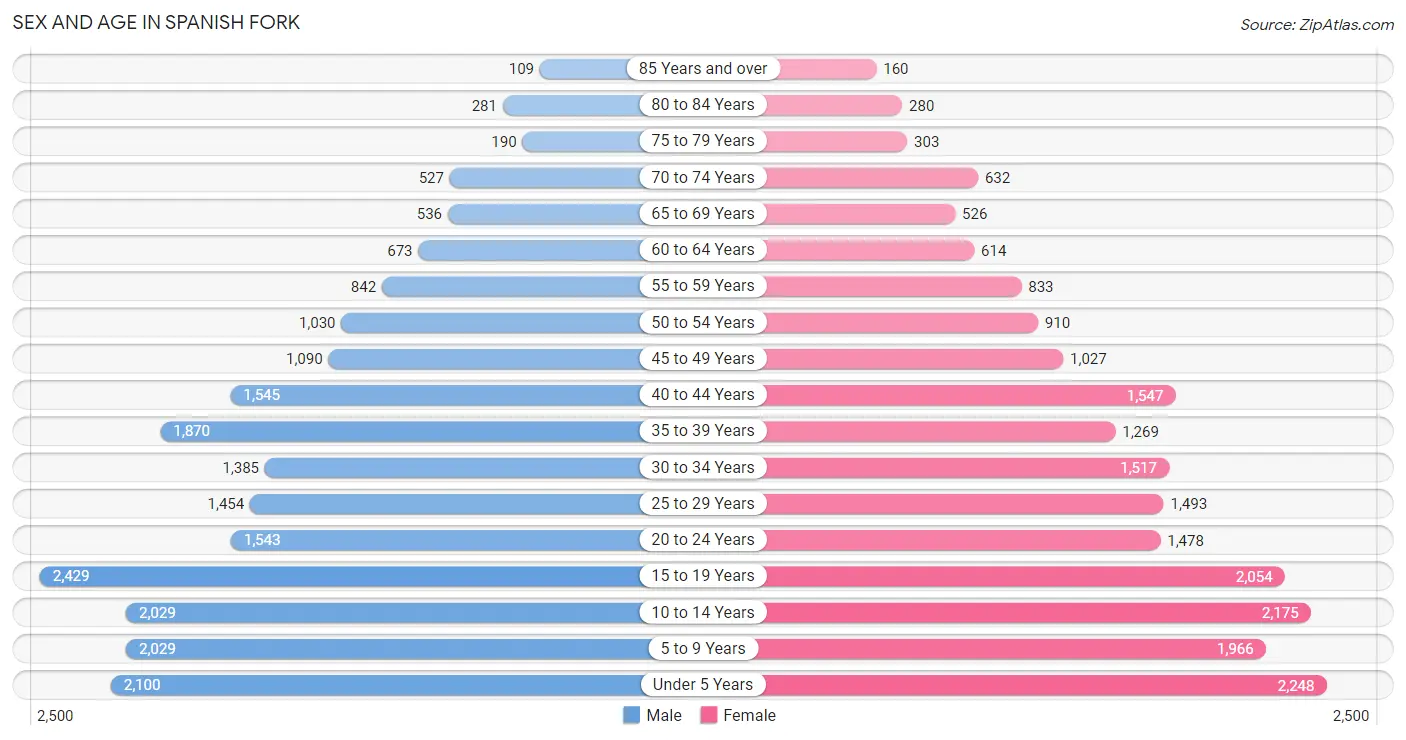
| Age Bracket | Male | Female |
| Under 5 Years | 2,100 (9.7%) | 2,248 (10.7%) |
| 5 to 9 Years | 2,029 (9.4%) | 1,966 (9.3%) |
| 10 to 14 Years | 2,029 (9.4%) | 2,175 (10.3%) |
| 15 to 19 Years | 2,429 (11.2%) | 2,054 (9.8%) |
| 20 to 24 Years | 1,543 (7.1%) | 1,478 (7.0%) |
| 25 to 29 Years | 1,454 (6.7%) | 1,493 (7.1%) |
| 30 to 34 Years | 1,385 (6.4%) | 1,517 (7.2%) |
| 35 to 39 Years | 1,870 (8.6%) | 1,269 (6.0%) |
| 40 to 44 Years | 1,545 (7.1%) | 1,547 (7.4%) |
| 45 to 49 Years | 1,090 (5.0%) | 1,027 (4.9%) |
| 50 to 54 Years | 1,030 (4.8%) | 910 (4.3%) |
| 55 to 59 Years | 842 (3.9%) | 833 (4.0%) |
| 60 to 64 Years | 673 (3.1%) | 614 (2.9%) |
| 65 to 69 Years | 536 (2.5%) | 526 (2.5%) |
| 70 to 74 Years | 527 (2.4%) | 632 (3.0%) |
| 75 to 79 Years | 190 (0.9%) | 303 (1.4%) |
| 80 to 84 Years | 281 (1.3%) | 280 (1.3%) |
| 85 Years and over | 109 (0.5%) | 160 (0.8%) |
| Total | 21,662 (100.0%) | 21,032 (100.0%) |
Families and Households in Spanish Fork
Median Family Size in Spanish Fork
The median family size in Spanish Fork is 3.88 persons per family, with married-couple families (8,733 | 86.6%) accounting for the largest median family size of 3.94 persons per family. On the other hand, single male/father families (455 | 4.5%) represent the smallest median family size with 2.79 persons per family.
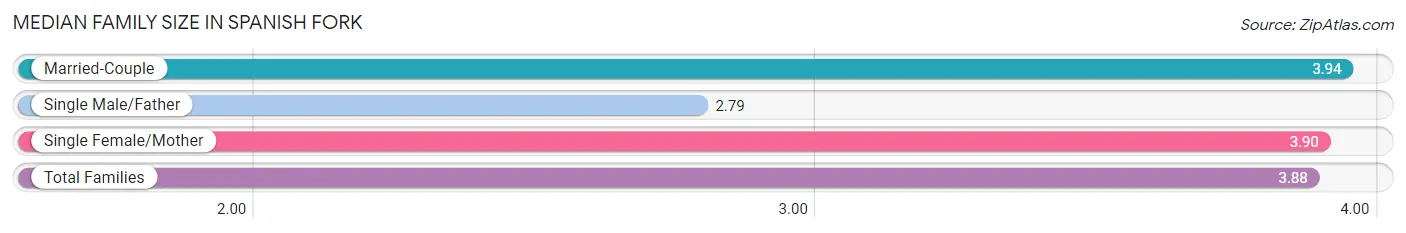
| Family Type | # Families | Family Size |
| Married-Couple | 8,733 (86.6%) | 3.94 |
| Single Male/Father | 455 (4.5%) | 2.79 |
| Single Female/Mother | 902 (8.9%) | 3.90 |
| Total Families | 10,090 (100.0%) | 3.88 |
Median Household Size in Spanish Fork
The median household size in Spanish Fork is 3.61 persons per household, with single female/mother households (902 | 7.7%) accounting for the largest median household size of 4.15 persons per household. non-family households (1,567 | 13.4%) represent the smallest median household size with 1.37 persons per household.
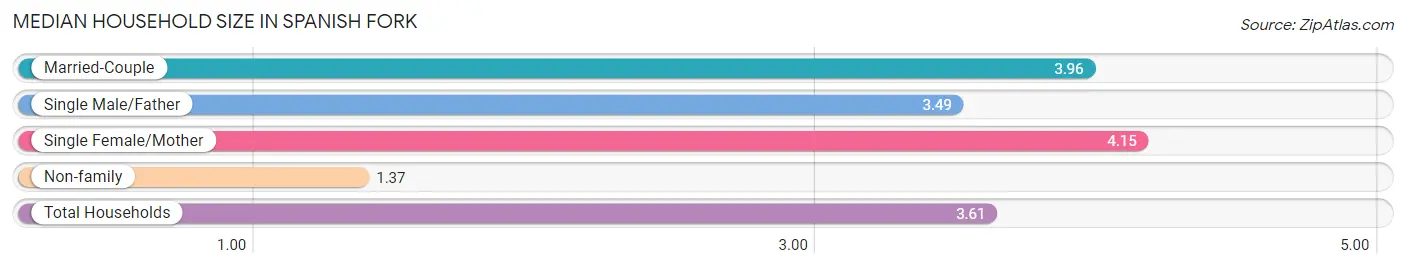
| Household Type | # Households | Household Size |
| Married-Couple | 8,733 (74.9%) | 3.96 |
| Single Male/Father | 455 (3.9%) | 3.49 |
| Single Female/Mother | 902 (7.7%) | 4.15 |
| Non-family | 1,567 (13.4%) | 1.37 |
| Total Households | 11,657 (100.0%) | 3.61 |
Household Size by Marriage Status in Spanish Fork
Out of a total of 11,657 households in Spanish Fork, 10,090 (86.6%) are family households, while 1,567 (13.4%) are nonfamily households. The most numerous type of family households are 2-person households, comprising 2,906, and the most common type of nonfamily households are 1-person households, comprising 1,278.
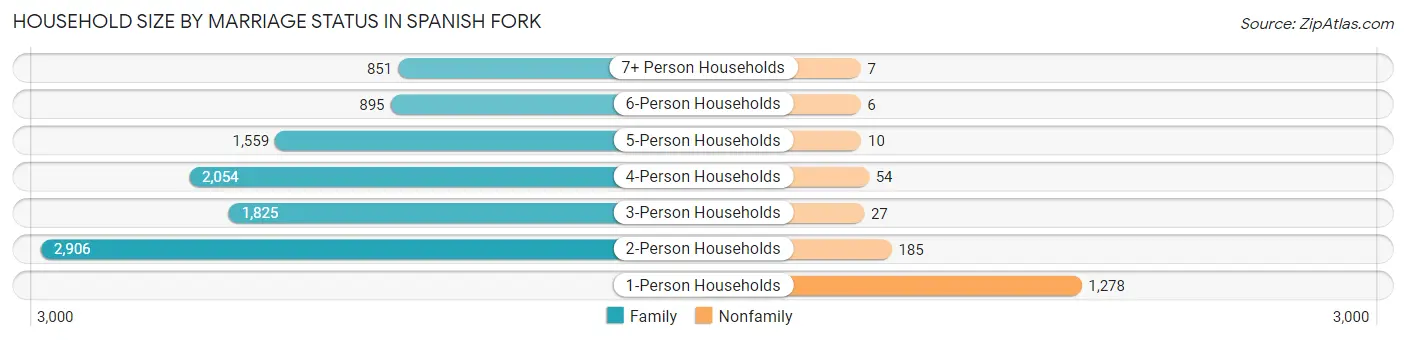
| Household Size | Family Households | Nonfamily Households |
| 1-Person Households | - | 1,278 (11.0%) |
| 2-Person Households | 2,906 (24.9%) | 185 (1.6%) |
| 3-Person Households | 1,825 (15.7%) | 27 (0.2%) |
| 4-Person Households | 2,054 (17.6%) | 54 (0.5%) |
| 5-Person Households | 1,559 (13.4%) | 10 (0.1%) |
| 6-Person Households | 895 (7.7%) | 6 (0.1%) |
| 7+ Person Households | 851 (7.3%) | 7 (0.1%) |
| Total | 10,090 (86.6%) | 1,567 (13.4%) |
Female Fertility in Spanish Fork
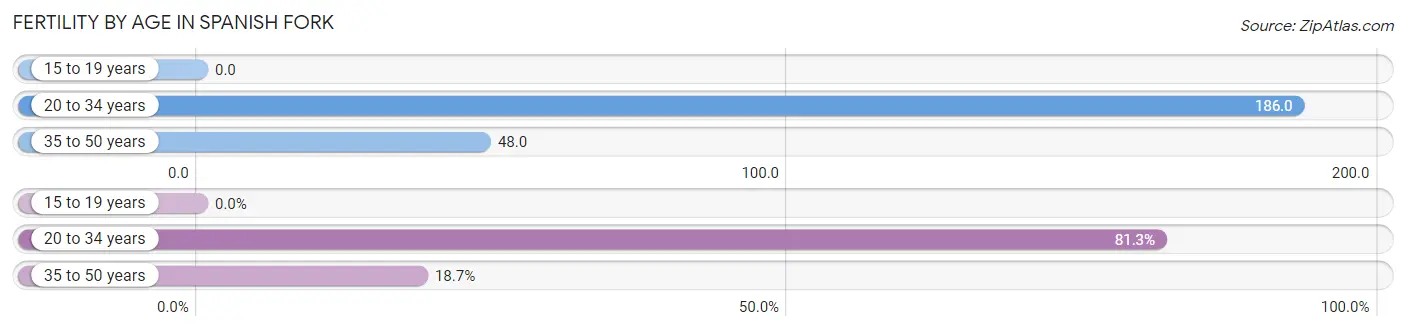
Fertility by Age in Spanish Fork
Average fertility rate in Spanish Fork is 97.0 births per 1,000 women. Women in the age bracket of 20 to 34 years have the highest fertility rate with 186.0 births per 1,000 women. Women in the age bracket of 20 to 34 years acount for 81.3% of all women with births.
| Age Bracket | Women with Births | Births / 1,000 Women |
| 15 to 19 years | 0 (0.0%) | 0.0 |
| 20 to 34 years | 837 (81.3%) | 186.0 |
| 35 to 50 years | 192 (18.7%) | 48.0 |
| Total | 1,029 (100.0%) | 97.0 |
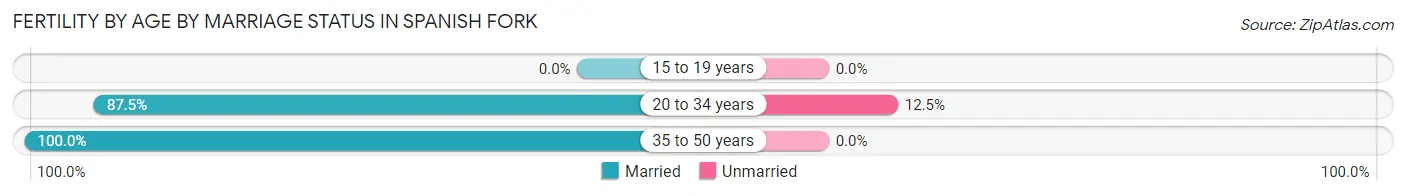
Fertility by Age by Marriage Status in Spanish Fork
89.8% of women with births (1,029) in Spanish Fork are married. The highest percentage of unmarried women with births falls into 20 to 34 years age bracket with 12.5% of them unmarried at the time of birth, while the lowest percentage of unmarried women with births belong to 35 to 50 years age bracket with 0.0% of them unmarried.
| Age Bracket | Married | Unmarried |
| 15 to 19 years | 0 (0.0%) | 0 (0.0%) |
| 20 to 34 years | 732 (87.5%) | 105 (12.5%) |
| 35 to 50 years | 192 (100.0%) | 0 (0.0%) |
| Total | 924 (89.8%) | 105 (10.2%) |
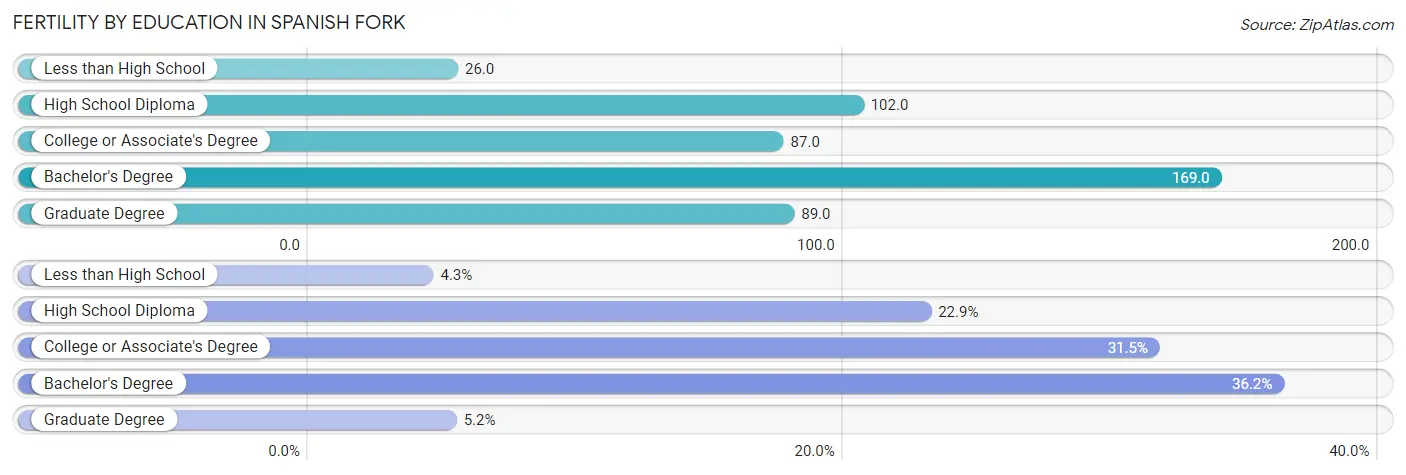
Fertility by Education in Spanish Fork
Average fertility rate in Spanish Fork is 97.0 births per 1,000 women. Women with the education attainment of bachelor's degree have the highest fertility rate of 169.0 births per 1,000 women, while women with the education attainment of less than high school have the lowest fertility at 26.0 births per 1,000 women. Women with the education attainment of bachelor's degree represent 36.1% of all women with births.
| Educational Attainment | Women with Births | Births / 1,000 Women |
| Less than High School | 44 (4.3%) | 26.0 |
| High School Diploma | 236 (22.9%) | 102.0 |
| College or Associate's Degree | 324 (31.5%) | 87.0 |
| Bachelor's Degree | 372 (36.1%) | 169.0 |
| Graduate Degree | 53 (5.1%) | 89.0 |
| Total | 1,029 (100.0%) | 97.0 |
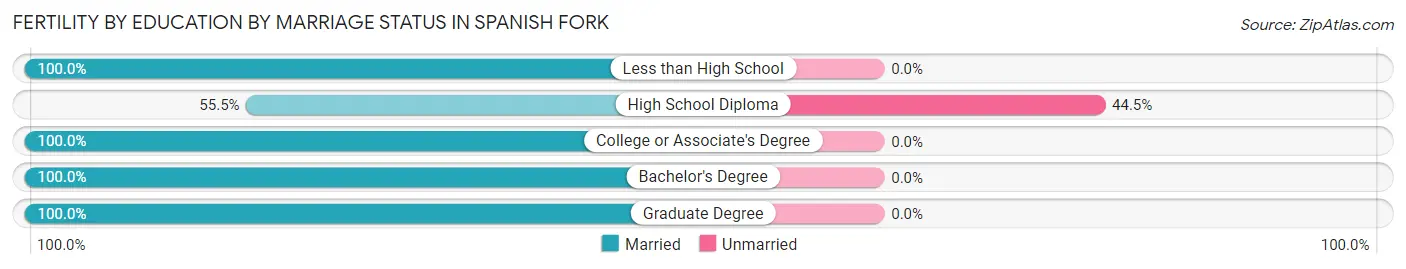
Fertility by Education by Marriage Status in Spanish Fork
10.2% of women with births in Spanish Fork are unmarried. Women with the educational attainment of less than high school are most likely to be married with 100.0% of them married at childbirth, while women with the educational attainment of high school diploma are least likely to be married with 44.5% of them unmarried at childbirth.
| Educational Attainment | Married | Unmarried |
| Less than High School | 44 (100.0%) | 0 (0.0%) |
| High School Diploma | 131 (55.5%) | 105 (44.5%) |
| College or Associate's Degree | 324 (100.0%) | 0 (0.0%) |
| Bachelor's Degree | 372 (100.0%) | 0 (0.0%) |
| Graduate Degree | 53 (100.0%) | 0 (0.0%) |
| Total | 924 (89.8%) | 105 (10.2%) |
Income in Spanish Fork
Income Overview in Spanish Fork
Per Capita Income in Spanish Fork is $30,832, while median incomes of families and households are $102,514 and $93,989 respectively.
| Characteristic | Number | Measure |
| Per Capita Income | 42,694 | $30,832 |
| Median Family Income | 10,090 | $102,514 |
| Mean Family Income | 10,090 | $115,800 |
| Median Household Income | 11,657 | $93,989 |
| Mean Household Income | 11,657 | $110,982 |
| Income Deficit | 10,090 | $13,688 |
| Wage / Income Gap (%) | 42,694 | 52.39% |
| Wage / Income Gap ($) | 42,694 | 47.61¢ per $1 |
| Gini / Inequality Index | 42,694 | 0.35 |
Earnings by Sex in Spanish Fork
Average Earnings in Spanish Fork are $37,868, $54,333 for men and $25,870 for women, a difference of 52.4%.
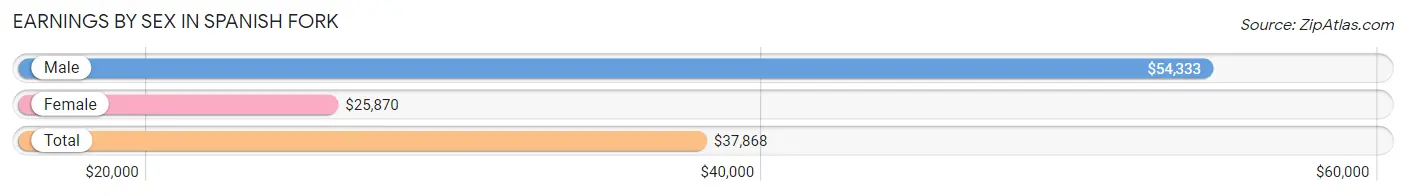
| Sex | Number | Average Earnings |
| Male | 12,435 (55.6%) | $54,333 |
| Female | 9,937 (44.4%) | $25,870 |
| Total | 22,372 (100.0%) | $37,868 |
Earnings by Sex by Income Bracket in Spanish Fork
The most common earnings brackets in Spanish Fork are $100,000+ for men (2,316 | 18.6%) and $2,499 or less for women (855 | 8.6%).
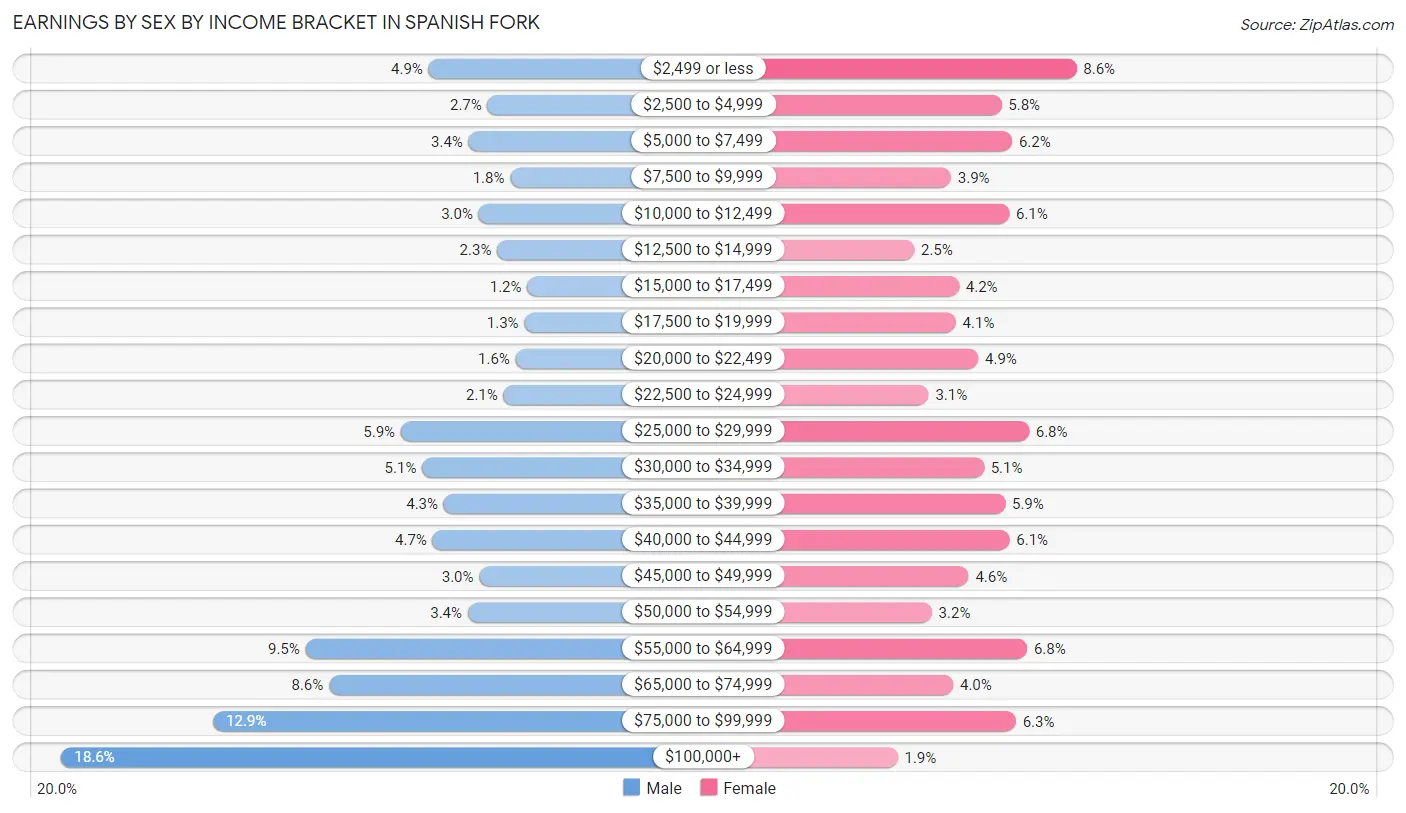
| Income | Male | Female |
| $2,499 or less | 604 (4.9%) | 855 (8.6%) |
| $2,500 to $4,999 | 330 (2.6%) | 575 (5.8%) |
| $5,000 to $7,499 | 418 (3.4%) | 615 (6.2%) |
| $7,500 to $9,999 | 224 (1.8%) | 388 (3.9%) |
| $10,000 to $12,499 | 371 (3.0%) | 604 (6.1%) |
| $12,500 to $14,999 | 285 (2.3%) | 250 (2.5%) |
| $15,000 to $17,499 | 144 (1.2%) | 417 (4.2%) |
| $17,500 to $19,999 | 158 (1.3%) | 405 (4.1%) |
| $20,000 to $22,499 | 199 (1.6%) | 489 (4.9%) |
| $22,500 to $24,999 | 255 (2.1%) | 304 (3.1%) |
| $25,000 to $29,999 | 734 (5.9%) | 678 (6.8%) |
| $30,000 to $34,999 | 634 (5.1%) | 510 (5.1%) |
| $35,000 to $39,999 | 533 (4.3%) | 589 (5.9%) |
| $40,000 to $44,999 | 586 (4.7%) | 605 (6.1%) |
| $45,000 to $49,999 | 368 (3.0%) | 453 (4.6%) |
| $50,000 to $54,999 | 422 (3.4%) | 316 (3.2%) |
| $55,000 to $64,999 | 1,177 (9.5%) | 671 (6.8%) |
| $65,000 to $74,999 | 1,068 (8.6%) | 395 (4.0%) |
| $75,000 to $99,999 | 1,609 (12.9%) | 629 (6.3%) |
| $100,000+ | 2,316 (18.6%) | 189 (1.9%) |
| Total | 12,435 (100.0%) | 9,937 (100.0%) |
Earnings by Sex by Educational Attainment in Spanish Fork
Average earnings in Spanish Fork are $66,140 for men and $34,911 for women, a difference of 47.2%. Men with an educational attainment of graduate degree enjoy the highest average annual earnings of $91,406, while those with high school diploma education earn the least with $43,025. Women with an educational attainment of graduate degree earn the most with the average annual earnings of $63,953, while those with less than high school education have the smallest earnings of $16,458.
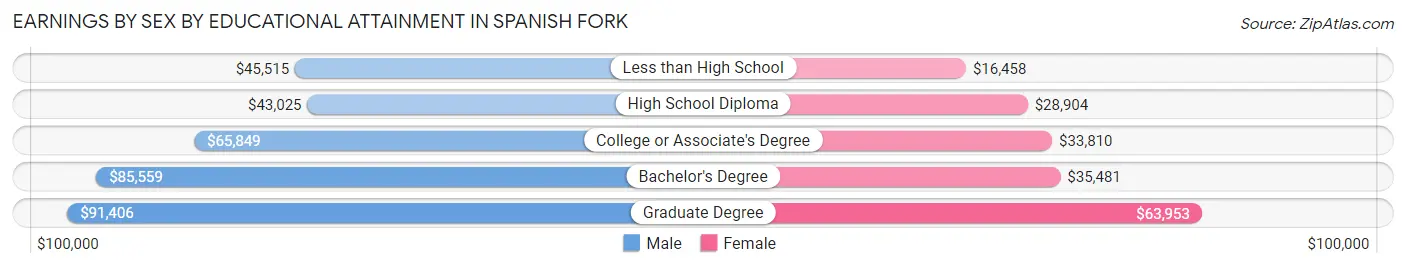
| Educational Attainment | Male Income | Female Income |
| Less than High School | $45,515 | $16,458 |
| High School Diploma | $43,025 | $28,904 |
| College or Associate's Degree | $65,849 | $33,810 |
| Bachelor's Degree | $85,559 | $35,481 |
| Graduate Degree | $91,406 | $63,953 |
| Total | $66,140 | $34,911 |
Family Income in Spanish Fork
Family Income Brackets in Spanish Fork
According to the Spanish Fork family income data, there are 2,987 families falling into the $100,000 to $149,999 income range, which is the most common income bracket and makes up 29.6% of all families. Conversely, the $10,000 to $14,999 income bracket is the least frequent group with only 50 families (0.5%) belonging to this category.
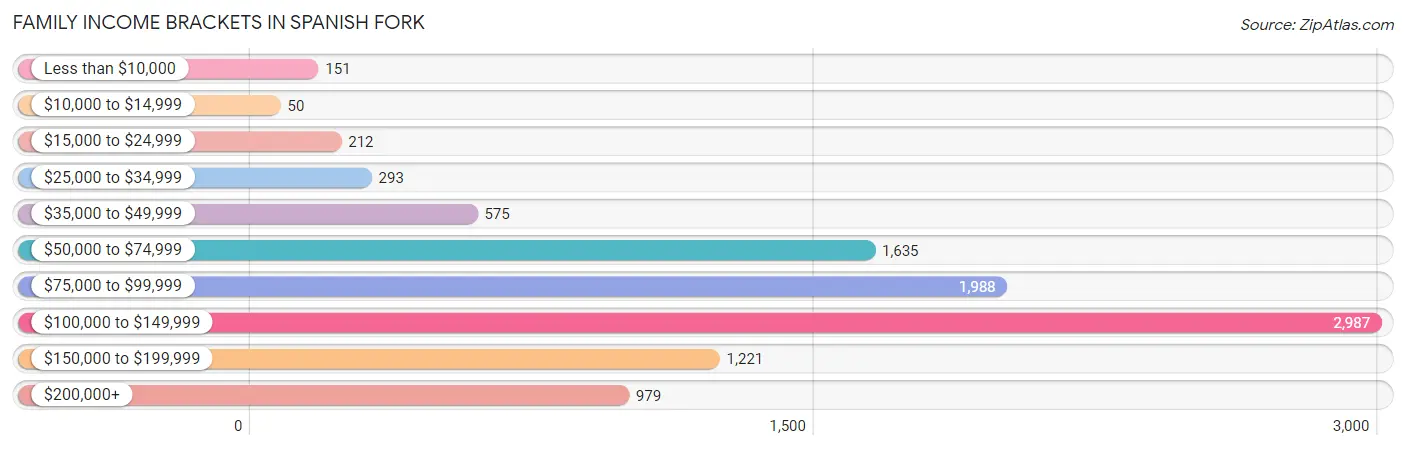
| Income Bracket | # Families | % Families |
| Less than $10,000 | 151 | 1.5% |
| $10,000 to $14,999 | 50 | 0.5% |
| $15,000 to $24,999 | 212 | 2.1% |
| $25,000 to $34,999 | 293 | 2.9% |
| $35,000 to $49,999 | 575 | 5.7% |
| $50,000 to $74,999 | 1,635 | 16.2% |
| $75,000 to $99,999 | 1,988 | 19.7% |
| $100,000 to $149,999 | 2,987 | 29.6% |
| $150,000 to $199,999 | 1,221 | 12.1% |
| $200,000+ | 979 | 9.7% |
Family Income by Famaliy Size in Spanish Fork
7+ person families (753 | 7.5%) account for the highest median family income in Spanish Fork with $129,625 per family, while 2-person families (3,045 | 30.2%) have the highest median income of $40,751 per family member.
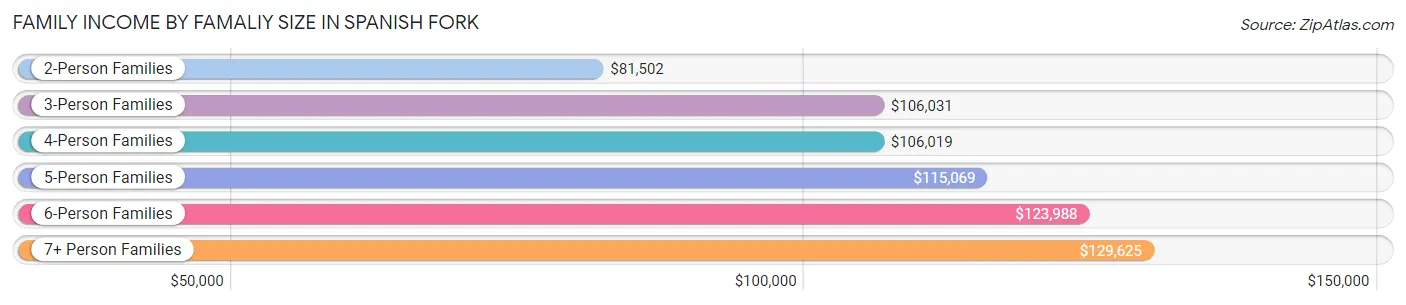
| Income Bracket | # Families | Median Income |
| 2-Person Families | 3,045 (30.2%) | $81,502 |
| 3-Person Families | 1,839 (18.2%) | $106,031 |
| 4-Person Families | 2,042 (20.2%) | $106,019 |
| 5-Person Families | 1,544 (15.3%) | $115,069 |
| 6-Person Families | 867 (8.6%) | $123,988 |
| 7+ Person Families | 753 (7.5%) | $129,625 |
| Total | 10,090 (100.0%) | $102,514 |
Family Income by Number of Earners in Spanish Fork
The median family income in Spanish Fork is $102,514, with families comprising 3+ earners (2,373) having the highest median family income of $134,571, while families with no earners (786) have the lowest median family income of $61,000, accounting for 23.5% and 7.8% of families, respectively.
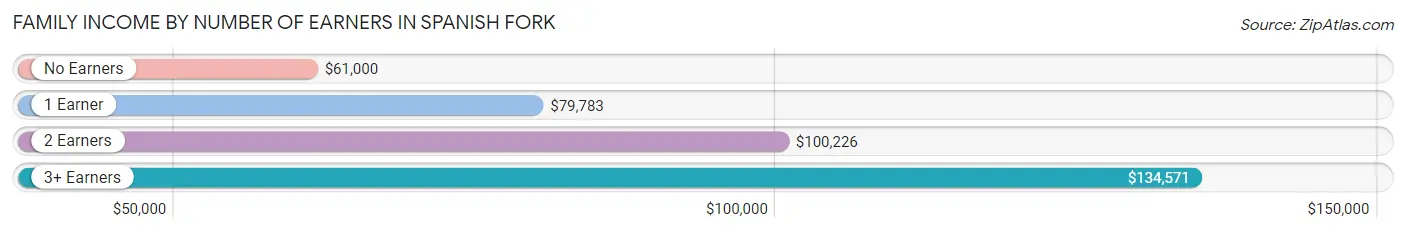
| Number of Earners | # Families | Median Income |
| No Earners | 786 (7.8%) | $61,000 |
| 1 Earner | 2,474 (24.5%) | $79,783 |
| 2 Earners | 4,457 (44.2%) | $100,226 |
| 3+ Earners | 2,373 (23.5%) | $134,571 |
| Total | 10,090 (100.0%) | $102,514 |
Household Income in Spanish Fork
Household Income Brackets in Spanish Fork
With 3,171 households falling in the category, the $100,000 to $149,999 income range is the most frequent in Spanish Fork, accounting for 27.2% of all households. In contrast, only 82 households (0.7%) fall into the $10,000 to $14,999 income bracket, making it the least populous group.
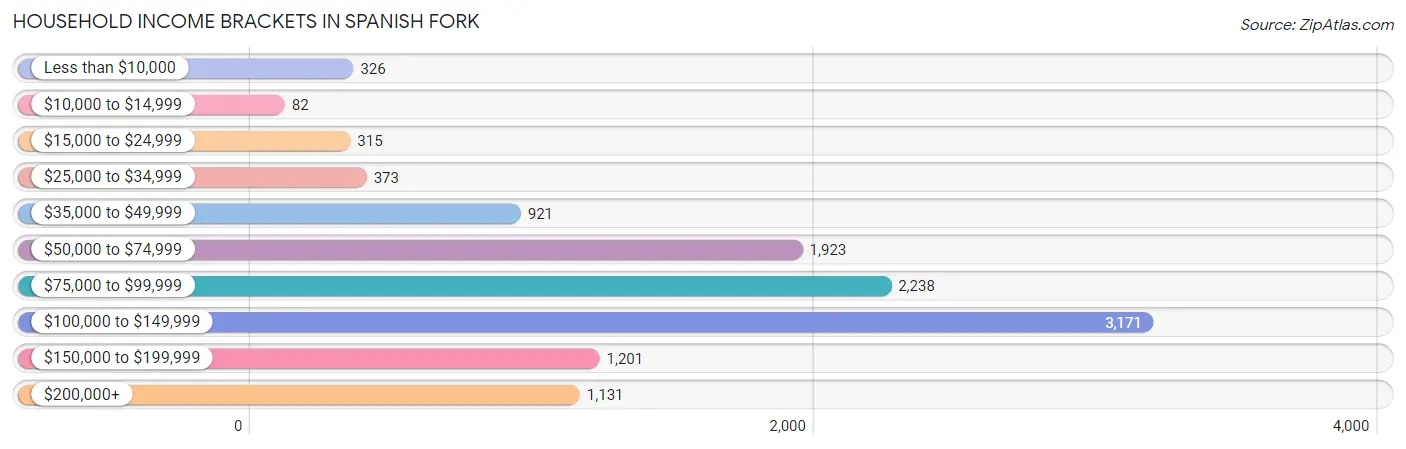
| Income Bracket | # Households | % Households |
| Less than $10,000 | 326 | 2.8% |
| $10,000 to $14,999 | 82 | 0.7% |
| $15,000 to $24,999 | 315 | 2.7% |
| $25,000 to $34,999 | 373 | 3.2% |
| $35,000 to $49,999 | 921 | 7.9% |
| $50,000 to $74,999 | 1,923 | 16.5% |
| $75,000 to $99,999 | 2,238 | 19.2% |
| $100,000 to $149,999 | 3,171 | 27.2% |
| $150,000 to $199,999 | 1,201 | 10.3% |
| $200,000+ | 1,131 | 9.7% |
Household Income by Householder Age in Spanish Fork
The median household income in Spanish Fork is $93,989, with the highest median household income of $126,429 found in the 45 to 64 years age bracket for the primary householder. A total of 3,578 households (30.7%) fall into this category. Meanwhile, the 15 to 24 years age bracket for the primary householder has the lowest median household income of $58,338, with 679 households (5.8%) in this group.
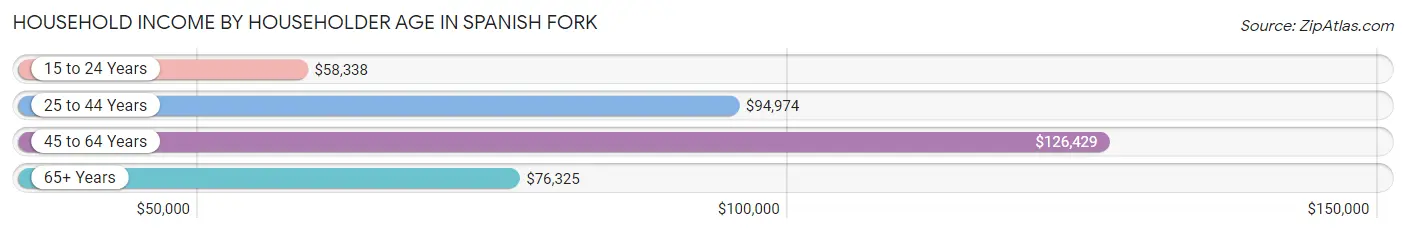
| Income Bracket | # Households | Median Income |
| 15 to 24 Years | 679 (5.8%) | $58,338 |
| 25 to 44 Years | 5,271 (45.2%) | $94,974 |
| 45 to 64 Years | 3,578 (30.7%) | $126,429 |
| 65+ Years | 2,129 (18.3%) | $76,325 |
| Total | 11,657 (100.0%) | $93,989 |
Poverty in Spanish Fork
Income Below Poverty by Sex and Age in Spanish Fork
With 5.9% poverty level for males and 6.1% for females among the residents of Spanish Fork, 25 to 34 year old males and 15 year old females are the most vulnerable to poverty, with 227 males (8.4%) and 43 females (10.9%) in their respective age groups living below the poverty level.
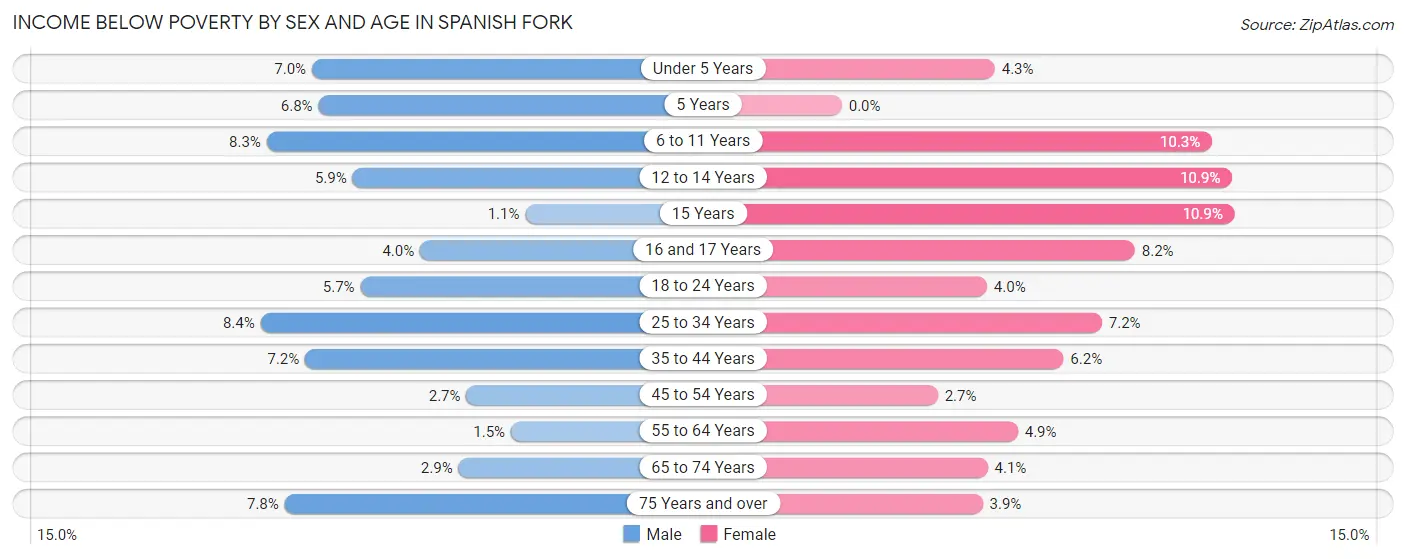
| Age Bracket | Male | Female |
| Under 5 Years | 142 (7.0%) | 95 (4.3%) |
| 5 Years | 30 (6.8%) | 0 (0.0%) |
| 6 to 11 Years | 182 (8.3%) | 229 (10.3%) |
| 12 to 14 Years | 78 (5.9%) | 154 (10.9%) |
| 15 Years | 5 (1.1%) | 43 (10.9%) |
| 16 and 17 Years | 34 (4.0%) | 70 (8.2%) |
| 18 to 24 Years | 145 (5.7%) | 91 (4.0%) |
| 25 to 34 Years | 227 (8.4%) | 214 (7.2%) |
| 35 to 44 Years | 239 (7.2%) | 172 (6.2%) |
| 45 to 54 Years | 56 (2.7%) | 51 (2.7%) |
| 55 to 64 Years | 22 (1.5%) | 70 (4.9%) |
| 65 to 74 Years | 31 (2.9%) | 47 (4.1%) |
| 75 Years and over | 45 (7.8%) | 29 (3.9%) |
| Total | 1,236 (5.9%) | 1,265 (6.1%) |
Income Above Poverty by Sex and Age in Spanish Fork
According to the poverty statistics in Spanish Fork, males aged 15 years and females aged 5 years are the age groups that are most secure financially, with 98.9% of males and 100.0% of females in these age groups living above the poverty line.
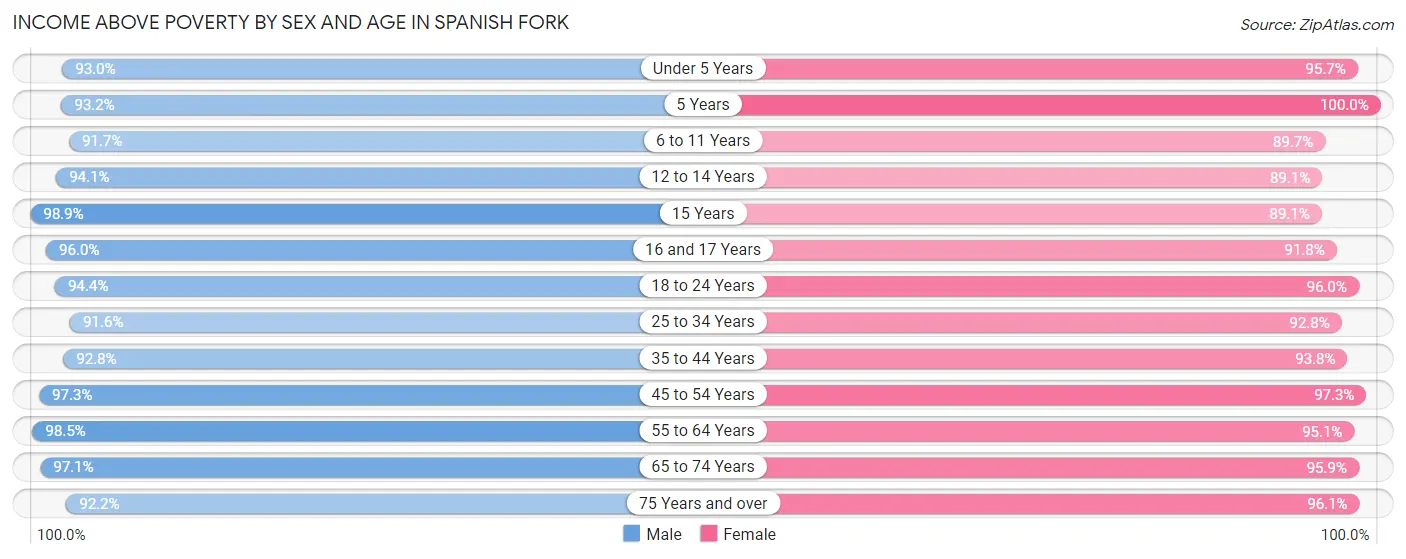
| Age Bracket | Male | Female |
| Under 5 Years | 1,887 (93.0%) | 2,134 (95.7%) |
| 5 Years | 410 (93.2%) | 469 (100.0%) |
| 6 to 11 Years | 2,021 (91.7%) | 1,993 (89.7%) |
| 12 to 14 Years | 1,250 (94.1%) | 1,263 (89.1%) |
| 15 Years | 465 (98.9%) | 350 (89.1%) |
| 16 and 17 Years | 818 (96.0%) | 788 (91.8%) |
| 18 to 24 Years | 2,423 (94.4%) | 2,164 (96.0%) |
| 25 to 34 Years | 2,465 (91.6%) | 2,740 (92.8%) |
| 35 to 44 Years | 3,084 (92.8%) | 2,615 (93.8%) |
| 45 to 54 Years | 2,017 (97.3%) | 1,861 (97.3%) |
| 55 to 64 Years | 1,485 (98.5%) | 1,359 (95.1%) |
| 65 to 74 Years | 1,032 (97.1%) | 1,111 (95.9%) |
| 75 Years and over | 535 (92.2%) | 711 (96.1%) |
| Total | 19,892 (94.2%) | 19,558 (93.9%) |
Income Below Poverty Among Married-Couple Families in Spanish Fork
The poverty statistics for married-couple families in Spanish Fork show that 2.3% or 204 of the total 8,733 families live below the poverty line. Families with 5 or more children have the highest poverty rate of 11.6%, comprising of 45 families. On the other hand, families with no children have the lowest poverty rate of 1.8%, which includes 62 families.
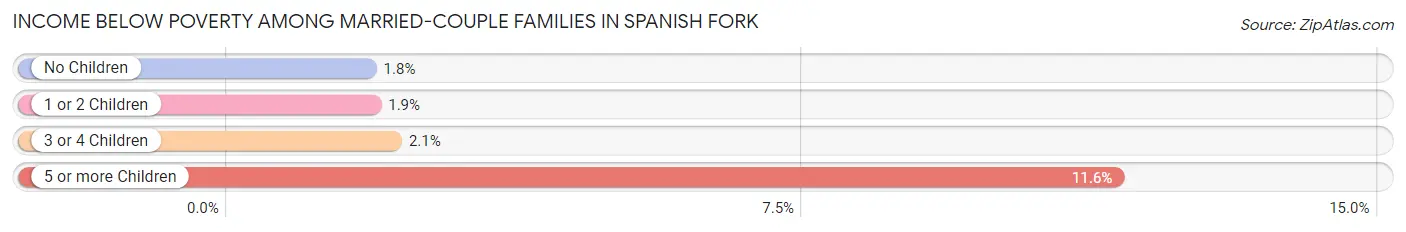
| Children | Above Poverty | Below Poverty |
| No Children | 3,361 (98.2%) | 62 (1.8%) |
| 1 or 2 Children | 3,089 (98.1%) | 59 (1.9%) |
| 3 or 4 Children | 1,735 (97.9%) | 38 (2.1%) |
| 5 or more Children | 344 (88.4%) | 45 (11.6%) |
| Total | 8,529 (97.7%) | 204 (2.3%) |
Income Below Poverty Among Single-Parent Households in Spanish Fork
According to the poverty data in Spanish Fork, 9.7% or 44 single-father households and 17.7% or 160 single-mother households are living below the poverty line. Among single-father households, those with 3 or 4 children have the highest poverty rate, with 12 households (32.4%) experiencing poverty. Likewise, among single-mother households, those with 5 or more children have the highest poverty rate, with 19 households (100.0%) falling below the poverty line.
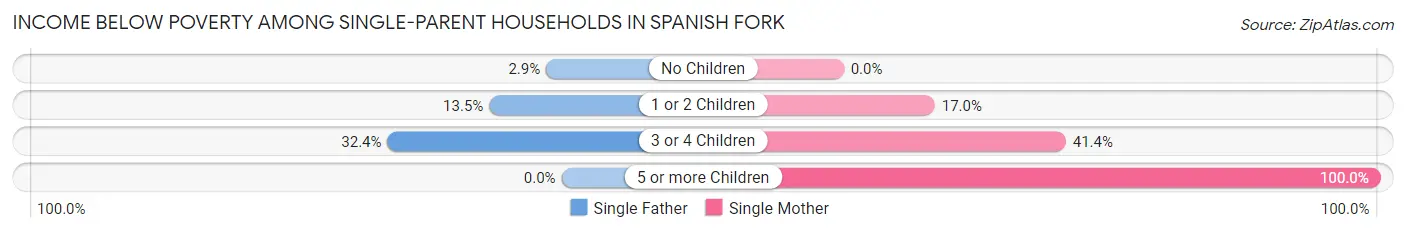
| Children | Single Father | Single Mother |
| No Children | 6 (2.9%) | 0 (0.0%) |
| 1 or 2 Children | 26 (13.5%) | 81 (17.0%) |
| 3 or 4 Children | 12 (32.4%) | 60 (41.4%) |
| 5 or more Children | 0 (0.0%) | 19 (100.0%) |
| Total | 44 (9.7%) | 160 (17.7%) |
Income Below Poverty Among Married-Couple vs Single-Parent Households in Spanish Fork
The poverty data for Spanish Fork shows that 204 of the married-couple family households (2.3%) and 204 of the single-parent households (15.0%) are living below the poverty level. Within the married-couple family households, those with 5 or more children have the highest poverty rate, with 45 households (11.6%) falling below the poverty line. Among the single-parent households, those with 5 or more children have the highest poverty rate, with 19 household (52.8%) living below poverty.
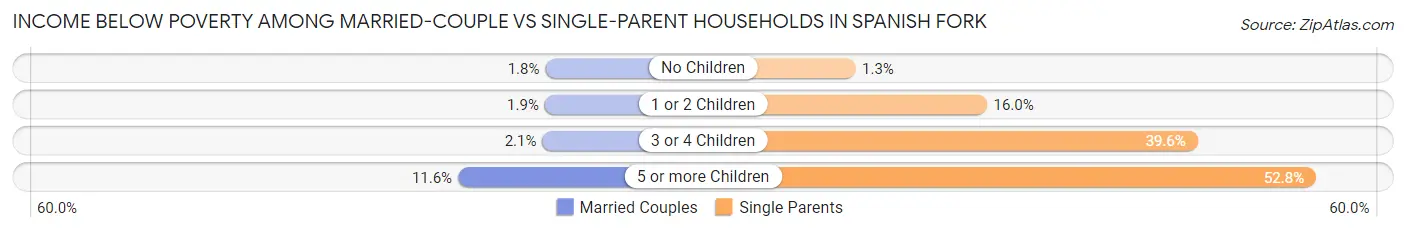
| Children | Married-Couple Families | Single-Parent Households |
| No Children | 62 (1.8%) | 6 (1.3%) |
| 1 or 2 Children | 59 (1.9%) | 107 (16.0%) |
| 3 or 4 Children | 38 (2.1%) | 72 (39.6%) |
| 5 or more Children | 45 (11.6%) | 19 (52.8%) |
| Total | 204 (2.3%) | 204 (15.0%) |
Employment Characteristics in Spanish Fork
Employment by Class of Employer in Spanish Fork
Among the 20,063 employed individuals in Spanish Fork, private company employees (13,908 | 69.3%), local government employees (1,924 | 9.6%), and self-employed (not incorporated) (1,226 | 6.1%) make up the most common classes of employment.
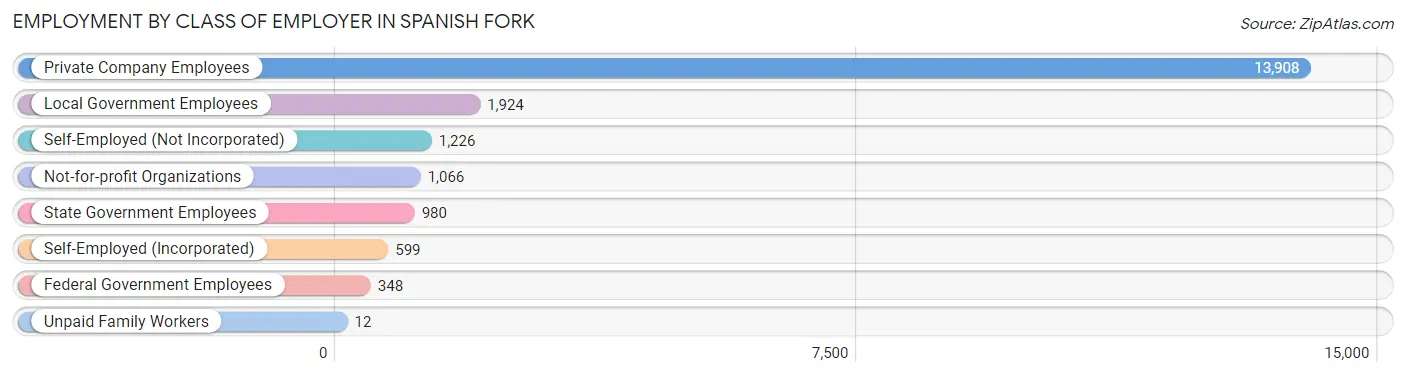
| Employer Class | # Employees | % Employees |
| Private Company Employees | 13,908 | 69.3% |
| Self-Employed (Incorporated) | 599 | 3.0% |
| Self-Employed (Not Incorporated) | 1,226 | 6.1% |
| Not-for-profit Organizations | 1,066 | 5.3% |
| Local Government Employees | 1,924 | 9.6% |
| State Government Employees | 980 | 4.9% |
| Federal Government Employees | 348 | 1.7% |
| Unpaid Family Workers | 12 | 0.1% |
| Total | 20,063 | 100.0% |
Employment Status by Age in Spanish Fork
According to the labor force statistics for Spanish Fork, out of the total population over 16 years of age (29,277), 71.5% or 20,933 individuals are in the labor force, with 1.9% or 398 of them unemployed. The age group with the highest labor force participation rate is 55 to 59 years, with 87.8% or 1,471 individuals in the labor force. Within the labor force, the 16 to 19 years age range has the highest percentage of unemployed individuals, with 7.1% or 164 of them being unemployed.
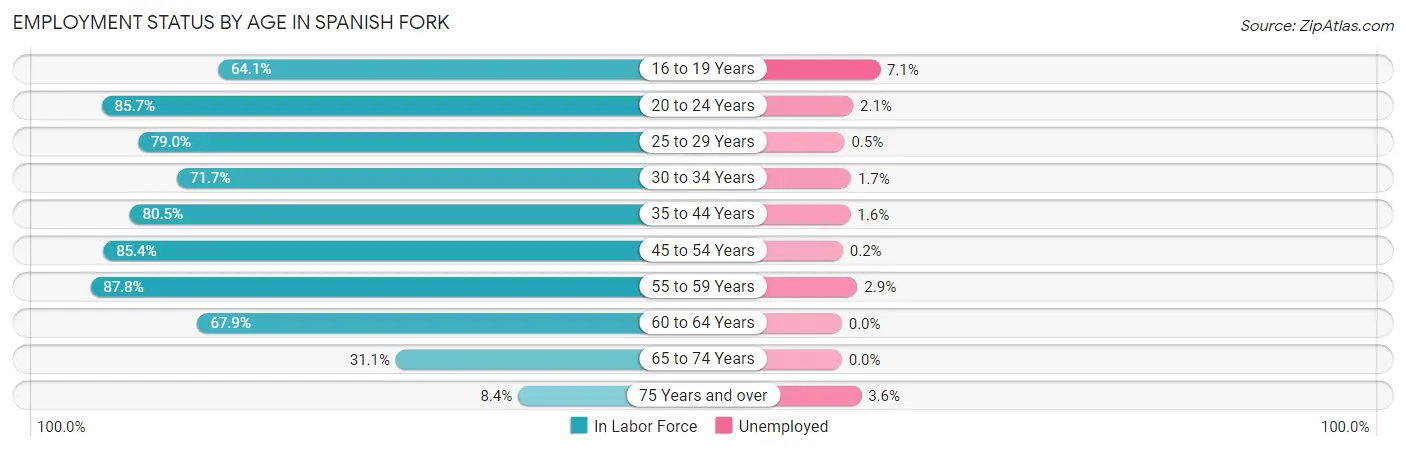
| Age Bracket | In Labor Force | Unemployed |
| 16 to 19 Years | 2,316 (64.1%) | 164 (7.1%) |
| 20 to 24 Years | 2,589 (85.7%) | 54 (2.1%) |
| 25 to 29 Years | 2,328 (79.0%) | 12 (0.5%) |
| 30 to 34 Years | 2,081 (71.7%) | 35 (1.7%) |
| 35 to 44 Years | 5,016 (80.5%) | 80 (1.6%) |
| 45 to 54 Years | 3,465 (85.4%) | 7 (0.2%) |
| 55 to 59 Years | 1,471 (87.8%) | 43 (2.9%) |
| 60 to 64 Years | 874 (67.9%) | 0 (0.0%) |
| 65 to 74 Years | 691 (31.1%) | 0 (0.0%) |
| 75 Years and over | 111 (8.4%) | 4 (3.6%) |
| Total | 20,933 (71.5%) | 398 (1.9%) |
Employment Status by Educational Attainment in Spanish Fork
According to labor force statistics for Spanish Fork, 79.8% of individuals (15,241) out of the total population between 25 and 64 years of age (19,099) are in the labor force, with 1.2% or 183 of them being unemployed. The group with the highest labor force participation rate are those with the educational attainment of bachelor's degree or higher, with 82.5% or 5,855 individuals in the labor force. Within the labor force, individuals with high school diploma education have the highest percentage of unemployment, with 1.5% or 46 of them being unemployed.
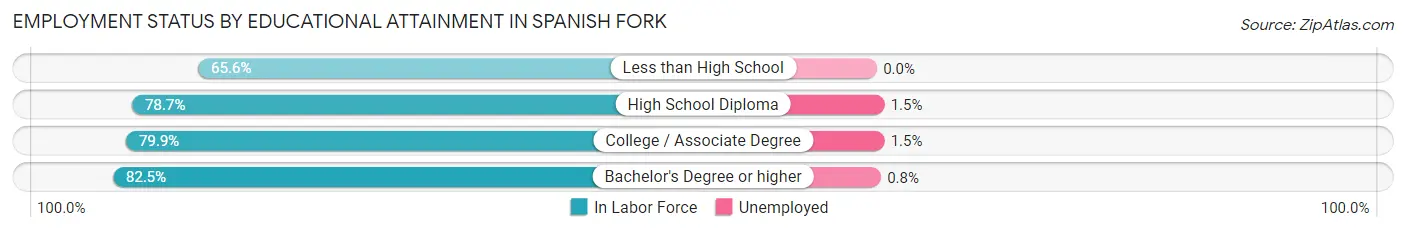
| Educational Attainment | In Labor Force | Unemployed |
| Less than High School | 755 (65.6%) | 0 (0.0%) |
| High School Diploma | 3,039 (78.7%) | 58 (1.5%) |
| College / Associate Degree | 5,585 (79.9%) | 105 (1.5%) |
| Bachelor's Degree or higher | 5,855 (82.5%) | 57 (0.8%) |
| Total | 15,241 (79.8%) | 229 (1.2%) |
Employment Occupations by Sex in Spanish Fork
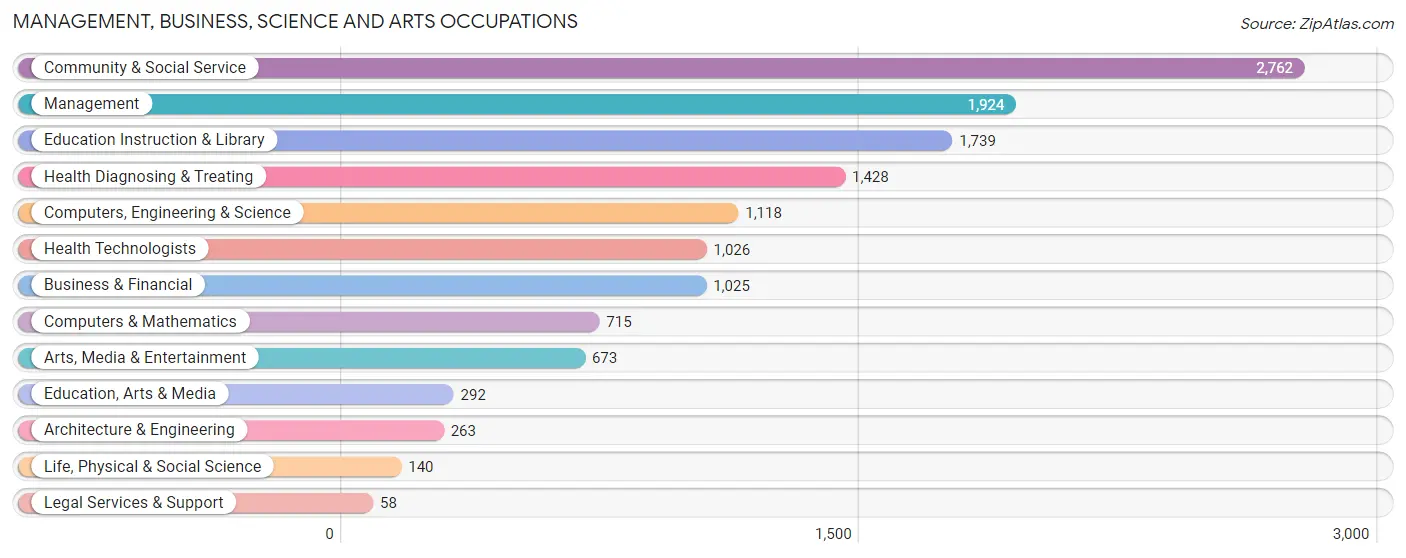
Management, Business, Science and Arts Occupations
The most common Management, Business, Science and Arts occupations in Spanish Fork are Community & Social Service (2,762 | 13.5%), Management (1,924 | 9.4%), Education Instruction & Library (1,739 | 8.5%), Health Diagnosing & Treating (1,428 | 7.0%), and Computers, Engineering & Science (1,118 | 5.4%).
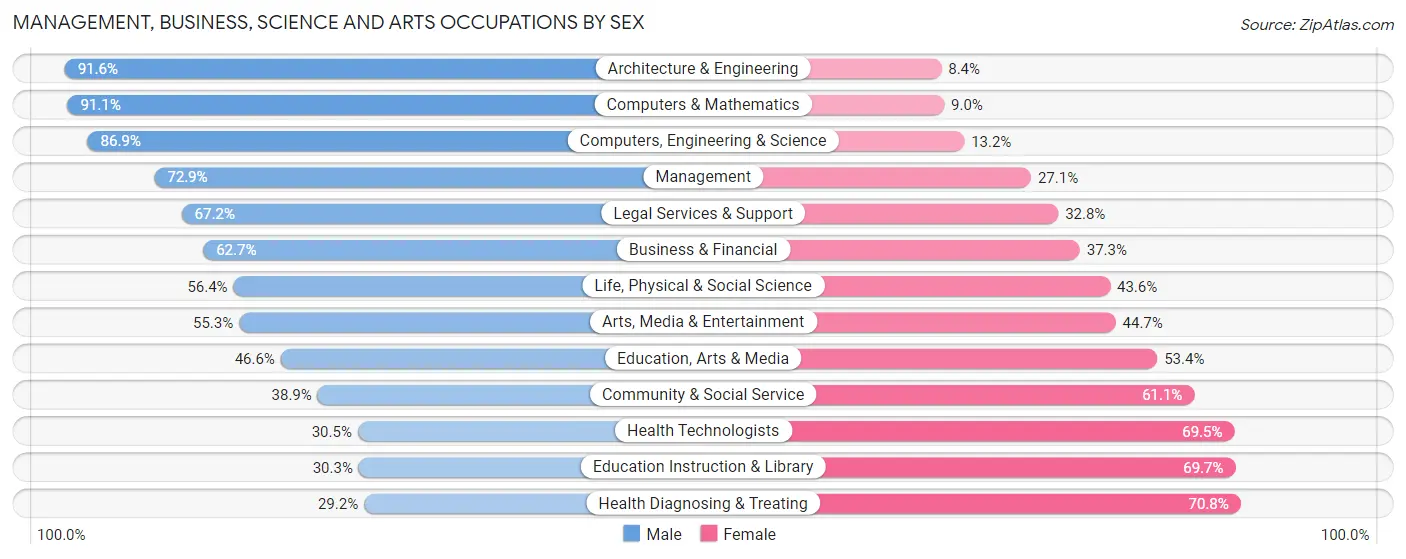
Management, Business, Science and Arts Occupations by Sex
Within the Management, Business, Science and Arts occupations in Spanish Fork, the most male-oriented occupations are Architecture & Engineering (91.6%), Computers & Mathematics (91.0%), and Computers, Engineering & Science (86.9%), while the most female-oriented occupations are Health Diagnosing & Treating (70.8%), Education Instruction & Library (69.7%), and Health Technologists (69.5%).
| Occupation | Male | Female |
| Management | 1,403 (72.9%) | 521 (27.1%) |
| Business & Financial | 643 (62.7%) | 382 (37.3%) |
| Computers, Engineering & Science | 971 (86.9%) | 147 (13.2%) |
| Computers & Mathematics | 651 (91.0%) | 64 (8.9%) |
| Architecture & Engineering | 241 (91.6%) | 22 (8.4%) |
| Life, Physical & Social Science | 79 (56.4%) | 61 (43.6%) |
| Community & Social Service | 1,074 (38.9%) | 1,688 (61.1%) |
| Education, Arts & Media | 136 (46.6%) | 156 (53.4%) |
| Legal Services & Support | 39 (67.2%) | 19 (32.8%) |
| Education Instruction & Library | 527 (30.3%) | 1,212 (69.7%) |
| Arts, Media & Entertainment | 372 (55.3%) | 301 (44.7%) |
| Health Diagnosing & Treating | 417 (29.2%) | 1,011 (70.8%) |
| Health Technologists | 313 (30.5%) | 713 (69.5%) |
| Total (Category) | 4,508 (54.6%) | 3,749 (45.4%) |
| Total (Overall) | 11,584 (56.4%) | 8,943 (43.6%) |
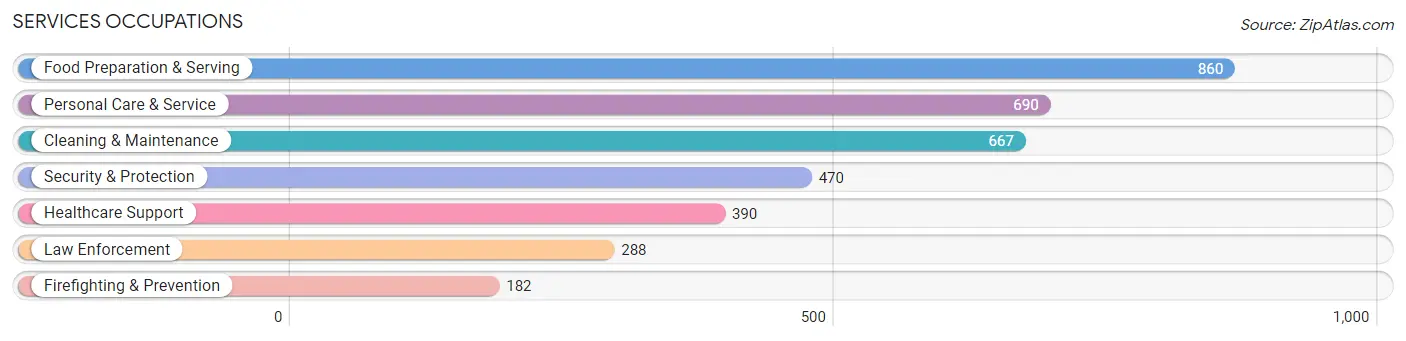
Services Occupations
The most common Services occupations in Spanish Fork are Food Preparation & Serving (860 | 4.2%), Personal Care & Service (690 | 3.4%), Cleaning & Maintenance (667 | 3.3%), Security & Protection (470 | 2.3%), and Healthcare Support (390 | 1.9%).
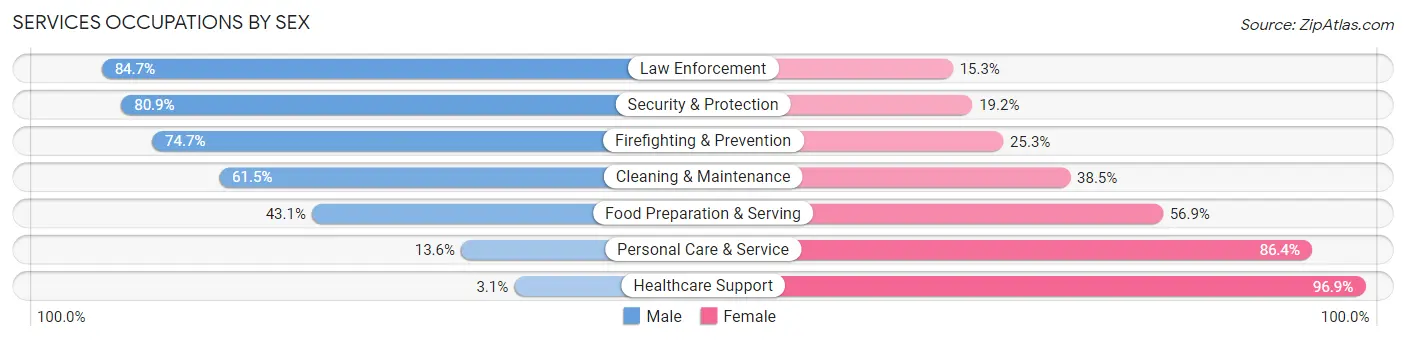
Services Occupations by Sex
Within the Services occupations in Spanish Fork, the most male-oriented occupations are Law Enforcement (84.7%), Security & Protection (80.8%), and Firefighting & Prevention (74.7%), while the most female-oriented occupations are Healthcare Support (96.9%), Personal Care & Service (86.4%), and Food Preparation & Serving (56.9%).
| Occupation | Male | Female |
| Healthcare Support | 12 (3.1%) | 378 (96.9%) |
| Security & Protection | 380 (80.8%) | 90 (19.2%) |
| Firefighting & Prevention | 136 (74.7%) | 46 (25.3%) |
| Law Enforcement | 244 (84.7%) | 44 (15.3%) |
| Food Preparation & Serving | 371 (43.1%) | 489 (56.9%) |
| Cleaning & Maintenance | 410 (61.5%) | 257 (38.5%) |
| Personal Care & Service | 94 (13.6%) | 596 (86.4%) |
| Total (Category) | 1,267 (41.2%) | 1,810 (58.8%) |
| Total (Overall) | 11,584 (56.4%) | 8,943 (43.6%) |
Sales and Office Occupations
The most common Sales and Office occupations in Spanish Fork are Office & Administration (2,666 | 13.0%), and Sales & Related (1,845 | 9.0%).

Sales and Office Occupations by Sex
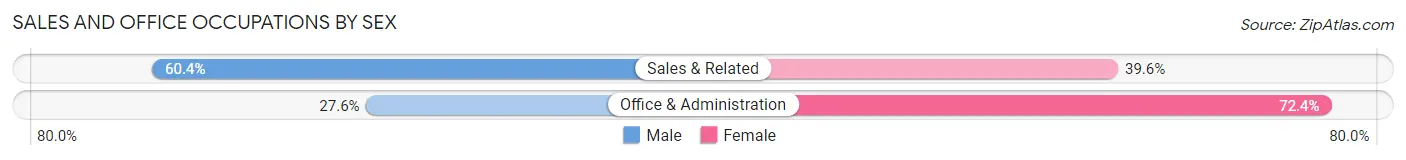
| Occupation | Male | Female |
| Sales & Related | 1,114 (60.4%) | 731 (39.6%) |
| Office & Administration | 735 (27.6%) | 1,931 (72.4%) |
| Total (Category) | 1,849 (41.0%) | 2,662 (59.0%) |
| Total (Overall) | 11,584 (56.4%) | 8,943 (43.6%) |
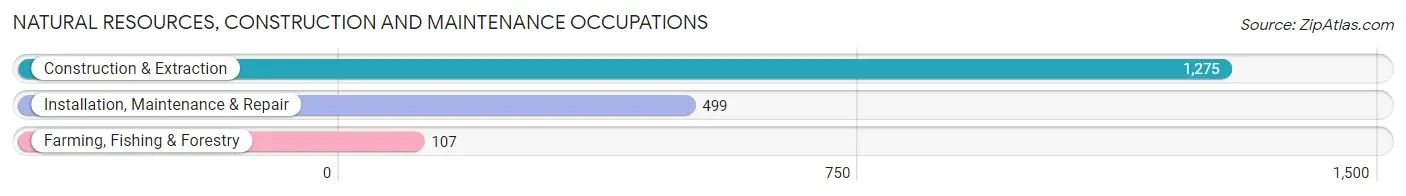
Natural Resources, Construction and Maintenance Occupations
The most common Natural Resources, Construction and Maintenance occupations in Spanish Fork are Construction & Extraction (1,275 | 6.2%), Installation, Maintenance & Repair (499 | 2.4%), and Farming, Fishing & Forestry (107 | 0.5%).
Natural Resources, Construction and Maintenance Occupations by Sex
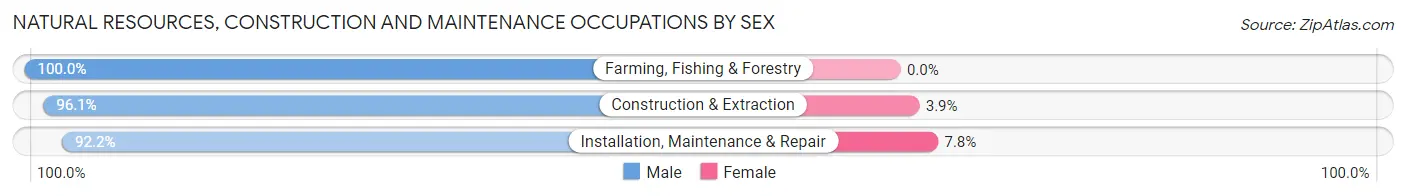
| Occupation | Male | Female |
| Farming, Fishing & Forestry | 107 (100.0%) | 0 (0.0%) |
| Construction & Extraction | 1,225 (96.1%) | 50 (3.9%) |
| Installation, Maintenance & Repair | 460 (92.2%) | 39 (7.8%) |
| Total (Category) | 1,792 (95.3%) | 89 (4.7%) |
| Total (Overall) | 11,584 (56.4%) | 8,943 (43.6%) |
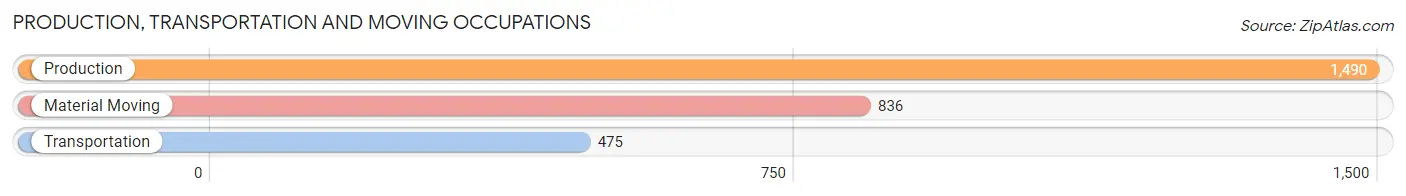
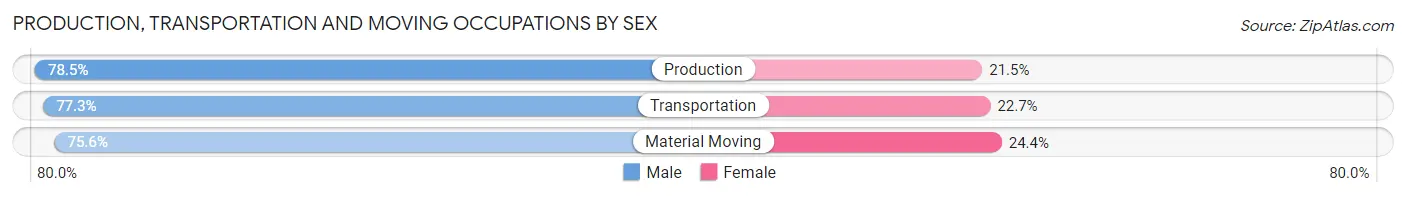
Production, Transportation and Moving Occupations
The most common Production, Transportation and Moving occupations in Spanish Fork are Production (1,490 | 7.3%), Material Moving (836 | 4.1%), and Transportation (475 | 2.3%).
Production, Transportation and Moving Occupations by Sex
| Occupation | Male | Female |
| Production | 1,169 (78.5%) | 321 (21.5%) |
| Transportation | 367 (77.3%) | 108 (22.7%) |
| Material Moving | 632 (75.6%) | 204 (24.4%) |
| Total (Category) | 2,168 (77.4%) | 633 (22.6%) |
| Total (Overall) | 11,584 (56.4%) | 8,943 (43.6%) |
Employment Industries by Sex in Spanish Fork
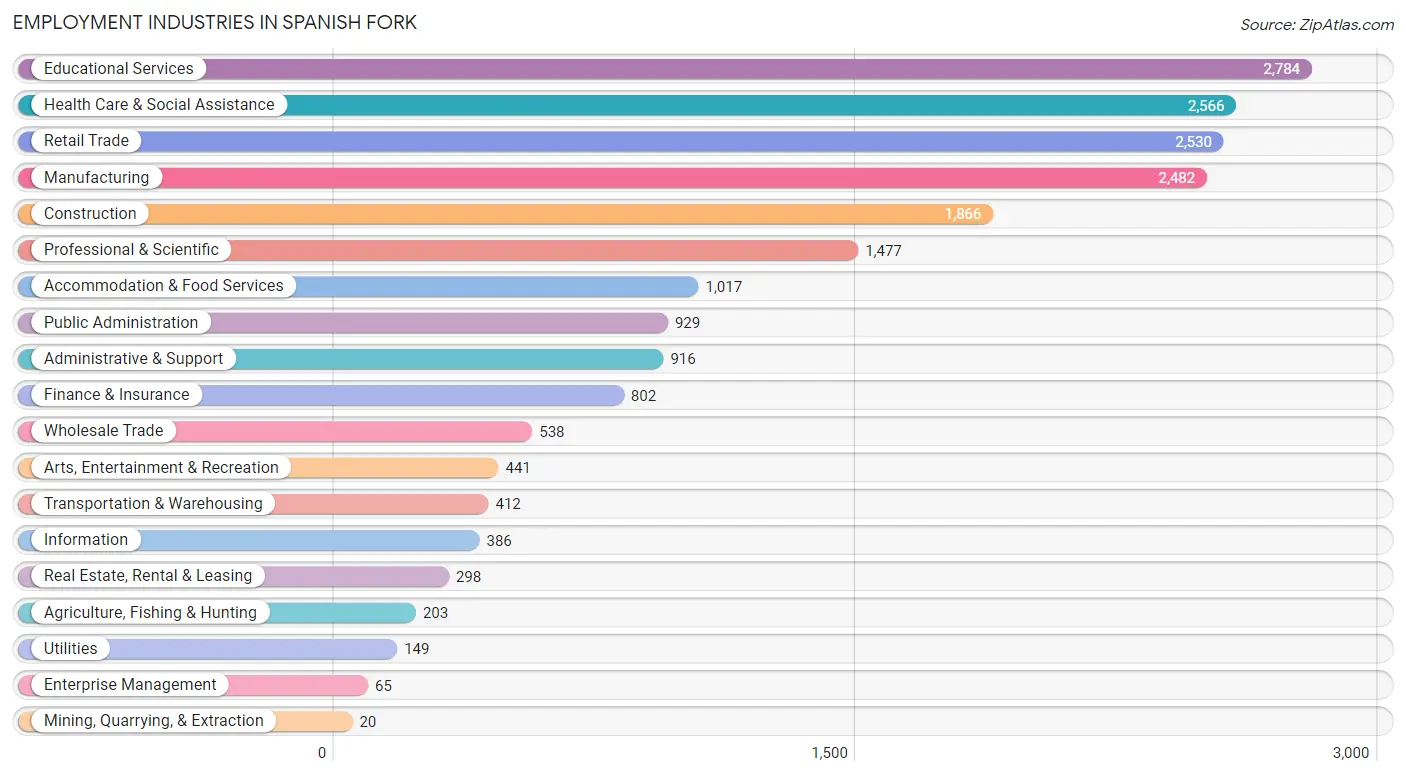
Employment Industries in Spanish Fork
The major employment industries in Spanish Fork include Educational Services (2,784 | 13.6%), Health Care & Social Assistance (2,566 | 12.5%), Retail Trade (2,530 | 12.3%), Manufacturing (2,482 | 12.1%), and Construction (1,866 | 9.1%).
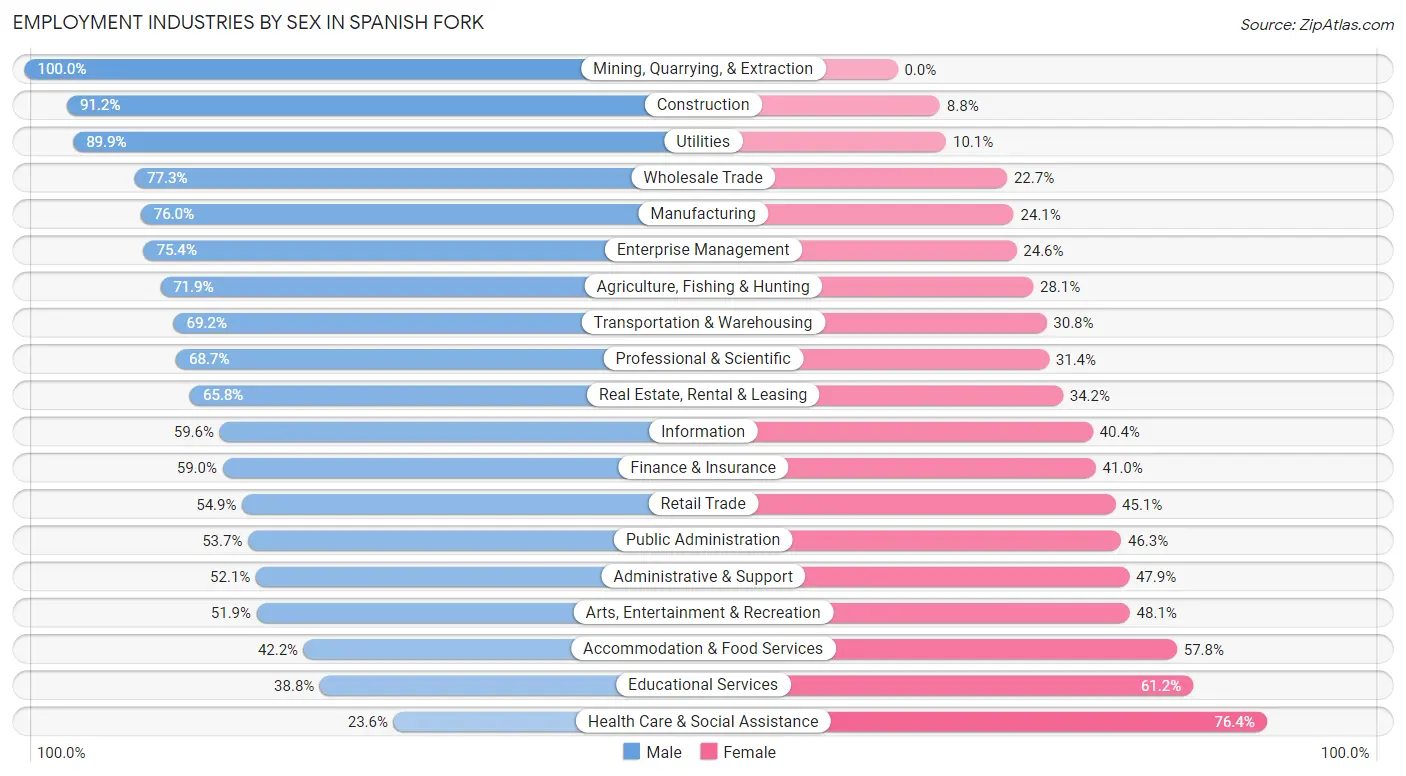
Employment Industries by Sex in Spanish Fork
The Spanish Fork industries that see more men than women are Mining, Quarrying, & Extraction (100.0%), Construction (91.2%), and Utilities (89.9%), whereas the industries that tend to have a higher number of women are Health Care & Social Assistance (76.4%), Educational Services (61.2%), and Accommodation & Food Services (57.8%).
| Industry | Male | Female |
| Agriculture, Fishing & Hunting | 146 (71.9%) | 57 (28.1%) |
| Mining, Quarrying, & Extraction | 20 (100.0%) | 0 (0.0%) |
| Construction | 1,702 (91.2%) | 164 (8.8%) |
| Manufacturing | 1,885 (75.9%) | 597 (24.0%) |
| Wholesale Trade | 416 (77.3%) | 122 (22.7%) |
| Retail Trade | 1,390 (54.9%) | 1,140 (45.1%) |
| Transportation & Warehousing | 285 (69.2%) | 127 (30.8%) |
| Utilities | 134 (89.9%) | 15 (10.1%) |
| Information | 230 (59.6%) | 156 (40.4%) |
| Finance & Insurance | 473 (59.0%) | 329 (41.0%) |
| Real Estate, Rental & Leasing | 196 (65.8%) | 102 (34.2%) |
| Professional & Scientific | 1,014 (68.6%) | 463 (31.4%) |
| Enterprise Management | 49 (75.4%) | 16 (24.6%) |
| Administrative & Support | 477 (52.1%) | 439 (47.9%) |
| Educational Services | 1,081 (38.8%) | 1,703 (61.2%) |
| Health Care & Social Assistance | 605 (23.6%) | 1,961 (76.4%) |
| Arts, Entertainment & Recreation | 229 (51.9%) | 212 (48.1%) |
| Accommodation & Food Services | 429 (42.2%) | 588 (57.8%) |
| Public Administration | 499 (53.7%) | 430 (46.3%) |
| Total | 11,584 (56.4%) | 8,943 (43.6%) |
Education in Spanish Fork
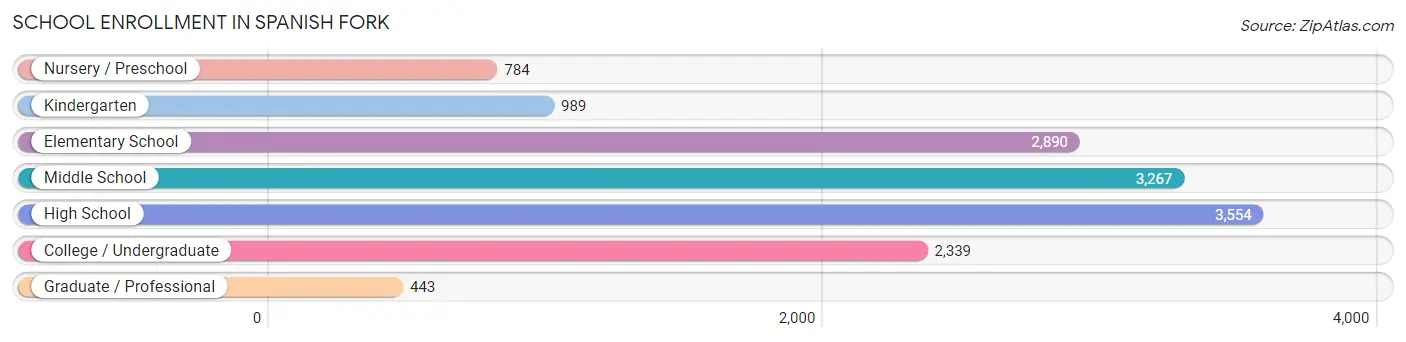
School Enrollment in Spanish Fork
The most common levels of schooling among the 14,266 students in Spanish Fork are high school (3,554 | 24.9%), middle school (3,267 | 22.9%), and elementary school (2,890 | 20.3%).
| School Level | # Students | % Students |
| Nursery / Preschool | 784 | 5.5% |
| Kindergarten | 989 | 6.9% |
| Elementary School | 2,890 | 20.3% |
| Middle School | 3,267 | 22.9% |
| High School | 3,554 | 24.9% |
| College / Undergraduate | 2,339 | 16.4% |
| Graduate / Professional | 443 | 3.1% |
| Total | 14,266 | 100.0% |
School Enrollment by Age by Funding Source in Spanish Fork
Out of a total of 14,266 students who are enrolled in schools in Spanish Fork, 1,455 (10.2%) attend a private institution, while the remaining 12,811 (89.8%) are enrolled in public schools. The age group of 3 to 4 year olds has the highest likelihood of being enrolled in private schools, with 197 (39.8% in the age bracket) enrolled. Conversely, the age group of 18 to 19 year olds has the lowest likelihood of being enrolled in a private school, with 1,006 (96.8% in the age bracket) attending a public institution.
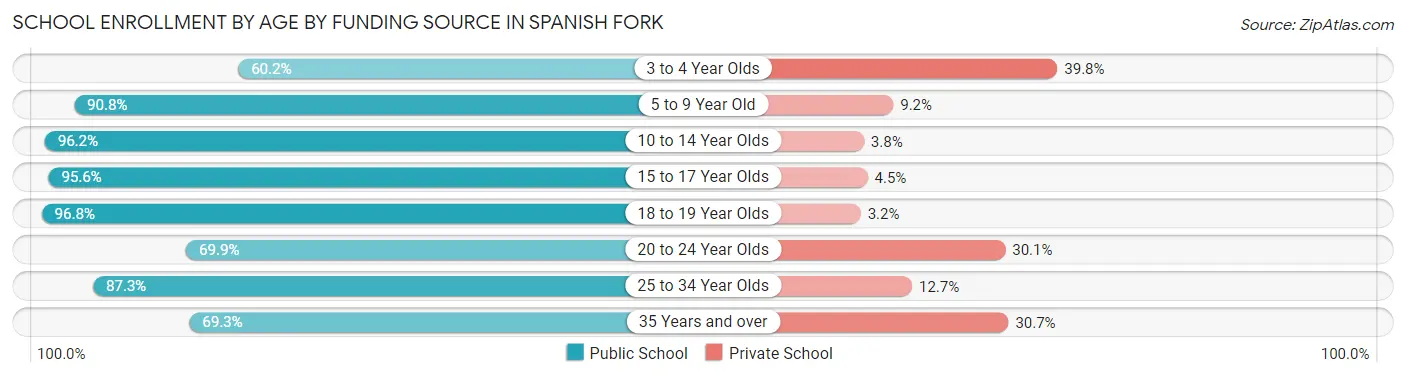
| Age Bracket | Public School | Private School |
| 3 to 4 Year Olds | 298 (60.2%) | 197 (39.8%) |
| 5 to 9 Year Old | 3,341 (90.8%) | 340 (9.2%) |
| 10 to 14 Year Olds | 3,955 (96.2%) | 155 (3.8%) |
| 15 to 17 Year Olds | 2,450 (95.6%) | 114 (4.4%) |
| 18 to 19 Year Olds | 1,006 (96.8%) | 33 (3.2%) |
| 20 to 24 Year Olds | 743 (69.9%) | 320 (30.1%) |
| 25 to 34 Year Olds | 541 (87.3%) | 79 (12.7%) |
| 35 Years and over | 481 (69.3%) | 213 (30.7%) |
| Total | 12,811 (89.8%) | 1,455 (10.2%) |
Educational Attainment by Field of Study in Spanish Fork
Education (1,779 | 19.5%), science & technology (1,411 | 15.4%), business (1,305 | 14.3%), arts & humanities (859 | 9.4%), and social sciences (583 | 6.4%) are the most common fields of study among 9,137 individuals in Spanish Fork who have obtained a bachelor's degree or higher.
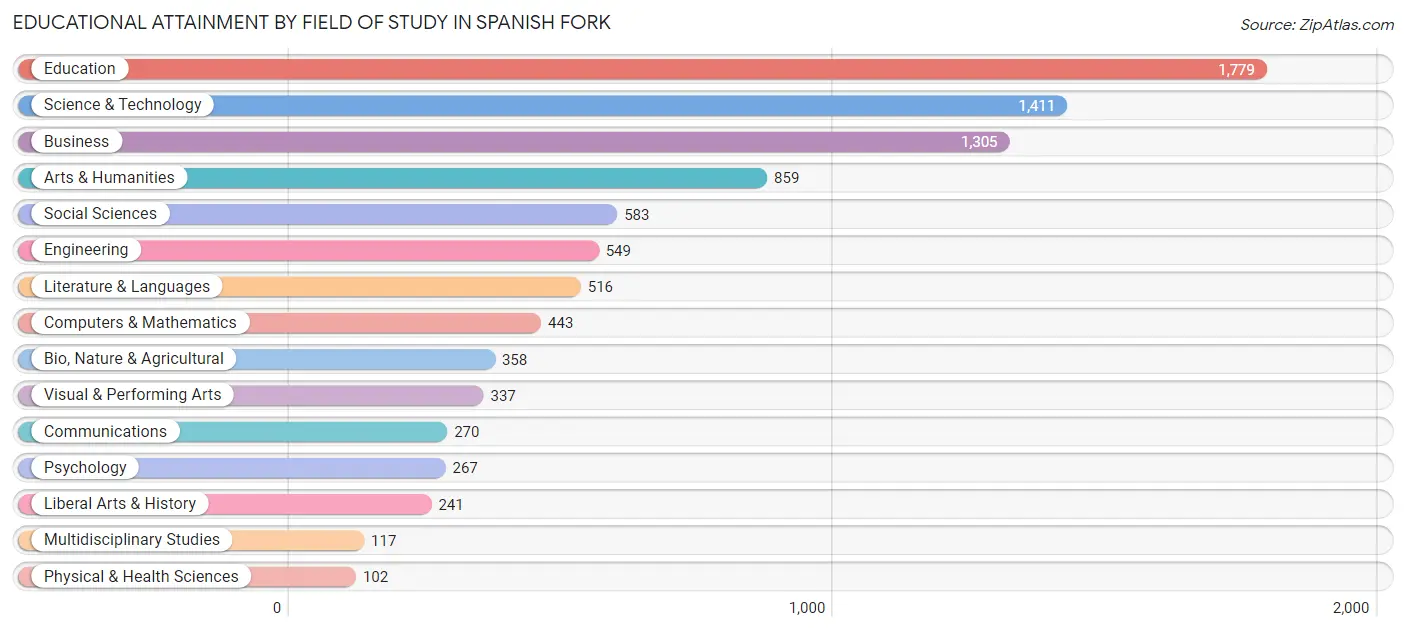
| Field of Study | # Graduates | % Graduates |
| Computers & Mathematics | 443 | 4.9% |
| Bio, Nature & Agricultural | 358 | 3.9% |
| Physical & Health Sciences | 102 | 1.1% |
| Psychology | 267 | 2.9% |
| Social Sciences | 583 | 6.4% |
| Engineering | 549 | 6.0% |
| Multidisciplinary Studies | 117 | 1.3% |
| Science & Technology | 1,411 | 15.4% |
| Business | 1,305 | 14.3% |
| Education | 1,779 | 19.5% |
| Literature & Languages | 516 | 5.7% |
| Liberal Arts & History | 241 | 2.6% |
| Visual & Performing Arts | 337 | 3.7% |
| Communications | 270 | 3.0% |
| Arts & Humanities | 859 | 9.4% |
| Total | 9,137 | 100.0% |
Transportation & Commute in Spanish Fork
Vehicle Availability by Sex in Spanish Fork
The most prevalent vehicle ownership categories in Spanish Fork are males with 2 vehicles (4,410, accounting for 39.0%) and females with 2 vehicles (2,941, making up 50.4%).
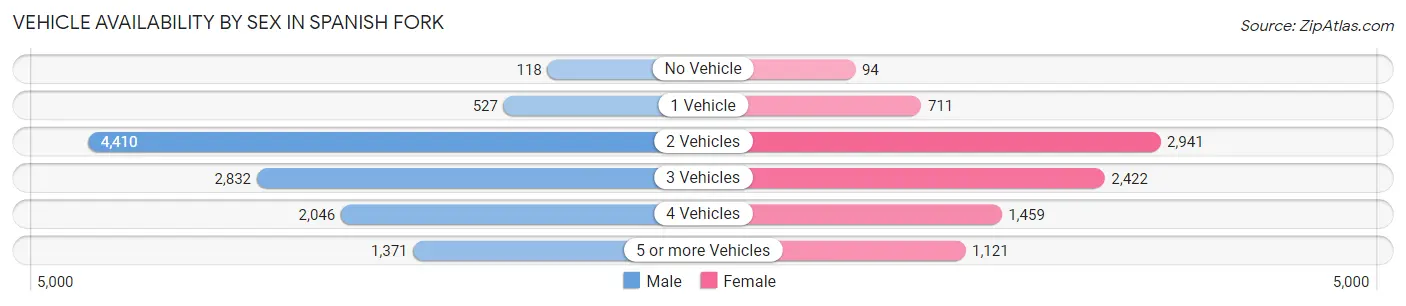
| Vehicles Available | Male | Female |
| No Vehicle | 118 (1.0%) | 94 (1.1%) |
| 1 Vehicle | 527 (4.7%) | 711 (8.1%) |
| 2 Vehicles | 4,410 (39.0%) | 2,941 (33.6%) |
| 3 Vehicles | 2,832 (25.1%) | 2,422 (27.7%) |
| 4 Vehicles | 2,046 (18.1%) | 1,459 (16.7%) |
| 5 or more Vehicles | 1,371 (12.1%) | 1,121 (12.8%) |
| Total | 11,304 (100.0%) | 8,748 (100.0%) |
Commute Time in Spanish Fork
The most frequently occuring commute durations in Spanish Fork are 10 to 14 minutes (3,217 commuters, 18.1%), 20 to 24 minutes (2,951 commuters, 16.6%), and 15 to 19 minutes (2,763 commuters, 15.5%).
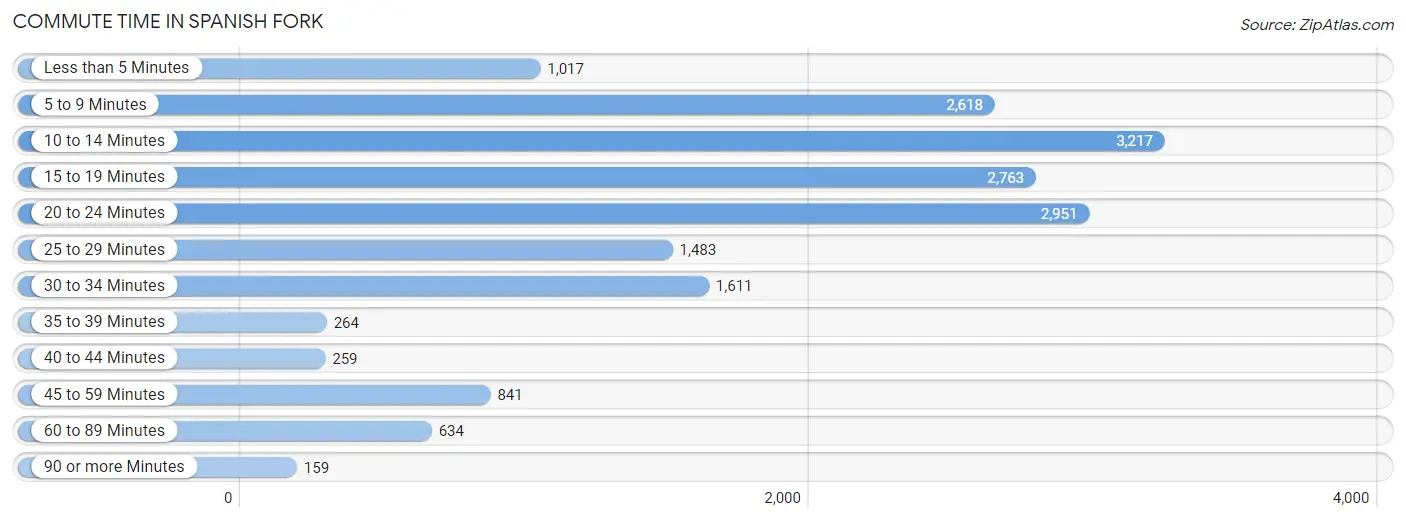
| Commute Time | # Commuters | % Commuters |
| Less than 5 Minutes | 1,017 | 5.7% |
| 5 to 9 Minutes | 2,618 | 14.7% |
| 10 to 14 Minutes | 3,217 | 18.1% |
| 15 to 19 Minutes | 2,763 | 15.5% |
| 20 to 24 Minutes | 2,951 | 16.6% |
| 25 to 29 Minutes | 1,483 | 8.3% |
| 30 to 34 Minutes | 1,611 | 9.0% |
| 35 to 39 Minutes | 264 | 1.5% |
| 40 to 44 Minutes | 259 | 1.5% |
| 45 to 59 Minutes | 841 | 4.7% |
| 60 to 89 Minutes | 634 | 3.6% |
| 90 or more Minutes | 159 | 0.9% |
Commute Time by Sex in Spanish Fork
The most common commute times in Spanish Fork are 10 to 14 minutes (1,859 commuters, 18.4%) for males and 5 to 9 minutes (1,419 commuters, 18.4%) for females.
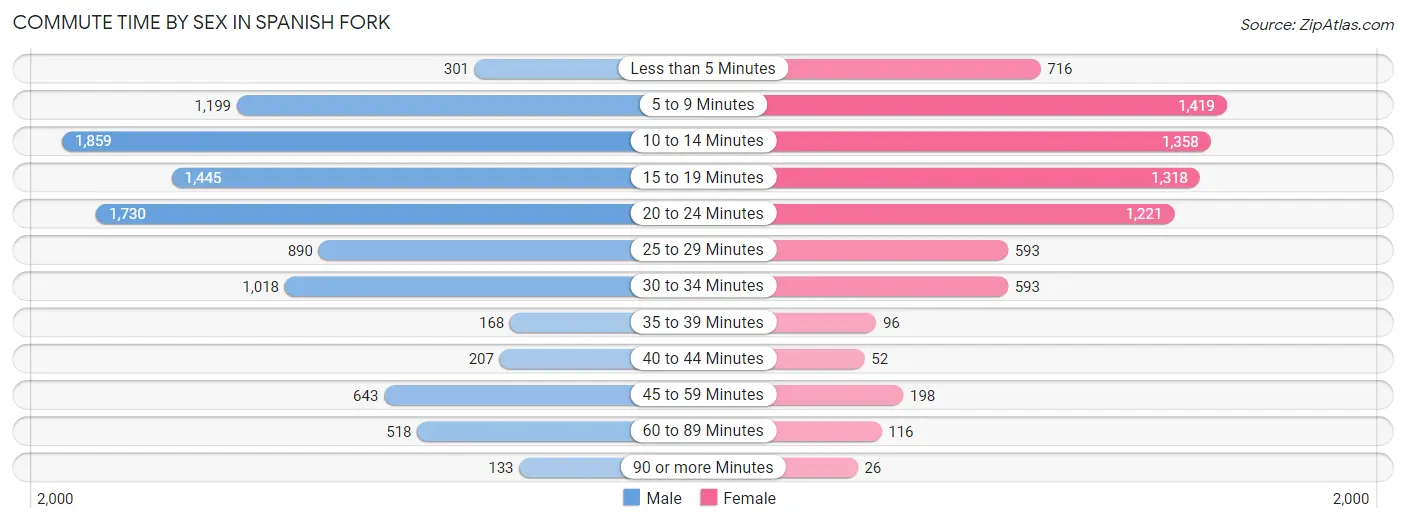
| Commute Time | Male | Female |
| Less than 5 Minutes | 301 (3.0%) | 716 (9.3%) |
| 5 to 9 Minutes | 1,199 (11.9%) | 1,419 (18.4%) |
| 10 to 14 Minutes | 1,859 (18.4%) | 1,358 (17.6%) |
| 15 to 19 Minutes | 1,445 (14.3%) | 1,318 (17.1%) |
| 20 to 24 Minutes | 1,730 (17.1%) | 1,221 (15.8%) |
| 25 to 29 Minutes | 890 (8.8%) | 593 (7.7%) |
| 30 to 34 Minutes | 1,018 (10.1%) | 593 (7.7%) |
| 35 to 39 Minutes | 168 (1.7%) | 96 (1.3%) |
| 40 to 44 Minutes | 207 (2.1%) | 52 (0.7%) |
| 45 to 59 Minutes | 643 (6.4%) | 198 (2.6%) |
| 60 to 89 Minutes | 518 (5.1%) | 116 (1.5%) |
| 90 or more Minutes | 133 (1.3%) | 26 (0.3%) |
Time of Departure to Work by Sex in Spanish Fork
The most frequent times of departure to work in Spanish Fork are 7:00 AM to 7:29 AM (1,389, 13.7%) for males and 8:00 AM to 8:29 AM (1,179, 15.3%) for females.
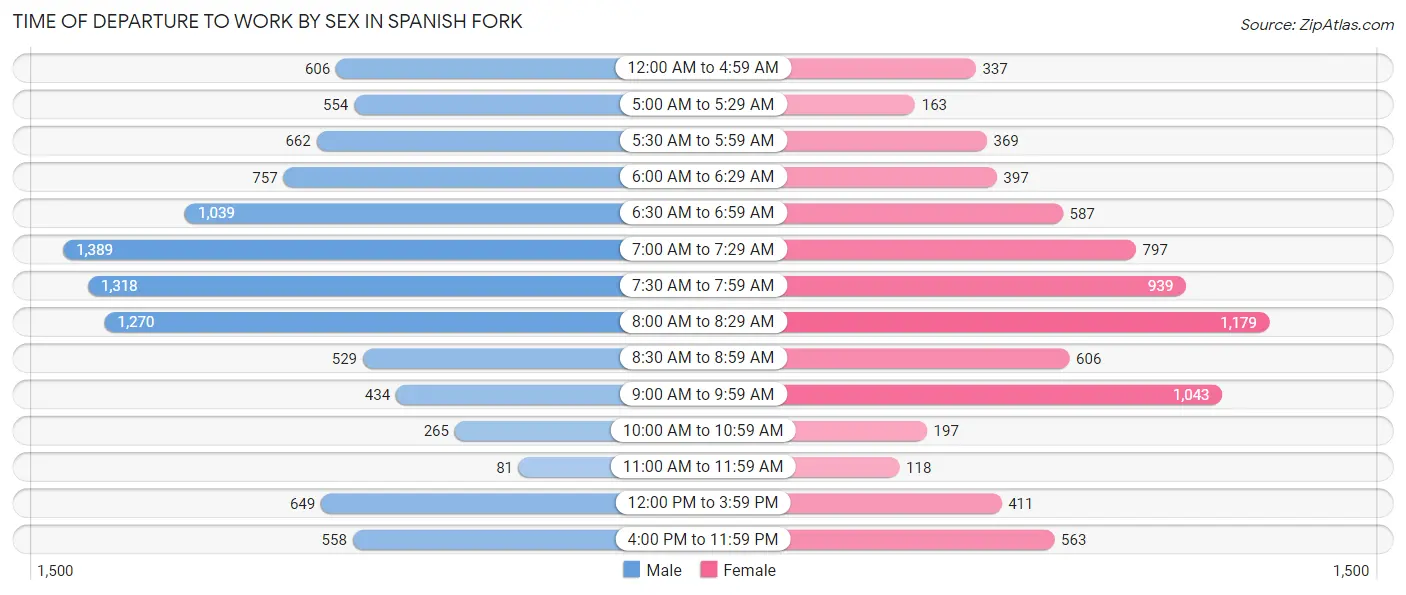
| Time of Departure | Male | Female |
| 12:00 AM to 4:59 AM | 606 (6.0%) | 337 (4.4%) |
| 5:00 AM to 5:29 AM | 554 (5.5%) | 163 (2.1%) |
| 5:30 AM to 5:59 AM | 662 (6.6%) | 369 (4.8%) |
| 6:00 AM to 6:29 AM | 757 (7.5%) | 397 (5.1%) |
| 6:30 AM to 6:59 AM | 1,039 (10.3%) | 587 (7.6%) |
| 7:00 AM to 7:29 AM | 1,389 (13.7%) | 797 (10.3%) |
| 7:30 AM to 7:59 AM | 1,318 (13.0%) | 939 (12.2%) |
| 8:00 AM to 8:29 AM | 1,270 (12.6%) | 1,179 (15.3%) |
| 8:30 AM to 8:59 AM | 529 (5.2%) | 606 (7.9%) |
| 9:00 AM to 9:59 AM | 434 (4.3%) | 1,043 (13.5%) |
| 10:00 AM to 10:59 AM | 265 (2.6%) | 197 (2.6%) |
| 11:00 AM to 11:59 AM | 81 (0.8%) | 118 (1.5%) |
| 12:00 PM to 3:59 PM | 649 (6.4%) | 411 (5.3%) |
| 4:00 PM to 11:59 PM | 558 (5.5%) | 563 (7.3%) |
| Total | 10,111 (100.0%) | 7,706 (100.0%) |
Housing Occupancy in Spanish Fork
Occupancy by Ownership in Spanish Fork
Of the total 11,657 dwellings in Spanish Fork, owner-occupied units account for 9,312 (79.9%), while renter-occupied units make up 2,345 (20.1%).
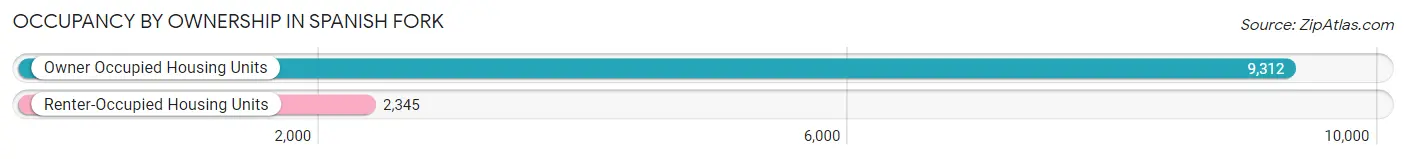
| Occupancy | # Housing Units | % Housing Units |
| Owner Occupied Housing Units | 9,312 | 79.9% |
| Renter-Occupied Housing Units | 2,345 | 20.1% |
| Total Occupied Housing Units | 11,657 | 100.0% |
Occupancy by Household Size in Spanish Fork
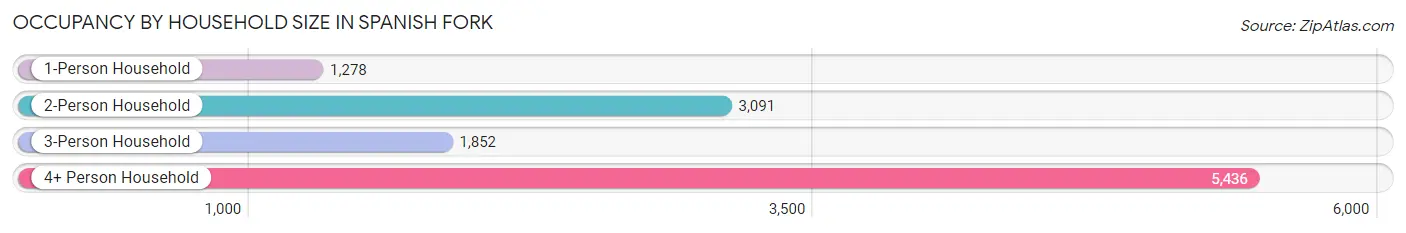
| Household Size | # Housing Units | % Housing Units |
| 1-Person Household | 1,278 | 11.0% |
| 2-Person Household | 3,091 | 26.5% |
| 3-Person Household | 1,852 | 15.9% |
| 4+ Person Household | 5,436 | 46.6% |
| Total Housing Units | 11,657 | 100.0% |
Occupancy by Ownership by Household Size in Spanish Fork
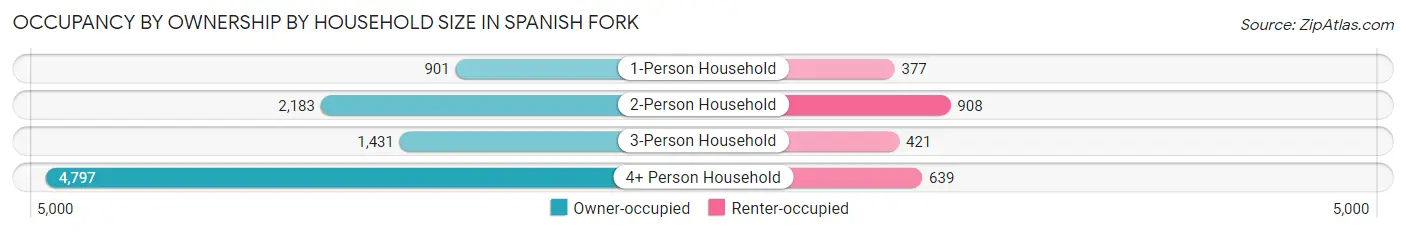
| Household Size | Owner-occupied | Renter-occupied |
| 1-Person Household | 901 (70.5%) | 377 (29.5%) |
| 2-Person Household | 2,183 (70.6%) | 908 (29.4%) |
| 3-Person Household | 1,431 (77.3%) | 421 (22.7%) |
| 4+ Person Household | 4,797 (88.2%) | 639 (11.7%) |
| Total Housing Units | 9,312 (79.9%) | 2,345 (20.1%) |
Occupancy by Educational Attainment in Spanish Fork
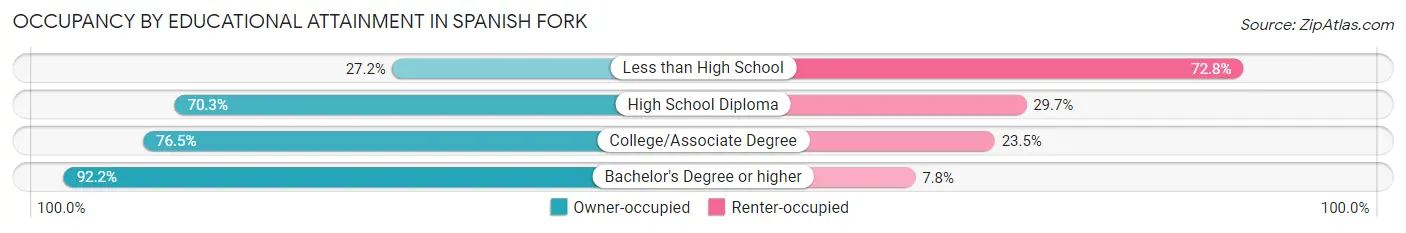
| Household Size | Owner-occupied | Renter-occupied |
| Less than High School | 129 (27.2%) | 345 (72.8%) |
| High School Diploma | 1,538 (70.3%) | 651 (29.7%) |
| College/Associate Degree | 3,165 (76.5%) | 972 (23.5%) |
| Bachelor's Degree or higher | 4,480 (92.2%) | 377 (7.8%) |
Occupancy by Age of Householder in Spanish Fork
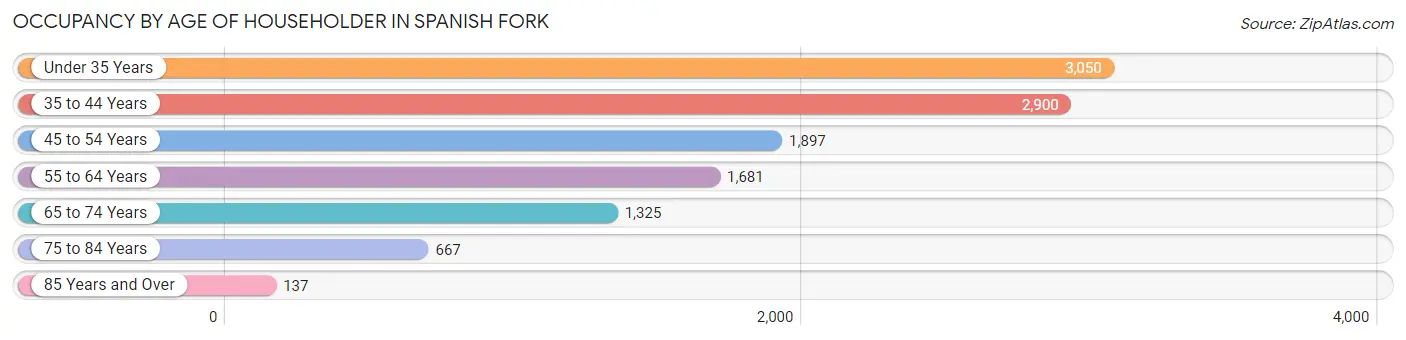
| Age Bracket | # Households | % Households |
| Under 35 Years | 3,050 | 26.2% |
| 35 to 44 Years | 2,900 | 24.9% |
| 45 to 54 Years | 1,897 | 16.3% |
| 55 to 64 Years | 1,681 | 14.4% |
| 65 to 74 Years | 1,325 | 11.4% |
| 75 to 84 Years | 667 | 5.7% |
| 85 Years and Over | 137 | 1.2% |
| Total | 11,657 | 100.0% |
Housing Finances in Spanish Fork
Median Income by Occupancy in Spanish Fork
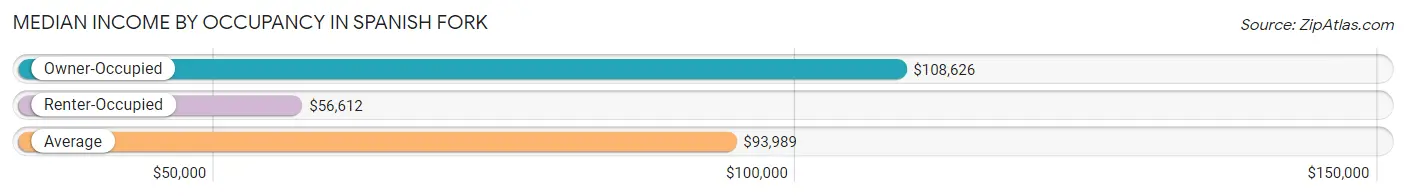
| Occupancy Type | # Households | Median Income |
| Owner-Occupied | 9,312 (79.9%) | $108,626 |
| Renter-Occupied | 2,345 (20.1%) | $56,612 |
| Average | 11,657 (100.0%) | $93,989 |
Occupancy by Householder Income Bracket in Spanish Fork
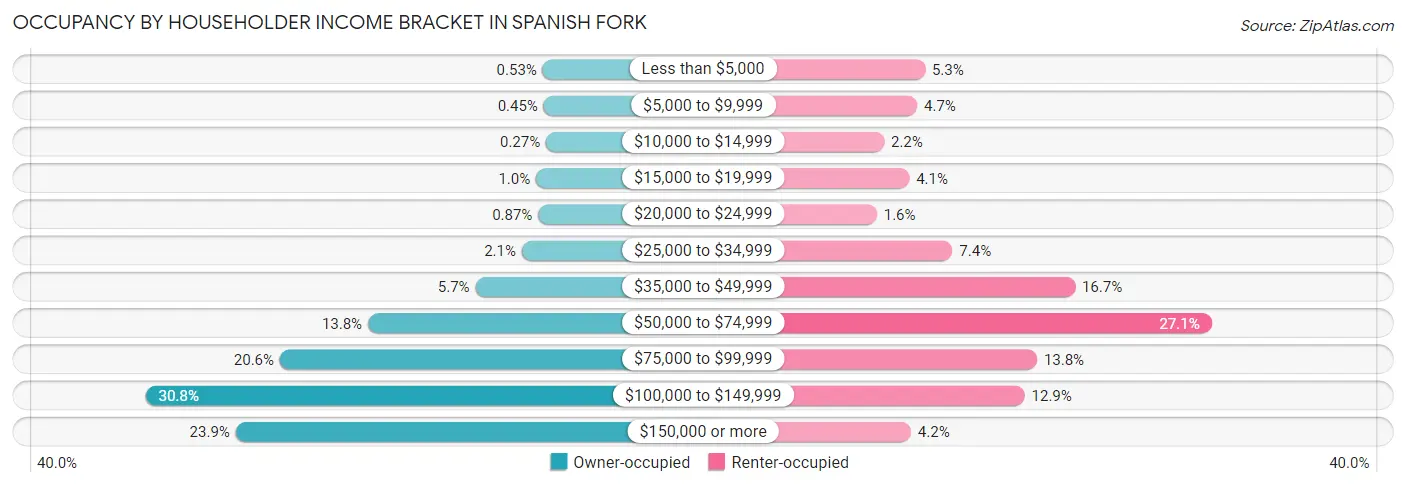
| Income Bracket | Owner-occupied | Renter-occupied |
| Less than $5,000 | 49 (0.5%) | 124 (5.3%) |
| $5,000 to $9,999 | 42 (0.4%) | 110 (4.7%) |
| $10,000 to $14,999 | 25 (0.3%) | 51 (2.2%) |
| $15,000 to $19,999 | 96 (1.0%) | 96 (4.1%) |
| $20,000 to $24,999 | 81 (0.9%) | 38 (1.6%) |
| $25,000 to $34,999 | 197 (2.1%) | 173 (7.4%) |
| $35,000 to $49,999 | 526 (5.7%) | 392 (16.7%) |
| $50,000 to $74,999 | 1,289 (13.8%) | 636 (27.1%) |
| $75,000 to $99,999 | 1,914 (20.5%) | 324 (13.8%) |
| $100,000 to $149,999 | 2,866 (30.8%) | 302 (12.9%) |
| $150,000 or more | 2,227 (23.9%) | 99 (4.2%) |
| Total | 9,312 (100.0%) | 2,345 (100.0%) |
Monthly Housing Cost Tiers in Spanish Fork
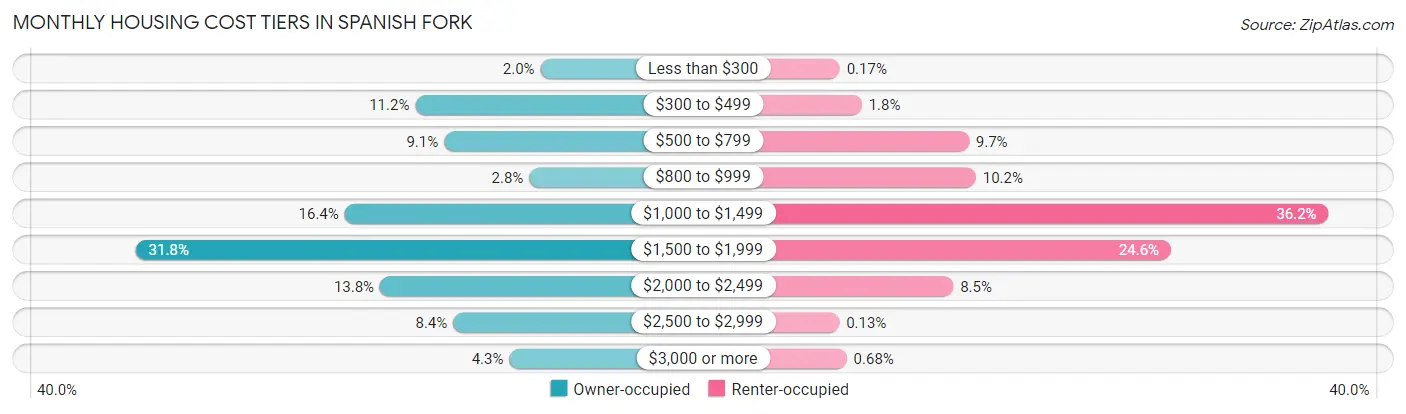
| Monthly Cost | Owner-occupied | Renter-occupied |
| Less than $300 | 187 (2.0%) | 4 (0.2%) |
| $300 to $499 | 1,046 (11.2%) | 42 (1.8%) |
| $500 to $799 | 848 (9.1%) | 227 (9.7%) |
| $800 to $999 | 264 (2.8%) | 239 (10.2%) |
| $1,000 to $1,499 | 1,530 (16.4%) | 848 (36.2%) |
| $1,500 to $1,999 | 2,963 (31.8%) | 576 (24.6%) |
| $2,000 to $2,499 | 1,288 (13.8%) | 200 (8.5%) |
| $2,500 to $2,999 | 786 (8.4%) | 3 (0.1%) |
| $3,000 or more | 400 (4.3%) | 16 (0.7%) |
| Total | 9,312 (100.0%) | 2,345 (100.0%) |
Physical Housing Characteristics in Spanish Fork
Housing Structures in Spanish Fork
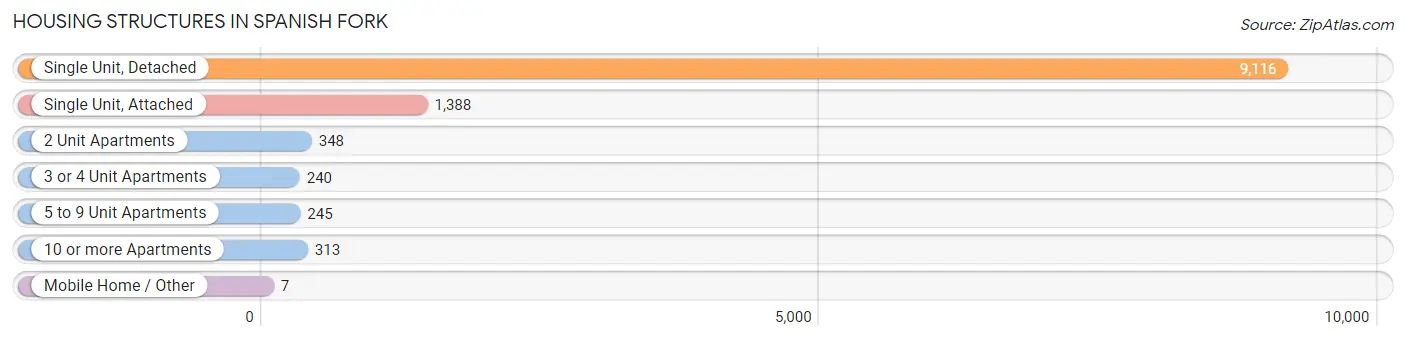
| Structure Type | # Housing Units | % Housing Units |
| Single Unit, Detached | 9,116 | 78.2% |
| Single Unit, Attached | 1,388 | 11.9% |
| 2 Unit Apartments | 348 | 3.0% |
| 3 or 4 Unit Apartments | 240 | 2.1% |
| 5 to 9 Unit Apartments | 245 | 2.1% |
| 10 or more Apartments | 313 | 2.7% |
| Mobile Home / Other | 7 | 0.1% |
| Total | 11,657 | 100.0% |
Housing Structures by Occupancy in Spanish Fork
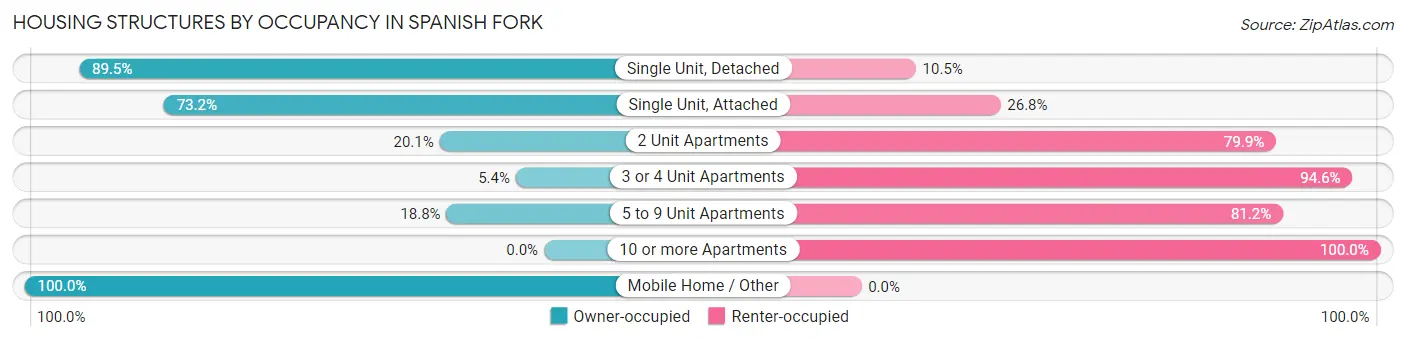
| Structure Type | Owner-occupied | Renter-occupied |
| Single Unit, Detached | 8,160 (89.5%) | 956 (10.5%) |
| Single Unit, Attached | 1,016 (73.2%) | 372 (26.8%) |
| 2 Unit Apartments | 70 (20.1%) | 278 (79.9%) |
| 3 or 4 Unit Apartments | 13 (5.4%) | 227 (94.6%) |
| 5 to 9 Unit Apartments | 46 (18.8%) | 199 (81.2%) |
| 10 or more Apartments | 0 (0.0%) | 313 (100.0%) |
| Mobile Home / Other | 7 (100.0%) | 0 (0.0%) |
| Total | 9,312 (79.9%) | 2,345 (20.1%) |
Housing Structures by Number of Rooms in Spanish Fork
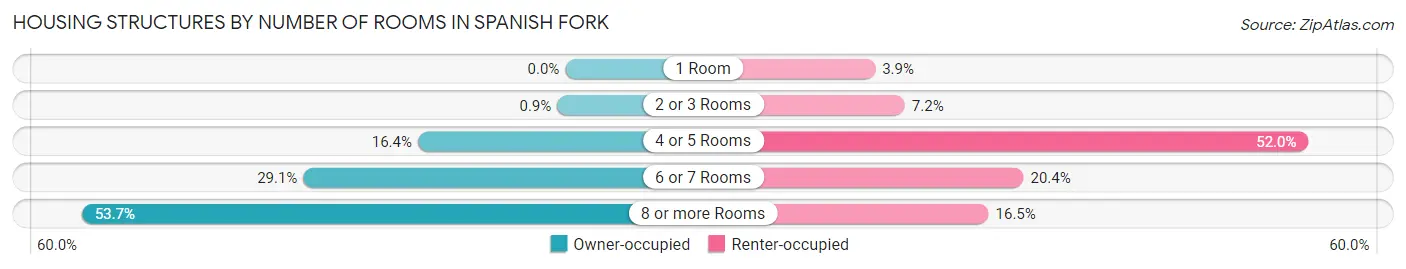
| Number of Rooms | Owner-occupied | Renter-occupied |
| 1 Room | 0 (0.0%) | 92 (3.9%) |
| 2 or 3 Rooms | 84 (0.9%) | 169 (7.2%) |
| 4 or 5 Rooms | 1,523 (16.4%) | 1,219 (52.0%) |
| 6 or 7 Rooms | 2,708 (29.1%) | 478 (20.4%) |
| 8 or more Rooms | 4,997 (53.7%) | 387 (16.5%) |
| Total | 9,312 (100.0%) | 2,345 (100.0%) |
Housing Structure by Heating Type in Spanish Fork
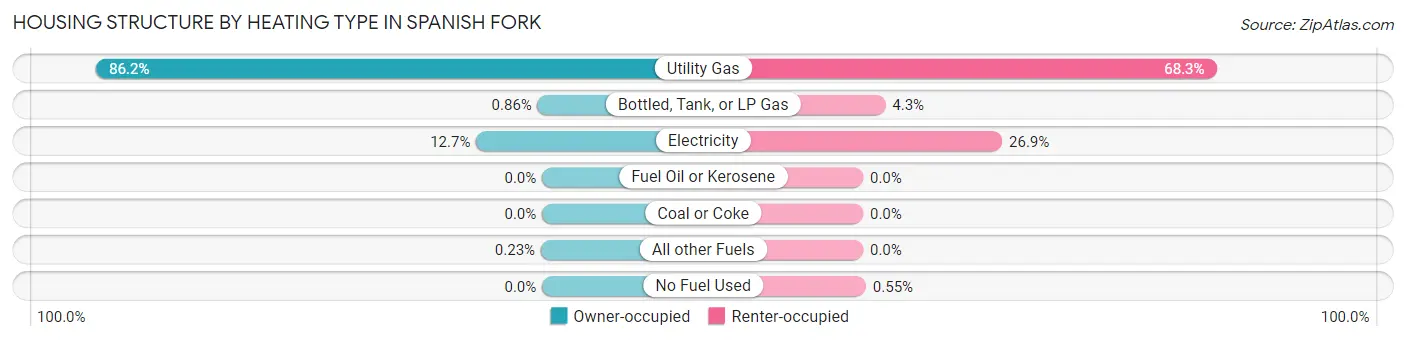
| Heating Type | Owner-occupied | Renter-occupied |
| Utility Gas | 8,026 (86.2%) | 1,601 (68.3%) |
| Bottled, Tank, or LP Gas | 80 (0.9%) | 101 (4.3%) |
| Electricity | 1,185 (12.7%) | 630 (26.9%) |
| Fuel Oil or Kerosene | 0 (0.0%) | 0 (0.0%) |
| Coal or Coke | 0 (0.0%) | 0 (0.0%) |
| All other Fuels | 21 (0.2%) | 0 (0.0%) |
| No Fuel Used | 0 (0.0%) | 13 (0.5%) |
| Total | 9,312 (100.0%) | 2,345 (100.0%) |
Household Vehicle Usage in Spanish Fork
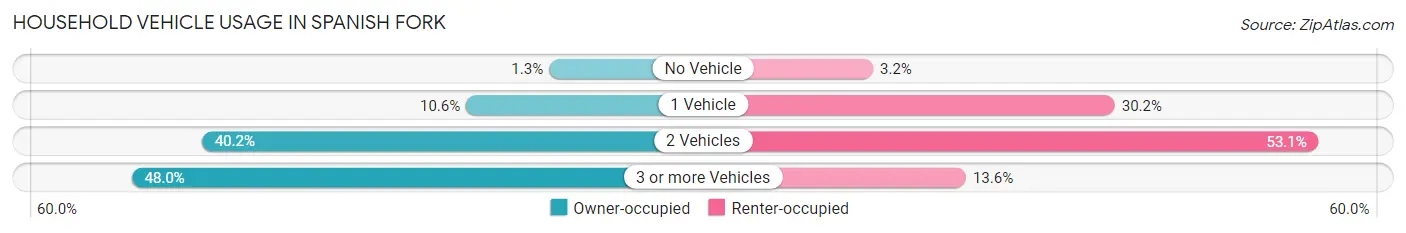
| Vehicles per Household | Owner-occupied | Renter-occupied |
| No Vehicle | 117 (1.3%) | 74 (3.2%) |
| 1 Vehicle | 982 (10.5%) | 709 (30.2%) |
| 2 Vehicles | 3,740 (40.2%) | 1,244 (53.0%) |
| 3 or more Vehicles | 4,473 (48.0%) | 318 (13.6%) |
| Total | 9,312 (100.0%) | 2,345 (100.0%) |
Real Estate & Mortgages in Spanish Fork
Real Estate and Mortgage Overview in Spanish Fork
| Characteristic | Without Mortgage | With Mortgage |
| Housing Units | 2,027 | 7,285 |
| Median Property Value | $387,900 | $406,700 |
| Median Household Income | $89,911 | $1,875 |
| Monthly Housing Costs | $461 | $395 |
| Real Estate Taxes | $1,838 | $252 |
Property Value by Mortgage Status in Spanish Fork
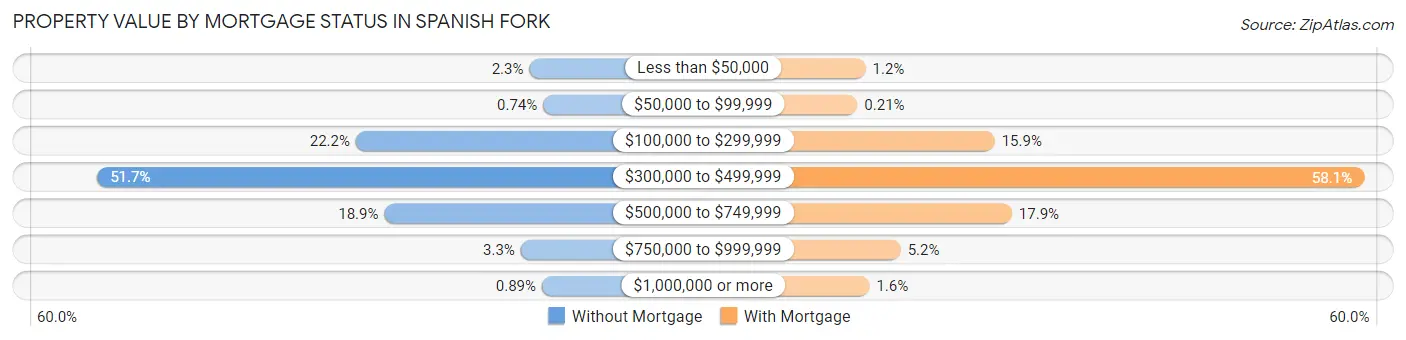
| Property Value | Without Mortgage | With Mortgage |
| Less than $50,000 | 47 (2.3%) | 84 (1.1%) |
| $50,000 to $99,999 | 15 (0.7%) | 15 (0.2%) |
| $100,000 to $299,999 | 449 (22.2%) | 1,159 (15.9%) |
| $300,000 to $499,999 | 1,048 (51.7%) | 4,233 (58.1%) |
| $500,000 to $749,999 | 383 (18.9%) | 1,302 (17.9%) |
| $750,000 to $999,999 | 67 (3.3%) | 376 (5.2%) |
| $1,000,000 or more | 18 (0.9%) | 116 (1.6%) |
| Total | 2,027 (100.0%) | 7,285 (100.0%) |
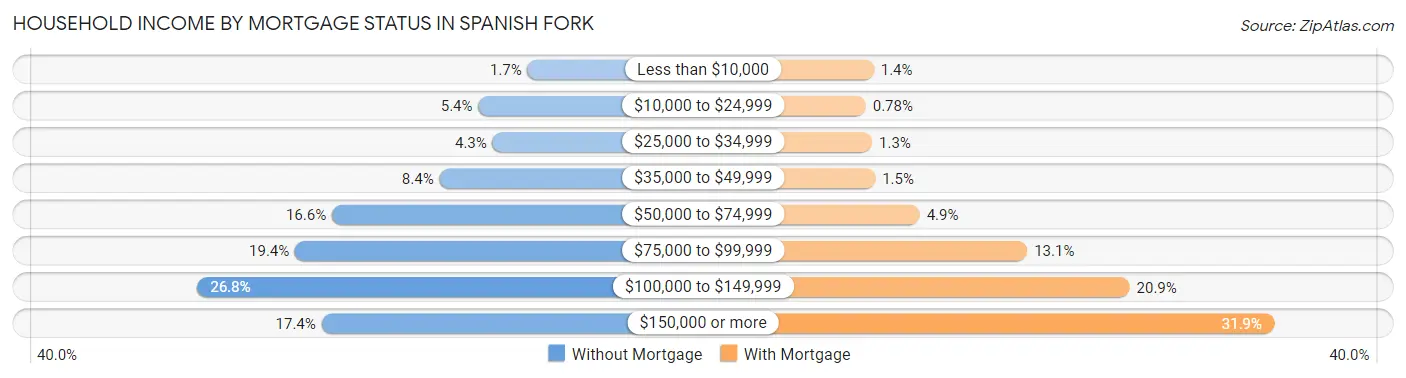
Household Income by Mortgage Status in Spanish Fork
| Household Income | Without Mortgage | With Mortgage |
| Less than $10,000 | 34 (1.7%) | 101 (1.4%) |
| $10,000 to $24,999 | 110 (5.4%) | 57 (0.8%) |
| $25,000 to $34,999 | 88 (4.3%) | 92 (1.3%) |
| $35,000 to $49,999 | 170 (8.4%) | 109 (1.5%) |
| $50,000 to $74,999 | 336 (16.6%) | 356 (4.9%) |
| $75,000 to $99,999 | 393 (19.4%) | 953 (13.1%) |
| $100,000 to $149,999 | 544 (26.8%) | 1,521 (20.9%) |
| $150,000 or more | 352 (17.4%) | 2,322 (31.9%) |
| Total | 2,027 (100.0%) | 7,285 (100.0%) |
Property Value to Household Income Ratio in Spanish Fork
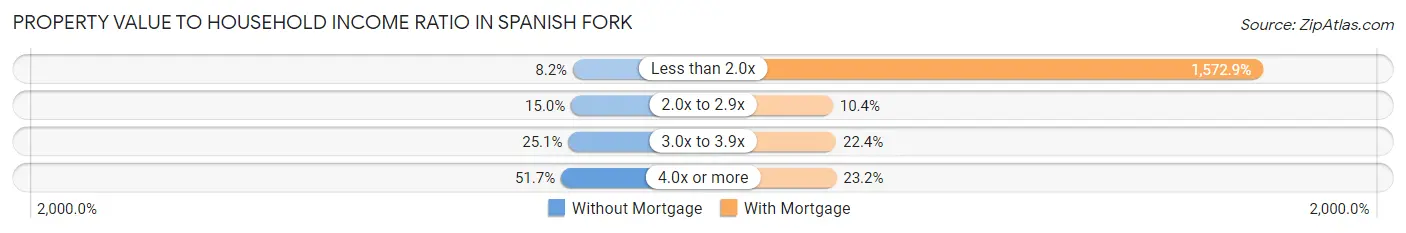
| Value-to-Income Ratio | Without Mortgage | With Mortgage |
| Less than 2.0x | 167 (8.2%) | 114,589 (1,572.9%) |
| 2.0x to 2.9x | 304 (15.0%) | 757 (10.4%) |
| 3.0x to 3.9x | 508 (25.1%) | 1,634 (22.4%) |
| 4.0x or more | 1,048 (51.7%) | 1,691 (23.2%) |
| Total | 2,027 (100.0%) | 7,285 (100.0%) |
Real Estate Taxes by Mortgage Status in Spanish Fork
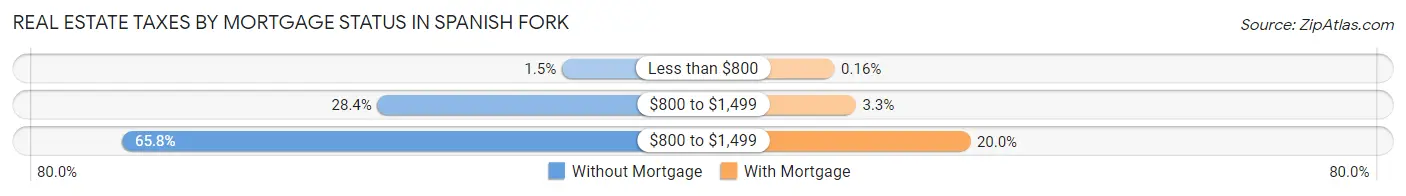
| Property Taxes | Without Mortgage | With Mortgage |
| Less than $800 | 30 (1.5%) | 12 (0.2%) |
| $800 to $1,499 | 576 (28.4%) | 240 (3.3%) |
| $800 to $1,499 | 1,333 (65.8%) | 1,457 (20.0%) |
| Total | 2,027 (100.0%) | 7,285 (100.0%) |
Health & Disability in Spanish Fork
Health Insurance Coverage by Age in Spanish Fork
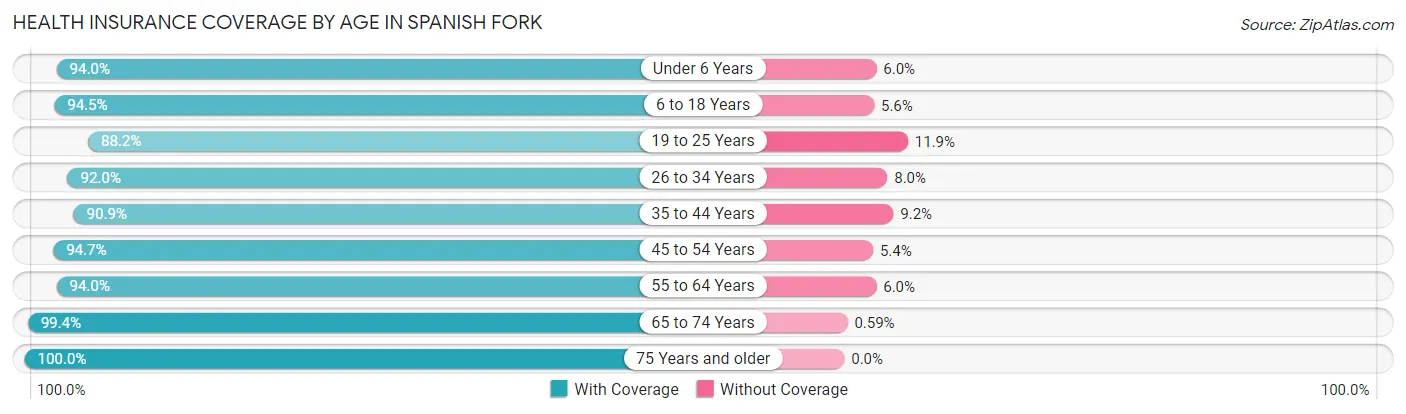
| Age Bracket | With Coverage | Without Coverage |
| Under 6 Years | 5,014 (94.0%) | 319 (6.0%) |
| 6 to 18 Years | 10,268 (94.5%) | 603 (5.6%) |
| 19 to 25 Years | 3,735 (88.1%) | 502 (11.8%) |
| 26 to 34 Years | 4,711 (92.0%) | 411 (8.0%) |
| 35 to 44 Years | 5,551 (90.8%) | 559 (9.1%) |
| 45 to 54 Years | 3,772 (94.7%) | 213 (5.3%) |
| 55 to 64 Years | 2,761 (94.0%) | 175 (6.0%) |
| 65 to 74 Years | 2,208 (99.4%) | 13 (0.6%) |
| 75 Years and older | 1,320 (100.0%) | 0 (0.0%) |
| Total | 39,340 (93.4%) | 2,795 (6.6%) |
Health Insurance Coverage by Citizenship Status in Spanish Fork
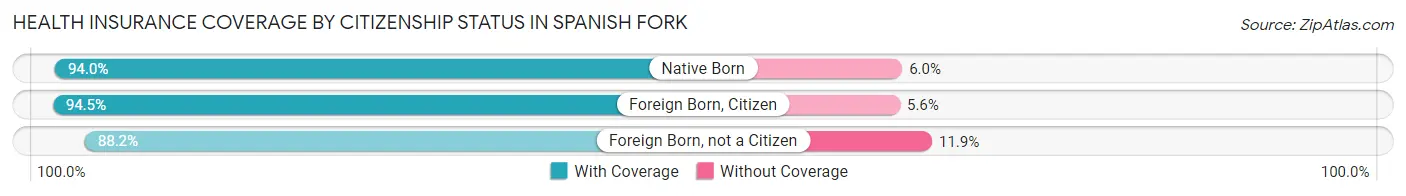
| Citizenship Status | With Coverage | Without Coverage |
| Native Born | 5,014 (94.0%) | 319 (6.0%) |
| Foreign Born, Citizen | 10,268 (94.5%) | 603 (5.6%) |
| Foreign Born, not a Citizen | 3,735 (88.1%) | 502 (11.8%) |
Health Insurance Coverage by Household Income in Spanish Fork
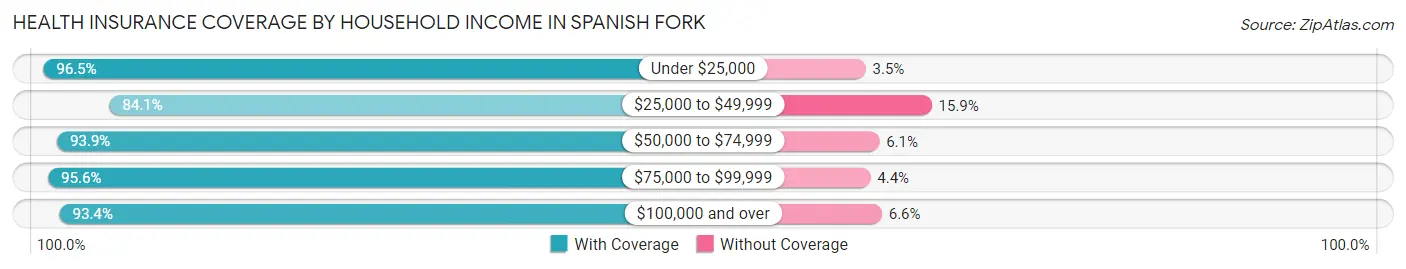
| Household Income | With Coverage | Without Coverage |
| Under $25,000 | 1,779 (96.5%) | 65 (3.5%) |
| $25,000 to $49,999 | 2,499 (84.1%) | 472 (15.9%) |
| $50,000 to $74,999 | 5,792 (93.9%) | 374 (6.1%) |
| $75,000 to $99,999 | 7,296 (95.6%) | 337 (4.4%) |
| $100,000 and over | 21,914 (93.4%) | 1,539 (6.6%) |
Public vs Private Health Insurance Coverage by Age in Spanish Fork
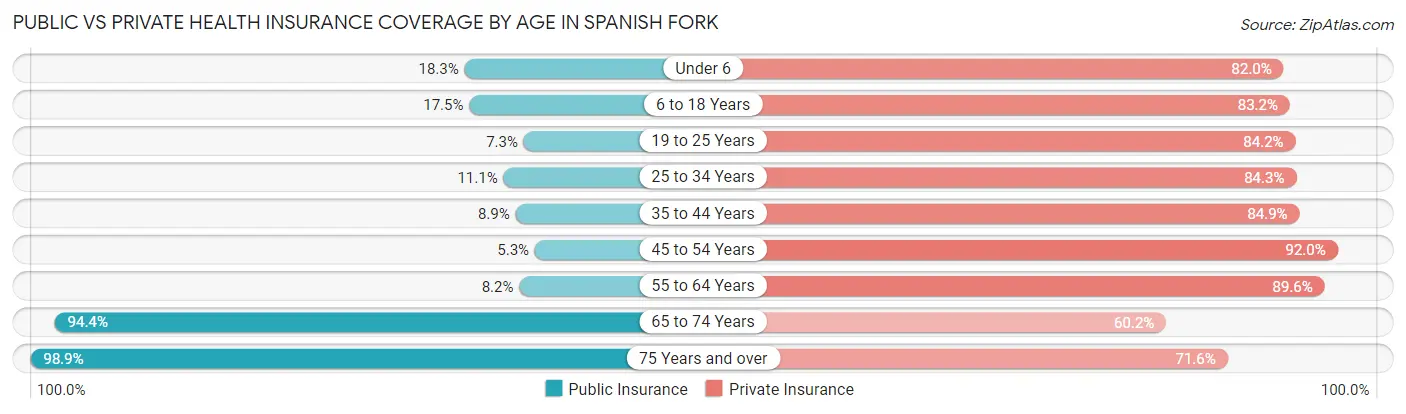
| Age Bracket | Public Insurance | Private Insurance |
| Under 6 | 978 (18.3%) | 4,373 (82.0%) |
| 6 to 18 Years | 1,898 (17.5%) | 9,039 (83.2%) |
| 19 to 25 Years | 311 (7.3%) | 3,567 (84.2%) |
| 25 to 34 Years | 569 (11.1%) | 4,320 (84.3%) |
| 35 to 44 Years | 542 (8.9%) | 5,190 (84.9%) |
| 45 to 54 Years | 210 (5.3%) | 3,667 (92.0%) |
| 55 to 64 Years | 240 (8.2%) | 2,631 (89.6%) |
| 65 to 74 Years | 2,097 (94.4%) | 1,337 (60.2%) |
| 75 Years and over | 1,306 (98.9%) | 945 (71.6%) |
| Total | 8,151 (19.3%) | 35,069 (83.2%) |
Disability Status by Sex by Age in Spanish Fork
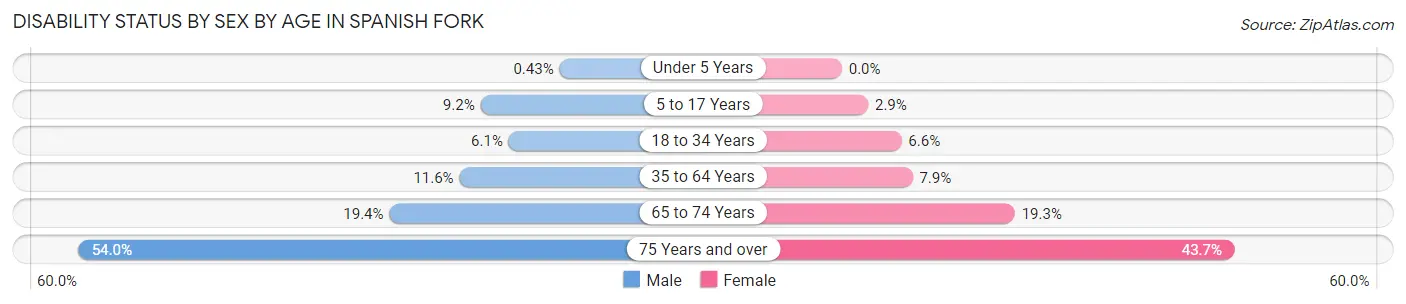
| Age Bracket | Male | Female |
| Under 5 Years | 9 (0.4%) | 0 (0.0%) |
| 5 to 17 Years | 496 (9.2%) | 157 (2.9%) |
| 18 to 34 Years | 319 (6.1%) | 346 (6.6%) |
| 35 to 64 Years | 799 (11.6%) | 482 (7.9%) |
| 65 to 74 Years | 206 (19.4%) | 223 (19.3%) |
| 75 Years and over | 313 (54.0%) | 323 (43.6%) |
Disability Class by Sex by Age in Spanish Fork
Disability Class: Hearing Difficulty
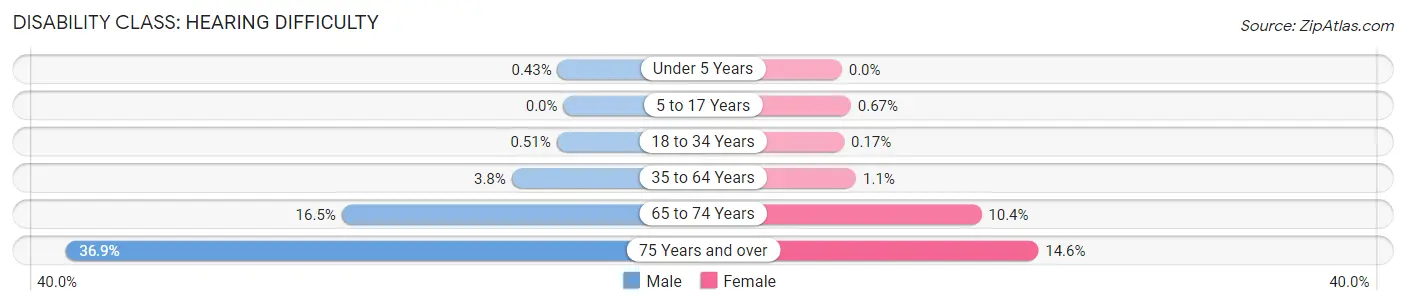
| Age Bracket | Male | Female |
| Under 5 Years | 9 (0.4%) | 0 (0.0%) |
| 5 to 17 Years | 0 (0.0%) | 36 (0.7%) |
| 18 to 34 Years | 27 (0.5%) | 9 (0.2%) |
| 35 to 64 Years | 265 (3.8%) | 65 (1.1%) |
| 65 to 74 Years | 175 (16.5%) | 120 (10.4%) |
| 75 Years and over | 214 (36.9%) | 108 (14.6%) |
Disability Class: Vision Difficulty
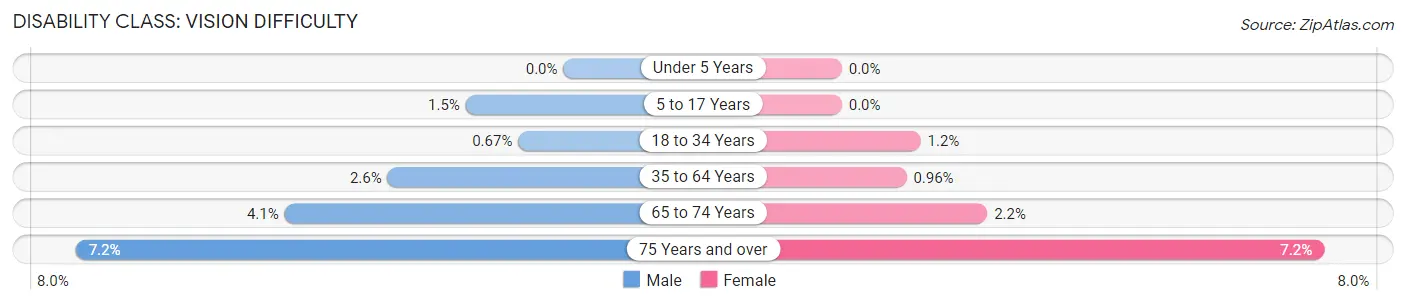
| Age Bracket | Male | Female |
| Under 5 Years | 0 (0.0%) | 0 (0.0%) |
| 5 to 17 Years | 78 (1.5%) | 0 (0.0%) |
| 18 to 34 Years | 35 (0.7%) | 61 (1.2%) |
| 35 to 64 Years | 180 (2.6%) | 59 (1.0%) |
| 65 to 74 Years | 44 (4.1%) | 25 (2.2%) |
| 75 Years and over | 42 (7.2%) | 53 (7.2%) |
Disability Class: Cognitive Difficulty
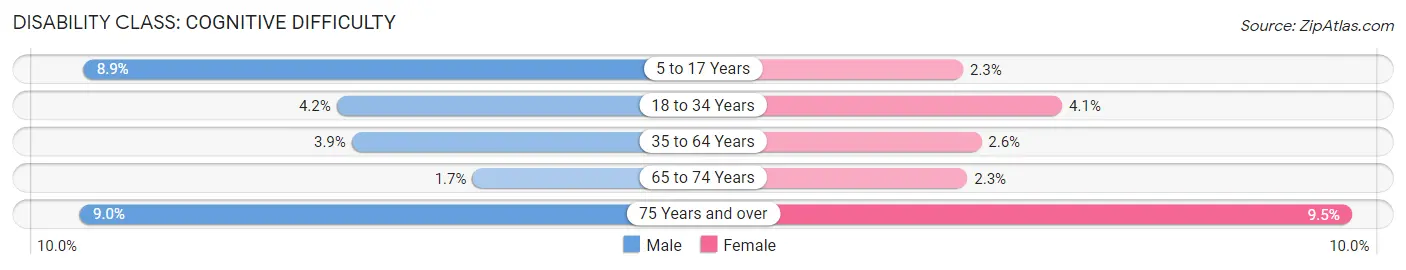
| Age Bracket | Male | Female |
| 5 to 17 Years | 478 (8.9%) | 121 (2.2%) |
| 18 to 34 Years | 221 (4.2%) | 213 (4.1%) |
| 35 to 64 Years | 271 (3.9%) | 159 (2.6%) |
| 65 to 74 Years | 18 (1.7%) | 27 (2.3%) |
| 75 Years and over | 52 (9.0%) | 70 (9.5%) |
Disability Class: Ambulatory Difficulty
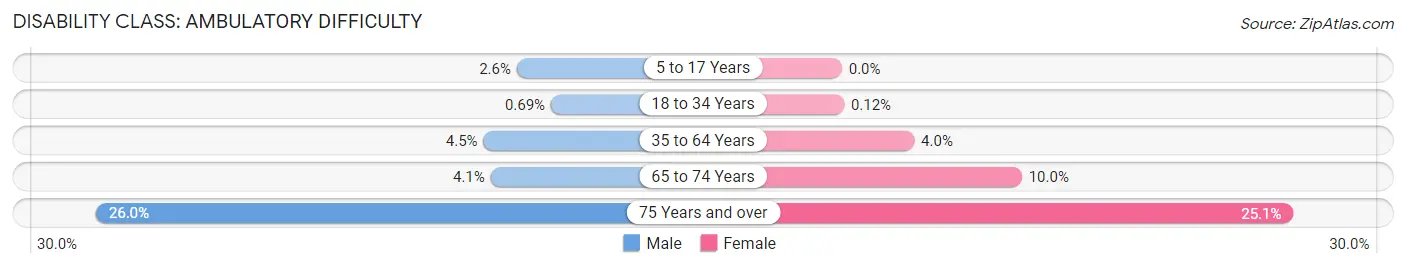
| Age Bracket | Male | Female |
| 5 to 17 Years | 139 (2.6%) | 0 (0.0%) |
| 18 to 34 Years | 36 (0.7%) | 6 (0.1%) |
| 35 to 64 Years | 307 (4.4%) | 247 (4.0%) |
| 65 to 74 Years | 43 (4.1%) | 116 (10.0%) |
| 75 Years and over | 151 (26.0%) | 186 (25.1%) |
Disability Class: Self-Care Difficulty
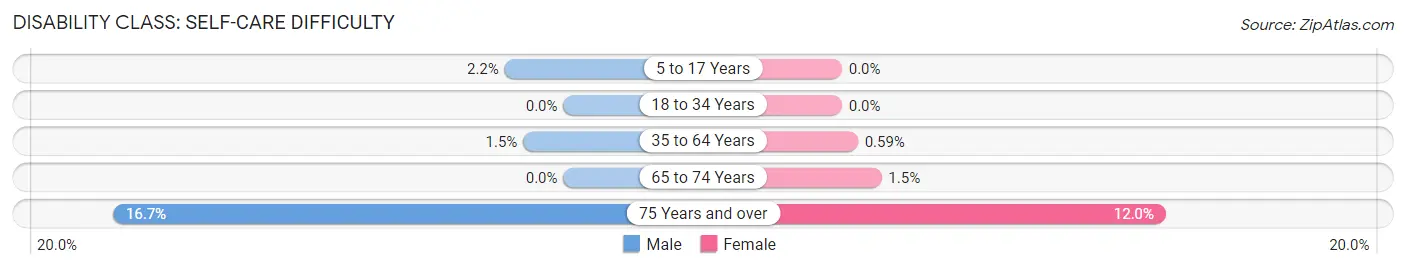
| Age Bracket | Male | Female |
| 5 to 17 Years | 117 (2.2%) | 0 (0.0%) |
| 18 to 34 Years | 0 (0.0%) | 0 (0.0%) |
| 35 to 64 Years | 103 (1.5%) | 36 (0.6%) |
| 65 to 74 Years | 0 (0.0%) | 17 (1.5%) |
| 75 Years and over | 97 (16.7%) | 89 (12.0%) |
Technology Access in Spanish Fork
Computing Device Access in Spanish Fork
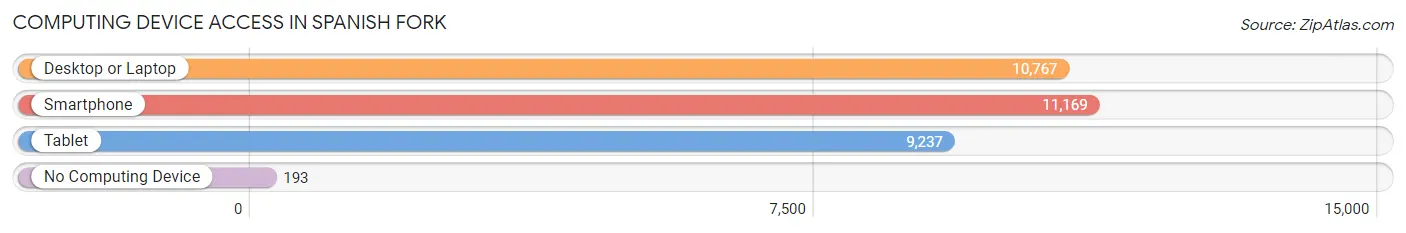
| Device Type | # Households | % Households |
| Desktop or Laptop | 10,767 | 92.4% |
| Smartphone | 11,169 | 95.8% |
| Tablet | 9,237 | 79.2% |
| No Computing Device | 193 | 1.7% |
| Total | 11,657 | 100.0% |
Internet Access in Spanish Fork
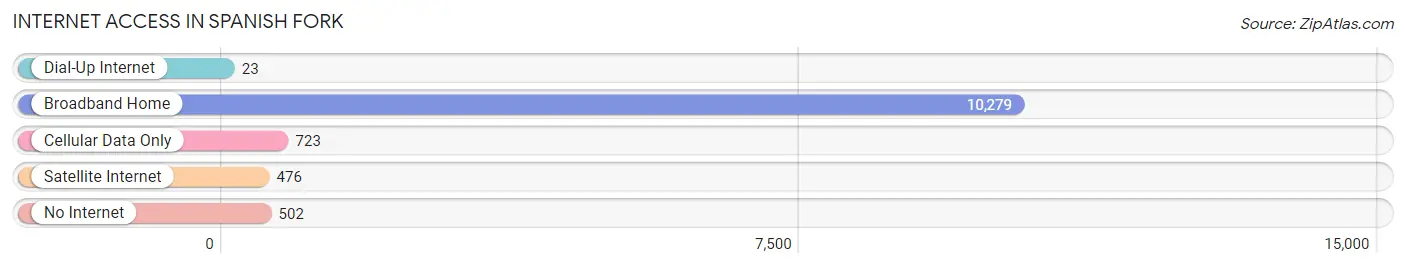
| Internet Type | # Households | % Households |
| Dial-Up Internet | 23 | 0.2% |
| Broadband Home | 10,279 | 88.2% |
| Cellular Data Only | 723 | 6.2% |
| Satellite Internet | 476 | 4.1% |
| No Internet | 502 | 4.3% |
| Total | 11,657 | 100.0% |
Spanish Fork Summary
History
The area now known as Spanish Fork, Utah was first settled in 1851 by a group of Mormon pioneers led by William Pace. The pioneers were sent by Brigham Young to establish a settlement in the area, which was then part of the Utah Territory. The settlement was named after the Spanish Fork River, which runs through the area.
The settlement quickly grew and by 1852, the population had grown to over 500 people. The settlers built a fort to protect themselves from Native American attacks and to provide a place for the community to gather. The fort was named Fort Santaquin, after the nearby Santaquin Peak.
In 1855, the first school in the area was established. The school was called the Spanish Fork Academy and it was the first school in the area to offer a high school education.
In 1877, the Utah Southern Railroad was built through the area, connecting Spanish Fork to Salt Lake City. This allowed for the growth of the local economy and the population of the town began to grow rapidly.
By 1900, the population of Spanish Fork had grown to over 1,000 people. The town was incorporated in 1904 and the first mayor was elected in 1906.
In the early 1900s, the town began to grow rapidly. The population had grown to over 2,000 people by 1910 and to over 5,000 people by 1920. The town was a major agricultural center and was known for its production of sugar beets, potatoes, and other crops.
In the 1950s, the town began to experience a population boom. The population had grown to over 10,000 people by 1960 and to over 20,000 people by 1970. The town was now a major center for manufacturing and industry.
Geography
Spanish Fork is located in the central part of Utah, in the foothills of the Wasatch Mountains. The town is situated at an elevation of 4,500 feet and is located about 40 miles south of Salt Lake City.
The town is located in a valley surrounded by mountains. The Spanish Fork River runs through the town and is a major source of water for the area.
The climate in Spanish Fork is semi-arid, with hot summers and cold winters. The average annual temperature is around 50 degrees Fahrenheit.
Economy
The economy of Spanish Fork is largely based on agriculture and manufacturing. The town is home to several large agricultural companies, including the Spanish Fork Sugar Company and the Spanish Fork Potato Company.
The town is also home to several large manufacturing companies, including the Spanish Fork Manufacturing Company and the Spanish Fork Textile Company.
The town is also home to several retail stores restaurants and other businesses
Demographics
As of the 2010 census, the population of Spanish Fork was 33,666. The population is largely white (90.2%) and Hispanic (7.2%). The median household income is $60,945 and the median home value is $219,400.
The town is home to several churches, including the Church of Jesus Christ of Latter-day Saints, the Catholic Church, and the Spanish Fork Baptist Church. The town is also home to several schools, including Spanish Fork High School, Spanish Fork Junior High School, and Spanish Fork Elementary School.
Common Questions
What is the Total Population of Spanish Fork?
Total Population of Spanish Fork is 42,694.
What is the Total Male Population of Spanish Fork?
Total Male Population of Spanish Fork is 21,662.
What is the Total Female Population of Spanish Fork?
Total Female Population of Spanish Fork is 21,032.
What is the Ratio of Males per 100 Females in Spanish Fork?
There are 103.00 Males per 100 Females in Spanish Fork.
What is the Ratio of Females per 100 Males in Spanish Fork?
There are 97.09 Females per 100 Males in Spanish Fork.
What is the Median Population Age in Spanish Fork?
Median Population Age in Spanish Fork is 27.4 Years.
What is the Average Family Size in Spanish Fork
Average Family Size in Spanish Fork is 3.9 People.
What is the Average Household Size in Spanish Fork
Average Household Size in Spanish Fork is 3.6 People.
What is Per Capita Income in Spanish Fork?
Per Capita income in Spanish Fork is $30,832.
What is the Median Family Income in Spanish Fork?
Median Family Income in Spanish Fork is $102,514.
What is the Median Household income in Spanish Fork?
Median Household Income in Spanish Fork is $93,989.
What is Income or Wage Gap in Spanish Fork?
Income or Wage Gap in Spanish Fork is 52.4%.
Women in Spanish Fork earn 47.6 cents for every dollar earned by a man.
What is Family Income Deficit in Spanish Fork?
Family Income Deficit in Spanish Fork is $13,688.
Families that are below poverty line in Spanish Fork earn $13,688 less on average than the poverty threshold level.
What is Inequality or Gini Index in Spanish Fork?
Inequality or Gini Index in Spanish Fork is 0.35.
How Large is the Labor Force in Spanish Fork?
There are 20,933 People in the Labor Forcein in Spanish Fork.
What is the Percentage of People in the Labor Force in Spanish Fork?
71.5% of People are in the Labor Force in Spanish Fork.
What is the Unemployment Rate in Spanish Fork?
Unemployment Rate in Spanish Fork is 1.9%.