Morgan, UT
Morgan Map
Morgan Overview
4,173
TOTAL POPULATION
2,127
MALE POPULATION
2,046
FEMALE POPULATION
103.96
MALES / 100 FEMALES
96.19
FEMALES / 100 MALES
28.4
MEDIAN AGE
4.0
AVG FAMILY SIZE
3.7
AVG HOUSEHOLD SIZE
$35,722
PER CAPITA INCOME
$116,875
AVG FAMILY INCOME
$112,232
AVG HOUSEHOLD INCOME
68.0%
WAGE / INCOME GAP [ % ]
32.0¢/ $1
WAGE / INCOME GAP [ $ ]
0.38
INEQUALITY / GINI INDEX
1,914
LABOR FORCE [ PEOPLE ]
68.7%
PERCENT IN LABOR FORCE
2.7%
UNEMPLOYMENT RATE
Morgan Zip Codes
Morgan Area Codes
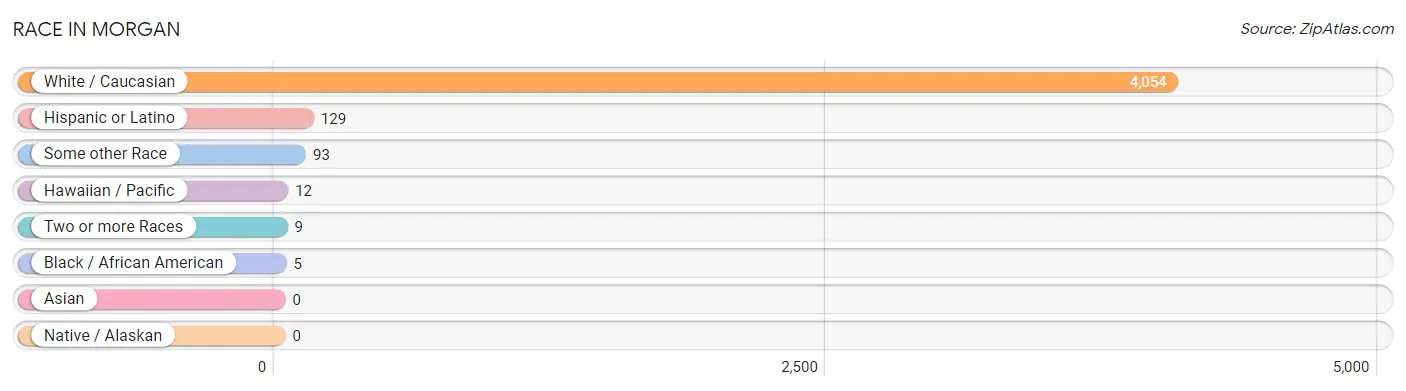
Race in Morgan
The most populous races in Morgan are White / Caucasian (4,054 | 97.2%), Hispanic or Latino (129 | 3.1%), and Some other Race (93 | 2.2%).
| Race | # Population | % Population |
| Asian | 0 | 0.0% |
| Black / African American | 5 | 0.1% |
| Hawaiian / Pacific | 12 | 0.3% |
| Hispanic or Latino | 129 | 3.1% |
| Native / Alaskan | 0 | 0.0% |
| White / Caucasian | 4,054 | 97.2% |
| Two or more Races | 9 | 0.2% |
| Some other Race | 93 | 2.2% |
| Total | 4,173 | 100.0% |
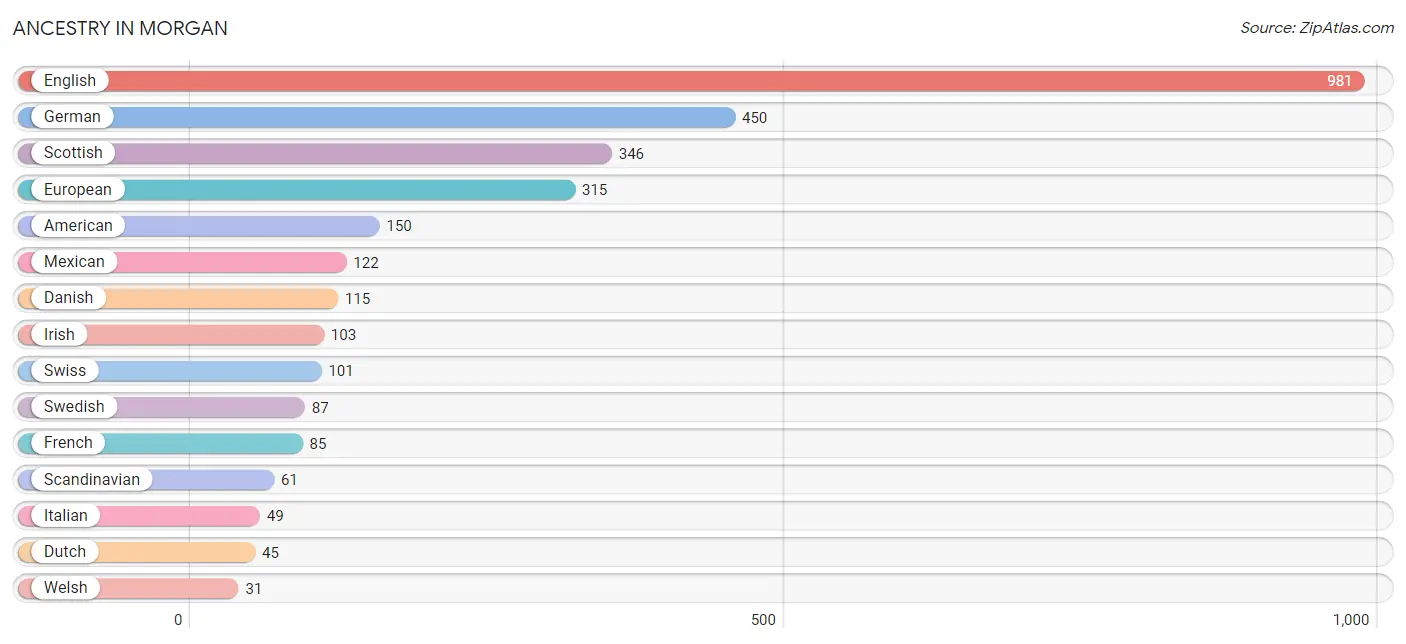
Ancestry in Morgan
The most populous ancestries reported in Morgan are English (981 | 23.5%), German (450 | 10.8%), Scottish (346 | 8.3%), European (315 | 7.5%), and American (150 | 3.6%), together accounting for 53.7% of all Morgan residents.
| Ancestry | # Population | % Population |
| American | 150 | 3.6% |
| British | 14 | 0.3% |
| Czech | 5 | 0.1% |
| Czechoslovakian | 5 | 0.1% |
| Danish | 115 | 2.8% |
| Dutch | 45 | 1.1% |
| English | 981 | 23.5% |
| European | 315 | 7.5% |
| Fijian | 5 | 0.1% |
| French | 85 | 2.0% |
| German | 450 | 10.8% |
| Guamanian / Chamorro | 7 | 0.2% |
| Irish | 103 | 2.5% |
| Italian | 49 | 1.2% |
| Mexican | 122 | 2.9% |
| Northern European | 17 | 0.4% |
| Norwegian | 29 | 0.7% |
| Polish | 22 | 0.5% |
| Portuguese | 9 | 0.2% |
| Scandinavian | 61 | 1.5% |
| Scotch-Irish | 1 | 0.0% |
| Scottish | 346 | 8.3% |
| Spanish | 7 | 0.2% |
| Swedish | 87 | 2.1% |
| Swiss | 101 | 2.4% |
| Welsh | 31 | 0.7% | View All 26 Rows |
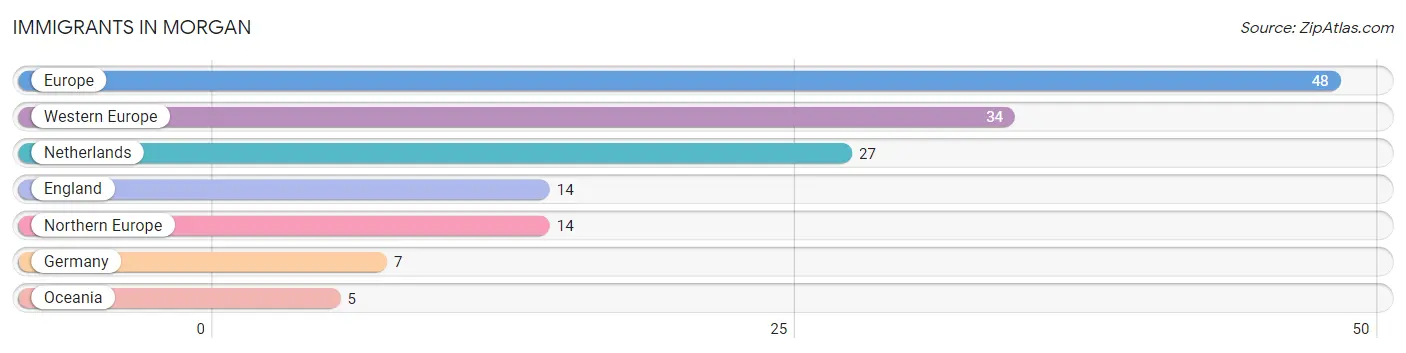
Immigrants in Morgan
The most numerous immigrant groups reported in Morgan came from Europe (48 | 1.1%), Western Europe (34 | 0.8%), Netherlands (27 | 0.6%), England (14 | 0.3%), and Northern Europe (14 | 0.3%), together accounting for 3.3% of all Morgan residents.
| Immigration Origin | # Population | % Population |
| England | 14 | 0.3% |
| Europe | 48 | 1.1% |
| Germany | 7 | 0.2% |
| Netherlands | 27 | 0.6% |
| Northern Europe | 14 | 0.3% |
| Oceania | 5 | 0.1% |
| Western Europe | 34 | 0.8% | View All 7 Rows |
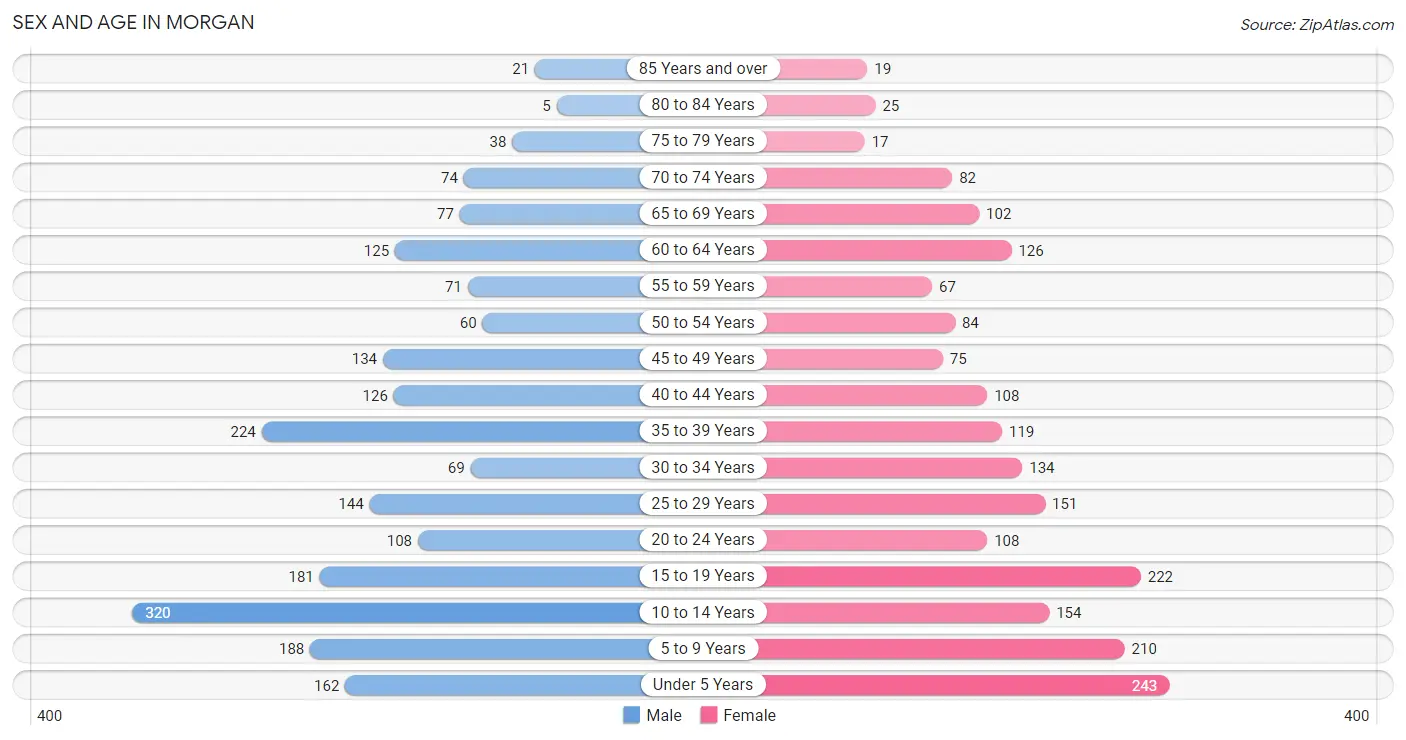
Sex and Age in Morgan
Sex and Age in Morgan
The most populous age groups in Morgan are 10 to 14 Years (320 | 15.0%) for men and Under 5 Years (243 | 11.9%) for women.
| Age Bracket | Male | Female |
| Under 5 Years | 162 (7.6%) | 243 (11.9%) |
| 5 to 9 Years | 188 (8.8%) | 210 (10.3%) |
| 10 to 14 Years | 320 (15.0%) | 154 (7.5%) |
| 15 to 19 Years | 181 (8.5%) | 222 (10.8%) |
| 20 to 24 Years | 108 (5.1%) | 108 (5.3%) |
| 25 to 29 Years | 144 (6.8%) | 151 (7.4%) |
| 30 to 34 Years | 69 (3.2%) | 134 (6.6%) |
| 35 to 39 Years | 224 (10.5%) | 119 (5.8%) |
| 40 to 44 Years | 126 (5.9%) | 108 (5.3%) |
| 45 to 49 Years | 134 (6.3%) | 75 (3.7%) |
| 50 to 54 Years | 60 (2.8%) | 84 (4.1%) |
| 55 to 59 Years | 71 (3.3%) | 67 (3.3%) |
| 60 to 64 Years | 125 (5.9%) | 126 (6.2%) |
| 65 to 69 Years | 77 (3.6%) | 102 (5.0%) |
| 70 to 74 Years | 74 (3.5%) | 82 (4.0%) |
| 75 to 79 Years | 38 (1.8%) | 17 (0.8%) |
| 80 to 84 Years | 5 (0.2%) | 25 (1.2%) |
| 85 Years and over | 21 (1.0%) | 19 (0.9%) |
| Total | 2,127 (100.0%) | 2,046 (100.0%) |
Families and Households in Morgan
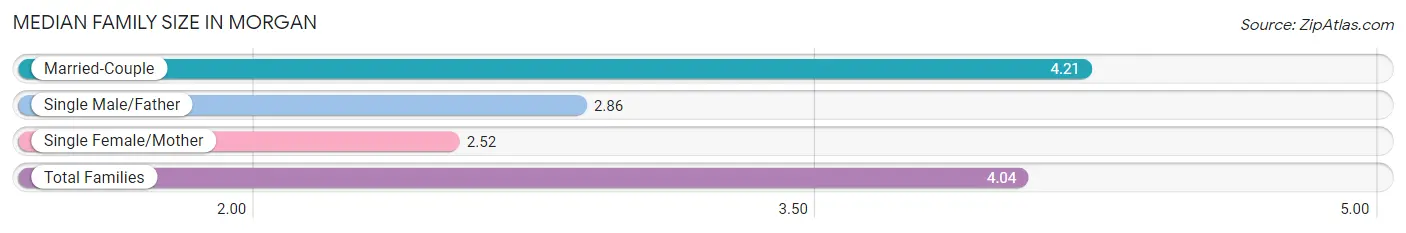
Median Family Size in Morgan
The median family size in Morgan is 4.04 persons per family, with married-couple families (890 | 89.4%) accounting for the largest median family size of 4.21 persons per family. On the other hand, single female/mother families (77 | 7.7%) represent the smallest median family size with 2.52 persons per family.
| Family Type | # Families | Family Size |
| Married-Couple | 890 (89.4%) | 4.21 |
| Single Male/Father | 29 (2.9%) | 2.86 |
| Single Female/Mother | 77 (7.7%) | 2.52 |
| Total Families | 996 (100.0%) | 4.04 |
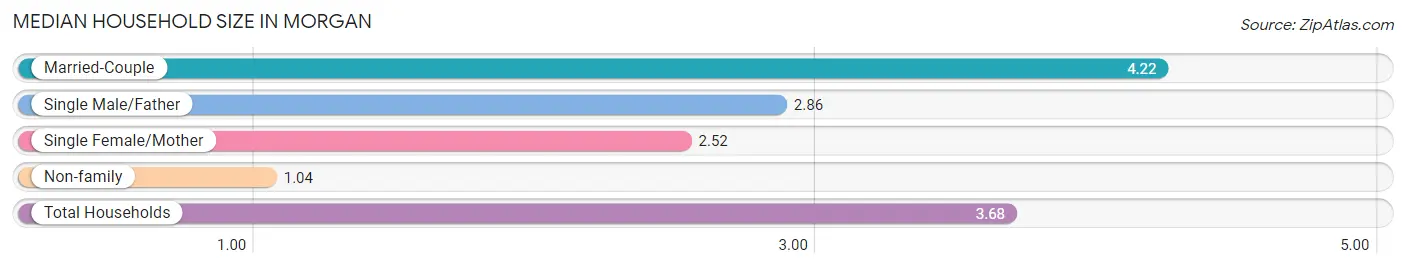
Median Household Size in Morgan
The median household size in Morgan is 3.68 persons per household, with married-couple households (890 | 78.5%) accounting for the largest median household size of 4.22 persons per household. non-family households (137 | 12.1%) represent the smallest median household size with 1.04 persons per household.
| Household Type | # Households | Household Size |
| Married-Couple | 890 (78.5%) | 4.22 |
| Single Male/Father | 29 (2.6%) | 2.86 |
| Single Female/Mother | 77 (6.8%) | 2.52 |
| Non-family | 137 (12.1%) | 1.04 |
| Total Households | 1,133 (100.0%) | 3.68 |
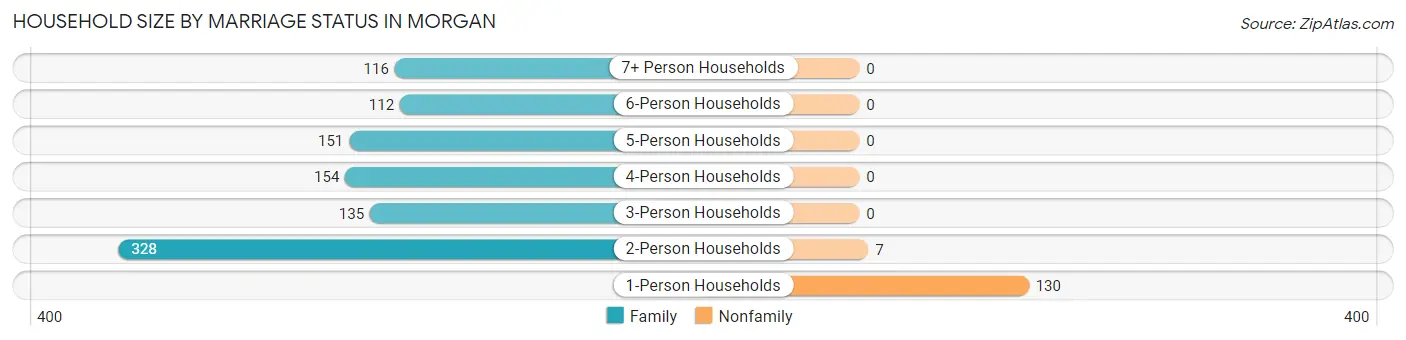
Household Size by Marriage Status in Morgan
Out of a total of 1,133 households in Morgan, 996 (87.9%) are family households, while 137 (12.1%) are nonfamily households. The most numerous type of family households are 2-person households, comprising 328, and the most common type of nonfamily households are 1-person households, comprising 130.
| Household Size | Family Households | Nonfamily Households |
| 1-Person Households | - | 130 (11.5%) |
| 2-Person Households | 328 (28.9%) | 7 (0.6%) |
| 3-Person Households | 135 (11.9%) | 0 (0.0%) |
| 4-Person Households | 154 (13.6%) | 0 (0.0%) |
| 5-Person Households | 151 (13.3%) | 0 (0.0%) |
| 6-Person Households | 112 (9.9%) | 0 (0.0%) |
| 7+ Person Households | 116 (10.2%) | 0 (0.0%) |
| Total | 996 (87.9%) | 137 (12.1%) |
Female Fertility in Morgan
Fertility by Age in Morgan
Average fertility rate in Morgan is 140.0 births per 1,000 women. Women in the age bracket of 20 to 34 years have the highest fertility rate with 265.0 births per 1,000 women. Women in the age bracket of 20 to 34 years acount for 78.8% of all women with births.
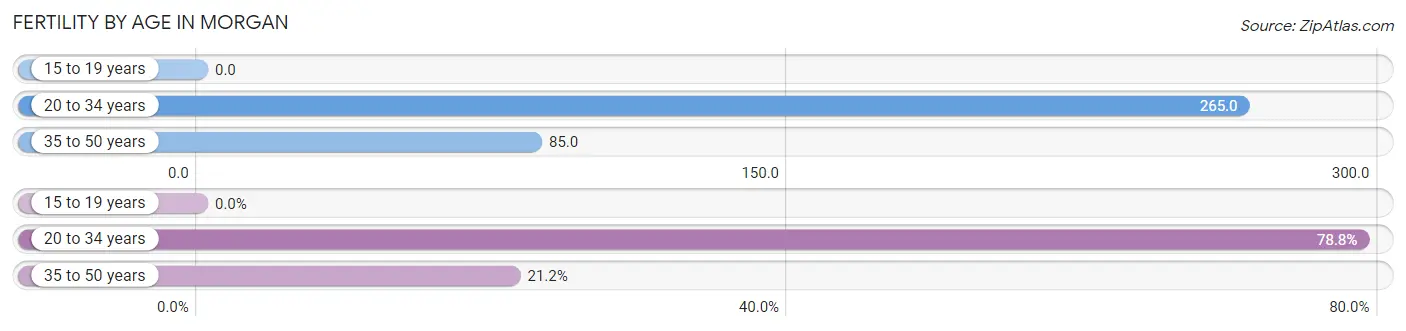
| Age Bracket | Women with Births | Births / 1,000 Women |
| 15 to 19 years | 0 (0.0%) | 0.0 |
| 20 to 34 years | 104 (78.8%) | 265.0 |
| 35 to 50 years | 28 (21.2%) | 85.0 |
| Total | 132 (100.0%) | 140.0 |
Fertility by Age by Marriage Status in Morgan
95.5% of women with births (132) in Morgan are married. The highest percentage of unmarried women with births falls into 20 to 34 years age bracket with 5.8% of them unmarried at the time of birth, while the lowest percentage of unmarried women with births belong to 35 to 50 years age bracket with 0.0% of them unmarried.
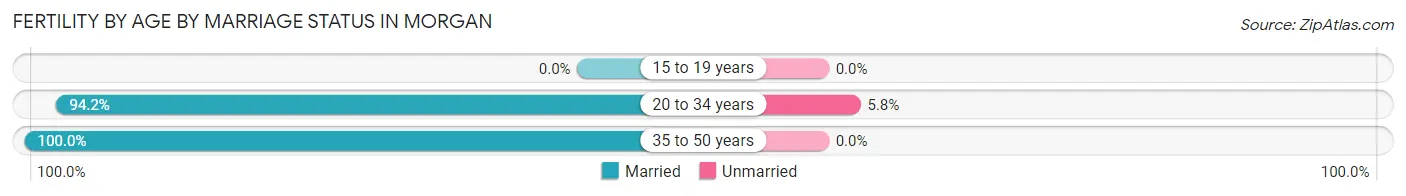
| Age Bracket | Married | Unmarried |
| 15 to 19 years | 0 (0.0%) | 0 (0.0%) |
| 20 to 34 years | 98 (94.2%) | 6 (5.8%) |
| 35 to 50 years | 28 (100.0%) | 0 (0.0%) |
| Total | 126 (95.5%) | 6 (4.5%) |
Fertility by Education in Morgan
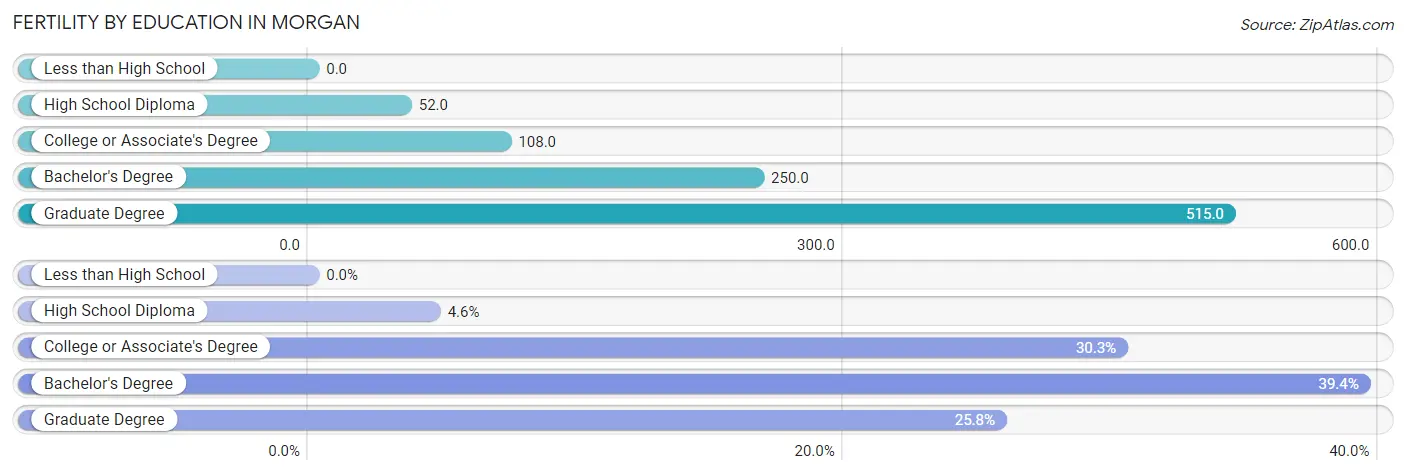
| Educational Attainment | Women with Births | Births / 1,000 Women |
| Less than High School | 0 (0.0%) | 0.0 |
| High School Diploma | 6 (4.5%) | 52.0 |
| College or Associate's Degree | 40 (30.3%) | 108.0 |
| Bachelor's Degree | 52 (39.4%) | 250.0 |
| Graduate Degree | 34 (25.8%) | 515.0 |
| Total | 132 (100.0%) | 140.0 |
Fertility by Education by Marriage Status in Morgan
4.5% of women with births in Morgan are unmarried. Women with the educational attainment of college or associate's degree are most likely to be married with 100.0% of them married at childbirth, while women with the educational attainment of high school diploma are least likely to be married with 100.0% of them unmarried at childbirth.
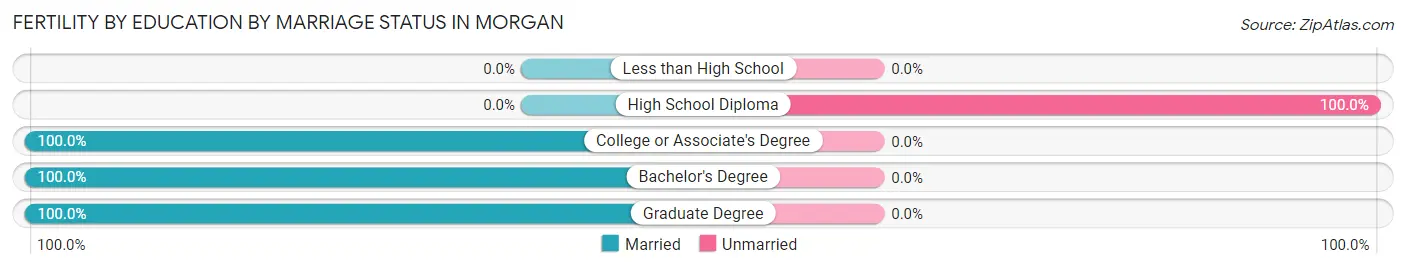
| Educational Attainment | Married | Unmarried |
| Less than High School | 0 (0.0%) | 0 (0.0%) |
| High School Diploma | 0 (0.0%) | 6 (100.0%) |
| College or Associate's Degree | 40 (100.0%) | 0 (0.0%) |
| Bachelor's Degree | 52 (100.0%) | 0 (0.0%) |
| Graduate Degree | 34 (100.0%) | 0 (0.0%) |
| Total | 126 (95.5%) | 6 (4.5%) |
Income in Morgan
Income Overview in Morgan
Per Capita Income in Morgan is $35,722, while median incomes of families and households are $116,875 and $112,232 respectively.
| Characteristic | Number | Measure |
| Per Capita Income | 4,173 | $35,722 |
| Median Family Income | 996 | $116,875 |
| Mean Family Income | 996 | $140,191 |
| Median Household Income | 1,133 | $112,232 |
| Mean Household Income | 1,133 | $128,559 |
| Income Deficit | 996 | $0 |
| Wage / Income Gap (%) | 4,173 | 67.98% |
| Wage / Income Gap ($) | 4,173 | 32.02¢ per $1 |
| Gini / Inequality Index | 4,173 | 0.38 |
Earnings by Sex in Morgan
Average Earnings in Morgan are $51,940, $70,551 for men and $22,593 for women, a difference of 68.0%.
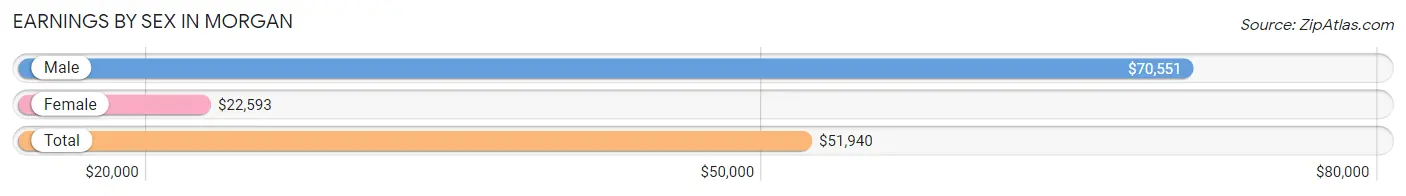
| Sex | Number | Average Earnings |
| Male | 1,091 (54.5%) | $70,551 |
| Female | 910 (45.5%) | $22,593 |
| Total | 2,001 (100.0%) | $51,940 |
Earnings by Sex by Income Bracket in Morgan
The most common earnings brackets in Morgan are $100,000+ for men (361 | 33.1%) and $55,000 to $64,999 for women (139 | 15.3%).
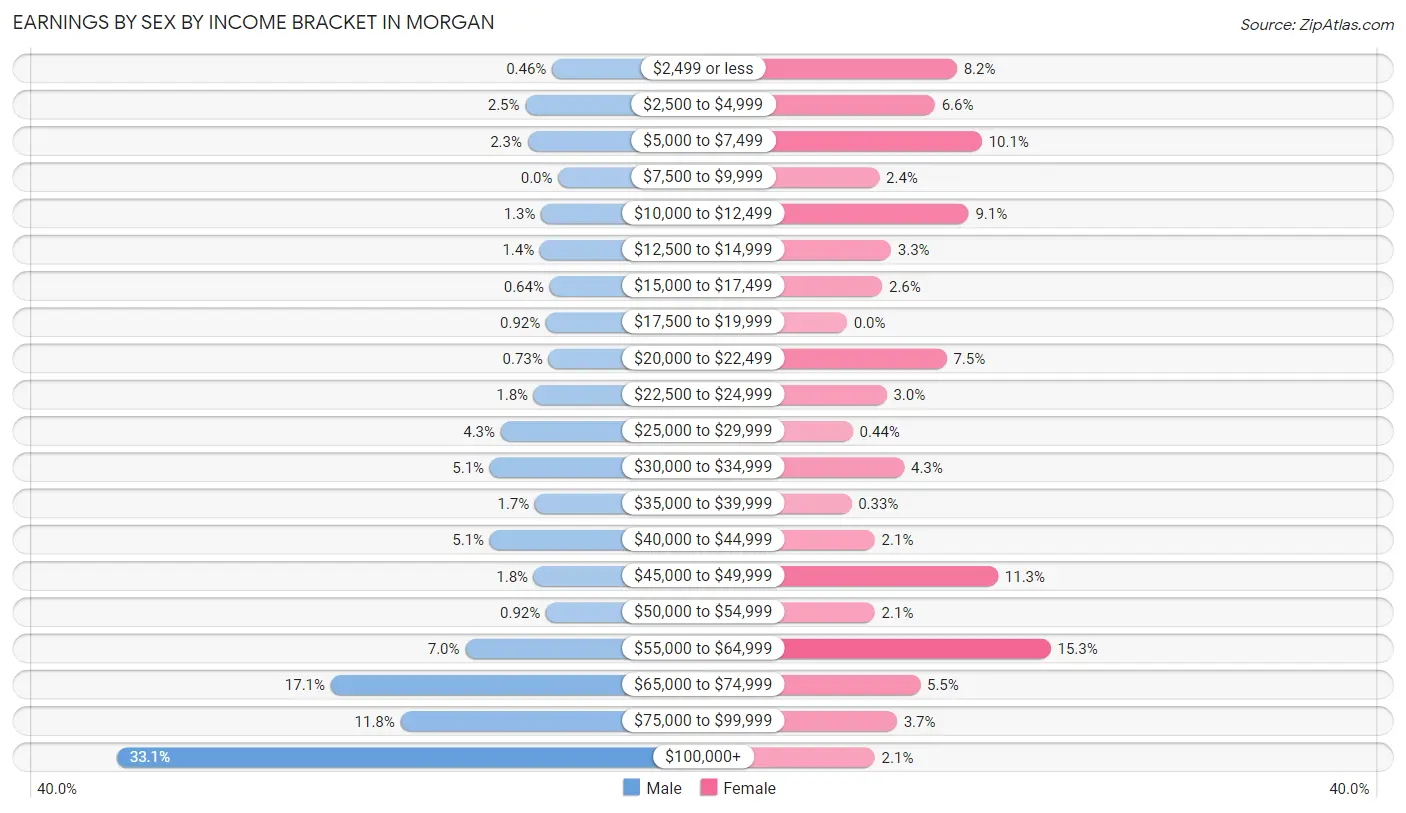
| Income | Male | Female |
| $2,499 or less | 5 (0.5%) | 75 (8.2%) |
| $2,500 to $4,999 | 27 (2.5%) | 60 (6.6%) |
| $5,000 to $7,499 | 25 (2.3%) | 92 (10.1%) |
| $7,500 to $9,999 | 0 (0.0%) | 22 (2.4%) |
| $10,000 to $12,499 | 14 (1.3%) | 83 (9.1%) |
| $12,500 to $14,999 | 15 (1.4%) | 30 (3.3%) |
| $15,000 to $17,499 | 7 (0.6%) | 24 (2.6%) |
| $17,500 to $19,999 | 10 (0.9%) | 0 (0.0%) |
| $20,000 to $22,499 | 8 (0.7%) | 68 (7.5%) |
| $22,500 to $24,999 | 20 (1.8%) | 27 (3.0%) |
| $25,000 to $29,999 | 47 (4.3%) | 4 (0.4%) |
| $30,000 to $34,999 | 56 (5.1%) | 39 (4.3%) |
| $35,000 to $39,999 | 19 (1.7%) | 3 (0.3%) |
| $40,000 to $44,999 | 56 (5.1%) | 19 (2.1%) |
| $45,000 to $49,999 | 20 (1.8%) | 103 (11.3%) |
| $50,000 to $54,999 | 10 (0.9%) | 19 (2.1%) |
| $55,000 to $64,999 | 76 (7.0%) | 139 (15.3%) |
| $65,000 to $74,999 | 186 (17.1%) | 50 (5.5%) |
| $75,000 to $99,999 | 129 (11.8%) | 34 (3.7%) |
| $100,000+ | 361 (33.1%) | 19 (2.1%) |
| Total | 1,091 (100.0%) | 910 (100.0%) |
Earnings by Sex by Educational Attainment in Morgan
Average earnings in Morgan are $80,417 for men and $45,680 for women, a difference of 43.2%. Men with an educational attainment of graduate degree enjoy the highest average annual earnings of $147,750, while those with college or associate's degree education earn the least with $66,237. Women with an educational attainment of high school diploma earn the most with the average annual earnings of $56,163, while those with graduate degree education have the smallest earnings of $45,100.
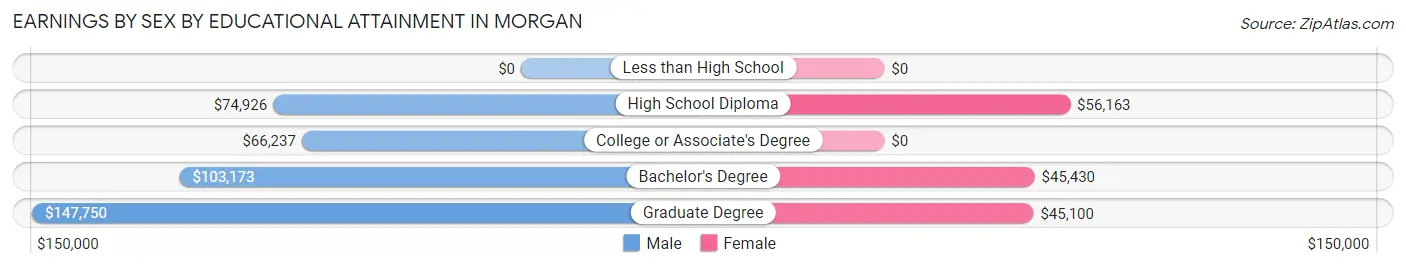
| Educational Attainment | Male Income | Female Income |
| Less than High School | - | - |
| High School Diploma | $74,926 | $56,163 |
| College or Associate's Degree | $66,237 | $0 |
| Bachelor's Degree | $103,173 | $45,430 |
| Graduate Degree | $147,750 | $45,100 |
| Total | $80,417 | $45,680 |
Family Income in Morgan
Family Income Brackets in Morgan
According to the Morgan family income data, there are 276 families falling into the $100,000 to $149,999 income range, which is the most common income bracket and makes up 27.7% of all families.
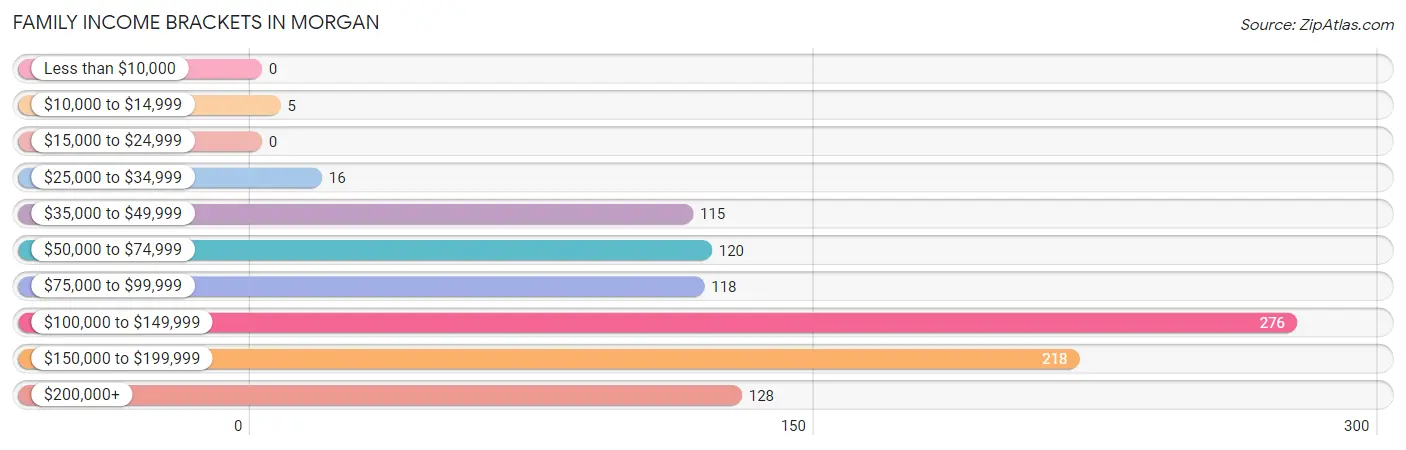
| Income Bracket | # Families | % Families |
| Less than $10,000 | 0 | 0.0% |
| $10,000 to $14,999 | 5 | 0.5% |
| $15,000 to $24,999 | 0 | 0.0% |
| $25,000 to $34,999 | 16 | 1.6% |
| $35,000 to $49,999 | 115 | 11.5% |
| $50,000 to $74,999 | 120 | 12.0% |
| $75,000 to $99,999 | 118 | 11.8% |
| $100,000 to $149,999 | 276 | 27.7% |
| $150,000 to $199,999 | 218 | 21.9% |
| $200,000+ | 128 | 12.9% |
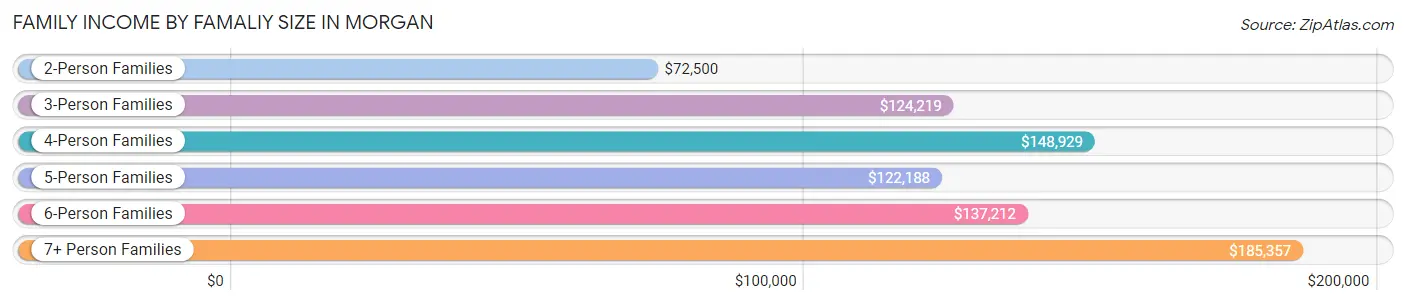
Family Income by Famaliy Size in Morgan
7+ person families (112 | 11.2%) account for the highest median family income in Morgan with $185,357 per family, while 3-person families (135 | 13.6%) have the highest median income of $41,406 per family member.
| Income Bracket | # Families | Median Income |
| 2-Person Families | 328 (32.9%) | $72,500 |
| 3-Person Families | 135 (13.6%) | $124,219 |
| 4-Person Families | 154 (15.5%) | $148,929 |
| 5-Person Families | 151 (15.2%) | $122,188 |
| 6-Person Families | 116 (11.7%) | $137,212 |
| 7+ Person Families | 112 (11.2%) | $185,357 |
| Total | 996 (100.0%) | $116,875 |
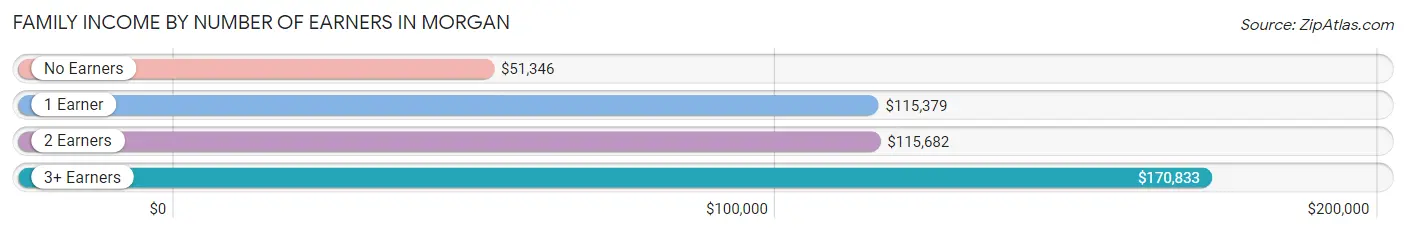
Family Income by Number of Earners in Morgan
The median family income in Morgan is $116,875, with families comprising 3+ earners (236) having the highest median family income of $170,833, while families with no earners (92) have the lowest median family income of $51,346, accounting for 23.7% and 9.2% of families, respectively.
| Number of Earners | # Families | Median Income |
| No Earners | 92 (9.2%) | $51,346 |
| 1 Earner | 268 (26.9%) | $115,379 |
| 2 Earners | 400 (40.2%) | $115,682 |
| 3+ Earners | 236 (23.7%) | $170,833 |
| Total | 996 (100.0%) | $116,875 |
Household Income in Morgan
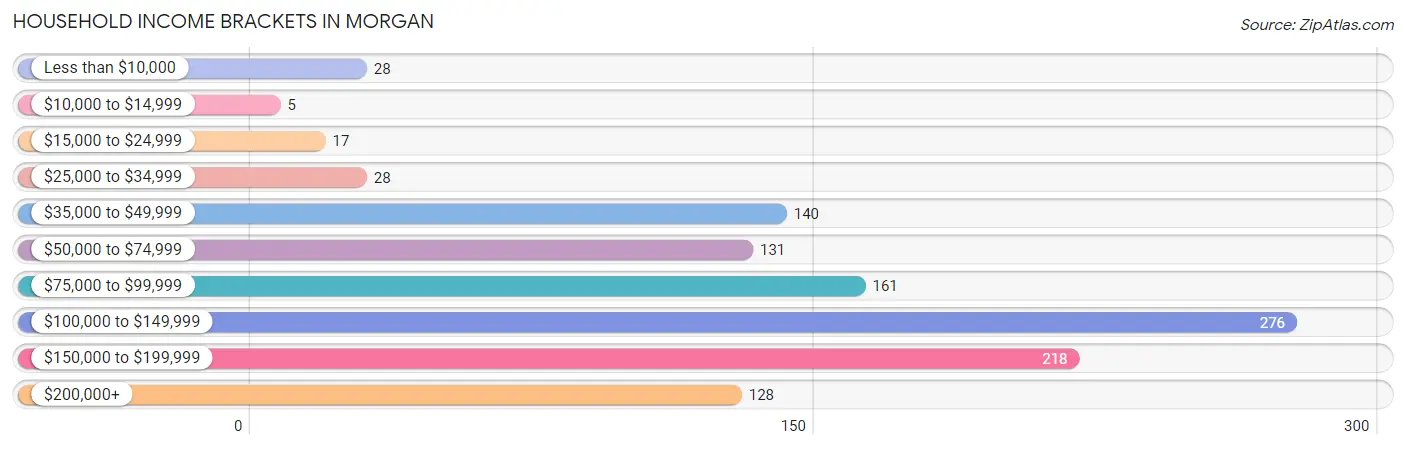
Household Income Brackets in Morgan
With 276 households falling in the category, the $100,000 to $149,999 income range is the most frequent in Morgan, accounting for 24.4% of all households. In contrast, only 5 households (0.4%) fall into the $10,000 to $14,999 income bracket, making it the least populous group.
| Income Bracket | # Households | % Households |
| Less than $10,000 | 28 | 2.5% |
| $10,000 to $14,999 | 5 | 0.4% |
| $15,000 to $24,999 | 17 | 1.5% |
| $25,000 to $34,999 | 28 | 2.5% |
| $35,000 to $49,999 | 140 | 12.4% |
| $50,000 to $74,999 | 131 | 11.6% |
| $75,000 to $99,999 | 161 | 14.2% |
| $100,000 to $149,999 | 276 | 24.4% |
| $150,000 to $199,999 | 218 | 19.2% |
| $200,000+ | 128 | 11.3% |
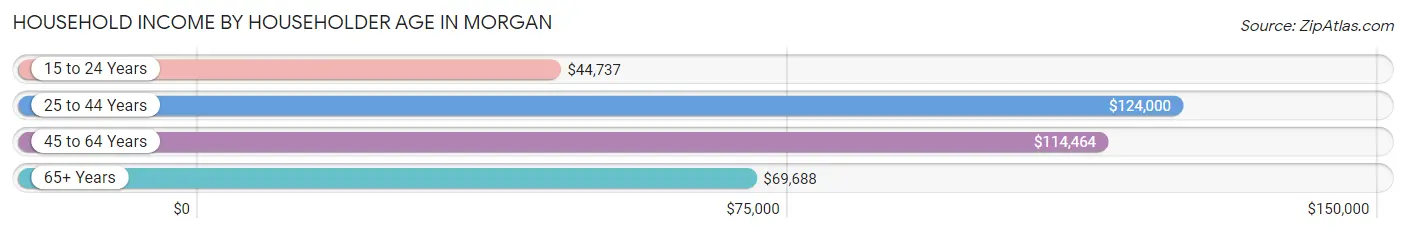
Household Income by Householder Age in Morgan
The median household income in Morgan is $112,232, with the highest median household income of $124,000 found in the 25 to 44 years age bracket for the primary householder. A total of 440 households (38.8%) fall into this category. Meanwhile, the 15 to 24 years age bracket for the primary householder has the lowest median household income of $44,737, with 38 households (3.4%) in this group.
| Income Bracket | # Households | Median Income |
| 15 to 24 Years | 38 (3.4%) | $44,737 |
| 25 to 44 Years | 440 (38.8%) | $124,000 |
| 45 to 64 Years | 394 (34.8%) | $114,464 |
| 65+ Years | 261 (23.0%) | $69,688 |
| Total | 1,133 (100.0%) | $112,232 |
Poverty in Morgan
Income Below Poverty by Sex and Age in Morgan
With 1.7% poverty level for males and 0.5% for females among the residents of Morgan, 75 year old and over males and 6 to 11 year old females are the most vulnerable to poverty, with 13 males (20.3%) and 5 females (2.0%) in their respective age groups living below the poverty level.
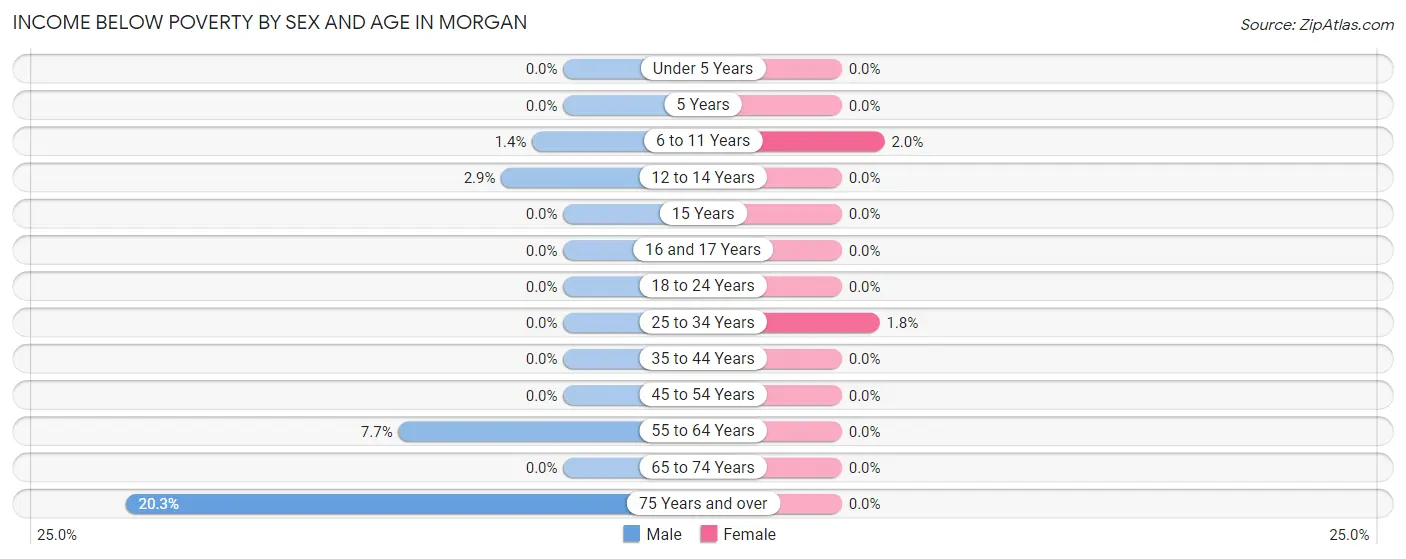
| Age Bracket | Male | Female |
| Under 5 Years | 0 (0.0%) | 0 (0.0%) |
| 5 Years | 0 (0.0%) | 0 (0.0%) |
| 6 to 11 Years | 5 (1.4%) | 5 (2.0%) |
| 12 to 14 Years | 4 (2.9%) | 0 (0.0%) |
| 15 Years | 0 (0.0%) | 0 (0.0%) |
| 16 and 17 Years | 0 (0.0%) | 0 (0.0%) |
| 18 to 24 Years | 0 (0.0%) | 0 (0.0%) |
| 25 to 34 Years | 0 (0.0%) | 5 (1.8%) |
| 35 to 44 Years | 0 (0.0%) | 0 (0.0%) |
| 45 to 54 Years | 0 (0.0%) | 0 (0.0%) |
| 55 to 64 Years | 15 (7.6%) | 0 (0.0%) |
| 65 to 74 Years | 0 (0.0%) | 0 (0.0%) |
| 75 Years and over | 13 (20.3%) | 0 (0.0%) |
| Total | 37 (1.7%) | 10 (0.5%) |
Income Above Poverty by Sex and Age in Morgan
According to the poverty statistics in Morgan, males aged under 5 years and females aged under 5 years are the age groups that are most secure financially, with 100.0% of males and 100.0% of females in these age groups living above the poverty line.
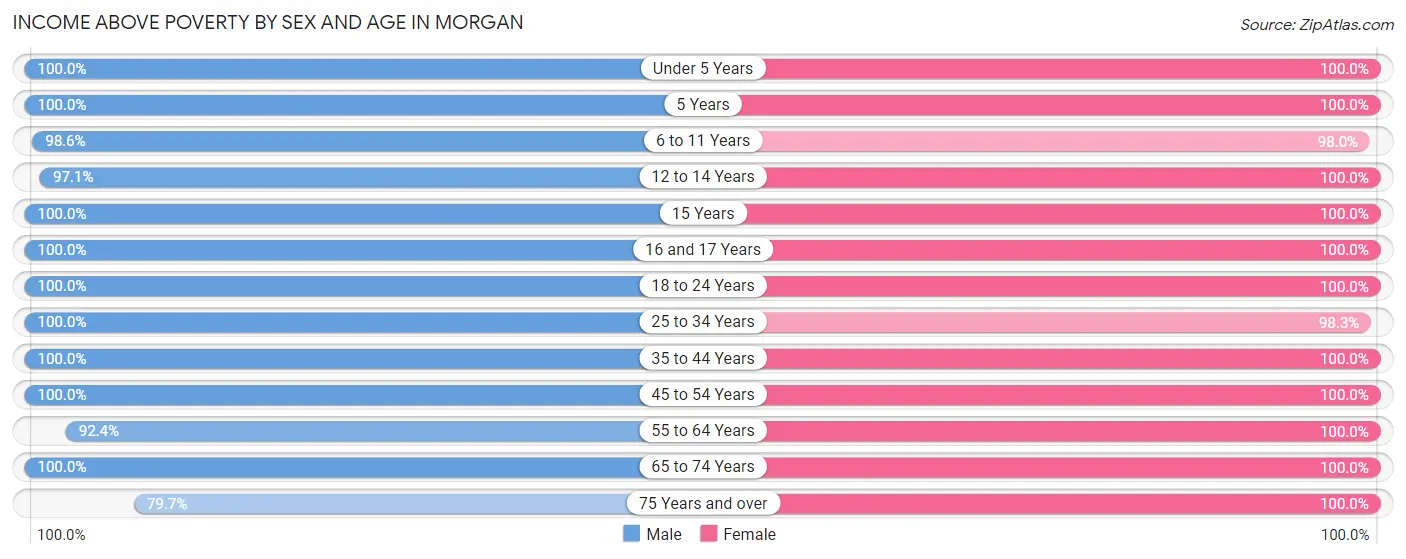
| Age Bracket | Male | Female |
| Under 5 Years | 160 (100.0%) | 243 (100.0%) |
| 5 Years | 22 (100.0%) | 25 (100.0%) |
| 6 to 11 Years | 342 (98.6%) | 248 (98.0%) |
| 12 to 14 Years | 135 (97.1%) | 86 (100.0%) |
| 15 Years | 69 (100.0%) | 41 (100.0%) |
| 16 and 17 Years | 84 (100.0%) | 101 (100.0%) |
| 18 to 24 Years | 136 (100.0%) | 188 (100.0%) |
| 25 to 34 Years | 213 (100.0%) | 280 (98.3%) |
| 35 to 44 Years | 350 (100.0%) | 227 (100.0%) |
| 45 to 54 Years | 194 (100.0%) | 159 (100.0%) |
| 55 to 64 Years | 181 (92.3%) | 193 (100.0%) |
| 65 to 74 Years | 151 (100.0%) | 184 (100.0%) |
| 75 Years and over | 51 (79.7%) | 61 (100.0%) |
| Total | 2,088 (98.3%) | 2,036 (99.5%) |
Income Below Poverty Among Married-Couple Families in Morgan
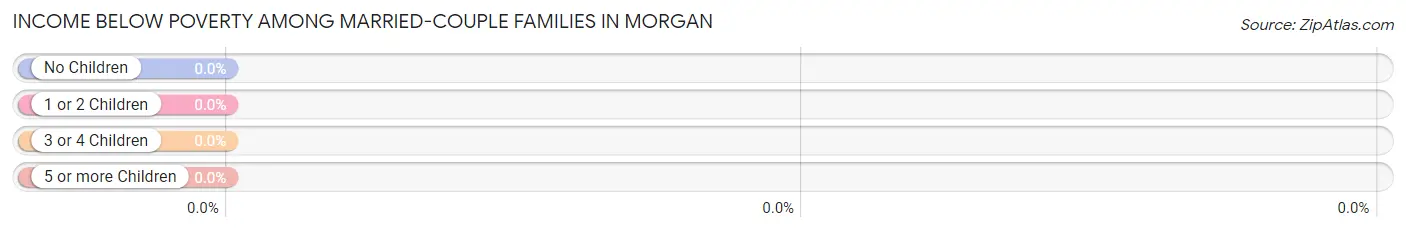
| Children | Above Poverty | Below Poverty |
| No Children | 329 (100.0%) | 0 (0.0%) |
| 1 or 2 Children | 284 (100.0%) | 0 (0.0%) |
| 3 or 4 Children | 200 (100.0%) | 0 (0.0%) |
| 5 or more Children | 77 (100.0%) | 0 (0.0%) |
| Total | 890 (100.0%) | 0 (0.0%) |
Income Below Poverty Among Single-Parent Households in Morgan
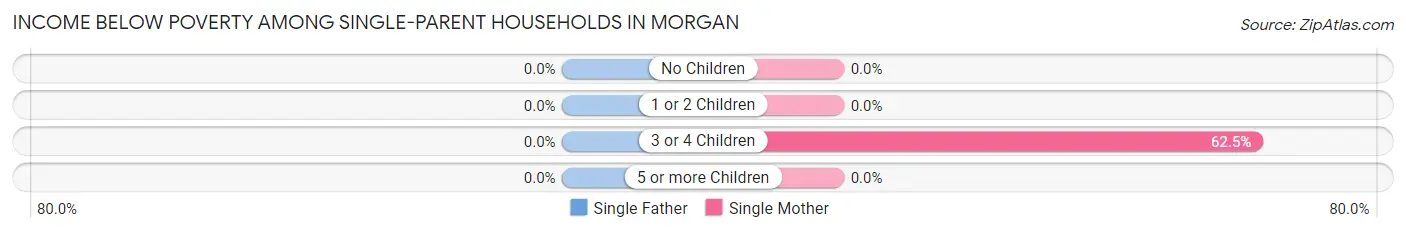
| Children | Single Father | Single Mother |
| No Children | 0 (0.0%) | 0 (0.0%) |
| 1 or 2 Children | 0 (0.0%) | 0 (0.0%) |
| 3 or 4 Children | 0 (0.0%) | 5 (62.5%) |
| 5 or more Children | 0 (0.0%) | 0 (0.0%) |
| Total | 0 (0.0%) | 5 (6.5%) |
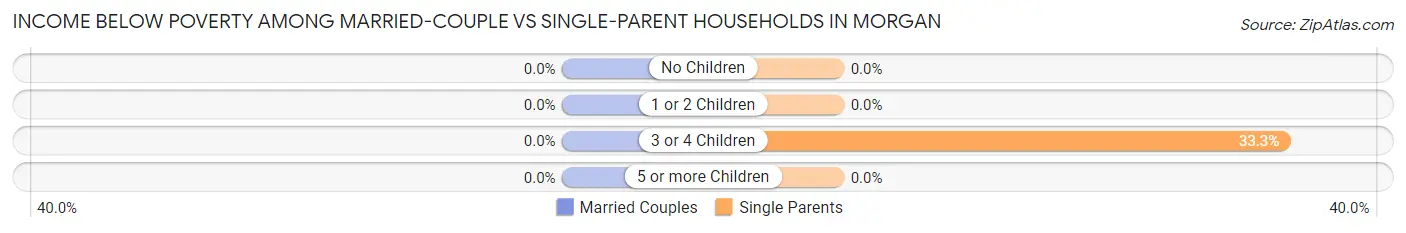
Income Below Poverty Among Married-Couple vs Single-Parent Households in Morgan
| Children | Married-Couple Families | Single-Parent Households |
| No Children | 0 (0.0%) | 0 (0.0%) |
| 1 or 2 Children | 0 (0.0%) | 0 (0.0%) |
| 3 or 4 Children | 0 (0.0%) | 5 (33.3%) |
| 5 or more Children | 0 (0.0%) | 0 (0.0%) |
| Total | 0 (0.0%) | 5 (4.7%) |
Employment Characteristics in Morgan
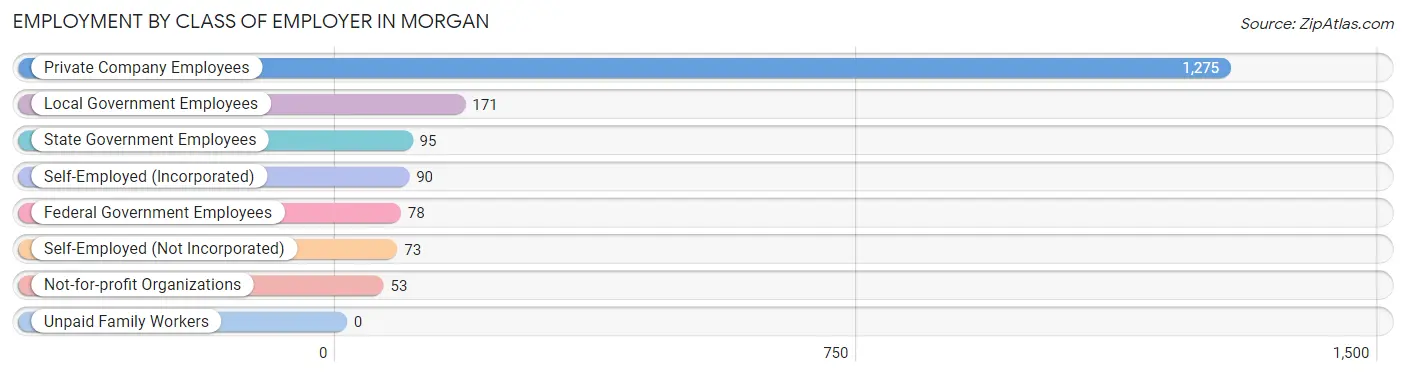
Employment by Class of Employer in Morgan
Among the 1,835 employed individuals in Morgan, private company employees (1,275 | 69.5%), local government employees (171 | 9.3%), and state government employees (95 | 5.2%) make up the most common classes of employment.
| Employer Class | # Employees | % Employees |
| Private Company Employees | 1,275 | 69.5% |
| Self-Employed (Incorporated) | 90 | 4.9% |
| Self-Employed (Not Incorporated) | 73 | 4.0% |
| Not-for-profit Organizations | 53 | 2.9% |
| Local Government Employees | 171 | 9.3% |
| State Government Employees | 95 | 5.2% |
| Federal Government Employees | 78 | 4.3% |
| Unpaid Family Workers | 0 | 0.0% |
| Total | 1,835 | 100.0% |
Employment Status by Age in Morgan
According to the labor force statistics for Morgan, out of the total population over 16 years of age (2,786), 68.7% or 1,914 individuals are in the labor force, with 2.7% or 52 of them unemployed. The age group with the highest labor force participation rate is 20 to 24 years, with 100.0% or 216 individuals in the labor force. Within the labor force, the 25 to 29 years age range has the highest percentage of unemployed individuals, with 10.9% or 27 of them being unemployed.
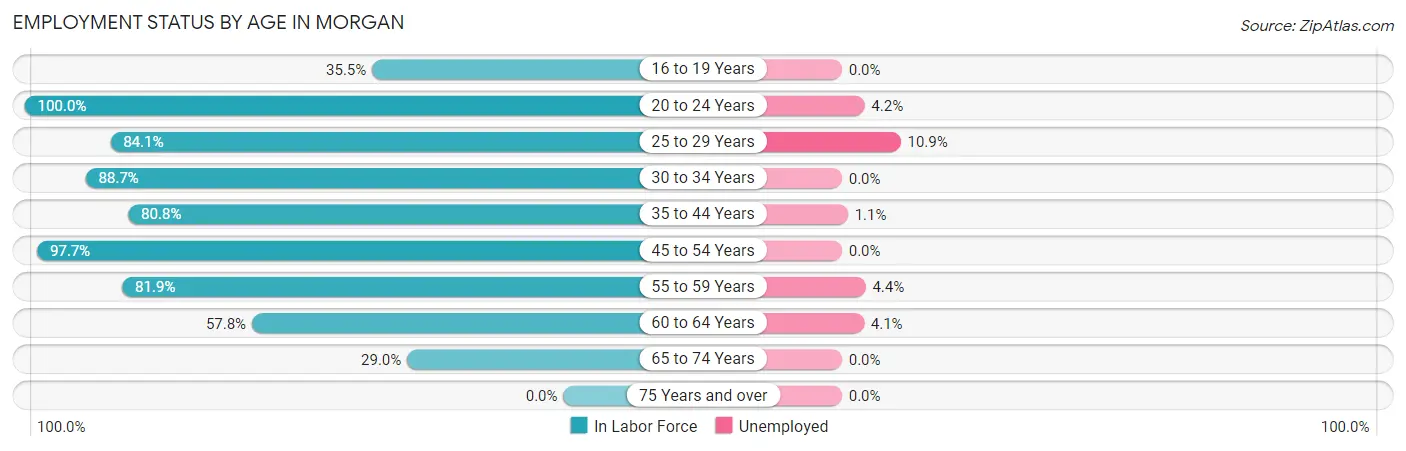
| Age Bracket | In Labor Force | Unemployed |
| 16 to 19 Years | 104 (35.5%) | 0 (0.0%) |
| 20 to 24 Years | 216 (100.0%) | 9 (4.2%) |
| 25 to 29 Years | 248 (84.1%) | 27 (10.9%) |
| 30 to 34 Years | 180 (88.7%) | 0 (0.0%) |
| 35 to 44 Years | 466 (80.8%) | 5 (1.1%) |
| 45 to 54 Years | 345 (97.7%) | 0 (0.0%) |
| 55 to 59 Years | 113 (81.9%) | 5 (4.4%) |
| 60 to 64 Years | 145 (57.8%) | 6 (4.1%) |
| 65 to 74 Years | 97 (29.0%) | 0 (0.0%) |
| 75 Years and over | 0 (0.0%) | 0 (0.0%) |
| Total | 1,914 (68.7%) | 52 (2.7%) |
Employment Status by Educational Attainment in Morgan
According to labor force statistics for Morgan, 82.4% of individuals (1,497) out of the total population between 25 and 64 years of age (1,817) are in the labor force, with 2.9% or 43 of them being unemployed. The group with the highest labor force participation rate are those with the educational attainment of less than high school, with 100.0% or 39 individuals in the labor force. Within the labor force, individuals with less than high school education have the highest percentage of unemployment, with 69.2% or 27 of them being unemployed.
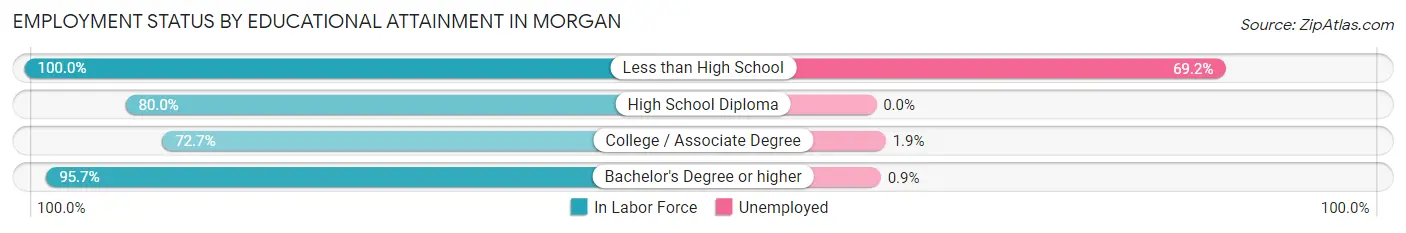
| Educational Attainment | In Labor Force | Unemployed |
| Less than High School | 39 (100.0%) | 27 (69.2%) |
| High School Diploma | 296 (80.0%) | 0 (0.0%) |
| College / Associate Degree | 585 (72.7%) | 15 (1.9%) |
| Bachelor's Degree or higher | 577 (95.7%) | 5 (0.9%) |
| Total | 1,497 (82.4%) | 53 (2.9%) |
Employment Occupations by Sex in Morgan
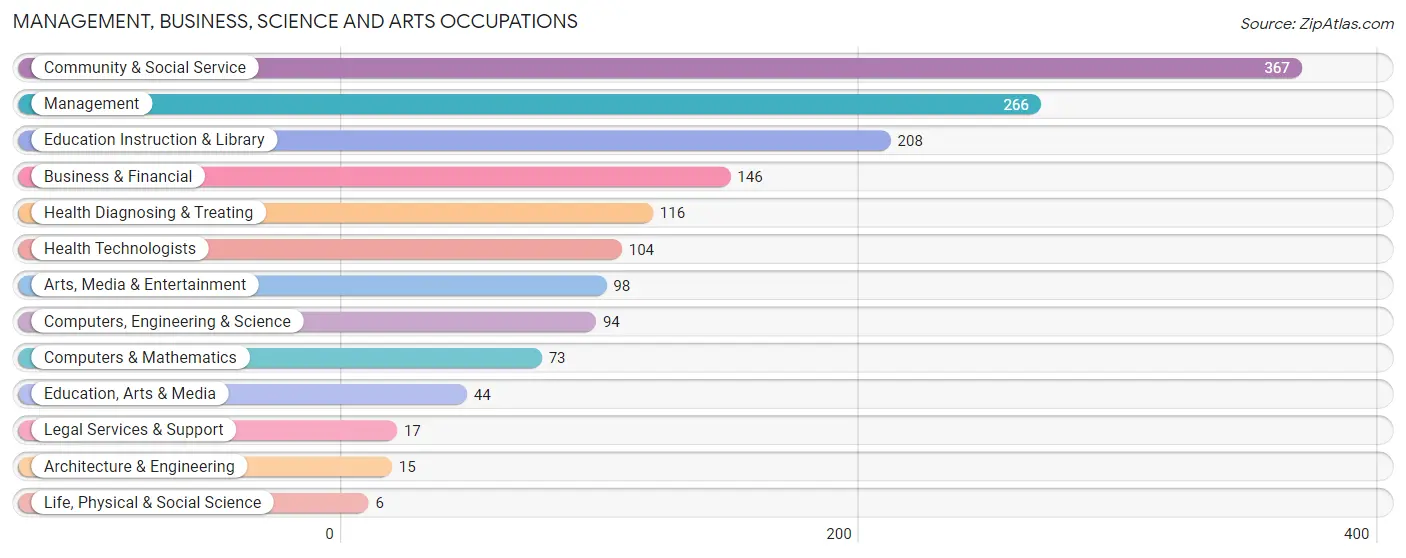
Management, Business, Science and Arts Occupations
The most common Management, Business, Science and Arts occupations in Morgan are Community & Social Service (367 | 19.7%), Management (266 | 14.3%), Education Instruction & Library (208 | 11.2%), Business & Financial (146 | 7.8%), and Health Diagnosing & Treating (116 | 6.2%).
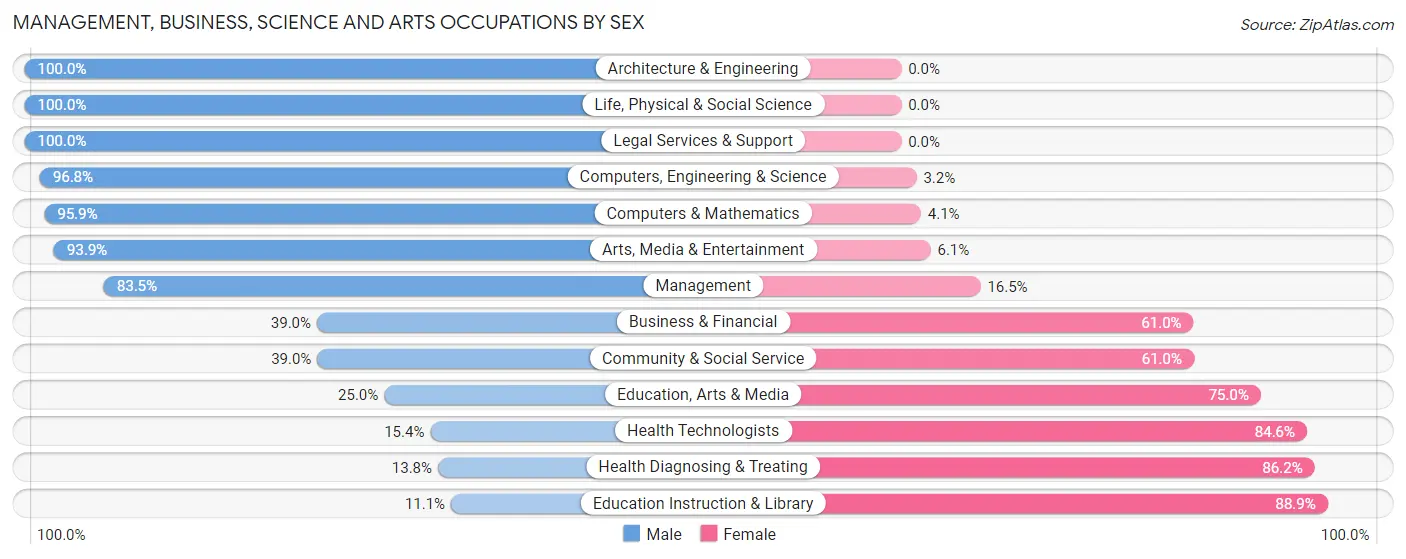
Management, Business, Science and Arts Occupations by Sex
Within the Management, Business, Science and Arts occupations in Morgan, the most male-oriented occupations are Architecture & Engineering (100.0%), Life, Physical & Social Science (100.0%), and Legal Services & Support (100.0%), while the most female-oriented occupations are Education Instruction & Library (88.9%), Health Diagnosing & Treating (86.2%), and Health Technologists (84.6%).
| Occupation | Male | Female |
| Management | 222 (83.5%) | 44 (16.5%) |
| Business & Financial | 57 (39.0%) | 89 (61.0%) |
| Computers, Engineering & Science | 91 (96.8%) | 3 (3.2%) |
| Computers & Mathematics | 70 (95.9%) | 3 (4.1%) |
| Architecture & Engineering | 15 (100.0%) | 0 (0.0%) |
| Life, Physical & Social Science | 6 (100.0%) | 0 (0.0%) |
| Community & Social Service | 143 (39.0%) | 224 (61.0%) |
| Education, Arts & Media | 11 (25.0%) | 33 (75.0%) |
| Legal Services & Support | 17 (100.0%) | 0 (0.0%) |
| Education Instruction & Library | 23 (11.1%) | 185 (88.9%) |
| Arts, Media & Entertainment | 92 (93.9%) | 6 (6.1%) |
| Health Diagnosing & Treating | 16 (13.8%) | 100 (86.2%) |
| Health Technologists | 16 (15.4%) | 88 (84.6%) |
| Total (Category) | 529 (53.5%) | 460 (46.5%) |
| Total (Overall) | 1,063 (57.1%) | 799 (42.9%) |
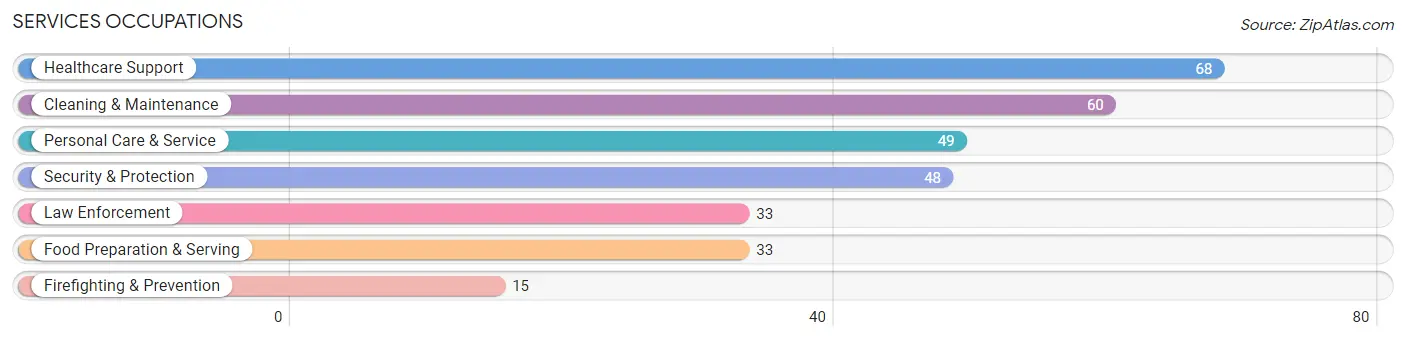
Services Occupations
The most common Services occupations in Morgan are Healthcare Support (68 | 3.6%), Cleaning & Maintenance (60 | 3.2%), Personal Care & Service (49 | 2.6%), Security & Protection (48 | 2.6%), and Law Enforcement (33 | 1.8%).
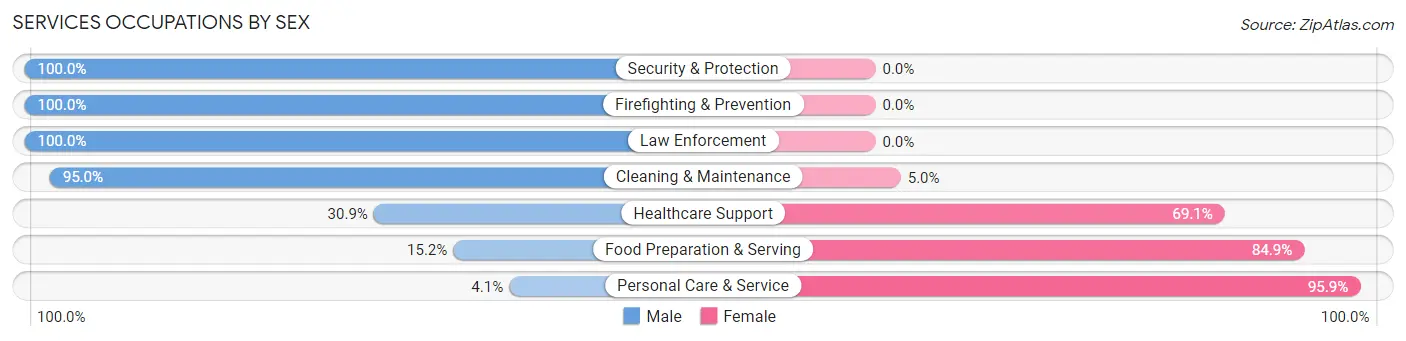
Services Occupations by Sex
Within the Services occupations in Morgan, the most male-oriented occupations are Security & Protection (100.0%), Firefighting & Prevention (100.0%), and Law Enforcement (100.0%), while the most female-oriented occupations are Personal Care & Service (95.9%), Food Preparation & Serving (84.9%), and Healthcare Support (69.1%).
| Occupation | Male | Female |
| Healthcare Support | 21 (30.9%) | 47 (69.1%) |
| Security & Protection | 48 (100.0%) | 0 (0.0%) |
| Firefighting & Prevention | 15 (100.0%) | 0 (0.0%) |
| Law Enforcement | 33 (100.0%) | 0 (0.0%) |
| Food Preparation & Serving | 5 (15.1%) | 28 (84.9%) |
| Cleaning & Maintenance | 57 (95.0%) | 3 (5.0%) |
| Personal Care & Service | 2 (4.1%) | 47 (95.9%) |
| Total (Category) | 133 (51.5%) | 125 (48.4%) |
| Total (Overall) | 1,063 (57.1%) | 799 (42.9%) |
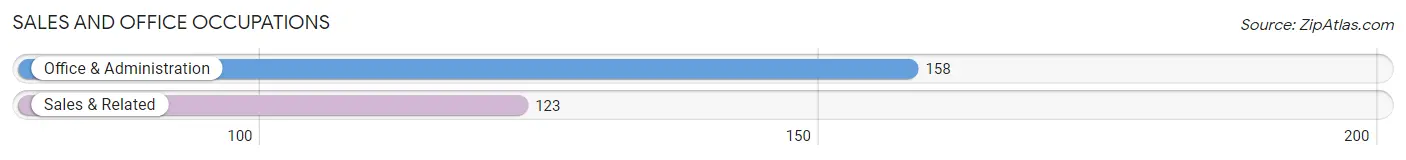
Sales and Office Occupations
The most common Sales and Office occupations in Morgan are Office & Administration (158 | 8.5%), and Sales & Related (123 | 6.6%).
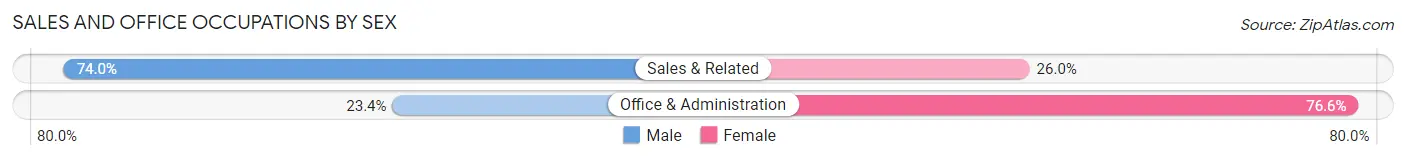
Sales and Office Occupations by Sex
| Occupation | Male | Female |
| Sales & Related | 91 (74.0%) | 32 (26.0%) |
| Office & Administration | 37 (23.4%) | 121 (76.6%) |
| Total (Category) | 128 (45.6%) | 153 (54.4%) |
| Total (Overall) | 1,063 (57.1%) | 799 (42.9%) |
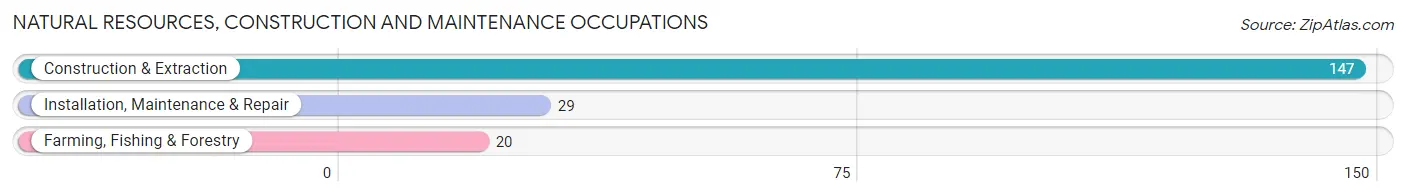
Natural Resources, Construction and Maintenance Occupations
The most common Natural Resources, Construction and Maintenance occupations in Morgan are Construction & Extraction (147 | 7.9%), Installation, Maintenance & Repair (29 | 1.6%), and Farming, Fishing & Forestry (20 | 1.1%).
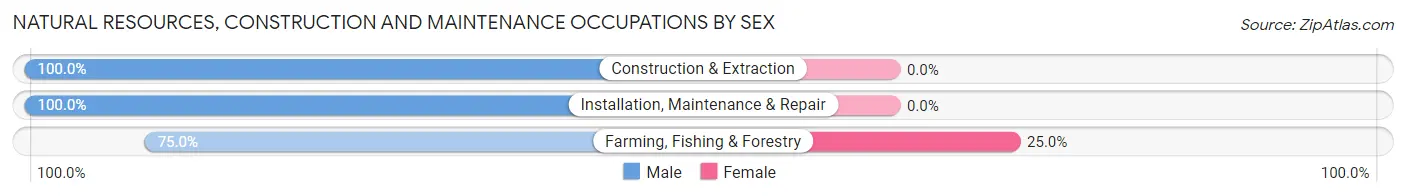
Natural Resources, Construction and Maintenance Occupations by Sex
| Occupation | Male | Female |
| Farming, Fishing & Forestry | 15 (75.0%) | 5 (25.0%) |
| Construction & Extraction | 147 (100.0%) | 0 (0.0%) |
| Installation, Maintenance & Repair | 29 (100.0%) | 0 (0.0%) |
| Total (Category) | 191 (97.5%) | 5 (2.5%) |
| Total (Overall) | 1,063 (57.1%) | 799 (42.9%) |
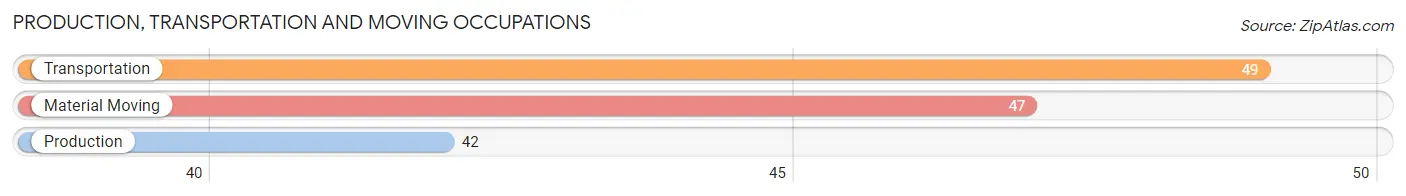
Production, Transportation and Moving Occupations
The most common Production, Transportation and Moving occupations in Morgan are Transportation (49 | 2.6%), Material Moving (47 | 2.5%), and Production (42 | 2.3%).
Production, Transportation and Moving Occupations by Sex
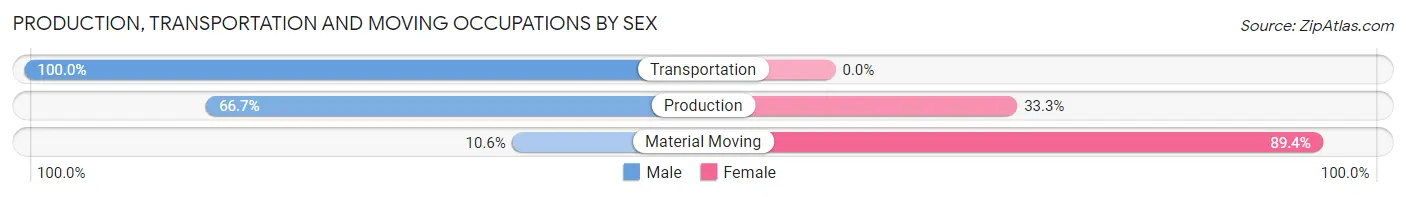
| Occupation | Male | Female |
| Production | 28 (66.7%) | 14 (33.3%) |
| Transportation | 49 (100.0%) | 0 (0.0%) |
| Material Moving | 5 (10.6%) | 42 (89.4%) |
| Total (Category) | 82 (59.4%) | 56 (40.6%) |
| Total (Overall) | 1,063 (57.1%) | 799 (42.9%) |
Employment Industries by Sex in Morgan
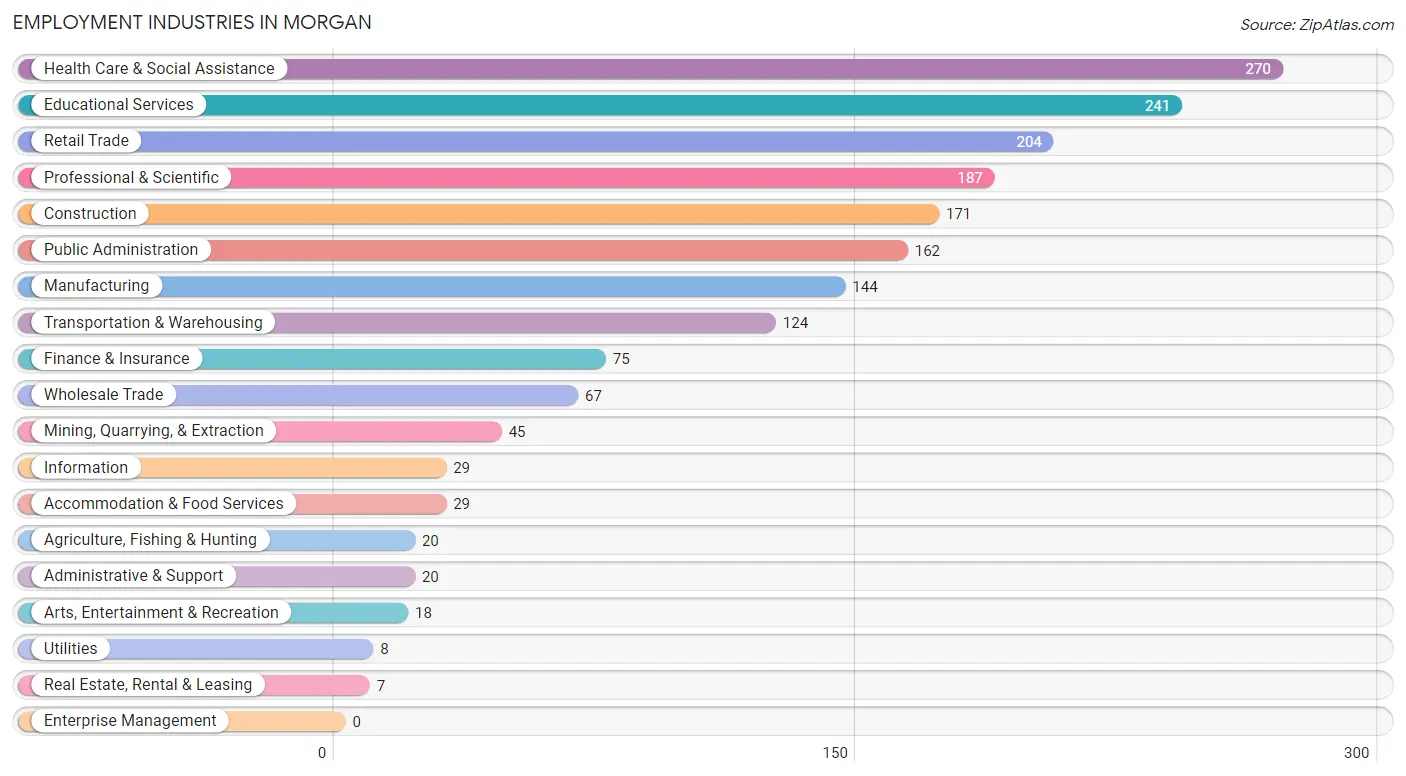
Employment Industries in Morgan
The major employment industries in Morgan include Health Care & Social Assistance (270 | 14.5%), Educational Services (241 | 12.9%), Retail Trade (204 | 11.0%), Professional & Scientific (187 | 10.0%), and Construction (171 | 9.2%).
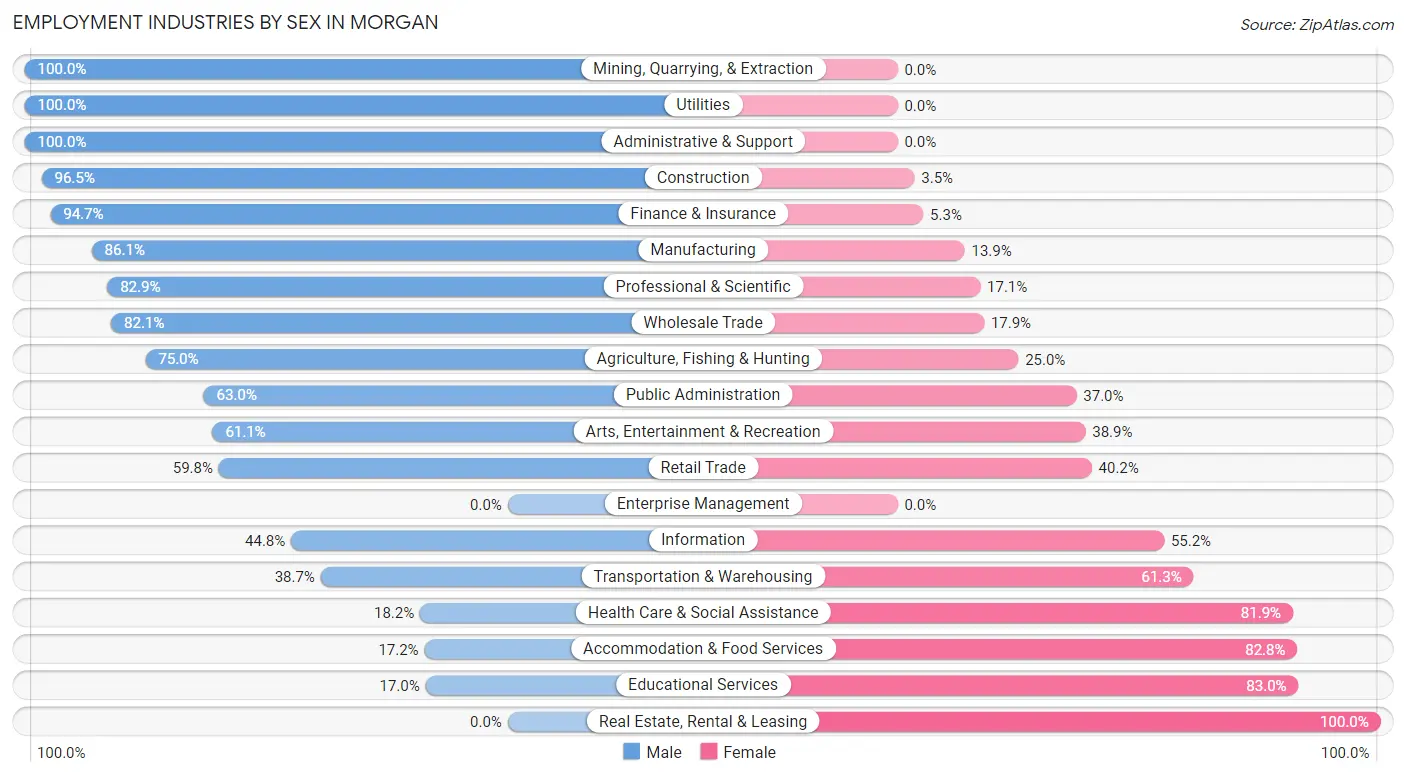
Employment Industries by Sex in Morgan
The Morgan industries that see more men than women are Mining, Quarrying, & Extraction (100.0%), Utilities (100.0%), and Administrative & Support (100.0%), whereas the industries that tend to have a higher number of women are Real Estate, Rental & Leasing (100.0%), Educational Services (83.0%), and Accommodation & Food Services (82.8%).
| Industry | Male | Female |
| Agriculture, Fishing & Hunting | 15 (75.0%) | 5 (25.0%) |
| Mining, Quarrying, & Extraction | 45 (100.0%) | 0 (0.0%) |
| Construction | 165 (96.5%) | 6 (3.5%) |
| Manufacturing | 124 (86.1%) | 20 (13.9%) |
| Wholesale Trade | 55 (82.1%) | 12 (17.9%) |
| Retail Trade | 122 (59.8%) | 82 (40.2%) |
| Transportation & Warehousing | 48 (38.7%) | 76 (61.3%) |
| Utilities | 8 (100.0%) | 0 (0.0%) |
| Information | 13 (44.8%) | 16 (55.2%) |
| Finance & Insurance | 71 (94.7%) | 4 (5.3%) |
| Real Estate, Rental & Leasing | 0 (0.0%) | 7 (100.0%) |
| Professional & Scientific | 155 (82.9%) | 32 (17.1%) |
| Enterprise Management | 0 (0.0%) | 0 (0.0%) |
| Administrative & Support | 20 (100.0%) | 0 (0.0%) |
| Educational Services | 41 (17.0%) | 200 (83.0%) |
| Health Care & Social Assistance | 49 (18.1%) | 221 (81.9%) |
| Arts, Entertainment & Recreation | 11 (61.1%) | 7 (38.9%) |
| Accommodation & Food Services | 5 (17.2%) | 24 (82.8%) |
| Public Administration | 102 (63.0%) | 60 (37.0%) |
| Total | 1,063 (57.1%) | 799 (42.9%) |
Education in Morgan
School Enrollment in Morgan
The most common levels of schooling among the 1,464 students in Morgan are elementary school (407 | 27.8%), high school (384 | 26.2%), and middle school (365 | 24.9%).
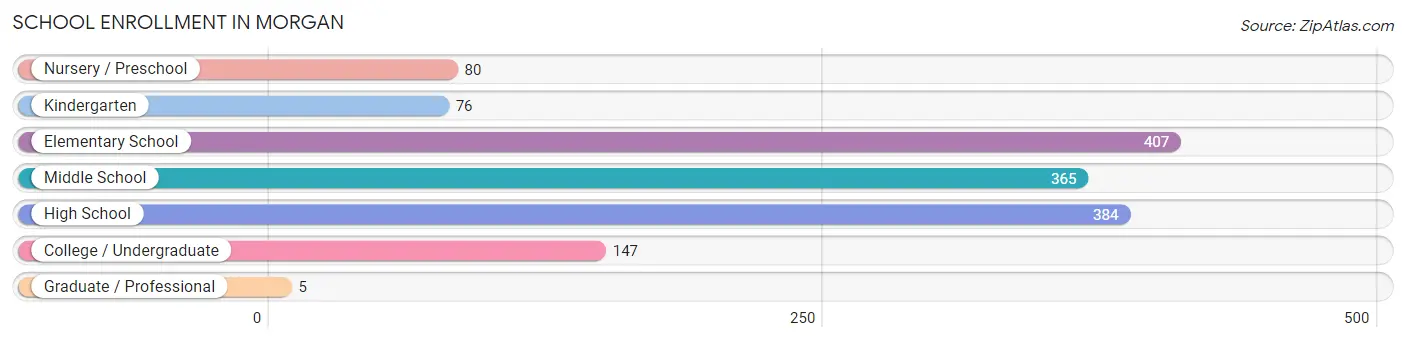
| School Level | # Students | % Students |
| Nursery / Preschool | 80 | 5.5% |
| Kindergarten | 76 | 5.2% |
| Elementary School | 407 | 27.8% |
| Middle School | 365 | 24.9% |
| High School | 384 | 26.2% |
| College / Undergraduate | 147 | 10.0% |
| Graduate / Professional | 5 | 0.3% |
| Total | 1,464 | 100.0% |
School Enrollment by Age by Funding Source in Morgan
Out of a total of 1,464 students who are enrolled in schools in Morgan, 165 (11.3%) attend a private institution, while the remaining 1,299 (88.7%) are enrolled in public schools. The age group of 3 to 4 year olds has the highest likelihood of being enrolled in private schools, with 40 (53.3% in the age bracket) enrolled. Conversely, the age group of 15 to 17 year olds has the lowest likelihood of being enrolled in a private school, with 295 (100.0% in the age bracket) attending a public institution.
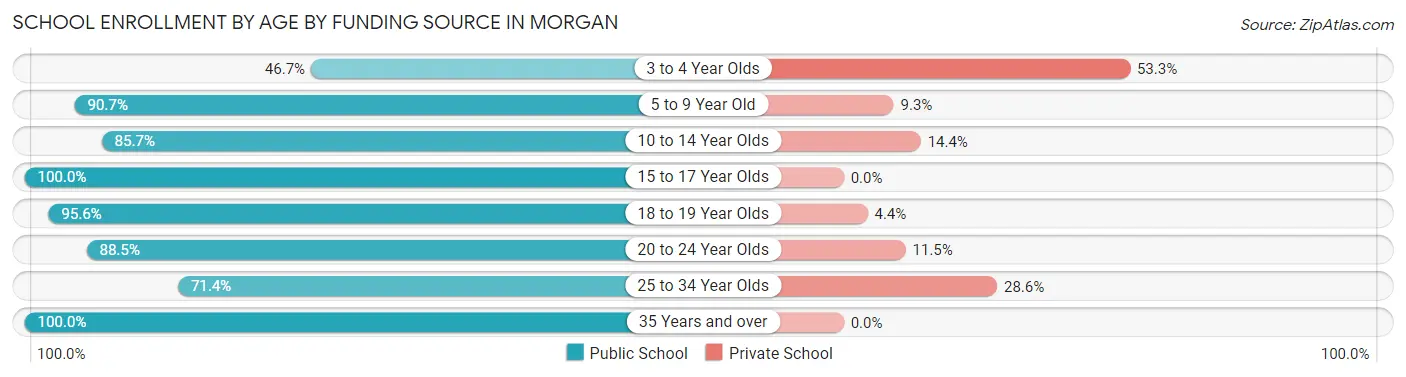
| Age Bracket | Public School | Private School |
| 3 to 4 Year Olds | 35 (46.7%) | 40 (53.3%) |
| 5 to 9 Year Old | 361 (90.7%) | 37 (9.3%) |
| 10 to 14 Year Olds | 406 (85.7%) | 68 (14.3%) |
| 15 to 17 Year Olds | 295 (100.0%) | 0 (0.0%) |
| 18 to 19 Year Olds | 86 (95.6%) | 4 (4.4%) |
| 20 to 24 Year Olds | 69 (88.5%) | 9 (11.5%) |
| 25 to 34 Year Olds | 20 (71.4%) | 8 (28.6%) |
| 35 Years and over | 26 (100.0%) | 0 (0.0%) |
| Total | 1,299 (88.7%) | 165 (11.3%) |
Educational Attainment by Field of Study in Morgan
Business (217 | 28.2%), arts & humanities (99 | 12.9%), education (91 | 11.8%), engineering (77 | 10.0%), and science & technology (62 | 8.1%) are the most common fields of study among 769 individuals in Morgan who have obtained a bachelor's degree or higher.
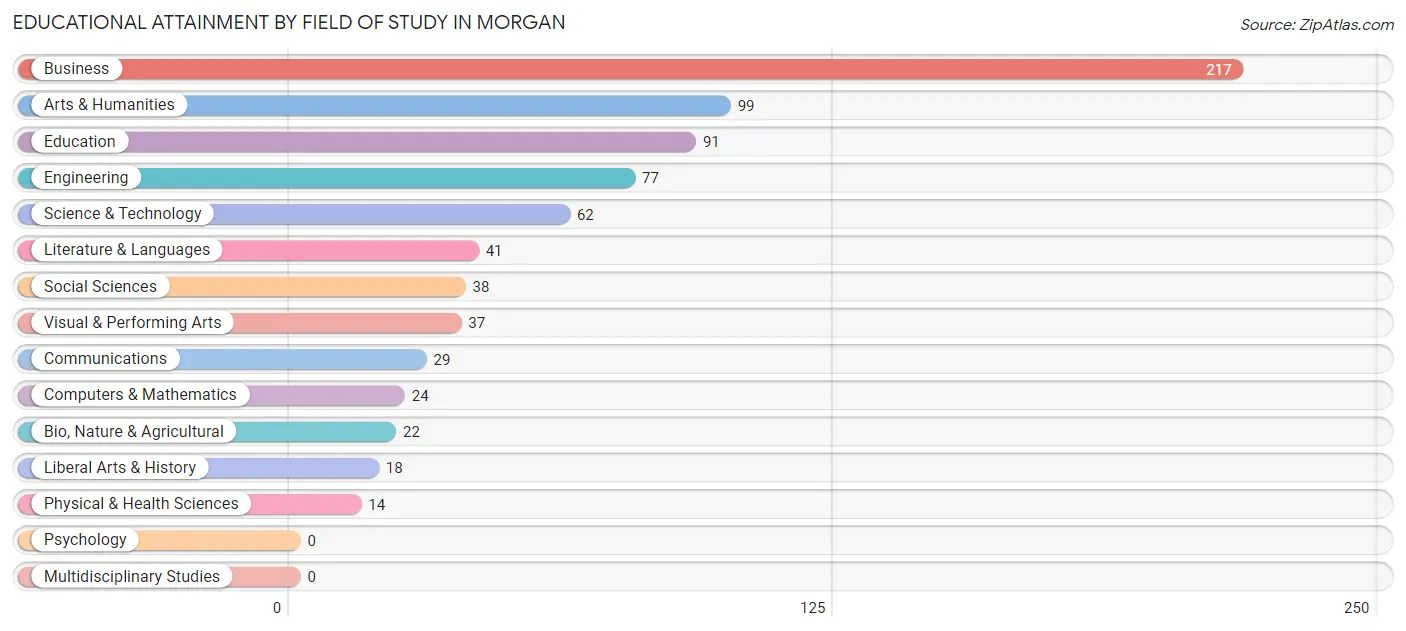
| Field of Study | # Graduates | % Graduates |
| Computers & Mathematics | 24 | 3.1% |
| Bio, Nature & Agricultural | 22 | 2.9% |
| Physical & Health Sciences | 14 | 1.8% |
| Psychology | 0 | 0.0% |
| Social Sciences | 38 | 4.9% |
| Engineering | 77 | 10.0% |
| Multidisciplinary Studies | 0 | 0.0% |
| Science & Technology | 62 | 8.1% |
| Business | 217 | 28.2% |
| Education | 91 | 11.8% |
| Literature & Languages | 41 | 5.3% |
| Liberal Arts & History | 18 | 2.3% |
| Visual & Performing Arts | 37 | 4.8% |
| Communications | 29 | 3.8% |
| Arts & Humanities | 99 | 12.9% |
| Total | 769 | 100.0% |
Transportation & Commute in Morgan
Vehicle Availability by Sex in Morgan
The most prevalent vehicle ownership categories in Morgan are males with 3 vehicles (406, accounting for 38.6%) and females with 3 vehicles (283, making up 51.9%).
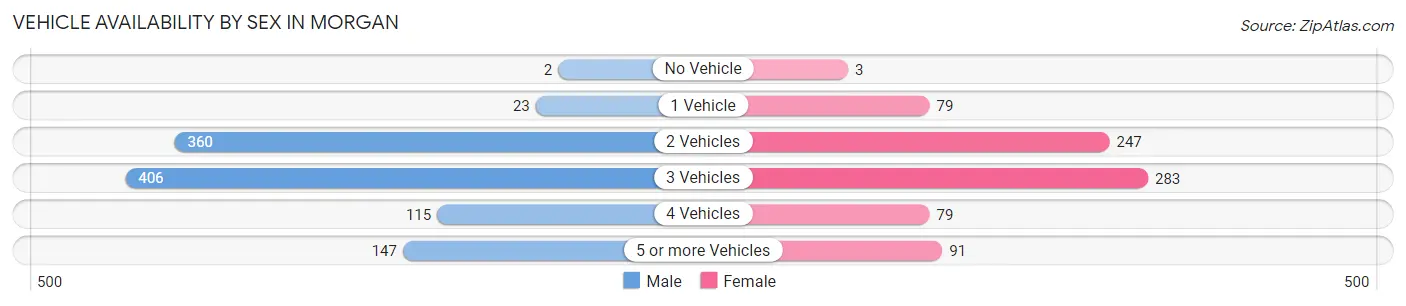
| Vehicles Available | Male | Female |
| No Vehicle | 2 (0.2%) | 3 (0.4%) |
| 1 Vehicle | 23 (2.2%) | 79 (10.1%) |
| 2 Vehicles | 360 (34.2%) | 247 (31.6%) |
| 3 Vehicles | 406 (38.6%) | 283 (36.2%) |
| 4 Vehicles | 115 (10.9%) | 79 (10.1%) |
| 5 or more Vehicles | 147 (14.0%) | 91 (11.6%) |
| Total | 1,053 (100.0%) | 782 (100.0%) |
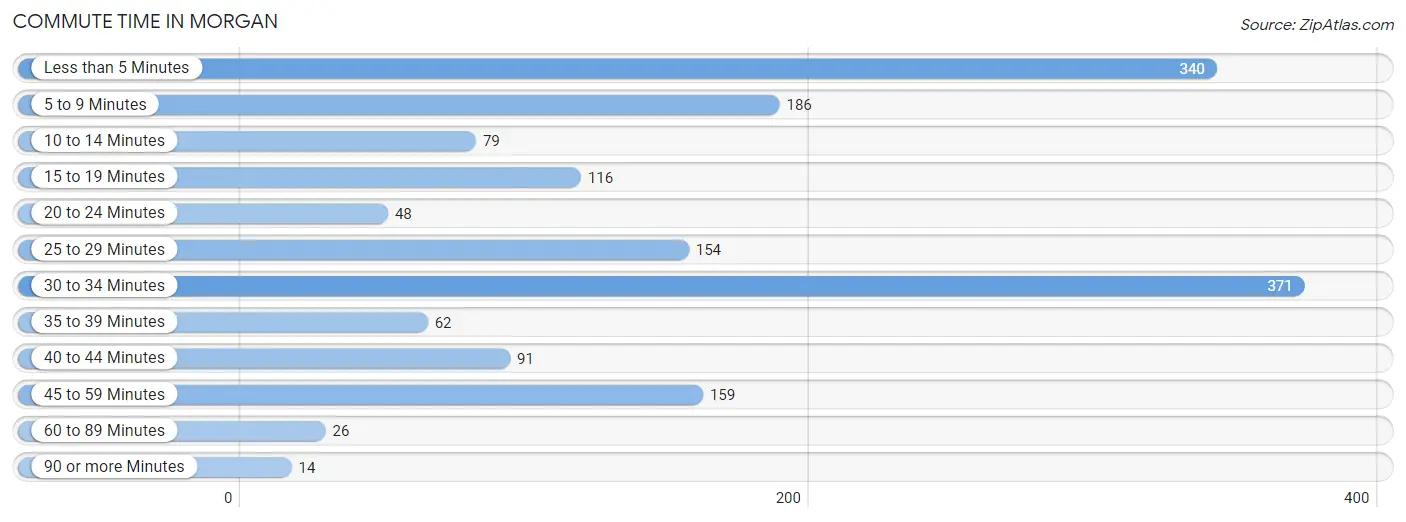
Commute Time in Morgan
The most frequently occuring commute durations in Morgan are 30 to 34 minutes (371 commuters, 22.5%), less than 5 minutes (340 commuters, 20.7%), and 5 to 9 minutes (186 commuters, 11.3%).
| Commute Time | # Commuters | % Commuters |
| Less than 5 Minutes | 340 | 20.7% |
| 5 to 9 Minutes | 186 | 11.3% |
| 10 to 14 Minutes | 79 | 4.8% |
| 15 to 19 Minutes | 116 | 7.0% |
| 20 to 24 Minutes | 48 | 2.9% |
| 25 to 29 Minutes | 154 | 9.4% |
| 30 to 34 Minutes | 371 | 22.5% |
| 35 to 39 Minutes | 62 | 3.8% |
| 40 to 44 Minutes | 91 | 5.5% |
| 45 to 59 Minutes | 159 | 9.7% |
| 60 to 89 Minutes | 26 | 1.6% |
| 90 or more Minutes | 14 | 0.9% |
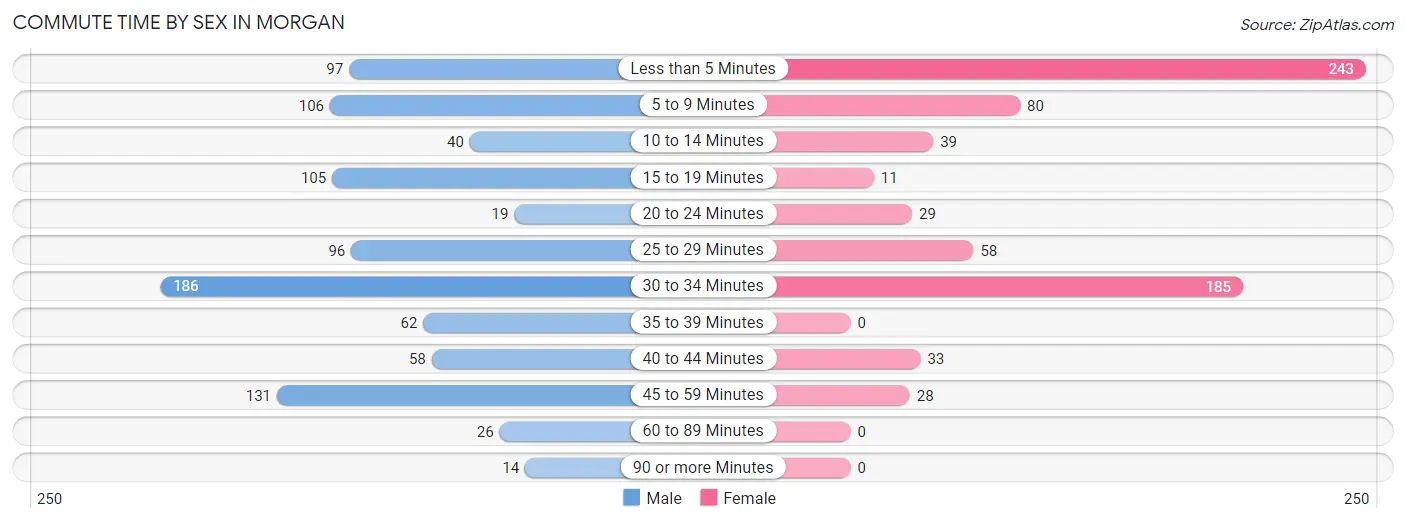
Commute Time by Sex in Morgan
The most common commute times in Morgan are 30 to 34 minutes (186 commuters, 19.8%) for males and less than 5 minutes (243 commuters, 34.4%) for females.
| Commute Time | Male | Female |
| Less than 5 Minutes | 97 (10.3%) | 243 (34.4%) |
| 5 to 9 Minutes | 106 (11.3%) | 80 (11.3%) |
| 10 to 14 Minutes | 40 (4.3%) | 39 (5.5%) |
| 15 to 19 Minutes | 105 (11.2%) | 11 (1.6%) |
| 20 to 24 Minutes | 19 (2.0%) | 29 (4.1%) |
| 25 to 29 Minutes | 96 (10.2%) | 58 (8.2%) |
| 30 to 34 Minutes | 186 (19.8%) | 185 (26.2%) |
| 35 to 39 Minutes | 62 (6.6%) | 0 (0.0%) |
| 40 to 44 Minutes | 58 (6.2%) | 33 (4.7%) |
| 45 to 59 Minutes | 131 (13.9%) | 28 (4.0%) |
| 60 to 89 Minutes | 26 (2.8%) | 0 (0.0%) |
| 90 or more Minutes | 14 (1.5%) | 0 (0.0%) |
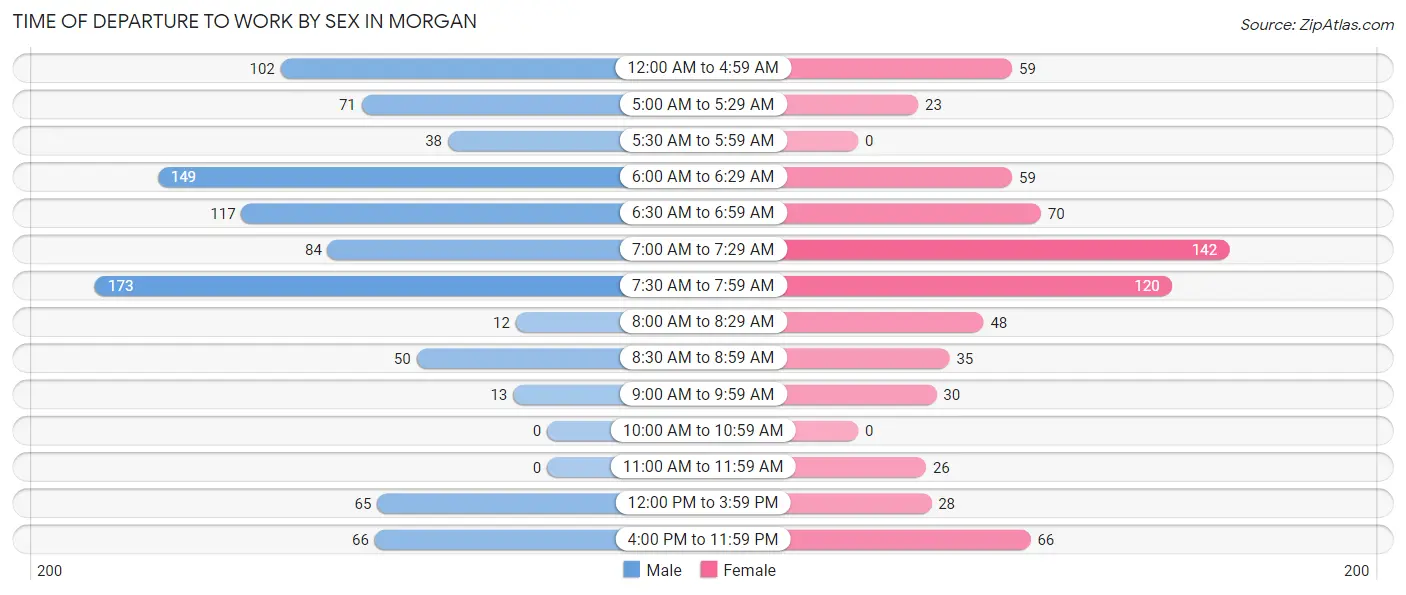
Time of Departure to Work by Sex in Morgan
The most frequent times of departure to work in Morgan are 7:30 AM to 7:59 AM (173, 18.4%) for males and 7:00 AM to 7:29 AM (142, 20.1%) for females.
| Time of Departure | Male | Female |
| 12:00 AM to 4:59 AM | 102 (10.8%) | 59 (8.4%) |
| 5:00 AM to 5:29 AM | 71 (7.5%) | 23 (3.3%) |
| 5:30 AM to 5:59 AM | 38 (4.0%) | 0 (0.0%) |
| 6:00 AM to 6:29 AM | 149 (15.9%) | 59 (8.4%) |
| 6:30 AM to 6:59 AM | 117 (12.4%) | 70 (9.9%) |
| 7:00 AM to 7:29 AM | 84 (8.9%) | 142 (20.1%) |
| 7:30 AM to 7:59 AM | 173 (18.4%) | 120 (17.0%) |
| 8:00 AM to 8:29 AM | 12 (1.3%) | 48 (6.8%) |
| 8:30 AM to 8:59 AM | 50 (5.3%) | 35 (5.0%) |
| 9:00 AM to 9:59 AM | 13 (1.4%) | 30 (4.3%) |
| 10:00 AM to 10:59 AM | 0 (0.0%) | 0 (0.0%) |
| 11:00 AM to 11:59 AM | 0 (0.0%) | 26 (3.7%) |
| 12:00 PM to 3:59 PM | 65 (6.9%) | 28 (4.0%) |
| 4:00 PM to 11:59 PM | 66 (7.0%) | 66 (9.3%) |
| Total | 940 (100.0%) | 706 (100.0%) |
Housing Occupancy in Morgan
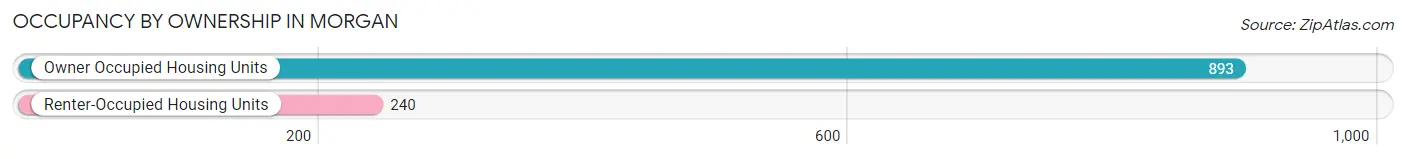
Occupancy by Ownership in Morgan
Of the total 1,133 dwellings in Morgan, owner-occupied units account for 893 (78.8%), while renter-occupied units make up 240 (21.2%).
| Occupancy | # Housing Units | % Housing Units |
| Owner Occupied Housing Units | 893 | 78.8% |
| Renter-Occupied Housing Units | 240 | 21.2% |
| Total Occupied Housing Units | 1,133 | 100.0% |
Occupancy by Household Size in Morgan
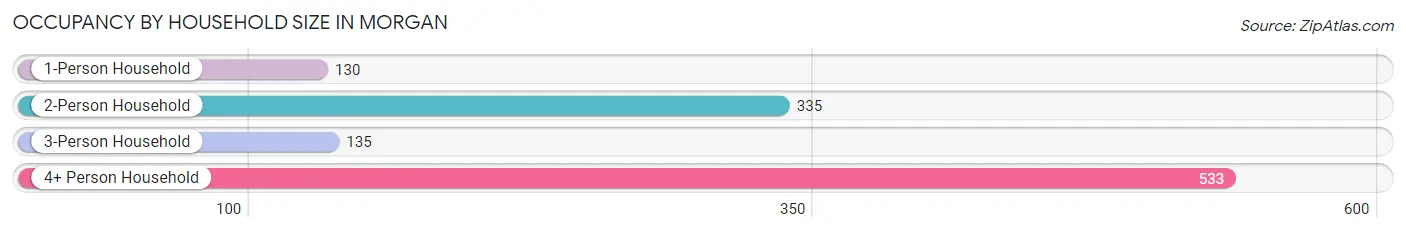
| Household Size | # Housing Units | % Housing Units |
| 1-Person Household | 130 | 11.5% |
| 2-Person Household | 335 | 29.6% |
| 3-Person Household | 135 | 11.9% |
| 4+ Person Household | 533 | 47.0% |
| Total Housing Units | 1,133 | 100.0% |
Occupancy by Ownership by Household Size in Morgan
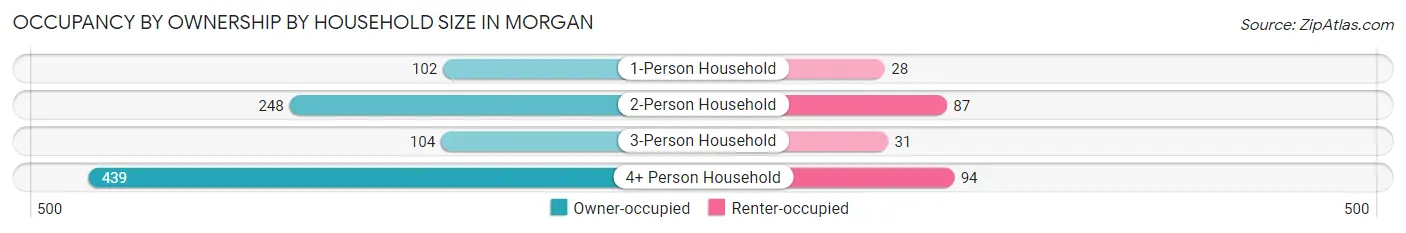
| Household Size | Owner-occupied | Renter-occupied |
| 1-Person Household | 102 (78.5%) | 28 (21.5%) |
| 2-Person Household | 248 (74.0%) | 87 (26.0%) |
| 3-Person Household | 104 (77.0%) | 31 (23.0%) |
| 4+ Person Household | 439 (82.4%) | 94 (17.6%) |
| Total Housing Units | 893 (78.8%) | 240 (21.2%) |
Occupancy by Educational Attainment in Morgan
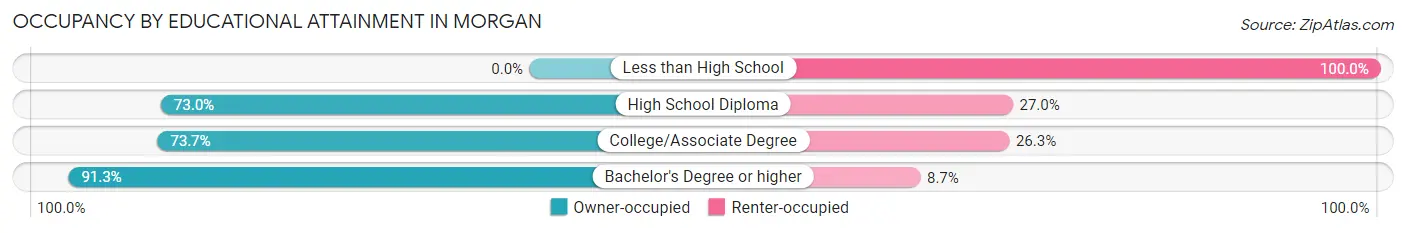
| Household Size | Owner-occupied | Renter-occupied |
| Less than High School | 0 (0.0%) | 1 (100.0%) |
| High School Diploma | 189 (73.0%) | 70 (27.0%) |
| College/Associate Degree | 389 (73.7%) | 139 (26.3%) |
| Bachelor's Degree or higher | 315 (91.3%) | 30 (8.7%) |
Occupancy by Age of Householder in Morgan
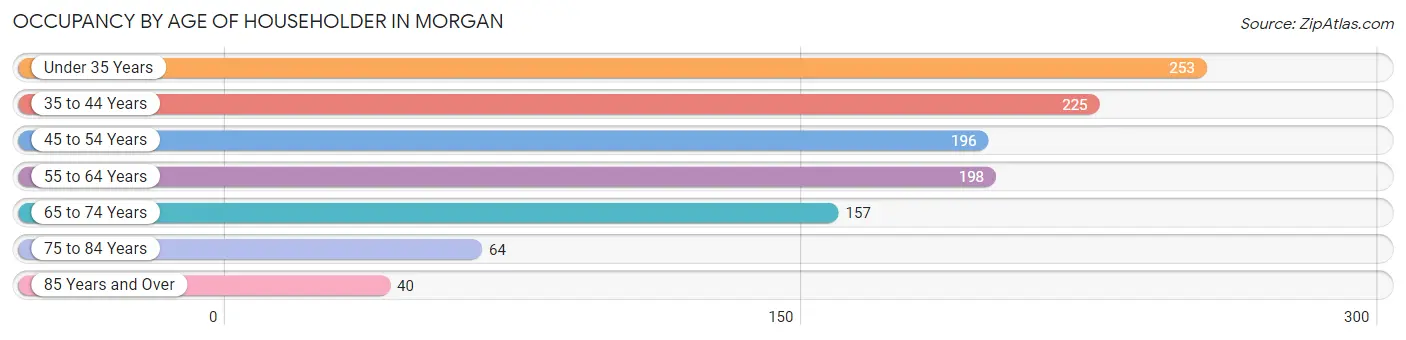
| Age Bracket | # Households | % Households |
| Under 35 Years | 253 | 22.3% |
| 35 to 44 Years | 225 | 19.9% |
| 45 to 54 Years | 196 | 17.3% |
| 55 to 64 Years | 198 | 17.5% |
| 65 to 74 Years | 157 | 13.9% |
| 75 to 84 Years | 64 | 5.7% |
| 85 Years and Over | 40 | 3.5% |
| Total | 1,133 | 100.0% |
Housing Finances in Morgan
Median Income by Occupancy in Morgan
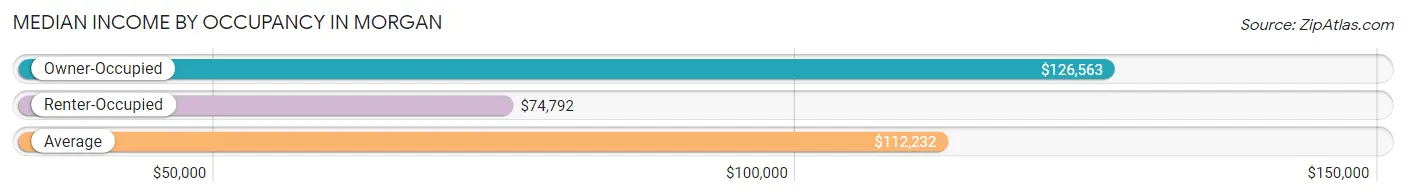
| Occupancy Type | # Households | Median Income |
| Owner-Occupied | 893 (78.8%) | $126,563 |
| Renter-Occupied | 240 (21.2%) | $74,792 |
| Average | 1,133 (100.0%) | $112,232 |
Occupancy by Householder Income Bracket in Morgan
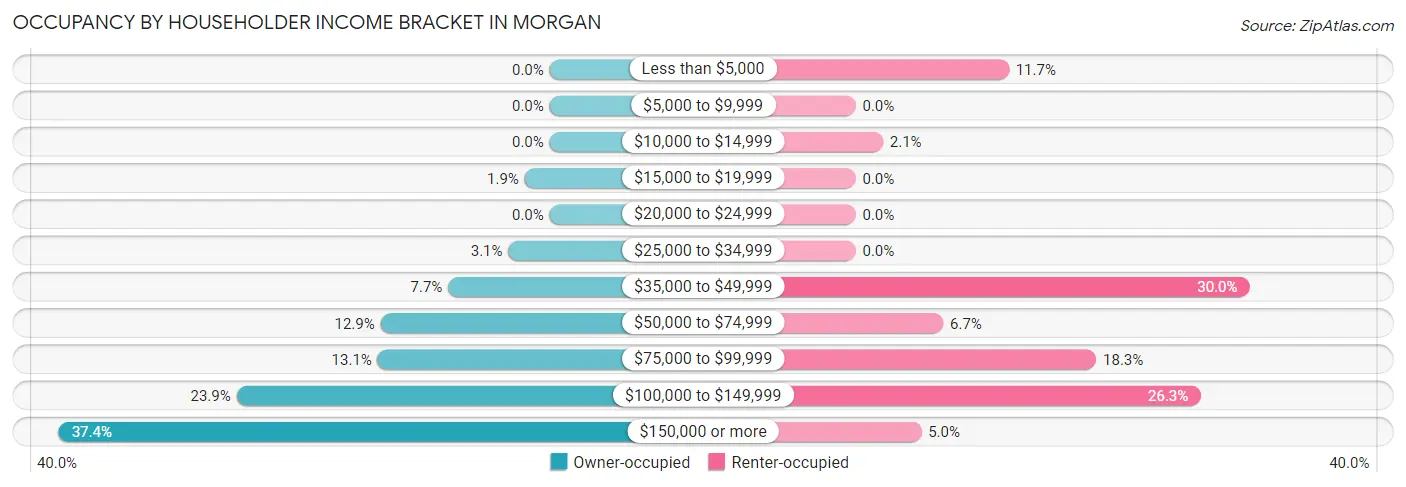
| Income Bracket | Owner-occupied | Renter-occupied |
| Less than $5,000 | 0 (0.0%) | 28 (11.7%) |
| $5,000 to $9,999 | 0 (0.0%) | 0 (0.0%) |
| $10,000 to $14,999 | 0 (0.0%) | 5 (2.1%) |
| $15,000 to $19,999 | 17 (1.9%) | 0 (0.0%) |
| $20,000 to $24,999 | 0 (0.0%) | 0 (0.0%) |
| $25,000 to $34,999 | 28 (3.1%) | 0 (0.0%) |
| $35,000 to $49,999 | 69 (7.7%) | 72 (30.0%) |
| $50,000 to $74,999 | 115 (12.9%) | 16 (6.7%) |
| $75,000 to $99,999 | 117 (13.1%) | 44 (18.3%) |
| $100,000 to $149,999 | 213 (23.8%) | 63 (26.3%) |
| $150,000 or more | 334 (37.4%) | 12 (5.0%) |
| Total | 893 (100.0%) | 240 (100.0%) |
Monthly Housing Cost Tiers in Morgan
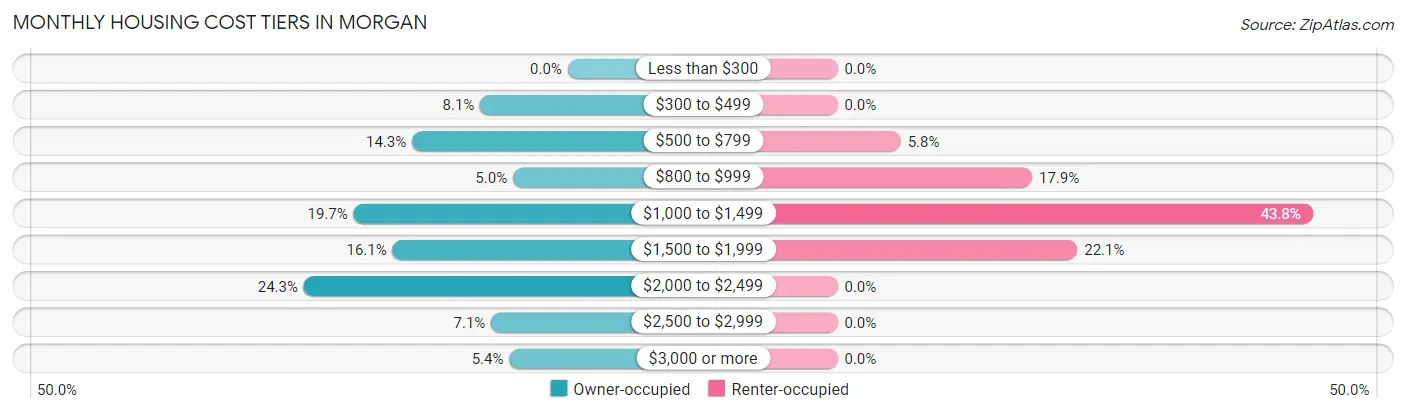
| Monthly Cost | Owner-occupied | Renter-occupied |
| Less than $300 | 0 (0.0%) | 0 (0.0%) |
| $300 to $499 | 72 (8.1%) | 0 (0.0%) |
| $500 to $799 | 128 (14.3%) | 14 (5.8%) |
| $800 to $999 | 45 (5.0%) | 43 (17.9%) |
| $1,000 to $1,499 | 176 (19.7%) | 105 (43.8%) |
| $1,500 to $1,999 | 144 (16.1%) | 53 (22.1%) |
| $2,000 to $2,499 | 217 (24.3%) | 0 (0.0%) |
| $2,500 to $2,999 | 63 (7.0%) | 0 (0.0%) |
| $3,000 or more | 48 (5.4%) | 0 (0.0%) |
| Total | 893 (100.0%) | 240 (100.0%) |
Physical Housing Characteristics in Morgan
Housing Structures in Morgan
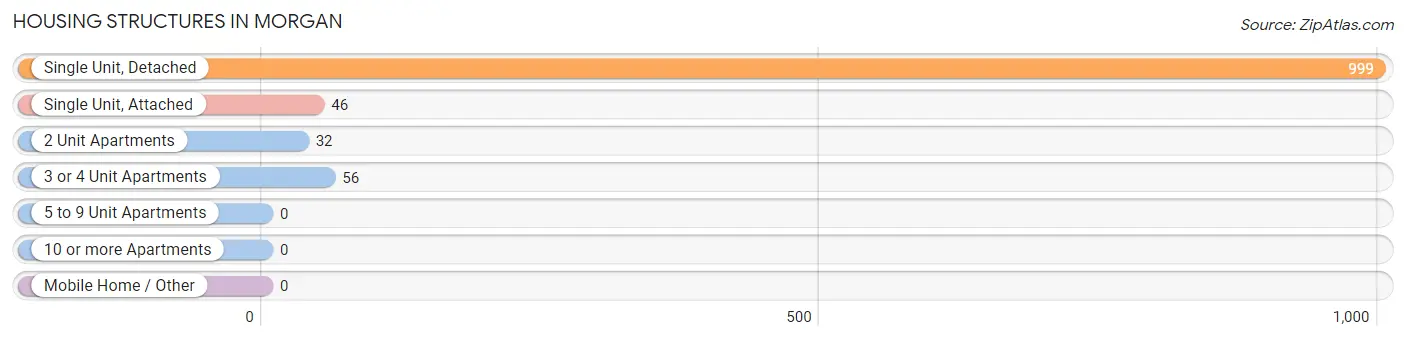
| Structure Type | # Housing Units | % Housing Units |
| Single Unit, Detached | 999 | 88.2% |
| Single Unit, Attached | 46 | 4.1% |
| 2 Unit Apartments | 32 | 2.8% |
| 3 or 4 Unit Apartments | 56 | 4.9% |
| 5 to 9 Unit Apartments | 0 | 0.0% |
| 10 or more Apartments | 0 | 0.0% |
| Mobile Home / Other | 0 | 0.0% |
| Total | 1,133 | 100.0% |
Housing Structures by Occupancy in Morgan
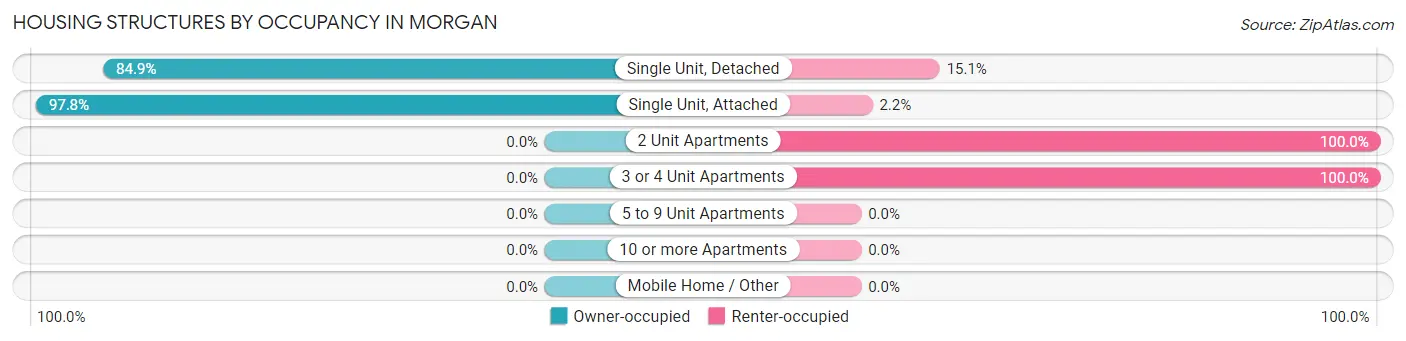
| Structure Type | Owner-occupied | Renter-occupied |
| Single Unit, Detached | 848 (84.9%) | 151 (15.1%) |
| Single Unit, Attached | 45 (97.8%) | 1 (2.2%) |
| 2 Unit Apartments | 0 (0.0%) | 32 (100.0%) |
| 3 or 4 Unit Apartments | 0 (0.0%) | 56 (100.0%) |
| 5 to 9 Unit Apartments | 0 (0.0%) | 0 (0.0%) |
| 10 or more Apartments | 0 (0.0%) | 0 (0.0%) |
| Mobile Home / Other | 0 (0.0%) | 0 (0.0%) |
| Total | 893 (78.8%) | 240 (21.2%) |
Housing Structures by Number of Rooms in Morgan
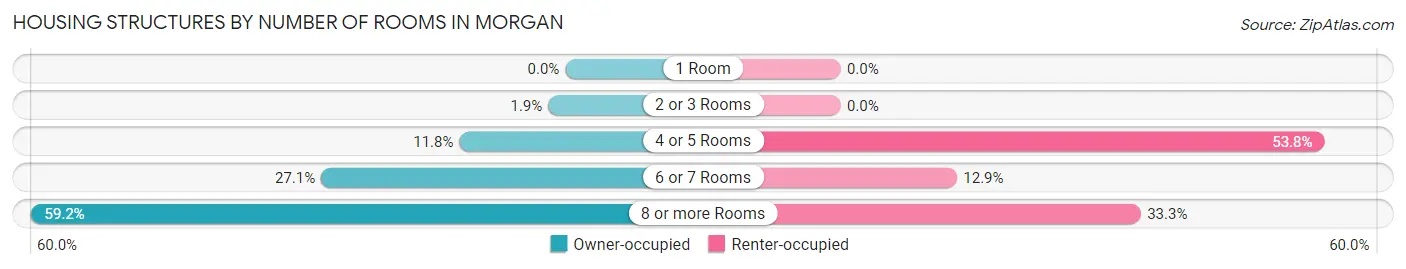
| Number of Rooms | Owner-occupied | Renter-occupied |
| 1 Room | 0 (0.0%) | 0 (0.0%) |
| 2 or 3 Rooms | 17 (1.9%) | 0 (0.0%) |
| 4 or 5 Rooms | 105 (11.8%) | 129 (53.7%) |
| 6 or 7 Rooms | 242 (27.1%) | 31 (12.9%) |
| 8 or more Rooms | 529 (59.2%) | 80 (33.3%) |
| Total | 893 (100.0%) | 240 (100.0%) |
Housing Structure by Heating Type in Morgan
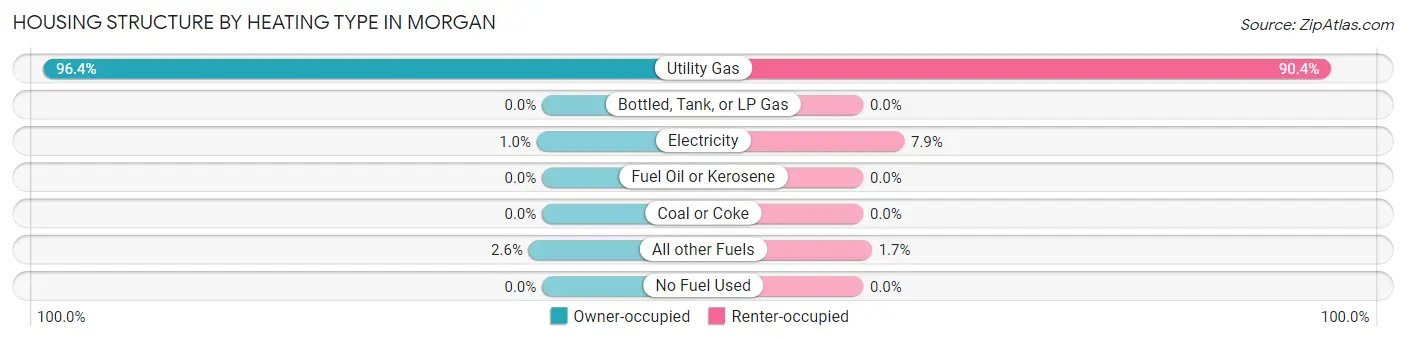
| Heating Type | Owner-occupied | Renter-occupied |
| Utility Gas | 861 (96.4%) | 217 (90.4%) |
| Bottled, Tank, or LP Gas | 0 (0.0%) | 0 (0.0%) |
| Electricity | 9 (1.0%) | 19 (7.9%) |
| Fuel Oil or Kerosene | 0 (0.0%) | 0 (0.0%) |
| Coal or Coke | 0 (0.0%) | 0 (0.0%) |
| All other Fuels | 23 (2.6%) | 4 (1.7%) |
| No Fuel Used | 0 (0.0%) | 0 (0.0%) |
| Total | 893 (100.0%) | 240 (100.0%) |
Household Vehicle Usage in Morgan
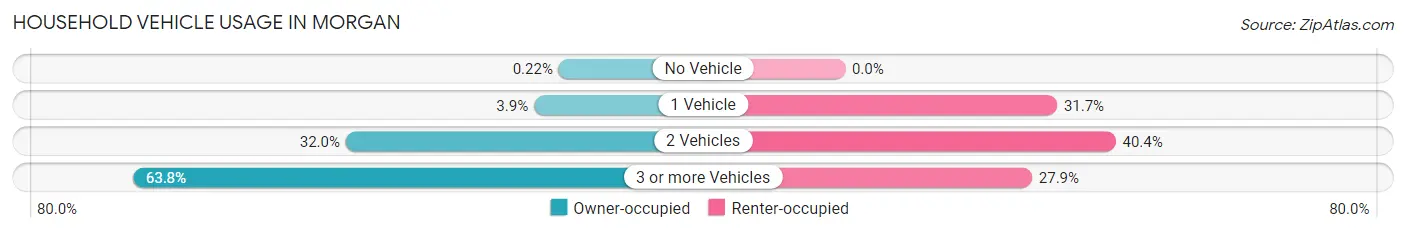
| Vehicles per Household | Owner-occupied | Renter-occupied |
| No Vehicle | 2 (0.2%) | 0 (0.0%) |
| 1 Vehicle | 35 (3.9%) | 76 (31.7%) |
| 2 Vehicles | 286 (32.0%) | 97 (40.4%) |
| 3 or more Vehicles | 570 (63.8%) | 67 (27.9%) |
| Total | 893 (100.0%) | 240 (100.0%) |
Real Estate & Mortgages in Morgan
Real Estate and Mortgage Overview in Morgan
| Characteristic | Without Mortgage | With Mortgage |
| Housing Units | 225 | 668 |
| Median Property Value | $433,100 | $401,600 |
| Median Household Income | $110,536 | $253 |
| Monthly Housing Costs | $560 | $48 |
| Real Estate Taxes | $2,550 | $44 |
Property Value by Mortgage Status in Morgan
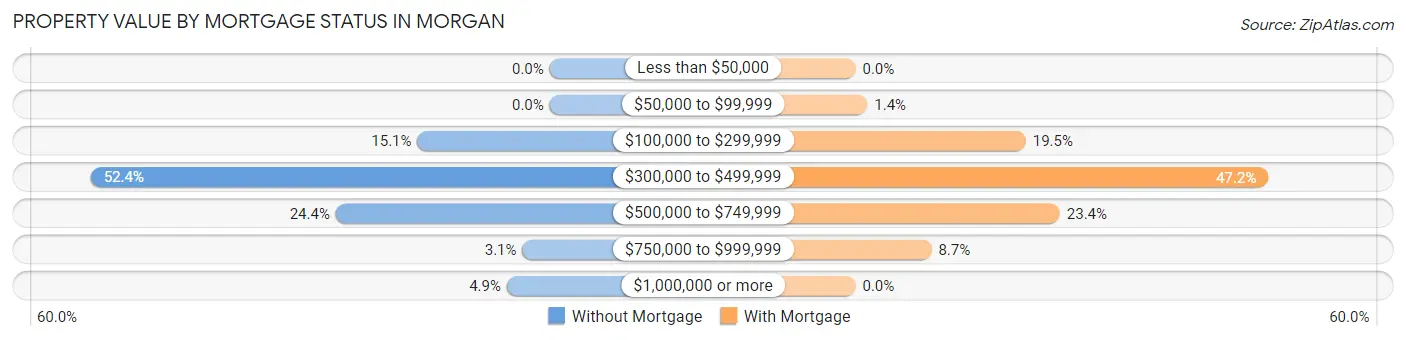
| Property Value | Without Mortgage | With Mortgage |
| Less than $50,000 | 0 (0.0%) | 0 (0.0%) |
| $50,000 to $99,999 | 0 (0.0%) | 9 (1.3%) |
| $100,000 to $299,999 | 34 (15.1%) | 130 (19.5%) |
| $300,000 to $499,999 | 118 (52.4%) | 315 (47.2%) |
| $500,000 to $749,999 | 55 (24.4%) | 156 (23.4%) |
| $750,000 to $999,999 | 7 (3.1%) | 58 (8.7%) |
| $1,000,000 or more | 11 (4.9%) | 0 (0.0%) |
| Total | 225 (100.0%) | 668 (100.0%) |
Household Income by Mortgage Status in Morgan
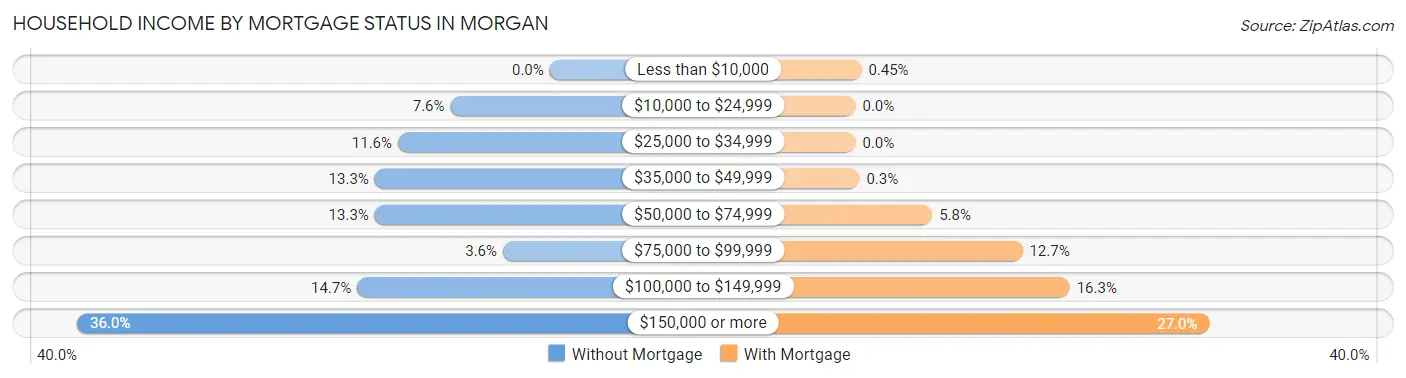
| Household Income | Without Mortgage | With Mortgage |
| Less than $10,000 | 0 (0.0%) | 3 (0.4%) |
| $10,000 to $24,999 | 17 (7.6%) | 0 (0.0%) |
| $25,000 to $34,999 | 26 (11.6%) | 0 (0.0%) |
| $35,000 to $49,999 | 30 (13.3%) | 2 (0.3%) |
| $50,000 to $74,999 | 30 (13.3%) | 39 (5.8%) |
| $75,000 to $99,999 | 8 (3.6%) | 85 (12.7%) |
| $100,000 to $149,999 | 33 (14.7%) | 109 (16.3%) |
| $150,000 or more | 81 (36.0%) | 180 (27.0%) |
| Total | 225 (100.0%) | 668 (100.0%) |
Property Value to Household Income Ratio in Morgan
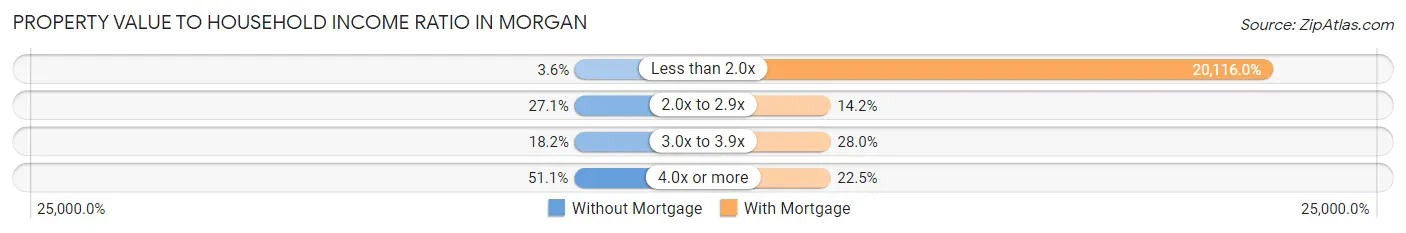
| Value-to-Income Ratio | Without Mortgage | With Mortgage |
| Less than 2.0x | 8 (3.6%) | 134,375 (20,116.0%) |
| 2.0x to 2.9x | 61 (27.1%) | 95 (14.2%) |
| 3.0x to 3.9x | 41 (18.2%) | 187 (28.0%) |
| 4.0x or more | 115 (51.1%) | 150 (22.5%) |
| Total | 225 (100.0%) | 668 (100.0%) |
Real Estate Taxes by Mortgage Status in Morgan
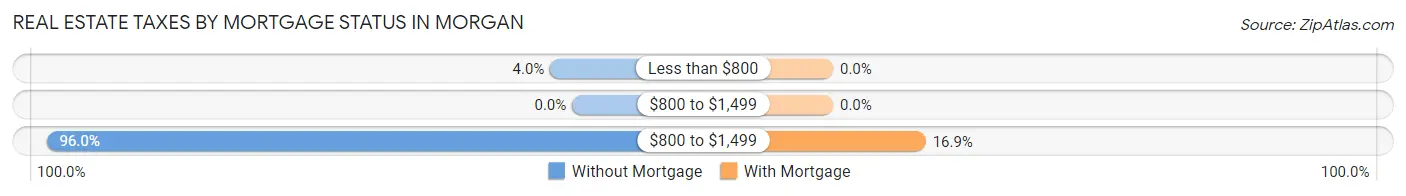
| Property Taxes | Without Mortgage | With Mortgage |
| Less than $800 | 9 (4.0%) | 0 (0.0%) |
| $800 to $1,499 | 0 (0.0%) | 0 (0.0%) |
| $800 to $1,499 | 216 (96.0%) | 113 (16.9%) |
| Total | 225 (100.0%) | 668 (100.0%) |
Health & Disability in Morgan
Health Insurance Coverage by Age in Morgan
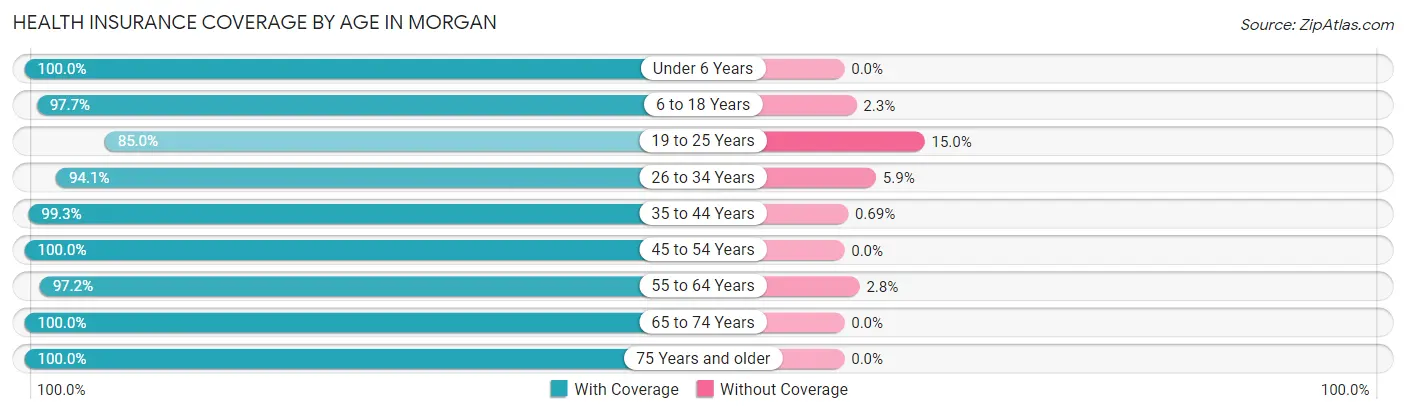
| Age Bracket | With Coverage | Without Coverage |
| Under 6 Years | 452 (100.0%) | 0 (0.0%) |
| 6 to 18 Years | 1,166 (97.7%) | 27 (2.3%) |
| 19 to 25 Years | 233 (85.0%) | 41 (15.0%) |
| 26 to 34 Years | 447 (94.1%) | 28 (5.9%) |
| 35 to 44 Years | 573 (99.3%) | 4 (0.7%) |
| 45 to 54 Years | 353 (100.0%) | 0 (0.0%) |
| 55 to 64 Years | 378 (97.2%) | 11 (2.8%) |
| 65 to 74 Years | 335 (100.0%) | 0 (0.0%) |
| 75 Years and older | 125 (100.0%) | 0 (0.0%) |
| Total | 4,062 (97.3%) | 111 (2.7%) |
Health Insurance Coverage by Citizenship Status in Morgan
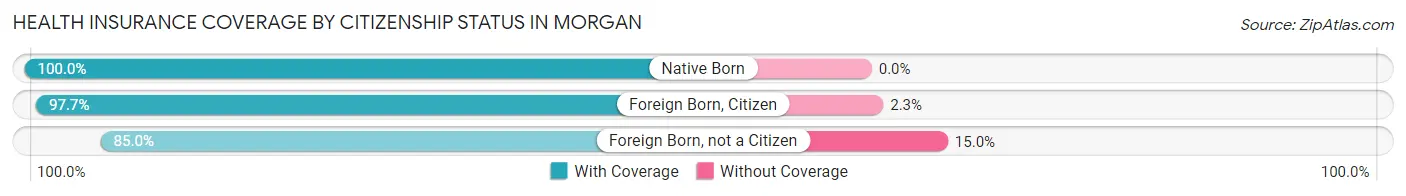
| Citizenship Status | With Coverage | Without Coverage |
| Native Born | 452 (100.0%) | 0 (0.0%) |
| Foreign Born, Citizen | 1,166 (97.7%) | 27 (2.3%) |
| Foreign Born, not a Citizen | 233 (85.0%) | 41 (15.0%) |
Health Insurance Coverage by Household Income in Morgan
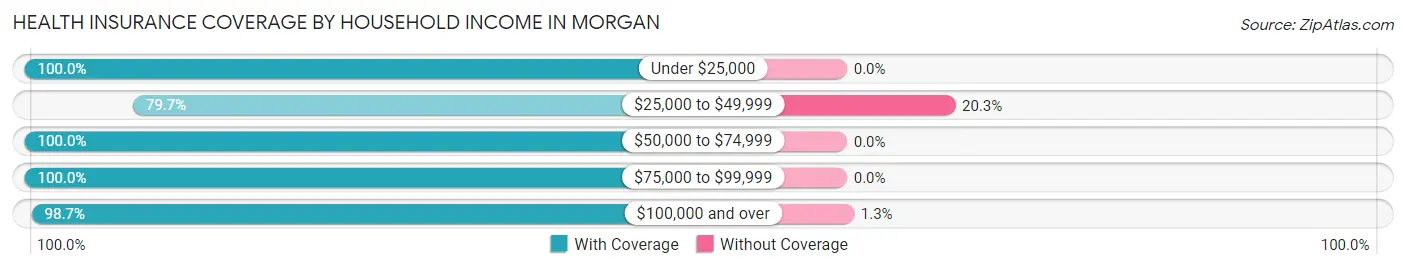
| Household Income | With Coverage | Without Coverage |
| Under $25,000 | 64 (100.0%) | 0 (0.0%) |
| $25,000 to $49,999 | 283 (79.7%) | 72 (20.3%) |
| $50,000 to $74,999 | 390 (100.0%) | 0 (0.0%) |
| $75,000 to $99,999 | 408 (100.0%) | 0 (0.0%) |
| $100,000 and over | 2,917 (98.7%) | 39 (1.3%) |
Public vs Private Health Insurance Coverage by Age in Morgan
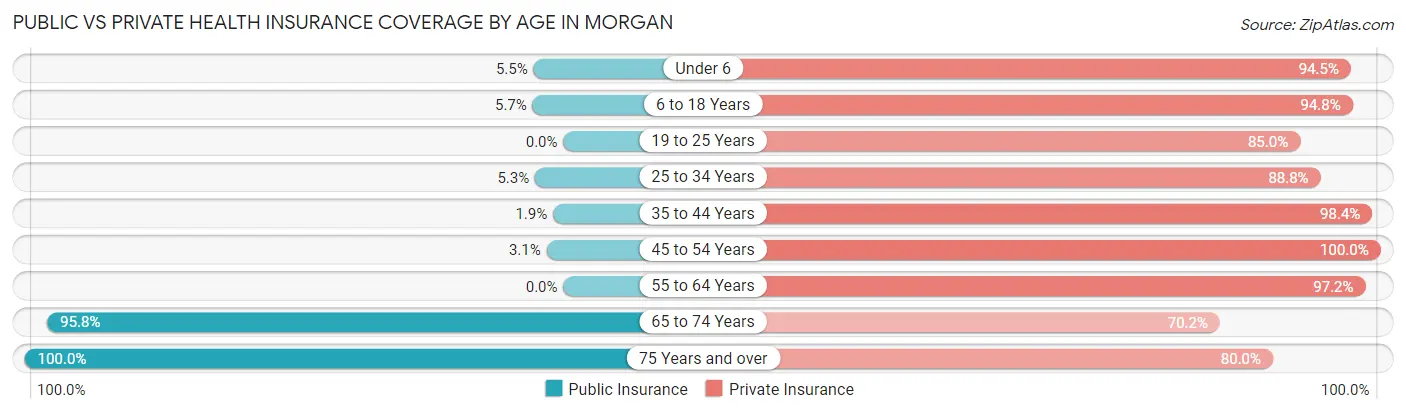
| Age Bracket | Public Insurance | Private Insurance |
| Under 6 | 25 (5.5%) | 427 (94.5%) |
| 6 to 18 Years | 68 (5.7%) | 1,131 (94.8%) |
| 19 to 25 Years | 0 (0.0%) | 233 (85.0%) |
| 25 to 34 Years | 25 (5.3%) | 422 (88.8%) |
| 35 to 44 Years | 11 (1.9%) | 568 (98.4%) |
| 45 to 54 Years | 11 (3.1%) | 353 (100.0%) |
| 55 to 64 Years | 0 (0.0%) | 378 (97.2%) |
| 65 to 74 Years | 321 (95.8%) | 235 (70.2%) |
| 75 Years and over | 125 (100.0%) | 100 (80.0%) |
| Total | 586 (14.0%) | 3,847 (92.2%) |
Disability Status by Sex by Age in Morgan
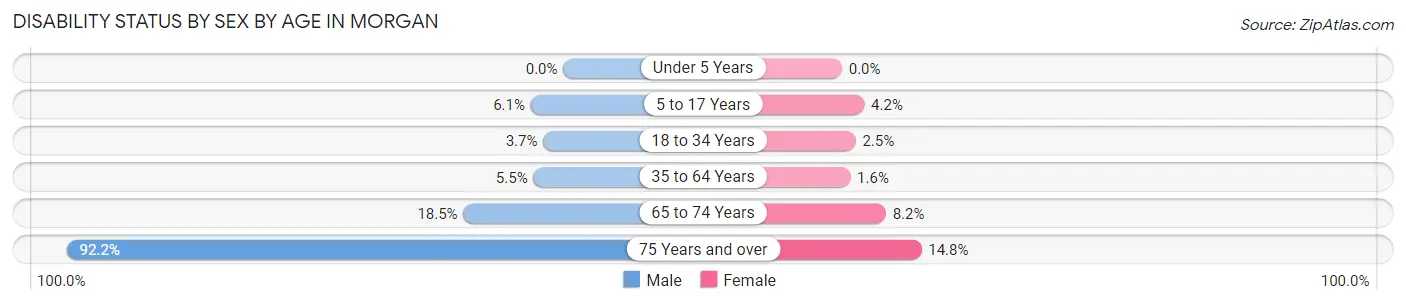
| Age Bracket | Male | Female |
| Under 5 Years | 0 (0.0%) | 0 (0.0%) |
| 5 to 17 Years | 40 (6.0%) | 21 (4.2%) |
| 18 to 34 Years | 13 (3.7%) | 12 (2.5%) |
| 35 to 64 Years | 41 (5.5%) | 9 (1.5%) |
| 65 to 74 Years | 28 (18.5%) | 15 (8.2%) |
| 75 Years and over | 59 (92.2%) | 9 (14.7%) |
Disability Class by Sex by Age in Morgan
Disability Class: Hearing Difficulty
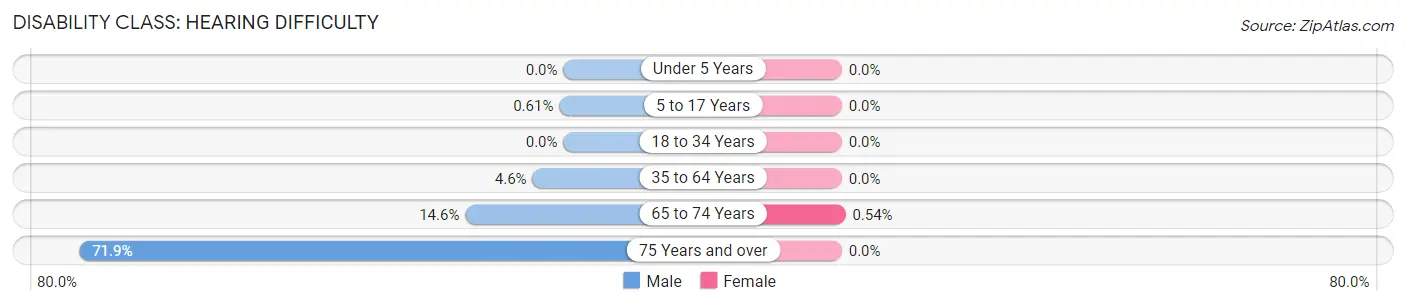
| Age Bracket | Male | Female |
| Under 5 Years | 0 (0.0%) | 0 (0.0%) |
| 5 to 17 Years | 4 (0.6%) | 0 (0.0%) |
| 18 to 34 Years | 0 (0.0%) | 0 (0.0%) |
| 35 to 64 Years | 34 (4.6%) | 0 (0.0%) |
| 65 to 74 Years | 22 (14.6%) | 1 (0.5%) |
| 75 Years and over | 46 (71.9%) | 0 (0.0%) |
Disability Class: Vision Difficulty
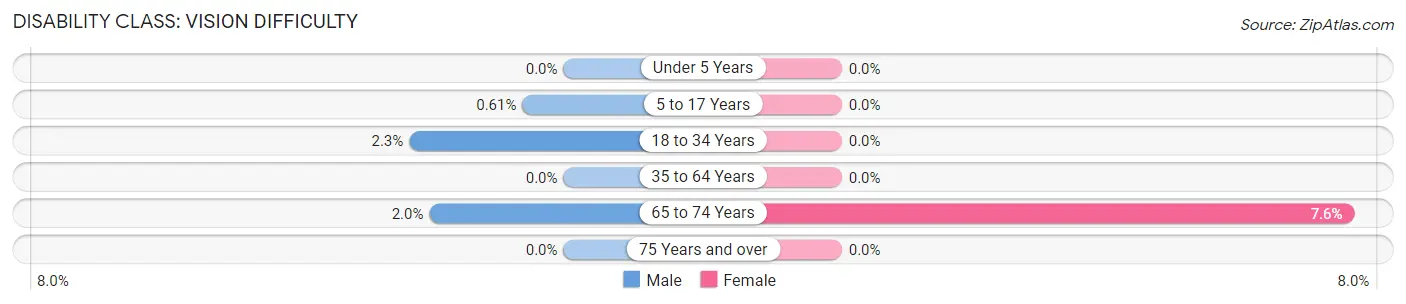
| Age Bracket | Male | Female |
| Under 5 Years | 0 (0.0%) | 0 (0.0%) |
| 5 to 17 Years | 4 (0.6%) | 0 (0.0%) |
| 18 to 34 Years | 8 (2.3%) | 0 (0.0%) |
| 35 to 64 Years | 0 (0.0%) | 0 (0.0%) |
| 65 to 74 Years | 3 (2.0%) | 14 (7.6%) |
| 75 Years and over | 0 (0.0%) | 0 (0.0%) |
Disability Class: Cognitive Difficulty
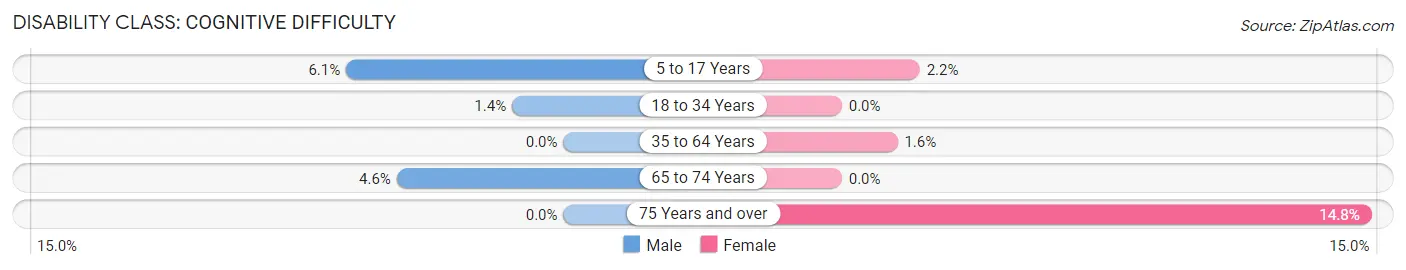
| Age Bracket | Male | Female |
| 5 to 17 Years | 40 (6.0%) | 11 (2.2%) |
| 18 to 34 Years | 5 (1.4%) | 0 (0.0%) |
| 35 to 64 Years | 0 (0.0%) | 9 (1.5%) |
| 65 to 74 Years | 7 (4.6%) | 0 (0.0%) |
| 75 Years and over | 0 (0.0%) | 9 (14.7%) |
Disability Class: Ambulatory Difficulty
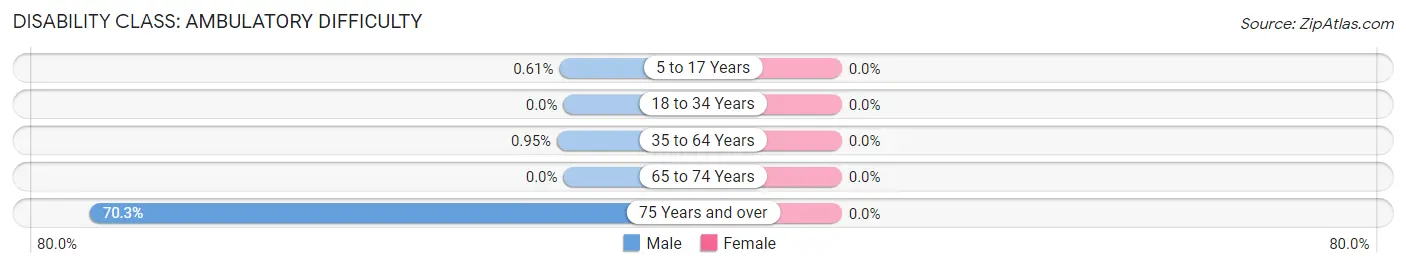
| Age Bracket | Male | Female |
| 5 to 17 Years | 4 (0.6%) | 0 (0.0%) |
| 18 to 34 Years | 0 (0.0%) | 0 (0.0%) |
| 35 to 64 Years | 7 (0.9%) | 0 (0.0%) |
| 65 to 74 Years | 0 (0.0%) | 0 (0.0%) |
| 75 Years and over | 45 (70.3%) | 0 (0.0%) |
Disability Class: Self-Care Difficulty
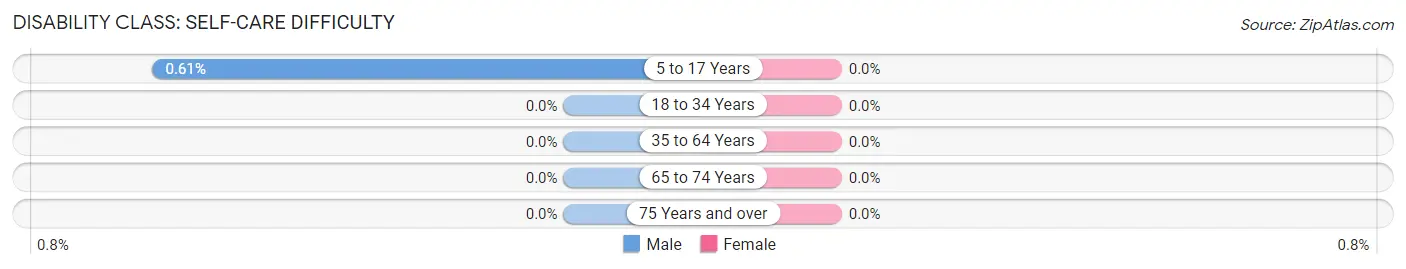
| Age Bracket | Male | Female |
| 5 to 17 Years | 4 (0.6%) | 0 (0.0%) |
| 18 to 34 Years | 0 (0.0%) | 0 (0.0%) |
| 35 to 64 Years | 0 (0.0%) | 0 (0.0%) |
| 65 to 74 Years | 0 (0.0%) | 0 (0.0%) |
| 75 Years and over | 0 (0.0%) | 0 (0.0%) |
Technology Access in Morgan
Computing Device Access in Morgan
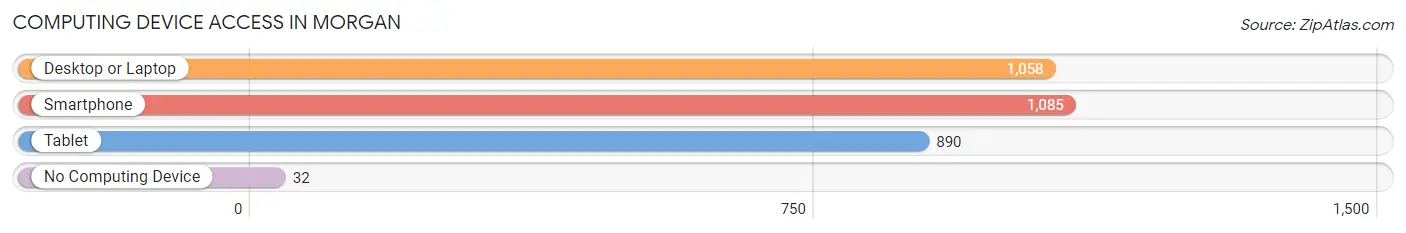
| Device Type | # Households | % Households |
| Desktop or Laptop | 1,058 | 93.4% |
| Smartphone | 1,085 | 95.8% |
| Tablet | 890 | 78.5% |
| No Computing Device | 32 | 2.8% |
| Total | 1,133 | 100.0% |
Internet Access in Morgan
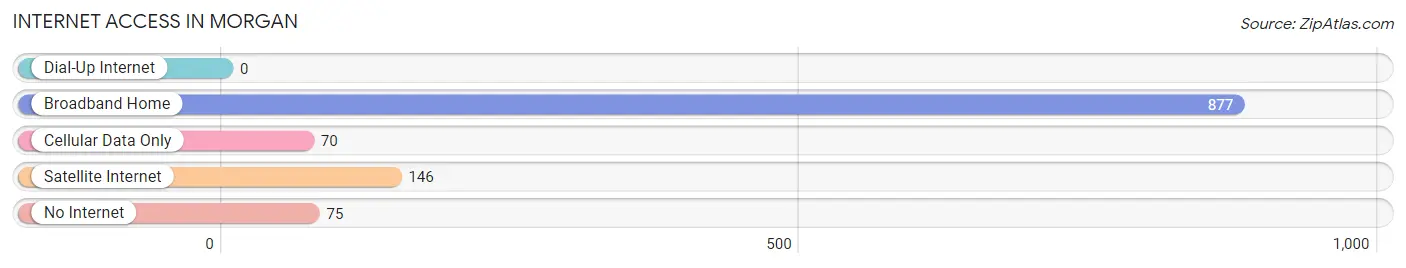
| Internet Type | # Households | % Households |
| Dial-Up Internet | 0 | 0.0% |
| Broadband Home | 877 | 77.4% |
| Cellular Data Only | 70 | 6.2% |
| Satellite Internet | 146 | 12.9% |
| No Internet | 75 | 6.6% |
| Total | 1,133 | 100.0% |
Morgan Summary
Morgan, Utah is a small city located in the northern part of the state, about 40 miles north of Salt Lake City. It is the county seat of Morgan County and has a population of about 2,000 people. The city is situated in a valley surrounded by the Wasatch Mountains and is known for its rural atmosphere and outdoor recreation opportunities.
History
The area that is now Morgan was first settled in 1855 by a group of Mormon pioneers led by John Morgan. The settlement was originally called Morganville, but the name was changed to Morgan in 1868. The city was incorporated in 1887 and has remained relatively small since then.
Geography
Morgan is located in the northern part of Utah, about 40 miles north of Salt Lake City. It is situated in a valley surrounded by the Wasatch Mountains. The city is located at an elevation of 4,890 feet and has a total area of 2.2 square miles. The climate is semi-arid, with hot summers and cold winters.
Economy
The economy of Morgan is largely based on agriculture and tourism. The city is home to several farms and ranches, as well as a number of small businesses. Tourism is also an important part of the local economy, with visitors coming to enjoy the city’s outdoor recreation opportunities.
Demographics
As of the 2010 census, the population of Morgan was 2,000. The racial makeup of the city was 95.2% White, 0.7% Native American, 0.3% Asian, 0.2% African American, and 3.6% from other races. The median household income was $45,000 and the median family income was $50,000.
Conclusion
Morgan, Utah is a small city located in the northern part of the state, about 40 miles north of Salt Lake City. It is the county seat of Morgan County and has a population of about 2,000 people. The city is situated in a valley surrounded by the Wasatch Mountains and is known for its rural atmosphere and outdoor recreation opportunities. The economy of Morgan is largely based on agriculture and tourism, and the city has a diverse population. Morgan is a great place to visit and explore, and offers a unique experience for those looking to get away from the hustle and bustle of city life.
Common Questions
What is the Total Population of Morgan?
Total Population of Morgan is 4,173.
What is the Total Male Population of Morgan?
Total Male Population of Morgan is 2,127.
What is the Total Female Population of Morgan?
Total Female Population of Morgan is 2,046.
What is the Ratio of Males per 100 Females in Morgan?
There are 103.96 Males per 100 Females in Morgan.
What is the Ratio of Females per 100 Males in Morgan?
There are 96.19 Females per 100 Males in Morgan.
What is the Median Population Age in Morgan?
Median Population Age in Morgan is 28.4 Years.
What is the Average Family Size in Morgan
Average Family Size in Morgan is 4.0 People.
What is the Average Household Size in Morgan
Average Household Size in Morgan is 3.7 People.
What is Per Capita Income in Morgan?
Per Capita income in Morgan is $35,722.
What is the Median Family Income in Morgan?
Median Family Income in Morgan is $116,875.
What is the Median Household income in Morgan?
Median Household Income in Morgan is $112,232.
What is Income or Wage Gap in Morgan?
Income or Wage Gap in Morgan is 68.0%.
Women in Morgan earn 32.0 cents for every dollar earned by a man.
What is Inequality or Gini Index in Morgan?
Inequality or Gini Index in Morgan is 0.38.
How Large is the Labor Force in Morgan?
There are 1,914 People in the Labor Forcein in Morgan.
What is the Percentage of People in the Labor Force in Morgan?
68.7% of People are in the Labor Force in Morgan.
What is the Unemployment Rate in Morgan?
Unemployment Rate in Morgan is 2.7%.