Marriott Slaterville, UT
Marriott Slaterville Map
Marriott Slaterville Overview
2,041
TOTAL POPULATION
1,168
MALE POPULATION
873
FEMALE POPULATION
133.79
MALES / 100 FEMALES
74.74
FEMALES / 100 MALES
36.7
MEDIAN AGE
3.1
AVG FAMILY SIZE
2.8
AVG HOUSEHOLD SIZE
$38,664
PER CAPITA INCOME
$92,708
AVG FAMILY INCOME
$82,098
AVG HOUSEHOLD INCOME
51.3%
WAGE / INCOME GAP [ % ]
48.7¢/ $1
WAGE / INCOME GAP [ $ ]
0.36
INEQUALITY / GINI INDEX
1,065
LABOR FORCE [ PEOPLE ]
67.0%
PERCENT IN LABOR FORCE
1.4%
UNEMPLOYMENT RATE
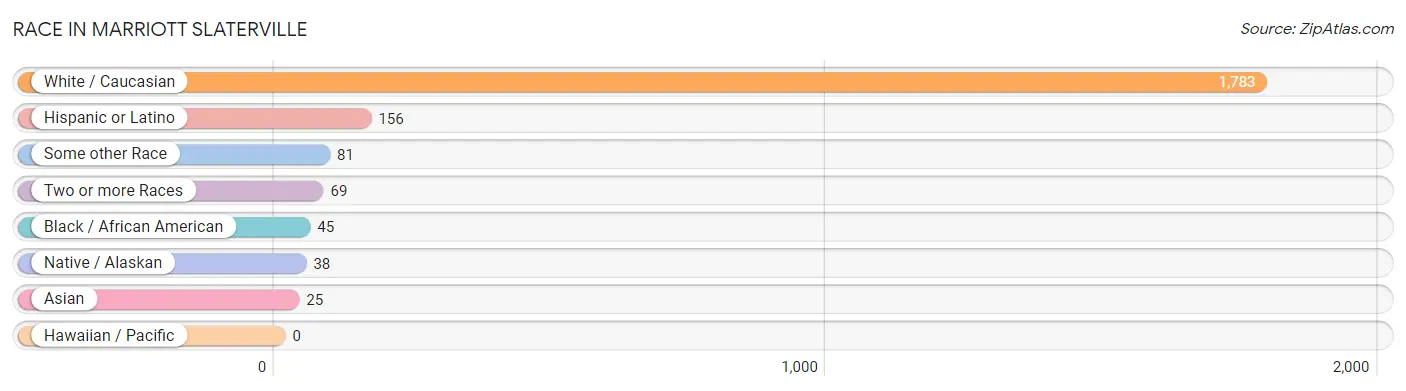
Race in Marriott Slaterville
The most populous races in Marriott Slaterville are White / Caucasian (1,783 | 87.4%), Hispanic or Latino (156 | 7.6%), and Some other Race (81 | 4.0%).
| Race | # Population | % Population |
| Asian | 25 | 1.2% |
| Black / African American | 45 | 2.2% |
| Hawaiian / Pacific | 0 | 0.0% |
| Hispanic or Latino | 156 | 7.6% |
| Native / Alaskan | 38 | 1.9% |
| White / Caucasian | 1,783 | 87.4% |
| Two or more Races | 69 | 3.4% |
| Some other Race | 81 | 4.0% |
| Total | 2,041 | 100.0% |
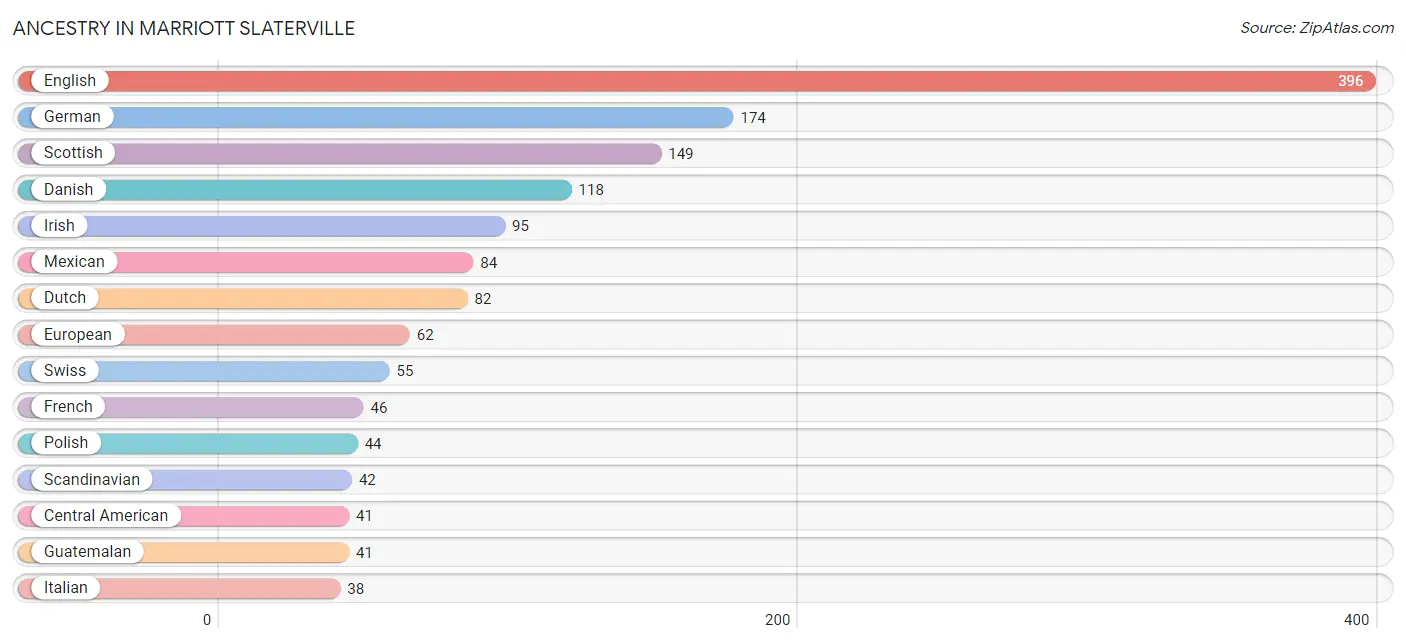
Ancestry in Marriott Slaterville
The most populous ancestries reported in Marriott Slaterville are English (396 | 19.4%), German (174 | 8.5%), Scottish (149 | 7.3%), Danish (118 | 5.8%), and Irish (95 | 4.6%), together accounting for 45.7% of all Marriott Slaterville residents.
| Ancestry | # Population | % Population |
| American | 36 | 1.8% |
| Arab | 4 | 0.2% |
| Austrian | 3 | 0.2% |
| Bhutanese | 27 | 1.3% |
| British | 3 | 0.2% |
| Central American | 41 | 2.0% |
| Cherokee | 3 | 0.2% |
| Cree | 3 | 0.2% |
| Danish | 118 | 5.8% |
| Dominican | 14 | 0.7% |
| Dutch | 82 | 4.0% |
| English | 396 | 19.4% |
| European | 62 | 3.0% |
| French | 46 | 2.2% |
| German | 174 | 8.5% |
| Greek | 15 | 0.7% |
| Guatemalan | 41 | 2.0% |
| Indian (Asian) | 1 | 0.1% |
| Irish | 95 | 4.6% |
| Italian | 38 | 1.9% |
| Korean | 3 | 0.2% |
| Lebanese | 4 | 0.2% |
| Mexican | 84 | 4.1% |
| Native Hawaiian | 3 | 0.2% |
| Norwegian | 17 | 0.8% |
| Polish | 44 | 2.2% |
| Portuguese | 4 | 0.2% |
| Puerto Rican | 4 | 0.2% |
| Russian | 3 | 0.2% |
| Scandinavian | 42 | 2.1% |
| Scottish | 149 | 7.3% |
| Shoshone | 38 | 1.9% |
| Spaniard | 3 | 0.2% |
| Spanish | 10 | 0.5% |
| Swedish | 32 | 1.6% |
| Swiss | 55 | 2.7% | View All 36 Rows |
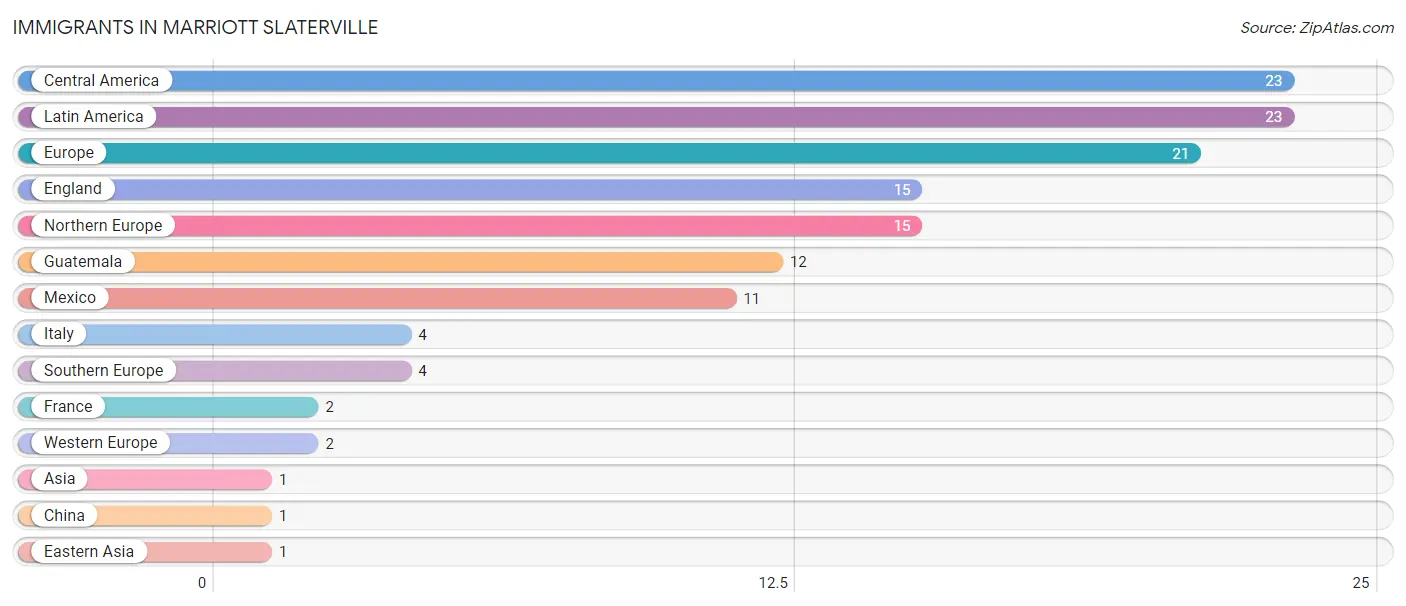
Immigrants in Marriott Slaterville
The most numerous immigrant groups reported in Marriott Slaterville came from Central America (23 | 1.1%), Latin America (23 | 1.1%), Europe (21 | 1.0%), England (15 | 0.7%), and Northern Europe (15 | 0.7%), together accounting for 4.8% of all Marriott Slaterville residents.
| Immigration Origin | # Population | % Population |
| Asia | 1 | 0.1% |
| Central America | 23 | 1.1% |
| China | 1 | 0.1% |
| Eastern Asia | 1 | 0.1% |
| England | 15 | 0.7% |
| Europe | 21 | 1.0% |
| France | 2 | 0.1% |
| Guatemala | 12 | 0.6% |
| Italy | 4 | 0.2% |
| Latin America | 23 | 1.1% |
| Mexico | 11 | 0.5% |
| Northern Europe | 15 | 0.7% |
| Southern Europe | 4 | 0.2% |
| Western Europe | 2 | 0.1% | View All 14 Rows |
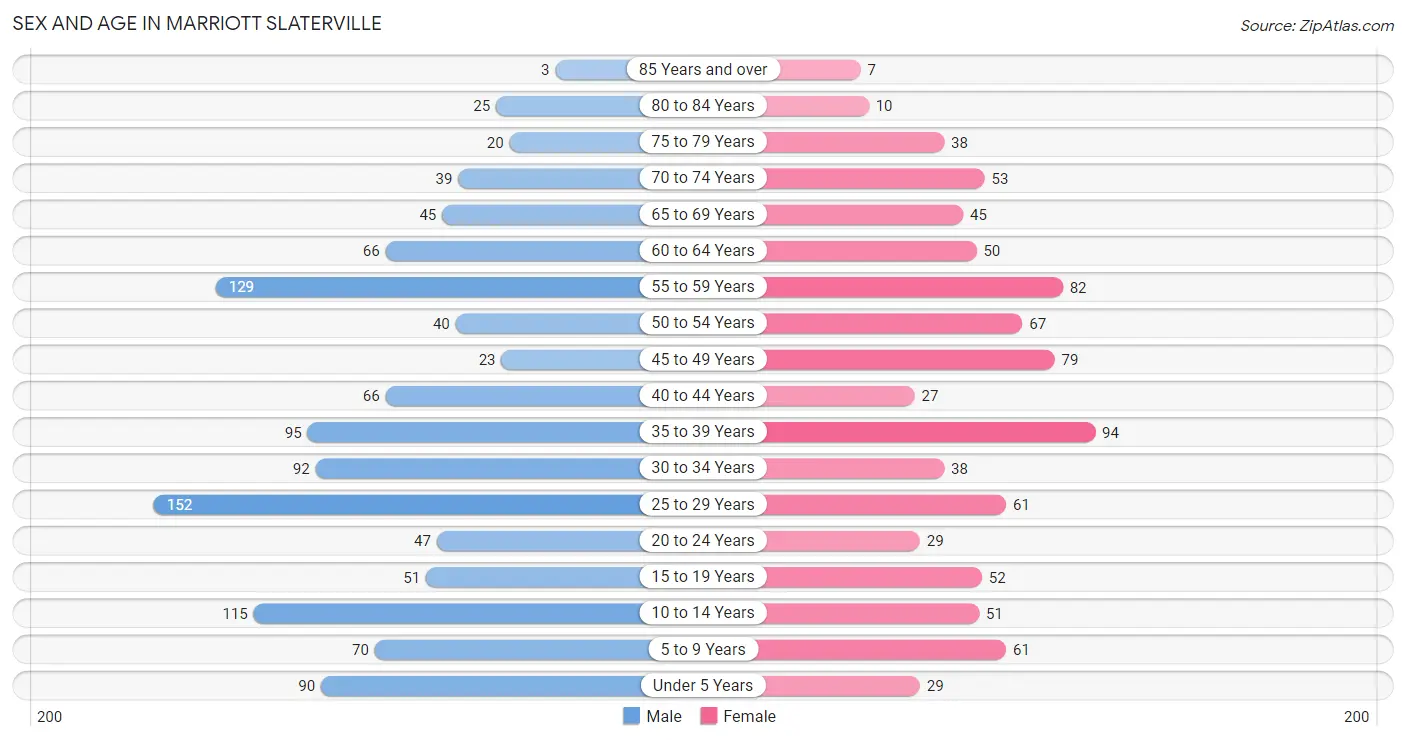
Sex and Age in Marriott Slaterville
Sex and Age in Marriott Slaterville
The most populous age groups in Marriott Slaterville are 25 to 29 Years (152 | 13.0%) for men and 35 to 39 Years (94 | 10.8%) for women.
| Age Bracket | Male | Female |
| Under 5 Years | 90 (7.7%) | 29 (3.3%) |
| 5 to 9 Years | 70 (6.0%) | 61 (7.0%) |
| 10 to 14 Years | 115 (9.9%) | 51 (5.8%) |
| 15 to 19 Years | 51 (4.4%) | 52 (6.0%) |
| 20 to 24 Years | 47 (4.0%) | 29 (3.3%) |
| 25 to 29 Years | 152 (13.0%) | 61 (7.0%) |
| 30 to 34 Years | 92 (7.9%) | 38 (4.3%) |
| 35 to 39 Years | 95 (8.1%) | 94 (10.8%) |
| 40 to 44 Years | 66 (5.7%) | 27 (3.1%) |
| 45 to 49 Years | 23 (2.0%) | 79 (9.0%) |
| 50 to 54 Years | 40 (3.4%) | 67 (7.7%) |
| 55 to 59 Years | 129 (11.0%) | 82 (9.4%) |
| 60 to 64 Years | 66 (5.7%) | 50 (5.7%) |
| 65 to 69 Years | 45 (3.8%) | 45 (5.1%) |
| 70 to 74 Years | 39 (3.3%) | 53 (6.1%) |
| 75 to 79 Years | 20 (1.7%) | 38 (4.3%) |
| 80 to 84 Years | 25 (2.1%) | 10 (1.1%) |
| 85 Years and over | 3 (0.3%) | 7 (0.8%) |
| Total | 1,168 (100.0%) | 873 (100.0%) |
Families and Households in Marriott Slaterville
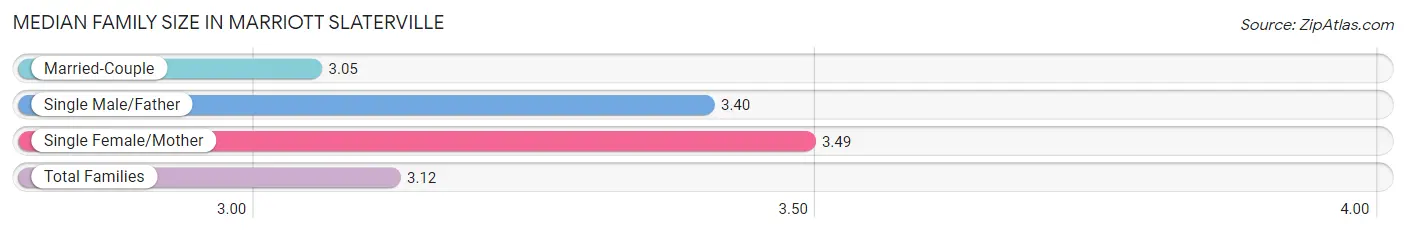
Median Family Size in Marriott Slaterville
The median family size in Marriott Slaterville is 3.12 persons per family, with single female/mother families (63 | 10.9%) accounting for the largest median family size of 3.49 persons per family. On the other hand, married-couple families (470 | 81.6%) represent the smallest median family size with 3.05 persons per family.
| Family Type | # Families | Family Size |
| Married-Couple | 470 (81.6%) | 3.05 |
| Single Male/Father | 43 (7.5%) | 3.40 |
| Single Female/Mother | 63 (10.9%) | 3.49 |
| Total Families | 576 (100.0%) | 3.12 |
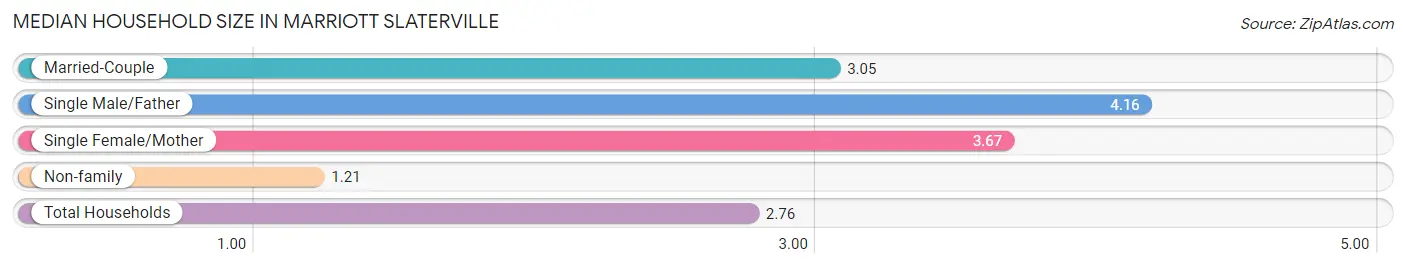
Median Household Size in Marriott Slaterville
The median household size in Marriott Slaterville is 2.76 persons per household, with single male/father households (43 | 5.8%) accounting for the largest median household size of 4.16 persons per household. non-family households (163 | 22.1%) represent the smallest median household size with 1.21 persons per household.
| Household Type | # Households | Household Size |
| Married-Couple | 470 (63.6%) | 3.05 |
| Single Male/Father | 43 (5.8%) | 4.16 |
| Single Female/Mother | 63 (8.5%) | 3.67 |
| Non-family | 163 (22.1%) | 1.21 |
| Total Households | 739 (100.0%) | 2.76 |
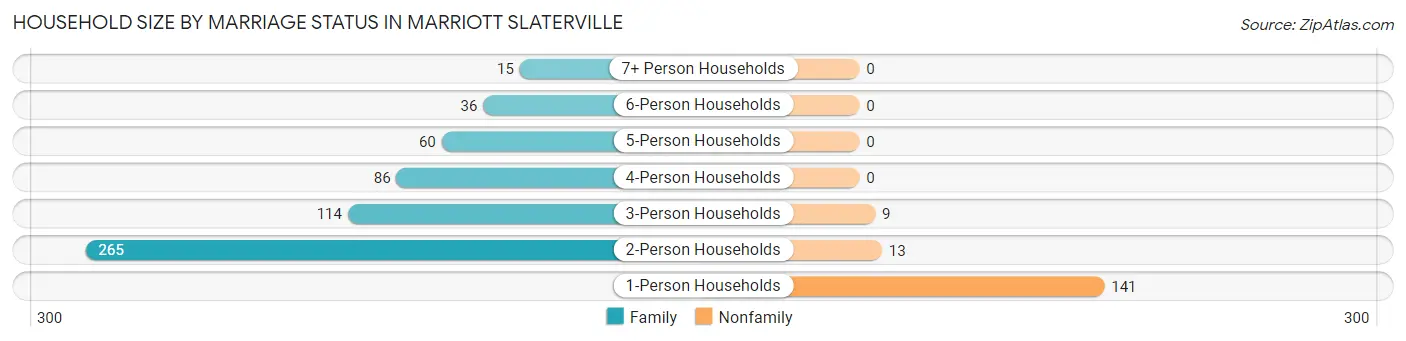
Household Size by Marriage Status in Marriott Slaterville
Out of a total of 739 households in Marriott Slaterville, 576 (77.9%) are family households, while 163 (22.1%) are nonfamily households. The most numerous type of family households are 2-person households, comprising 265, and the most common type of nonfamily households are 1-person households, comprising 141.
| Household Size | Family Households | Nonfamily Households |
| 1-Person Households | - | 141 (19.1%) |
| 2-Person Households | 265 (35.9%) | 13 (1.8%) |
| 3-Person Households | 114 (15.4%) | 9 (1.2%) |
| 4-Person Households | 86 (11.6%) | 0 (0.0%) |
| 5-Person Households | 60 (8.1%) | 0 (0.0%) |
| 6-Person Households | 36 (4.9%) | 0 (0.0%) |
| 7+ Person Households | 15 (2.0%) | 0 (0.0%) |
| Total | 576 (77.9%) | 163 (22.1%) |
Female Fertility in Marriott Slaterville
Fertility by Age in Marriott Slaterville
Average fertility rate in Marriott Slaterville is 82.0 births per 1,000 women. Women in the age bracket of 20 to 34 years have the highest fertility rate with 234.0 births per 1,000 women. Women in the age bracket of 20 to 34 years acount for 90.9% of all women with births.
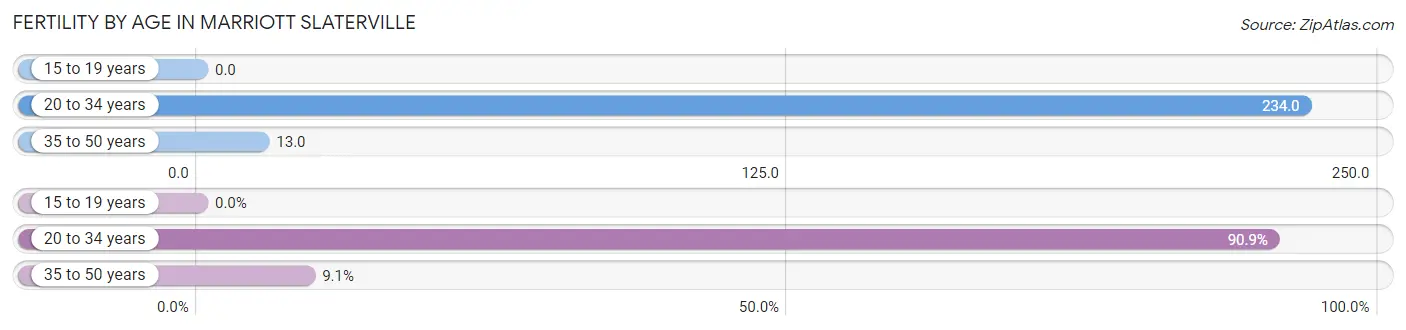
| Age Bracket | Women with Births | Births / 1,000 Women |
| 15 to 19 years | 0 (0.0%) | 0.0 |
| 20 to 34 years | 30 (90.9%) | 234.0 |
| 35 to 50 years | 3 (9.1%) | 13.0 |
| Total | 33 (100.0%) | 82.0 |
Fertility by Age by Marriage Status in Marriott Slaterville
51.5% of women with births (33) in Marriott Slaterville are married. The highest percentage of unmarried women with births falls into 20 to 34 years age bracket with 53.3% of them unmarried at the time of birth, while the lowest percentage of unmarried women with births belong to 35 to 50 years age bracket with 0.0% of them unmarried.
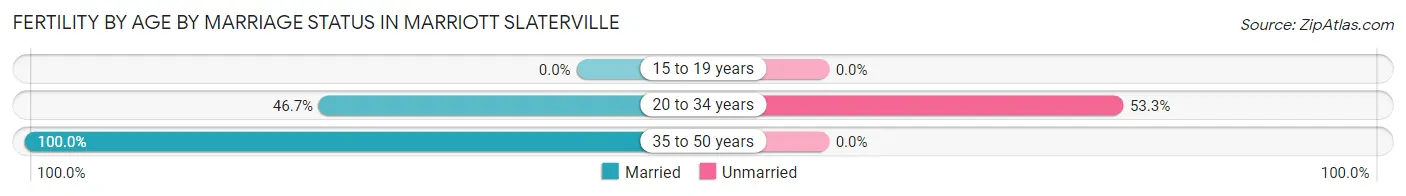
| Age Bracket | Married | Unmarried |
| 15 to 19 years | 0 (0.0%) | 0 (0.0%) |
| 20 to 34 years | 14 (46.7%) | 16 (53.3%) |
| 35 to 50 years | 3 (100.0%) | 0 (0.0%) |
| Total | 17 (51.5%) | 16 (48.5%) |
Fertility by Education in Marriott Slaterville
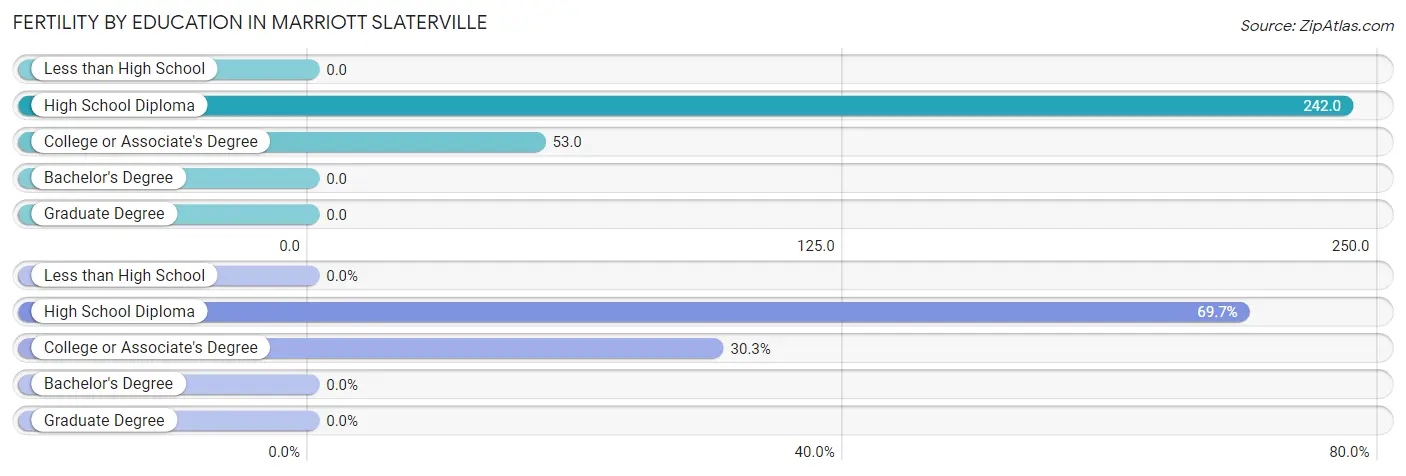
| Educational Attainment | Women with Births | Births / 1,000 Women |
| Less than High School | 0 (0.0%) | 0.0 |
| High School Diploma | 23 (69.7%) | 242.0 |
| College or Associate's Degree | 10 (30.3%) | 53.0 |
| Bachelor's Degree | 0 (0.0%) | 0.0 |
| Graduate Degree | 0 (0.0%) | 0.0 |
| Total | 33 (100.0%) | 82.0 |
Fertility by Education by Marriage Status in Marriott Slaterville
48.5% of women with births in Marriott Slaterville are unmarried. Women with the educational attainment of high school diploma are most likely to be married with 56.5% of them married at childbirth, while women with the educational attainment of college or associate's degree are least likely to be married with 60.0% of them unmarried at childbirth.
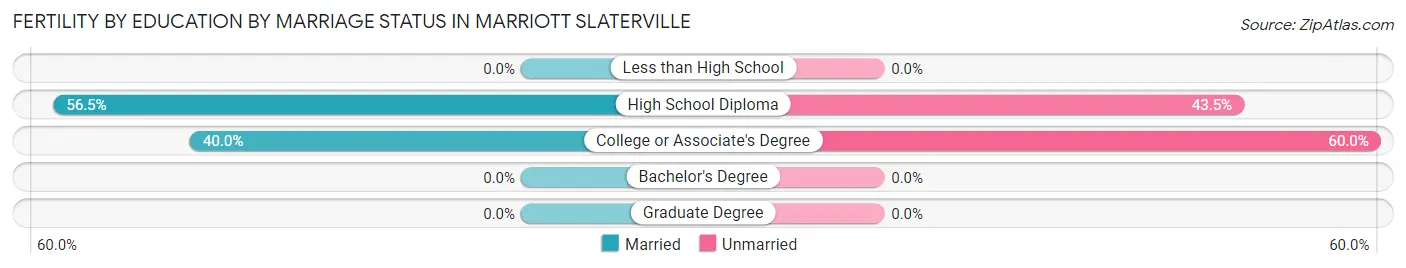
| Educational Attainment | Married | Unmarried |
| Less than High School | 0 (0.0%) | 0 (0.0%) |
| High School Diploma | 13 (56.5%) | 10 (43.5%) |
| College or Associate's Degree | 4 (40.0%) | 6 (60.0%) |
| Bachelor's Degree | 0 (0.0%) | 0 (0.0%) |
| Graduate Degree | 0 (0.0%) | 0 (0.0%) |
| Total | 17 (51.5%) | 16 (48.5%) |
Income in Marriott Slaterville
Income Overview in Marriott Slaterville
Per Capita Income in Marriott Slaterville is $38,664, while median incomes of families and households are $92,708 and $82,098 respectively.
| Characteristic | Number | Measure |
| Per Capita Income | 2,041 | $38,664 |
| Median Family Income | 576 | $92,708 |
| Mean Family Income | 576 | $111,760 |
| Median Household Income | 739 | $82,098 |
| Mean Household Income | 739 | $105,021 |
| Income Deficit | 576 | $0 |
| Wage / Income Gap (%) | 2,041 | 51.26% |
| Wage / Income Gap ($) | 2,041 | 48.74¢ per $1 |
| Gini / Inequality Index | 2,041 | 0.36 |
Earnings by Sex in Marriott Slaterville
Average Earnings in Marriott Slaterville are $46,359, $57,321 for men and $27,939 for women, a difference of 51.3%.
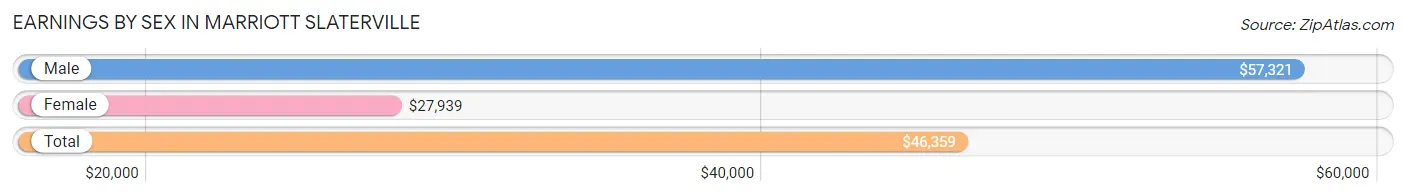
| Sex | Number | Average Earnings |
| Male | 665 (58.6%) | $57,321 |
| Female | 469 (41.4%) | $27,939 |
| Total | 1,134 (100.0%) | $46,359 |
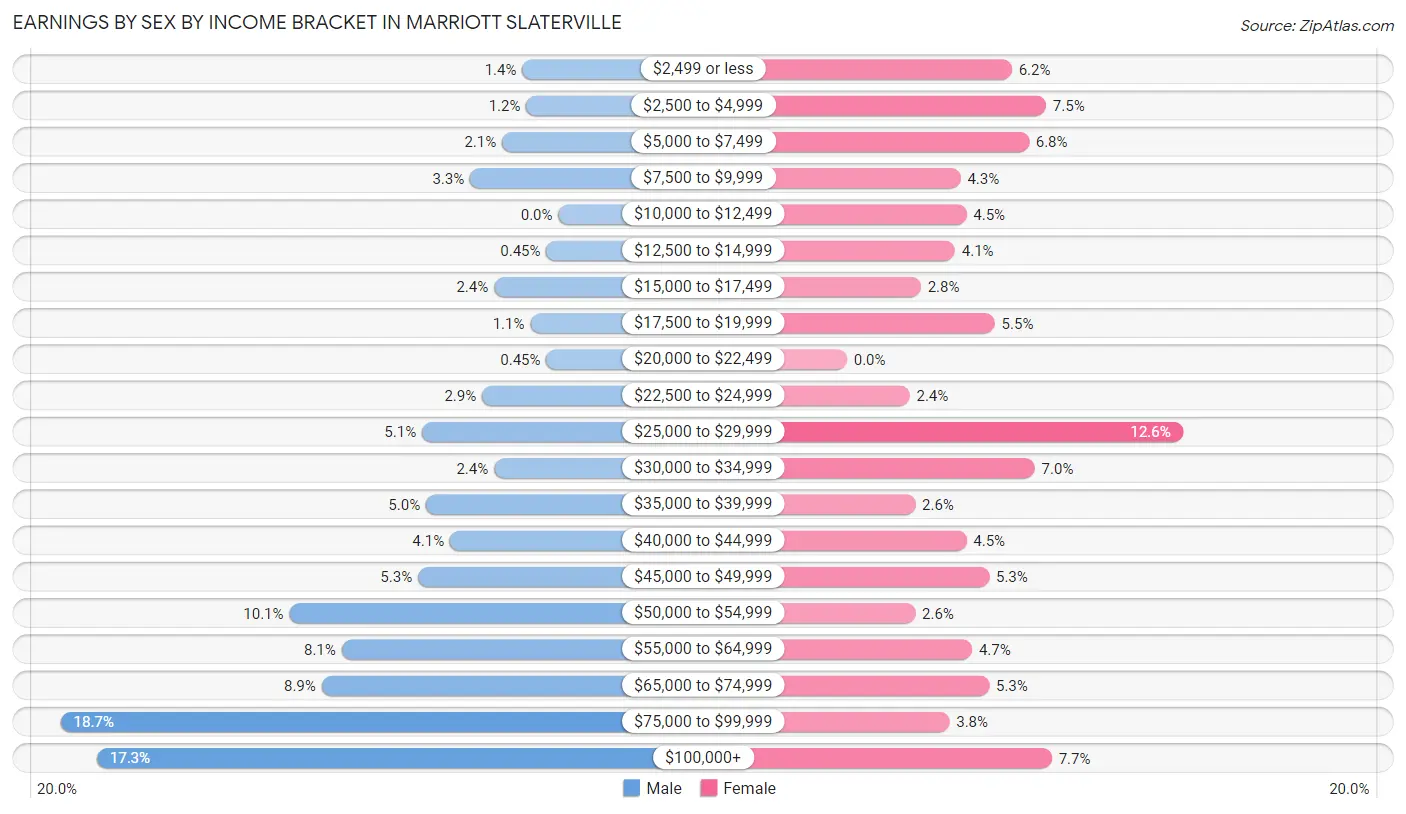
Earnings by Sex by Income Bracket in Marriott Slaterville
The most common earnings brackets in Marriott Slaterville are $75,000 to $99,999 for men (124 | 18.6%) and $25,000 to $29,999 for women (59 | 12.6%).
| Income | Male | Female |
| $2,499 or less | 9 (1.3%) | 29 (6.2%) |
| $2,500 to $4,999 | 8 (1.2%) | 35 (7.5%) |
| $5,000 to $7,499 | 14 (2.1%) | 32 (6.8%) |
| $7,500 to $9,999 | 22 (3.3%) | 20 (4.3%) |
| $10,000 to $12,499 | 0 (0.0%) | 21 (4.5%) |
| $12,500 to $14,999 | 3 (0.4%) | 19 (4.1%) |
| $15,000 to $17,499 | 16 (2.4%) | 13 (2.8%) |
| $17,500 to $19,999 | 7 (1.1%) | 26 (5.5%) |
| $20,000 to $22,499 | 3 (0.4%) | 0 (0.0%) |
| $22,500 to $24,999 | 19 (2.9%) | 11 (2.4%) |
| $25,000 to $29,999 | 34 (5.1%) | 59 (12.6%) |
| $30,000 to $34,999 | 16 (2.4%) | 33 (7.0%) |
| $35,000 to $39,999 | 33 (5.0%) | 12 (2.6%) |
| $40,000 to $44,999 | 27 (4.1%) | 21 (4.5%) |
| $45,000 to $49,999 | 35 (5.3%) | 25 (5.3%) |
| $50,000 to $54,999 | 67 (10.1%) | 12 (2.6%) |
| $55,000 to $64,999 | 54 (8.1%) | 22 (4.7%) |
| $65,000 to $74,999 | 59 (8.9%) | 25 (5.3%) |
| $75,000 to $99,999 | 124 (18.6%) | 18 (3.8%) |
| $100,000+ | 115 (17.3%) | 36 (7.7%) |
| Total | 665 (100.0%) | 469 (100.0%) |
Earnings by Sex by Educational Attainment in Marriott Slaterville
Average earnings in Marriott Slaterville are $59,125 for men and $29,730 for women, a difference of 49.7%. Men with an educational attainment of graduate degree enjoy the highest average annual earnings of $132,500, while those with less than high school education earn the least with $44,063. Women with an educational attainment of graduate degree earn the most with the average annual earnings of $45,833, while those with less than high school education have the smallest earnings of $18,977.
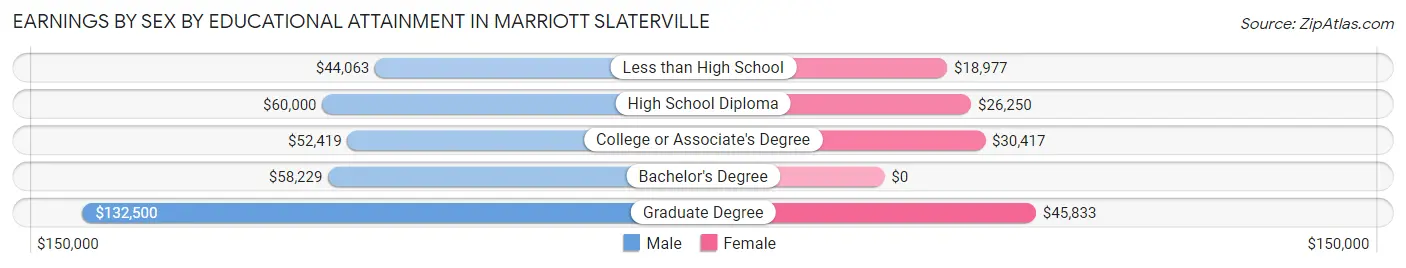
| Educational Attainment | Male Income | Female Income |
| Less than High School | $44,063 | $18,977 |
| High School Diploma | $60,000 | $26,250 |
| College or Associate's Degree | $52,419 | $30,417 |
| Bachelor's Degree | $58,229 | $0 |
| Graduate Degree | $132,500 | $45,833 |
| Total | $59,125 | $29,730 |
Family Income in Marriott Slaterville
Family Income Brackets in Marriott Slaterville
According to the Marriott Slaterville family income data, there are 155 families falling into the $100,000 to $149,999 income range, which is the most common income bracket and makes up 26.9% of all families.
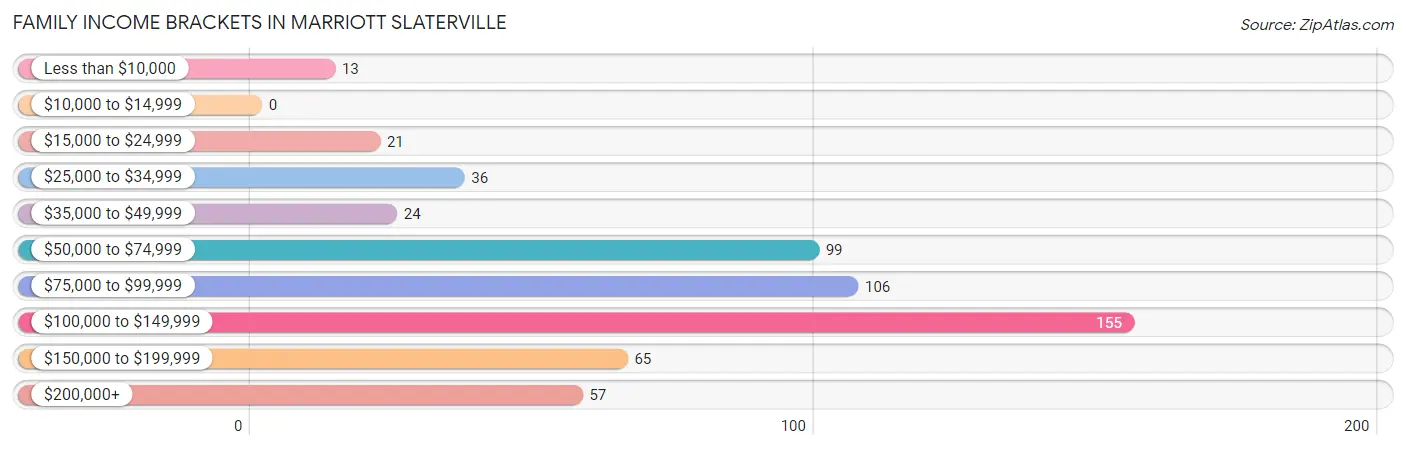
| Income Bracket | # Families | % Families |
| Less than $10,000 | 13 | 2.3% |
| $10,000 to $14,999 | 0 | 0.0% |
| $15,000 to $24,999 | 21 | 3.6% |
| $25,000 to $34,999 | 36 | 6.3% |
| $35,000 to $49,999 | 24 | 4.2% |
| $50,000 to $74,999 | 99 | 17.2% |
| $75,000 to $99,999 | 106 | 18.4% |
| $100,000 to $149,999 | 155 | 26.9% |
| $150,000 to $199,999 | 65 | 11.3% |
| $200,000+ | 57 | 9.9% |
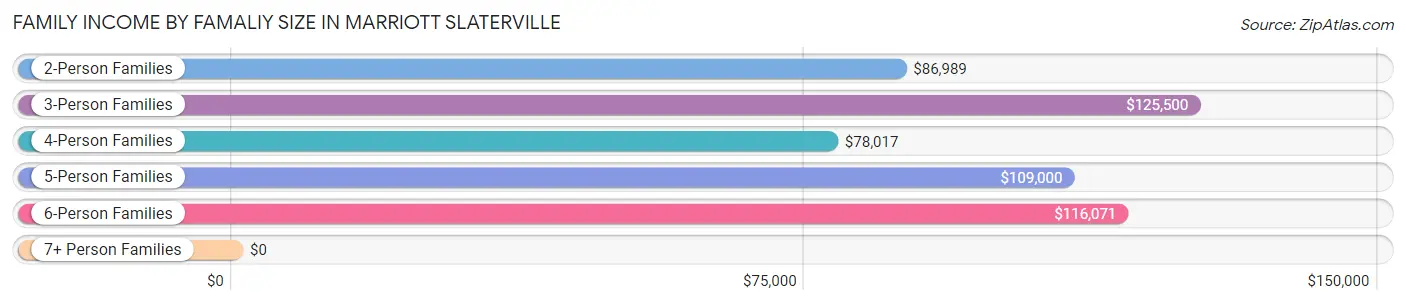
Family Income by Famaliy Size in Marriott Slaterville
3-person families (104 | 18.1%) account for the highest median family income in Marriott Slaterville with $125,500 per family, while 2-person families (277 | 48.1%) have the highest median income of $43,494 per family member.
| Income Bracket | # Families | Median Income |
| 2-Person Families | 277 (48.1%) | $86,989 |
| 3-Person Families | 104 (18.1%) | $125,500 |
| 4-Person Families | 100 (17.4%) | $78,017 |
| 5-Person Families | 46 (8.0%) | $109,000 |
| 6-Person Families | 40 (6.9%) | $116,071 |
| 7+ Person Families | 9 (1.6%) | $0 |
| Total | 576 (100.0%) | $92,708 |
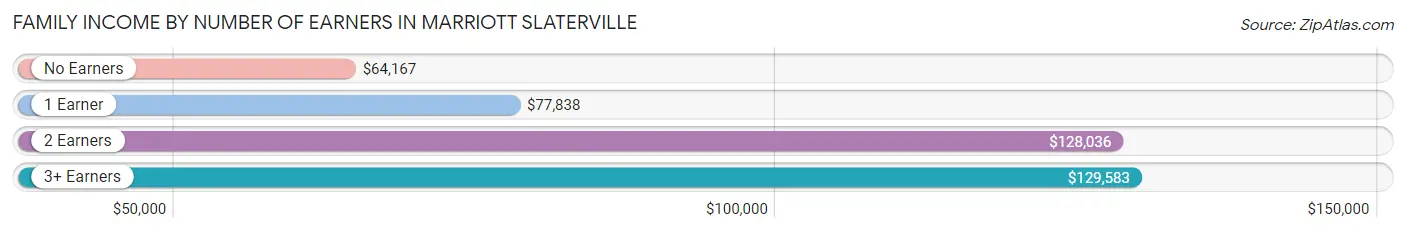
Family Income by Number of Earners in Marriott Slaterville
The median family income in Marriott Slaterville is $92,708, with families comprising 3+ earners (75) having the highest median family income of $129,583, while families with no earners (70) have the lowest median family income of $64,167, accounting for 13.0% and 12.1% of families, respectively.
| Number of Earners | # Families | Median Income |
| No Earners | 70 (12.1%) | $64,167 |
| 1 Earner | 178 (30.9%) | $77,838 |
| 2 Earners | 253 (43.9%) | $128,036 |
| 3+ Earners | 75 (13.0%) | $129,583 |
| Total | 576 (100.0%) | $92,708 |
Household Income in Marriott Slaterville
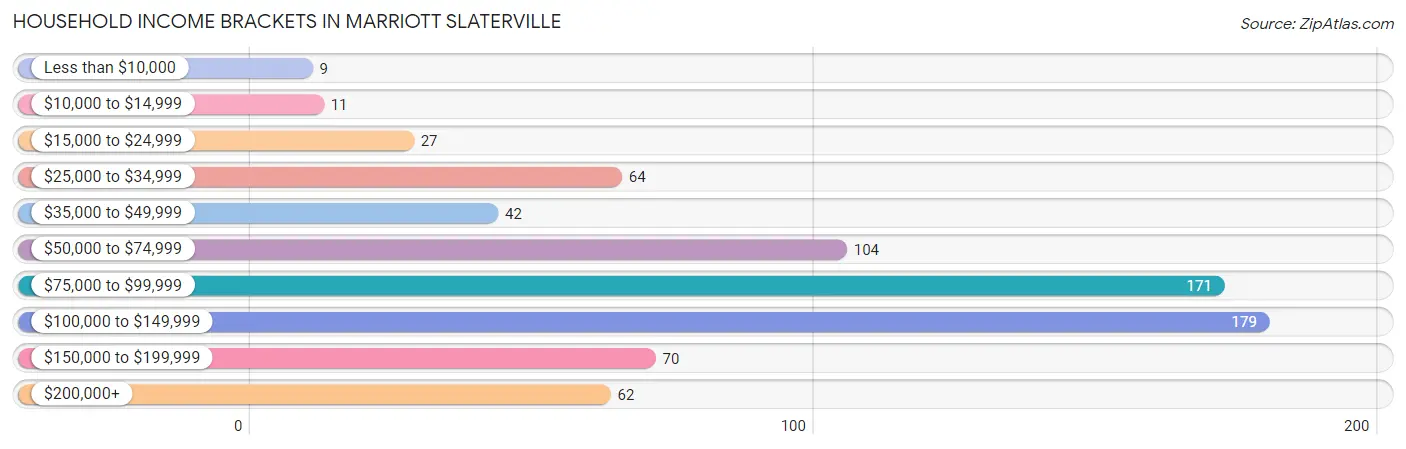
Household Income Brackets in Marriott Slaterville
With 179 households falling in the category, the $100,000 to $149,999 income range is the most frequent in Marriott Slaterville, accounting for 24.2% of all households. In contrast, only 9 households (1.2%) fall into the less than $10,000 income bracket, making it the least populous group.
| Income Bracket | # Households | % Households |
| Less than $10,000 | 9 | 1.2% |
| $10,000 to $14,999 | 11 | 1.5% |
| $15,000 to $24,999 | 27 | 3.7% |
| $25,000 to $34,999 | 64 | 8.7% |
| $35,000 to $49,999 | 42 | 5.7% |
| $50,000 to $74,999 | 104 | 14.1% |
| $75,000 to $99,999 | 171 | 23.1% |
| $100,000 to $149,999 | 179 | 24.2% |
| $150,000 to $199,999 | 70 | 9.5% |
| $200,000+ | 62 | 8.4% |
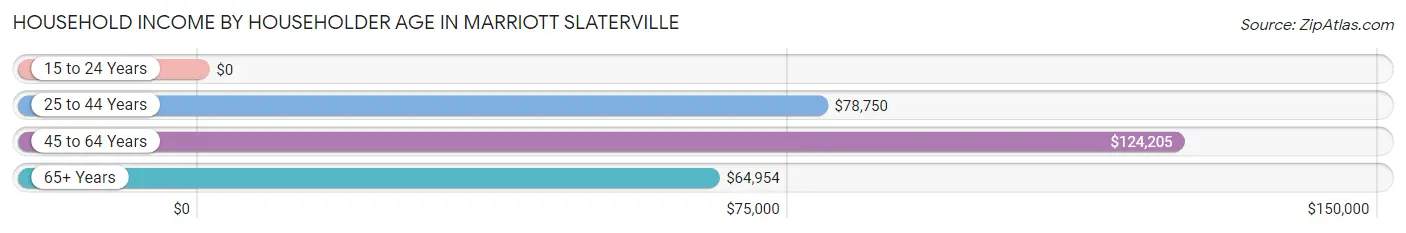
Household Income by Householder Age in Marriott Slaterville
The median household income in Marriott Slaterville is $82,098, with the highest median household income of $124,205 found in the 45 to 64 years age bracket for the primary householder. A total of 283 households (38.3%) fall into this category.
| Income Bracket | # Households | Median Income |
| 15 to 24 Years | 0 (0.0%) | $0 |
| 25 to 44 Years | 283 (38.3%) | $78,750 |
| 45 to 64 Years | 283 (38.3%) | $124,205 |
| 65+ Years | 173 (23.4%) | $64,954 |
| Total | 739 (100.0%) | $82,098 |
Poverty in Marriott Slaterville
Income Below Poverty by Sex and Age in Marriott Slaterville
With 7.2% poverty level for males and 11.2% for females among the residents of Marriott Slaterville, 5 year old males and 12 to 14 year old females are the most vulnerable to poverty, with 7 males (63.6%) and 13 females (54.2%) in their respective age groups living below the poverty level.
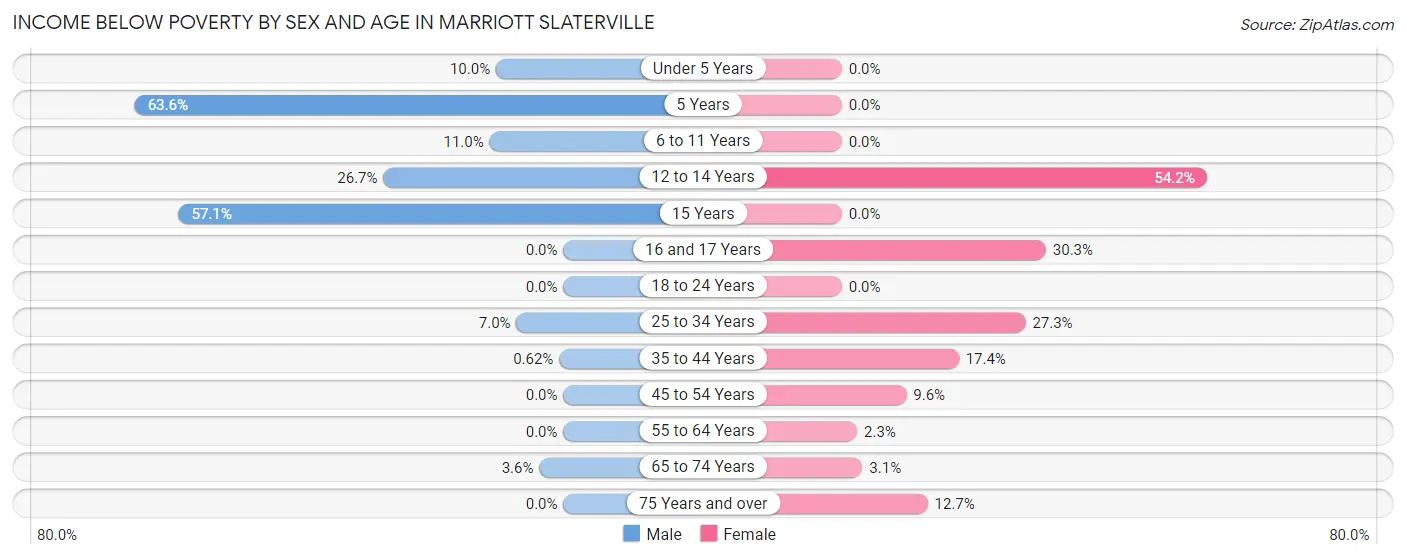
| Age Bracket | Male | Female |
| Under 5 Years | 9 (10.0%) | 0 (0.0%) |
| 5 Years | 7 (63.6%) | 0 (0.0%) |
| 6 to 11 Years | 8 (11.0%) | 0 (0.0%) |
| 12 to 14 Years | 27 (26.7%) | 13 (54.2%) |
| 15 Years | 12 (57.1%) | 0 (0.0%) |
| 16 and 17 Years | 0 (0.0%) | 10 (30.3%) |
| 18 to 24 Years | 0 (0.0%) | 0 (0.0%) |
| 25 to 34 Years | 17 (7.0%) | 27 (27.3%) |
| 35 to 44 Years | 1 (0.6%) | 21 (17.4%) |
| 45 to 54 Years | 0 (0.0%) | 14 (9.6%) |
| 55 to 64 Years | 0 (0.0%) | 3 (2.3%) |
| 65 to 74 Years | 3 (3.6%) | 3 (3.1%) |
| 75 Years and over | 0 (0.0%) | 7 (12.7%) |
| Total | 84 (7.2%) | 98 (11.2%) |
Income Above Poverty by Sex and Age in Marriott Slaterville
According to the poverty statistics in Marriott Slaterville, males aged 16 and 17 years and females aged under 5 years are the age groups that are most secure financially, with 100.0% of males and 100.0% of females in these age groups living above the poverty line.
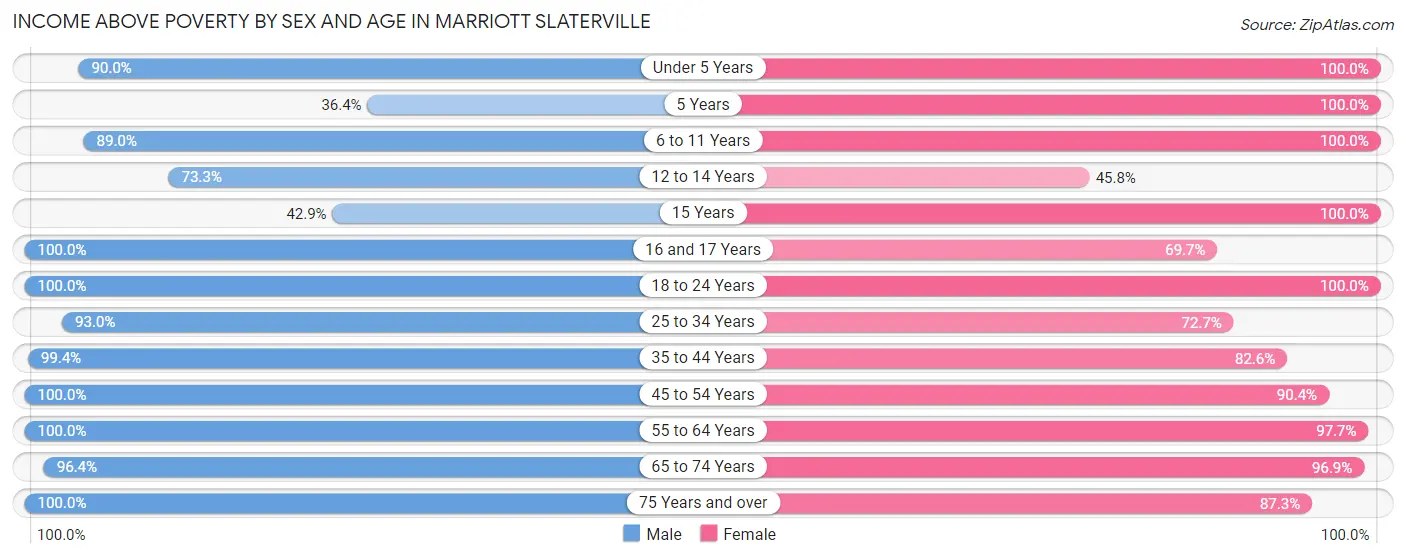
| Age Bracket | Male | Female |
| Under 5 Years | 81 (90.0%) | 29 (100.0%) |
| 5 Years | 4 (36.4%) | 7 (100.0%) |
| 6 to 11 Years | 65 (89.0%) | 81 (100.0%) |
| 12 to 14 Years | 74 (73.3%) | 11 (45.8%) |
| 15 Years | 9 (42.9%) | 14 (100.0%) |
| 16 and 17 Years | 17 (100.0%) | 23 (69.7%) |
| 18 to 24 Years | 60 (100.0%) | 34 (100.0%) |
| 25 to 34 Years | 227 (93.0%) | 72 (72.7%) |
| 35 to 44 Years | 160 (99.4%) | 100 (82.6%) |
| 45 to 54 Years | 63 (100.0%) | 132 (90.4%) |
| 55 to 64 Years | 195 (100.0%) | 129 (97.7%) |
| 65 to 74 Years | 81 (96.4%) | 95 (96.9%) |
| 75 Years and over | 48 (100.0%) | 48 (87.3%) |
| Total | 1,084 (92.8%) | 775 (88.8%) |
Income Below Poverty Among Married-Couple Families in Marriott Slaterville
The poverty statistics for married-couple families in Marriott Slaterville show that 2.1% or 10 of the total 470 families live below the poverty line. Families with 1 or 2 children have the highest poverty rate of 4.9%, comprising of 4 families. On the other hand, families with 3 or 4 children have the lowest poverty rate of 0.0%, which includes 0 families.
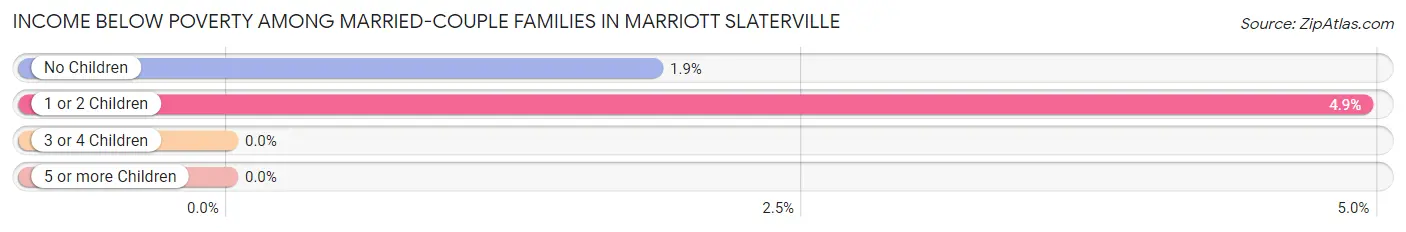
| Children | Above Poverty | Below Poverty |
| No Children | 319 (98.2%) | 6 (1.8%) |
| 1 or 2 Children | 77 (95.1%) | 4 (4.9%) |
| 3 or 4 Children | 55 (100.0%) | 0 (0.0%) |
| 5 or more Children | 9 (100.0%) | 0 (0.0%) |
| Total | 460 (97.9%) | 10 (2.1%) |
Income Below Poverty Among Single-Parent Households in Marriott Slaterville
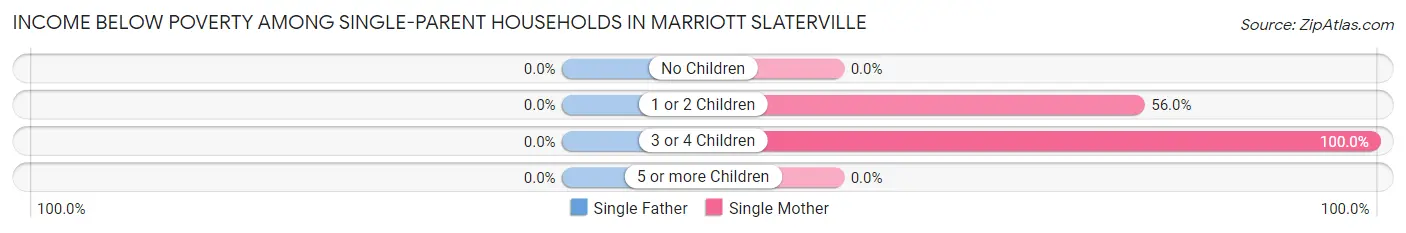
| Children | Single Father | Single Mother |
| No Children | 0 (0.0%) | 0 (0.0%) |
| 1 or 2 Children | 0 (0.0%) | 14 (56.0%) |
| 3 or 4 Children | 0 (0.0%) | 20 (100.0%) |
| 5 or more Children | 0 (0.0%) | 0 (0.0%) |
| Total | 0 (0.0%) | 34 (54.0%) |
Income Below Poverty Among Married-Couple vs Single-Parent Households in Marriott Slaterville
The poverty data for Marriott Slaterville shows that 10 of the married-couple family households (2.1%) and 34 of the single-parent households (32.1%) are living below the poverty level. Within the married-couple family households, those with 1 or 2 children have the highest poverty rate, with 4 households (4.9%) falling below the poverty line. Among the single-parent households, those with 3 or 4 children have the highest poverty rate, with 20 household (74.1%) living below poverty.
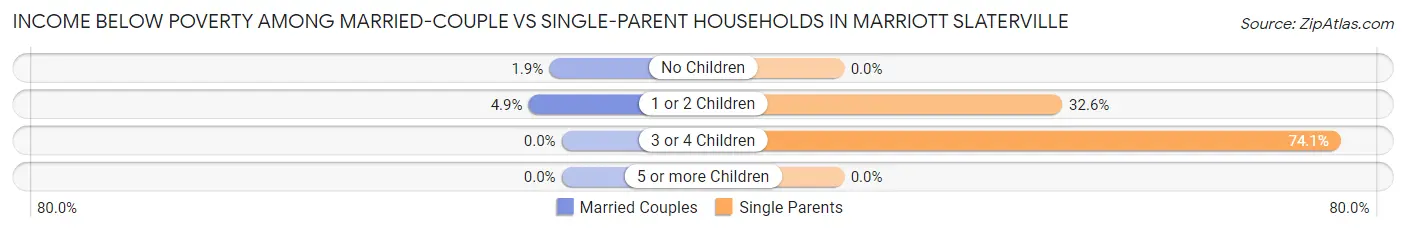
| Children | Married-Couple Families | Single-Parent Households |
| No Children | 6 (1.8%) | 0 (0.0%) |
| 1 or 2 Children | 4 (4.9%) | 14 (32.6%) |
| 3 or 4 Children | 0 (0.0%) | 20 (74.1%) |
| 5 or more Children | 0 (0.0%) | 0 (0.0%) |
| Total | 10 (2.1%) | 34 (32.1%) |
Employment Characteristics in Marriott Slaterville
Employment by Class of Employer in Marriott Slaterville
Among the 1,047 employed individuals in Marriott Slaterville, private company employees (700 | 66.9%), federal government employees (95 | 9.1%), and local government employees (86 | 8.2%) make up the most common classes of employment.
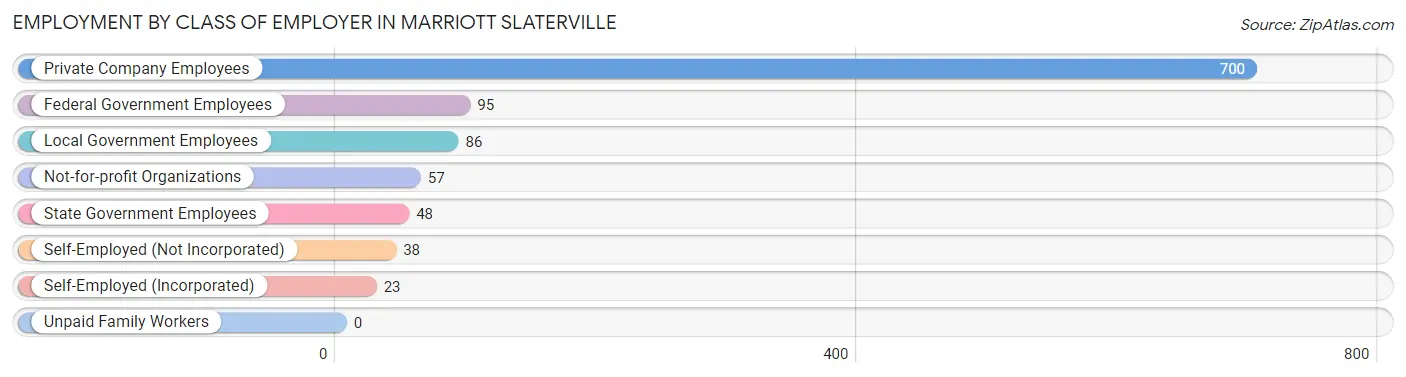
| Employer Class | # Employees | % Employees |
| Private Company Employees | 700 | 66.9% |
| Self-Employed (Incorporated) | 23 | 2.2% |
| Self-Employed (Not Incorporated) | 38 | 3.6% |
| Not-for-profit Organizations | 57 | 5.4% |
| Local Government Employees | 86 | 8.2% |
| State Government Employees | 48 | 4.6% |
| Federal Government Employees | 95 | 9.1% |
| Unpaid Family Workers | 0 | 0.0% |
| Total | 1,047 | 100.0% |
Employment Status by Age in Marriott Slaterville
According to the labor force statistics for Marriott Slaterville, out of the total population over 16 years of age (1,590), 67.0% or 1,065 individuals are in the labor force, with 1.4% or 15 of them unemployed. The age group with the highest labor force participation rate is 45 to 54 years, with 95.7% or 200 individuals in the labor force. Within the labor force, the 35 to 44 years age range has the highest percentage of unemployed individuals, with 5.9% or 12 of them being unemployed.
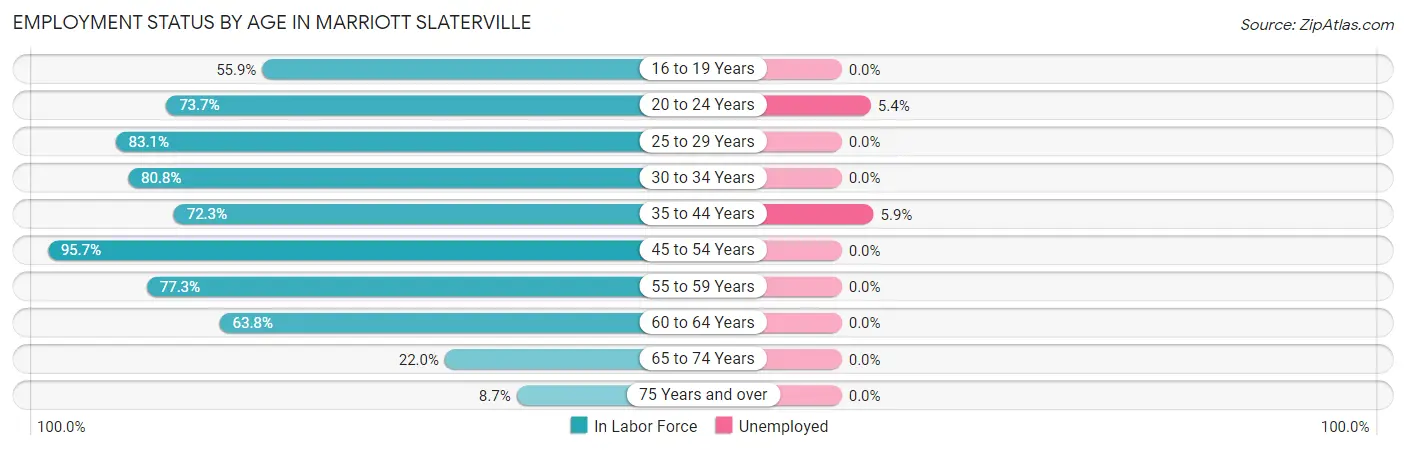
| Age Bracket | In Labor Force | Unemployed |
| 16 to 19 Years | 38 (55.9%) | 0 (0.0%) |
| 20 to 24 Years | 56 (73.7%) | 3 (5.4%) |
| 25 to 29 Years | 177 (83.1%) | 0 (0.0%) |
| 30 to 34 Years | 105 (80.8%) | 0 (0.0%) |
| 35 to 44 Years | 204 (72.3%) | 12 (5.9%) |
| 45 to 54 Years | 200 (95.7%) | 0 (0.0%) |
| 55 to 59 Years | 163 (77.3%) | 0 (0.0%) |
| 60 to 64 Years | 74 (63.8%) | 0 (0.0%) |
| 65 to 74 Years | 40 (22.0%) | 0 (0.0%) |
| 75 Years and over | 9 (8.7%) | 0 (0.0%) |
| Total | 1,065 (67.0%) | 15 (1.4%) |
Employment Status by Educational Attainment in Marriott Slaterville
According to labor force statistics for Marriott Slaterville, 79.5% of individuals (923) out of the total population between 25 and 64 years of age (1,161) are in the labor force, with 1.3% or 12 of them being unemployed. The group with the highest labor force participation rate are those with the educational attainment of bachelor's degree or higher, with 97.9% or 185 individuals in the labor force. Within the labor force, individuals with high school diploma education have the highest percentage of unemployment, with 3.2% or 12 of them being unemployed.
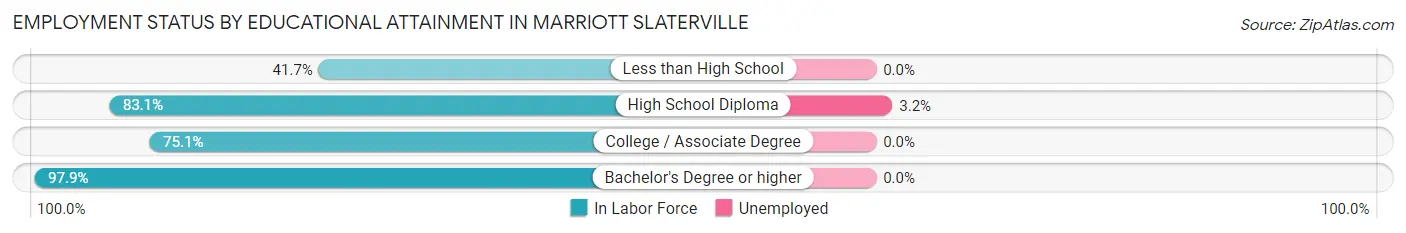
| Educational Attainment | In Labor Force | Unemployed |
| Less than High School | 35 (41.7%) | 0 (0.0%) |
| High School Diploma | 375 (83.1%) | 14 (3.2%) |
| College / Associate Degree | 328 (75.1%) | 0 (0.0%) |
| Bachelor's Degree or higher | 185 (97.9%) | 0 (0.0%) |
| Total | 923 (79.5%) | 15 (1.3%) |
Employment Occupations by Sex in Marriott Slaterville
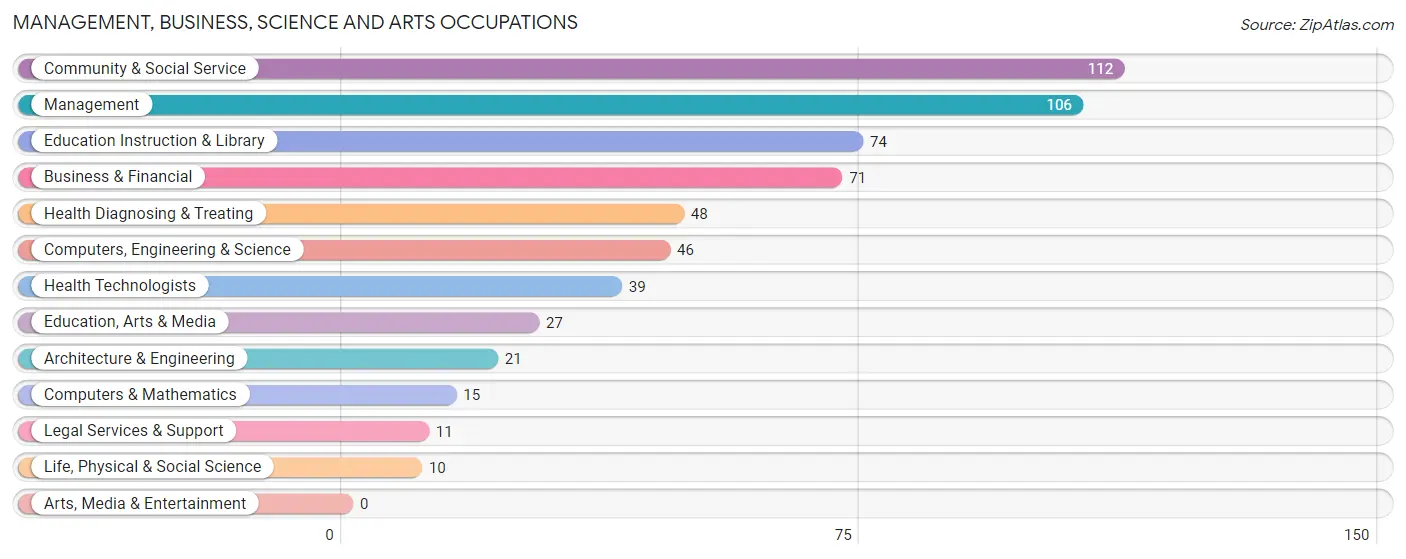
Management, Business, Science and Arts Occupations
The most common Management, Business, Science and Arts occupations in Marriott Slaterville are Community & Social Service (112 | 10.7%), Management (106 | 10.1%), Education Instruction & Library (74 | 7.0%), Business & Financial (71 | 6.8%), and Health Diagnosing & Treating (48 | 4.6%).
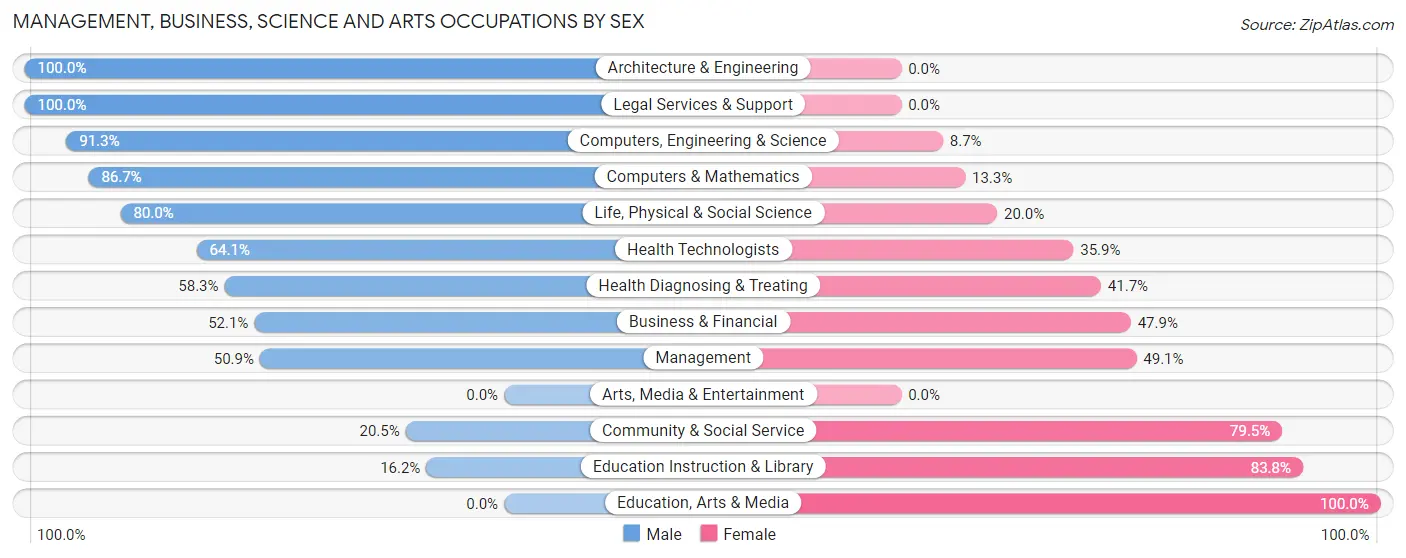
Management, Business, Science and Arts Occupations by Sex
Within the Management, Business, Science and Arts occupations in Marriott Slaterville, the most male-oriented occupations are Architecture & Engineering (100.0%), Legal Services & Support (100.0%), and Computers, Engineering & Science (91.3%), while the most female-oriented occupations are Education, Arts & Media (100.0%), Education Instruction & Library (83.8%), and Community & Social Service (79.5%).
| Occupation | Male | Female |
| Management | 54 (50.9%) | 52 (49.1%) |
| Business & Financial | 37 (52.1%) | 34 (47.9%) |
| Computers, Engineering & Science | 42 (91.3%) | 4 (8.7%) |
| Computers & Mathematics | 13 (86.7%) | 2 (13.3%) |
| Architecture & Engineering | 21 (100.0%) | 0 (0.0%) |
| Life, Physical & Social Science | 8 (80.0%) | 2 (20.0%) |
| Community & Social Service | 23 (20.5%) | 89 (79.5%) |
| Education, Arts & Media | 0 (0.0%) | 27 (100.0%) |
| Legal Services & Support | 11 (100.0%) | 0 (0.0%) |
| Education Instruction & Library | 12 (16.2%) | 62 (83.8%) |
| Arts, Media & Entertainment | 0 (0.0%) | 0 (0.0%) |
| Health Diagnosing & Treating | 28 (58.3%) | 20 (41.7%) |
| Health Technologists | 25 (64.1%) | 14 (35.9%) |
| Total (Category) | 184 (48.0%) | 199 (52.0%) |
| Total (Overall) | 607 (57.8%) | 444 (42.2%) |
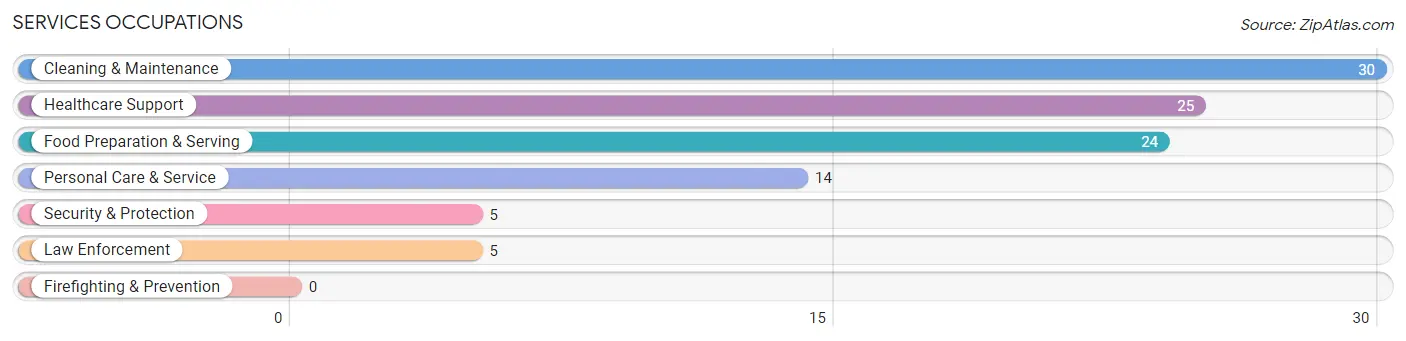
Services Occupations
The most common Services occupations in Marriott Slaterville are Cleaning & Maintenance (30 | 2.9%), Healthcare Support (25 | 2.4%), Food Preparation & Serving (24 | 2.3%), Personal Care & Service (14 | 1.3%), and Security & Protection (5 | 0.5%).
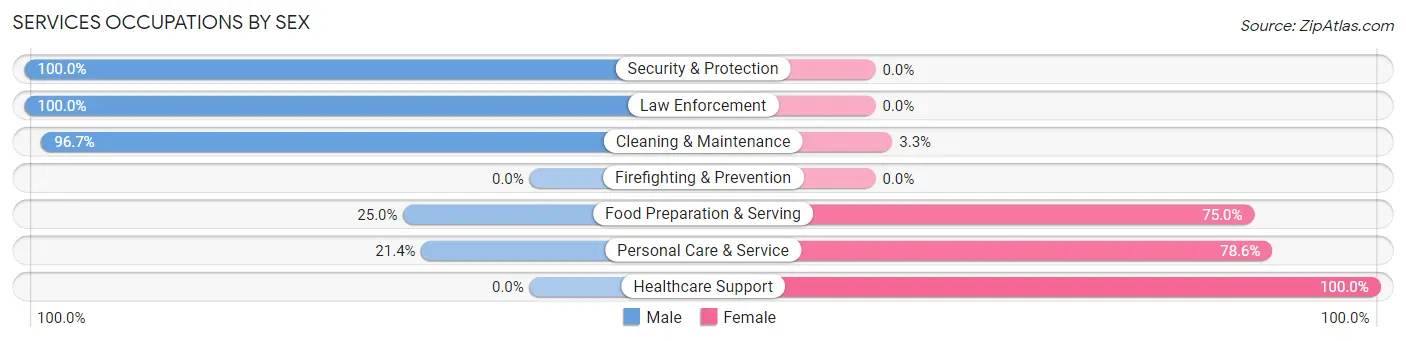
Services Occupations by Sex
Within the Services occupations in Marriott Slaterville, the most male-oriented occupations are Security & Protection (100.0%), Law Enforcement (100.0%), and Cleaning & Maintenance (96.7%), while the most female-oriented occupations are Healthcare Support (100.0%), Personal Care & Service (78.6%), and Food Preparation & Serving (75.0%).
| Occupation | Male | Female |
| Healthcare Support | 0 (0.0%) | 25 (100.0%) |
| Security & Protection | 5 (100.0%) | 0 (0.0%) |
| Firefighting & Prevention | 0 (0.0%) | 0 (0.0%) |
| Law Enforcement | 5 (100.0%) | 0 (0.0%) |
| Food Preparation & Serving | 6 (25.0%) | 18 (75.0%) |
| Cleaning & Maintenance | 29 (96.7%) | 1 (3.3%) |
| Personal Care & Service | 3 (21.4%) | 11 (78.6%) |
| Total (Category) | 43 (43.9%) | 55 (56.1%) |
| Total (Overall) | 607 (57.8%) | 444 (42.2%) |
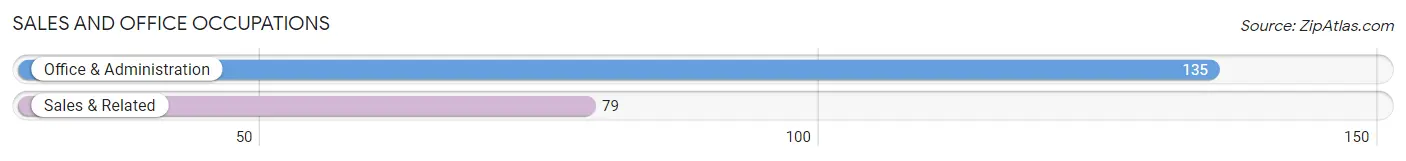
Sales and Office Occupations
The most common Sales and Office occupations in Marriott Slaterville are Office & Administration (135 | 12.8%), and Sales & Related (79 | 7.5%).
Sales and Office Occupations by Sex
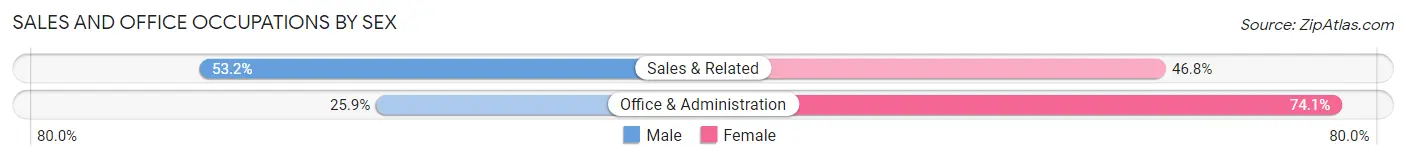
| Occupation | Male | Female |
| Sales & Related | 42 (53.2%) | 37 (46.8%) |
| Office & Administration | 35 (25.9%) | 100 (74.1%) |
| Total (Category) | 77 (36.0%) | 137 (64.0%) |
| Total (Overall) | 607 (57.8%) | 444 (42.2%) |
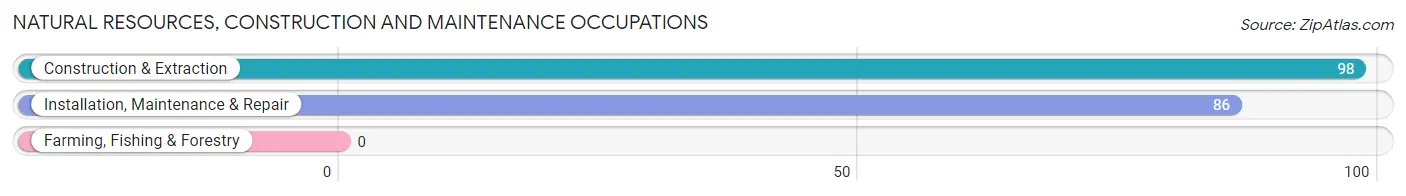
Natural Resources, Construction and Maintenance Occupations
The most common Natural Resources, Construction and Maintenance occupations in Marriott Slaterville are Construction & Extraction (98 | 9.3%), and Installation, Maintenance & Repair (86 | 8.2%).
Natural Resources, Construction and Maintenance Occupations by Sex
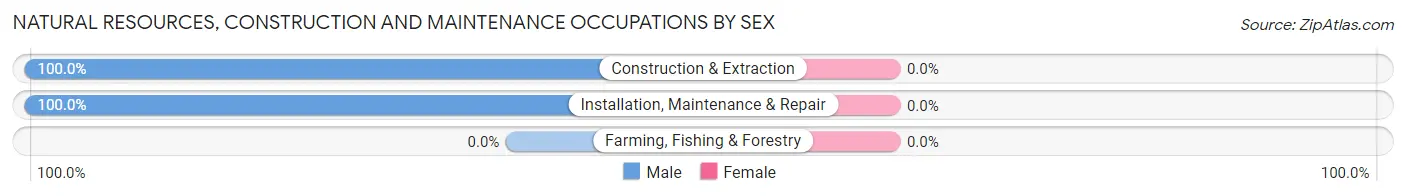
| Occupation | Male | Female |
| Farming, Fishing & Forestry | 0 (0.0%) | 0 (0.0%) |
| Construction & Extraction | 98 (100.0%) | 0 (0.0%) |
| Installation, Maintenance & Repair | 86 (100.0%) | 0 (0.0%) |
| Total (Category) | 184 (100.0%) | 0 (0.0%) |
| Total (Overall) | 607 (57.8%) | 444 (42.2%) |
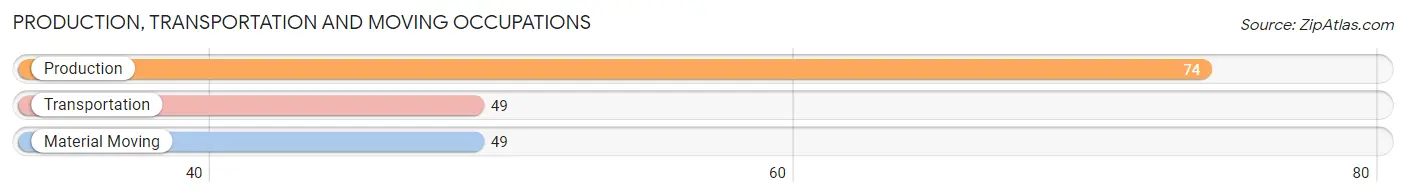
Production, Transportation and Moving Occupations
The most common Production, Transportation and Moving occupations in Marriott Slaterville are Production (74 | 7.0%), Transportation (49 | 4.7%), and Material Moving (49 | 4.7%).
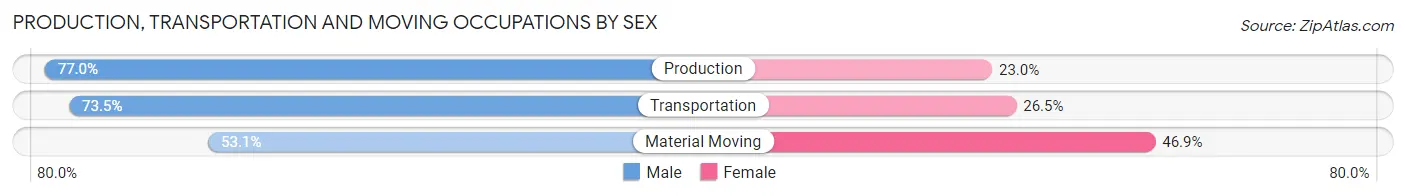
Production, Transportation and Moving Occupations by Sex
| Occupation | Male | Female |
| Production | 57 (77.0%) | 17 (23.0%) |
| Transportation | 36 (73.5%) | 13 (26.5%) |
| Material Moving | 26 (53.1%) | 23 (46.9%) |
| Total (Category) | 119 (69.2%) | 53 (30.8%) |
| Total (Overall) | 607 (57.8%) | 444 (42.2%) |
Employment Industries by Sex in Marriott Slaterville
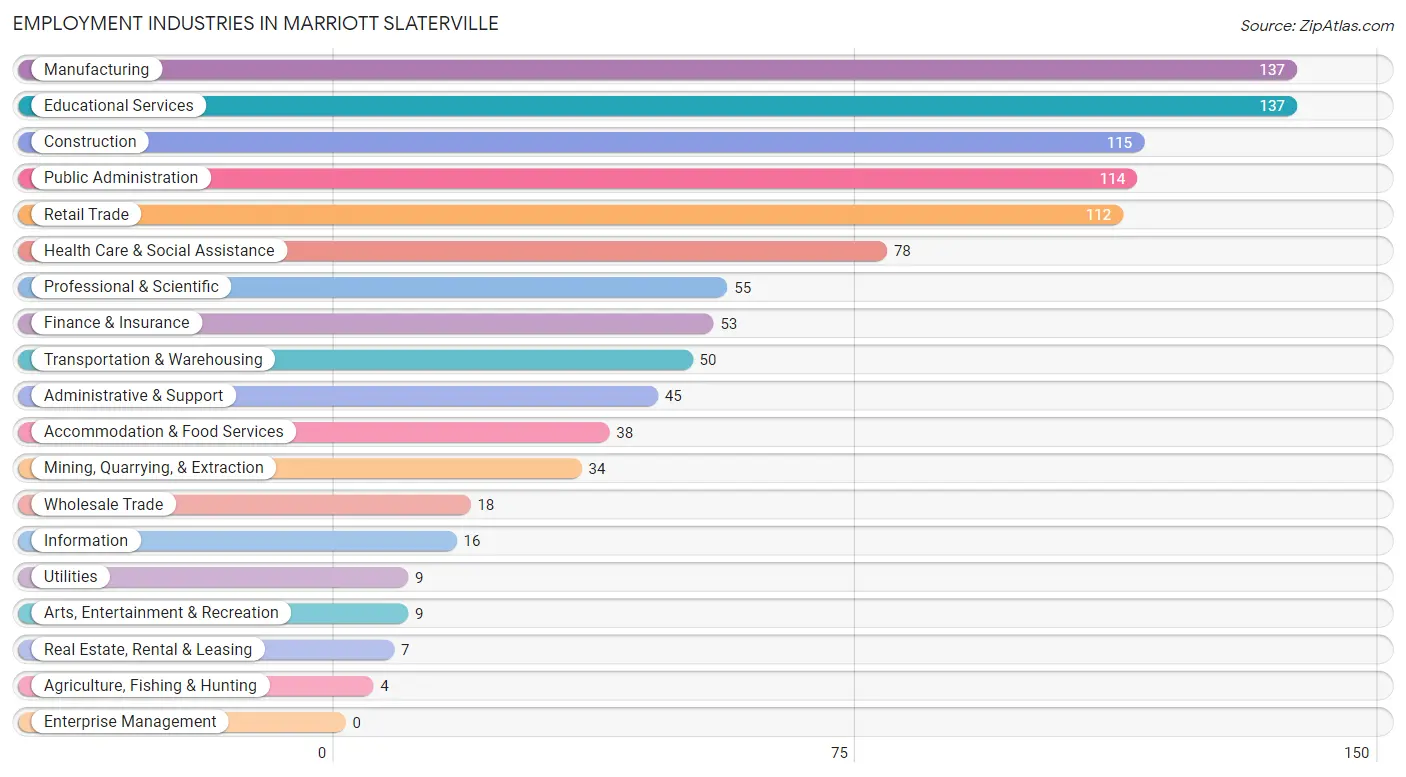
Employment Industries in Marriott Slaterville
The major employment industries in Marriott Slaterville include Manufacturing (137 | 13.0%), Educational Services (137 | 13.0%), Construction (115 | 10.9%), Public Administration (114 | 10.8%), and Retail Trade (112 | 10.7%).
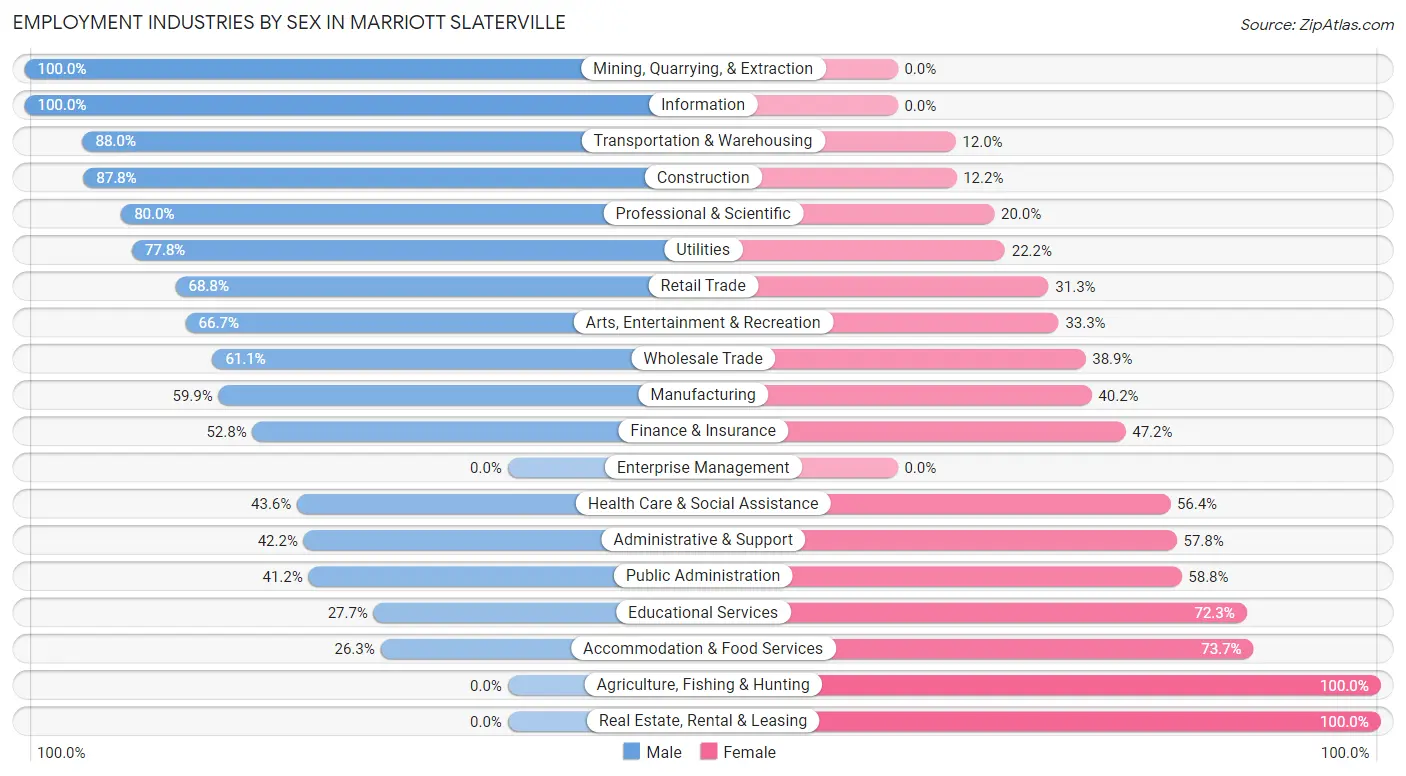
Employment Industries by Sex in Marriott Slaterville
The Marriott Slaterville industries that see more men than women are Mining, Quarrying, & Extraction (100.0%), Information (100.0%), and Transportation & Warehousing (88.0%), whereas the industries that tend to have a higher number of women are Agriculture, Fishing & Hunting (100.0%), Real Estate, Rental & Leasing (100.0%), and Accommodation & Food Services (73.7%).
| Industry | Male | Female |
| Agriculture, Fishing & Hunting | 0 (0.0%) | 4 (100.0%) |
| Mining, Quarrying, & Extraction | 34 (100.0%) | 0 (0.0%) |
| Construction | 101 (87.8%) | 14 (12.2%) |
| Manufacturing | 82 (59.9%) | 55 (40.2%) |
| Wholesale Trade | 11 (61.1%) | 7 (38.9%) |
| Retail Trade | 77 (68.8%) | 35 (31.2%) |
| Transportation & Warehousing | 44 (88.0%) | 6 (12.0%) |
| Utilities | 7 (77.8%) | 2 (22.2%) |
| Information | 16 (100.0%) | 0 (0.0%) |
| Finance & Insurance | 28 (52.8%) | 25 (47.2%) |
| Real Estate, Rental & Leasing | 0 (0.0%) | 7 (100.0%) |
| Professional & Scientific | 44 (80.0%) | 11 (20.0%) |
| Enterprise Management | 0 (0.0%) | 0 (0.0%) |
| Administrative & Support | 19 (42.2%) | 26 (57.8%) |
| Educational Services | 38 (27.7%) | 99 (72.3%) |
| Health Care & Social Assistance | 34 (43.6%) | 44 (56.4%) |
| Arts, Entertainment & Recreation | 6 (66.7%) | 3 (33.3%) |
| Accommodation & Food Services | 10 (26.3%) | 28 (73.7%) |
| Public Administration | 47 (41.2%) | 67 (58.8%) |
| Total | 607 (57.8%) | 444 (42.2%) |
Education in Marriott Slaterville
School Enrollment in Marriott Slaterville
The most common levels of schooling among the 470 students in Marriott Slaterville are middle school (124 | 26.4%), high school (118 | 25.1%), and elementary school (86 | 18.3%).
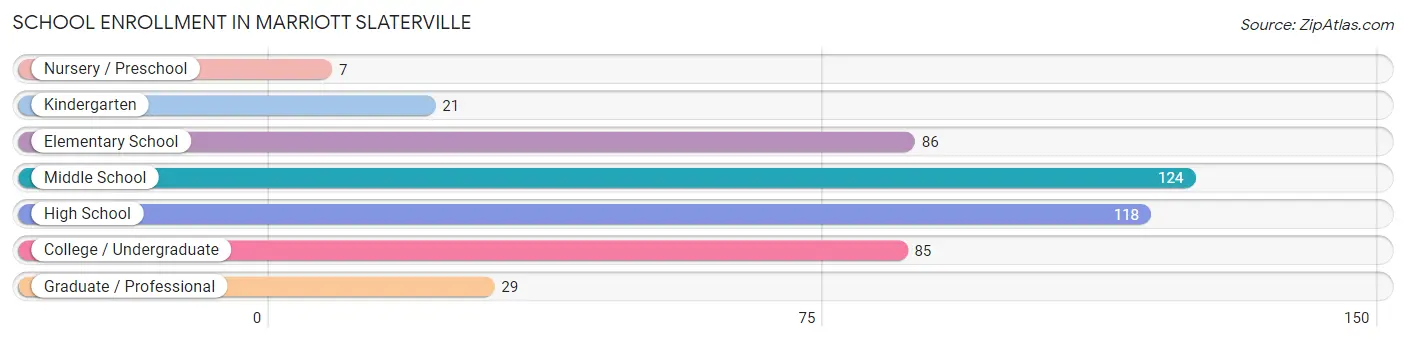
| School Level | # Students | % Students |
| Nursery / Preschool | 7 | 1.5% |
| Kindergarten | 21 | 4.5% |
| Elementary School | 86 | 18.3% |
| Middle School | 124 | 26.4% |
| High School | 118 | 25.1% |
| College / Undergraduate | 85 | 18.1% |
| Graduate / Professional | 29 | 6.2% |
| Total | 470 | 100.0% |
School Enrollment by Age by Funding Source in Marriott Slaterville
Out of a total of 470 students who are enrolled in schools in Marriott Slaterville, 48 (10.2%) attend a private institution, while the remaining 422 (89.8%) are enrolled in public schools. The age group of 25 to 34 year olds has the highest likelihood of being enrolled in private schools, with 12 (54.5% in the age bracket) enrolled. Conversely, the age group of 3 to 4 year olds has the lowest likelihood of being enrolled in a private school, with 7 (100.0% in the age bracket) attending a public institution.
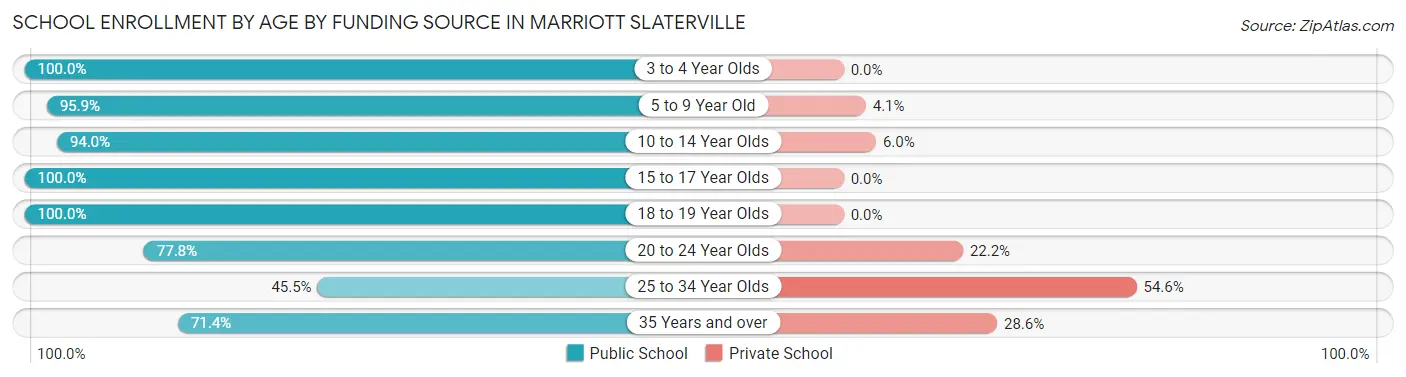
| Age Bracket | Public School | Private School |
| 3 to 4 Year Olds | 7 (100.0%) | 0 (0.0%) |
| 5 to 9 Year Old | 93 (95.9%) | 4 (4.1%) |
| 10 to 14 Year Olds | 156 (94.0%) | 10 (6.0%) |
| 15 to 17 Year Olds | 85 (100.0%) | 0 (0.0%) |
| 18 to 19 Year Olds | 8 (100.0%) | 0 (0.0%) |
| 20 to 24 Year Olds | 28 (77.8%) | 8 (22.2%) |
| 25 to 34 Year Olds | 10 (45.5%) | 12 (54.5%) |
| 35 Years and over | 35 (71.4%) | 14 (28.6%) |
| Total | 422 (89.8%) | 48 (10.2%) |
Educational Attainment by Field of Study in Marriott Slaterville
Business (56 | 19.5%), education (44 | 15.3%), arts & humanities (27 | 9.4%), bio, nature & agricultural (25 | 8.7%), and science & technology (23 | 8.0%) are the most common fields of study among 287 individuals in Marriott Slaterville who have obtained a bachelor's degree or higher.
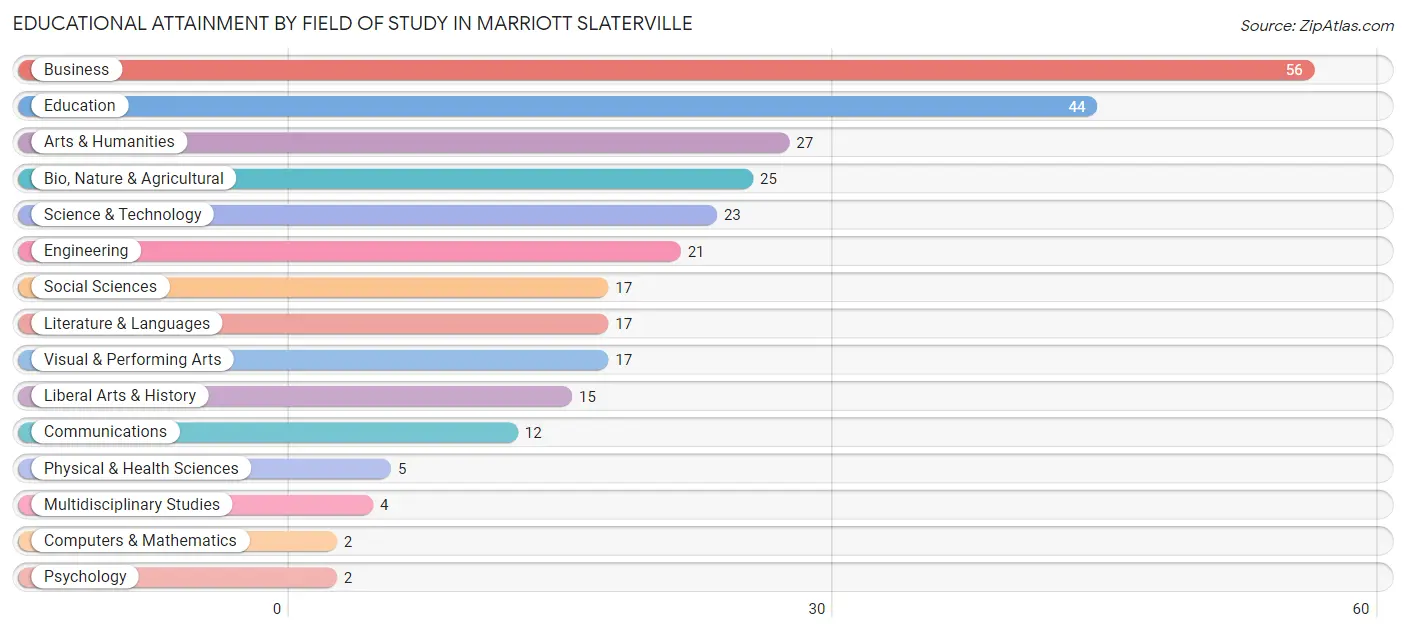
| Field of Study | # Graduates | % Graduates |
| Computers & Mathematics | 2 | 0.7% |
| Bio, Nature & Agricultural | 25 | 8.7% |
| Physical & Health Sciences | 5 | 1.7% |
| Psychology | 2 | 0.7% |
| Social Sciences | 17 | 5.9% |
| Engineering | 21 | 7.3% |
| Multidisciplinary Studies | 4 | 1.4% |
| Science & Technology | 23 | 8.0% |
| Business | 56 | 19.5% |
| Education | 44 | 15.3% |
| Literature & Languages | 17 | 5.9% |
| Liberal Arts & History | 15 | 5.2% |
| Visual & Performing Arts | 17 | 5.9% |
| Communications | 12 | 4.2% |
| Arts & Humanities | 27 | 9.4% |
| Total | 287 | 100.0% |
Transportation & Commute in Marriott Slaterville
Vehicle Availability by Sex in Marriott Slaterville
The most prevalent vehicle ownership categories in Marriott Slaterville are males with 2 vehicles (153, accounting for 25.4%) and females with 2 vehicles (123, making up 34.5%).
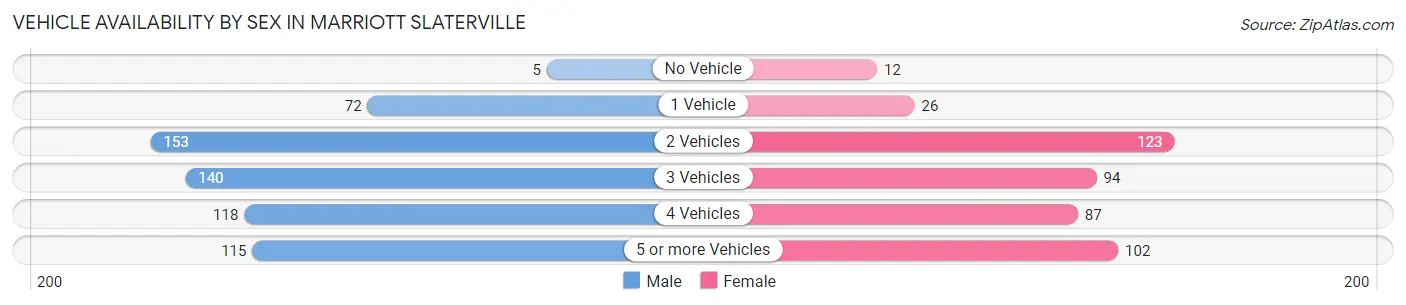
| Vehicles Available | Male | Female |
| No Vehicle | 5 (0.8%) | 12 (2.7%) |
| 1 Vehicle | 72 (11.9%) | 26 (5.9%) |
| 2 Vehicles | 153 (25.4%) | 123 (27.7%) |
| 3 Vehicles | 140 (23.2%) | 94 (21.2%) |
| 4 Vehicles | 118 (19.6%) | 87 (19.6%) |
| 5 or more Vehicles | 115 (19.1%) | 102 (23.0%) |
| Total | 603 (100.0%) | 444 (100.0%) |
Commute Time in Marriott Slaterville
The most frequently occuring commute durations in Marriott Slaterville are 20 to 24 minutes (264 commuters, 27.8%), 10 to 14 minutes (200 commuters, 21.0%), and 15 to 19 minutes (153 commuters, 16.1%).
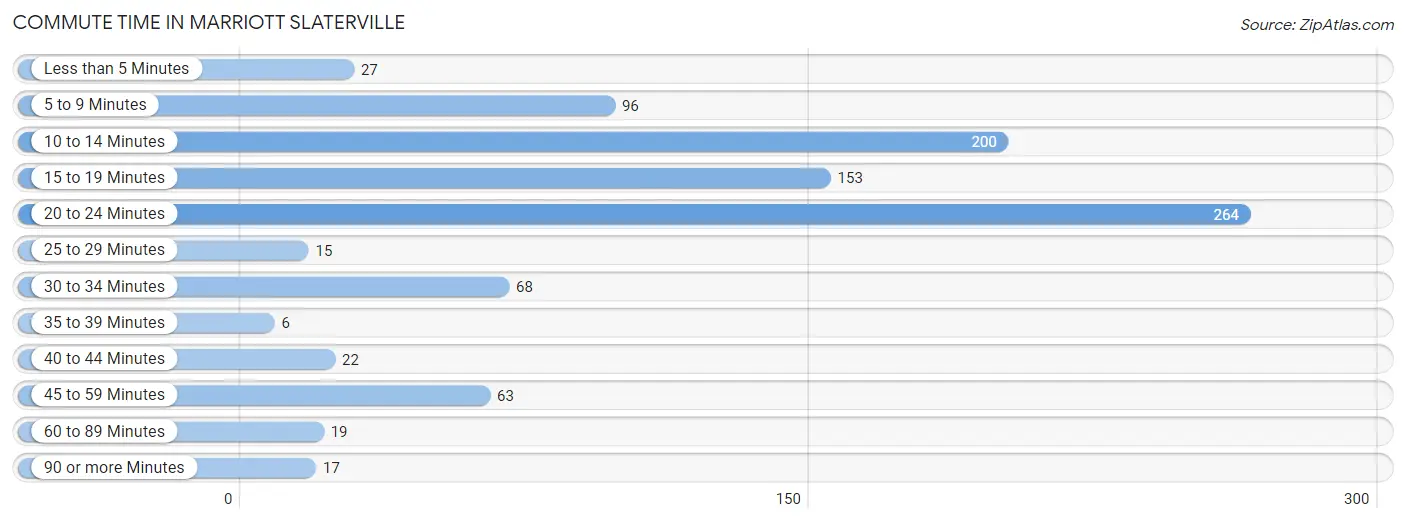
| Commute Time | # Commuters | % Commuters |
| Less than 5 Minutes | 27 | 2.8% |
| 5 to 9 Minutes | 96 | 10.1% |
| 10 to 14 Minutes | 200 | 21.0% |
| 15 to 19 Minutes | 153 | 16.1% |
| 20 to 24 Minutes | 264 | 27.8% |
| 25 to 29 Minutes | 15 | 1.6% |
| 30 to 34 Minutes | 68 | 7.2% |
| 35 to 39 Minutes | 6 | 0.6% |
| 40 to 44 Minutes | 22 | 2.3% |
| 45 to 59 Minutes | 63 | 6.6% |
| 60 to 89 Minutes | 19 | 2.0% |
| 90 or more Minutes | 17 | 1.8% |
Commute Time by Sex in Marriott Slaterville
The most common commute times in Marriott Slaterville are 20 to 24 minutes (147 commuters, 26.2%) for males and 20 to 24 minutes (117 commuters, 30.1%) for females.
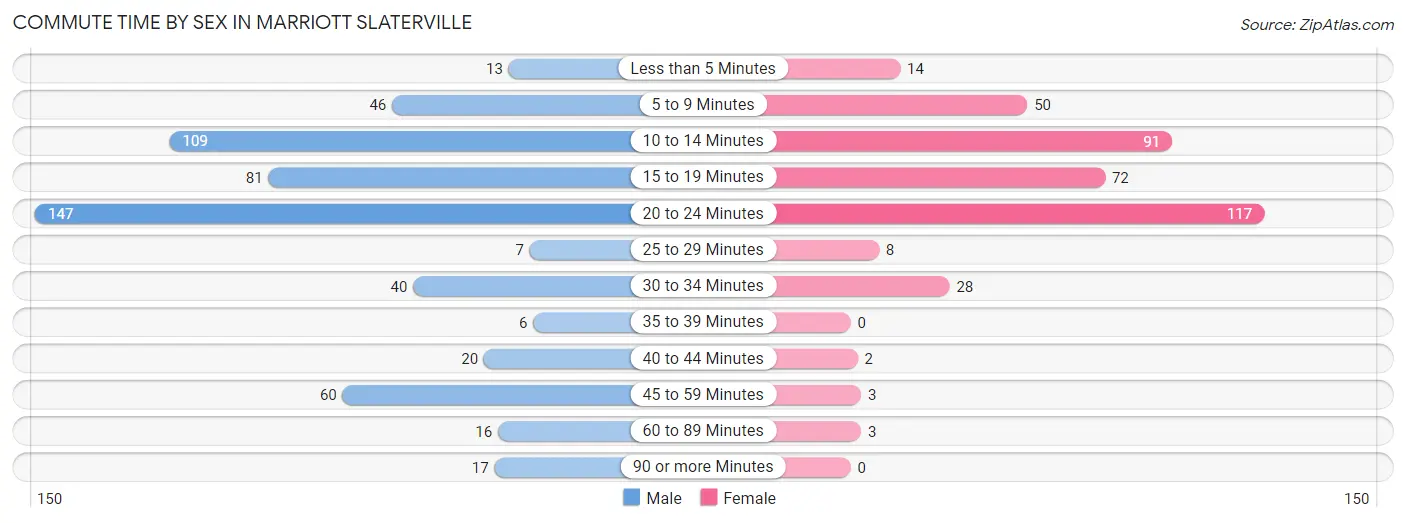
| Commute Time | Male | Female |
| Less than 5 Minutes | 13 (2.3%) | 14 (3.6%) |
| 5 to 9 Minutes | 46 (8.2%) | 50 (12.9%) |
| 10 to 14 Minutes | 109 (19.4%) | 91 (23.4%) |
| 15 to 19 Minutes | 81 (14.4%) | 72 (18.6%) |
| 20 to 24 Minutes | 147 (26.2%) | 117 (30.1%) |
| 25 to 29 Minutes | 7 (1.3%) | 8 (2.1%) |
| 30 to 34 Minutes | 40 (7.1%) | 28 (7.2%) |
| 35 to 39 Minutes | 6 (1.1%) | 0 (0.0%) |
| 40 to 44 Minutes | 20 (3.6%) | 2 (0.5%) |
| 45 to 59 Minutes | 60 (10.7%) | 3 (0.8%) |
| 60 to 89 Minutes | 16 (2.9%) | 3 (0.8%) |
| 90 or more Minutes | 17 (3.0%) | 0 (0.0%) |
Time of Departure to Work by Sex in Marriott Slaterville
The most frequent times of departure to work in Marriott Slaterville are 5:30 AM to 5:59 AM (73, 13.0%) for males and 12:00 PM to 3:59 PM (53, 13.7%) for females.
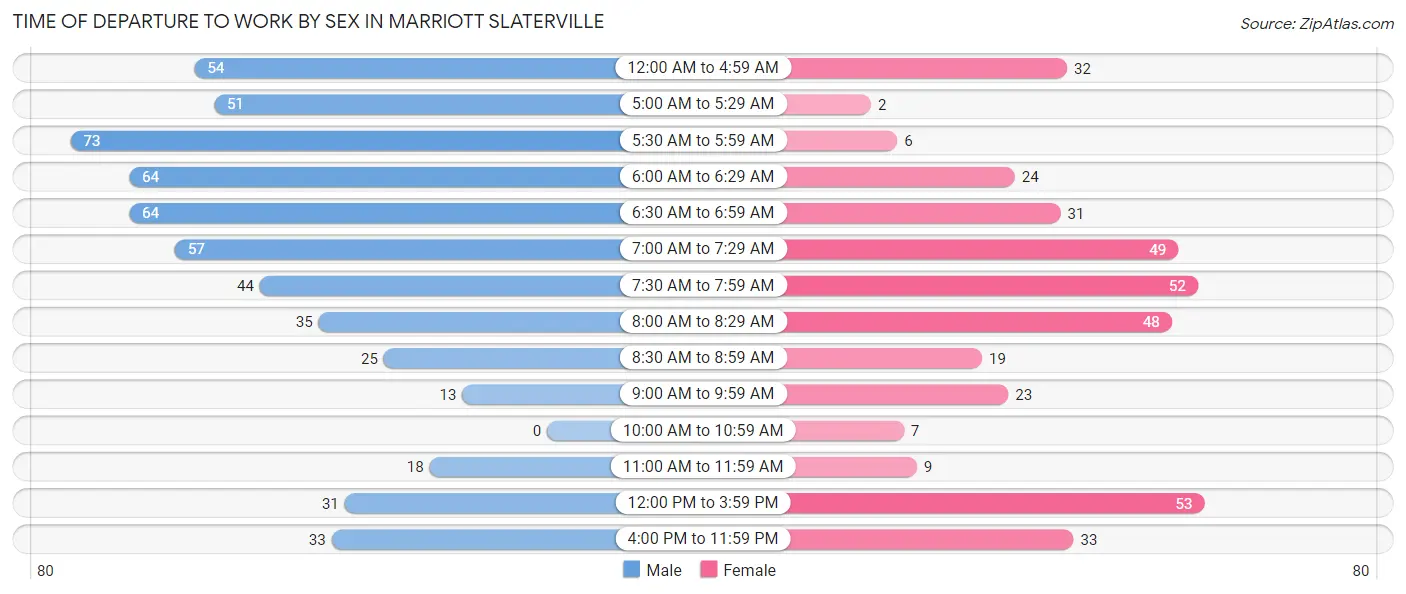
| Time of Departure | Male | Female |
| 12:00 AM to 4:59 AM | 54 (9.6%) | 32 (8.3%) |
| 5:00 AM to 5:29 AM | 51 (9.1%) | 2 (0.5%) |
| 5:30 AM to 5:59 AM | 73 (13.0%) | 6 (1.5%) |
| 6:00 AM to 6:29 AM | 64 (11.4%) | 24 (6.2%) |
| 6:30 AM to 6:59 AM | 64 (11.4%) | 31 (8.0%) |
| 7:00 AM to 7:29 AM | 57 (10.1%) | 49 (12.6%) |
| 7:30 AM to 7:59 AM | 44 (7.8%) | 52 (13.4%) |
| 8:00 AM to 8:29 AM | 35 (6.2%) | 48 (12.4%) |
| 8:30 AM to 8:59 AM | 25 (4.4%) | 19 (4.9%) |
| 9:00 AM to 9:59 AM | 13 (2.3%) | 23 (5.9%) |
| 10:00 AM to 10:59 AM | 0 (0.0%) | 7 (1.8%) |
| 11:00 AM to 11:59 AM | 18 (3.2%) | 9 (2.3%) |
| 12:00 PM to 3:59 PM | 31 (5.5%) | 53 (13.7%) |
| 4:00 PM to 11:59 PM | 33 (5.9%) | 33 (8.5%) |
| Total | 562 (100.0%) | 388 (100.0%) |
Housing Occupancy in Marriott Slaterville
Occupancy by Ownership in Marriott Slaterville
Of the total 739 dwellings in Marriott Slaterville, owner-occupied units account for 549 (74.3%), while renter-occupied units make up 190 (25.7%).
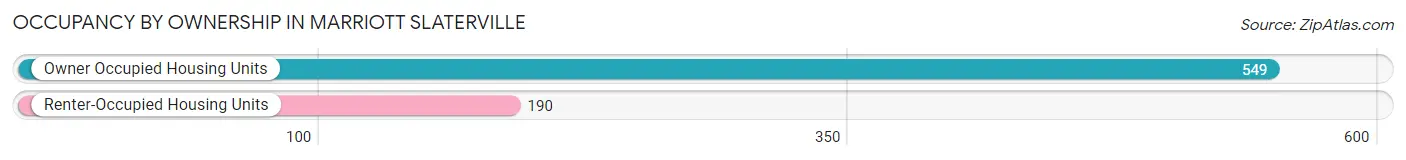
| Occupancy | # Housing Units | % Housing Units |
| Owner Occupied Housing Units | 549 | 74.3% |
| Renter-Occupied Housing Units | 190 | 25.7% |
| Total Occupied Housing Units | 739 | 100.0% |
Occupancy by Household Size in Marriott Slaterville
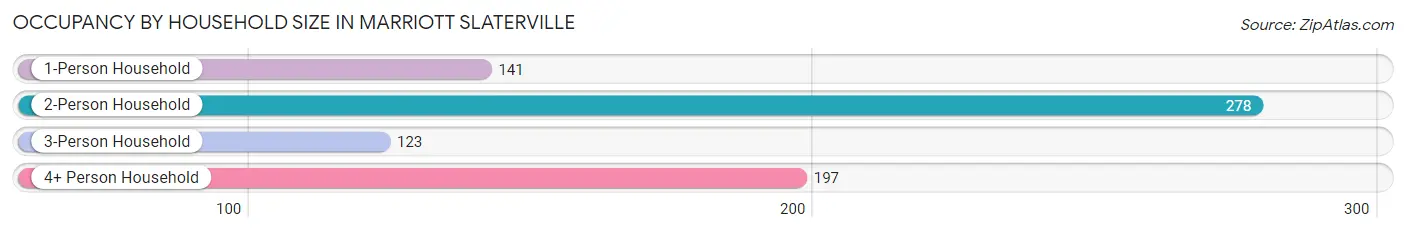
| Household Size | # Housing Units | % Housing Units |
| 1-Person Household | 141 | 19.1% |
| 2-Person Household | 278 | 37.6% |
| 3-Person Household | 123 | 16.6% |
| 4+ Person Household | 197 | 26.7% |
| Total Housing Units | 739 | 100.0% |
Occupancy by Ownership by Household Size in Marriott Slaterville
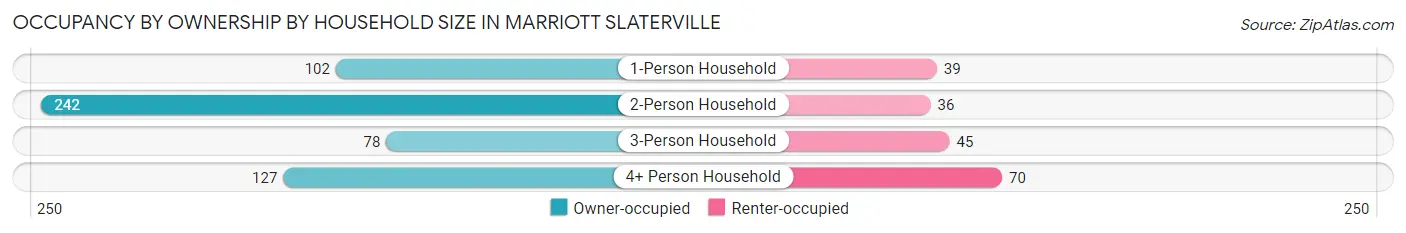
| Household Size | Owner-occupied | Renter-occupied |
| 1-Person Household | 102 (72.3%) | 39 (27.7%) |
| 2-Person Household | 242 (87.1%) | 36 (13.0%) |
| 3-Person Household | 78 (63.4%) | 45 (36.6%) |
| 4+ Person Household | 127 (64.5%) | 70 (35.5%) |
| Total Housing Units | 549 (74.3%) | 190 (25.7%) |
Occupancy by Educational Attainment in Marriott Slaterville
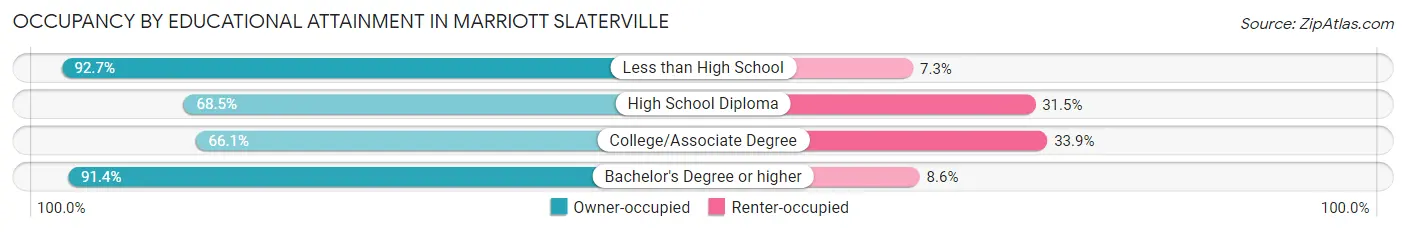
| Household Size | Owner-occupied | Renter-occupied |
| Less than High School | 38 (92.7%) | 3 (7.3%) |
| High School Diploma | 165 (68.5%) | 76 (31.5%) |
| College/Associate Degree | 187 (66.1%) | 96 (33.9%) |
| Bachelor's Degree or higher | 159 (91.4%) | 15 (8.6%) |
Occupancy by Age of Householder in Marriott Slaterville
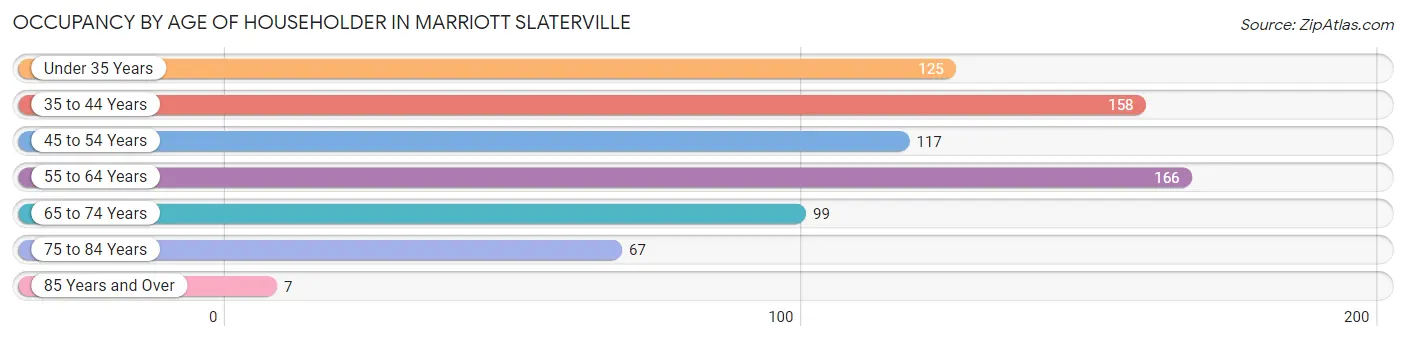
| Age Bracket | # Households | % Households |
| Under 35 Years | 125 | 16.9% |
| 35 to 44 Years | 158 | 21.4% |
| 45 to 54 Years | 117 | 15.8% |
| 55 to 64 Years | 166 | 22.5% |
| 65 to 74 Years | 99 | 13.4% |
| 75 to 84 Years | 67 | 9.1% |
| 85 Years and Over | 7 | 0.9% |
| Total | 739 | 100.0% |
Housing Finances in Marriott Slaterville
Median Income by Occupancy in Marriott Slaterville
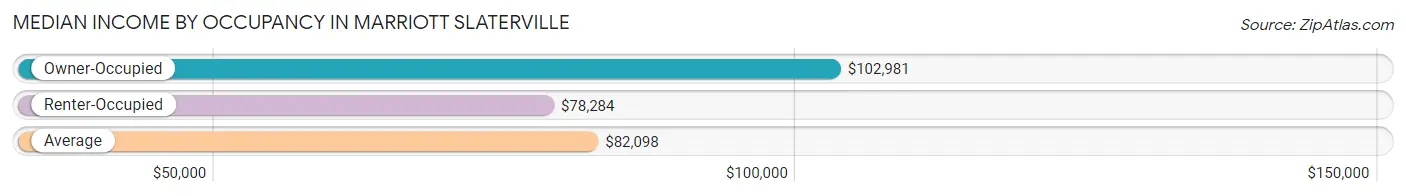
| Occupancy Type | # Households | Median Income |
| Owner-Occupied | 549 (74.3%) | $102,981 |
| Renter-Occupied | 190 (25.7%) | $78,284 |
| Average | 739 (100.0%) | $82,098 |
Occupancy by Householder Income Bracket in Marriott Slaterville
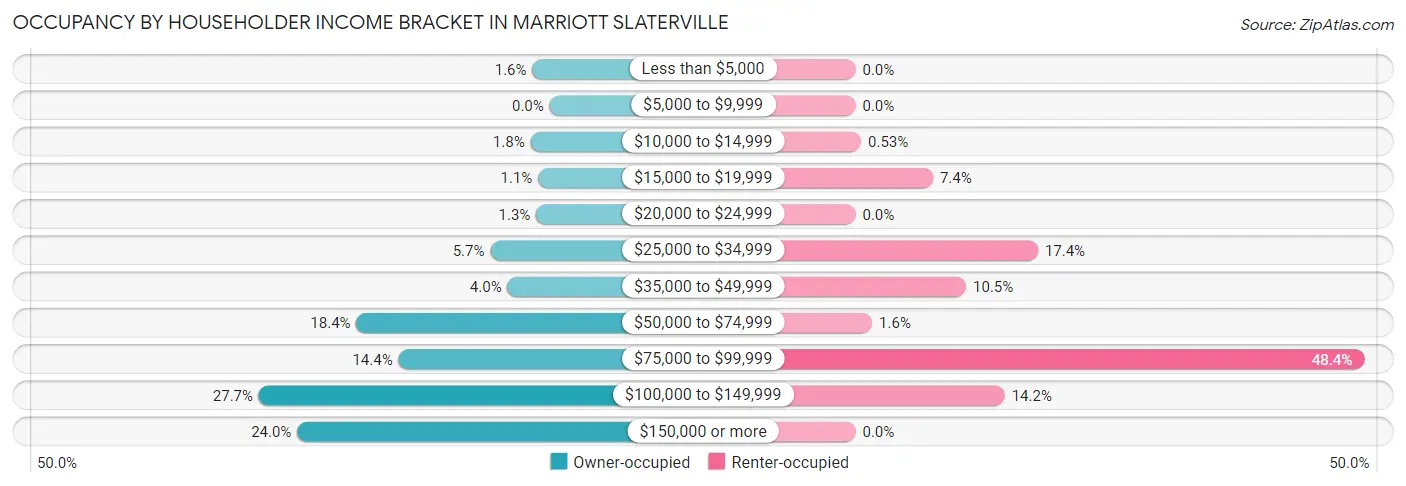
| Income Bracket | Owner-occupied | Renter-occupied |
| Less than $5,000 | 9 (1.6%) | 0 (0.0%) |
| $5,000 to $9,999 | 0 (0.0%) | 0 (0.0%) |
| $10,000 to $14,999 | 10 (1.8%) | 1 (0.5%) |
| $15,000 to $19,999 | 6 (1.1%) | 14 (7.4%) |
| $20,000 to $24,999 | 7 (1.3%) | 0 (0.0%) |
| $25,000 to $34,999 | 31 (5.7%) | 33 (17.4%) |
| $35,000 to $49,999 | 22 (4.0%) | 20 (10.5%) |
| $50,000 to $74,999 | 101 (18.4%) | 3 (1.6%) |
| $75,000 to $99,999 | 79 (14.4%) | 92 (48.4%) |
| $100,000 to $149,999 | 152 (27.7%) | 27 (14.2%) |
| $150,000 or more | 132 (24.0%) | 0 (0.0%) |
| Total | 549 (100.0%) | 190 (100.0%) |
Monthly Housing Cost Tiers in Marriott Slaterville
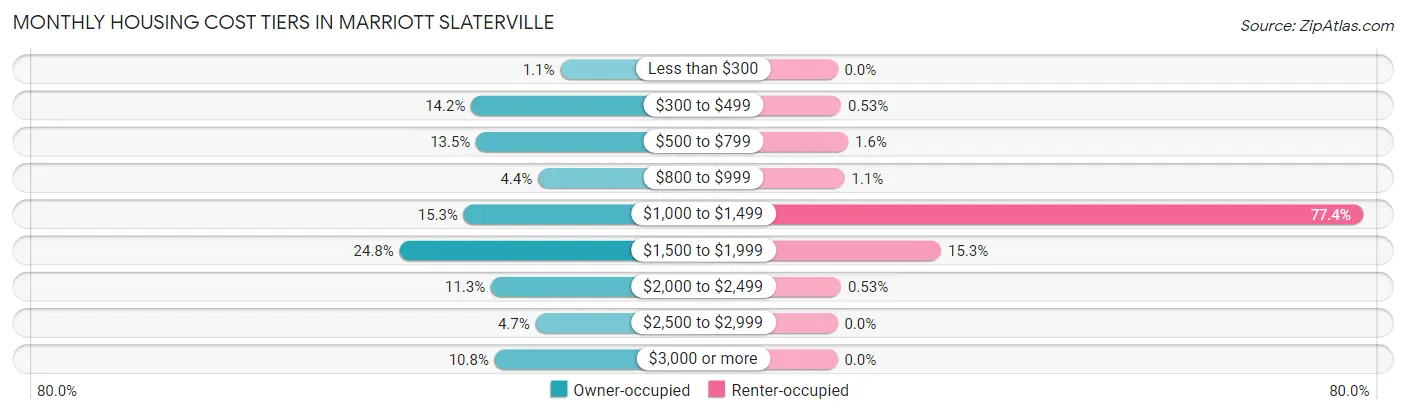
| Monthly Cost | Owner-occupied | Renter-occupied |
| Less than $300 | 6 (1.1%) | 0 (0.0%) |
| $300 to $499 | 78 (14.2%) | 1 (0.5%) |
| $500 to $799 | 74 (13.5%) | 3 (1.6%) |
| $800 to $999 | 24 (4.4%) | 2 (1.1%) |
| $1,000 to $1,499 | 84 (15.3%) | 147 (77.4%) |
| $1,500 to $1,999 | 136 (24.8%) | 29 (15.3%) |
| $2,000 to $2,499 | 62 (11.3%) | 1 (0.5%) |
| $2,500 to $2,999 | 26 (4.7%) | 0 (0.0%) |
| $3,000 or more | 59 (10.7%) | 0 (0.0%) |
| Total | 549 (100.0%) | 190 (100.0%) |
Physical Housing Characteristics in Marriott Slaterville
Housing Structures in Marriott Slaterville
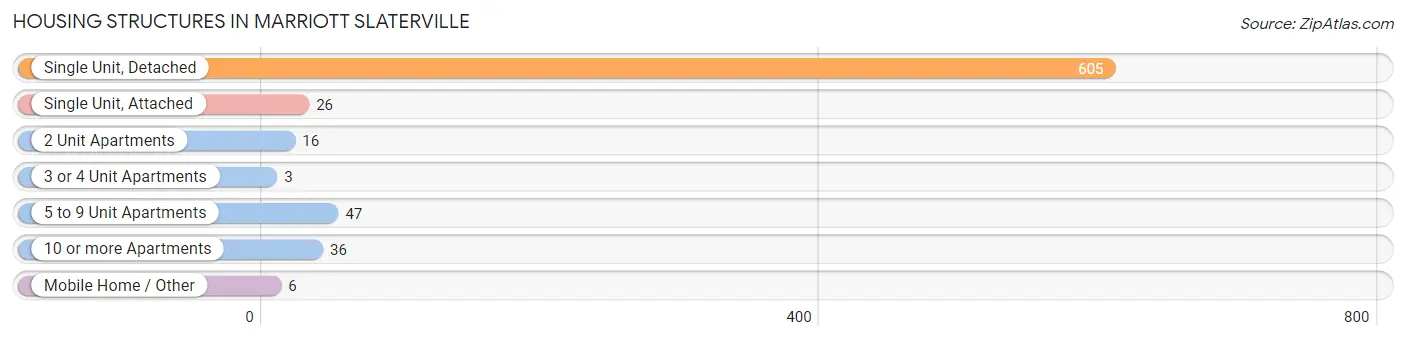
| Structure Type | # Housing Units | % Housing Units |
| Single Unit, Detached | 605 | 81.9% |
| Single Unit, Attached | 26 | 3.5% |
| 2 Unit Apartments | 16 | 2.2% |
| 3 or 4 Unit Apartments | 3 | 0.4% |
| 5 to 9 Unit Apartments | 47 | 6.4% |
| 10 or more Apartments | 36 | 4.9% |
| Mobile Home / Other | 6 | 0.8% |
| Total | 739 | 100.0% |
Housing Structures by Occupancy in Marriott Slaterville
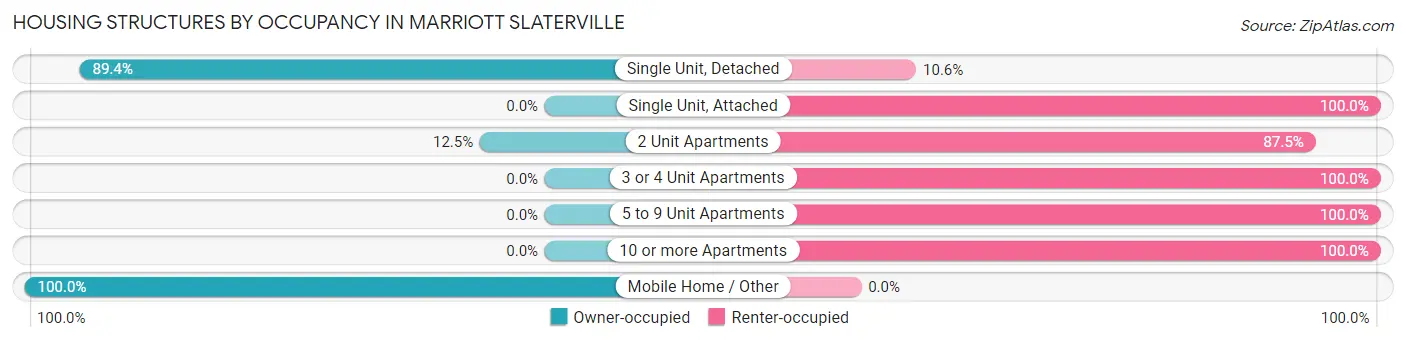
| Structure Type | Owner-occupied | Renter-occupied |
| Single Unit, Detached | 541 (89.4%) | 64 (10.6%) |
| Single Unit, Attached | 0 (0.0%) | 26 (100.0%) |
| 2 Unit Apartments | 2 (12.5%) | 14 (87.5%) |
| 3 or 4 Unit Apartments | 0 (0.0%) | 3 (100.0%) |
| 5 to 9 Unit Apartments | 0 (0.0%) | 47 (100.0%) |
| 10 or more Apartments | 0 (0.0%) | 36 (100.0%) |
| Mobile Home / Other | 6 (100.0%) | 0 (0.0%) |
| Total | 549 (74.3%) | 190 (25.7%) |
Housing Structures by Number of Rooms in Marriott Slaterville
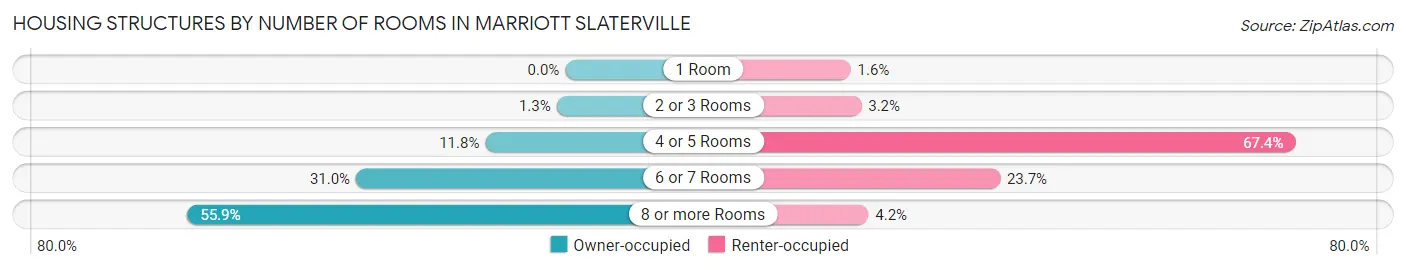
| Number of Rooms | Owner-occupied | Renter-occupied |
| 1 Room | 0 (0.0%) | 3 (1.6%) |
| 2 or 3 Rooms | 7 (1.3%) | 6 (3.2%) |
| 4 or 5 Rooms | 65 (11.8%) | 128 (67.4%) |
| 6 or 7 Rooms | 170 (31.0%) | 45 (23.7%) |
| 8 or more Rooms | 307 (55.9%) | 8 (4.2%) |
| Total | 549 (100.0%) | 190 (100.0%) |
Housing Structure by Heating Type in Marriott Slaterville
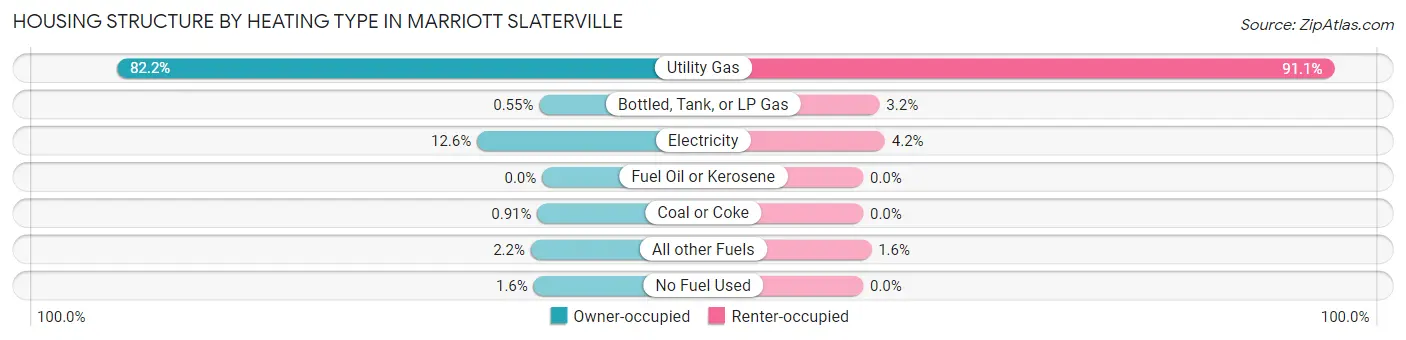
| Heating Type | Owner-occupied | Renter-occupied |
| Utility Gas | 451 (82.2%) | 173 (91.0%) |
| Bottled, Tank, or LP Gas | 3 (0.5%) | 6 (3.2%) |
| Electricity | 69 (12.6%) | 8 (4.2%) |
| Fuel Oil or Kerosene | 0 (0.0%) | 0 (0.0%) |
| Coal or Coke | 5 (0.9%) | 0 (0.0%) |
| All other Fuels | 12 (2.2%) | 3 (1.6%) |
| No Fuel Used | 9 (1.6%) | 0 (0.0%) |
| Total | 549 (100.0%) | 190 (100.0%) |
Household Vehicle Usage in Marriott Slaterville
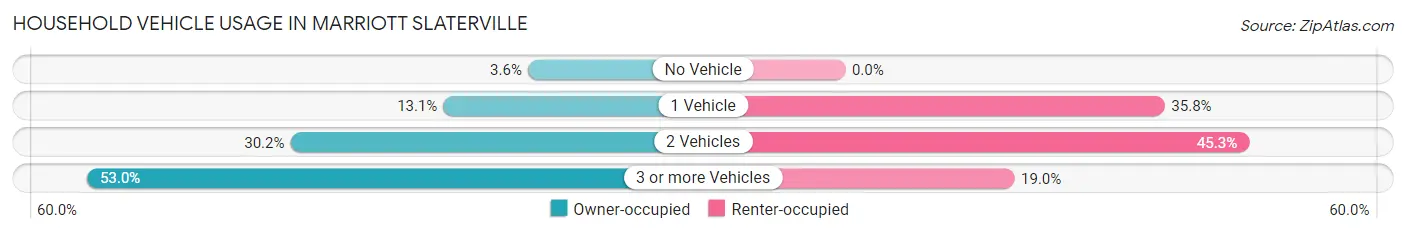
| Vehicles per Household | Owner-occupied | Renter-occupied |
| No Vehicle | 20 (3.6%) | 0 (0.0%) |
| 1 Vehicle | 72 (13.1%) | 68 (35.8%) |
| 2 Vehicles | 166 (30.2%) | 86 (45.3%) |
| 3 or more Vehicles | 291 (53.0%) | 36 (19.0%) |
| Total | 549 (100.0%) | 190 (100.0%) |
Real Estate & Mortgages in Marriott Slaterville
Real Estate and Mortgage Overview in Marriott Slaterville
| Characteristic | Without Mortgage | With Mortgage |
| Housing Units | 170 | 379 |
| Median Property Value | $433,900 | $469,400 |
| Median Household Income | $86,875 | $96 |
| Monthly Housing Costs | $531 | $59 |
| Real Estate Taxes | $2,548 | $0 |
Property Value by Mortgage Status in Marriott Slaterville
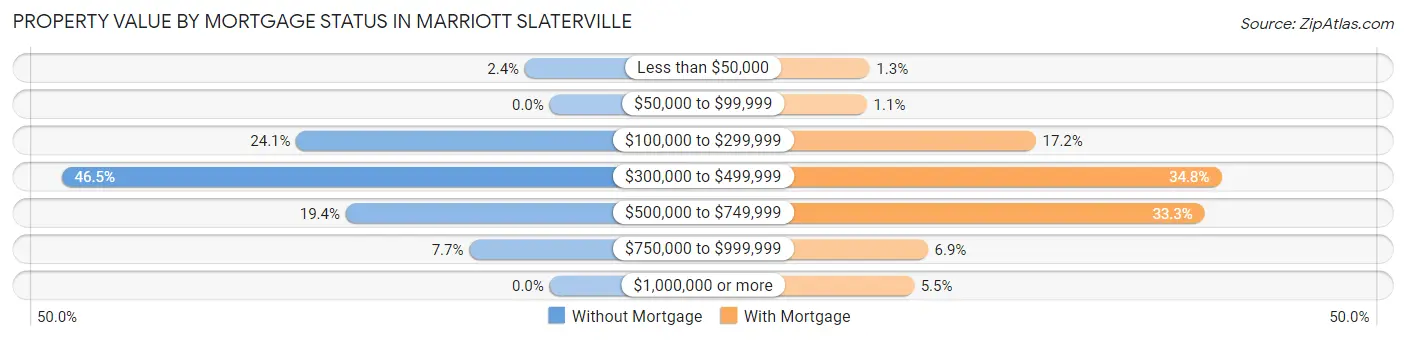
| Property Value | Without Mortgage | With Mortgage |
| Less than $50,000 | 4 (2.4%) | 5 (1.3%) |
| $50,000 to $99,999 | 0 (0.0%) | 4 (1.1%) |
| $100,000 to $299,999 | 41 (24.1%) | 65 (17.2%) |
| $300,000 to $499,999 | 79 (46.5%) | 132 (34.8%) |
| $500,000 to $749,999 | 33 (19.4%) | 126 (33.3%) |
| $750,000 to $999,999 | 13 (7.6%) | 26 (6.9%) |
| $1,000,000 or more | 0 (0.0%) | 21 (5.5%) |
| Total | 170 (100.0%) | 379 (100.0%) |
Household Income by Mortgage Status in Marriott Slaterville
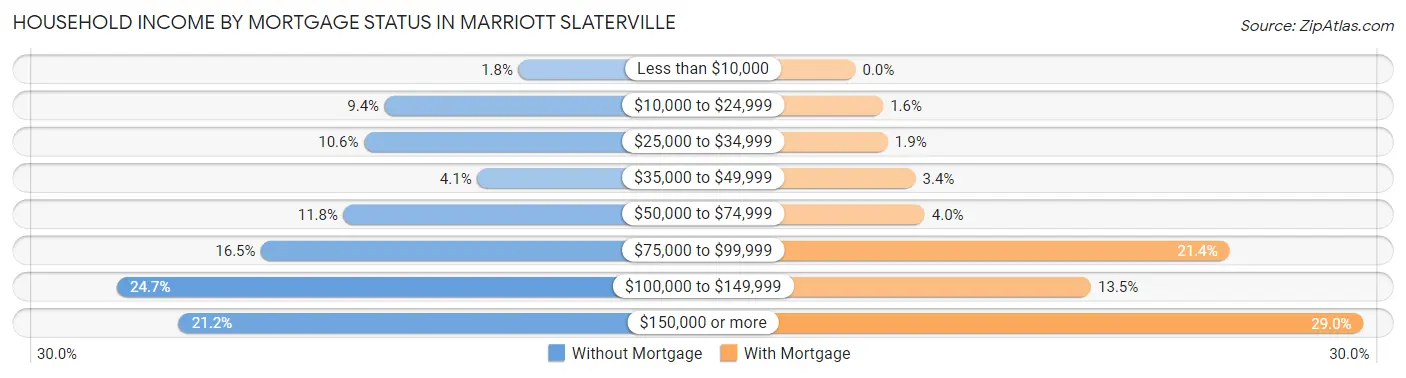
| Household Income | Without Mortgage | With Mortgage |
| Less than $10,000 | 3 (1.8%) | 0 (0.0%) |
| $10,000 to $24,999 | 16 (9.4%) | 6 (1.6%) |
| $25,000 to $34,999 | 18 (10.6%) | 7 (1.8%) |
| $35,000 to $49,999 | 7 (4.1%) | 13 (3.4%) |
| $50,000 to $74,999 | 20 (11.8%) | 15 (4.0%) |
| $75,000 to $99,999 | 28 (16.5%) | 81 (21.4%) |
| $100,000 to $149,999 | 42 (24.7%) | 51 (13.5%) |
| $150,000 or more | 36 (21.2%) | 110 (29.0%) |
| Total | 170 (100.0%) | 379 (100.0%) |
Property Value to Household Income Ratio in Marriott Slaterville
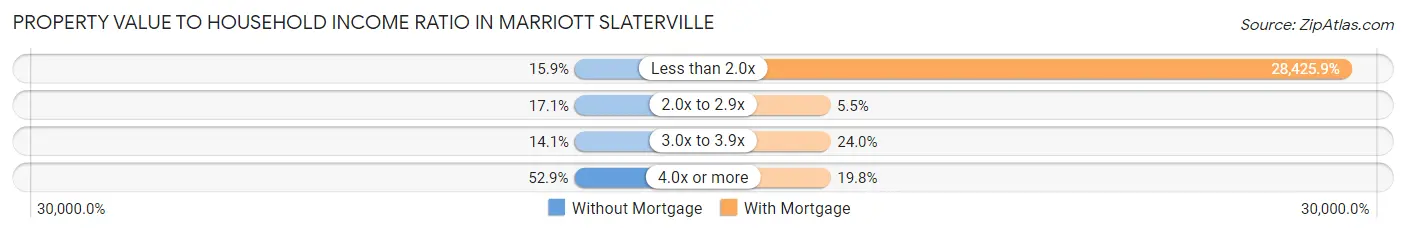
| Value-to-Income Ratio | Without Mortgage | With Mortgage |
| Less than 2.0x | 27 (15.9%) | 107,734 (28,425.9%) |
| 2.0x to 2.9x | 29 (17.1%) | 21 (5.5%) |
| 3.0x to 3.9x | 24 (14.1%) | 91 (24.0%) |
| 4.0x or more | 90 (52.9%) | 75 (19.8%) |
| Total | 170 (100.0%) | 379 (100.0%) |
Real Estate Taxes by Mortgage Status in Marriott Slaterville
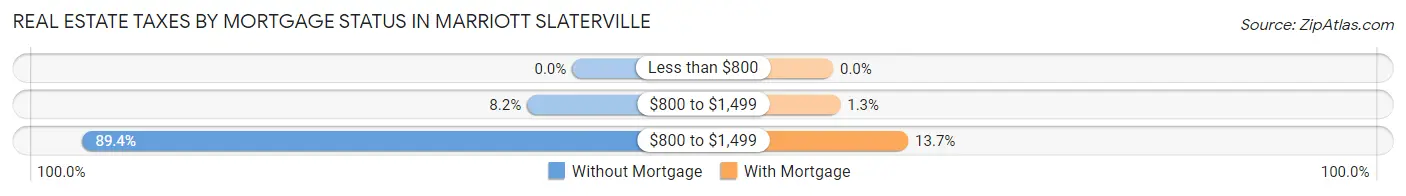
| Property Taxes | Without Mortgage | With Mortgage |
| Less than $800 | 0 (0.0%) | 0 (0.0%) |
| $800 to $1,499 | 14 (8.2%) | 5 (1.3%) |
| $800 to $1,499 | 152 (89.4%) | 52 (13.7%) |
| Total | 170 (100.0%) | 379 (100.0%) |
Health & Disability in Marriott Slaterville
Health Insurance Coverage by Age in Marriott Slaterville
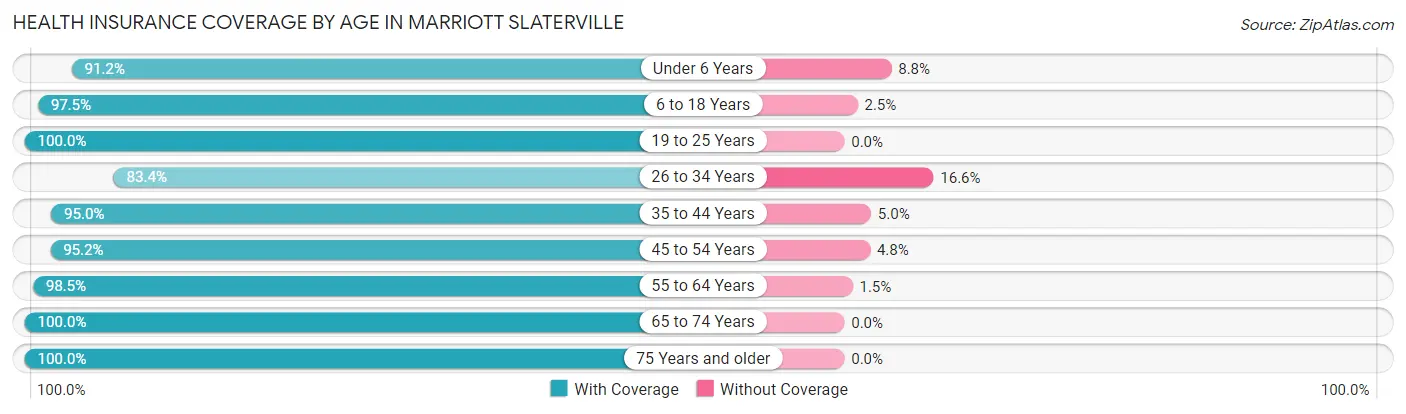
| Age Bracket | With Coverage | Without Coverage |
| Under 6 Years | 125 (91.2%) | 12 (8.8%) |
| 6 to 18 Years | 356 (97.5%) | 9 (2.5%) |
| 19 to 25 Years | 117 (100.0%) | 0 (0.0%) |
| 26 to 34 Years | 266 (83.4%) | 53 (16.6%) |
| 35 to 44 Years | 268 (95.0%) | 14 (5.0%) |
| 45 to 54 Years | 199 (95.2%) | 10 (4.8%) |
| 55 to 64 Years | 322 (98.5%) | 5 (1.5%) |
| 65 to 74 Years | 182 (100.0%) | 0 (0.0%) |
| 75 Years and older | 103 (100.0%) | 0 (0.0%) |
| Total | 1,938 (95.0%) | 103 (5.1%) |
Health Insurance Coverage by Citizenship Status in Marriott Slaterville
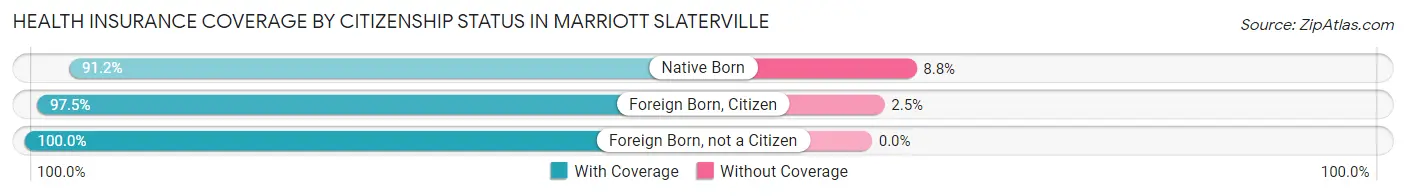
| Citizenship Status | With Coverage | Without Coverage |
| Native Born | 125 (91.2%) | 12 (8.8%) |
| Foreign Born, Citizen | 356 (97.5%) | 9 (2.5%) |
| Foreign Born, not a Citizen | 117 (100.0%) | 0 (0.0%) |
Health Insurance Coverage by Household Income in Marriott Slaterville
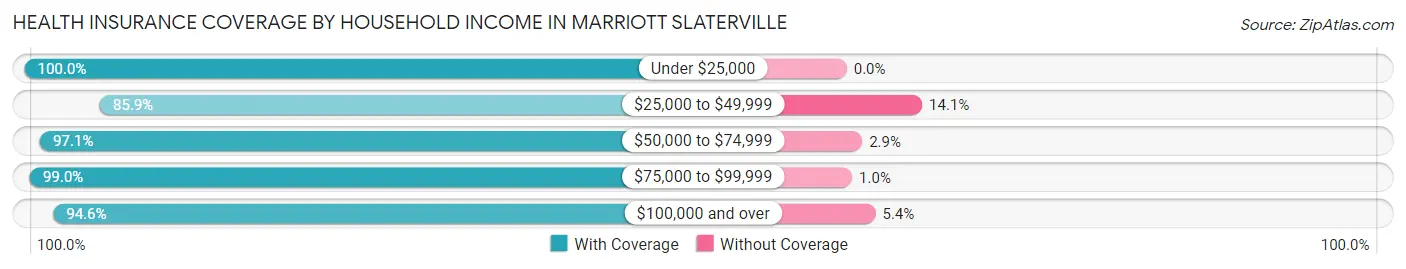
| Household Income | With Coverage | Without Coverage |
| Under $25,000 | 86 (100.0%) | 0 (0.0%) |
| $25,000 to $49,999 | 219 (85.9%) | 36 (14.1%) |
| $50,000 to $74,999 | 269 (97.1%) | 8 (2.9%) |
| $75,000 to $99,999 | 398 (99.0%) | 4 (1.0%) |
| $100,000 and over | 966 (94.6%) | 55 (5.4%) |
Public vs Private Health Insurance Coverage by Age in Marriott Slaterville
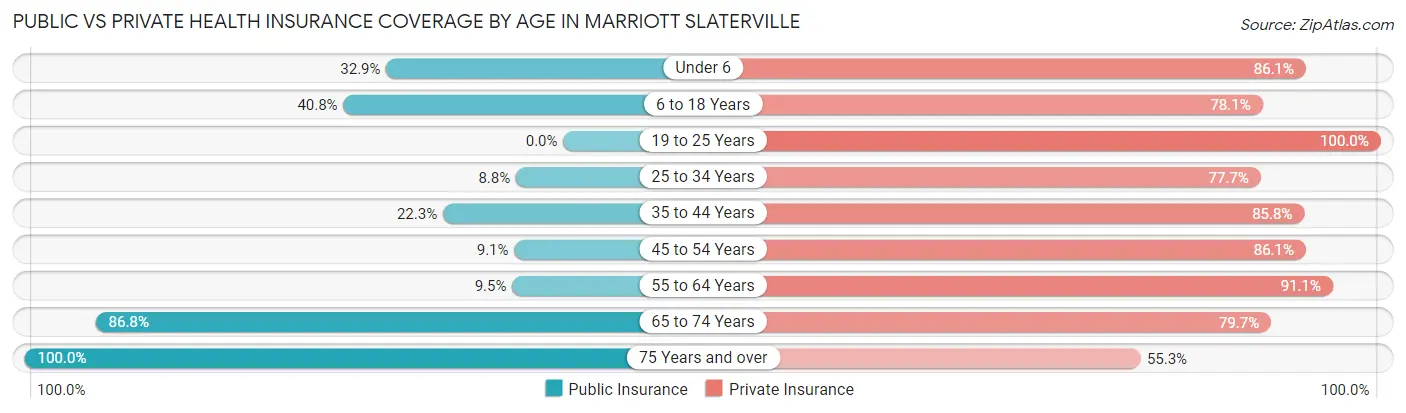
| Age Bracket | Public Insurance | Private Insurance |
| Under 6 | 45 (32.9%) | 118 (86.1%) |
| 6 to 18 Years | 149 (40.8%) | 285 (78.1%) |
| 19 to 25 Years | 0 (0.0%) | 117 (100.0%) |
| 25 to 34 Years | 28 (8.8%) | 248 (77.7%) |
| 35 to 44 Years | 63 (22.3%) | 242 (85.8%) |
| 45 to 54 Years | 19 (9.1%) | 180 (86.1%) |
| 55 to 64 Years | 31 (9.5%) | 298 (91.1%) |
| 65 to 74 Years | 158 (86.8%) | 145 (79.7%) |
| 75 Years and over | 103 (100.0%) | 57 (55.3%) |
| Total | 596 (29.2%) | 1,690 (82.8%) |
Disability Status by Sex by Age in Marriott Slaterville
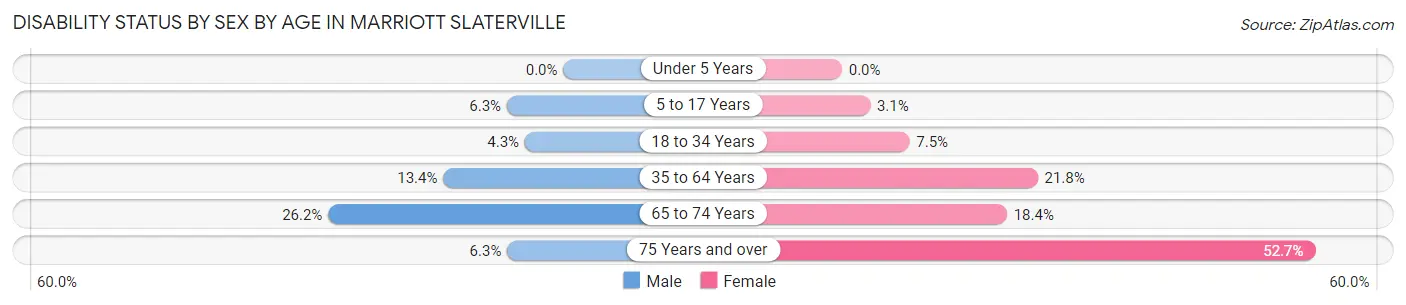
| Age Bracket | Male | Female |
| Under 5 Years | 0 (0.0%) | 0 (0.0%) |
| 5 to 17 Years | 14 (6.3%) | 5 (3.1%) |
| 18 to 34 Years | 13 (4.3%) | 10 (7.5%) |
| 35 to 64 Years | 56 (13.4%) | 87 (21.8%) |
| 65 to 74 Years | 22 (26.2%) | 18 (18.4%) |
| 75 Years and over | 3 (6.2%) | 29 (52.7%) |
Disability Class by Sex by Age in Marriott Slaterville
Disability Class: Hearing Difficulty
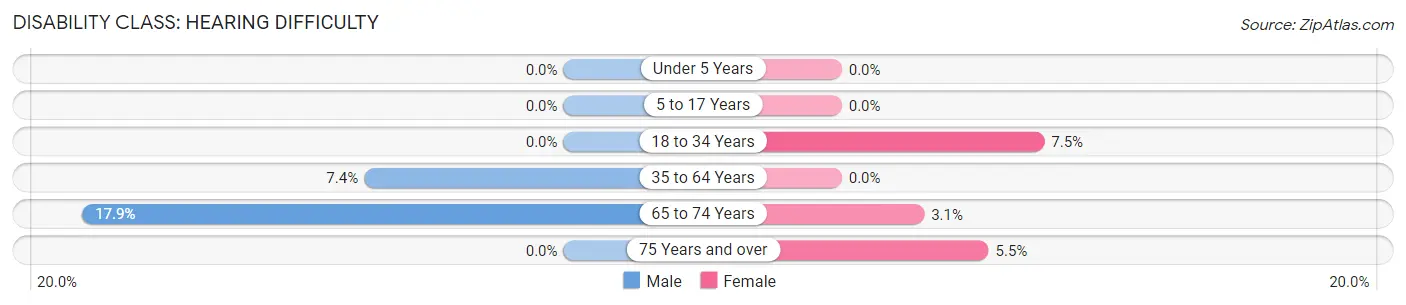
| Age Bracket | Male | Female |
| Under 5 Years | 0 (0.0%) | 0 (0.0%) |
| 5 to 17 Years | 0 (0.0%) | 0 (0.0%) |
| 18 to 34 Years | 0 (0.0%) | 10 (7.5%) |
| 35 to 64 Years | 31 (7.4%) | 0 (0.0%) |
| 65 to 74 Years | 15 (17.9%) | 3 (3.1%) |
| 75 Years and over | 0 (0.0%) | 3 (5.4%) |
Disability Class: Vision Difficulty
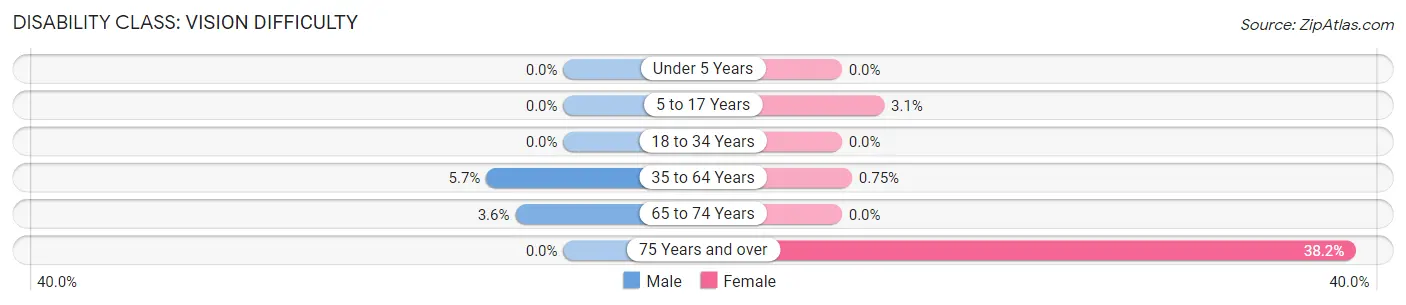
| Age Bracket | Male | Female |
| Under 5 Years | 0 (0.0%) | 0 (0.0%) |
| 5 to 17 Years | 0 (0.0%) | 5 (3.1%) |
| 18 to 34 Years | 0 (0.0%) | 0 (0.0%) |
| 35 to 64 Years | 24 (5.7%) | 3 (0.7%) |
| 65 to 74 Years | 3 (3.6%) | 0 (0.0%) |
| 75 Years and over | 0 (0.0%) | 21 (38.2%) |
Disability Class: Cognitive Difficulty
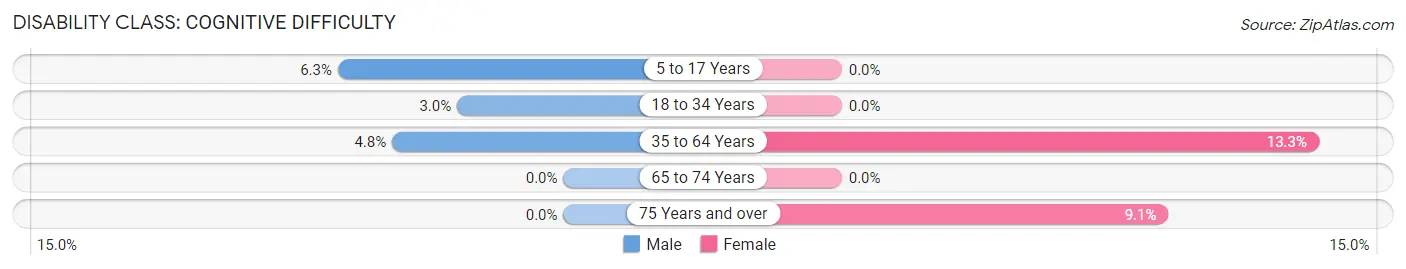
| Age Bracket | Male | Female |
| 5 to 17 Years | 14 (6.3%) | 0 (0.0%) |
| 18 to 34 Years | 9 (3.0%) | 0 (0.0%) |
| 35 to 64 Years | 20 (4.8%) | 53 (13.3%) |
| 65 to 74 Years | 0 (0.0%) | 0 (0.0%) |
| 75 Years and over | 0 (0.0%) | 5 (9.1%) |
Disability Class: Ambulatory Difficulty
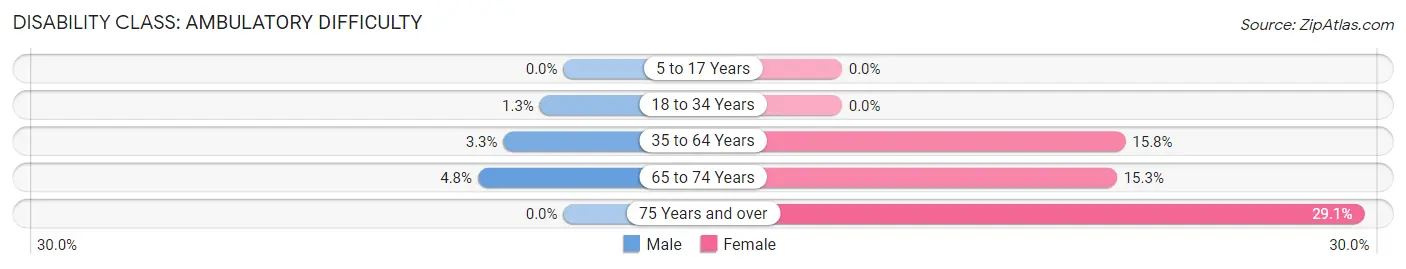
| Age Bracket | Male | Female |
| 5 to 17 Years | 0 (0.0%) | 0 (0.0%) |
| 18 to 34 Years | 4 (1.3%) | 0 (0.0%) |
| 35 to 64 Years | 14 (3.3%) | 63 (15.8%) |
| 65 to 74 Years | 4 (4.8%) | 15 (15.3%) |
| 75 Years and over | 0 (0.0%) | 16 (29.1%) |
Disability Class: Self-Care Difficulty
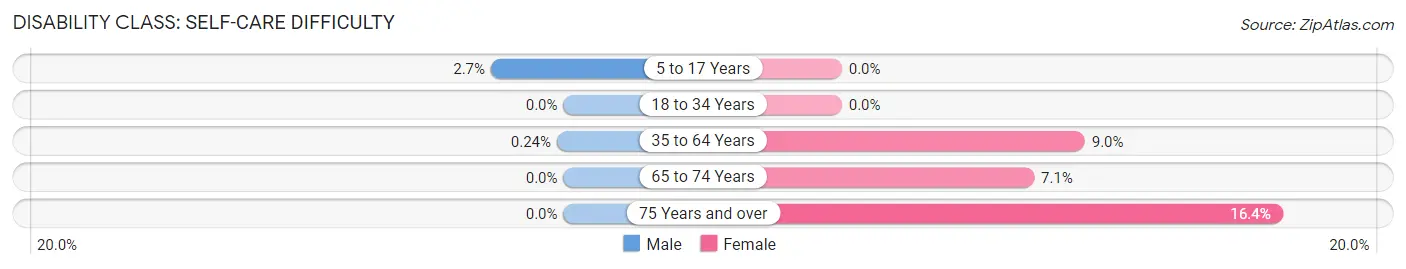
| Age Bracket | Male | Female |
| 5 to 17 Years | 6 (2.7%) | 0 (0.0%) |
| 18 to 34 Years | 0 (0.0%) | 0 (0.0%) |
| 35 to 64 Years | 1 (0.2%) | 36 (9.0%) |
| 65 to 74 Years | 0 (0.0%) | 7 (7.1%) |
| 75 Years and over | 0 (0.0%) | 9 (16.4%) |
Technology Access in Marriott Slaterville
Computing Device Access in Marriott Slaterville
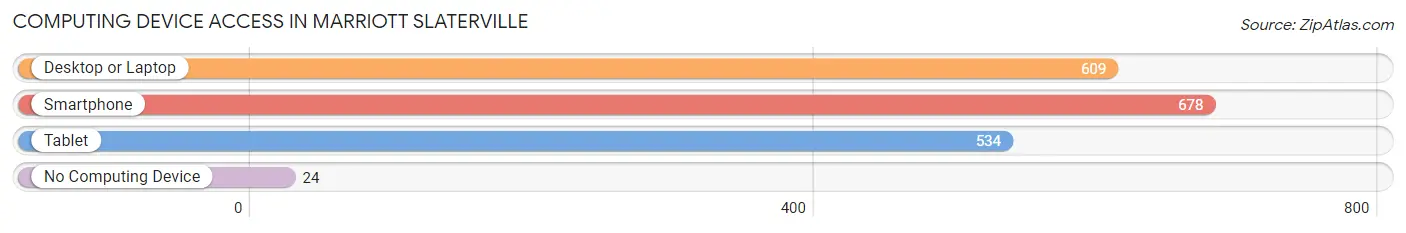
| Device Type | # Households | % Households |
| Desktop or Laptop | 609 | 82.4% |
| Smartphone | 678 | 91.7% |
| Tablet | 534 | 72.3% |
| No Computing Device | 24 | 3.3% |
| Total | 739 | 100.0% |
Internet Access in Marriott Slaterville

| Internet Type | # Households | % Households |
| Dial-Up Internet | 0 | 0.0% |
| Broadband Home | 478 | 64.7% |
| Cellular Data Only | 95 | 12.9% |
| Satellite Internet | 148 | 20.0% |
| No Internet | 34 | 4.6% |
| Total | 739 | 100.0% |
Marriott Slaterville Summary
Marriott Slaterville, Utah is a small city located in Weber County, Utah. It is situated in the northern part of the state, just north of Ogden and south of Brigham City. The city is part of the Ogden-Clearfield Metropolitan Statistical Area and has a population of approximately 5,000 people.
History
Marriott Slaterville was founded in 1851 by a group of Mormon pioneers led by John R. Slaterville. The city was named after Slaterville, a small town in England. The pioneers were looking for a place to settle and build a community. They chose the area because of its fertile soil and abundant water supply. The city was incorporated in 1868 and has remained a small, rural community ever since.
Geography
Marriott Slaterville is located in the northern part of Utah, just north of Ogden and south of Brigham City. The city is situated in the foothills of the Wasatch Mountains and is surrounded by rolling hills and farmland. The city is located at an elevation of 4,400 feet and has a total area of 4.2 square miles. The climate is semi-arid with hot summers and cold winters.
Economy
Marriott Slaterville’s economy is largely based on agriculture and tourism. The city is home to several farms and ranches that produce a variety of crops, including corn, wheat, hay, and alfalfa. The city is also home to several tourist attractions, including the Ogden Valley Golf Course, the Ogden Valley Ski Resort, and the Ogden Valley Wildlife Refuge.
Demographics
As of the 2010 census, Marriott Slaterville had a population of 5,000 people. The racial makeup of the city was 94.2% White, 0.7% African American, 0.3% Native American, 0.7% Asian, 0.1% Pacific Islander, and 3.9% from other races. The median household income was $50,000 and the median family income was $54,000. The per capita income was $20,000. The city’s population is largely made up of families, with nearly half of the population under the age of 18.
Marriott Slaterville is a small, rural community with a rich history and a strong sense of community. The city is home to a variety of businesses and attractions, and its economy is largely based on agriculture and tourism. The city’s population is largely made up of families, and the median household income is slightly above the national average. Marriott Slaterville is a great place to live and work, and it is a great place to raise a family.
Common Questions
What is the Total Population of Marriott Slaterville?
Total Population of Marriott Slaterville is 2,041.
What is the Total Male Population of Marriott Slaterville?
Total Male Population of Marriott Slaterville is 1,168.
What is the Total Female Population of Marriott Slaterville?
Total Female Population of Marriott Slaterville is 873.
What is the Ratio of Males per 100 Females in Marriott Slaterville?
There are 133.79 Males per 100 Females in Marriott Slaterville.
What is the Ratio of Females per 100 Males in Marriott Slaterville?
There are 74.74 Females per 100 Males in Marriott Slaterville.
What is the Median Population Age in Marriott Slaterville?
Median Population Age in Marriott Slaterville is 36.7 Years.
What is the Average Family Size in Marriott Slaterville
Average Family Size in Marriott Slaterville is 3.1 People.
What is the Average Household Size in Marriott Slaterville
Average Household Size in Marriott Slaterville is 2.8 People.
What is Per Capita Income in Marriott Slaterville?
Per Capita income in Marriott Slaterville is $38,664.
What is the Median Family Income in Marriott Slaterville?
Median Family Income in Marriott Slaterville is $92,708.
What is the Median Household income in Marriott Slaterville?
Median Household Income in Marriott Slaterville is $82,098.
What is Income or Wage Gap in Marriott Slaterville?
Income or Wage Gap in Marriott Slaterville is 51.3%.
Women in Marriott Slaterville earn 48.7 cents for every dollar earned by a man.
What is Inequality or Gini Index in Marriott Slaterville?
Inequality or Gini Index in Marriott Slaterville is 0.36.
How Large is the Labor Force in Marriott Slaterville?
There are 1,065 People in the Labor Forcein in Marriott Slaterville.
What is the Percentage of People in the Labor Force in Marriott Slaterville?
67.0% of People are in the Labor Force in Marriott Slaterville.
What is the Unemployment Rate in Marriott Slaterville?
Unemployment Rate in Marriott Slaterville is 1.4%.