Rockville, UT
Rockville Map
Rockville Overview
180
TOTAL POPULATION
95
MALE POPULATION
85
FEMALE POPULATION
111.76
MALES / 100 FEMALES
89.47
FEMALES / 100 MALES
66.3
MEDIAN AGE
2.8
AVG FAMILY SIZE
1.7
AVG HOUSEHOLD SIZE
$36,360
PER CAPITA INCOME
$87,000
AVG FAMILY INCOME
$48,438
AVG HOUSEHOLD INCOME
63.5%
WAGE / INCOME GAP [ % ]
36.5¢/ $1
WAGE / INCOME GAP [ $ ]
0.37
INEQUALITY / GINI INDEX
68
LABOR FORCE [ PEOPLE ]
41.7%
PERCENT IN LABOR FORCE
Rockville Zip Codes
Rockville Area Codes
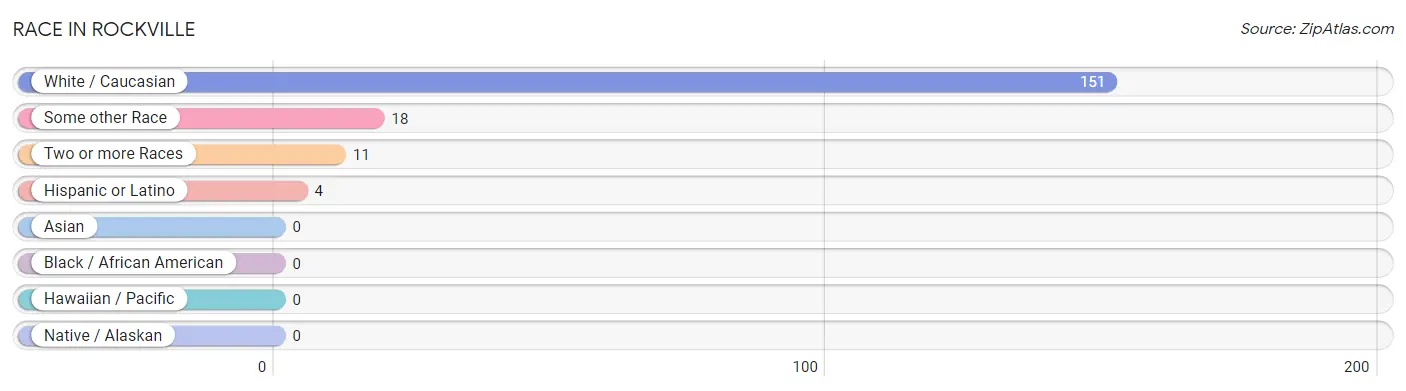
Race in Rockville
The most populous races in Rockville are White / Caucasian (151 | 83.9%), Some other Race (18 | 10.0%), and Two or more Races (11 | 6.1%).
| Race | # Population | % Population |
| Asian | 0 | 0.0% |
| Black / African American | 0 | 0.0% |
| Hawaiian / Pacific | 0 | 0.0% |
| Hispanic or Latino | 4 | 2.2% |
| Native / Alaskan | 0 | 0.0% |
| White / Caucasian | 151 | 83.9% |
| Two or more Races | 11 | 6.1% |
| Some other Race | 18 | 10.0% |
| Total | 180 | 100.0% |
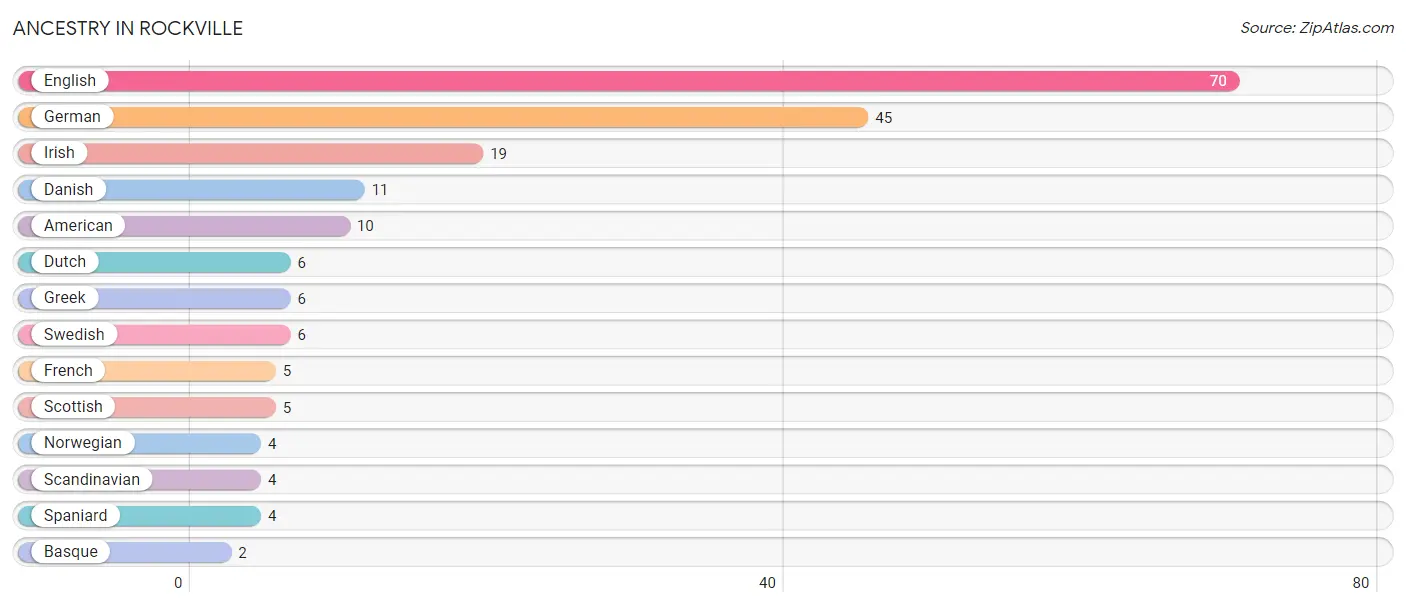
Ancestry in Rockville
The most populous ancestries reported in Rockville are English (70 | 38.9%), German (45 | 25.0%), Irish (19 | 10.6%), Danish (11 | 6.1%), and American (10 | 5.6%), together accounting for 86.1% of all Rockville residents.
| Ancestry | # Population | % Population |
| American | 10 | 5.6% |
| Basque | 2 | 1.1% |
| Danish | 11 | 6.1% |
| Dutch | 6 | 3.3% |
| English | 70 | 38.9% |
| French | 5 | 2.8% |
| German | 45 | 25.0% |
| Greek | 6 | 3.3% |
| Irish | 19 | 10.6% |
| Norwegian | 4 | 2.2% |
| Scandinavian | 4 | 2.2% |
| Scottish | 5 | 2.8% |
| Spaniard | 4 | 2.2% |
| Swedish | 6 | 3.3% | View All 14 Rows |
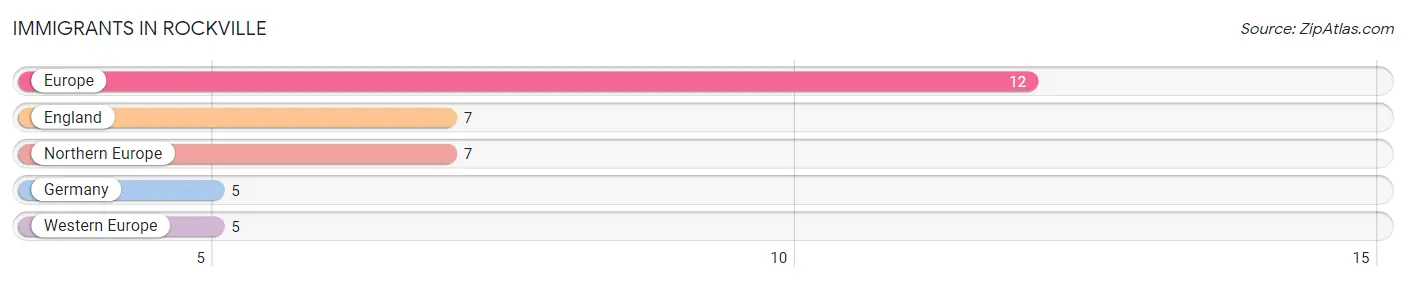
Immigrants in Rockville
The most numerous immigrant groups reported in Rockville came from Europe (12 | 6.7%), England (7 | 3.9%), Northern Europe (7 | 3.9%), Germany (5 | 2.8%), and Western Europe (5 | 2.8%), together accounting for 20.0% of all Rockville residents.
| Immigration Origin | # Population | % Population |
| England | 7 | 3.9% |
| Europe | 12 | 6.7% |
| Germany | 5 | 2.8% |
| Northern Europe | 7 | 3.9% |
| Western Europe | 5 | 2.8% | View All 5 Rows |
Sex and Age in Rockville
Sex and Age in Rockville
The most populous age groups in Rockville are 65 to 69 Years (30 | 31.6%) for men and 70 to 74 Years (24 | 28.2%) for women.
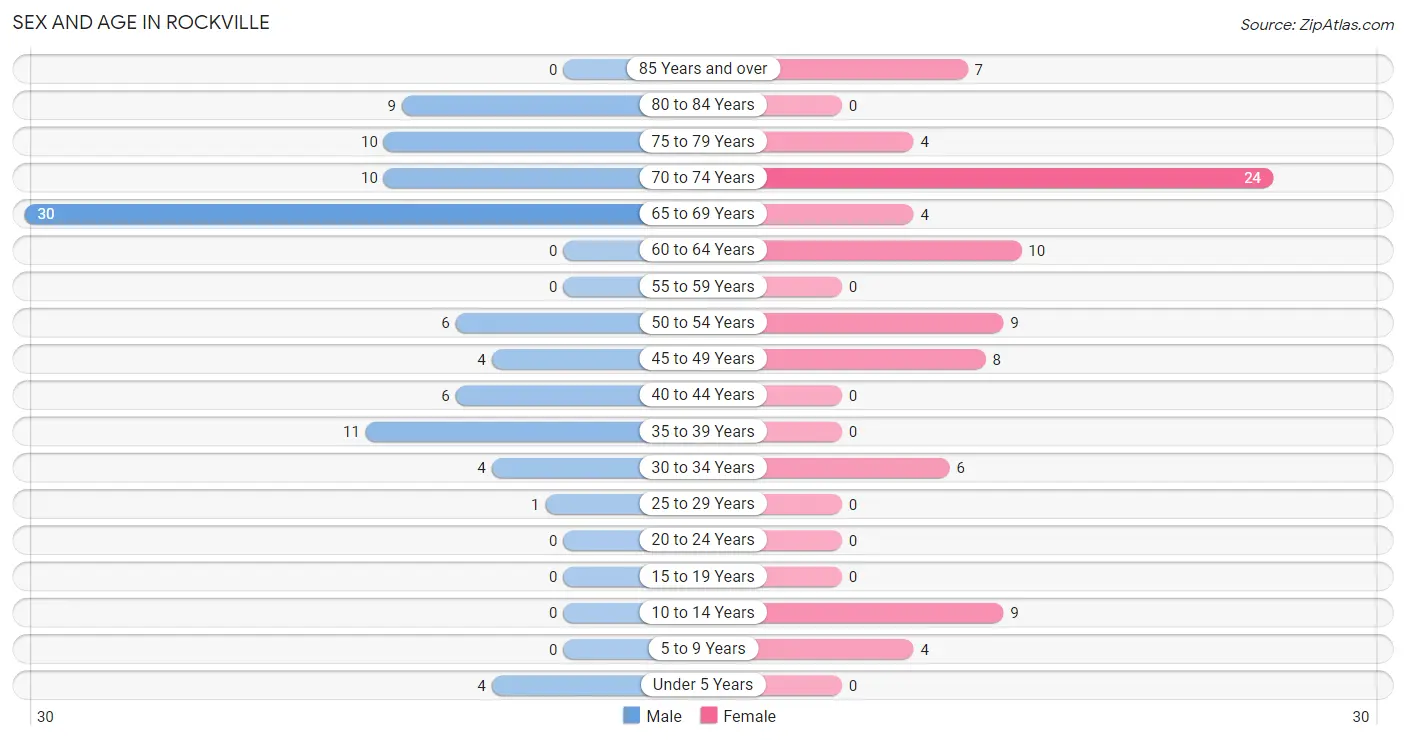
| Age Bracket | Male | Female |
| Under 5 Years | 4 (4.2%) | 0 (0.0%) |
| 5 to 9 Years | 0 (0.0%) | 4 (4.7%) |
| 10 to 14 Years | 0 (0.0%) | 9 (10.6%) |
| 15 to 19 Years | 0 (0.0%) | 0 (0.0%) |
| 20 to 24 Years | 0 (0.0%) | 0 (0.0%) |
| 25 to 29 Years | 1 (1.1%) | 0 (0.0%) |
| 30 to 34 Years | 4 (4.2%) | 6 (7.1%) |
| 35 to 39 Years | 11 (11.6%) | 0 (0.0%) |
| 40 to 44 Years | 6 (6.3%) | 0 (0.0%) |
| 45 to 49 Years | 4 (4.2%) | 8 (9.4%) |
| 50 to 54 Years | 6 (6.3%) | 9 (10.6%) |
| 55 to 59 Years | 0 (0.0%) | 0 (0.0%) |
| 60 to 64 Years | 0 (0.0%) | 10 (11.8%) |
| 65 to 69 Years | 30 (31.6%) | 4 (4.7%) |
| 70 to 74 Years | 10 (10.5%) | 24 (28.2%) |
| 75 to 79 Years | 10 (10.5%) | 4 (4.7%) |
| 80 to 84 Years | 9 (9.5%) | 0 (0.0%) |
| 85 Years and over | 0 (0.0%) | 7 (8.2%) |
| Total | 95 (100.0%) | 85 (100.0%) |
Families and Households in Rockville
Median Family Size in Rockville
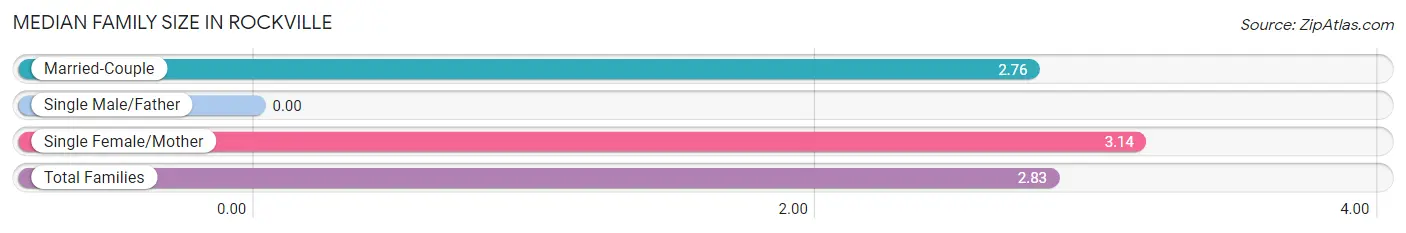
| Family Type | # Families | Family Size |
| Married-Couple | 29 (80.6%) | 2.76 |
| Single Male/Father | 0 (0.0%) | - |
| Single Female/Mother | 7 (19.4%) | 3.14 |
| Total Families | 36 (100.0%) | 2.83 |
Median Household Size in Rockville
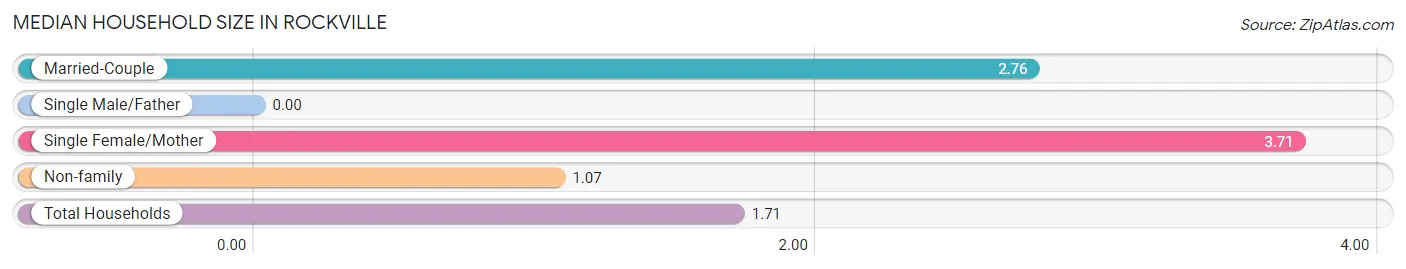
| Household Type | # Households | Household Size |
| Married-Couple | 29 (27.6%) | 2.76 |
| Single Male/Father | 0 (0.0%) | - |
| Single Female/Mother | 7 (6.7%) | 3.71 |
| Non-family | 69 (65.7%) | 1.07 |
| Total Households | 105 (100.0%) | 1.71 |
Household Size by Marriage Status in Rockville
Out of a total of 105 households in Rockville, 36 (34.3%) are family households, while 69 (65.7%) are nonfamily households. The most numerous type of family households are 2-person households, comprising 22, and the most common type of nonfamily households are 1-person households, comprising 62.
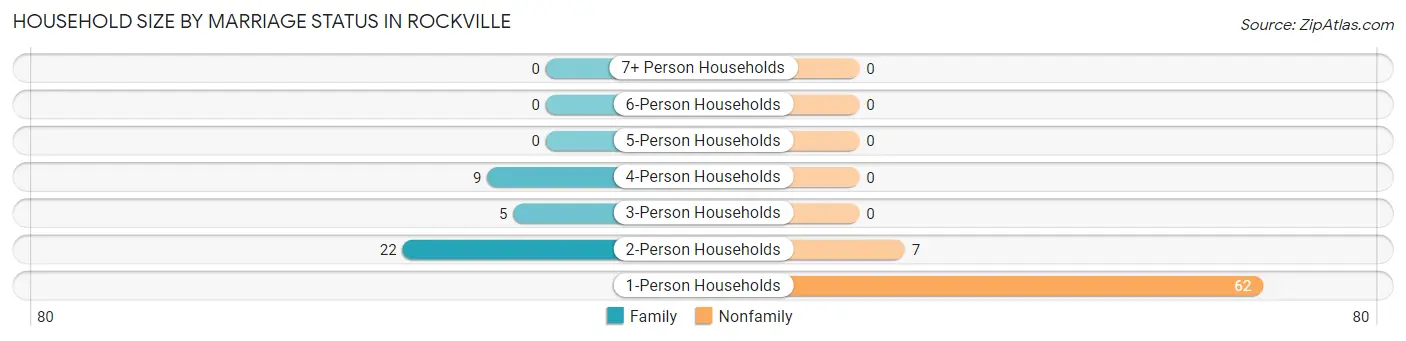
| Household Size | Family Households | Nonfamily Households |
| 1-Person Households | - | 62 (59.1%) |
| 2-Person Households | 22 (20.9%) | 7 (6.7%) |
| 3-Person Households | 5 (4.8%) | 0 (0.0%) |
| 4-Person Households | 9 (8.6%) | 0 (0.0%) |
| 5-Person Households | 0 (0.0%) | 0 (0.0%) |
| 6-Person Households | 0 (0.0%) | 0 (0.0%) |
| 7+ Person Households | 0 (0.0%) | 0 (0.0%) |
| Total | 36 (34.3%) | 69 (65.7%) |
Female Fertility in Rockville
Fertility by Age in Rockville
Average fertility rate in Rockville is 286.0 births per 1,000 women. Women in the age bracket of 20 to 34 years have the highest fertility rate with 667.0 births per 1,000 women. Women in the age bracket of 20 to 34 years acount for 100.0% of all women with births.
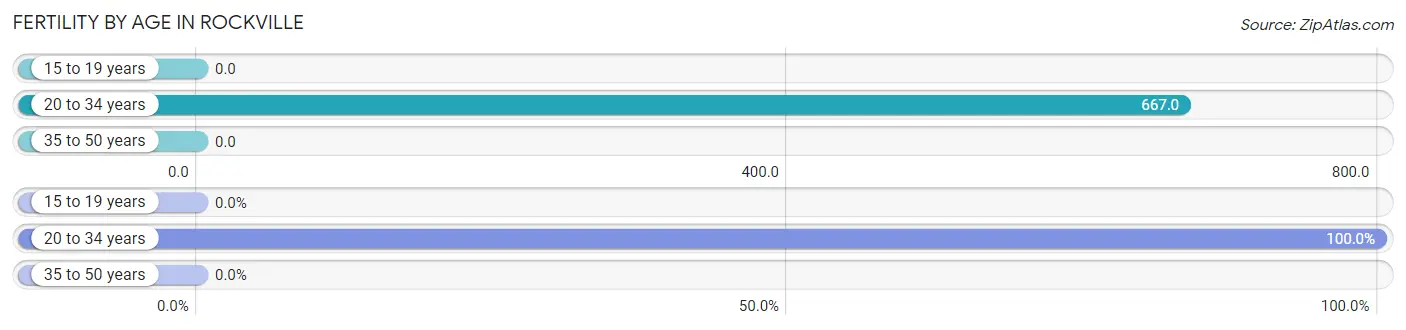
| Age Bracket | Women with Births | Births / 1,000 Women |
| 15 to 19 years | 0 (0.0%) | 0.0 |
| 20 to 34 years | 4 (100.0%) | 667.0 |
| 35 to 50 years | 0 (0.0%) | 0.0 |
| Total | 4 (100.0%) | 286.0 |
Fertility by Age by Marriage Status in Rockville
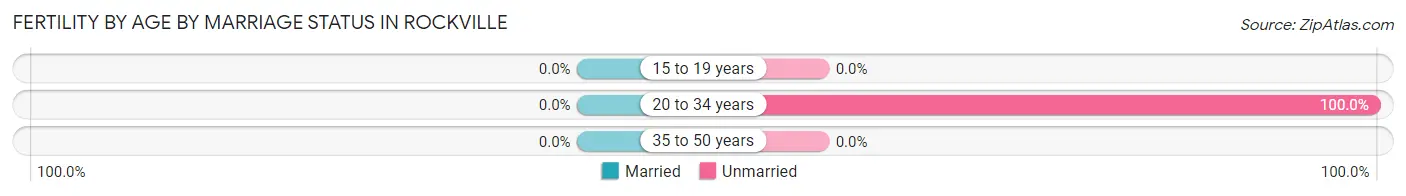
| Age Bracket | Married | Unmarried |
| 15 to 19 years | 0 (0.0%) | 0 (0.0%) |
| 20 to 34 years | 0 (0.0%) | 4 (100.0%) |
| 35 to 50 years | 0 (0.0%) | 0 (0.0%) |
| Total | 0 (0.0%) | 4 (100.0%) |
Fertility by Education in Rockville
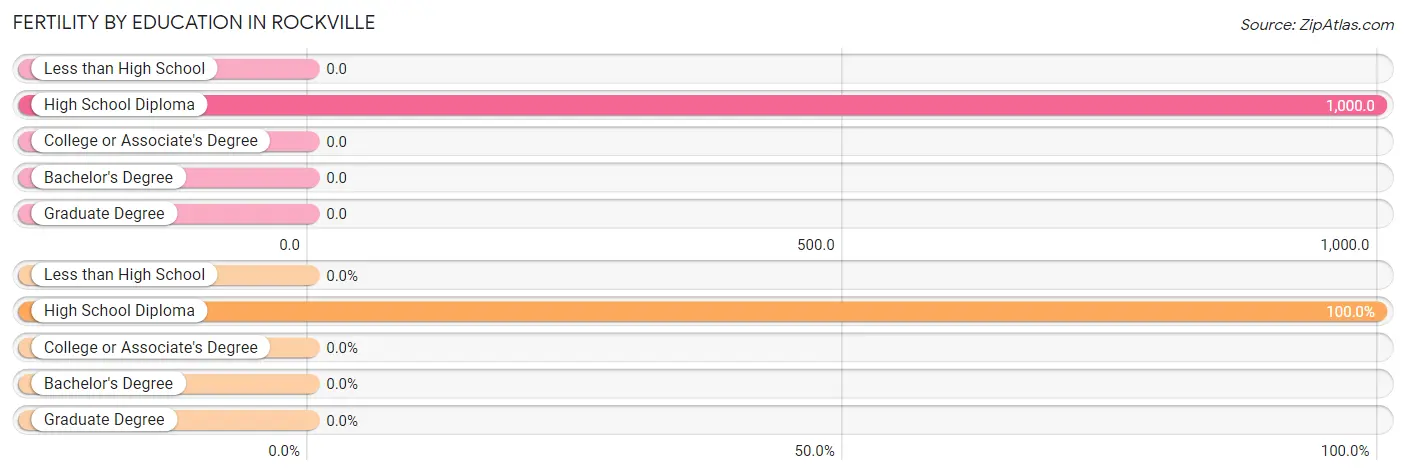
| Educational Attainment | Women with Births | Births / 1,000 Women |
| Less than High School | 0 (0.0%) | 0.0 |
| High School Diploma | 4 (100.0%) | 1,000.0 |
| College or Associate's Degree | 0 (0.0%) | 0.0 |
| Bachelor's Degree | 0 (0.0%) | 0.0 |
| Graduate Degree | 0 (0.0%) | 0.0 |
| Total | 4 (100.0%) | 286.0 |
Fertility by Education by Marriage Status in Rockville
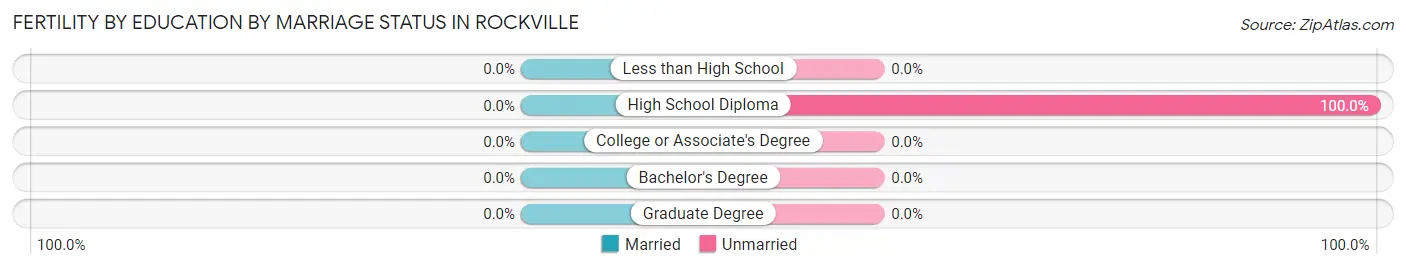
| Educational Attainment | Married | Unmarried |
| Less than High School | 0 (0.0%) | 0 (0.0%) |
| High School Diploma | 0 (0.0%) | 4 (100.0%) |
| College or Associate's Degree | 0 (0.0%) | 0 (0.0%) |
| Bachelor's Degree | 0 (0.0%) | 0 (0.0%) |
| Graduate Degree | 0 (0.0%) | 0 (0.0%) |
| Total | 0 (0.0%) | 4 (100.0%) |
Income in Rockville
Income Overview in Rockville
Per Capita Income in Rockville is $36,360, while median incomes of families and households are $87,000 and $48,438 respectively.
| Characteristic | Number | Measure |
| Per Capita Income | 180 | $36,360 |
| Median Family Income | 36 | $87,000 |
| Mean Family Income | 36 | $87,750 |
| Median Household Income | 105 | $48,438 |
| Mean Household Income | 105 | $57,248 |
| Income Deficit | 36 | $0 |
| Wage / Income Gap (%) | 180 | 63.48% |
| Wage / Income Gap ($) | 180 | 36.52¢ per $1 |
| Gini / Inequality Index | 180 | 0.37 |
Earnings by Sex in Rockville
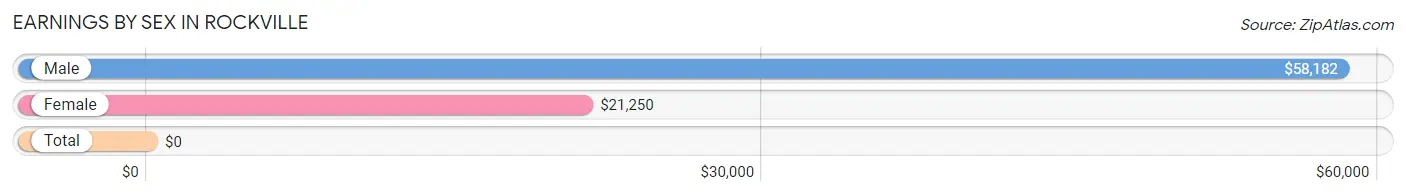
| Sex | Number | Average Earnings |
| Male | 48 (65.7%) | $58,182 |
| Female | 25 (34.3%) | $21,250 |
| Total | 73 (100.0%) | $0 |
Earnings by Sex by Income Bracket in Rockville
The most common earnings brackets in Rockville are $55,000 to $64,999 for men (11 | 22.9%) and $2,499 or less for women (5 | 20.0%).
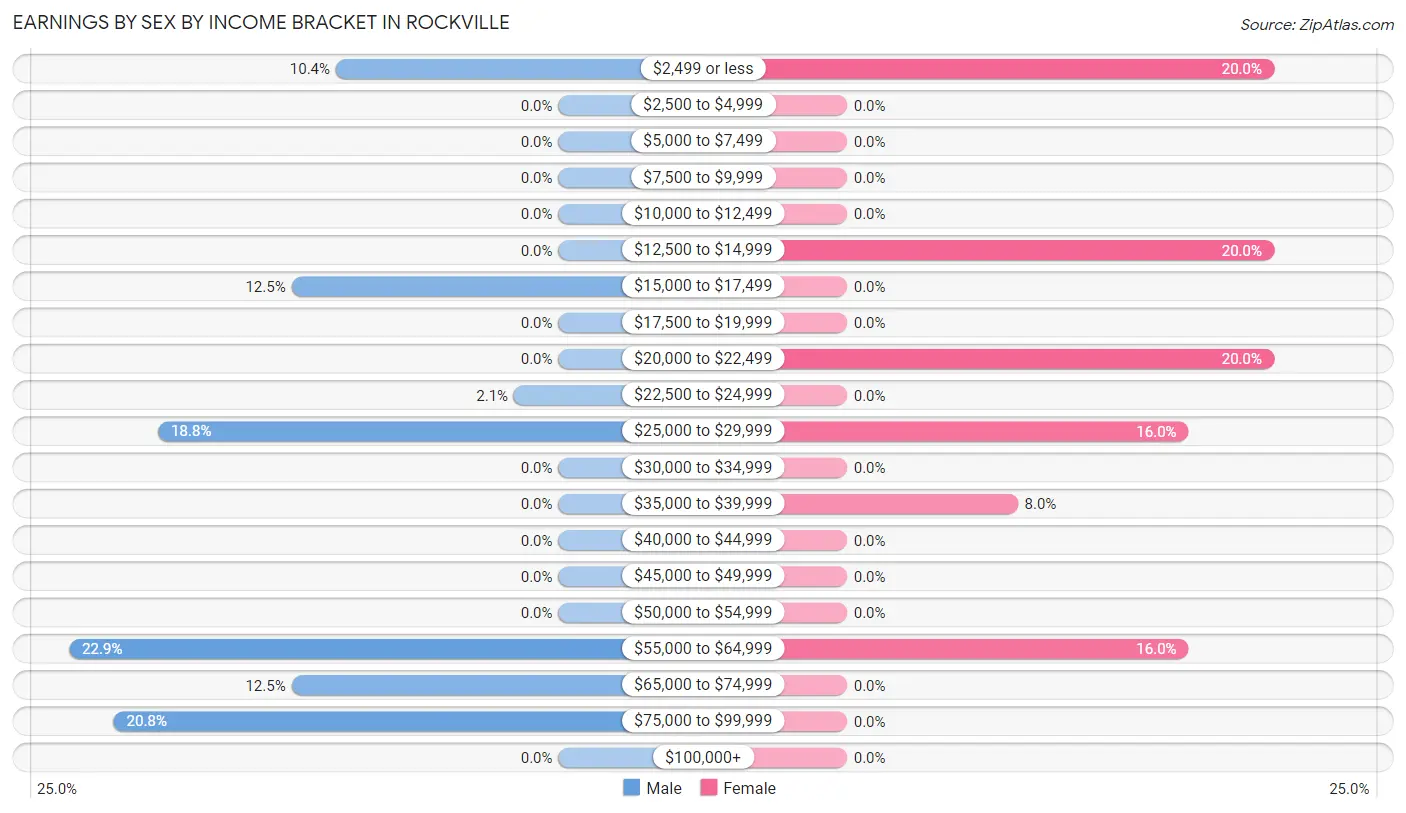
| Income | Male | Female |
| $2,499 or less | 5 (10.4%) | 5 (20.0%) |
| $2,500 to $4,999 | 0 (0.0%) | 0 (0.0%) |
| $5,000 to $7,499 | 0 (0.0%) | 0 (0.0%) |
| $7,500 to $9,999 | 0 (0.0%) | 0 (0.0%) |
| $10,000 to $12,499 | 0 (0.0%) | 0 (0.0%) |
| $12,500 to $14,999 | 0 (0.0%) | 5 (20.0%) |
| $15,000 to $17,499 | 6 (12.5%) | 0 (0.0%) |
| $17,500 to $19,999 | 0 (0.0%) | 0 (0.0%) |
| $20,000 to $22,499 | 0 (0.0%) | 5 (20.0%) |
| $22,500 to $24,999 | 1 (2.1%) | 0 (0.0%) |
| $25,000 to $29,999 | 9 (18.8%) | 4 (16.0%) |
| $30,000 to $34,999 | 0 (0.0%) | 0 (0.0%) |
| $35,000 to $39,999 | 0 (0.0%) | 2 (8.0%) |
| $40,000 to $44,999 | 0 (0.0%) | 0 (0.0%) |
| $45,000 to $49,999 | 0 (0.0%) | 0 (0.0%) |
| $50,000 to $54,999 | 0 (0.0%) | 0 (0.0%) |
| $55,000 to $64,999 | 11 (22.9%) | 4 (16.0%) |
| $65,000 to $74,999 | 6 (12.5%) | 0 (0.0%) |
| $75,000 to $99,999 | 10 (20.8%) | 0 (0.0%) |
| $100,000+ | 0 (0.0%) | 0 (0.0%) |
| Total | 48 (100.0%) | 25 (100.0%) |
Earnings by Sex by Educational Attainment in Rockville
Average earnings in Rockville are $58,182 for men and $21,250 for women, a difference of 63.5%. Men with an educational attainment of bachelor's degree enjoy the highest average annual earnings of $81,875, while those with high school diploma education earn the least with $58,295. Women with an educational attainment of bachelor's degree earn the most with the average annual earnings of $20,500, while those with bachelor's degree education have the smallest earnings of $20,500.
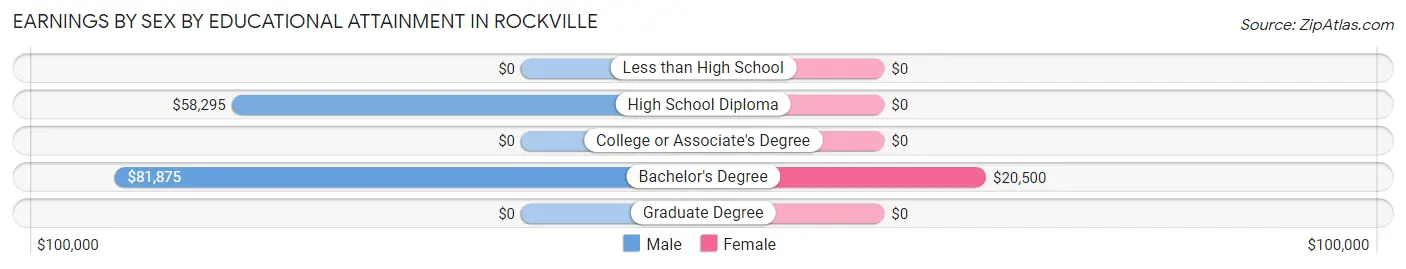
| Educational Attainment | Male Income | Female Income |
| Less than High School | - | - |
| High School Diploma | $58,295 | $0 |
| College or Associate's Degree | - | - |
| Bachelor's Degree | $81,875 | $20,500 |
| Graduate Degree | - | - |
| Total | $58,182 | $21,250 |
Family Income in Rockville
Family Income Brackets in Rockville
According to the Rockville family income data, there are 10 families falling into the $100,000 to $149,999 income range, which is the most common income bracket and makes up 27.8% of all families.
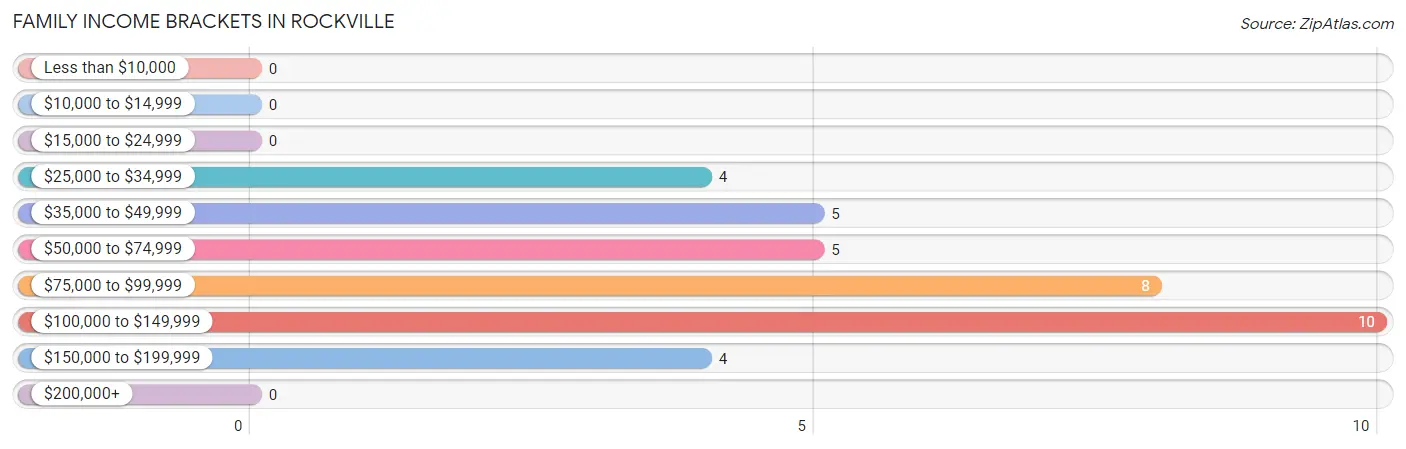
| Income Bracket | # Families | % Families |
| Less than $10,000 | 0 | 0.0% |
| $10,000 to $14,999 | 0 | 0.0% |
| $15,000 to $24,999 | 0 | 0.0% |
| $25,000 to $34,999 | 4 | 11.1% |
| $35,000 to $49,999 | 5 | 13.9% |
| $50,000 to $74,999 | 5 | 13.9% |
| $75,000 to $99,999 | 8 | 22.2% |
| $100,000 to $149,999 | 10 | 27.8% |
| $150,000 to $199,999 | 4 | 11.1% |
| $200,000+ | 0 | 0.0% |
Family Income by Famaliy Size in Rockville
2-person families (22 | 61.1%) account for the highest median family income in Rockville with $85,500 per family, while 2-person families (22 | 61.1%) have the highest median income of $42,750 per family member.
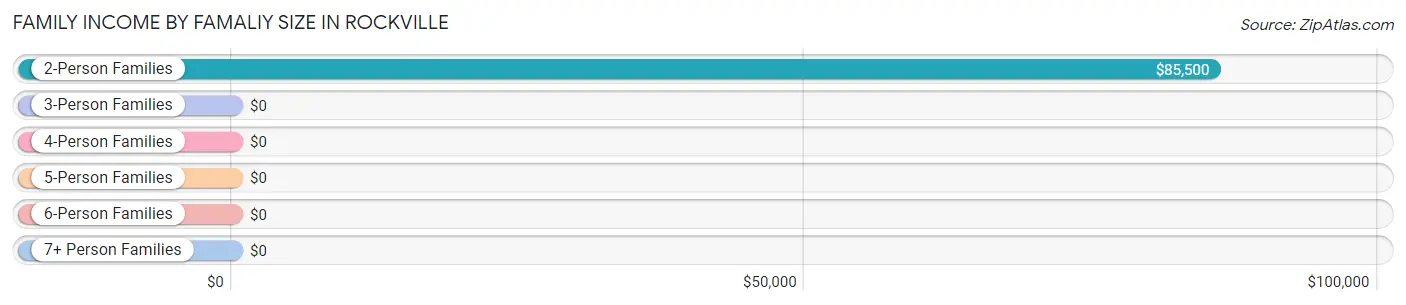
| Income Bracket | # Families | Median Income |
| 2-Person Families | 22 (61.1%) | $85,500 |
| 3-Person Families | 9 (25.0%) | $0 |
| 4-Person Families | 5 (13.9%) | $0 |
| 5-Person Families | 0 (0.0%) | $0 |
| 6-Person Families | 0 (0.0%) | $0 |
| 7+ Person Families | 0 (0.0%) | $0 |
| Total | 36 (100.0%) | $87,000 |
Family Income by Number of Earners in Rockville
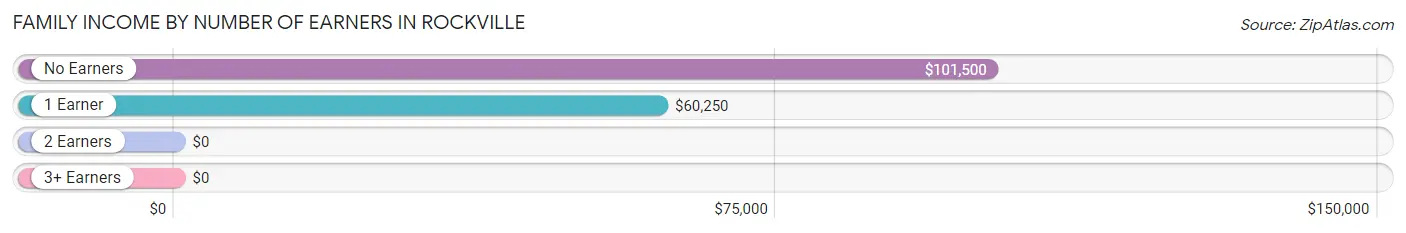
| Number of Earners | # Families | Median Income |
| No Earners | 12 (33.3%) | $101,500 |
| 1 Earner | 19 (52.8%) | $60,250 |
| 2 Earners | 5 (13.9%) | $0 |
| 3+ Earners | 0 (0.0%) | $0 |
| Total | 36 (100.0%) | $87,000 |
Household Income in Rockville
Household Income Brackets in Rockville
With 25 households falling in the category, the $15,000 to $24,999 income range is the most frequent in Rockville, accounting for 23.8% of all households.
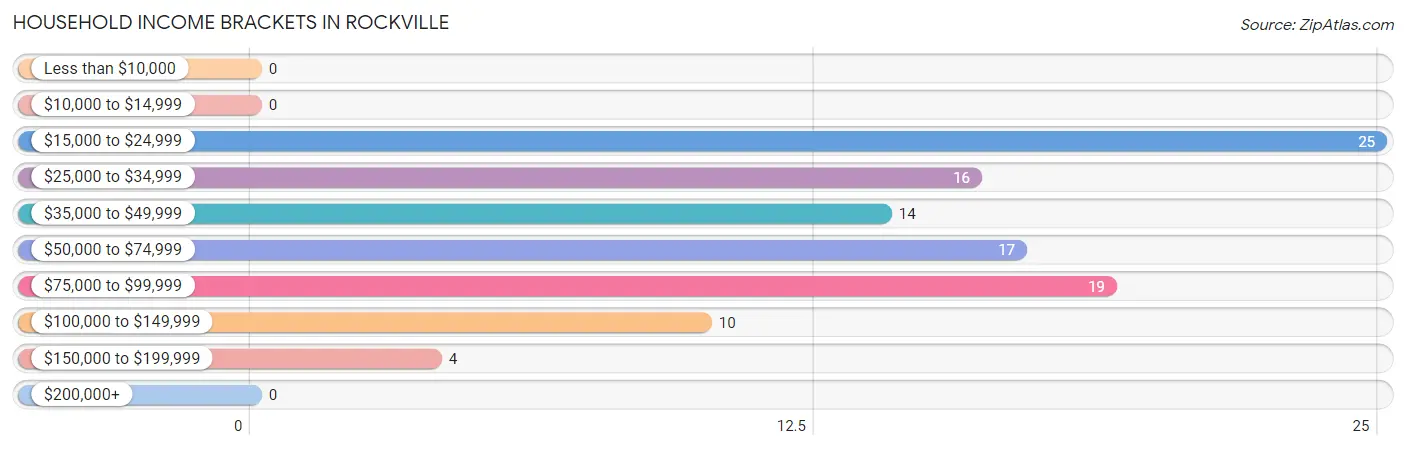
| Income Bracket | # Households | % Households |
| Less than $10,000 | 0 | 0.0% |
| $10,000 to $14,999 | 0 | 0.0% |
| $15,000 to $24,999 | 25 | 23.8% |
| $25,000 to $34,999 | 16 | 15.2% |
| $35,000 to $49,999 | 14 | 13.3% |
| $50,000 to $74,999 | 17 | 16.2% |
| $75,000 to $99,999 | 19 | 18.1% |
| $100,000 to $149,999 | 10 | 9.5% |
| $150,000 to $199,999 | 4 | 3.8% |
| $200,000+ | 0 | 0.0% |
Household Income by Householder Age in Rockville
The median household income in Rockville is $48,438, with the highest median household income of $86,000 found in the 45 to 64 years age bracket for the primary householder. A total of 16 households (15.2%) fall into this category.
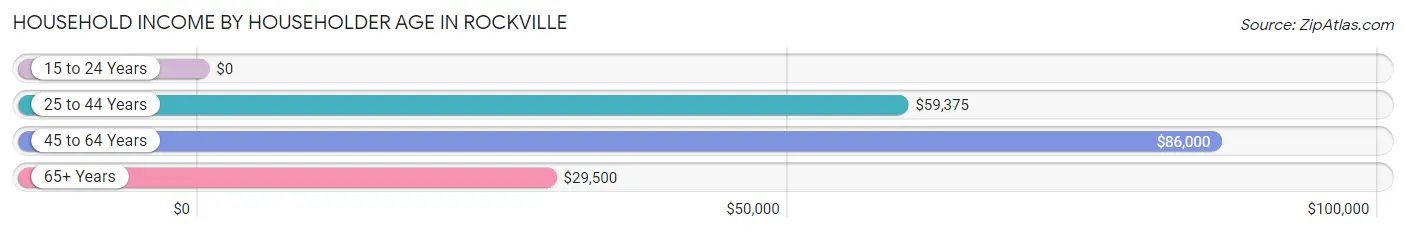
| Income Bracket | # Households | Median Income |
| 15 to 24 Years | 0 (0.0%) | $0 |
| 25 to 44 Years | 23 (21.9%) | $59,375 |
| 45 to 64 Years | 16 (15.2%) | $86,000 |
| 65+ Years | 66 (62.9%) | $29,500 |
| Total | 105 (100.0%) | $48,438 |
Poverty in Rockville
Income Below Poverty by Sex and Age in Rockville
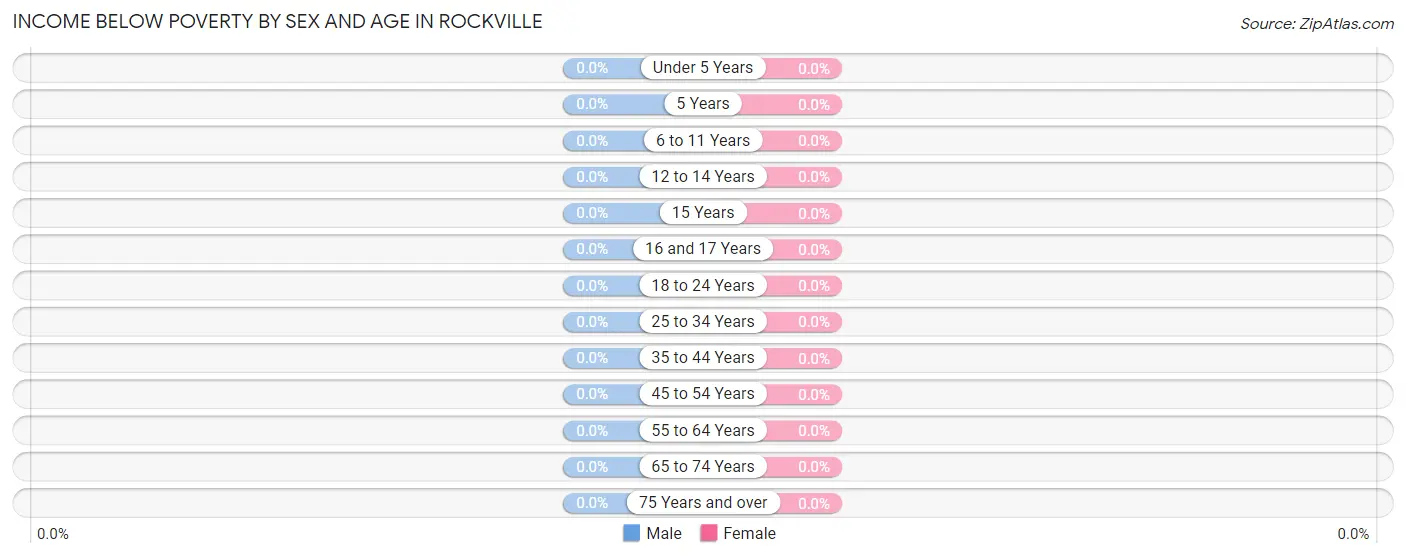
| Age Bracket | Male | Female |
| Under 5 Years | 0 (0.0%) | 0 (0.0%) |
| 5 Years | 0 (0.0%) | 0 (0.0%) |
| 6 to 11 Years | 0 (0.0%) | 0 (0.0%) |
| 12 to 14 Years | 0 (0.0%) | 0 (0.0%) |
| 15 Years | 0 (0.0%) | 0 (0.0%) |
| 16 and 17 Years | 0 (0.0%) | 0 (0.0%) |
| 18 to 24 Years | 0 (0.0%) | 0 (0.0%) |
| 25 to 34 Years | 0 (0.0%) | 0 (0.0%) |
| 35 to 44 Years | 0 (0.0%) | 0 (0.0%) |
| 45 to 54 Years | 0 (0.0%) | 0 (0.0%) |
| 55 to 64 Years | 0 (0.0%) | 0 (0.0%) |
| 65 to 74 Years | 0 (0.0%) | 0 (0.0%) |
| 75 Years and over | 0 (0.0%) | 0 (0.0%) |
| Total | 0 (0.0%) | 0 (0.0%) |
Income Above Poverty by Sex and Age in Rockville
According to the poverty statistics in Rockville, males aged under 5 years and females aged 5 years are the age groups that are most secure financially, with 100.0% of males and 100.0% of females in these age groups living above the poverty line.
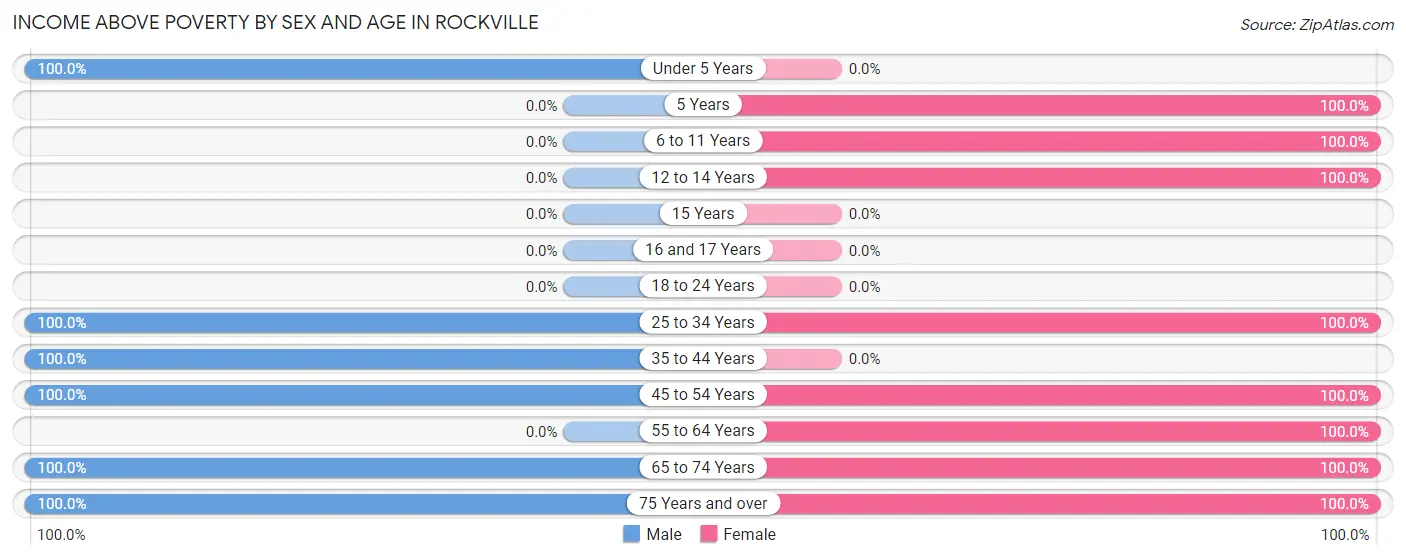
| Age Bracket | Male | Female |
| Under 5 Years | 4 (100.0%) | 0 (0.0%) |
| 5 Years | 0 (0.0%) | 4 (100.0%) |
| 6 to 11 Years | 0 (0.0%) | 5 (100.0%) |
| 12 to 14 Years | 0 (0.0%) | 4 (100.0%) |
| 15 Years | 0 (0.0%) | 0 (0.0%) |
| 16 and 17 Years | 0 (0.0%) | 0 (0.0%) |
| 18 to 24 Years | 0 (0.0%) | 0 (0.0%) |
| 25 to 34 Years | 5 (100.0%) | 6 (100.0%) |
| 35 to 44 Years | 17 (100.0%) | 0 (0.0%) |
| 45 to 54 Years | 10 (100.0%) | 17 (100.0%) |
| 55 to 64 Years | 0 (0.0%) | 10 (100.0%) |
| 65 to 74 Years | 40 (100.0%) | 28 (100.0%) |
| 75 Years and over | 19 (100.0%) | 11 (100.0%) |
| Total | 95 (100.0%) | 85 (100.0%) |
Income Below Poverty Among Married-Couple Families in Rockville
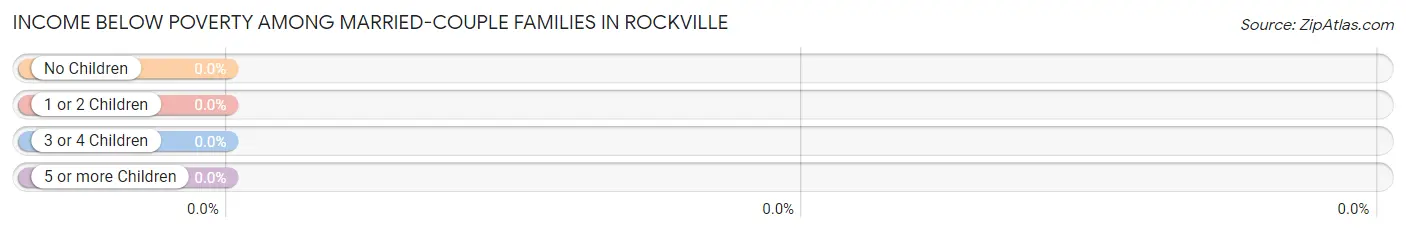
| Children | Above Poverty | Below Poverty |
| No Children | 24 (100.0%) | 0 (0.0%) |
| 1 or 2 Children | 5 (100.0%) | 0 (0.0%) |
| 3 or 4 Children | 0 (0.0%) | 0 (0.0%) |
| 5 or more Children | 0 (0.0%) | 0 (0.0%) |
| Total | 29 (100.0%) | 0 (0.0%) |
Income Below Poverty Among Single-Parent Households in Rockville
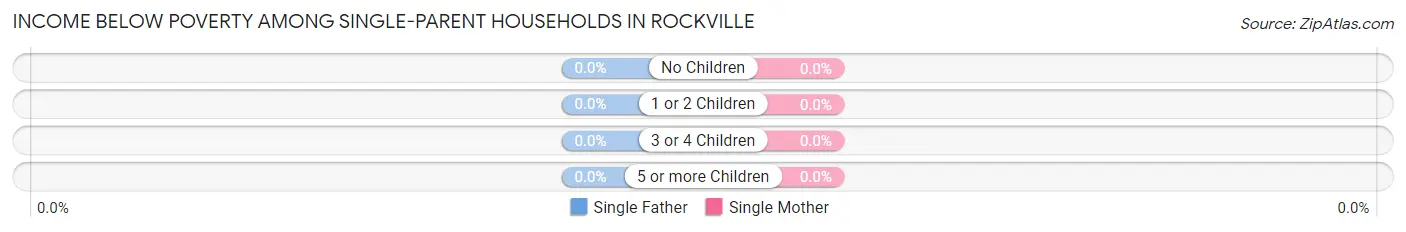
| Children | Single Father | Single Mother |
| No Children | 0 (0.0%) | 0 (0.0%) |
| 1 or 2 Children | 0 (0.0%) | 0 (0.0%) |
| 3 or 4 Children | 0 (0.0%) | 0 (0.0%) |
| 5 or more Children | 0 (0.0%) | 0 (0.0%) |
| Total | 0 (0.0%) | 0 (0.0%) |
Income Below Poverty Among Married-Couple vs Single-Parent Households in Rockville
| Children | Married-Couple Families | Single-Parent Households |
| No Children | 0 (0.0%) | 0 (0.0%) |
| 1 or 2 Children | 0 (0.0%) | 0 (0.0%) |
| 3 or 4 Children | 0 (0.0%) | 0 (0.0%) |
| 5 or more Children | 0 (0.0%) | 0 (0.0%) |
| Total | 0 (0.0%) | 0 (0.0%) |
Employment Characteristics in Rockville
Employment by Class of Employer in Rockville
Among the 64 employed individuals in Rockville, private company employees (27 | 42.2%), self-employed (not incorporated) (23 | 35.9%), and federal government employees (9 | 14.1%) make up the most common classes of employment.
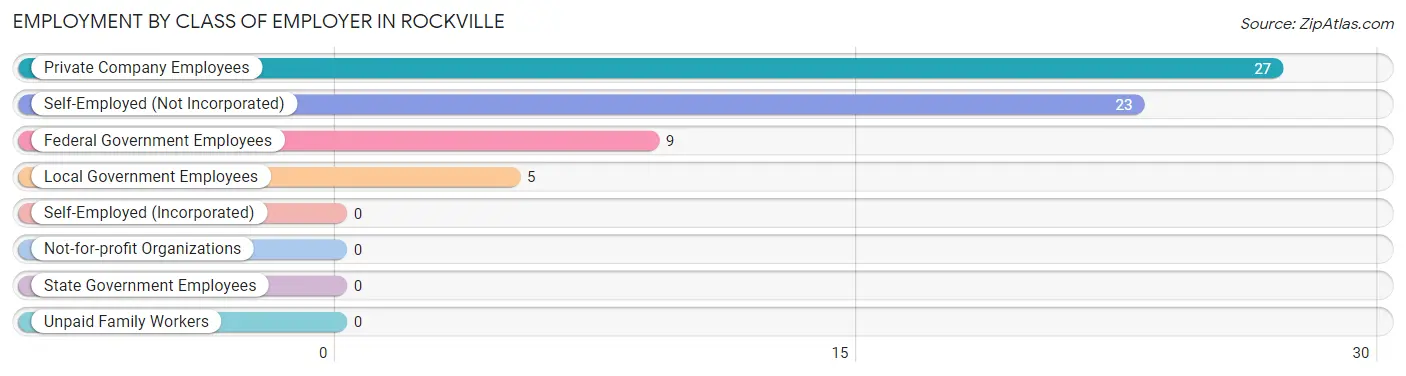
| Employer Class | # Employees | % Employees |
| Private Company Employees | 27 | 42.2% |
| Self-Employed (Incorporated) | 0 | 0.0% |
| Self-Employed (Not Incorporated) | 23 | 35.9% |
| Not-for-profit Organizations | 0 | 0.0% |
| Local Government Employees | 5 | 7.8% |
| State Government Employees | 0 | 0.0% |
| Federal Government Employees | 9 | 14.1% |
| Unpaid Family Workers | 0 | 0.0% |
| Total | 64 | 100.0% |
Employment Status by Age in Rockville
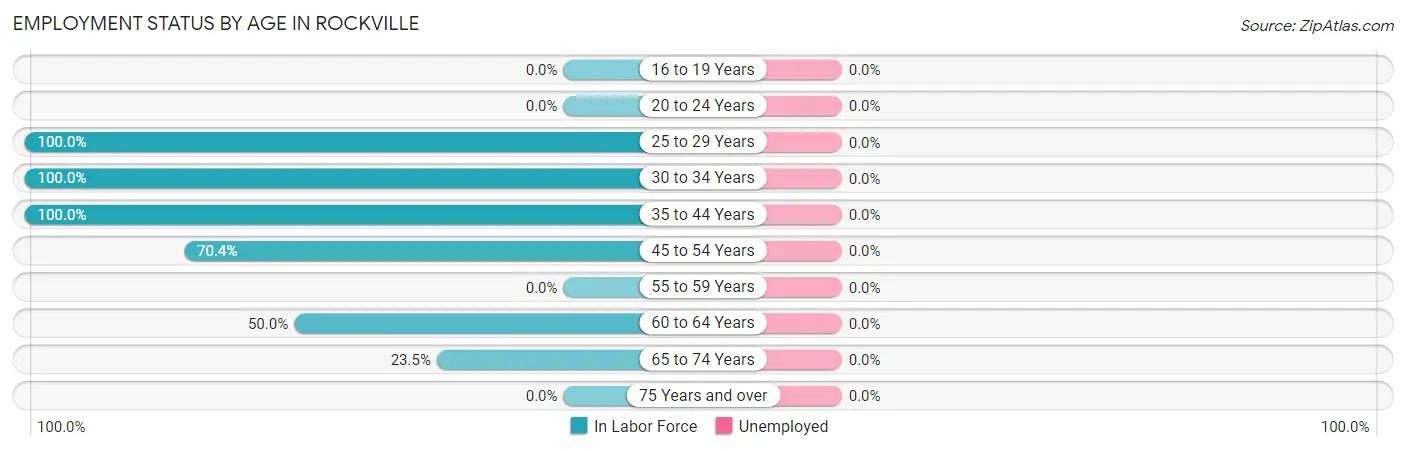
| Age Bracket | In Labor Force | Unemployed |
| 16 to 19 Years | 0 (0.0%) | 0 (0.0%) |
| 20 to 24 Years | 0 (0.0%) | 0 (0.0%) |
| 25 to 29 Years | 1 (100.0%) | 0 (0.0%) |
| 30 to 34 Years | 10 (100.0%) | 0 (0.0%) |
| 35 to 44 Years | 17 (100.0%) | 0 (0.0%) |
| 45 to 54 Years | 19 (70.4%) | 0 (0.0%) |
| 55 to 59 Years | 0 (0.0%) | 0 (0.0%) |
| 60 to 64 Years | 5 (50.0%) | 0 (0.0%) |
| 65 to 74 Years | 16 (23.5%) | 0 (0.0%) |
| 75 Years and over | 0 (0.0%) | 0 (0.0%) |
| Total | 68 (41.7%) | 0 (0.0%) |
Employment Status by Educational Attainment in Rockville
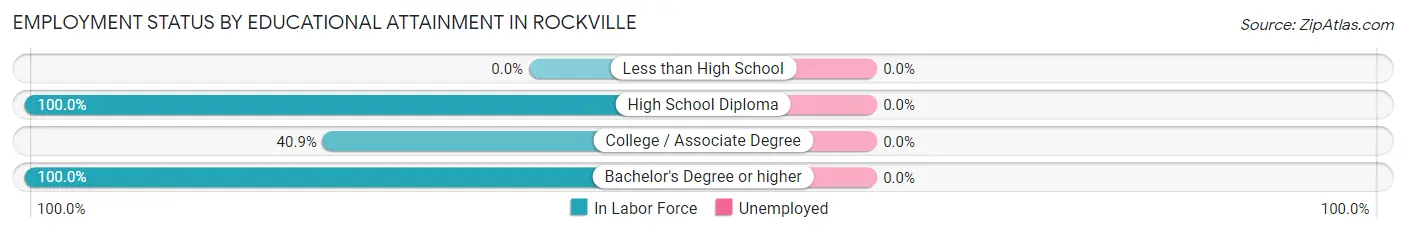
| Educational Attainment | In Labor Force | Unemployed |
| Less than High School | 0 (0.0%) | 0 (0.0%) |
| High School Diploma | 20 (100.0%) | 0 (0.0%) |
| College / Associate Degree | 9 (40.9%) | 0 (0.0%) |
| Bachelor's Degree or higher | 23 (100.0%) | 0 (0.0%) |
| Total | 52 (80.0%) | 0 (0.0%) |
Employment Occupations by Sex in Rockville
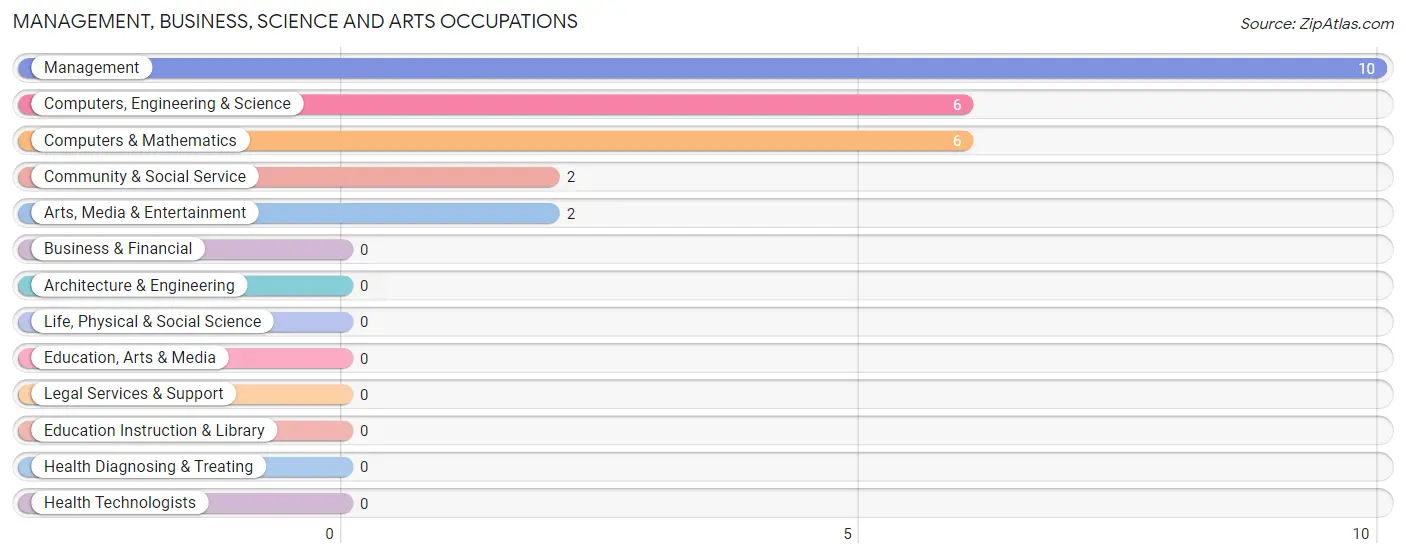
Management, Business, Science and Arts Occupations
The most common Management, Business, Science and Arts occupations in Rockville are Management (10 | 14.7%), Computers, Engineering & Science (6 | 8.8%), Computers & Mathematics (6 | 8.8%), Community & Social Service (2 | 2.9%), and Arts, Media & Entertainment (2 | 2.9%).
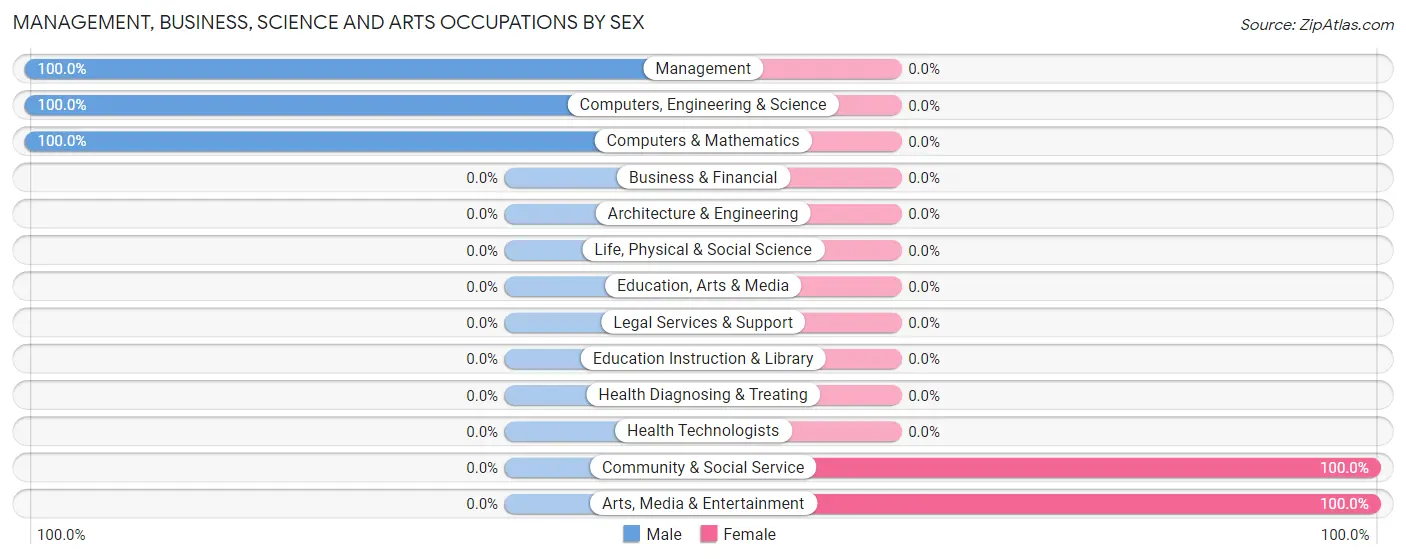
Management, Business, Science and Arts Occupations by Sex
Within the Management, Business, Science and Arts occupations in Rockville, the most male-oriented occupations are Management (100.0%), Computers, Engineering & Science (100.0%), and Computers & Mathematics (100.0%), while the most female-oriented occupations are Community & Social Service (100.0%), and Arts, Media & Entertainment (100.0%).
| Occupation | Male | Female |
| Management | 10 (100.0%) | 0 (0.0%) |
| Business & Financial | 0 (0.0%) | 0 (0.0%) |
| Computers, Engineering & Science | 6 (100.0%) | 0 (0.0%) |
| Computers & Mathematics | 6 (100.0%) | 0 (0.0%) |
| Architecture & Engineering | 0 (0.0%) | 0 (0.0%) |
| Life, Physical & Social Science | 0 (0.0%) | 0 (0.0%) |
| Community & Social Service | 0 (0.0%) | 2 (100.0%) |
| Education, Arts & Media | 0 (0.0%) | 0 (0.0%) |
| Legal Services & Support | 0 (0.0%) | 0 (0.0%) |
| Education Instruction & Library | 0 (0.0%) | 0 (0.0%) |
| Arts, Media & Entertainment | 0 (0.0%) | 2 (100.0%) |
| Health Diagnosing & Treating | 0 (0.0%) | 0 (0.0%) |
| Health Technologists | 0 (0.0%) | 0 (0.0%) |
| Total (Category) | 16 (88.9%) | 2 (11.1%) |
| Total (Overall) | 43 (63.2%) | 25 (36.8%) |
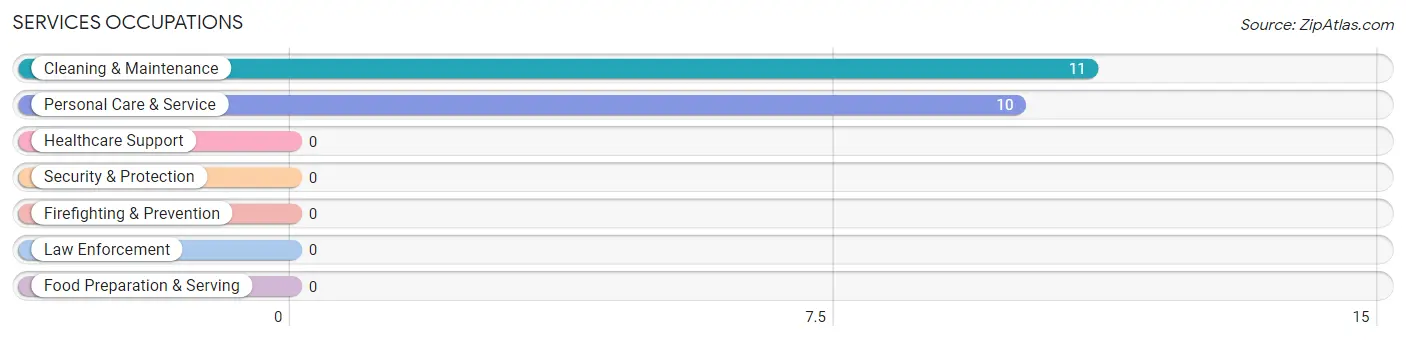
Services Occupations
The most common Services occupations in Rockville are Cleaning & Maintenance (11 | 16.2%), and Personal Care & Service (10 | 14.7%).
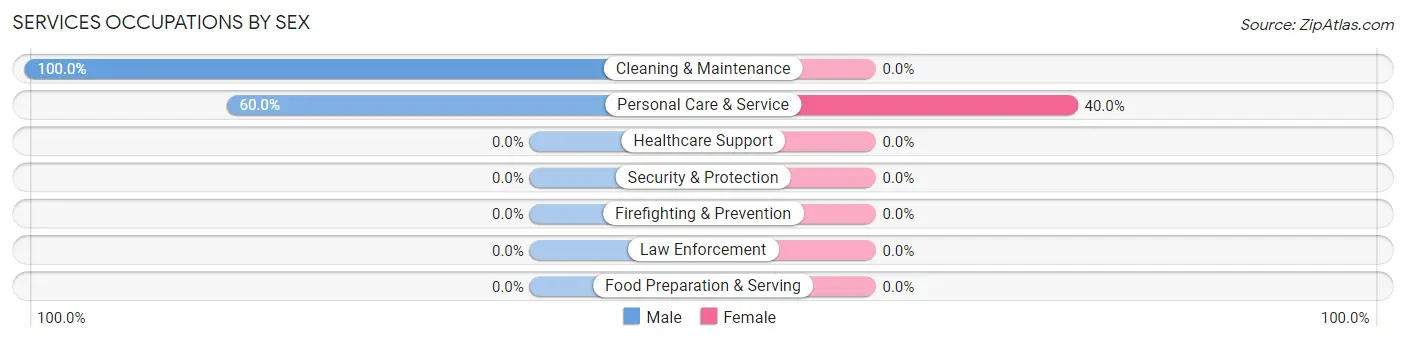
Services Occupations by Sex
| Occupation | Male | Female |
| Healthcare Support | 0 (0.0%) | 0 (0.0%) |
| Security & Protection | 0 (0.0%) | 0 (0.0%) |
| Firefighting & Prevention | 0 (0.0%) | 0 (0.0%) |
| Law Enforcement | 0 (0.0%) | 0 (0.0%) |
| Food Preparation & Serving | 0 (0.0%) | 0 (0.0%) |
| Cleaning & Maintenance | 11 (100.0%) | 0 (0.0%) |
| Personal Care & Service | 6 (60.0%) | 4 (40.0%) |
| Total (Category) | 17 (80.9%) | 4 (19.1%) |
| Total (Overall) | 43 (63.2%) | 25 (36.8%) |
Sales and Office Occupations
The most common Sales and Office occupations in Rockville are Office & Administration (14 | 20.6%), and Sales & Related (5 | 7.3%).

Sales and Office Occupations by Sex
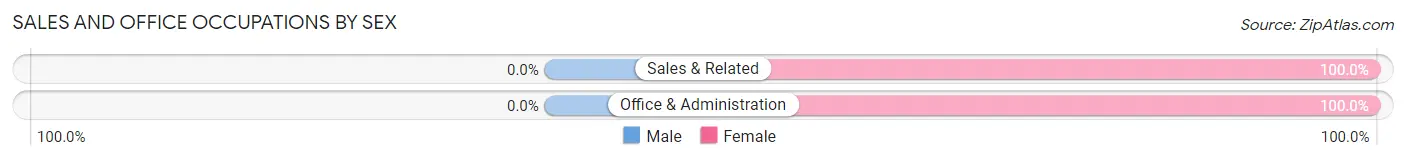
| Occupation | Male | Female |
| Sales & Related | 0 (0.0%) | 5 (100.0%) |
| Office & Administration | 0 (0.0%) | 14 (100.0%) |
| Total (Category) | 0 (0.0%) | 19 (100.0%) |
| Total (Overall) | 43 (63.2%) | 25 (36.8%) |
Natural Resources, Construction and Maintenance Occupations
The most common Natural Resources, Construction and Maintenance occupations in Rockville are , and Construction & Extraction (10 | 14.7%).
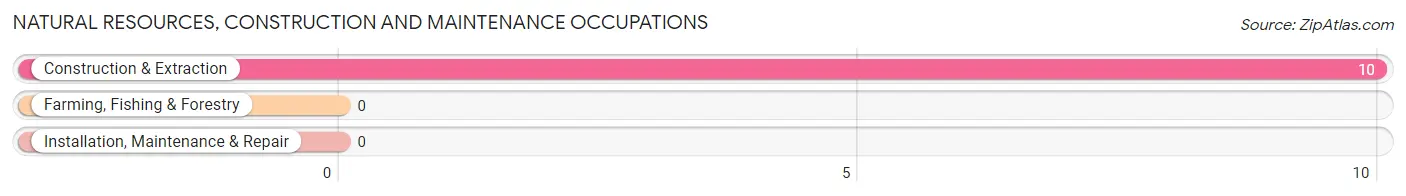
Natural Resources, Construction and Maintenance Occupations by Sex

| Occupation | Male | Female |
| Farming, Fishing & Forestry | 0 (0.0%) | 0 (0.0%) |
| Construction & Extraction | 10 (100.0%) | 0 (0.0%) |
| Installation, Maintenance & Repair | 0 (0.0%) | 0 (0.0%) |
| Total (Category) | 10 (100.0%) | 0 (0.0%) |
| Total (Overall) | 43 (63.2%) | 25 (36.8%) |
Production, Transportation and Moving Occupations
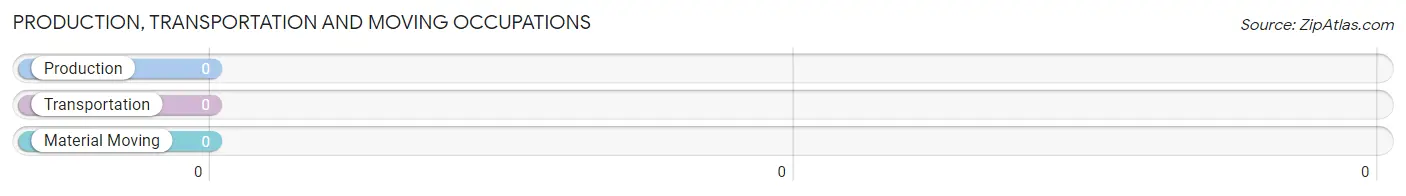
Production, Transportation and Moving Occupations by Sex
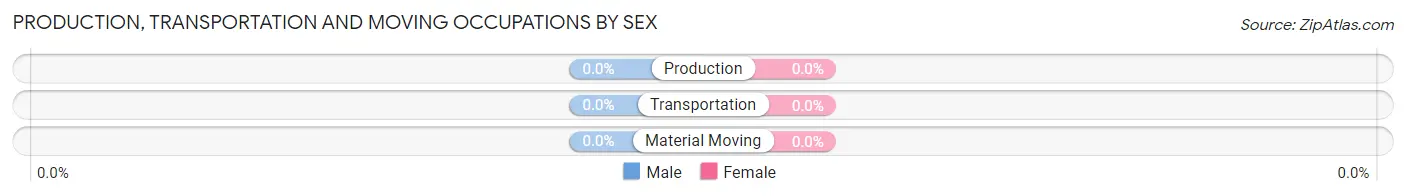
| Occupation | Male | Female |
| Production | 0 (0.0%) | 0 (0.0%) |
| Transportation | 0 (0.0%) | 0 (0.0%) |
| Material Moving | 0 (0.0%) | 0 (0.0%) |
| Total (Category) | 0 (0.0%) | 0 (0.0%) |
| Total (Overall) | 43 (63.2%) | 25 (36.8%) |
Employment Industries by Sex in Rockville
Employment Industries in Rockville
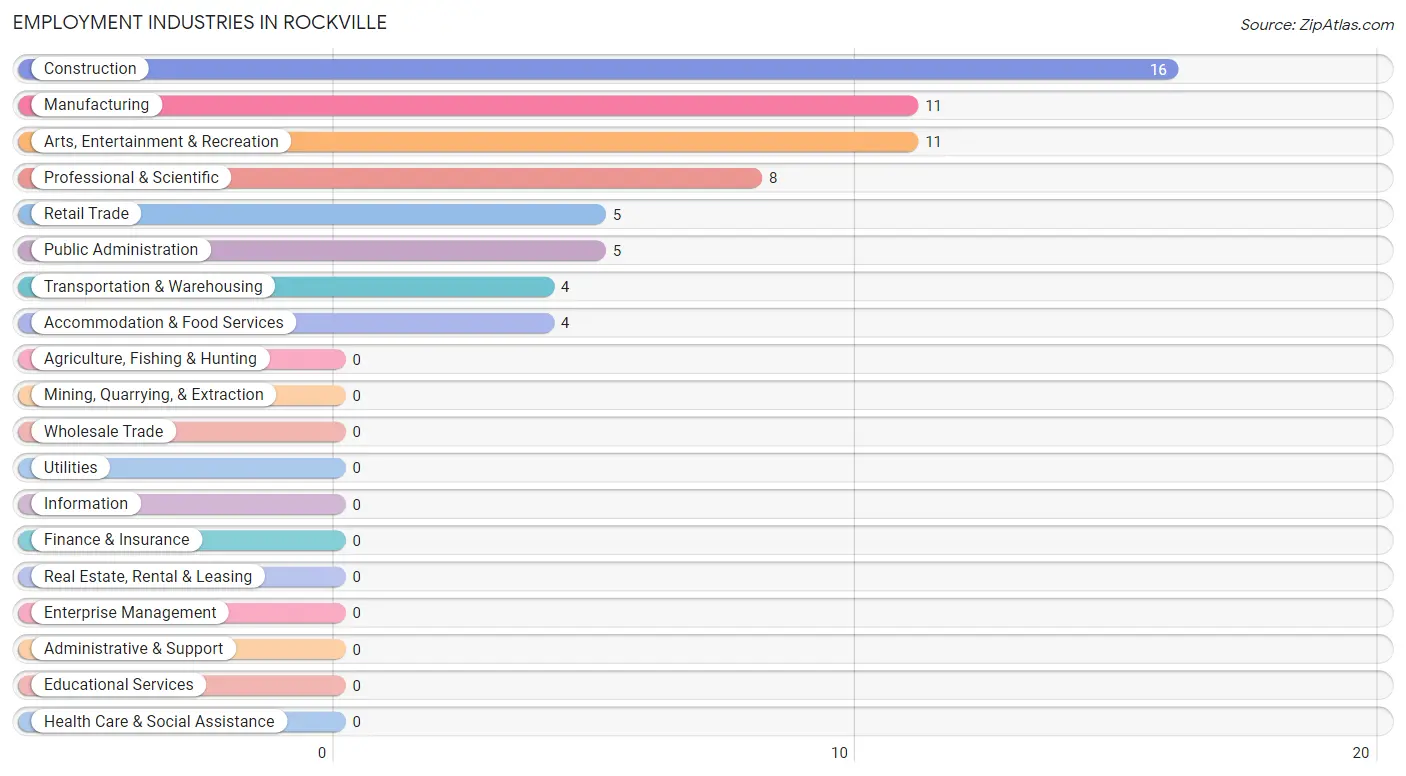
The major employment industries in Rockville include Construction (16 | 23.5%), Manufacturing (11 | 16.2%), Arts, Entertainment & Recreation (11 | 16.2%), Professional & Scientific (8 | 11.8%), and Retail Trade (5 | 7.3%).
Employment Industries by Sex in Rockville
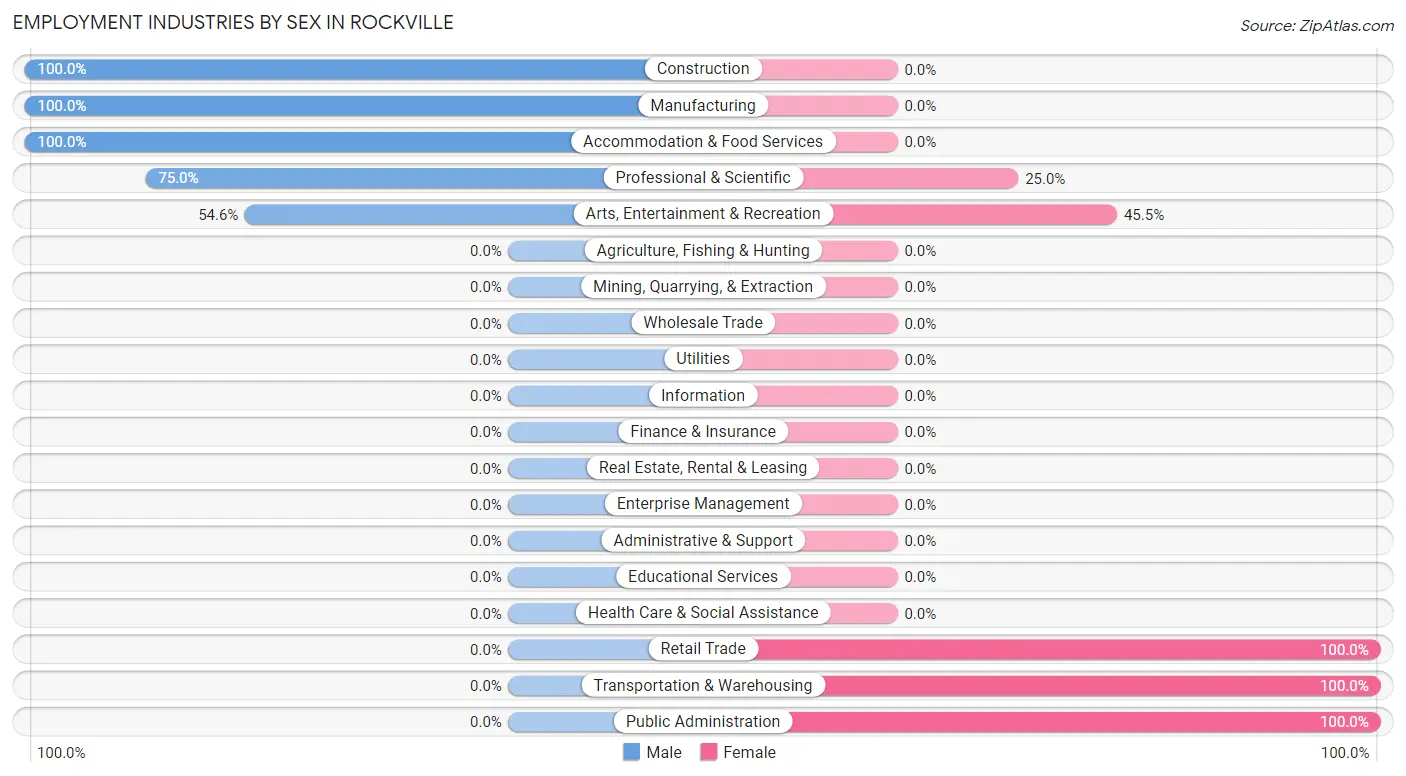
The Rockville industries that see more men than women are Construction (100.0%), Manufacturing (100.0%), and Accommodation & Food Services (100.0%), whereas the industries that tend to have a higher number of women are Retail Trade (100.0%), Transportation & Warehousing (100.0%), and Public Administration (100.0%).
| Industry | Male | Female |
| Agriculture, Fishing & Hunting | 0 (0.0%) | 0 (0.0%) |
| Mining, Quarrying, & Extraction | 0 (0.0%) | 0 (0.0%) |
| Construction | 16 (100.0%) | 0 (0.0%) |
| Manufacturing | 11 (100.0%) | 0 (0.0%) |
| Wholesale Trade | 0 (0.0%) | 0 (0.0%) |
| Retail Trade | 0 (0.0%) | 5 (100.0%) |
| Transportation & Warehousing | 0 (0.0%) | 4 (100.0%) |
| Utilities | 0 (0.0%) | 0 (0.0%) |
| Information | 0 (0.0%) | 0 (0.0%) |
| Finance & Insurance | 0 (0.0%) | 0 (0.0%) |
| Real Estate, Rental & Leasing | 0 (0.0%) | 0 (0.0%) |
| Professional & Scientific | 6 (75.0%) | 2 (25.0%) |
| Enterprise Management | 0 (0.0%) | 0 (0.0%) |
| Administrative & Support | 0 (0.0%) | 0 (0.0%) |
| Educational Services | 0 (0.0%) | 0 (0.0%) |
| Health Care & Social Assistance | 0 (0.0%) | 0 (0.0%) |
| Arts, Entertainment & Recreation | 6 (54.5%) | 5 (45.5%) |
| Accommodation & Food Services | 4 (100.0%) | 0 (0.0%) |
| Public Administration | 0 (0.0%) | 5 (100.0%) |
| Total | 43 (63.2%) | 25 (36.8%) |
Education in Rockville
School Enrollment in Rockville
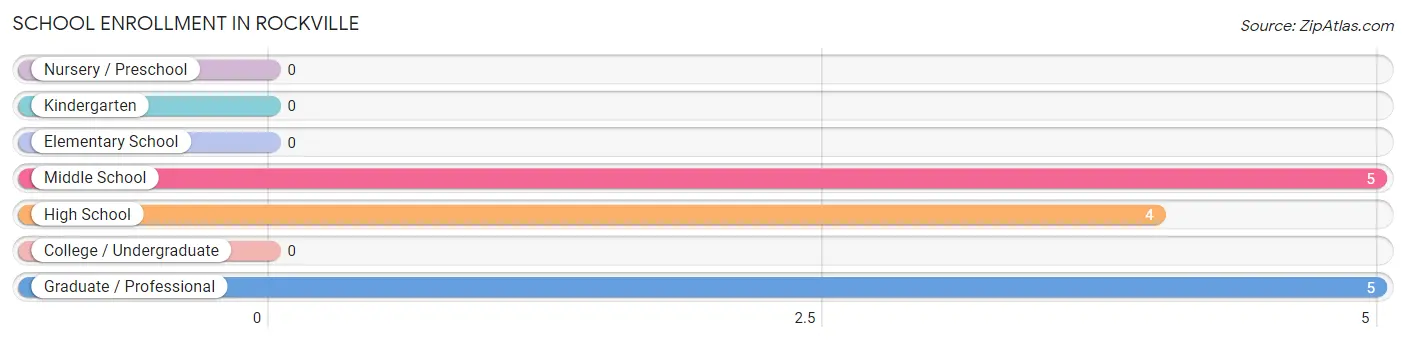
The most common levels of schooling among the 14 students in Rockville are middle school (5 | 35.7%), graduate / professional (5 | 35.7%), and high school (4 | 28.6%).
| School Level | # Students | % Students |
| Nursery / Preschool | 0 | 0.0% |
| Kindergarten | 0 | 0.0% |
| Elementary School | 0 | 0.0% |
| Middle School | 5 | 35.7% |
| High School | 4 | 28.6% |
| College / Undergraduate | 0 | 0.0% |
| Graduate / Professional | 5 | 35.7% |
| Total | 14 | 100.0% |
School Enrollment by Age by Funding Source in Rockville
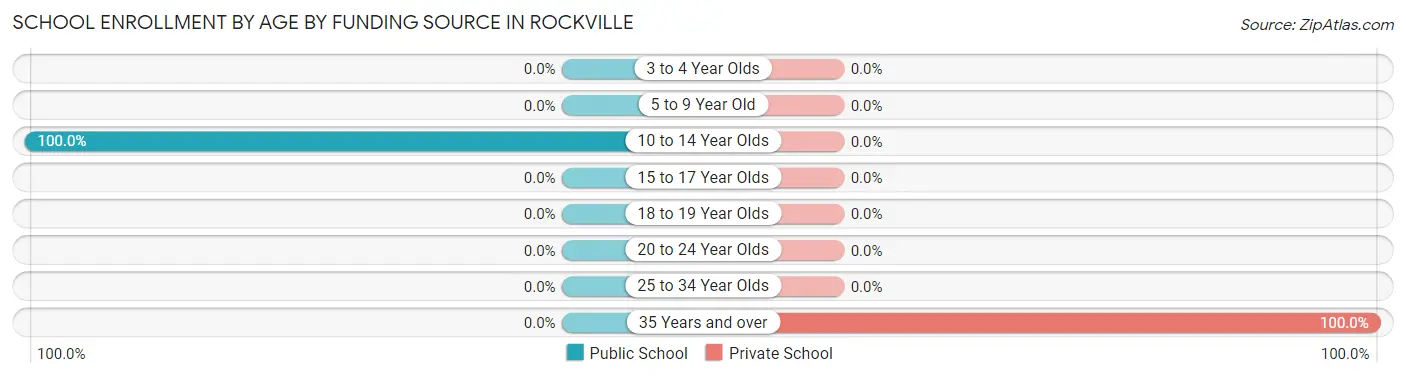
Out of a total of 14 students who are enrolled in schools in Rockville, 5 (35.7%) attend a private institution, while the remaining 9 (64.3%) are enrolled in public schools. The age group of 35 years and over has the highest likelihood of being enrolled in private schools, with 5 (100.0% in the age bracket) enrolled. Conversely, the age group of 10 to 14 year olds has the lowest likelihood of being enrolled in a private school, with 9 (100.0% in the age bracket) attending a public institution.
| Age Bracket | Public School | Private School |
| 3 to 4 Year Olds | 0 (0.0%) | 0 (0.0%) |
| 5 to 9 Year Old | 0 (0.0%) | 0 (0.0%) |
| 10 to 14 Year Olds | 9 (100.0%) | 0 (0.0%) |
| 15 to 17 Year Olds | 0 (0.0%) | 0 (0.0%) |
| 18 to 19 Year Olds | 0 (0.0%) | 0 (0.0%) |
| 20 to 24 Year Olds | 0 (0.0%) | 0 (0.0%) |
| 25 to 34 Year Olds | 0 (0.0%) | 0 (0.0%) |
| 35 Years and over | 0 (0.0%) | 5 (100.0%) |
| Total | 9 (64.3%) | 5 (35.7%) |
Educational Attainment by Field of Study in Rockville
Education (13 | 29.5%), computers & mathematics (9 | 20.4%), literature & languages (6 | 13.6%), business (5 | 11.4%), and visual & performing arts (5 | 11.4%) are the most common fields of study among 44 individuals in Rockville who have obtained a bachelor's degree or higher.
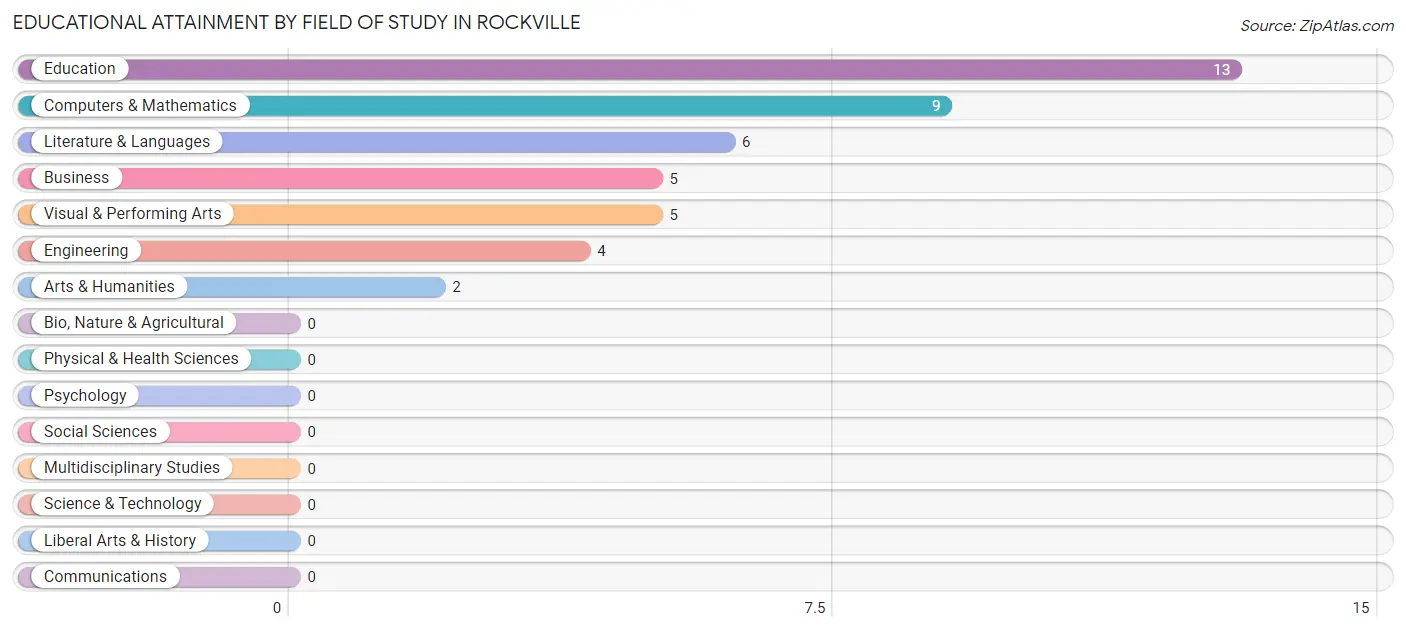
| Field of Study | # Graduates | % Graduates |
| Computers & Mathematics | 9 | 20.4% |
| Bio, Nature & Agricultural | 0 | 0.0% |
| Physical & Health Sciences | 0 | 0.0% |
| Psychology | 0 | 0.0% |
| Social Sciences | 0 | 0.0% |
| Engineering | 4 | 9.1% |
| Multidisciplinary Studies | 0 | 0.0% |
| Science & Technology | 0 | 0.0% |
| Business | 5 | 11.4% |
| Education | 13 | 29.5% |
| Literature & Languages | 6 | 13.6% |
| Liberal Arts & History | 0 | 0.0% |
| Visual & Performing Arts | 5 | 11.4% |
| Communications | 0 | 0.0% |
| Arts & Humanities | 2 | 4.5% |
| Total | 44 | 100.0% |
Transportation & Commute in Rockville
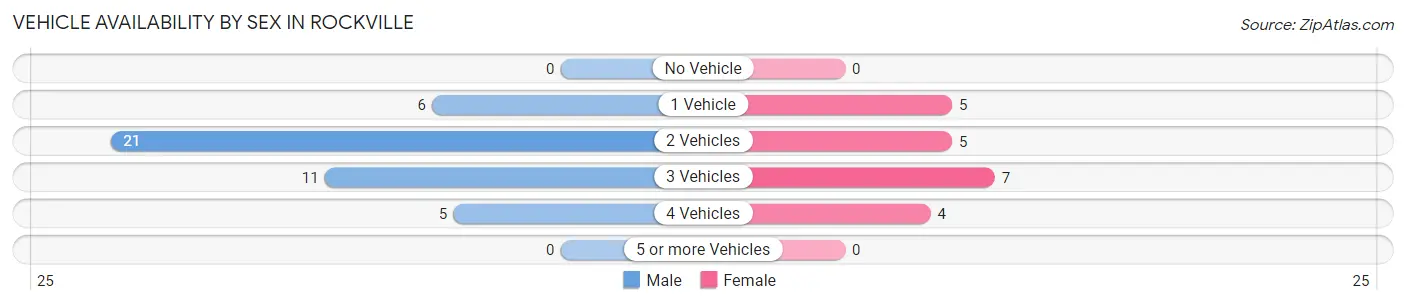
Vehicle Availability by Sex in Rockville
The most prevalent vehicle ownership categories in Rockville are males with 2 vehicles (21, accounting for 48.8%) and females with 2 vehicles (5, making up 100.0%).
| Vehicles Available | Male | Female |
| No Vehicle | 0 (0.0%) | 0 (0.0%) |
| 1 Vehicle | 6 (14.0%) | 5 (23.8%) |
| 2 Vehicles | 21 (48.8%) | 5 (23.8%) |
| 3 Vehicles | 11 (25.6%) | 7 (33.3%) |
| 4 Vehicles | 5 (11.6%) | 4 (19.1%) |
| 5 or more Vehicles | 0 (0.0%) | 0 (0.0%) |
| Total | 43 (100.0%) | 21 (100.0%) |
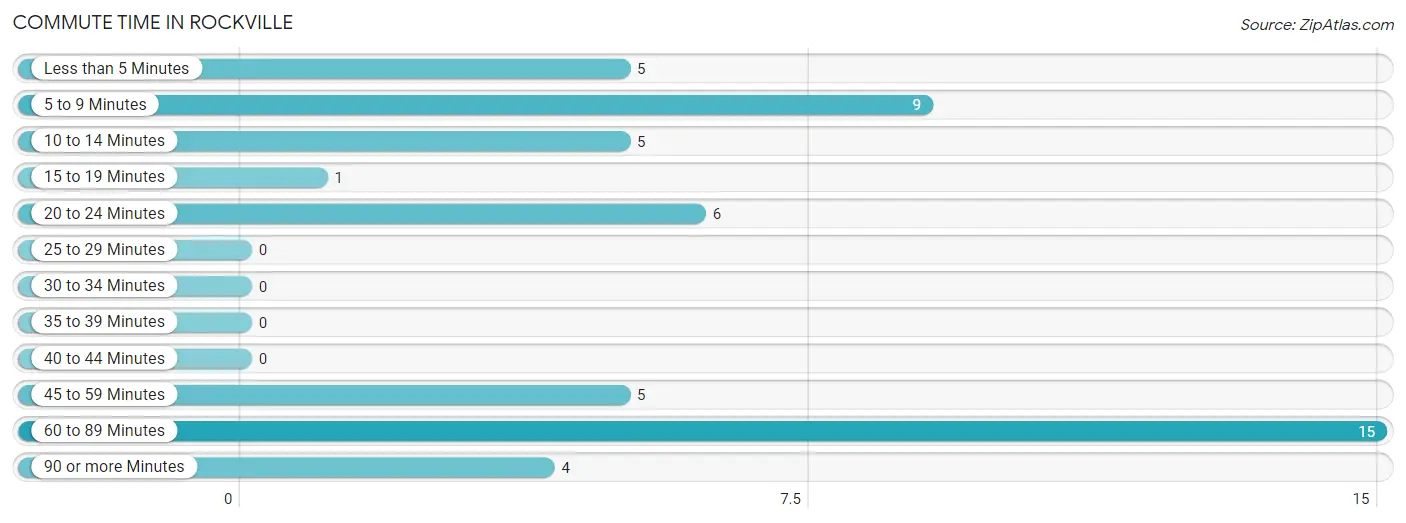
Commute Time in Rockville
The most frequently occuring commute durations in Rockville are 60 to 89 minutes (15 commuters, 30.0%), 5 to 9 minutes (9 commuters, 18.0%), and 20 to 24 minutes (6 commuters, 12.0%).
| Commute Time | # Commuters | % Commuters |
| Less than 5 Minutes | 5 | 10.0% |
| 5 to 9 Minutes | 9 | 18.0% |
| 10 to 14 Minutes | 5 | 10.0% |
| 15 to 19 Minutes | 1 | 2.0% |
| 20 to 24 Minutes | 6 | 12.0% |
| 25 to 29 Minutes | 0 | 0.0% |
| 30 to 34 Minutes | 0 | 0.0% |
| 35 to 39 Minutes | 0 | 0.0% |
| 40 to 44 Minutes | 0 | 0.0% |
| 45 to 59 Minutes | 5 | 10.0% |
| 60 to 89 Minutes | 15 | 30.0% |
| 90 or more Minutes | 4 | 8.0% |
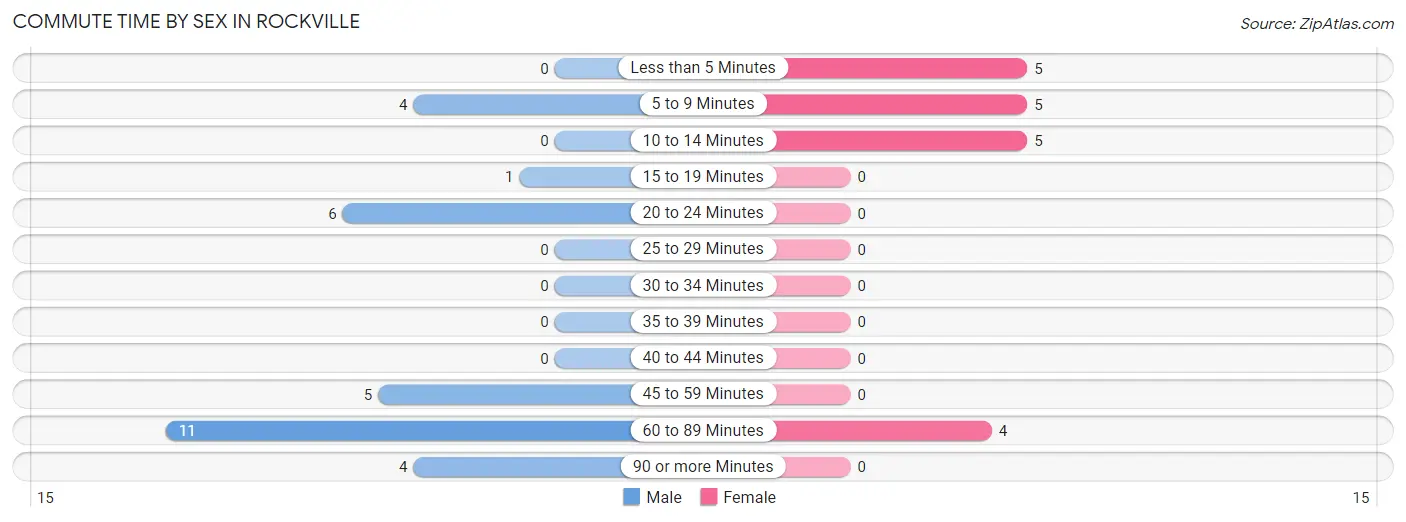
Commute Time by Sex in Rockville
The most common commute times in Rockville are 60 to 89 minutes (11 commuters, 35.5%) for males and less than 5 minutes (5 commuters, 26.3%) for females.
| Commute Time | Male | Female |
| Less than 5 Minutes | 0 (0.0%) | 5 (26.3%) |
| 5 to 9 Minutes | 4 (12.9%) | 5 (26.3%) |
| 10 to 14 Minutes | 0 (0.0%) | 5 (26.3%) |
| 15 to 19 Minutes | 1 (3.2%) | 0 (0.0%) |
| 20 to 24 Minutes | 6 (19.4%) | 0 (0.0%) |
| 25 to 29 Minutes | 0 (0.0%) | 0 (0.0%) |
| 30 to 34 Minutes | 0 (0.0%) | 0 (0.0%) |
| 35 to 39 Minutes | 0 (0.0%) | 0 (0.0%) |
| 40 to 44 Minutes | 0 (0.0%) | 0 (0.0%) |
| 45 to 59 Minutes | 5 (16.1%) | 0 (0.0%) |
| 60 to 89 Minutes | 11 (35.5%) | 4 (21.0%) |
| 90 or more Minutes | 4 (12.9%) | 0 (0.0%) |
Time of Departure to Work by Sex in Rockville
The most frequent times of departure to work in Rockville are 9:00 AM to 9:59 AM (11, 35.5%) for males and 8:30 AM to 8:59 AM (10, 52.6%) for females.
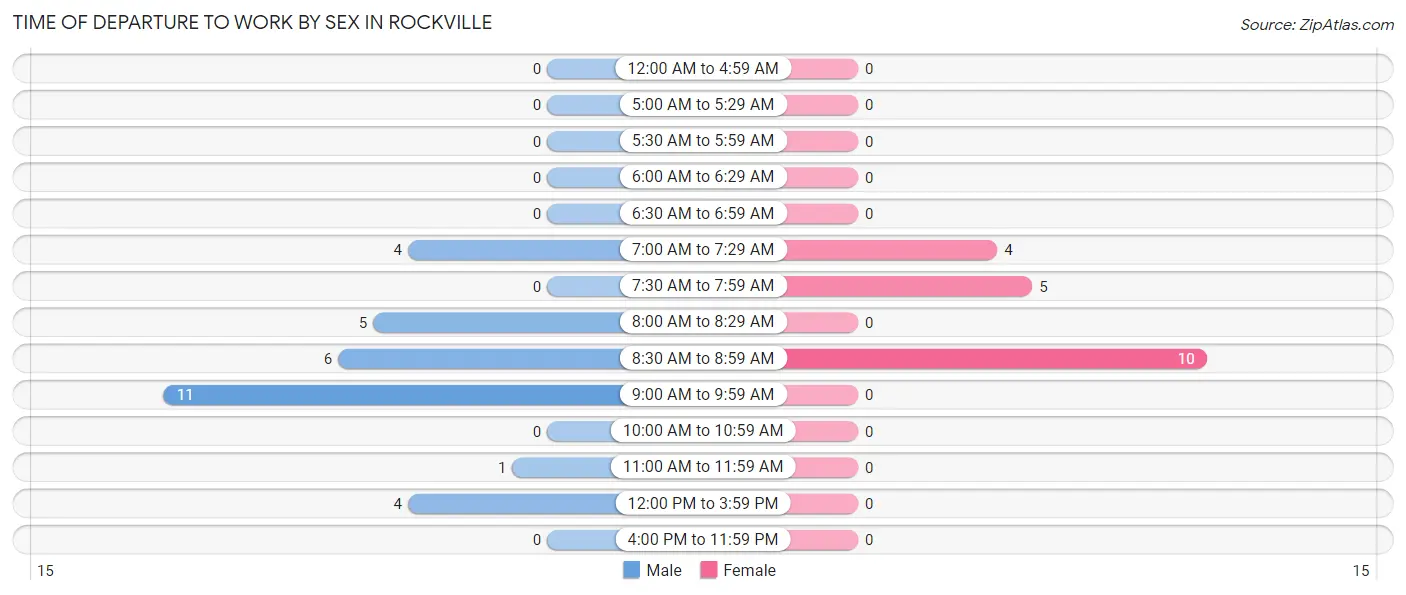
| Time of Departure | Male | Female |
| 12:00 AM to 4:59 AM | 0 (0.0%) | 0 (0.0%) |
| 5:00 AM to 5:29 AM | 0 (0.0%) | 0 (0.0%) |
| 5:30 AM to 5:59 AM | 0 (0.0%) | 0 (0.0%) |
| 6:00 AM to 6:29 AM | 0 (0.0%) | 0 (0.0%) |
| 6:30 AM to 6:59 AM | 0 (0.0%) | 0 (0.0%) |
| 7:00 AM to 7:29 AM | 4 (12.9%) | 4 (21.0%) |
| 7:30 AM to 7:59 AM | 0 (0.0%) | 5 (26.3%) |
| 8:00 AM to 8:29 AM | 5 (16.1%) | 0 (0.0%) |
| 8:30 AM to 8:59 AM | 6 (19.4%) | 10 (52.6%) |
| 9:00 AM to 9:59 AM | 11 (35.5%) | 0 (0.0%) |
| 10:00 AM to 10:59 AM | 0 (0.0%) | 0 (0.0%) |
| 11:00 AM to 11:59 AM | 1 (3.2%) | 0 (0.0%) |
| 12:00 PM to 3:59 PM | 4 (12.9%) | 0 (0.0%) |
| 4:00 PM to 11:59 PM | 0 (0.0%) | 0 (0.0%) |
| Total | 31 (100.0%) | 19 (100.0%) |
Housing Occupancy in Rockville
Occupancy by Ownership in Rockville
Of the total 105 dwellings in Rockville, owner-occupied units account for 82 (78.1%), while renter-occupied units make up 23 (21.9%).
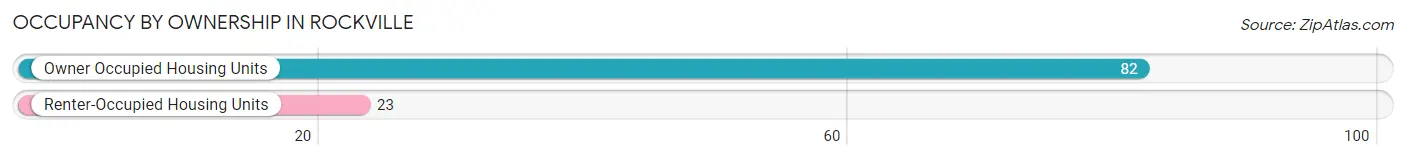
| Occupancy | # Housing Units | % Housing Units |
| Owner Occupied Housing Units | 82 | 78.1% |
| Renter-Occupied Housing Units | 23 | 21.9% |
| Total Occupied Housing Units | 105 | 100.0% |
Occupancy by Household Size in Rockville
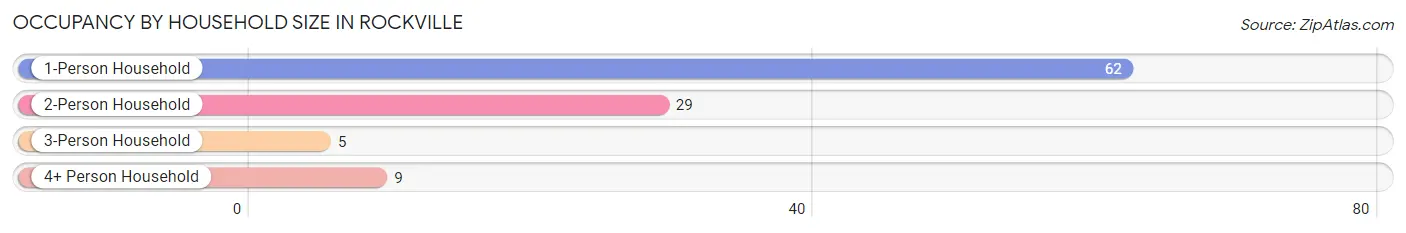
| Household Size | # Housing Units | % Housing Units |
| 1-Person Household | 62 | 59.1% |
| 2-Person Household | 29 | 27.6% |
| 3-Person Household | 5 | 4.8% |
| 4+ Person Household | 9 | 8.6% |
| Total Housing Units | 105 | 100.0% |
Occupancy by Ownership by Household Size in Rockville
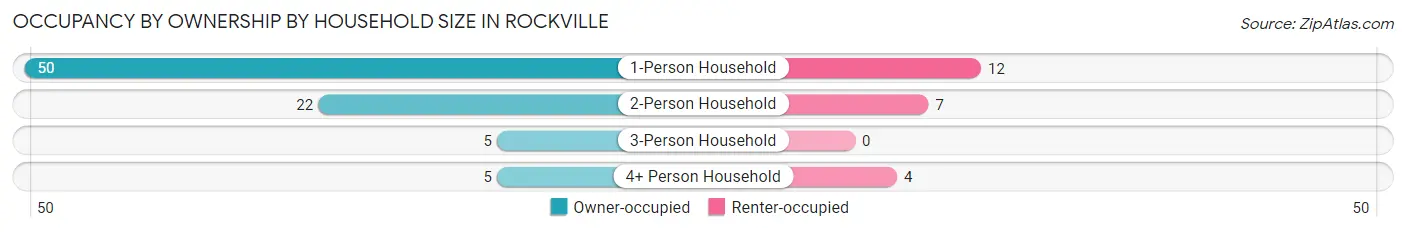
| Household Size | Owner-occupied | Renter-occupied |
| 1-Person Household | 50 (80.6%) | 12 (19.4%) |
| 2-Person Household | 22 (75.9%) | 7 (24.1%) |
| 3-Person Household | 5 (100.0%) | 0 (0.0%) |
| 4+ Person Household | 5 (55.6%) | 4 (44.4%) |
| Total Housing Units | 82 (78.1%) | 23 (21.9%) |
Occupancy by Educational Attainment in Rockville
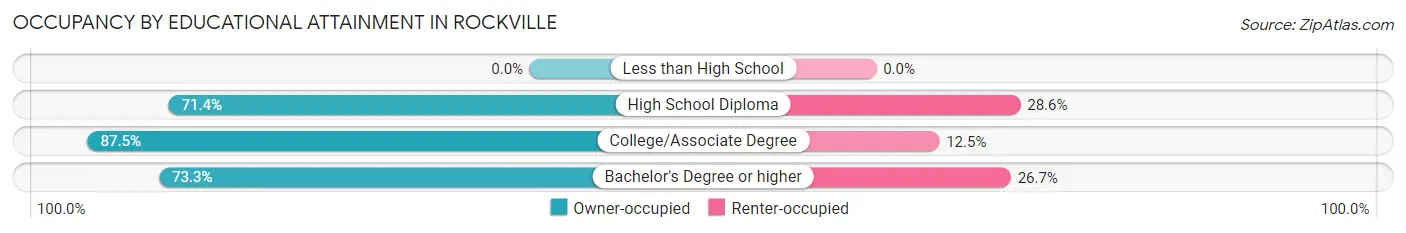
| Household Size | Owner-occupied | Renter-occupied |
| Less than High School | 0 (0.0%) | 0 (0.0%) |
| High School Diploma | 25 (71.4%) | 10 (28.6%) |
| College/Associate Degree | 35 (87.5%) | 5 (12.5%) |
| Bachelor's Degree or higher | 22 (73.3%) | 8 (26.7%) |
Occupancy by Age of Householder in Rockville
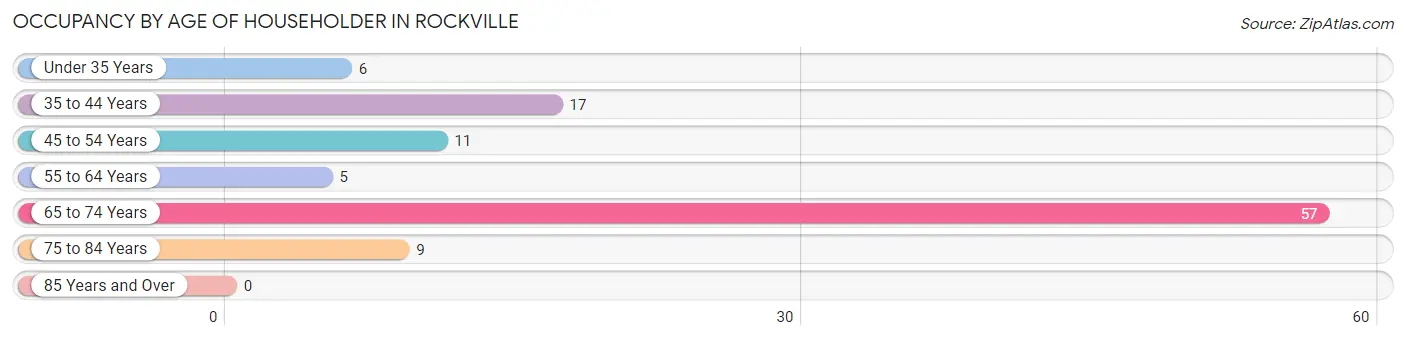
| Age Bracket | # Households | % Households |
| Under 35 Years | 6 | 5.7% |
| 35 to 44 Years | 17 | 16.2% |
| 45 to 54 Years | 11 | 10.5% |
| 55 to 64 Years | 5 | 4.8% |
| 65 to 74 Years | 57 | 54.3% |
| 75 to 84 Years | 9 | 8.6% |
| 85 Years and Over | 0 | 0.0% |
| Total | 105 | 100.0% |
Housing Finances in Rockville
Median Income by Occupancy in Rockville
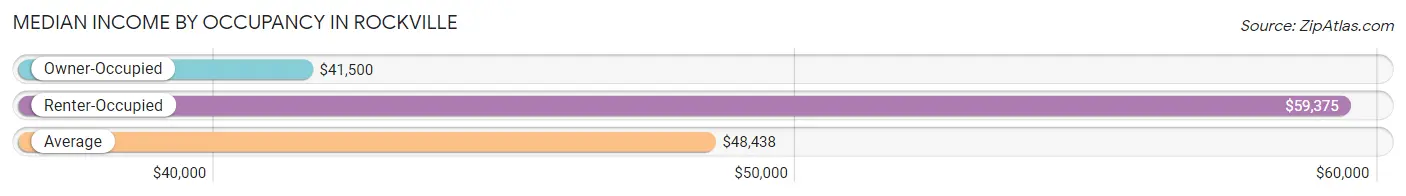
| Occupancy Type | # Households | Median Income |
| Owner-Occupied | 82 (78.1%) | $41,500 |
| Renter-Occupied | 23 (21.9%) | $59,375 |
| Average | 105 (100.0%) | $48,438 |
Occupancy by Householder Income Bracket in Rockville
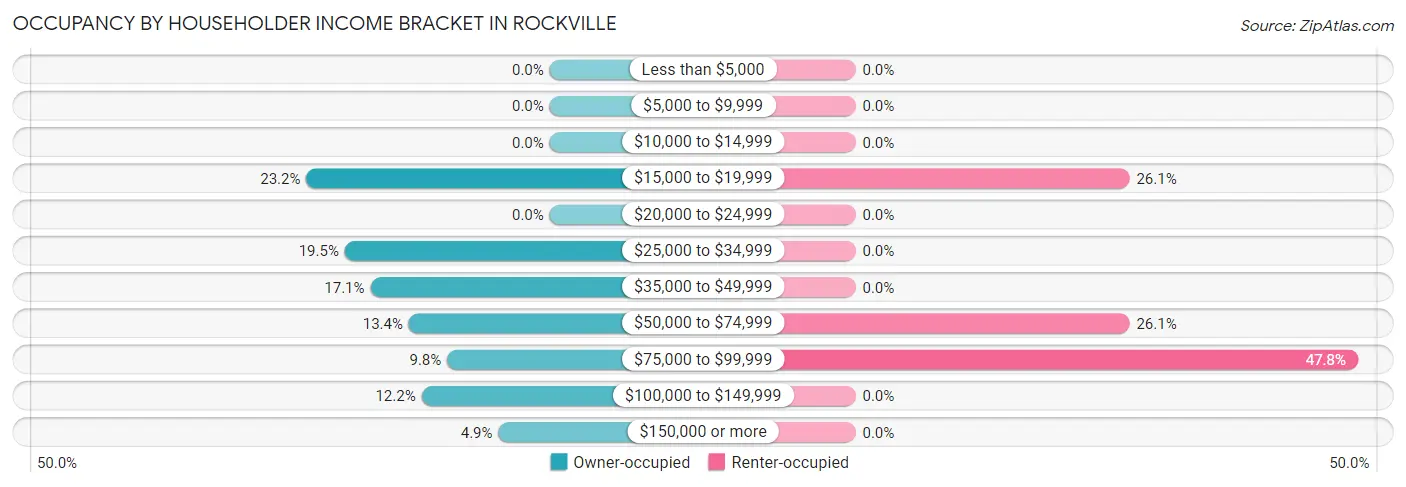
| Income Bracket | Owner-occupied | Renter-occupied |
| Less than $5,000 | 0 (0.0%) | 0 (0.0%) |
| $5,000 to $9,999 | 0 (0.0%) | 0 (0.0%) |
| $10,000 to $14,999 | 0 (0.0%) | 0 (0.0%) |
| $15,000 to $19,999 | 19 (23.2%) | 6 (26.1%) |
| $20,000 to $24,999 | 0 (0.0%) | 0 (0.0%) |
| $25,000 to $34,999 | 16 (19.5%) | 0 (0.0%) |
| $35,000 to $49,999 | 14 (17.1%) | 0 (0.0%) |
| $50,000 to $74,999 | 11 (13.4%) | 6 (26.1%) |
| $75,000 to $99,999 | 8 (9.8%) | 11 (47.8%) |
| $100,000 to $149,999 | 10 (12.2%) | 0 (0.0%) |
| $150,000 or more | 4 (4.9%) | 0 (0.0%) |
| Total | 82 (100.0%) | 23 (100.0%) |
Monthly Housing Cost Tiers in Rockville
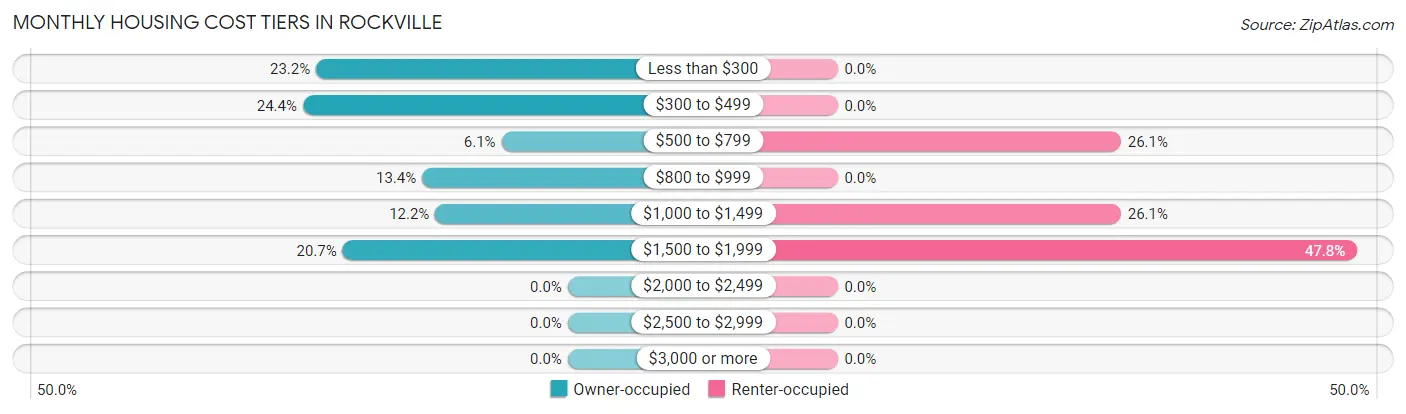
| Monthly Cost | Owner-occupied | Renter-occupied |
| Less than $300 | 19 (23.2%) | 0 (0.0%) |
| $300 to $499 | 20 (24.4%) | 0 (0.0%) |
| $500 to $799 | 5 (6.1%) | 6 (26.1%) |
| $800 to $999 | 11 (13.4%) | 0 (0.0%) |
| $1,000 to $1,499 | 10 (12.2%) | 6 (26.1%) |
| $1,500 to $1,999 | 17 (20.7%) | 11 (47.8%) |
| $2,000 to $2,499 | 0 (0.0%) | 0 (0.0%) |
| $2,500 to $2,999 | 0 (0.0%) | 0 (0.0%) |
| $3,000 or more | 0 (0.0%) | 0 (0.0%) |
| Total | 82 (100.0%) | 23 (100.0%) |
Physical Housing Characteristics in Rockville
Housing Structures in Rockville
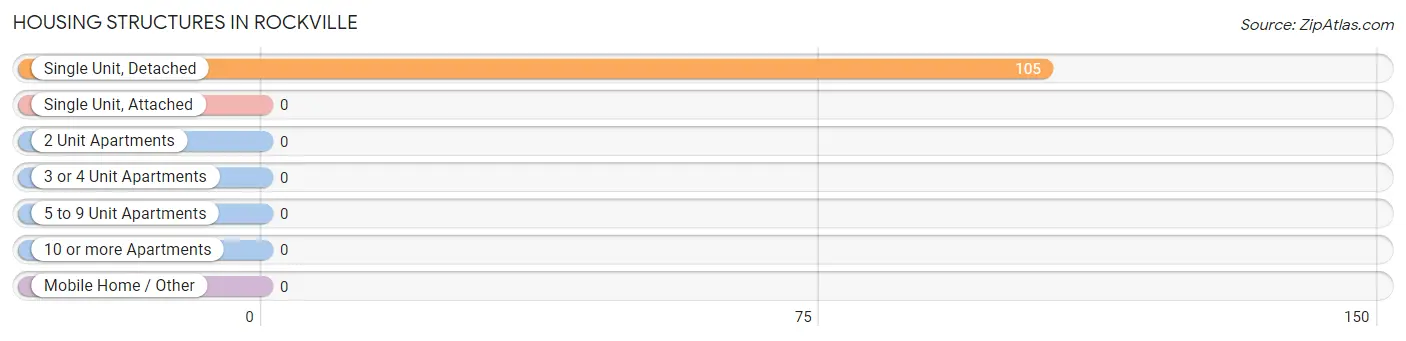
| Structure Type | # Housing Units | % Housing Units |
| Single Unit, Detached | 105 | 100.0% |
| Single Unit, Attached | 0 | 0.0% |
| 2 Unit Apartments | 0 | 0.0% |
| 3 or 4 Unit Apartments | 0 | 0.0% |
| 5 to 9 Unit Apartments | 0 | 0.0% |
| 10 or more Apartments | 0 | 0.0% |
| Mobile Home / Other | 0 | 0.0% |
| Total | 105 | 100.0% |
Housing Structures by Occupancy in Rockville
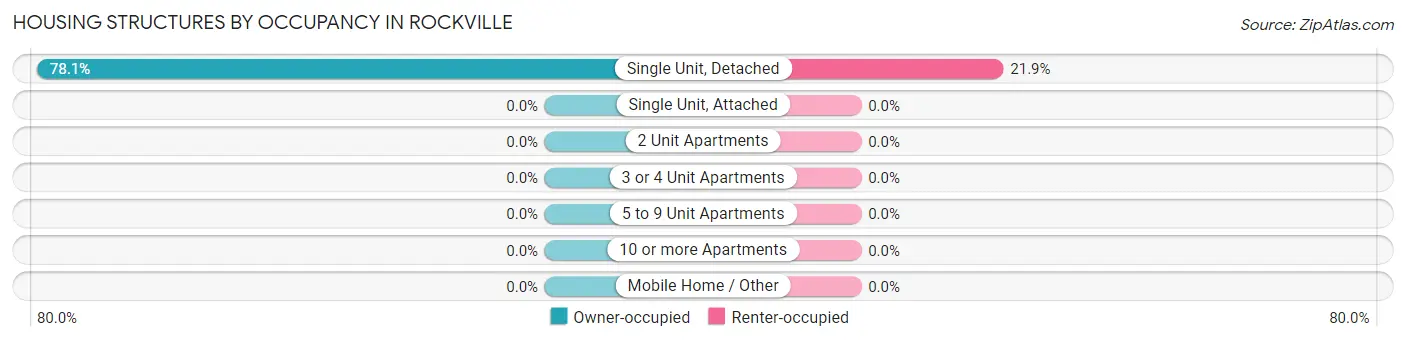
| Structure Type | Owner-occupied | Renter-occupied |
| Single Unit, Detached | 82 (78.1%) | 23 (21.9%) |
| Single Unit, Attached | 0 (0.0%) | 0 (0.0%) |
| 2 Unit Apartments | 0 (0.0%) | 0 (0.0%) |
| 3 or 4 Unit Apartments | 0 (0.0%) | 0 (0.0%) |
| 5 to 9 Unit Apartments | 0 (0.0%) | 0 (0.0%) |
| 10 or more Apartments | 0 (0.0%) | 0 (0.0%) |
| Mobile Home / Other | 0 (0.0%) | 0 (0.0%) |
| Total | 82 (78.1%) | 23 (21.9%) |
Housing Structures by Number of Rooms in Rockville
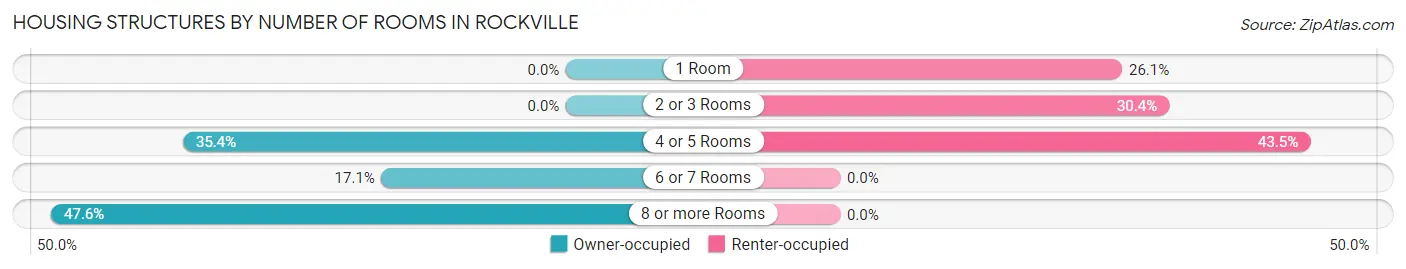
| Number of Rooms | Owner-occupied | Renter-occupied |
| 1 Room | 0 (0.0%) | 6 (26.1%) |
| 2 or 3 Rooms | 0 (0.0%) | 7 (30.4%) |
| 4 or 5 Rooms | 29 (35.4%) | 10 (43.5%) |
| 6 or 7 Rooms | 14 (17.1%) | 0 (0.0%) |
| 8 or more Rooms | 39 (47.6%) | 0 (0.0%) |
| Total | 82 (100.0%) | 23 (100.0%) |
Housing Structure by Heating Type in Rockville
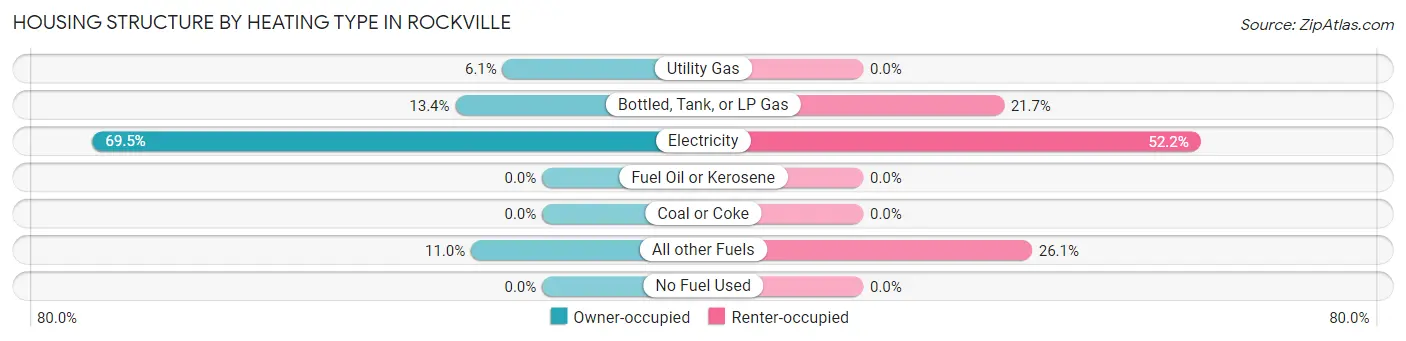
| Heating Type | Owner-occupied | Renter-occupied |
| Utility Gas | 5 (6.1%) | 0 (0.0%) |
| Bottled, Tank, or LP Gas | 11 (13.4%) | 5 (21.7%) |
| Electricity | 57 (69.5%) | 12 (52.2%) |
| Fuel Oil or Kerosene | 0 (0.0%) | 0 (0.0%) |
| Coal or Coke | 0 (0.0%) | 0 (0.0%) |
| All other Fuels | 9 (11.0%) | 6 (26.1%) |
| No Fuel Used | 0 (0.0%) | 0 (0.0%) |
| Total | 82 (100.0%) | 23 (100.0%) |
Household Vehicle Usage in Rockville
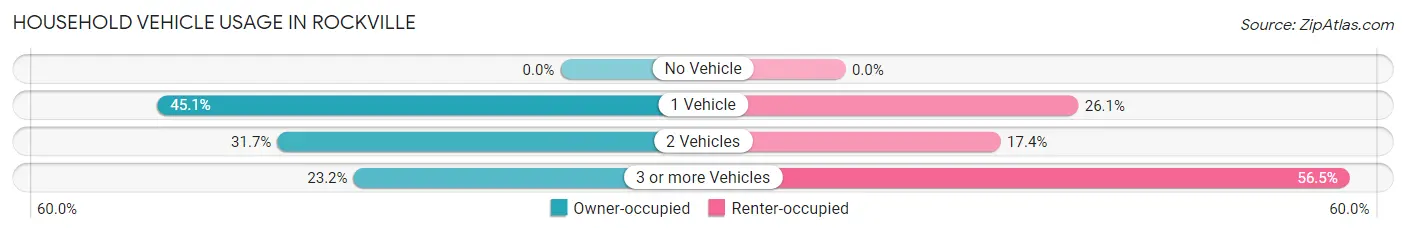
| Vehicles per Household | Owner-occupied | Renter-occupied |
| No Vehicle | 0 (0.0%) | 0 (0.0%) |
| 1 Vehicle | 37 (45.1%) | 6 (26.1%) |
| 2 Vehicles | 26 (31.7%) | 4 (17.4%) |
| 3 or more Vehicles | 19 (23.2%) | 13 (56.5%) |
| Total | 82 (100.0%) | 23 (100.0%) |
Real Estate & Mortgages in Rockville
Real Estate and Mortgage Overview in Rockville
| Characteristic | Without Mortgage | With Mortgage |
| Housing Units | 50 | 32 |
| Median Property Value | - | - |
| Median Household Income | - | - |
| Monthly Housing Costs | $350 | $0 |
| Real Estate Taxes | $2,545 | $0 |
Property Value by Mortgage Status in Rockville
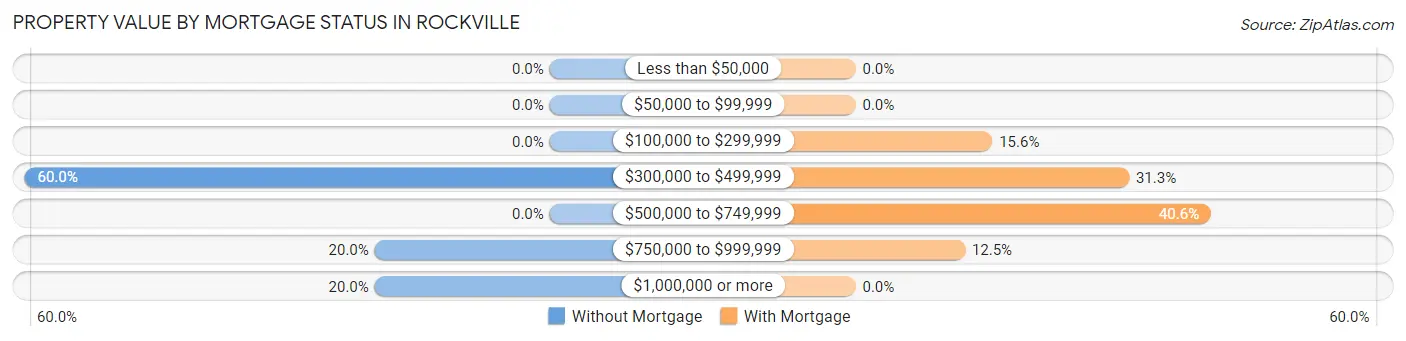
| Property Value | Without Mortgage | With Mortgage |
| Less than $50,000 | 0 (0.0%) | 0 (0.0%) |
| $50,000 to $99,999 | 0 (0.0%) | 0 (0.0%) |
| $100,000 to $299,999 | 0 (0.0%) | 5 (15.6%) |
| $300,000 to $499,999 | 30 (60.0%) | 10 (31.2%) |
| $500,000 to $749,999 | 0 (0.0%) | 13 (40.6%) |
| $750,000 to $999,999 | 10 (20.0%) | 4 (12.5%) |
| $1,000,000 or more | 10 (20.0%) | 0 (0.0%) |
| Total | 50 (100.0%) | 32 (100.0%) |
Household Income by Mortgage Status in Rockville
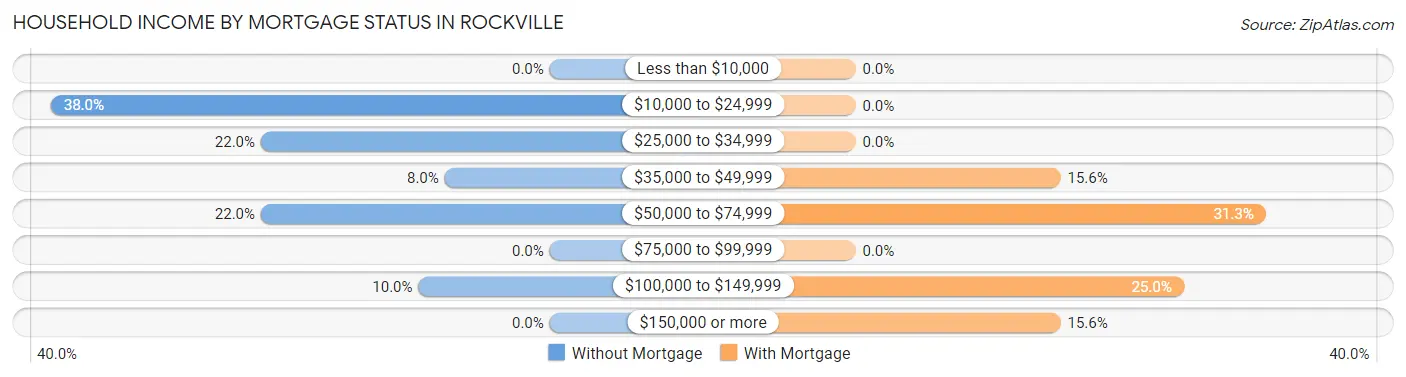
| Household Income | Without Mortgage | With Mortgage |
| Less than $10,000 | 0 (0.0%) | 0 (0.0%) |
| $10,000 to $24,999 | 19 (38.0%) | 0 (0.0%) |
| $25,000 to $34,999 | 11 (22.0%) | 0 (0.0%) |
| $35,000 to $49,999 | 4 (8.0%) | 5 (15.6%) |
| $50,000 to $74,999 | 11 (22.0%) | 10 (31.2%) |
| $75,000 to $99,999 | 0 (0.0%) | 0 (0.0%) |
| $100,000 to $149,999 | 5 (10.0%) | 8 (25.0%) |
| $150,000 or more | 0 (0.0%) | 5 (15.6%) |
| Total | 50 (100.0%) | 32 (100.0%) |
Property Value to Household Income Ratio in Rockville
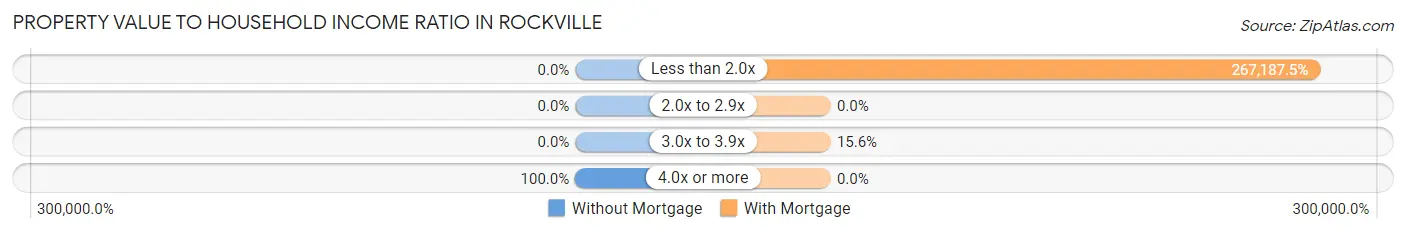
| Value-to-Income Ratio | Without Mortgage | With Mortgage |
| Less than 2.0x | 0 (0.0%) | 85,500 (267,187.5%) |
| 2.0x to 2.9x | 0 (0.0%) | 0 (0.0%) |
| 3.0x to 3.9x | 0 (0.0%) | 5 (15.6%) |
| 4.0x or more | 50 (100.0%) | 0 (0.0%) |
| Total | 50 (100.0%) | 32 (100.0%) |
Real Estate Taxes by Mortgage Status in Rockville
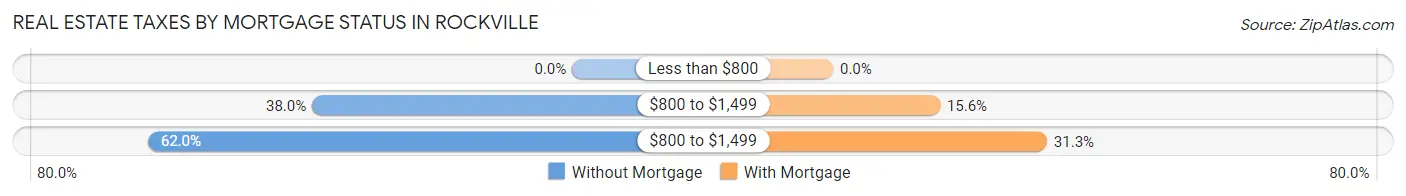
| Property Taxes | Without Mortgage | With Mortgage |
| Less than $800 | 0 (0.0%) | 0 (0.0%) |
| $800 to $1,499 | 19 (38.0%) | 5 (15.6%) |
| $800 to $1,499 | 31 (62.0%) | 10 (31.2%) |
| Total | 50 (100.0%) | 32 (100.0%) |
Health & Disability in Rockville
Health Insurance Coverage by Age in Rockville
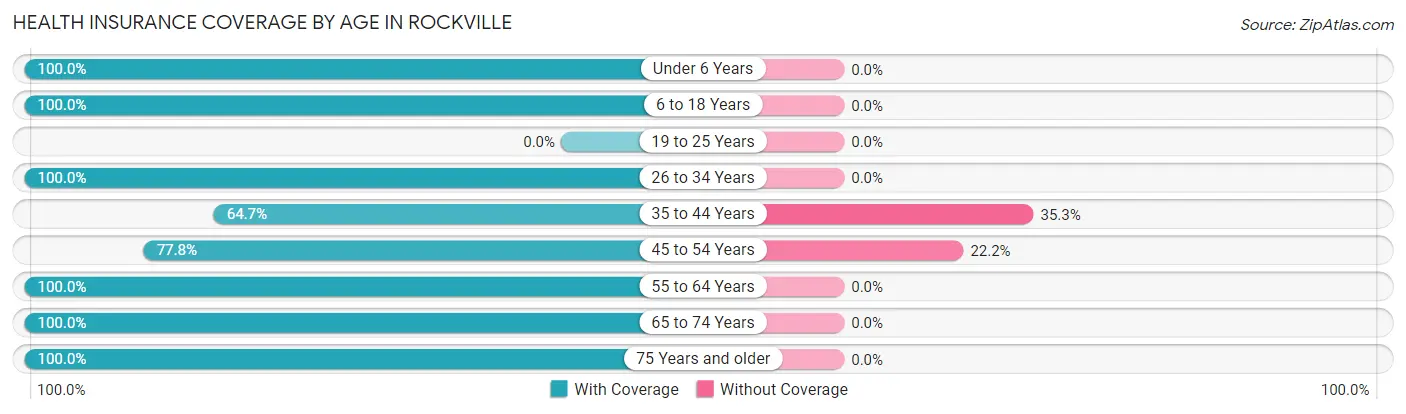
| Age Bracket | With Coverage | Without Coverage |
| Under 6 Years | 8 (100.0%) | 0 (0.0%) |
| 6 to 18 Years | 9 (100.0%) | 0 (0.0%) |
| 19 to 25 Years | 0 (0.0%) | 0 (0.0%) |
| 26 to 34 Years | 11 (100.0%) | 0 (0.0%) |
| 35 to 44 Years | 11 (64.7%) | 6 (35.3%) |
| 45 to 54 Years | 21 (77.8%) | 6 (22.2%) |
| 55 to 64 Years | 10 (100.0%) | 0 (0.0%) |
| 65 to 74 Years | 68 (100.0%) | 0 (0.0%) |
| 75 Years and older | 30 (100.0%) | 0 (0.0%) |
| Total | 168 (93.3%) | 12 (6.7%) |
Health Insurance Coverage by Citizenship Status in Rockville
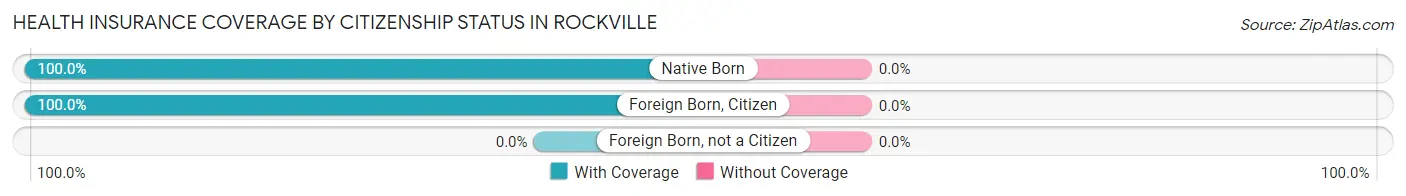
| Citizenship Status | With Coverage | Without Coverage |
| Native Born | 8 (100.0%) | 0 (0.0%) |
| Foreign Born, Citizen | 9 (100.0%) | 0 (0.0%) |
| Foreign Born, not a Citizen | 0 (0.0%) | 0 (0.0%) |
Health Insurance Coverage by Household Income in Rockville
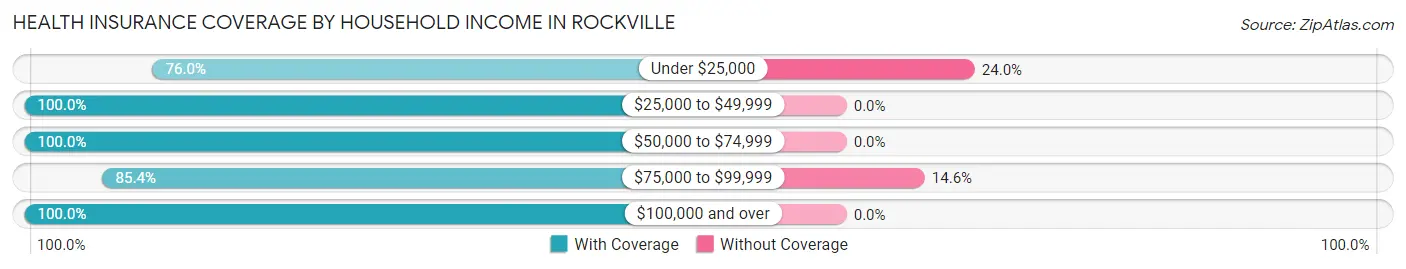
| Household Income | With Coverage | Without Coverage |
| Under $25,000 | 19 (76.0%) | 6 (24.0%) |
| $25,000 to $49,999 | 35 (100.0%) | 0 (0.0%) |
| $50,000 to $74,999 | 35 (100.0%) | 0 (0.0%) |
| $75,000 to $99,999 | 35 (85.4%) | 6 (14.6%) |
| $100,000 and over | 44 (100.0%) | 0 (0.0%) |
Public vs Private Health Insurance Coverage by Age in Rockville
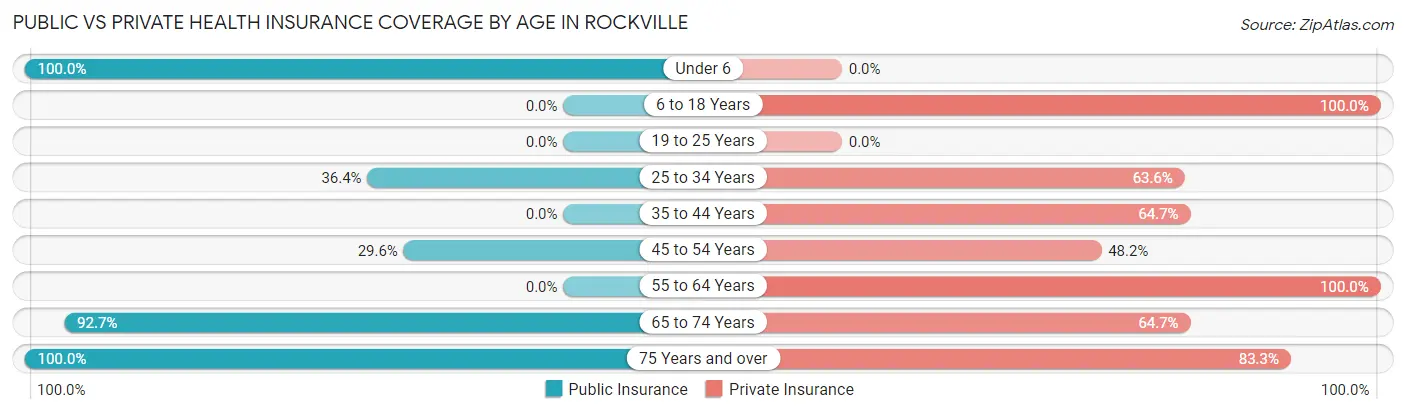
| Age Bracket | Public Insurance | Private Insurance |
| Under 6 | 8 (100.0%) | 0 (0.0%) |
| 6 to 18 Years | 0 (0.0%) | 9 (100.0%) |
| 19 to 25 Years | 0 (0.0%) | 0 (0.0%) |
| 25 to 34 Years | 4 (36.4%) | 7 (63.6%) |
| 35 to 44 Years | 0 (0.0%) | 11 (64.7%) |
| 45 to 54 Years | 8 (29.6%) | 13 (48.1%) |
| 55 to 64 Years | 0 (0.0%) | 10 (100.0%) |
| 65 to 74 Years | 63 (92.6%) | 44 (64.7%) |
| 75 Years and over | 30 (100.0%) | 25 (83.3%) |
| Total | 113 (62.8%) | 119 (66.1%) |
Disability Status by Sex by Age in Rockville
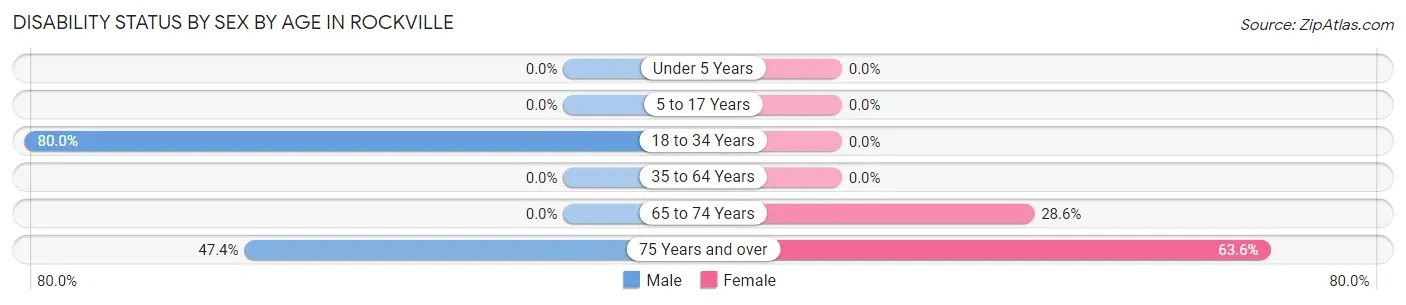
| Age Bracket | Male | Female |
| Under 5 Years | 0 (0.0%) | 0 (0.0%) |
| 5 to 17 Years | 0 (0.0%) | 0 (0.0%) |
| 18 to 34 Years | 4 (80.0%) | 0 (0.0%) |
| 35 to 64 Years | 0 (0.0%) | 0 (0.0%) |
| 65 to 74 Years | 0 (0.0%) | 8 (28.6%) |
| 75 Years and over | 9 (47.4%) | 7 (63.6%) |
Disability Class by Sex by Age in Rockville
Disability Class: Hearing Difficulty
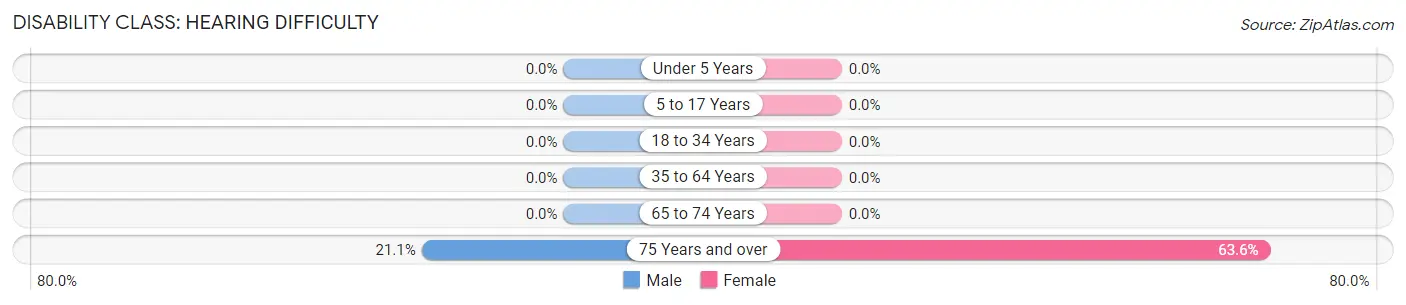
| Age Bracket | Male | Female |
| Under 5 Years | 0 (0.0%) | 0 (0.0%) |
| 5 to 17 Years | 0 (0.0%) | 0 (0.0%) |
| 18 to 34 Years | 0 (0.0%) | 0 (0.0%) |
| 35 to 64 Years | 0 (0.0%) | 0 (0.0%) |
| 65 to 74 Years | 0 (0.0%) | 0 (0.0%) |
| 75 Years and over | 4 (21.0%) | 7 (63.6%) |
Disability Class: Vision Difficulty
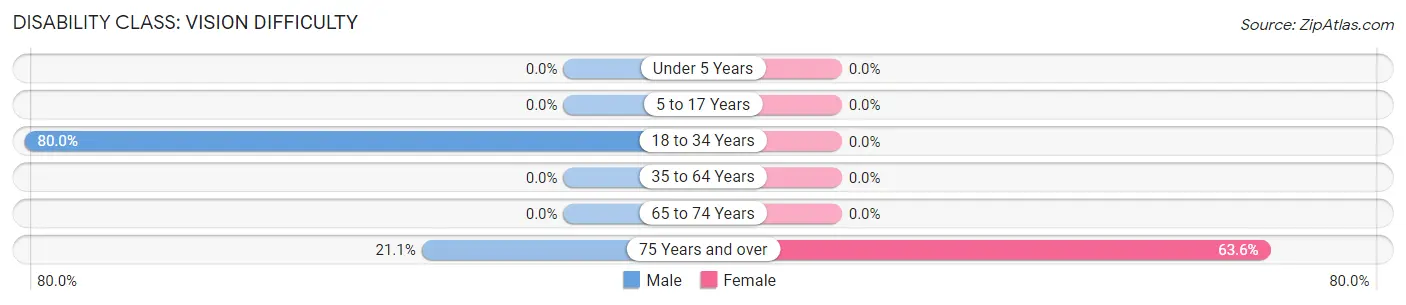
| Age Bracket | Male | Female |
| Under 5 Years | 0 (0.0%) | 0 (0.0%) |
| 5 to 17 Years | 0 (0.0%) | 0 (0.0%) |
| 18 to 34 Years | 4 (80.0%) | 0 (0.0%) |
| 35 to 64 Years | 0 (0.0%) | 0 (0.0%) |
| 65 to 74 Years | 0 (0.0%) | 0 (0.0%) |
| 75 Years and over | 4 (21.0%) | 7 (63.6%) |
Disability Class: Cognitive Difficulty
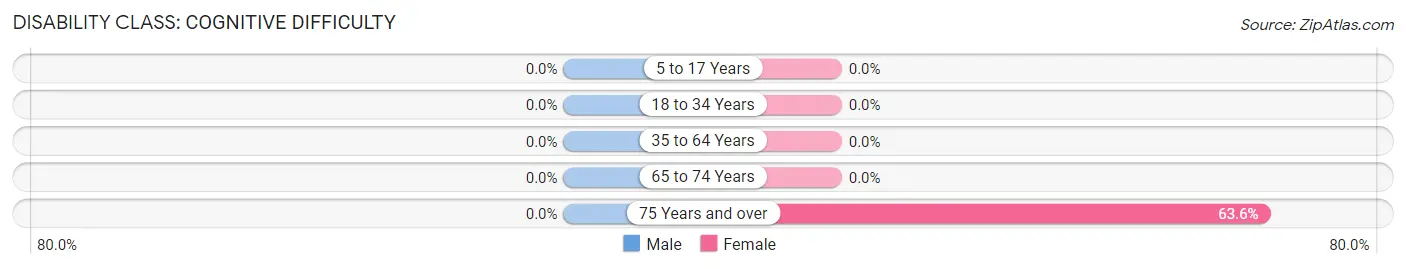
| Age Bracket | Male | Female |
| 5 to 17 Years | 0 (0.0%) | 0 (0.0%) |
| 18 to 34 Years | 0 (0.0%) | 0 (0.0%) |
| 35 to 64 Years | 0 (0.0%) | 0 (0.0%) |
| 65 to 74 Years | 0 (0.0%) | 0 (0.0%) |
| 75 Years and over | 0 (0.0%) | 7 (63.6%) |
Disability Class: Ambulatory Difficulty
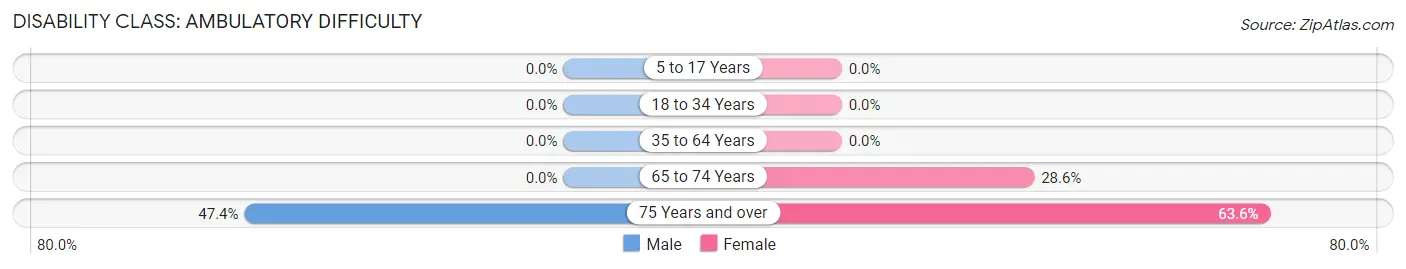
| Age Bracket | Male | Female |
| 5 to 17 Years | 0 (0.0%) | 0 (0.0%) |
| 18 to 34 Years | 0 (0.0%) | 0 (0.0%) |
| 35 to 64 Years | 0 (0.0%) | 0 (0.0%) |
| 65 to 74 Years | 0 (0.0%) | 8 (28.6%) |
| 75 Years and over | 9 (47.4%) | 7 (63.6%) |
Disability Class: Self-Care Difficulty
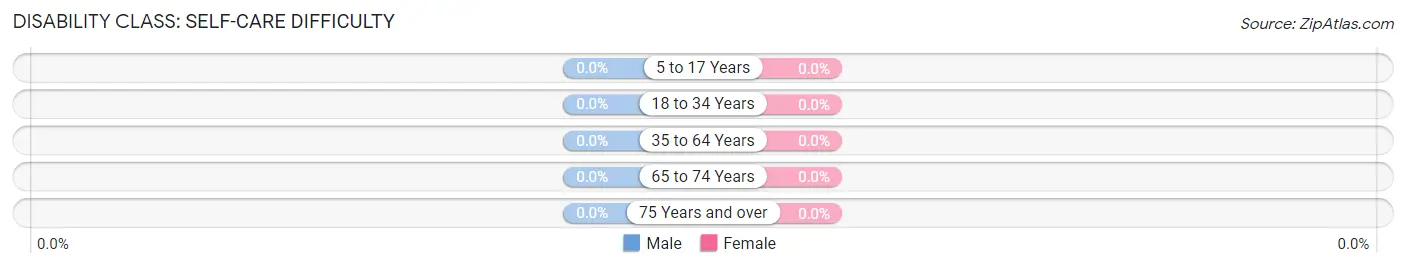
| Age Bracket | Male | Female |
| 5 to 17 Years | 0 (0.0%) | 0 (0.0%) |
| 18 to 34 Years | 0 (0.0%) | 0 (0.0%) |
| 35 to 64 Years | 0 (0.0%) | 0 (0.0%) |
| 65 to 74 Years | 0 (0.0%) | 0 (0.0%) |
| 75 Years and over | 0 (0.0%) | 0 (0.0%) |
Technology Access in Rockville
Computing Device Access in Rockville
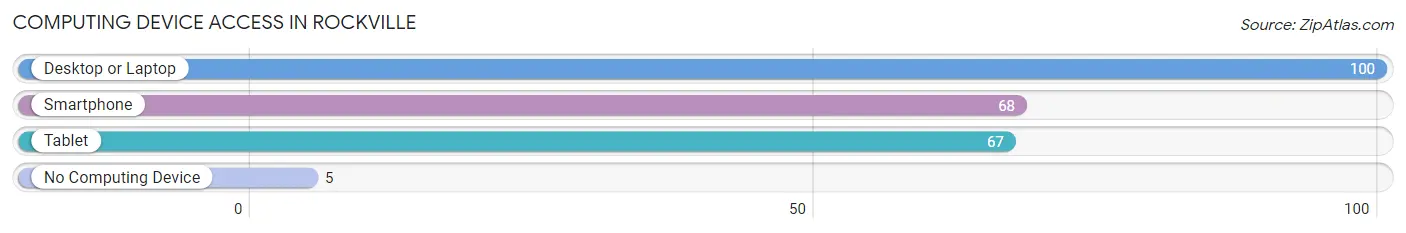
| Device Type | # Households | % Households |
| Desktop or Laptop | 100 | 95.2% |
| Smartphone | 68 | 64.8% |
| Tablet | 67 | 63.8% |
| No Computing Device | 5 | 4.8% |
| Total | 105 | 100.0% |
Internet Access in Rockville
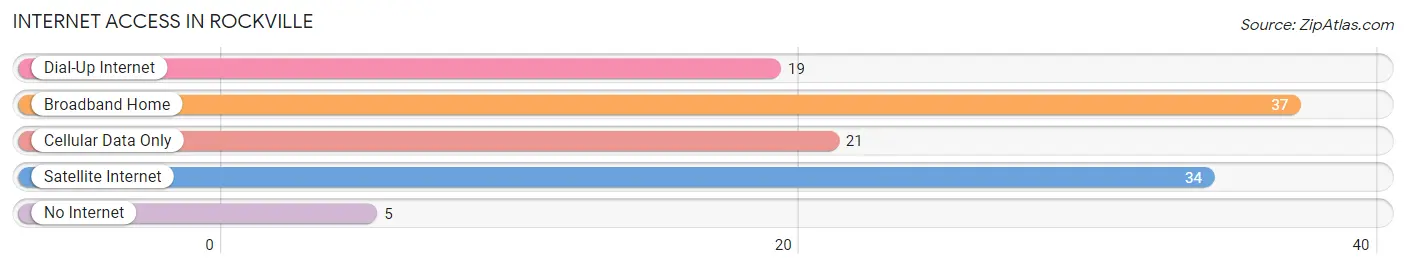
| Internet Type | # Households | % Households |
| Dial-Up Internet | 19 | 18.1% |
| Broadband Home | 37 | 35.2% |
| Cellular Data Only | 21 | 20.0% |
| Satellite Internet | 34 | 32.4% |
| No Internet | 5 | 4.8% |
| Total | 105 | 100.0% |
Rockville Summary
Introduction
Rockville is a small town located in the southwestern corner of Utah, in the United States. It is situated in the heart of Zion National Park, and is the gateway to the park. The town is known for its stunning scenery, and is a popular tourist destination. The population of Rockville was estimated to be just over 200 people in 2020.
History
Rockville was first settled in the late 1800s by Mormon pioneers. The town was originally called Adamsville, after the first settler, John Adams. The town was renamed Rockville in 1872, after the nearby rock formations.
The town was a popular stop for travelers heading to Zion National Park, and the local economy was largely based on tourism. In the early 1900s, the town was home to several hotels, restaurants, and stores.
Geography
Rockville is located in the southwestern corner of Utah, in the United States. It is situated in the heart of Zion National Park, and is the gateway to the park. The town is surrounded by stunning red rock formations, and is located at the confluence of the Virgin River and the East Fork of the Virgin River.
The town is located at an elevation of 4,000 feet, and has a semi-arid climate. The average annual temperature is around 60 degrees Fahrenheit, and the average annual precipitation is around 10 inches.
Economy
The economy of Rockville is largely based on tourism. The town is a popular destination for visitors to Zion National Park, and there are several hotels, restaurants, and stores in the town. The town also has a few small businesses, such as a gas station and a grocery store.
Demographics
The population of Rockville was estimated to be just over 200 people in 2020. The town is predominantly white, with a small Hispanic population. The median household income is around $50,000, and the median home value is around $200,000.
Conclusion
Rockville is a small town located in the southwestern corner of Utah, in the United States. It is situated in the heart of Zion National Park, and is the gateway to the park. The town is known for its stunning scenery, and is a popular tourist destination. The economy of Rockville is largely based on tourism, and the population of the town was estimated to be just over 200 people in 2020.
Common Questions
What is the Total Population of Rockville?
Total Population of Rockville is 180.
What is the Total Male Population of Rockville?
Total Male Population of Rockville is 95.
What is the Total Female Population of Rockville?
Total Female Population of Rockville is 85.
What is the Ratio of Males per 100 Females in Rockville?
There are 111.76 Males per 100 Females in Rockville.
What is the Ratio of Females per 100 Males in Rockville?
There are 89.47 Females per 100 Males in Rockville.
What is the Median Population Age in Rockville?
Median Population Age in Rockville is 66.3 Years.
What is the Average Family Size in Rockville
Average Family Size in Rockville is 2.8 People.
What is the Average Household Size in Rockville
Average Household Size in Rockville is 1.7 People.
What is Per Capita Income in Rockville?
Per Capita income in Rockville is $36,360.
What is the Median Family Income in Rockville?
Median Family Income in Rockville is $87,000.
What is the Median Household income in Rockville?
Median Household Income in Rockville is $48,438.
What is Income or Wage Gap in Rockville?
Income or Wage Gap in Rockville is 63.5%.
Women in Rockville earn 36.5 cents for every dollar earned by a man.
What is Inequality or Gini Index in Rockville?
Inequality or Gini Index in Rockville is 0.37.
How Large is the Labor Force in Rockville?
There are 68 People in the Labor Forcein in Rockville.
What is the Percentage of People in the Labor Force in Rockville?
41.7% of People are in the Labor Force in Rockville.