Forest Park, OK
Forest Park Map
Forest Park Overview
881
TOTAL POPULATION
358
MALE POPULATION
523
FEMALE POPULATION
68.45
MALES / 100 FEMALES
146.09
FEMALES / 100 MALES
62.6
MEDIAN AGE
2.9
AVG FAMILY SIZE
2.5
AVG HOUSEHOLD SIZE
$47,659
PER CAPITA INCOME
$98,750
AVG FAMILY INCOME
$96,250
AVG HOUSEHOLD INCOME
13.4%
WAGE / INCOME GAP [ % ]
86.6¢/ $1
WAGE / INCOME GAP [ $ ]
0.29
INEQUALITY / GINI INDEX
409
LABOR FORCE [ PEOPLE ]
50.6%
PERCENT IN LABOR FORCE
1.2%
UNEMPLOYMENT RATE
Forest Park Area Codes
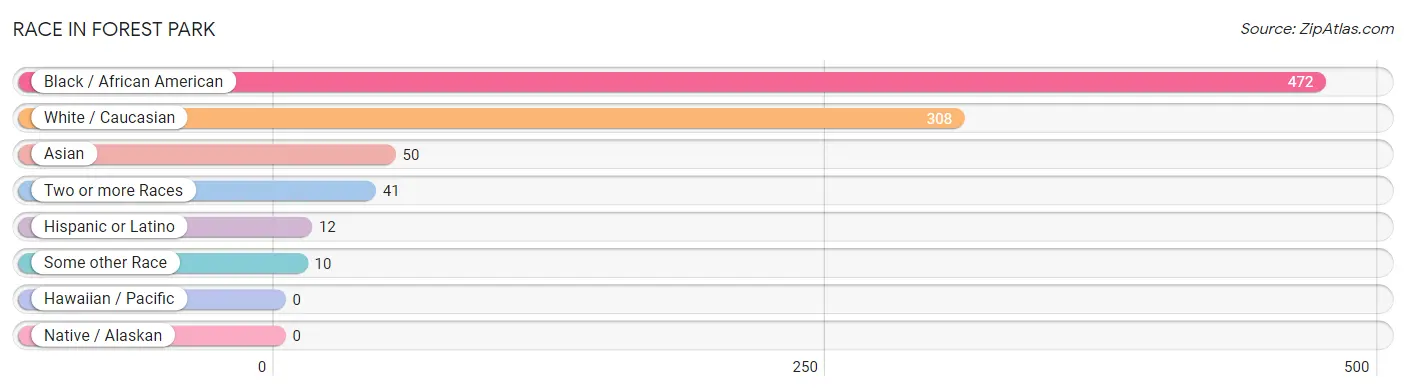
Race in Forest Park
The most populous races in Forest Park are Black / African American (472 | 53.6%), White / Caucasian (308 | 35.0%), and Asian (50 | 5.7%).
| Race | # Population | % Population |
| Asian | 50 | 5.7% |
| Black / African American | 472 | 53.6% |
| Hawaiian / Pacific | 0 | 0.0% |
| Hispanic or Latino | 12 | 1.4% |
| Native / Alaskan | 0 | 0.0% |
| White / Caucasian | 308 | 35.0% |
| Two or more Races | 41 | 4.6% |
| Some other Race | 10 | 1.1% |
| Total | 881 | 100.0% |
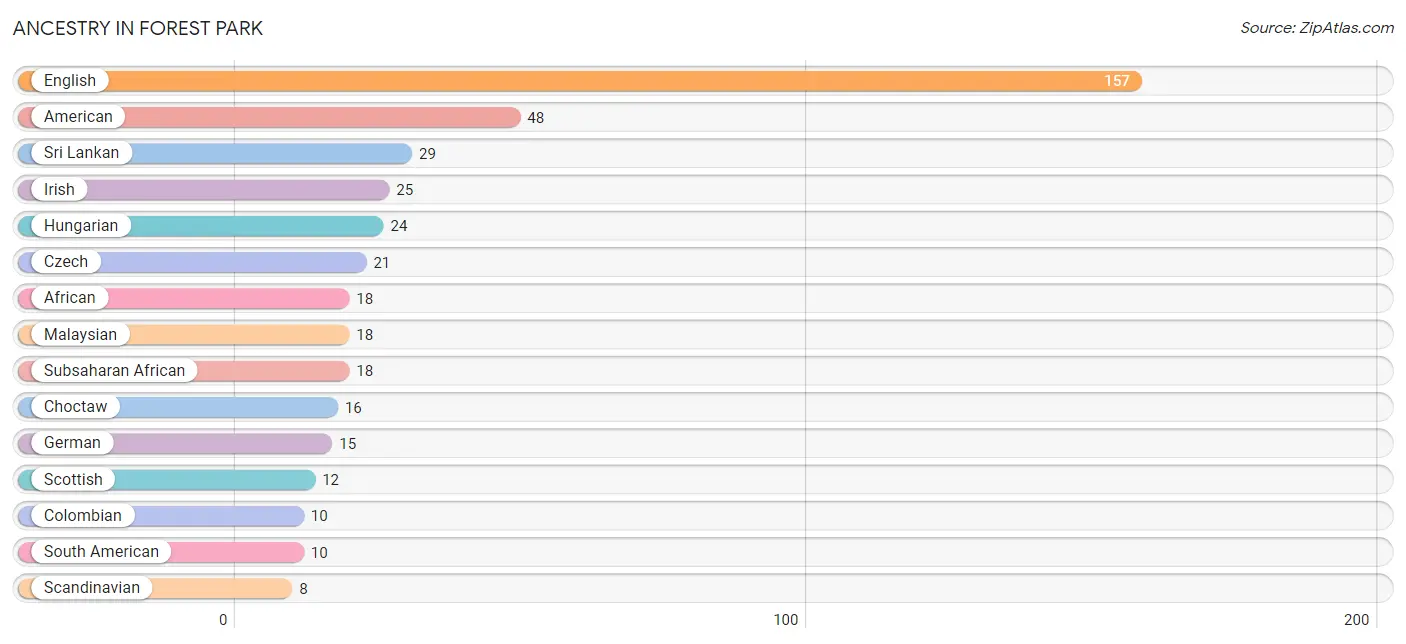
Ancestry in Forest Park
The most populous ancestries reported in Forest Park are English (157 | 17.8%), American (48 | 5.4%), Sri Lankan (29 | 3.3%), Irish (25 | 2.8%), and Hungarian (24 | 2.7%), together accounting for 32.1% of all Forest Park residents.
| Ancestry | # Population | % Population |
| African | 18 | 2.0% |
| American | 48 | 5.4% |
| British | 6 | 0.7% |
| Canadian | 3 | 0.3% |
| Choctaw | 16 | 1.8% |
| Colombian | 10 | 1.1% |
| Creek | 4 | 0.4% |
| Czech | 21 | 2.4% |
| English | 157 | 17.8% |
| European | 4 | 0.4% |
| French | 4 | 0.4% |
| German | 15 | 1.7% |
| Hungarian | 24 | 2.7% |
| Indian (Asian) | 3 | 0.3% |
| Irish | 25 | 2.8% |
| Malaysian | 18 | 2.0% |
| Mexican | 2 | 0.2% |
| Norwegian | 6 | 0.7% |
| Scandinavian | 8 | 0.9% |
| Scotch-Irish | 1 | 0.1% |
| Scottish | 12 | 1.4% |
| Seminole | 5 | 0.6% |
| South American | 10 | 1.1% |
| Sri Lankan | 29 | 3.3% |
| Subsaharan African | 18 | 2.0% | View All 25 Rows |
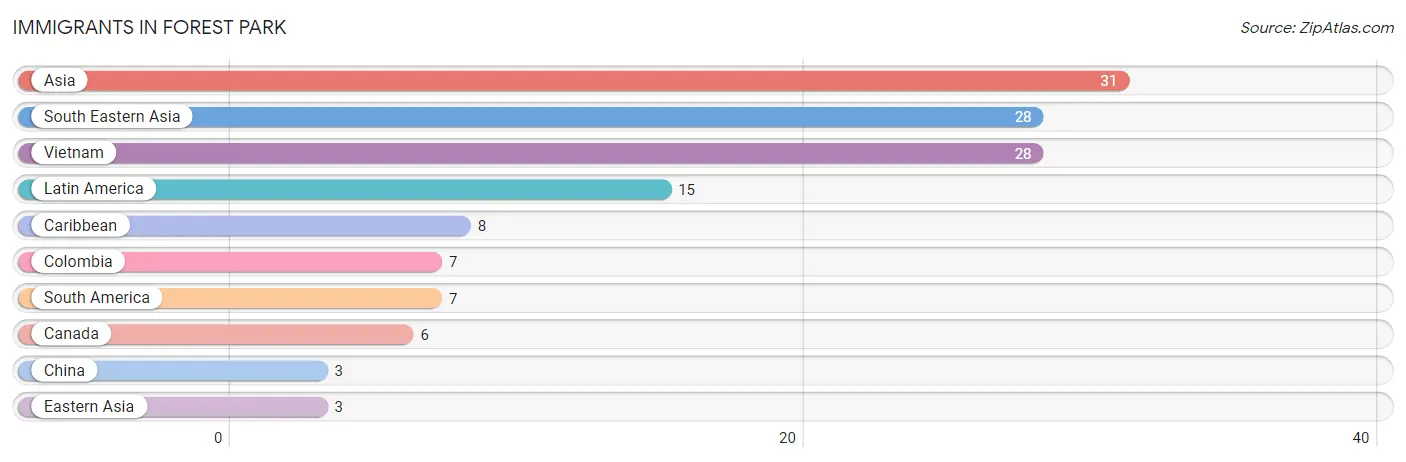
Immigrants in Forest Park
The most numerous immigrant groups reported in Forest Park came from Asia (31 | 3.5%), South Eastern Asia (28 | 3.2%), Vietnam (28 | 3.2%), Latin America (15 | 1.7%), and Caribbean (8 | 0.9%), together accounting for 12.5% of all Forest Park residents.
| Immigration Origin | # Population | % Population |
| Asia | 31 | 3.5% |
| Canada | 6 | 0.7% |
| Caribbean | 8 | 0.9% |
| China | 3 | 0.3% |
| Colombia | 7 | 0.8% |
| Eastern Asia | 3 | 0.3% |
| Latin America | 15 | 1.7% |
| South America | 7 | 0.8% |
| South Eastern Asia | 28 | 3.2% |
| Vietnam | 28 | 3.2% | View All 10 Rows |
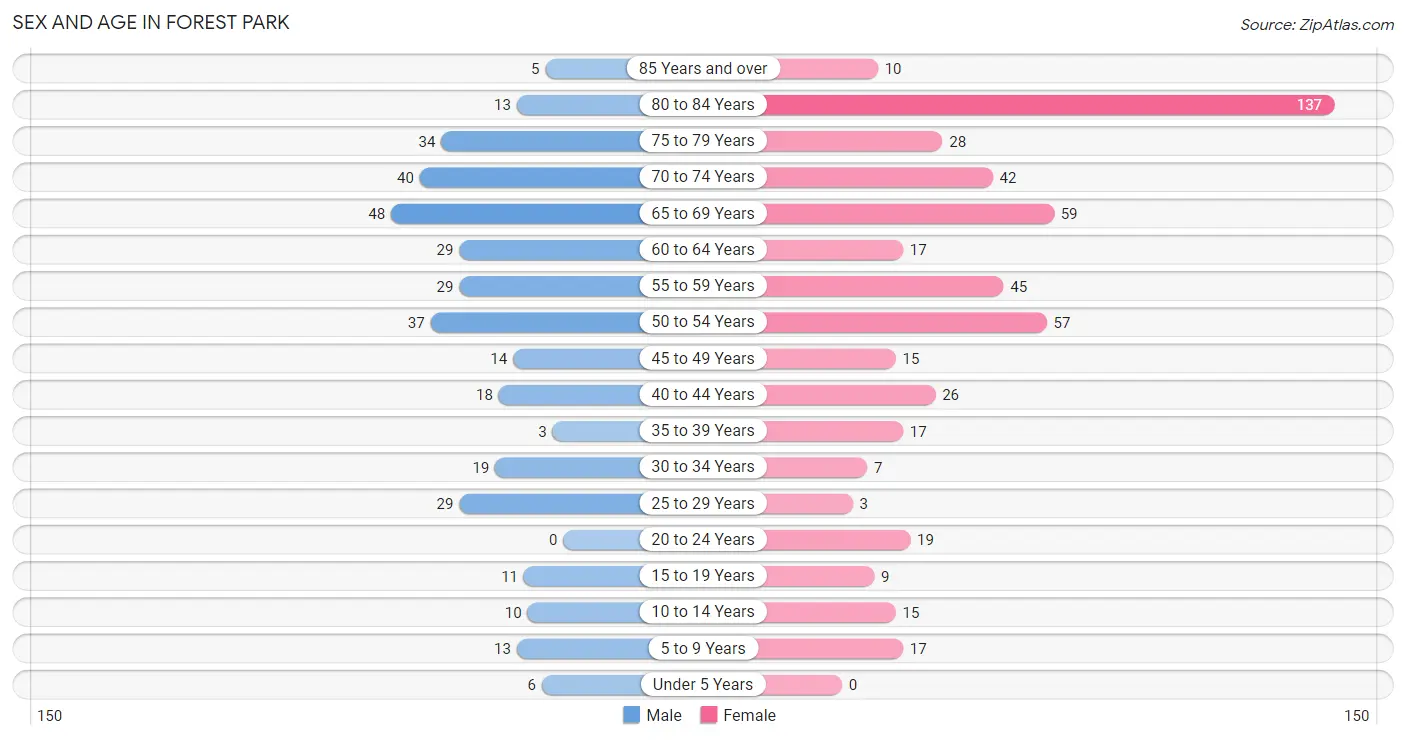
Sex and Age in Forest Park
Sex and Age in Forest Park
The most populous age groups in Forest Park are 65 to 69 Years (48 | 13.4%) for men and 80 to 84 Years (137 | 26.2%) for women.
| Age Bracket | Male | Female |
| Under 5 Years | 6 (1.7%) | 0 (0.0%) |
| 5 to 9 Years | 13 (3.6%) | 17 (3.3%) |
| 10 to 14 Years | 10 (2.8%) | 15 (2.9%) |
| 15 to 19 Years | 11 (3.1%) | 9 (1.7%) |
| 20 to 24 Years | 0 (0.0%) | 19 (3.6%) |
| 25 to 29 Years | 29 (8.1%) | 3 (0.6%) |
| 30 to 34 Years | 19 (5.3%) | 7 (1.3%) |
| 35 to 39 Years | 3 (0.8%) | 17 (3.3%) |
| 40 to 44 Years | 18 (5.0%) | 26 (5.0%) |
| 45 to 49 Years | 14 (3.9%) | 15 (2.9%) |
| 50 to 54 Years | 37 (10.3%) | 57 (10.9%) |
| 55 to 59 Years | 29 (8.1%) | 45 (8.6%) |
| 60 to 64 Years | 29 (8.1%) | 17 (3.3%) |
| 65 to 69 Years | 48 (13.4%) | 59 (11.3%) |
| 70 to 74 Years | 40 (11.2%) | 42 (8.0%) |
| 75 to 79 Years | 34 (9.5%) | 28 (5.3%) |
| 80 to 84 Years | 13 (3.6%) | 137 (26.2%) |
| 85 Years and over | 5 (1.4%) | 10 (1.9%) |
| Total | 358 (100.0%) | 523 (100.0%) |
Families and Households in Forest Park
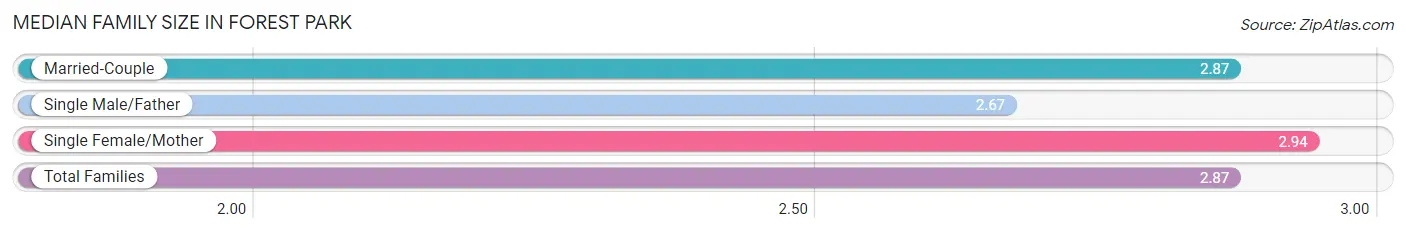
Median Family Size in Forest Park
The median family size in Forest Park is 2.87 persons per family, with single female/mother families (32 | 12.2%) accounting for the largest median family size of 2.94 persons per family. On the other hand, single male/father families (6 | 2.3%) represent the smallest median family size with 2.67 persons per family.
| Family Type | # Families | Family Size |
| Married-Couple | 224 (85.5%) | 2.87 |
| Single Male/Father | 6 (2.3%) | 2.67 |
| Single Female/Mother | 32 (12.2%) | 2.94 |
| Total Families | 262 (100.0%) | 2.87 |
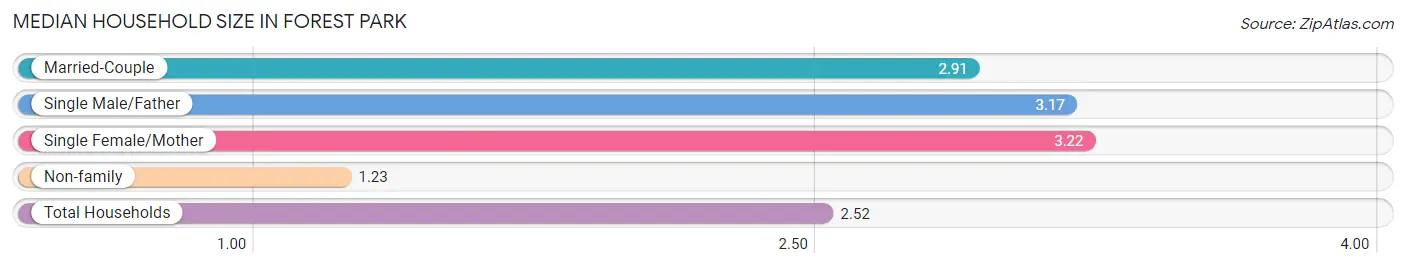
Median Household Size in Forest Park
The median household size in Forest Park is 2.52 persons per household, with single female/mother households (32 | 9.2%) accounting for the largest median household size of 3.22 persons per household. non-family households (87 | 24.9%) represent the smallest median household size with 1.23 persons per household.
| Household Type | # Households | Household Size |
| Married-Couple | 224 (64.2%) | 2.91 |
| Single Male/Father | 6 (1.7%) | 3.17 |
| Single Female/Mother | 32 (9.2%) | 3.22 |
| Non-family | 87 (24.9%) | 1.23 |
| Total Households | 349 (100.0%) | 2.52 |
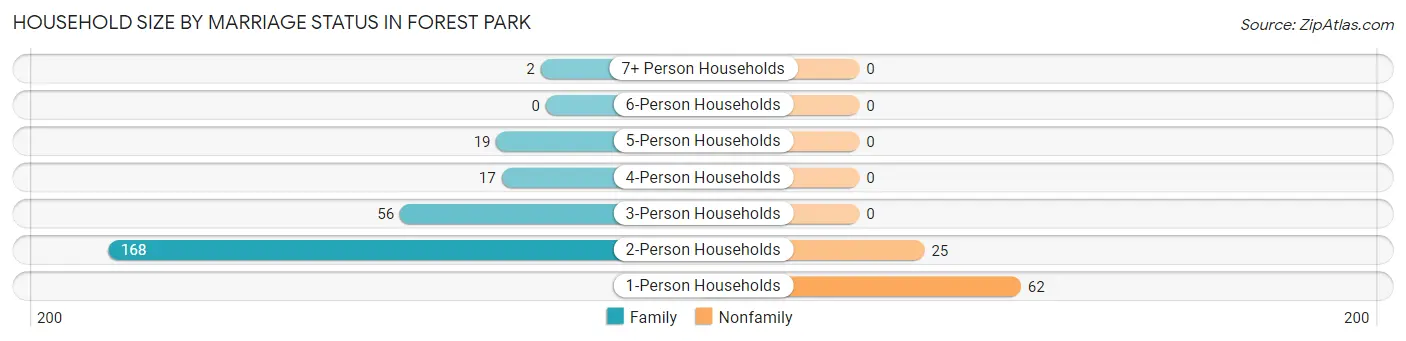
Household Size by Marriage Status in Forest Park
Out of a total of 349 households in Forest Park, 262 (75.1%) are family households, while 87 (24.9%) are nonfamily households. The most numerous type of family households are 2-person households, comprising 168, and the most common type of nonfamily households are 1-person households, comprising 62.
| Household Size | Family Households | Nonfamily Households |
| 1-Person Households | - | 62 (17.8%) |
| 2-Person Households | 168 (48.1%) | 25 (7.2%) |
| 3-Person Households | 56 (16.1%) | 0 (0.0%) |
| 4-Person Households | 17 (4.9%) | 0 (0.0%) |
| 5-Person Households | 19 (5.4%) | 0 (0.0%) |
| 6-Person Households | 0 (0.0%) | 0 (0.0%) |
| 7+ Person Households | 2 (0.6%) | 0 (0.0%) |
| Total | 262 (75.1%) | 87 (24.9%) |
Female Fertility in Forest Park
Fertility by Age in Forest Park
| Age Bracket | Women with Births | Births / 1,000 Women |
| 15 to 19 years | 0 (0.0%) | 0.0 |
| 20 to 34 years | 0 (0.0%) | 0.0 |
| 35 to 50 years | 0 (0.0%) | 0.0 |
| Total | 0 (0.0%) | 0.0 |
Fertility by Age by Marriage Status in Forest Park
| Age Bracket | Married | Unmarried |
| 15 to 19 years | 0 (0.0%) | 0 (0.0%) |
| 20 to 34 years | 0 (0.0%) | 0 (0.0%) |
| 35 to 50 years | 0 (0.0%) | 0 (0.0%) |
| Total | 0 (0.0%) | 0 (0.0%) |
Fertility by Education in Forest Park
| Educational Attainment | Women with Births | Births / 1,000 Women |
| Less than High School | 0 (0.0%) | 0.0 |
| High School Diploma | 0 (0.0%) | 0.0 |
| College or Associate's Degree | 0 (0.0%) | 0.0 |
| Bachelor's Degree | 0 (0.0%) | 0.0 |
| Graduate Degree | 0 (0.0%) | 0.0 |
| Total | 0 (0.0%) | 0.0 |
Fertility by Education by Marriage Status in Forest Park
| Educational Attainment | Married | Unmarried |
| Less than High School | 0 (0.0%) | 0 (0.0%) |
| High School Diploma | 0 (0.0%) | 0 (0.0%) |
| College or Associate's Degree | 0 (0.0%) | 0 (0.0%) |
| Bachelor's Degree | 0 (0.0%) | 0 (0.0%) |
| Graduate Degree | 0 (0.0%) | 0 (0.0%) |
| Total | 0 (0.0%) | 0 (0.0%) |
Income in Forest Park
Income Overview in Forest Park
Per Capita Income in Forest Park is $47,659, while median incomes of families and households are $98,750 and $96,250 respectively.
| Characteristic | Number | Measure |
| Per Capita Income | 881 | $47,659 |
| Median Family Income | 262 | $98,750 |
| Mean Family Income | 262 | $109,533 |
| Median Household Income | 349 | $96,250 |
| Mean Household Income | 349 | $107,423 |
| Income Deficit | 262 | $0 |
| Wage / Income Gap (%) | 881 | 13.37% |
| Wage / Income Gap ($) | 881 | 86.63¢ per $1 |
| Gini / Inequality Index | 881 | 0.29 |
Earnings by Sex in Forest Park
Average Earnings in Forest Park are $41,806, $42,708 for men and $37,000 for women, a difference of 13.4%.
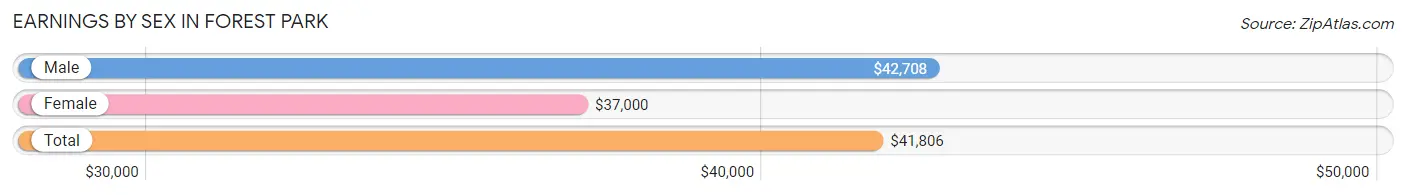
| Sex | Number | Average Earnings |
| Male | 195 (47.2%) | $42,708 |
| Female | 218 (52.8%) | $37,000 |
| Total | 413 (100.0%) | $41,806 |
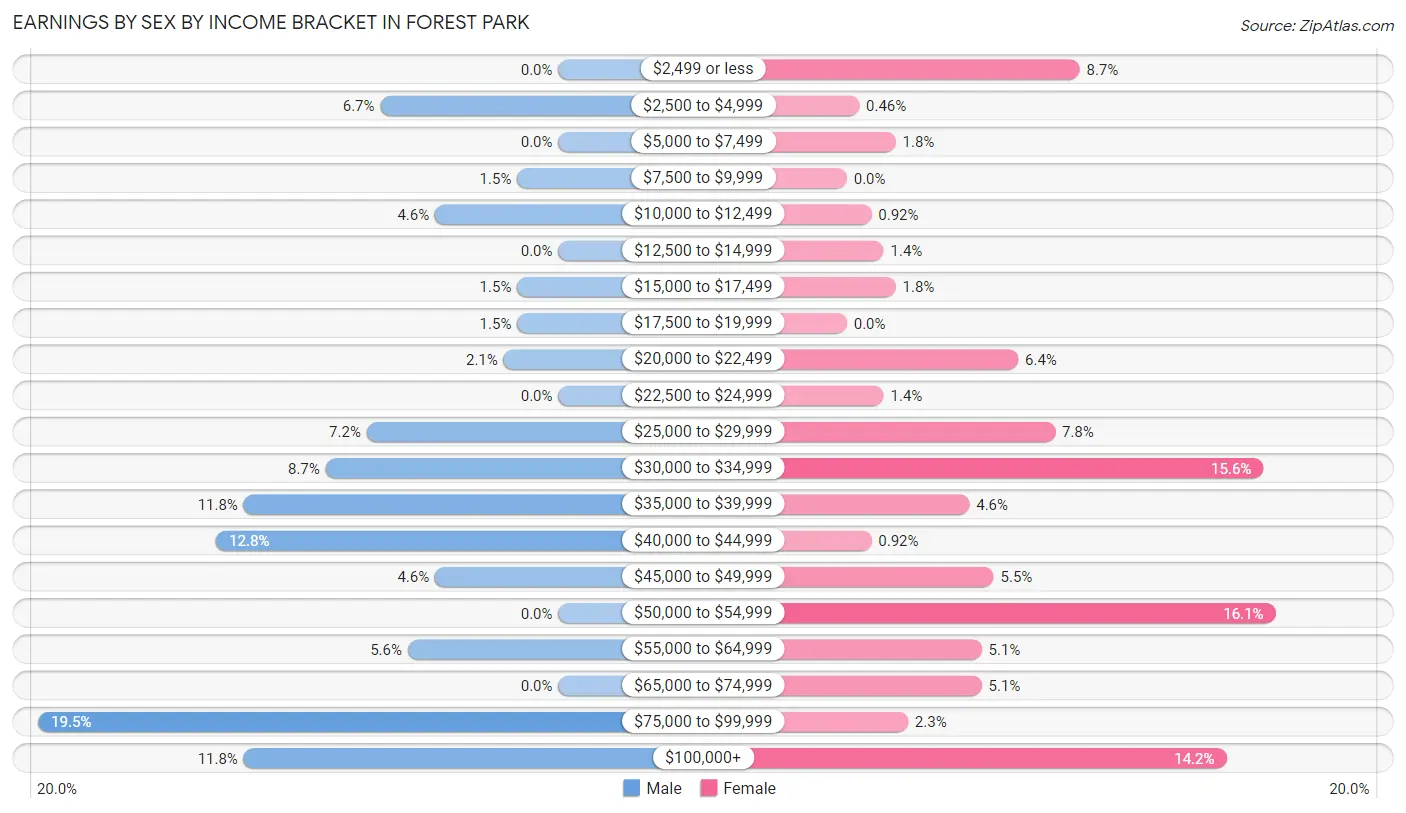
Earnings by Sex by Income Bracket in Forest Park
The most common earnings brackets in Forest Park are $75,000 to $99,999 for men (38 | 19.5%) and $50,000 to $54,999 for women (35 | 16.1%).
| Income | Male | Female |
| $2,499 or less | 0 (0.0%) | 19 (8.7%) |
| $2,500 to $4,999 | 13 (6.7%) | 1 (0.5%) |
| $5,000 to $7,499 | 0 (0.0%) | 4 (1.8%) |
| $7,500 to $9,999 | 3 (1.5%) | 0 (0.0%) |
| $10,000 to $12,499 | 9 (4.6%) | 2 (0.9%) |
| $12,500 to $14,999 | 0 (0.0%) | 3 (1.4%) |
| $15,000 to $17,499 | 3 (1.5%) | 4 (1.8%) |
| $17,500 to $19,999 | 3 (1.5%) | 0 (0.0%) |
| $20,000 to $22,499 | 4 (2.1%) | 14 (6.4%) |
| $22,500 to $24,999 | 0 (0.0%) | 3 (1.4%) |
| $25,000 to $29,999 | 14 (7.2%) | 17 (7.8%) |
| $30,000 to $34,999 | 17 (8.7%) | 34 (15.6%) |
| $35,000 to $39,999 | 23 (11.8%) | 10 (4.6%) |
| $40,000 to $44,999 | 25 (12.8%) | 2 (0.9%) |
| $45,000 to $49,999 | 9 (4.6%) | 12 (5.5%) |
| $50,000 to $54,999 | 0 (0.0%) | 35 (16.1%) |
| $55,000 to $64,999 | 11 (5.6%) | 11 (5.1%) |
| $65,000 to $74,999 | 0 (0.0%) | 11 (5.1%) |
| $75,000 to $99,999 | 38 (19.5%) | 5 (2.3%) |
| $100,000+ | 23 (11.8%) | 31 (14.2%) |
| Total | 195 (100.0%) | 218 (100.0%) |
Earnings by Sex by Educational Attainment in Forest Park
Average earnings in Forest Park are $42,708 for men and $45,833 for women, a difference of 6.8%. Men with an educational attainment of college or associate's degree enjoy the highest average annual earnings of $58,125, while those with high school diploma education earn the least with $38,967. Women with an educational attainment of graduate degree earn the most with the average annual earnings of $59,318, while those with high school diploma education have the smallest earnings of $30,972.
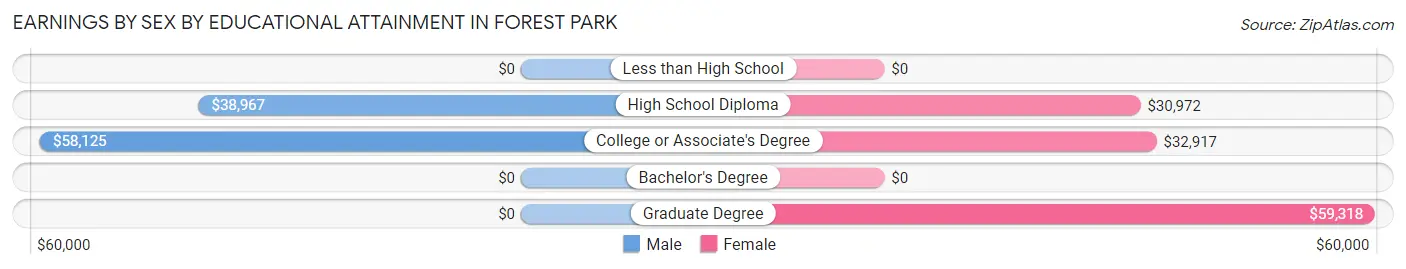
| Educational Attainment | Male Income | Female Income |
| Less than High School | - | - |
| High School Diploma | $38,967 | $30,972 |
| College or Associate's Degree | $58,125 | $32,917 |
| Bachelor's Degree | - | - |
| Graduate Degree | - | - |
| Total | $42,708 | $45,833 |
Family Income in Forest Park
Family Income Brackets in Forest Park
According to the Forest Park family income data, there are 81 families falling into the $100,000 to $149,999 income range, which is the most common income bracket and makes up 30.9% of all families.
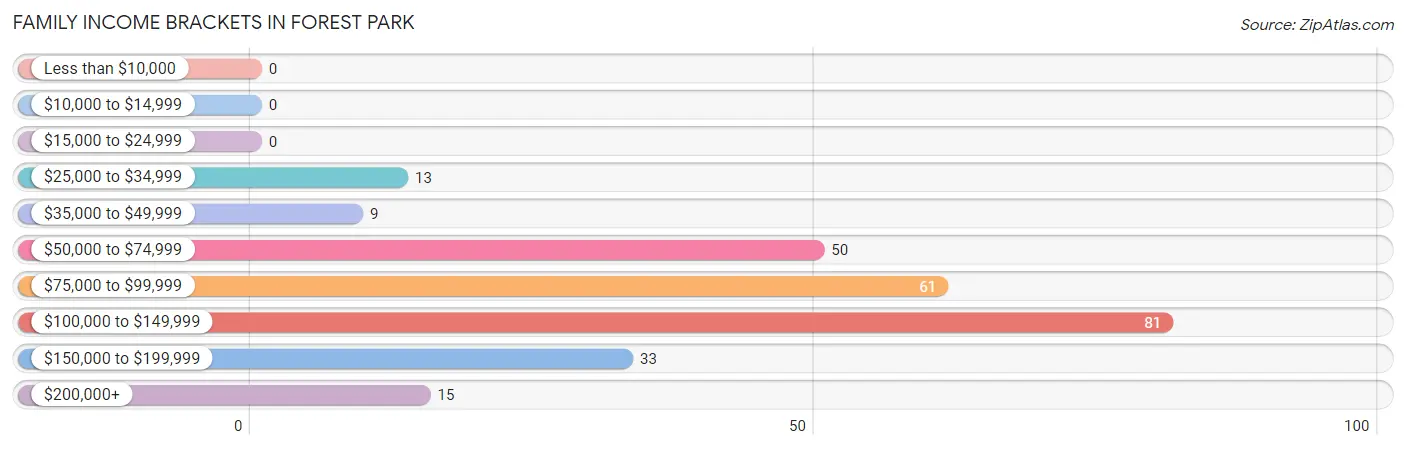
| Income Bracket | # Families | % Families |
| Less than $10,000 | 0 | 0.0% |
| $10,000 to $14,999 | 0 | 0.0% |
| $15,000 to $24,999 | 0 | 0.0% |
| $25,000 to $34,999 | 13 | 5.0% |
| $35,000 to $49,999 | 9 | 3.4% |
| $50,000 to $74,999 | 50 | 19.1% |
| $75,000 to $99,999 | 61 | 23.3% |
| $100,000 to $149,999 | 81 | 30.9% |
| $150,000 to $199,999 | 33 | 12.6% |
| $200,000+ | 15 | 5.7% |
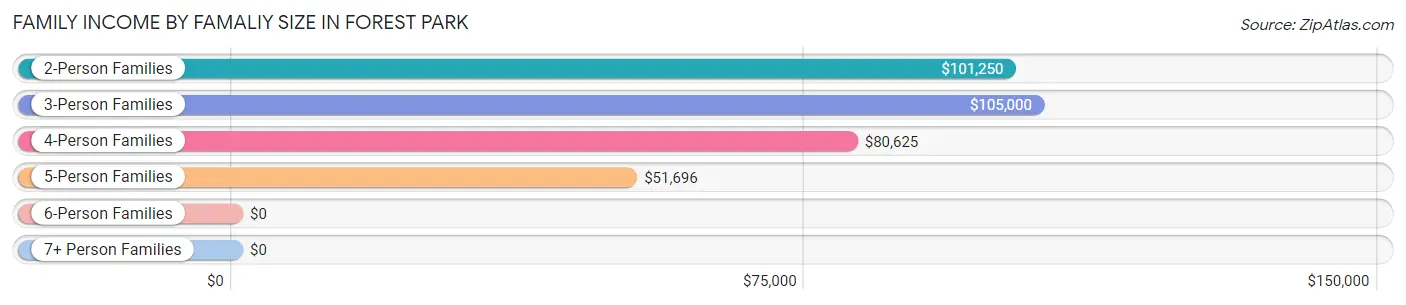
Family Income by Famaliy Size in Forest Park
3-person families (42 | 16.0%) account for the highest median family income in Forest Park with $105,000 per family, while 2-person families (185 | 70.6%) have the highest median income of $50,625 per family member.
| Income Bracket | # Families | Median Income |
| 2-Person Families | 185 (70.6%) | $101,250 |
| 3-Person Families | 42 (16.0%) | $105,000 |
| 4-Person Families | 14 (5.3%) | $80,625 |
| 5-Person Families | 19 (7.2%) | $51,696 |
| 6-Person Families | 0 (0.0%) | $0 |
| 7+ Person Families | 2 (0.8%) | $0 |
| Total | 262 (100.0%) | $98,750 |
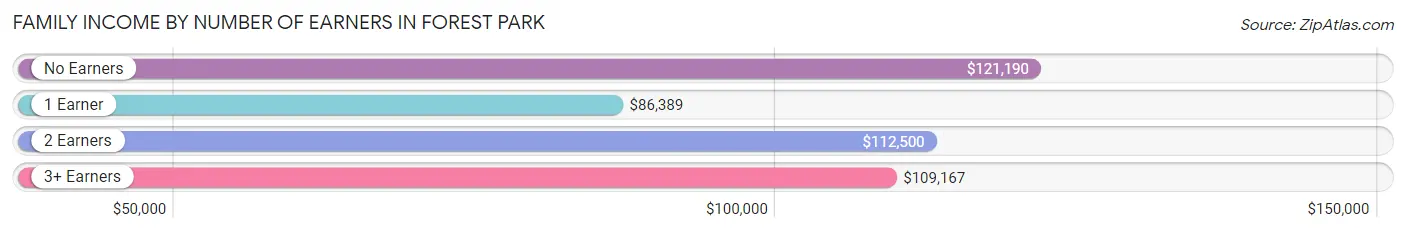
Family Income by Number of Earners in Forest Park
The median family income in Forest Park is $98,750, with families comprising no earners (68) having the highest median family income of $121,190, while families with 1 earner (98) have the lowest median family income of $86,389, accounting for 26.0% and 37.4% of families, respectively.
| Number of Earners | # Families | Median Income |
| No Earners | 68 (26.0%) | $121,190 |
| 1 Earner | 98 (37.4%) | $86,389 |
| 2 Earners | 70 (26.7%) | $112,500 |
| 3+ Earners | 26 (9.9%) | $109,167 |
| Total | 262 (100.0%) | $98,750 |
Household Income in Forest Park
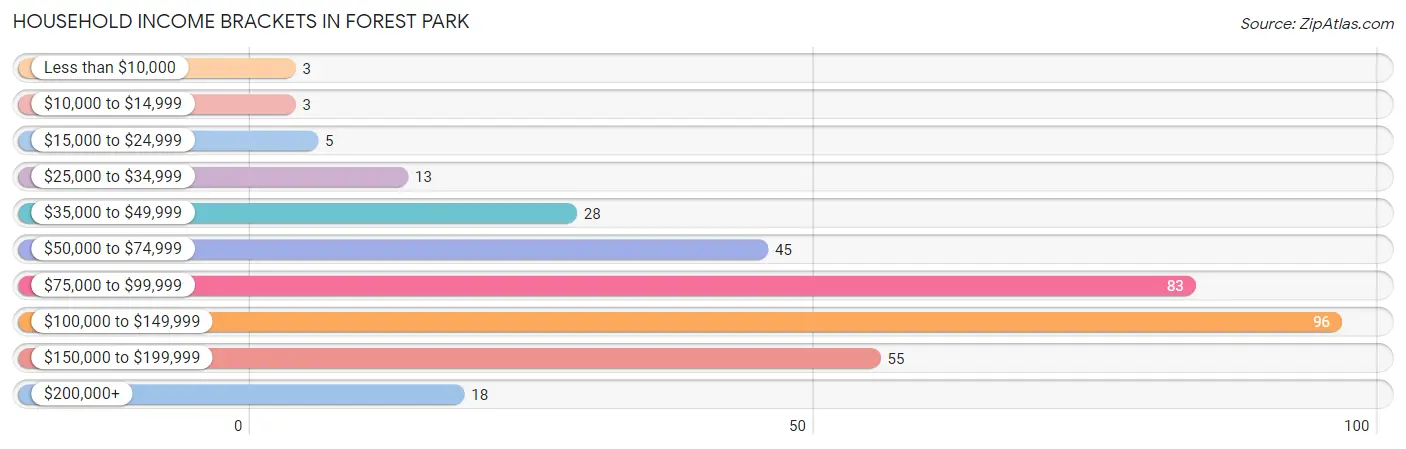
Household Income Brackets in Forest Park
With 96 households falling in the category, the $100,000 to $149,999 income range is the most frequent in Forest Park, accounting for 27.5% of all households. In contrast, only 3 households (0.9%) fall into the less than $10,000 income bracket, making it the least populous group.
| Income Bracket | # Households | % Households |
| Less than $10,000 | 3 | 0.9% |
| $10,000 to $14,999 | 3 | 0.9% |
| $15,000 to $24,999 | 5 | 1.4% |
| $25,000 to $34,999 | 13 | 3.7% |
| $35,000 to $49,999 | 28 | 8.0% |
| $50,000 to $74,999 | 45 | 12.9% |
| $75,000 to $99,999 | 83 | 23.8% |
| $100,000 to $149,999 | 96 | 27.5% |
| $150,000 to $199,999 | 55 | 15.8% |
| $200,000+ | 18 | 5.2% |
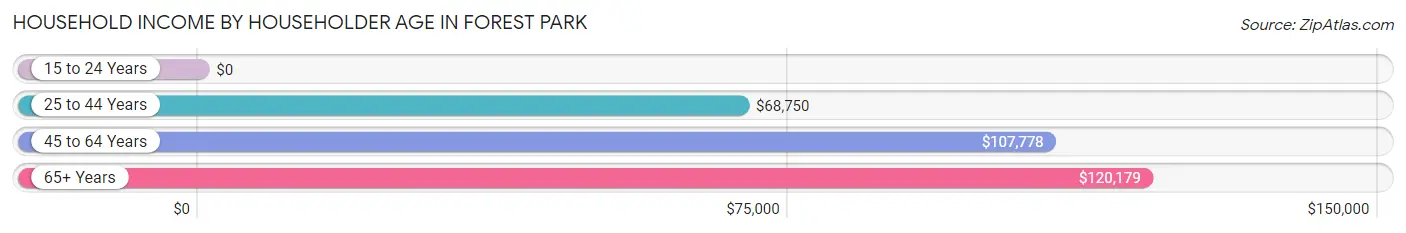
Household Income by Householder Age in Forest Park
The median household income in Forest Park is $96,250, with the highest median household income of $120,179 found in the 65+ years age bracket for the primary householder. A total of 191 households (54.7%) fall into this category.
| Income Bracket | # Households | Median Income |
| 15 to 24 Years | 0 (0.0%) | $0 |
| 25 to 44 Years | 36 (10.3%) | $68,750 |
| 45 to 64 Years | 122 (35.0%) | $107,778 |
| 65+ Years | 191 (54.7%) | $120,179 |
| Total | 349 (100.0%) | $96,250 |
Poverty in Forest Park
Income Below Poverty by Sex and Age in Forest Park
With 0.9% poverty level for males and 1.7% for females among the residents of Forest Park, 45 to 54 year old males and 25 to 34 year old females are the most vulnerable to poverty, with 3 males (5.9%) and 3 females (30.0%) in their respective age groups living below the poverty level.
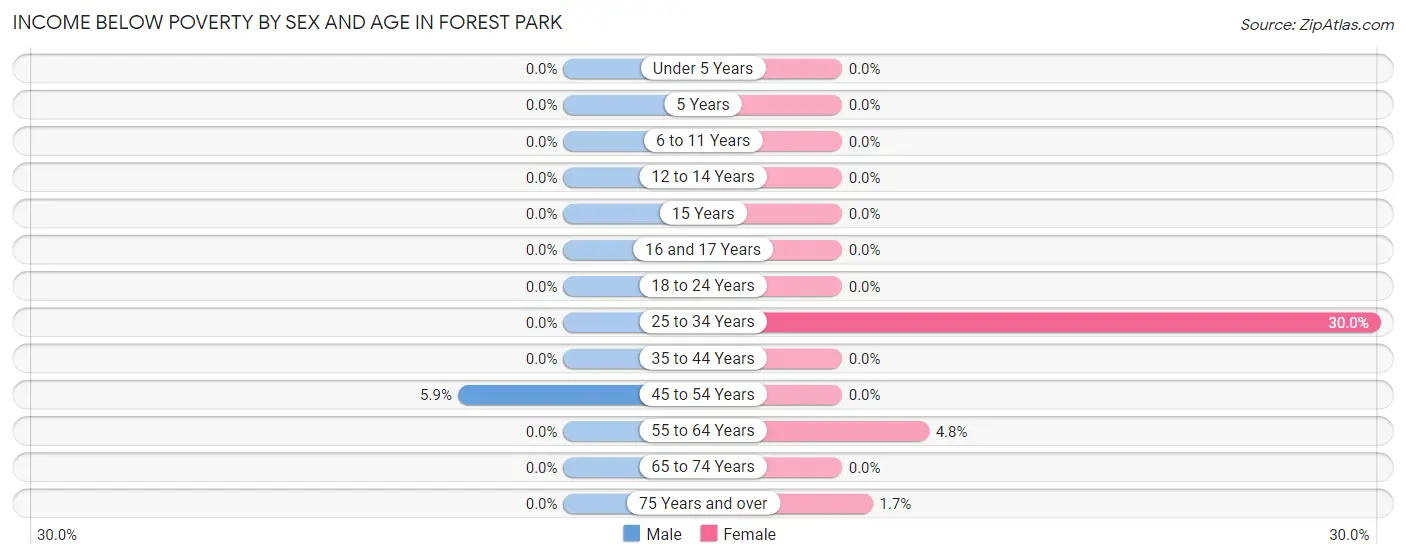
| Age Bracket | Male | Female |
| Under 5 Years | 0 (0.0%) | 0 (0.0%) |
| 5 Years | 0 (0.0%) | 0 (0.0%) |
| 6 to 11 Years | 0 (0.0%) | 0 (0.0%) |
| 12 to 14 Years | 0 (0.0%) | 0 (0.0%) |
| 15 Years | 0 (0.0%) | 0 (0.0%) |
| 16 and 17 Years | 0 (0.0%) | 0 (0.0%) |
| 18 to 24 Years | 0 (0.0%) | 0 (0.0%) |
| 25 to 34 Years | 0 (0.0%) | 3 (30.0%) |
| 35 to 44 Years | 0 (0.0%) | 0 (0.0%) |
| 45 to 54 Years | 3 (5.9%) | 0 (0.0%) |
| 55 to 64 Years | 0 (0.0%) | 3 (4.8%) |
| 65 to 74 Years | 0 (0.0%) | 0 (0.0%) |
| 75 Years and over | 0 (0.0%) | 3 (1.7%) |
| Total | 3 (0.9%) | 9 (1.7%) |
Income Above Poverty by Sex and Age in Forest Park
According to the poverty statistics in Forest Park, males aged under 5 years and females aged 6 to 11 years are the age groups that are most secure financially, with 100.0% of males and 100.0% of females in these age groups living above the poverty line.
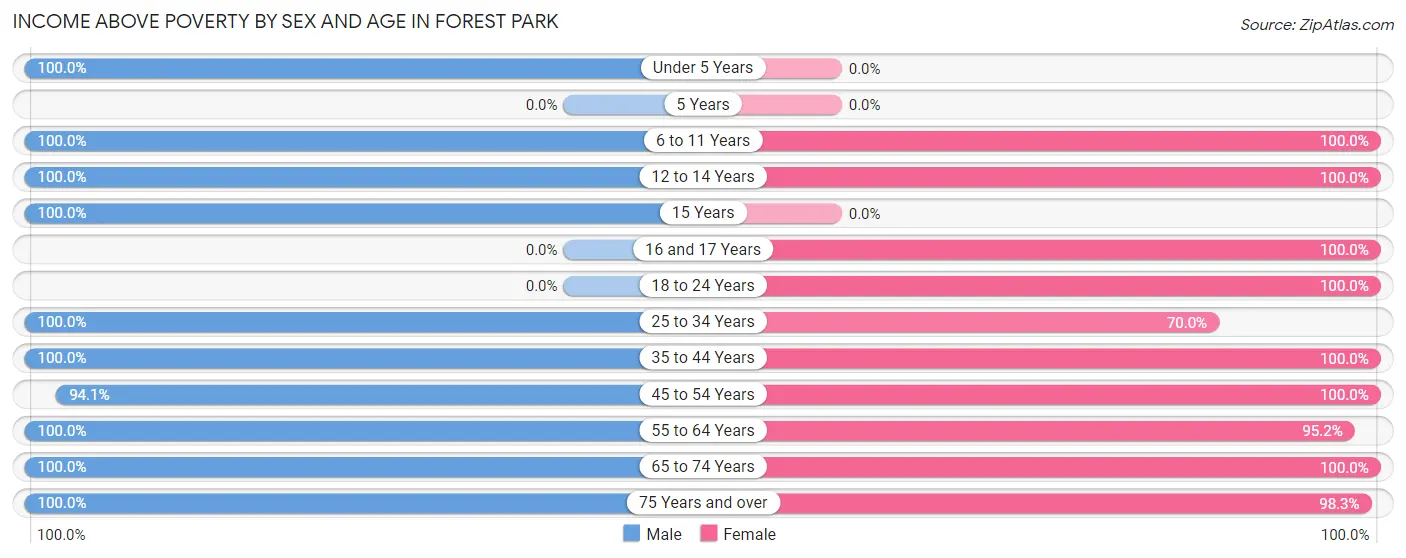
| Age Bracket | Male | Female |
| Under 5 Years | 6 (100.0%) | 0 (0.0%) |
| 5 Years | 0 (0.0%) | 0 (0.0%) |
| 6 to 11 Years | 15 (100.0%) | 26 (100.0%) |
| 12 to 14 Years | 5 (100.0%) | 3 (100.0%) |
| 15 Years | 11 (100.0%) | 0 (0.0%) |
| 16 and 17 Years | 0 (0.0%) | 4 (100.0%) |
| 18 to 24 Years | 0 (0.0%) | 24 (100.0%) |
| 25 to 34 Years | 48 (100.0%) | 7 (70.0%) |
| 35 to 44 Years | 21 (100.0%) | 43 (100.0%) |
| 45 to 54 Years | 48 (94.1%) | 72 (100.0%) |
| 55 to 64 Years | 58 (100.0%) | 59 (95.2%) |
| 65 to 74 Years | 88 (100.0%) | 101 (100.0%) |
| 75 Years and over | 52 (100.0%) | 172 (98.3%) |
| Total | 352 (99.2%) | 511 (98.3%) |
Income Below Poverty Among Married-Couple Families in Forest Park
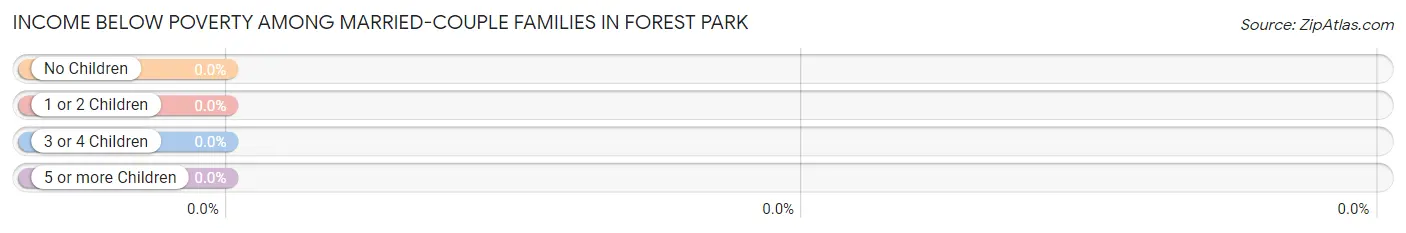
| Children | Above Poverty | Below Poverty |
| No Children | 199 (100.0%) | 0 (0.0%) |
| 1 or 2 Children | 11 (100.0%) | 0 (0.0%) |
| 3 or 4 Children | 14 (100.0%) | 0 (0.0%) |
| 5 or more Children | 0 (0.0%) | 0 (0.0%) |
| Total | 224 (100.0%) | 0 (0.0%) |
Income Below Poverty Among Single-Parent Households in Forest Park
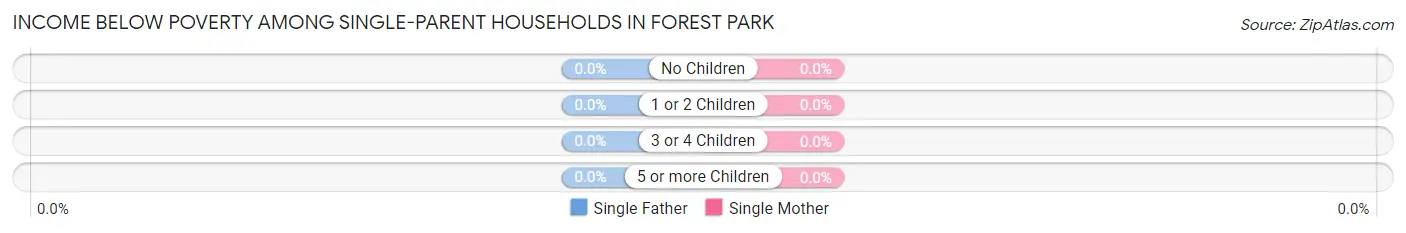
| Children | Single Father | Single Mother |
| No Children | 0 (0.0%) | 0 (0.0%) |
| 1 or 2 Children | 0 (0.0%) | 0 (0.0%) |
| 3 or 4 Children | 0 (0.0%) | 0 (0.0%) |
| 5 or more Children | 0 (0.0%) | 0 (0.0%) |
| Total | 0 (0.0%) | 0 (0.0%) |
Income Below Poverty Among Married-Couple vs Single-Parent Households in Forest Park
| Children | Married-Couple Families | Single-Parent Households |
| No Children | 0 (0.0%) | 0 (0.0%) |
| 1 or 2 Children | 0 (0.0%) | 0 (0.0%) |
| 3 or 4 Children | 0 (0.0%) | 0 (0.0%) |
| 5 or more Children | 0 (0.0%) | 0 (0.0%) |
| Total | 0 (0.0%) | 0 (0.0%) |
Employment Characteristics in Forest Park
Employment by Class of Employer in Forest Park
Among the 401 employed individuals in Forest Park, private company employees (197 | 49.1%), local government employees (63 | 15.7%), and federal government employees (63 | 15.7%) make up the most common classes of employment.
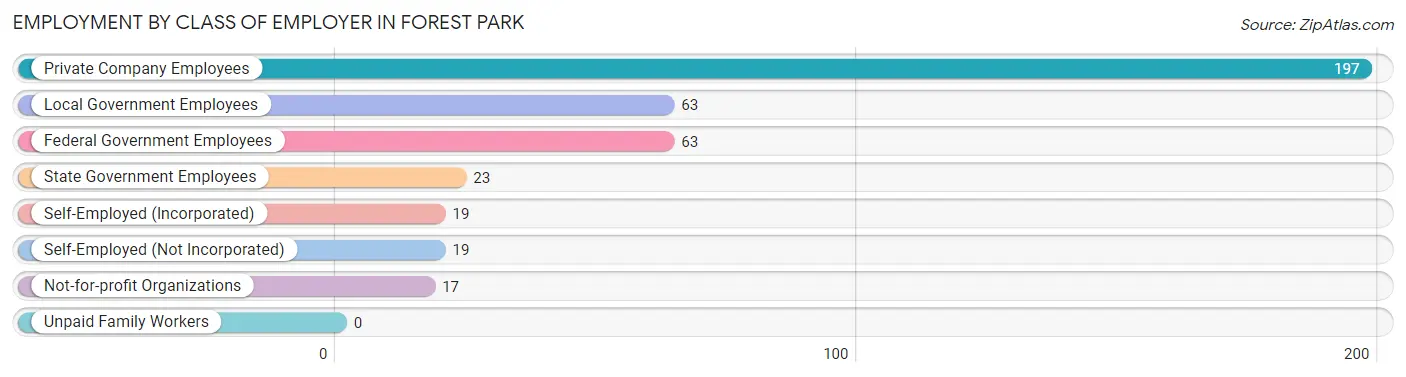
| Employer Class | # Employees | % Employees |
| Private Company Employees | 197 | 49.1% |
| Self-Employed (Incorporated) | 19 | 4.7% |
| Self-Employed (Not Incorporated) | 19 | 4.7% |
| Not-for-profit Organizations | 17 | 4.2% |
| Local Government Employees | 63 | 15.7% |
| State Government Employees | 23 | 5.7% |
| Federal Government Employees | 63 | 15.7% |
| Unpaid Family Workers | 0 | 0.0% |
| Total | 401 | 100.0% |
Employment Status by Age in Forest Park
According to the labor force statistics for Forest Park, out of the total population over 16 years of age (809), 50.6% or 409 individuals are in the labor force, with 1.2% or 5 of them unemployed. The age group with the highest labor force participation rate is 25 to 29 years, with 93.8% or 30 individuals in the labor force. Within the labor force, the 25 to 29 years age range has the highest percentage of unemployed individuals, with 16.7% or 5 of them being unemployed.
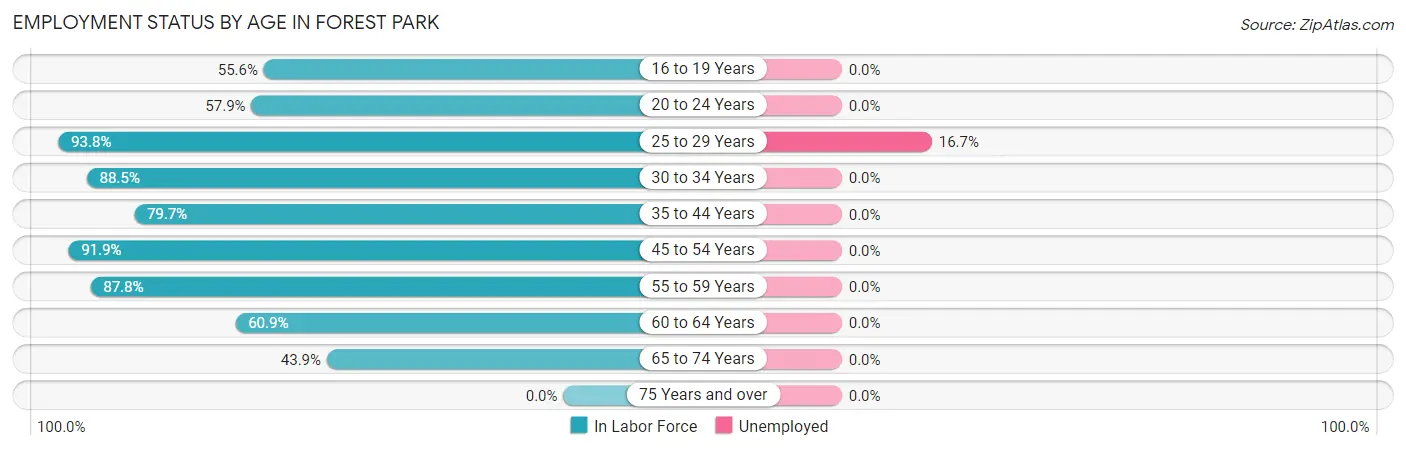
| Age Bracket | In Labor Force | Unemployed |
| 16 to 19 Years | 5 (55.6%) | 0 (0.0%) |
| 20 to 24 Years | 11 (57.9%) | 0 (0.0%) |
| 25 to 29 Years | 30 (93.8%) | 5 (16.7%) |
| 30 to 34 Years | 23 (88.5%) | 0 (0.0%) |
| 35 to 44 Years | 51 (79.7%) | 0 (0.0%) |
| 45 to 54 Years | 113 (91.9%) | 0 (0.0%) |
| 55 to 59 Years | 65 (87.8%) | 0 (0.0%) |
| 60 to 64 Years | 28 (60.9%) | 0 (0.0%) |
| 65 to 74 Years | 83 (43.9%) | 0 (0.0%) |
| 75 Years and over | 0 (0.0%) | 0 (0.0%) |
| Total | 409 (50.6%) | 5 (1.2%) |
Employment Status by Educational Attainment in Forest Park
According to labor force statistics for Forest Park, 84.9% of individuals (310) out of the total population between 25 and 64 years of age (365) are in the labor force, with 1.6% or 5 of them being unemployed. The group with the highest labor force participation rate are those with the educational attainment of college / associate degree, with 95.6% or 129 individuals in the labor force. Within the labor force, individuals with less than high school education have the highest percentage of unemployment, with 29.4% or 5 of them being unemployed.
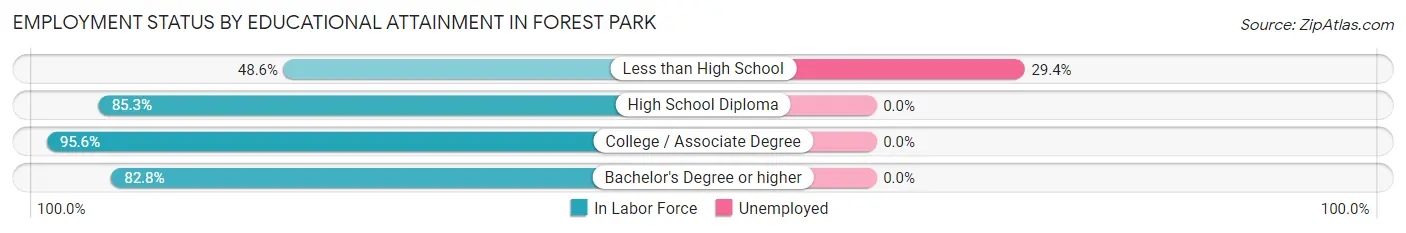
| Educational Attainment | In Labor Force | Unemployed |
| Less than High School | 17 (48.6%) | 10 (29.4%) |
| High School Diploma | 87 (85.3%) | 0 (0.0%) |
| College / Associate Degree | 129 (95.6%) | 0 (0.0%) |
| Bachelor's Degree or higher | 77 (82.8%) | 0 (0.0%) |
| Total | 310 (84.9%) | 6 (1.6%) |
Employment Occupations by Sex in Forest Park
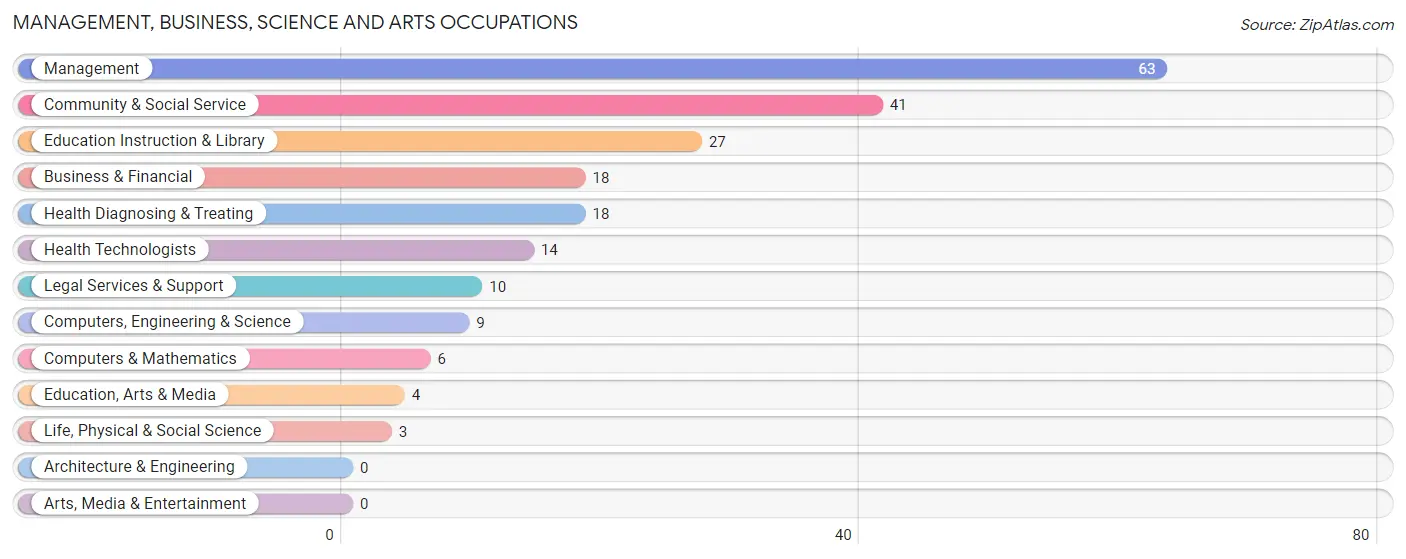
Management, Business, Science and Arts Occupations
The most common Management, Business, Science and Arts occupations in Forest Park are Management (63 | 15.6%), Community & Social Service (41 | 10.2%), Education Instruction & Library (27 | 6.7%), Business & Financial (18 | 4.5%), and Health Diagnosing & Treating (18 | 4.5%).
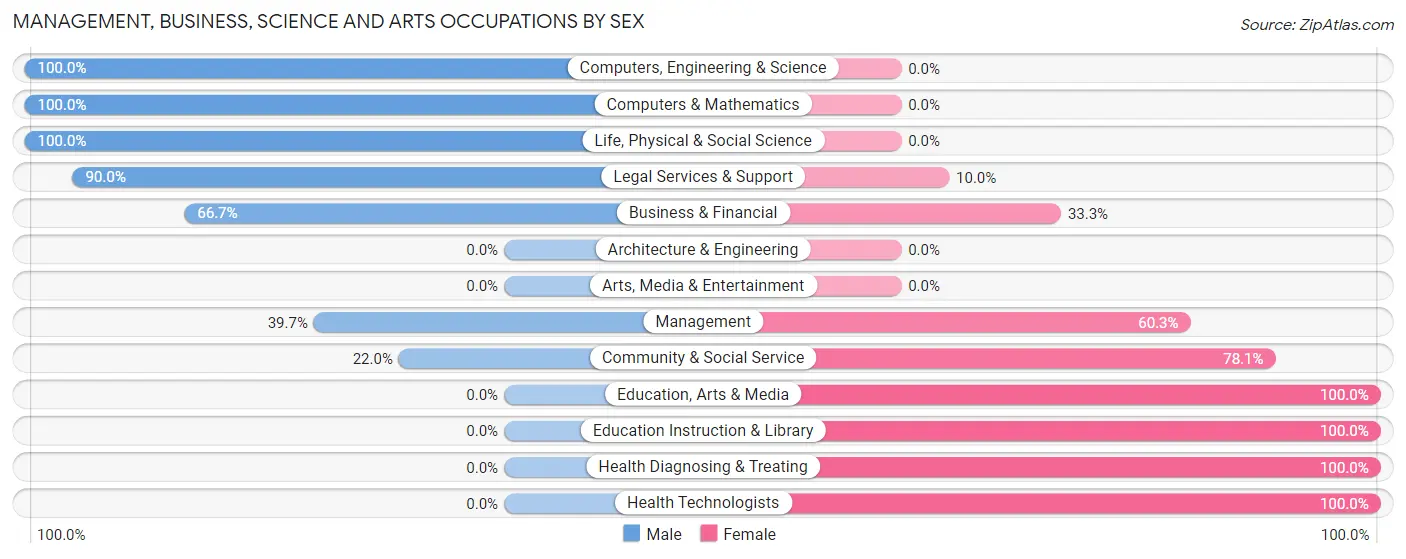
Management, Business, Science and Arts Occupations by Sex
Within the Management, Business, Science and Arts occupations in Forest Park, the most male-oriented occupations are Computers, Engineering & Science (100.0%), Computers & Mathematics (100.0%), and Life, Physical & Social Science (100.0%), while the most female-oriented occupations are Education, Arts & Media (100.0%), Education Instruction & Library (100.0%), and Health Diagnosing & Treating (100.0%).
| Occupation | Male | Female |
| Management | 25 (39.7%) | 38 (60.3%) |
| Business & Financial | 12 (66.7%) | 6 (33.3%) |
| Computers, Engineering & Science | 9 (100.0%) | 0 (0.0%) |
| Computers & Mathematics | 6 (100.0%) | 0 (0.0%) |
| Architecture & Engineering | 0 (0.0%) | 0 (0.0%) |
| Life, Physical & Social Science | 3 (100.0%) | 0 (0.0%) |
| Community & Social Service | 9 (22.0%) | 32 (78.0%) |
| Education, Arts & Media | 0 (0.0%) | 4 (100.0%) |
| Legal Services & Support | 9 (90.0%) | 1 (10.0%) |
| Education Instruction & Library | 0 (0.0%) | 27 (100.0%) |
| Arts, Media & Entertainment | 0 (0.0%) | 0 (0.0%) |
| Health Diagnosing & Treating | 0 (0.0%) | 18 (100.0%) |
| Health Technologists | 0 (0.0%) | 14 (100.0%) |
| Total (Category) | 55 (36.9%) | 94 (63.1%) |
| Total (Overall) | 189 (46.8%) | 215 (53.2%) |
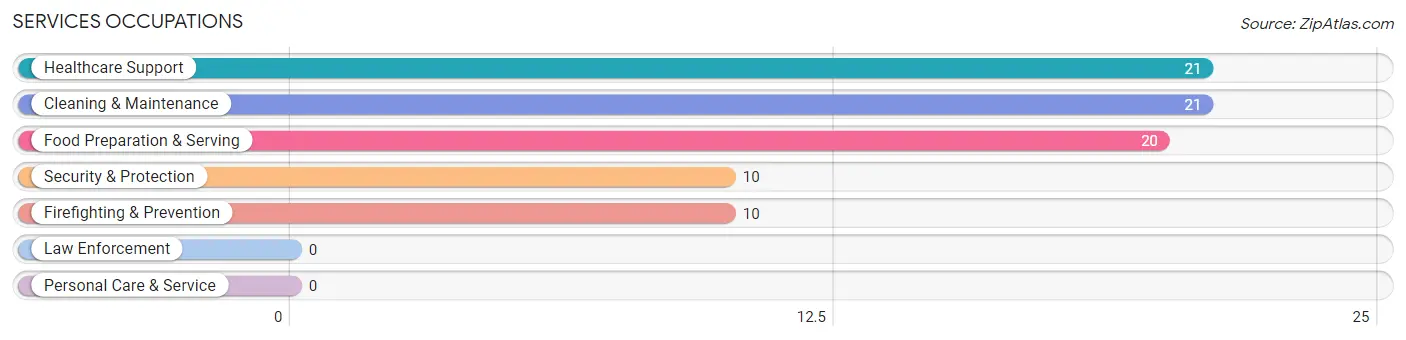
Services Occupations
The most common Services occupations in Forest Park are Healthcare Support (21 | 5.2%), Cleaning & Maintenance (21 | 5.2%), Food Preparation & Serving (20 | 5.0%), Security & Protection (10 | 2.5%), and Firefighting & Prevention (10 | 2.5%).
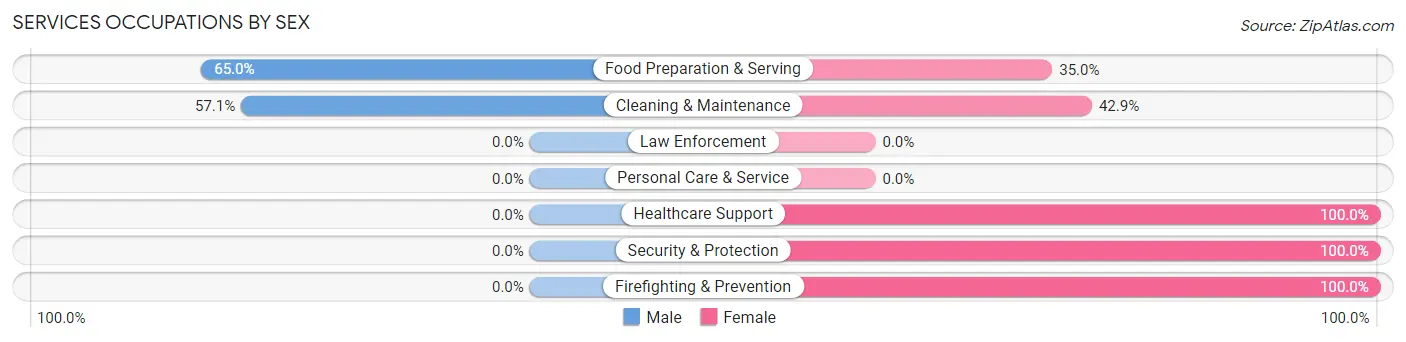
Services Occupations by Sex
Within the Services occupations in Forest Park, the most male-oriented occupations are Food Preparation & Serving (65.0%), and Cleaning & Maintenance (57.1%), while the most female-oriented occupations are Healthcare Support (100.0%), Security & Protection (100.0%), and Firefighting & Prevention (100.0%).
| Occupation | Male | Female |
| Healthcare Support | 0 (0.0%) | 21 (100.0%) |
| Security & Protection | 0 (0.0%) | 10 (100.0%) |
| Firefighting & Prevention | 0 (0.0%) | 10 (100.0%) |
| Law Enforcement | 0 (0.0%) | 0 (0.0%) |
| Food Preparation & Serving | 13 (65.0%) | 7 (35.0%) |
| Cleaning & Maintenance | 12 (57.1%) | 9 (42.9%) |
| Personal Care & Service | 0 (0.0%) | 0 (0.0%) |
| Total (Category) | 25 (34.7%) | 47 (65.3%) |
| Total (Overall) | 189 (46.8%) | 215 (53.2%) |
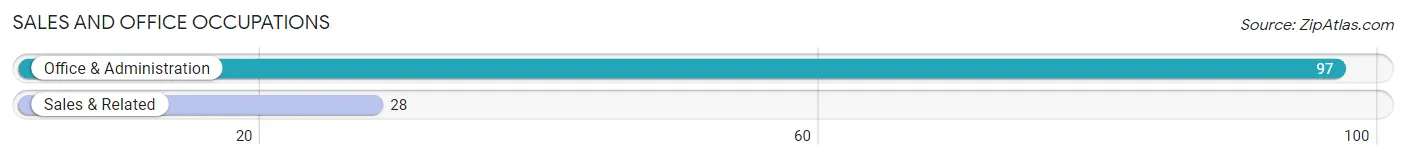
Sales and Office Occupations
The most common Sales and Office occupations in Forest Park are Office & Administration (97 | 24.0%), and Sales & Related (28 | 6.9%).
Sales and Office Occupations by Sex
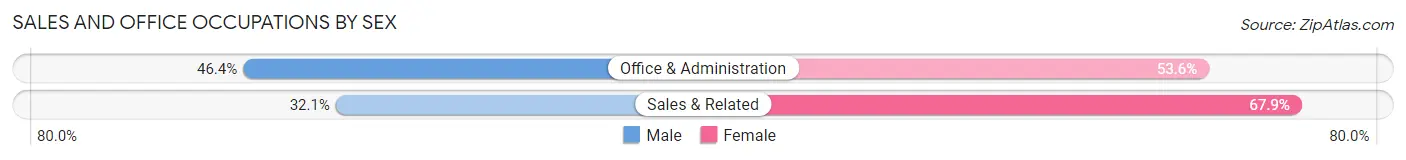
| Occupation | Male | Female |
| Sales & Related | 9 (32.1%) | 19 (67.9%) |
| Office & Administration | 45 (46.4%) | 52 (53.6%) |
| Total (Category) | 54 (43.2%) | 71 (56.8%) |
| Total (Overall) | 189 (46.8%) | 215 (53.2%) |
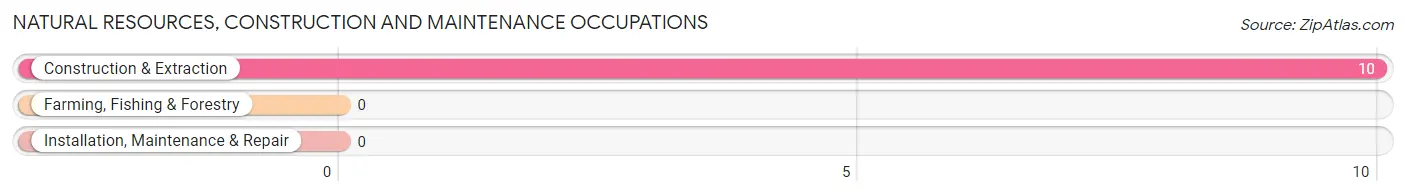
Natural Resources, Construction and Maintenance Occupations
The most common Natural Resources, Construction and Maintenance occupations in Forest Park are , and Construction & Extraction (10 | 2.5%).
Natural Resources, Construction and Maintenance Occupations by Sex
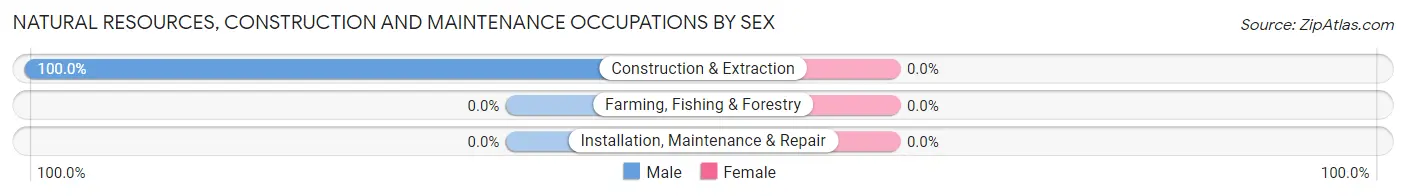
| Occupation | Male | Female |
| Farming, Fishing & Forestry | 0 (0.0%) | 0 (0.0%) |
| Construction & Extraction | 10 (100.0%) | 0 (0.0%) |
| Installation, Maintenance & Repair | 0 (0.0%) | 0 (0.0%) |
| Total (Category) | 10 (100.0%) | 0 (0.0%) |
| Total (Overall) | 189 (46.8%) | 215 (53.2%) |
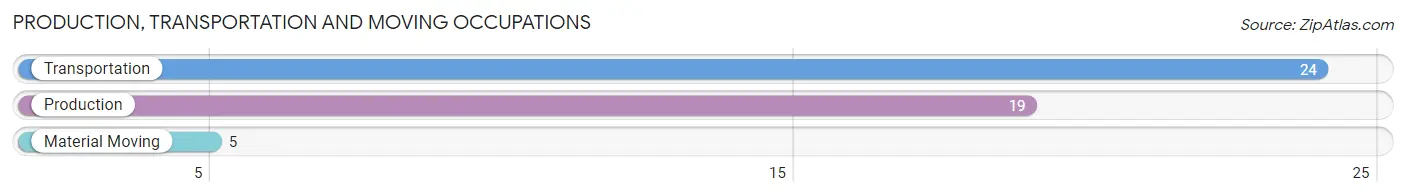
Production, Transportation and Moving Occupations
The most common Production, Transportation and Moving occupations in Forest Park are Transportation (24 | 5.9%), Production (19 | 4.7%), and Material Moving (5 | 1.2%).
Production, Transportation and Moving Occupations by Sex
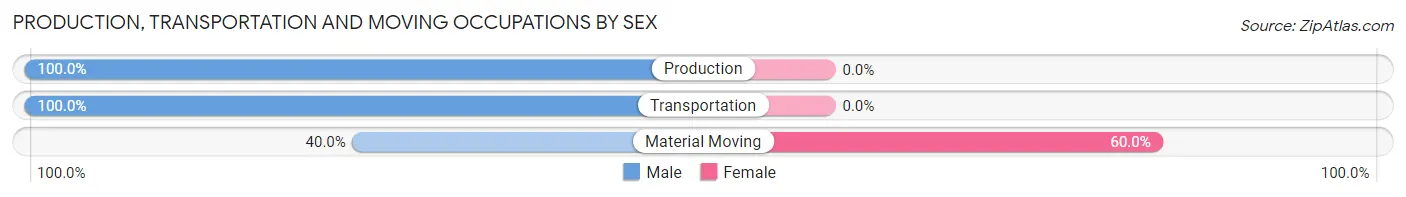
| Occupation | Male | Female |
| Production | 19 (100.0%) | 0 (0.0%) |
| Transportation | 24 (100.0%) | 0 (0.0%) |
| Material Moving | 2 (40.0%) | 3 (60.0%) |
| Total (Category) | 45 (93.8%) | 3 (6.2%) |
| Total (Overall) | 189 (46.8%) | 215 (53.2%) |
Employment Industries by Sex in Forest Park
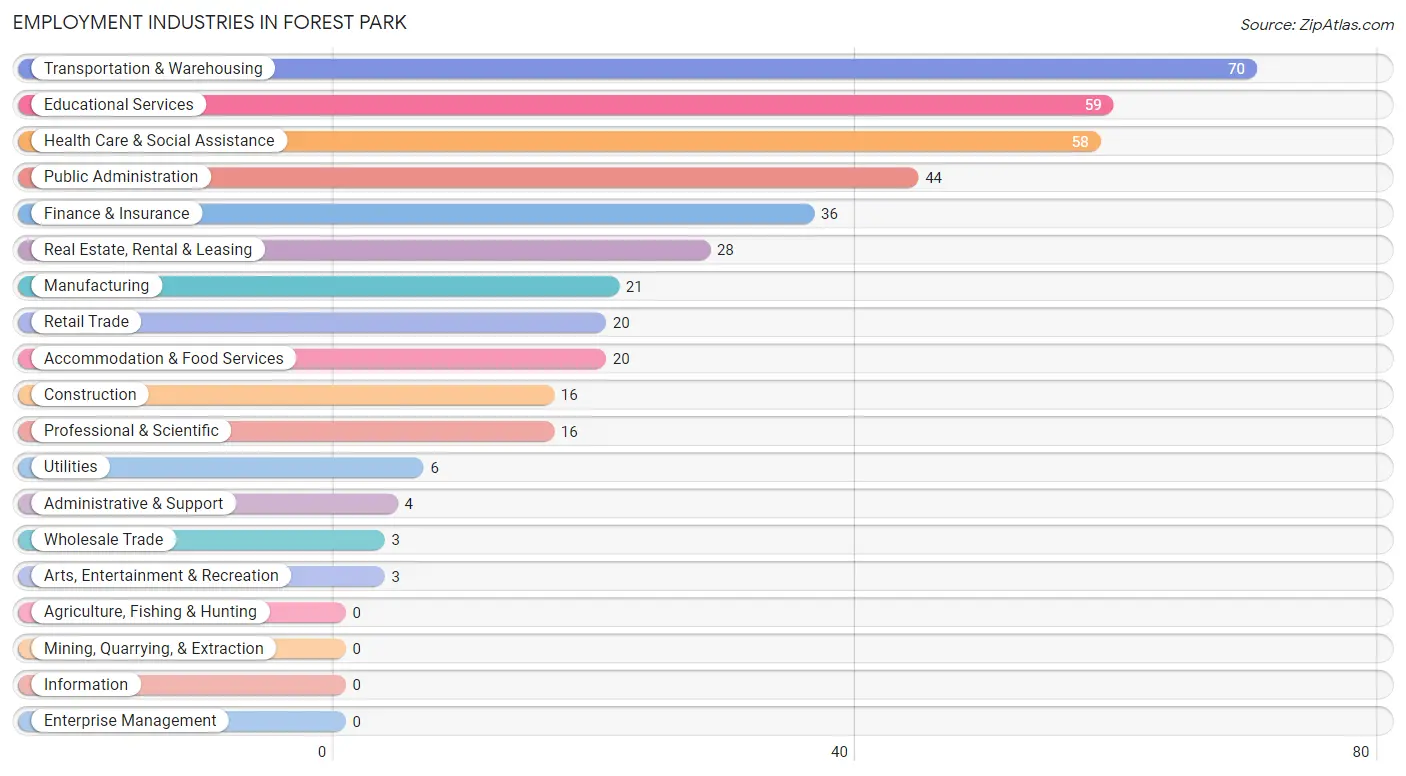
Employment Industries in Forest Park
The major employment industries in Forest Park include Transportation & Warehousing (70 | 17.3%), Educational Services (59 | 14.6%), Health Care & Social Assistance (58 | 14.4%), Public Administration (44 | 10.9%), and Finance & Insurance (36 | 8.9%).
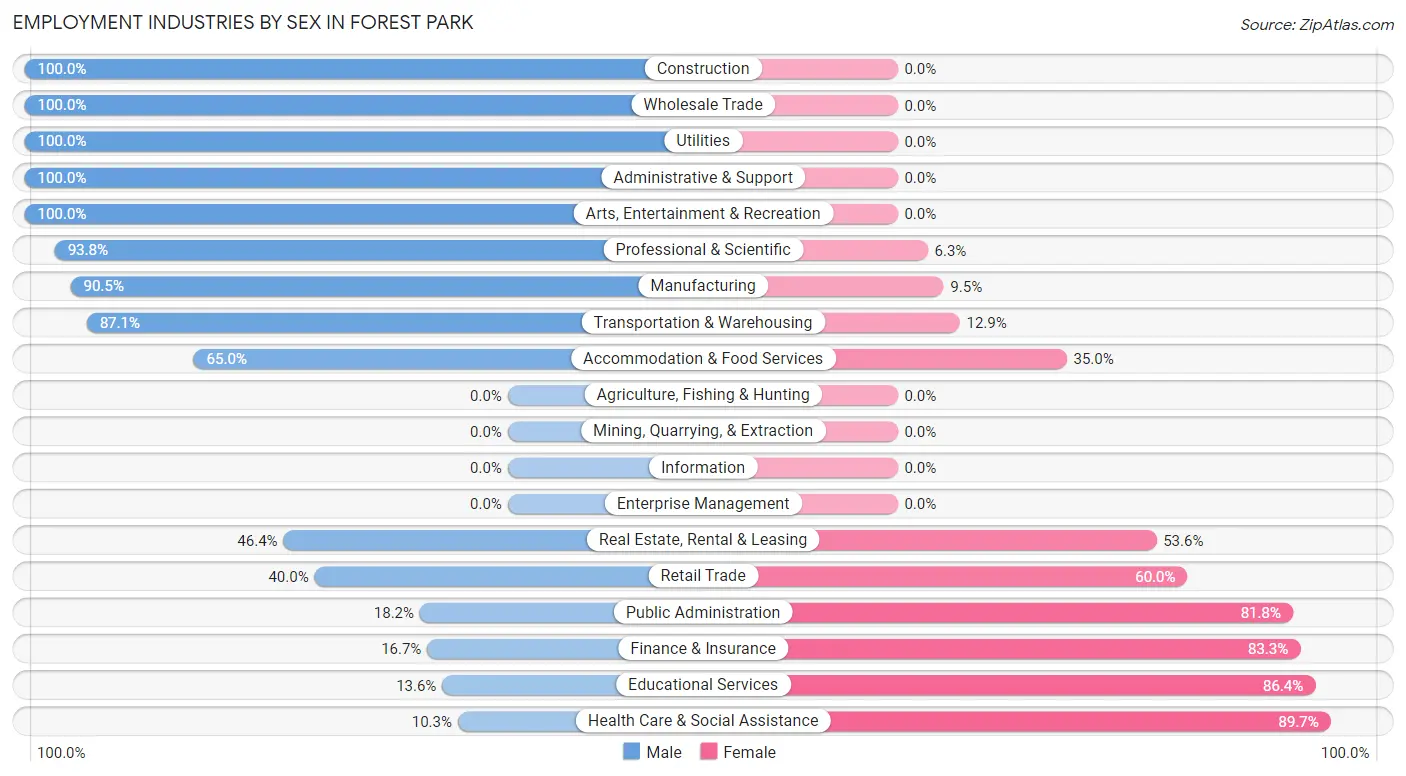
Employment Industries by Sex in Forest Park
The Forest Park industries that see more men than women are Construction (100.0%), Wholesale Trade (100.0%), and Utilities (100.0%), whereas the industries that tend to have a higher number of women are Health Care & Social Assistance (89.7%), Educational Services (86.4%), and Finance & Insurance (83.3%).
| Industry | Male | Female |
| Agriculture, Fishing & Hunting | 0 (0.0%) | 0 (0.0%) |
| Mining, Quarrying, & Extraction | 0 (0.0%) | 0 (0.0%) |
| Construction | 16 (100.0%) | 0 (0.0%) |
| Manufacturing | 19 (90.5%) | 2 (9.5%) |
| Wholesale Trade | 3 (100.0%) | 0 (0.0%) |
| Retail Trade | 8 (40.0%) | 12 (60.0%) |
| Transportation & Warehousing | 61 (87.1%) | 9 (12.9%) |
| Utilities | 6 (100.0%) | 0 (0.0%) |
| Information | 0 (0.0%) | 0 (0.0%) |
| Finance & Insurance | 6 (16.7%) | 30 (83.3%) |
| Real Estate, Rental & Leasing | 13 (46.4%) | 15 (53.6%) |
| Professional & Scientific | 15 (93.8%) | 1 (6.2%) |
| Enterprise Management | 0 (0.0%) | 0 (0.0%) |
| Administrative & Support | 4 (100.0%) | 0 (0.0%) |
| Educational Services | 8 (13.6%) | 51 (86.4%) |
| Health Care & Social Assistance | 6 (10.3%) | 52 (89.7%) |
| Arts, Entertainment & Recreation | 3 (100.0%) | 0 (0.0%) |
| Accommodation & Food Services | 13 (65.0%) | 7 (35.0%) |
| Public Administration | 8 (18.2%) | 36 (81.8%) |
| Total | 189 (46.8%) | 215 (53.2%) |
Education in Forest Park
School Enrollment in Forest Park
The most common levels of schooling among the 104 students in Forest Park are college / undergraduate (23 | 22.1%), elementary school (22 | 21.1%), and high school (20 | 19.2%).
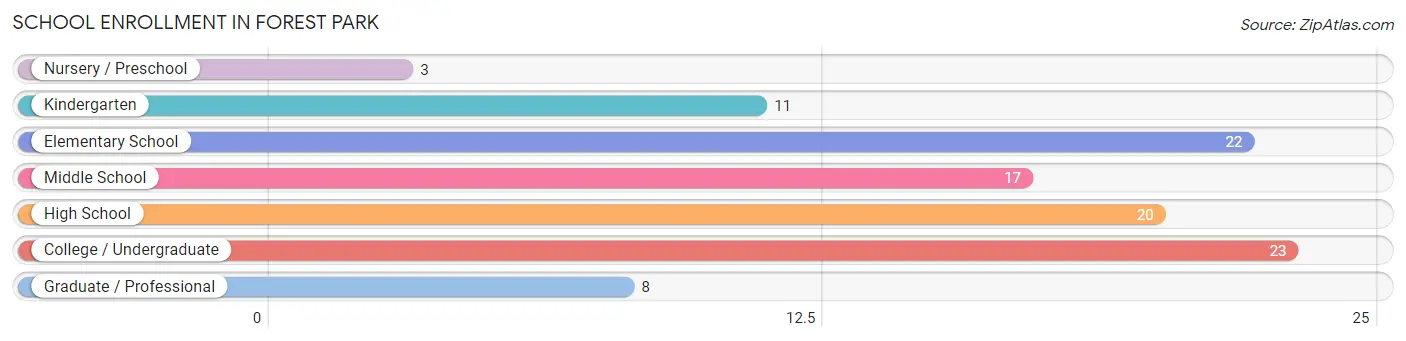
| School Level | # Students | % Students |
| Nursery / Preschool | 3 | 2.9% |
| Kindergarten | 11 | 10.6% |
| Elementary School | 22 | 21.1% |
| Middle School | 17 | 16.4% |
| High School | 20 | 19.2% |
| College / Undergraduate | 23 | 22.1% |
| Graduate / Professional | 8 | 7.7% |
| Total | 104 | 100.0% |
School Enrollment by Age by Funding Source in Forest Park
Out of a total of 104 students who are enrolled in schools in Forest Park, 16 (15.4%) attend a private institution, while the remaining 88 (84.6%) are enrolled in public schools. The age group of 20 to 24 year olds has the highest likelihood of being enrolled in private schools, with 5 (62.5% in the age bracket) enrolled. Conversely, the age group of 3 to 4 year olds has the lowest likelihood of being enrolled in a private school, with 3 (100.0% in the age bracket) attending a public institution.
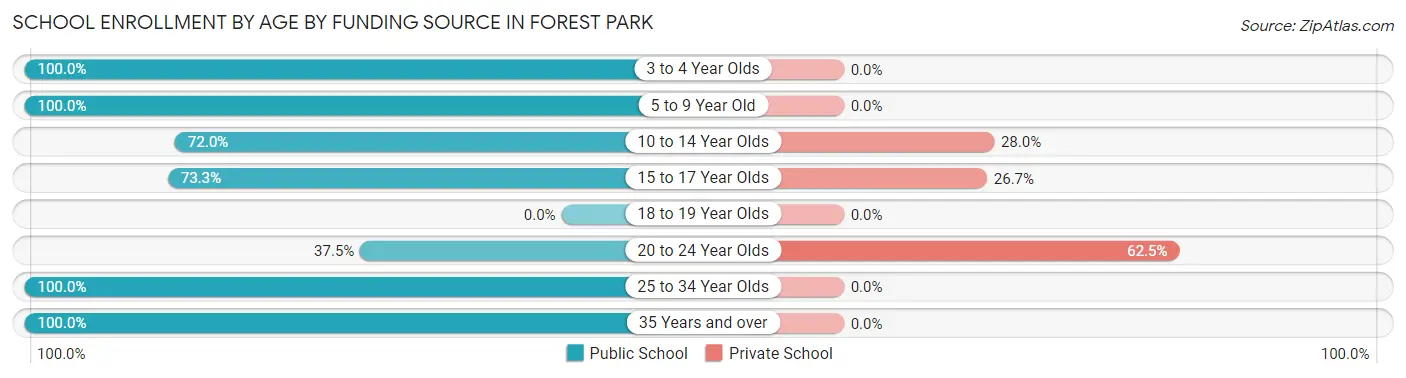
| Age Bracket | Public School | Private School |
| 3 to 4 Year Olds | 3 (100.0%) | 0 (0.0%) |
| 5 to 9 Year Old | 30 (100.0%) | 0 (0.0%) |
| 10 to 14 Year Olds | 18 (72.0%) | 7 (28.0%) |
| 15 to 17 Year Olds | 11 (73.3%) | 4 (26.7%) |
| 18 to 19 Year Olds | 0 (0.0%) | 0 (0.0%) |
| 20 to 24 Year Olds | 3 (37.5%) | 5 (62.5%) |
| 25 to 34 Year Olds | 2 (100.0%) | 0 (0.0%) |
| 35 Years and over | 21 (100.0%) | 0 (0.0%) |
| Total | 88 (84.6%) | 16 (15.4%) |
Educational Attainment by Field of Study in Forest Park
Education (103 | 35.0%), business (48 | 16.3%), arts & humanities (38 | 12.9%), science & technology (21 | 7.1%), and psychology (17 | 5.8%) are the most common fields of study among 294 individuals in Forest Park who have obtained a bachelor's degree or higher.
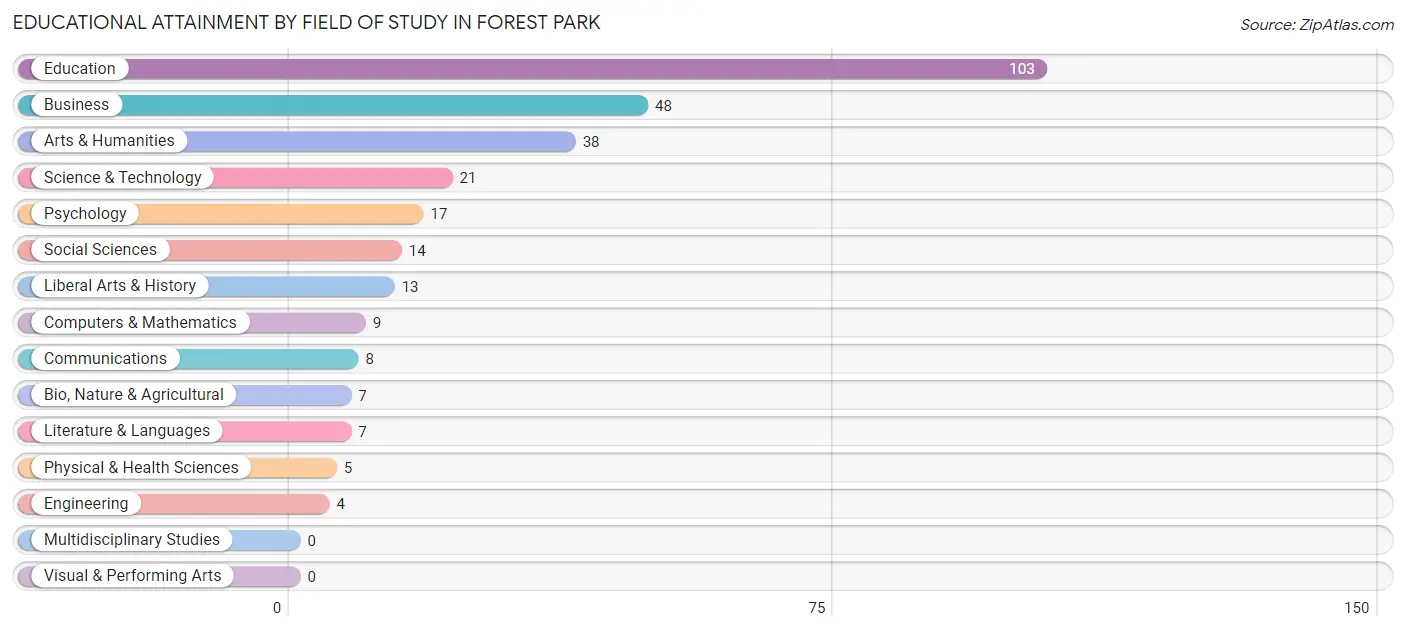
| Field of Study | # Graduates | % Graduates |
| Computers & Mathematics | 9 | 3.1% |
| Bio, Nature & Agricultural | 7 | 2.4% |
| Physical & Health Sciences | 5 | 1.7% |
| Psychology | 17 | 5.8% |
| Social Sciences | 14 | 4.8% |
| Engineering | 4 | 1.4% |
| Multidisciplinary Studies | 0 | 0.0% |
| Science & Technology | 21 | 7.1% |
| Business | 48 | 16.3% |
| Education | 103 | 35.0% |
| Literature & Languages | 7 | 2.4% |
| Liberal Arts & History | 13 | 4.4% |
| Visual & Performing Arts | 0 | 0.0% |
| Communications | 8 | 2.7% |
| Arts & Humanities | 38 | 12.9% |
| Total | 294 | 100.0% |
Transportation & Commute in Forest Park
Vehicle Availability by Sex in Forest Park
The most prevalent vehicle ownership categories in Forest Park are males with 2 vehicles (69, accounting for 36.5%) and females with 2 vehicles (70, making up 32.6%).
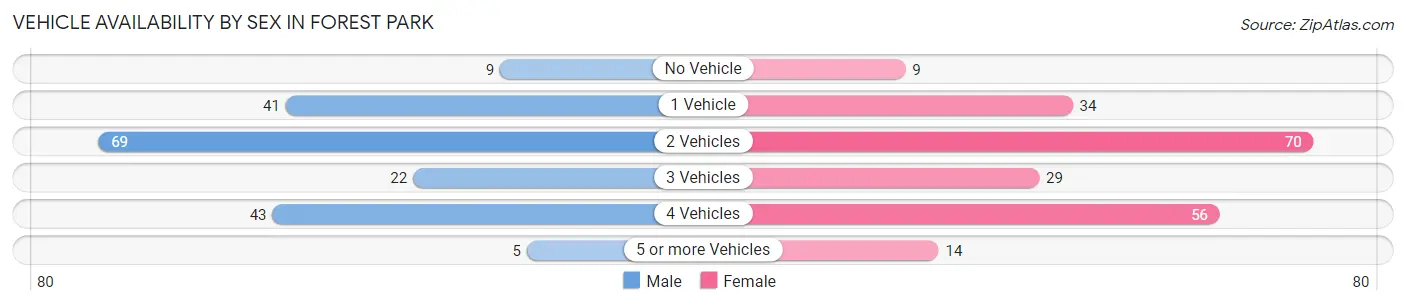
| Vehicles Available | Male | Female |
| No Vehicle | 9 (4.8%) | 9 (4.3%) |
| 1 Vehicle | 41 (21.7%) | 34 (16.0%) |
| 2 Vehicles | 69 (36.5%) | 70 (33.0%) |
| 3 Vehicles | 22 (11.6%) | 29 (13.7%) |
| 4 Vehicles | 43 (22.8%) | 56 (26.4%) |
| 5 or more Vehicles | 5 (2.6%) | 14 (6.6%) |
| Total | 189 (100.0%) | 212 (100.0%) |
Commute Time in Forest Park
The most frequently occuring commute durations in Forest Park are 15 to 19 minutes (92 commuters, 27.5%), 30 to 34 minutes (67 commuters, 20.1%), and 10 to 14 minutes (56 commuters, 16.8%).
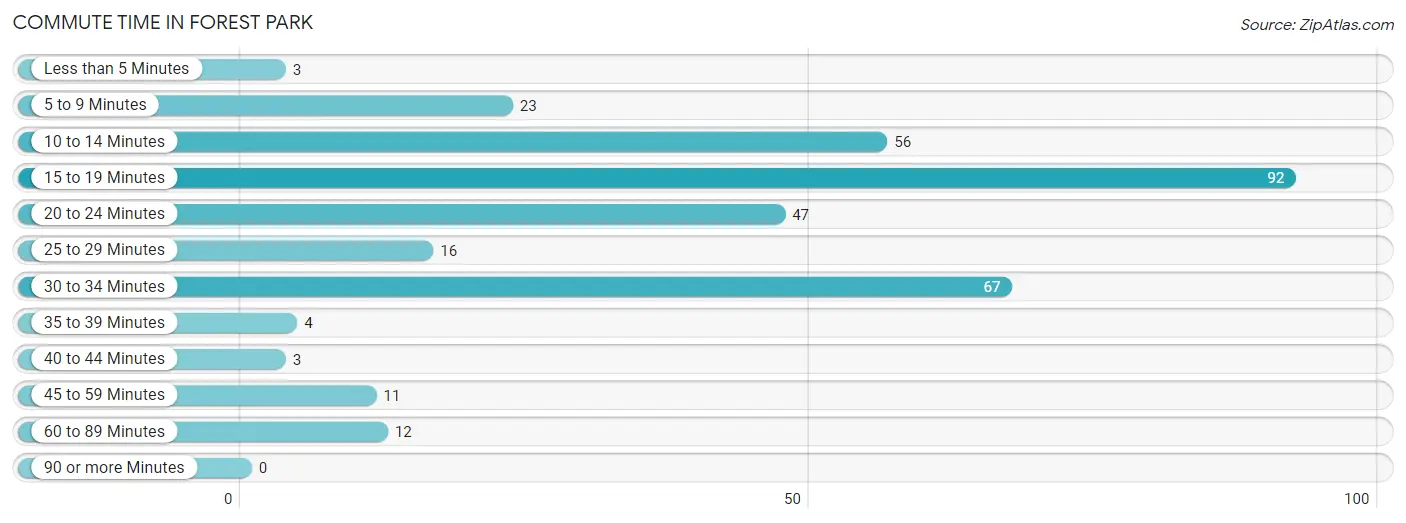
| Commute Time | # Commuters | % Commuters |
| Less than 5 Minutes | 3 | 0.9% |
| 5 to 9 Minutes | 23 | 6.9% |
| 10 to 14 Minutes | 56 | 16.8% |
| 15 to 19 Minutes | 92 | 27.5% |
| 20 to 24 Minutes | 47 | 14.1% |
| 25 to 29 Minutes | 16 | 4.8% |
| 30 to 34 Minutes | 67 | 20.1% |
| 35 to 39 Minutes | 4 | 1.2% |
| 40 to 44 Minutes | 3 | 0.9% |
| 45 to 59 Minutes | 11 | 3.3% |
| 60 to 89 Minutes | 12 | 3.6% |
| 90 or more Minutes | 0 | 0.0% |
Commute Time by Sex in Forest Park
The most common commute times in Forest Park are 30 to 34 minutes (41 commuters, 27.5%) for males and 15 to 19 minutes (65 commuters, 35.1%) for females.
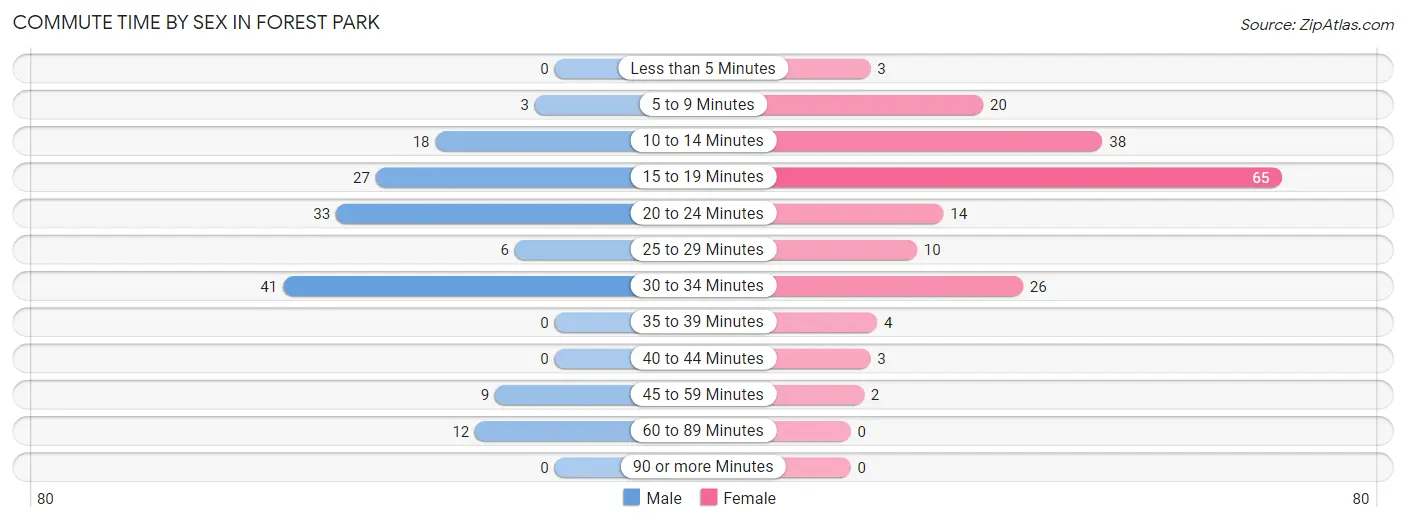
| Commute Time | Male | Female |
| Less than 5 Minutes | 0 (0.0%) | 3 (1.6%) |
| 5 to 9 Minutes | 3 (2.0%) | 20 (10.8%) |
| 10 to 14 Minutes | 18 (12.1%) | 38 (20.5%) |
| 15 to 19 Minutes | 27 (18.1%) | 65 (35.1%) |
| 20 to 24 Minutes | 33 (22.2%) | 14 (7.6%) |
| 25 to 29 Minutes | 6 (4.0%) | 10 (5.4%) |
| 30 to 34 Minutes | 41 (27.5%) | 26 (14.1%) |
| 35 to 39 Minutes | 0 (0.0%) | 4 (2.2%) |
| 40 to 44 Minutes | 0 (0.0%) | 3 (1.6%) |
| 45 to 59 Minutes | 9 (6.0%) | 2 (1.1%) |
| 60 to 89 Minutes | 12 (8.1%) | 0 (0.0%) |
| 90 or more Minutes | 0 (0.0%) | 0 (0.0%) |
Time of Departure to Work by Sex in Forest Park
The most frequent times of departure to work in Forest Park are 7:00 AM to 7:29 AM (48, 32.2%) for males and 7:00 AM to 7:29 AM (33, 17.8%) for females.
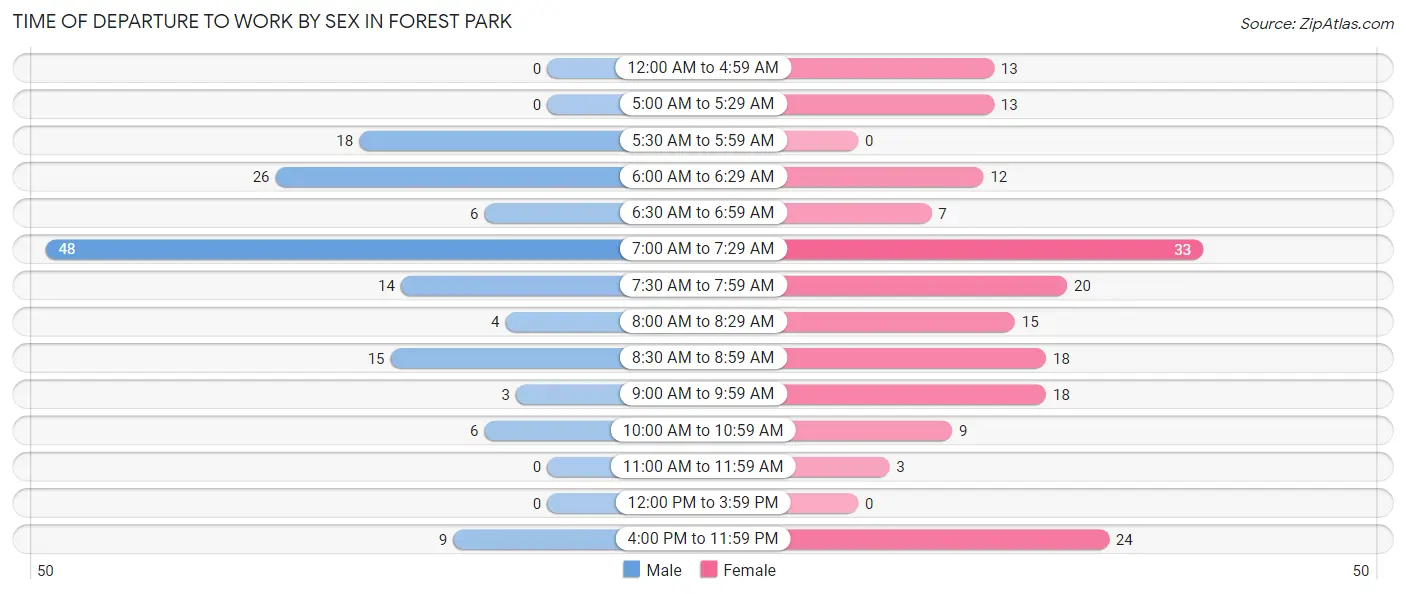
| Time of Departure | Male | Female |
| 12:00 AM to 4:59 AM | 0 (0.0%) | 13 (7.0%) |
| 5:00 AM to 5:29 AM | 0 (0.0%) | 13 (7.0%) |
| 5:30 AM to 5:59 AM | 18 (12.1%) | 0 (0.0%) |
| 6:00 AM to 6:29 AM | 26 (17.4%) | 12 (6.5%) |
| 6:30 AM to 6:59 AM | 6 (4.0%) | 7 (3.8%) |
| 7:00 AM to 7:29 AM | 48 (32.2%) | 33 (17.8%) |
| 7:30 AM to 7:59 AM | 14 (9.4%) | 20 (10.8%) |
| 8:00 AM to 8:29 AM | 4 (2.7%) | 15 (8.1%) |
| 8:30 AM to 8:59 AM | 15 (10.1%) | 18 (9.7%) |
| 9:00 AM to 9:59 AM | 3 (2.0%) | 18 (9.7%) |
| 10:00 AM to 10:59 AM | 6 (4.0%) | 9 (4.9%) |
| 11:00 AM to 11:59 AM | 0 (0.0%) | 3 (1.6%) |
| 12:00 PM to 3:59 PM | 0 (0.0%) | 0 (0.0%) |
| 4:00 PM to 11:59 PM | 9 (6.0%) | 24 (13.0%) |
| Total | 149 (100.0%) | 185 (100.0%) |
Housing Occupancy in Forest Park
Occupancy by Ownership in Forest Park
Of the total 349 dwellings in Forest Park, owner-occupied units account for 336 (96.3%), while renter-occupied units make up 13 (3.7%).
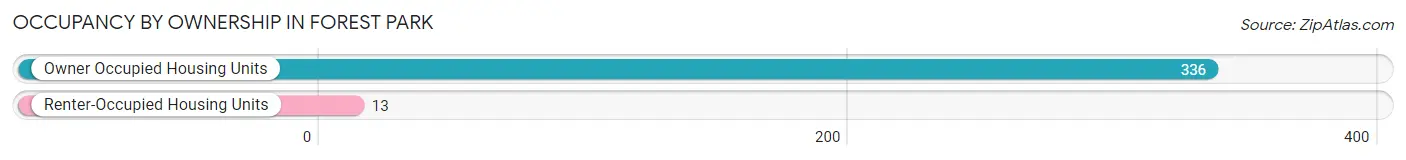
| Occupancy | # Housing Units | % Housing Units |
| Owner Occupied Housing Units | 336 | 96.3% |
| Renter-Occupied Housing Units | 13 | 3.7% |
| Total Occupied Housing Units | 349 | 100.0% |
Occupancy by Household Size in Forest Park
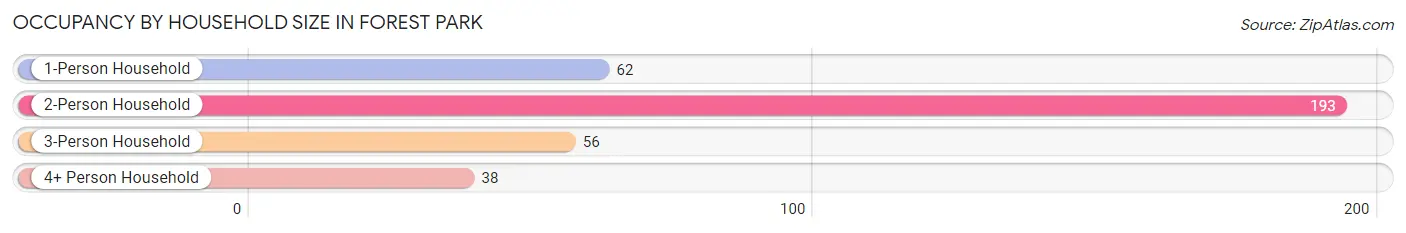
| Household Size | # Housing Units | % Housing Units |
| 1-Person Household | 62 | 17.8% |
| 2-Person Household | 193 | 55.3% |
| 3-Person Household | 56 | 16.1% |
| 4+ Person Household | 38 | 10.9% |
| Total Housing Units | 349 | 100.0% |
Occupancy by Ownership by Household Size in Forest Park
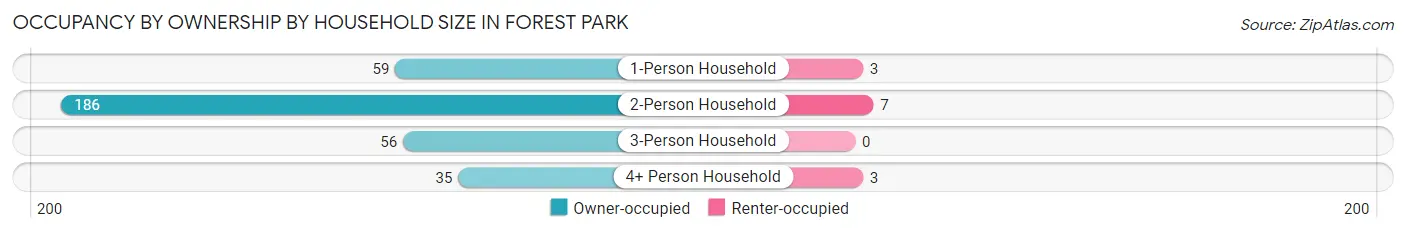
| Household Size | Owner-occupied | Renter-occupied |
| 1-Person Household | 59 (95.2%) | 3 (4.8%) |
| 2-Person Household | 186 (96.4%) | 7 (3.6%) |
| 3-Person Household | 56 (100.0%) | 0 (0.0%) |
| 4+ Person Household | 35 (92.1%) | 3 (7.9%) |
| Total Housing Units | 336 (96.3%) | 13 (3.7%) |
Occupancy by Educational Attainment in Forest Park
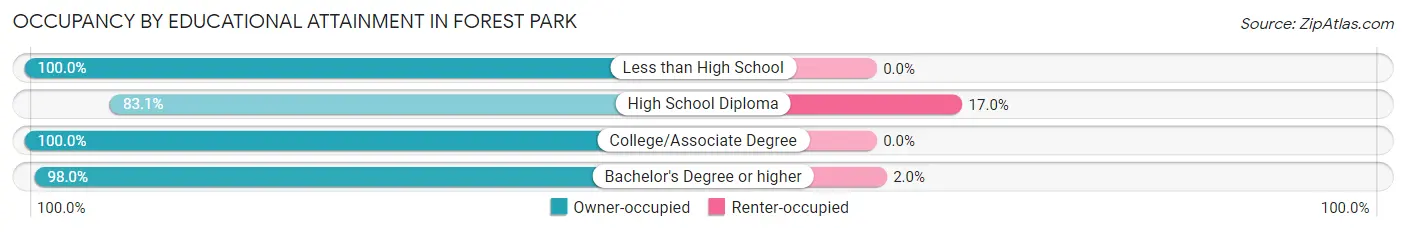
| Household Size | Owner-occupied | Renter-occupied |
| Less than High School | 9 (100.0%) | 0 (0.0%) |
| High School Diploma | 49 (83.1%) | 10 (17.0%) |
| College/Associate Degree | 130 (100.0%) | 0 (0.0%) |
| Bachelor's Degree or higher | 148 (98.0%) | 3 (2.0%) |
Occupancy by Age of Householder in Forest Park
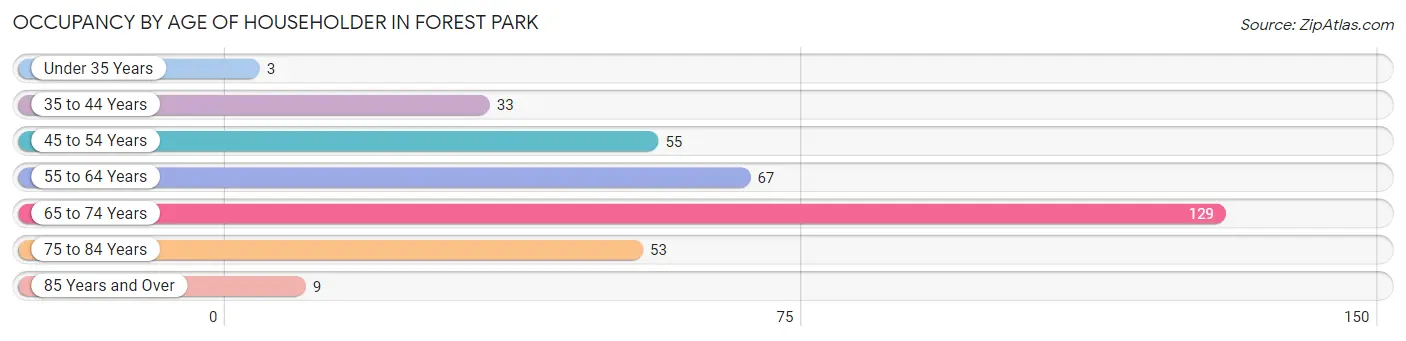
| Age Bracket | # Households | % Households |
| Under 35 Years | 3 | 0.9% |
| 35 to 44 Years | 33 | 9.5% |
| 45 to 54 Years | 55 | 15.8% |
| 55 to 64 Years | 67 | 19.2% |
| 65 to 74 Years | 129 | 37.0% |
| 75 to 84 Years | 53 | 15.2% |
| 85 Years and Over | 9 | 2.6% |
| Total | 349 | 100.0% |
Housing Finances in Forest Park
Median Income by Occupancy in Forest Park
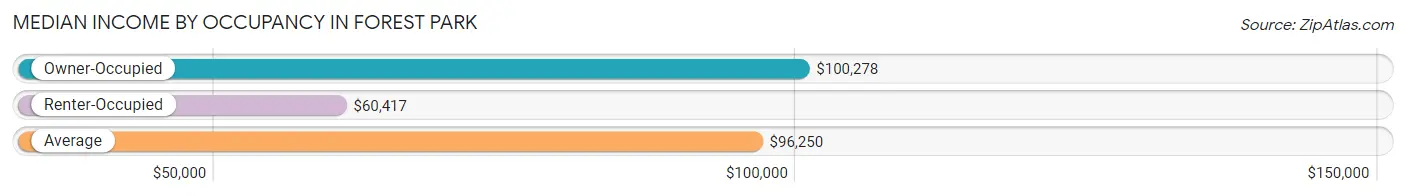
| Occupancy Type | # Households | Median Income |
| Owner-Occupied | 336 (96.3%) | $100,278 |
| Renter-Occupied | 13 (3.7%) | $60,417 |
| Average | 349 (100.0%) | $96,250 |
Occupancy by Householder Income Bracket in Forest Park
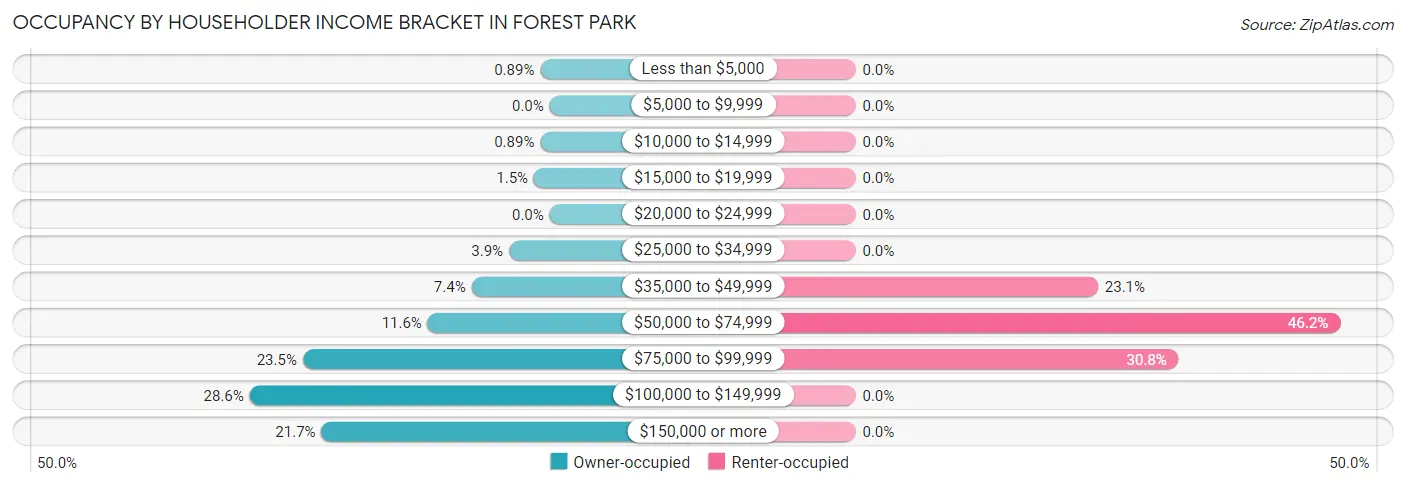
| Income Bracket | Owner-occupied | Renter-occupied |
| Less than $5,000 | 3 (0.9%) | 0 (0.0%) |
| $5,000 to $9,999 | 0 (0.0%) | 0 (0.0%) |
| $10,000 to $14,999 | 3 (0.9%) | 0 (0.0%) |
| $15,000 to $19,999 | 5 (1.5%) | 0 (0.0%) |
| $20,000 to $24,999 | 0 (0.0%) | 0 (0.0%) |
| $25,000 to $34,999 | 13 (3.9%) | 0 (0.0%) |
| $35,000 to $49,999 | 25 (7.4%) | 3 (23.1%) |
| $50,000 to $74,999 | 39 (11.6%) | 6 (46.2%) |
| $75,000 to $99,999 | 79 (23.5%) | 4 (30.8%) |
| $100,000 to $149,999 | 96 (28.6%) | 0 (0.0%) |
| $150,000 or more | 73 (21.7%) | 0 (0.0%) |
| Total | 336 (100.0%) | 13 (100.0%) |
Monthly Housing Cost Tiers in Forest Park
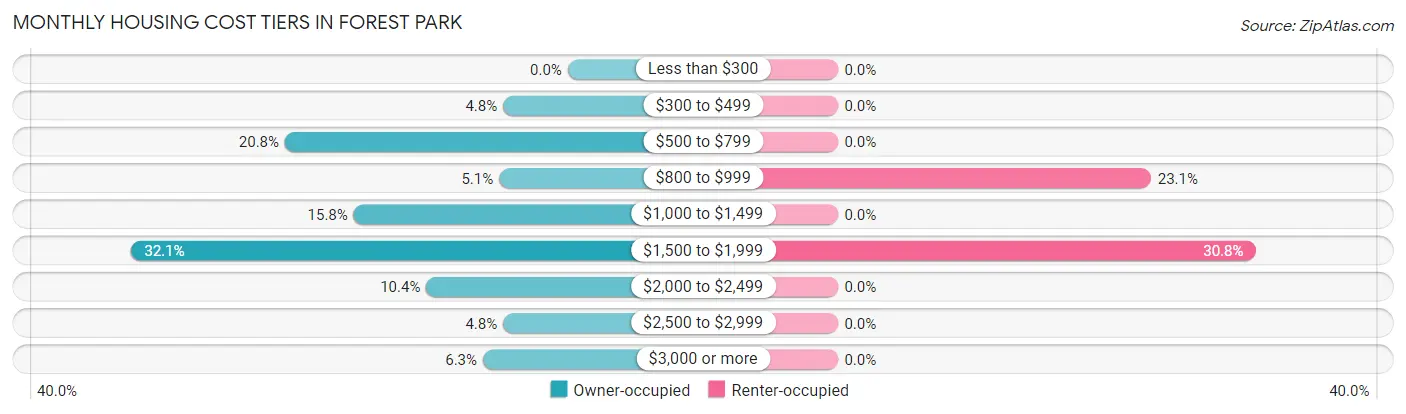
| Monthly Cost | Owner-occupied | Renter-occupied |
| Less than $300 | 0 (0.0%) | 0 (0.0%) |
| $300 to $499 | 16 (4.8%) | 0 (0.0%) |
| $500 to $799 | 70 (20.8%) | 0 (0.0%) |
| $800 to $999 | 17 (5.1%) | 3 (23.1%) |
| $1,000 to $1,499 | 53 (15.8%) | 0 (0.0%) |
| $1,500 to $1,999 | 108 (32.1%) | 4 (30.8%) |
| $2,000 to $2,499 | 35 (10.4%) | 0 (0.0%) |
| $2,500 to $2,999 | 16 (4.8%) | 0 (0.0%) |
| $3,000 or more | 21 (6.2%) | 0 (0.0%) |
| Total | 336 (100.0%) | 13 (100.0%) |
Physical Housing Characteristics in Forest Park
Housing Structures in Forest Park
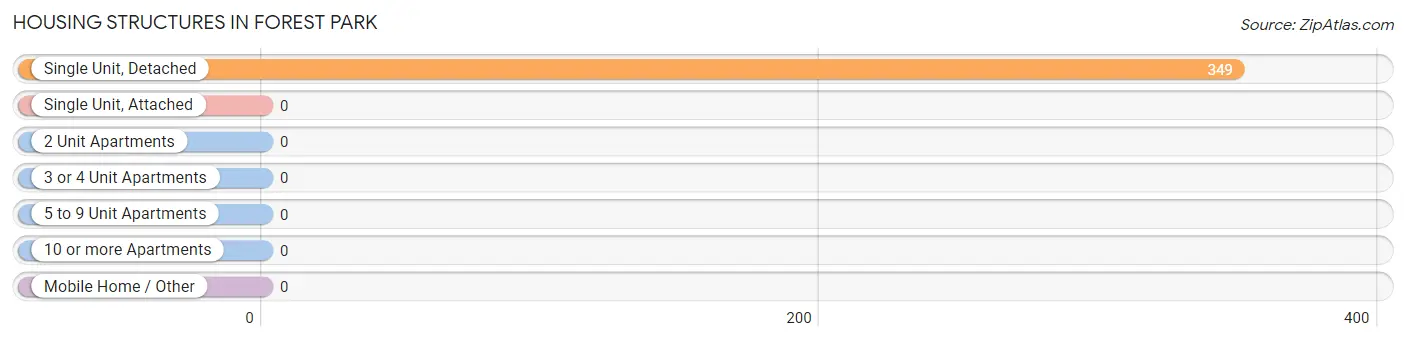
| Structure Type | # Housing Units | % Housing Units |
| Single Unit, Detached | 349 | 100.0% |
| Single Unit, Attached | 0 | 0.0% |
| 2 Unit Apartments | 0 | 0.0% |
| 3 or 4 Unit Apartments | 0 | 0.0% |
| 5 to 9 Unit Apartments | 0 | 0.0% |
| 10 or more Apartments | 0 | 0.0% |
| Mobile Home / Other | 0 | 0.0% |
| Total | 349 | 100.0% |
Housing Structures by Occupancy in Forest Park
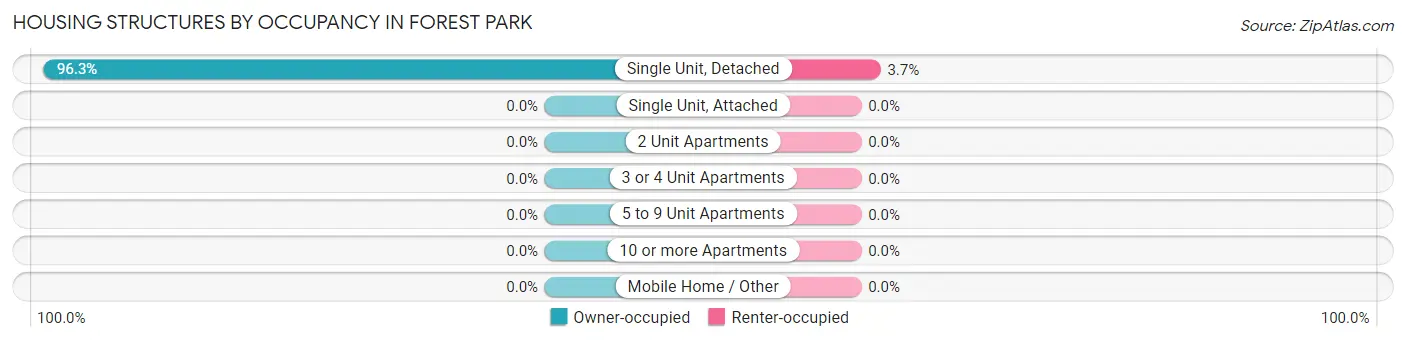
| Structure Type | Owner-occupied | Renter-occupied |
| Single Unit, Detached | 336 (96.3%) | 13 (3.7%) |
| Single Unit, Attached | 0 (0.0%) | 0 (0.0%) |
| 2 Unit Apartments | 0 (0.0%) | 0 (0.0%) |
| 3 or 4 Unit Apartments | 0 (0.0%) | 0 (0.0%) |
| 5 to 9 Unit Apartments | 0 (0.0%) | 0 (0.0%) |
| 10 or more Apartments | 0 (0.0%) | 0 (0.0%) |
| Mobile Home / Other | 0 (0.0%) | 0 (0.0%) |
| Total | 336 (96.3%) | 13 (3.7%) |
Housing Structures by Number of Rooms in Forest Park
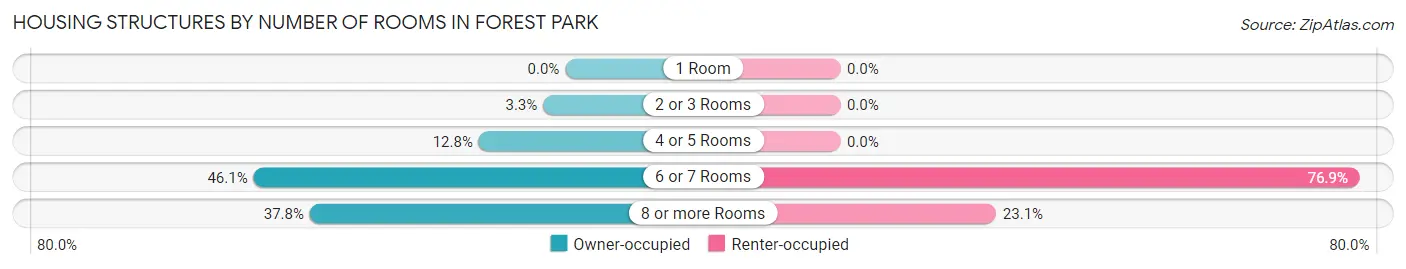
| Number of Rooms | Owner-occupied | Renter-occupied |
| 1 Room | 0 (0.0%) | 0 (0.0%) |
| 2 or 3 Rooms | 11 (3.3%) | 0 (0.0%) |
| 4 or 5 Rooms | 43 (12.8%) | 0 (0.0%) |
| 6 or 7 Rooms | 155 (46.1%) | 10 (76.9%) |
| 8 or more Rooms | 127 (37.8%) | 3 (23.1%) |
| Total | 336 (100.0%) | 13 (100.0%) |
Housing Structure by Heating Type in Forest Park
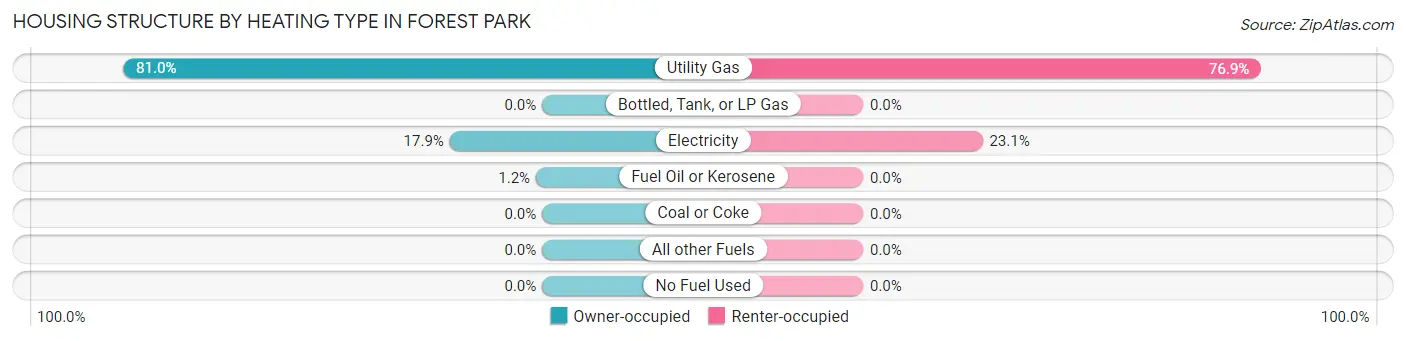
| Heating Type | Owner-occupied | Renter-occupied |
| Utility Gas | 272 (80.9%) | 10 (76.9%) |
| Bottled, Tank, or LP Gas | 0 (0.0%) | 0 (0.0%) |
| Electricity | 60 (17.9%) | 3 (23.1%) |
| Fuel Oil or Kerosene | 4 (1.2%) | 0 (0.0%) |
| Coal or Coke | 0 (0.0%) | 0 (0.0%) |
| All other Fuels | 0 (0.0%) | 0 (0.0%) |
| No Fuel Used | 0 (0.0%) | 0 (0.0%) |
| Total | 336 (100.0%) | 13 (100.0%) |
Household Vehicle Usage in Forest Park
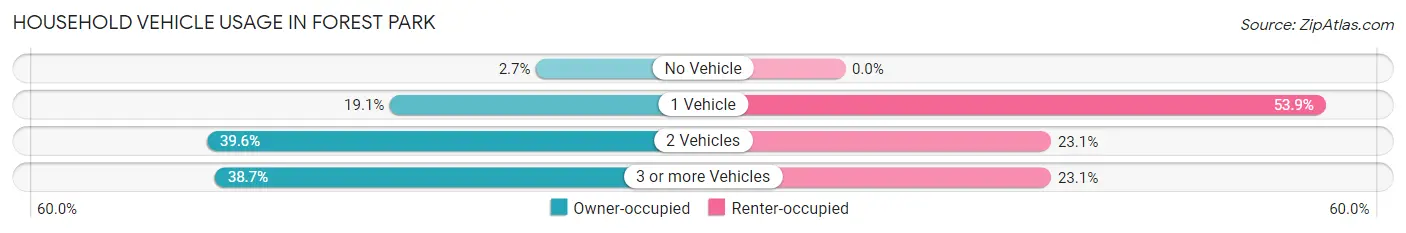
| Vehicles per Household | Owner-occupied | Renter-occupied |
| No Vehicle | 9 (2.7%) | 0 (0.0%) |
| 1 Vehicle | 64 (19.1%) | 7 (53.8%) |
| 2 Vehicles | 133 (39.6%) | 3 (23.1%) |
| 3 or more Vehicles | 130 (38.7%) | 3 (23.1%) |
| Total | 336 (100.0%) | 13 (100.0%) |
Real Estate & Mortgages in Forest Park
Real Estate and Mortgage Overview in Forest Park
| Characteristic | Without Mortgage | With Mortgage |
| Housing Units | 114 | 222 |
| Median Property Value | $265,100 | $273,500 |
| Median Household Income | $120,595 | $59 |
| Monthly Housing Costs | $673 | $21 |
| Real Estate Taxes | $2,615 | $3 |
Property Value by Mortgage Status in Forest Park
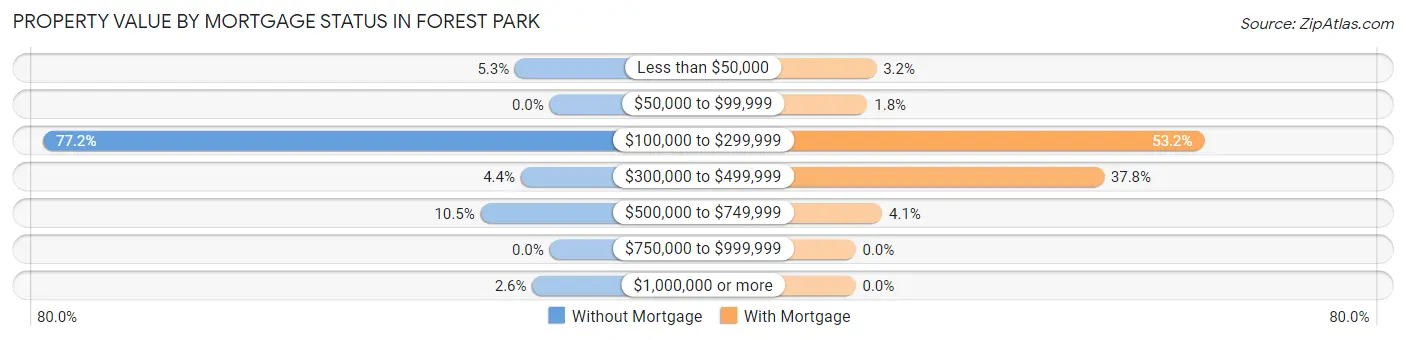
| Property Value | Without Mortgage | With Mortgage |
| Less than $50,000 | 6 (5.3%) | 7 (3.2%) |
| $50,000 to $99,999 | 0 (0.0%) | 4 (1.8%) |
| $100,000 to $299,999 | 88 (77.2%) | 118 (53.1%) |
| $300,000 to $499,999 | 5 (4.4%) | 84 (37.8%) |
| $500,000 to $749,999 | 12 (10.5%) | 9 (4.1%) |
| $750,000 to $999,999 | 0 (0.0%) | 0 (0.0%) |
| $1,000,000 or more | 3 (2.6%) | 0 (0.0%) |
| Total | 114 (100.0%) | 222 (100.0%) |
Household Income by Mortgage Status in Forest Park
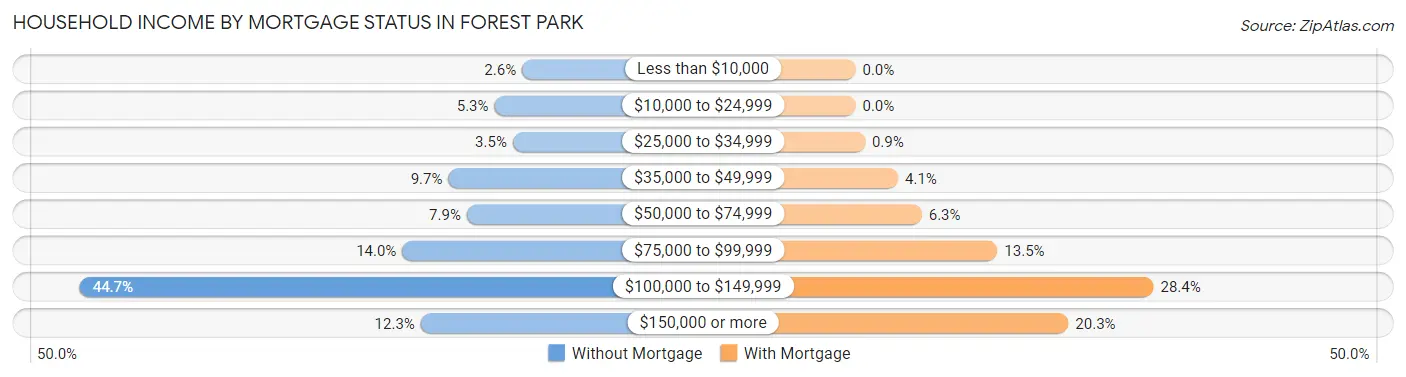
| Household Income | Without Mortgage | With Mortgage |
| Less than $10,000 | 3 (2.6%) | 0 (0.0%) |
| $10,000 to $24,999 | 6 (5.3%) | 0 (0.0%) |
| $25,000 to $34,999 | 4 (3.5%) | 2 (0.9%) |
| $35,000 to $49,999 | 11 (9.7%) | 9 (4.1%) |
| $50,000 to $74,999 | 9 (7.9%) | 14 (6.3%) |
| $75,000 to $99,999 | 16 (14.0%) | 30 (13.5%) |
| $100,000 to $149,999 | 51 (44.7%) | 63 (28.4%) |
| $150,000 or more | 14 (12.3%) | 45 (20.3%) |
| Total | 114 (100.0%) | 222 (100.0%) |
Property Value to Household Income Ratio in Forest Park
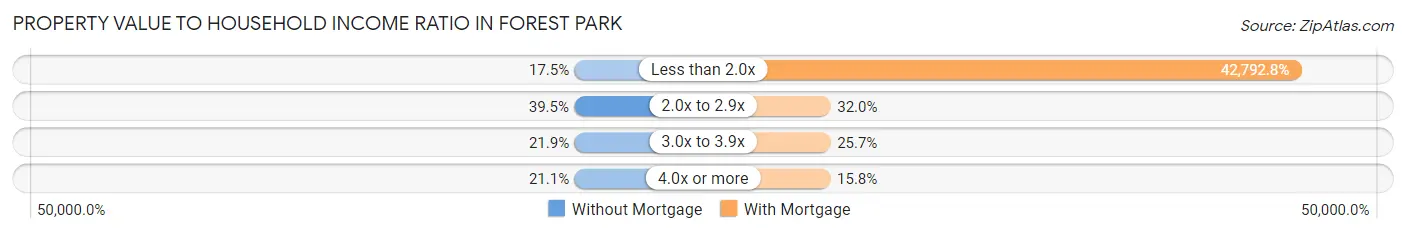
| Value-to-Income Ratio | Without Mortgage | With Mortgage |
| Less than 2.0x | 20 (17.5%) | 95,000 (42,792.8%) |
| 2.0x to 2.9x | 45 (39.5%) | 71 (32.0%) |
| 3.0x to 3.9x | 25 (21.9%) | 57 (25.7%) |
| 4.0x or more | 24 (21.0%) | 35 (15.8%) |
| Total | 114 (100.0%) | 222 (100.0%) |
Real Estate Taxes by Mortgage Status in Forest Park
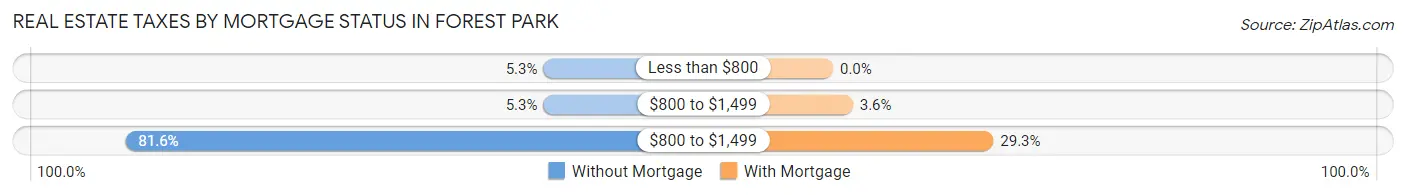
| Property Taxes | Without Mortgage | With Mortgage |
| Less than $800 | 6 (5.3%) | 0 (0.0%) |
| $800 to $1,499 | 6 (5.3%) | 8 (3.6%) |
| $800 to $1,499 | 93 (81.6%) | 65 (29.3%) |
| Total | 114 (100.0%) | 222 (100.0%) |
Health & Disability in Forest Park
Health Insurance Coverage by Age in Forest Park
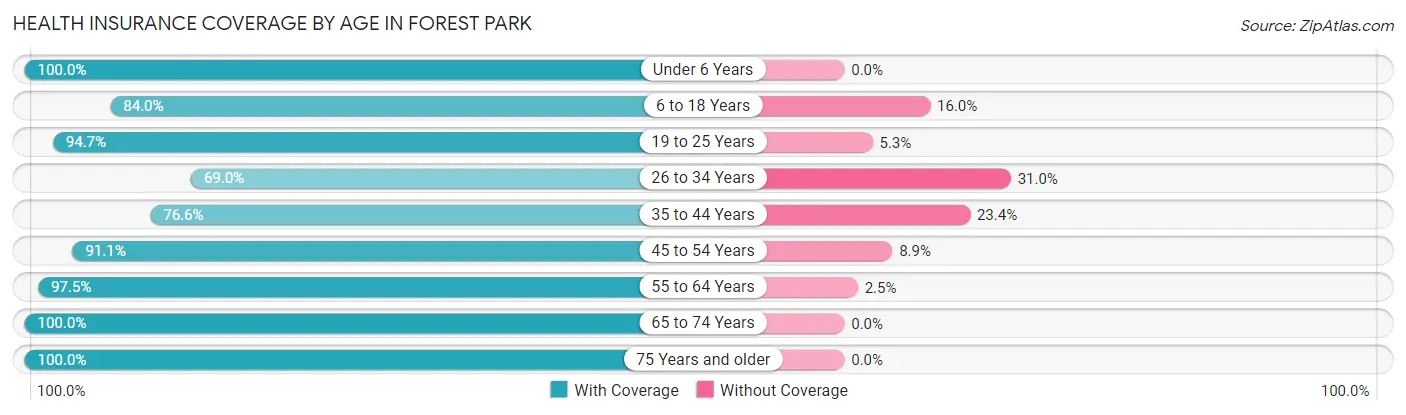
| Age Bracket | With Coverage | Without Coverage |
| Under 6 Years | 6 (100.0%) | 0 (0.0%) |
| 6 to 18 Years | 63 (84.0%) | 12 (16.0%) |
| 19 to 25 Years | 18 (94.7%) | 1 (5.3%) |
| 26 to 34 Years | 40 (69.0%) | 18 (31.0%) |
| 35 to 44 Years | 49 (76.6%) | 15 (23.4%) |
| 45 to 54 Years | 112 (91.1%) | 11 (8.9%) |
| 55 to 64 Years | 117 (97.5%) | 3 (2.5%) |
| 65 to 74 Years | 189 (100.0%) | 0 (0.0%) |
| 75 Years and older | 227 (100.0%) | 0 (0.0%) |
| Total | 821 (93.2%) | 60 (6.8%) |
Health Insurance Coverage by Citizenship Status in Forest Park
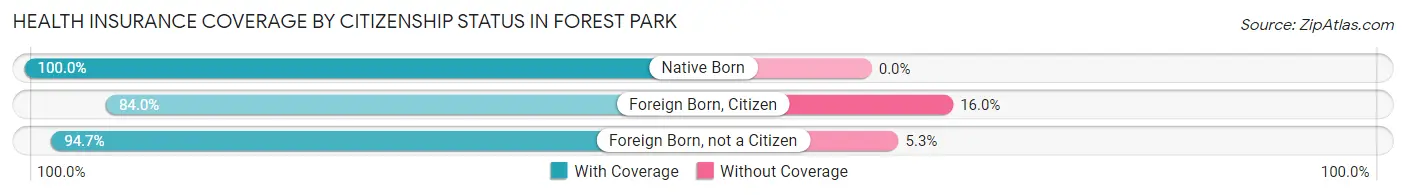
| Citizenship Status | With Coverage | Without Coverage |
| Native Born | 6 (100.0%) | 0 (0.0%) |
| Foreign Born, Citizen | 63 (84.0%) | 12 (16.0%) |
| Foreign Born, not a Citizen | 18 (94.7%) | 1 (5.3%) |
Health Insurance Coverage by Household Income in Forest Park
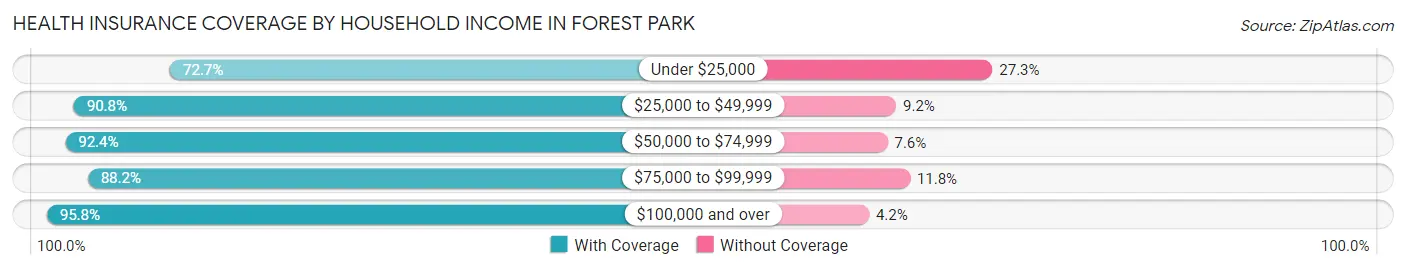
| Household Income | With Coverage | Without Coverage |
| Under $25,000 | 8 (72.7%) | 3 (27.3%) |
| $25,000 to $49,999 | 59 (90.8%) | 6 (9.2%) |
| $50,000 to $74,999 | 121 (92.4%) | 10 (7.6%) |
| $75,000 to $99,999 | 149 (88.2%) | 20 (11.8%) |
| $100,000 and over | 484 (95.8%) | 21 (4.2%) |
Public vs Private Health Insurance Coverage by Age in Forest Park
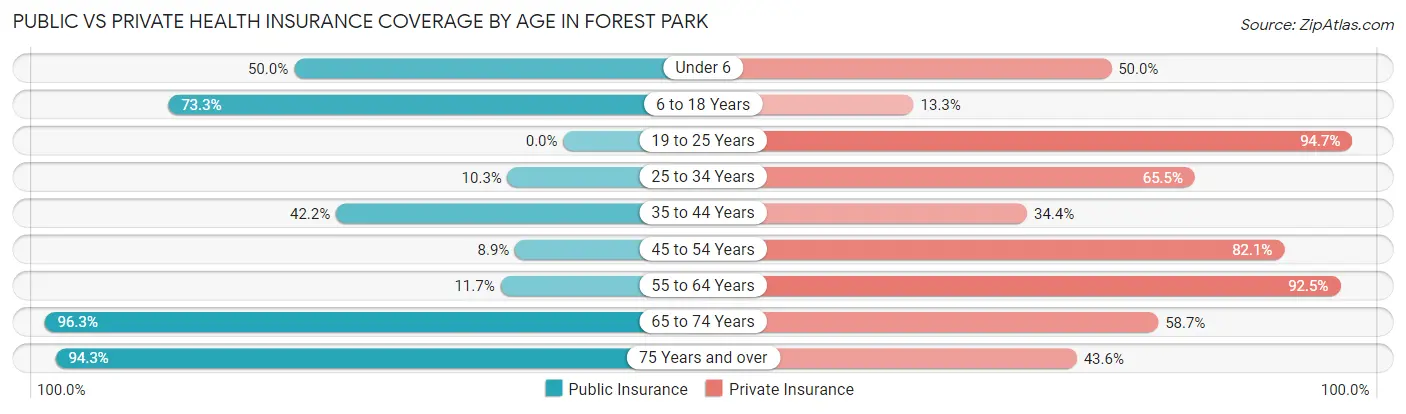
| Age Bracket | Public Insurance | Private Insurance |
| Under 6 | 3 (50.0%) | 3 (50.0%) |
| 6 to 18 Years | 55 (73.3%) | 10 (13.3%) |
| 19 to 25 Years | 0 (0.0%) | 18 (94.7%) |
| 25 to 34 Years | 6 (10.3%) | 38 (65.5%) |
| 35 to 44 Years | 27 (42.2%) | 22 (34.4%) |
| 45 to 54 Years | 11 (8.9%) | 101 (82.1%) |
| 55 to 64 Years | 14 (11.7%) | 111 (92.5%) |
| 65 to 74 Years | 182 (96.3%) | 111 (58.7%) |
| 75 Years and over | 214 (94.3%) | 99 (43.6%) |
| Total | 512 (58.1%) | 513 (58.2%) |
Disability Status by Sex by Age in Forest Park
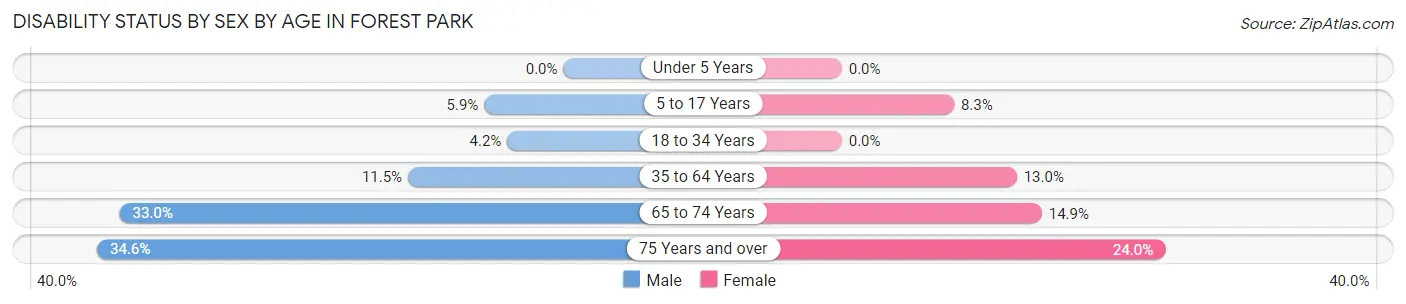
| Age Bracket | Male | Female |
| Under 5 Years | 0 (0.0%) | 0 (0.0%) |
| 5 to 17 Years | 2 (5.9%) | 3 (8.3%) |
| 18 to 34 Years | 2 (4.2%) | 0 (0.0%) |
| 35 to 64 Years | 15 (11.5%) | 23 (13.0%) |
| 65 to 74 Years | 29 (33.0%) | 15 (14.8%) |
| 75 Years and over | 18 (34.6%) | 42 (24.0%) |
Disability Class by Sex by Age in Forest Park
Disability Class: Hearing Difficulty
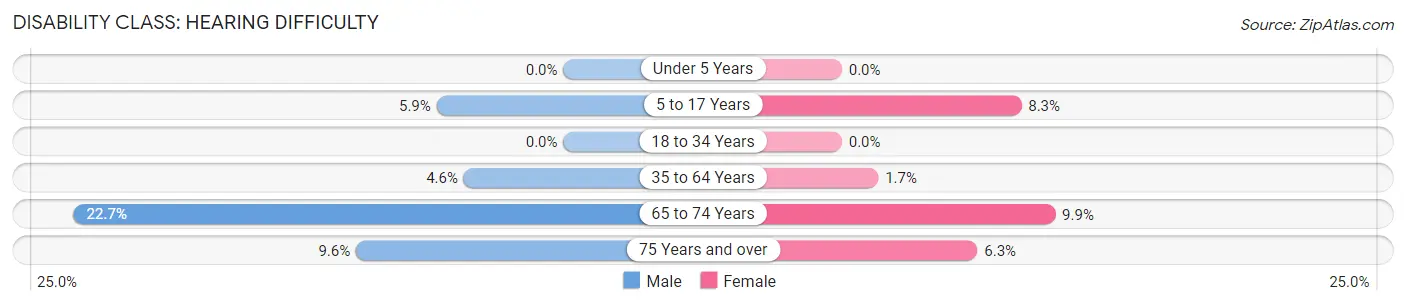
| Age Bracket | Male | Female |
| Under 5 Years | 0 (0.0%) | 0 (0.0%) |
| 5 to 17 Years | 2 (5.9%) | 3 (8.3%) |
| 18 to 34 Years | 0 (0.0%) | 0 (0.0%) |
| 35 to 64 Years | 6 (4.6%) | 3 (1.7%) |
| 65 to 74 Years | 20 (22.7%) | 10 (9.9%) |
| 75 Years and over | 5 (9.6%) | 11 (6.3%) |
Disability Class: Vision Difficulty
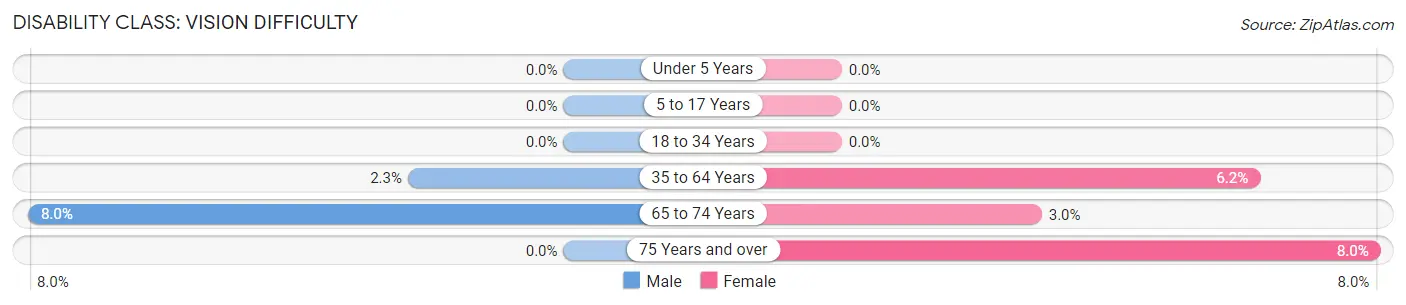
| Age Bracket | Male | Female |
| Under 5 Years | 0 (0.0%) | 0 (0.0%) |
| 5 to 17 Years | 0 (0.0%) | 0 (0.0%) |
| 18 to 34 Years | 0 (0.0%) | 0 (0.0%) |
| 35 to 64 Years | 3 (2.3%) | 11 (6.2%) |
| 65 to 74 Years | 7 (8.0%) | 3 (3.0%) |
| 75 Years and over | 0 (0.0%) | 14 (8.0%) |
Disability Class: Cognitive Difficulty
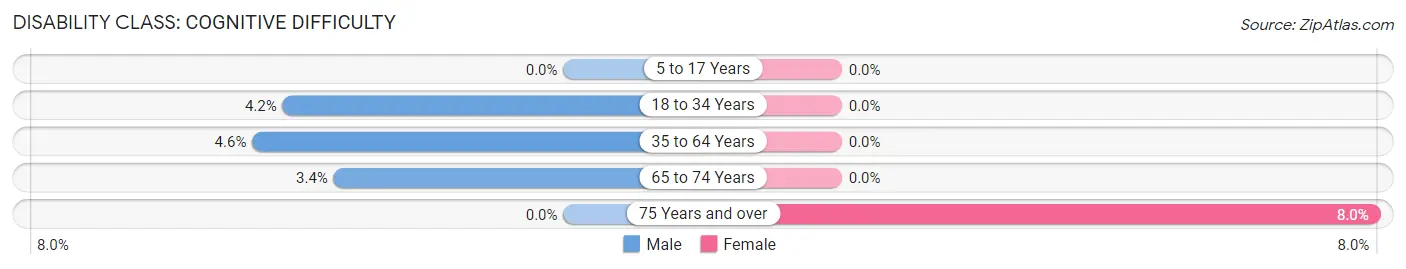
| Age Bracket | Male | Female |
| 5 to 17 Years | 0 (0.0%) | 0 (0.0%) |
| 18 to 34 Years | 2 (4.2%) | 0 (0.0%) |
| 35 to 64 Years | 6 (4.6%) | 0 (0.0%) |
| 65 to 74 Years | 3 (3.4%) | 0 (0.0%) |
| 75 Years and over | 0 (0.0%) | 14 (8.0%) |
Disability Class: Ambulatory Difficulty
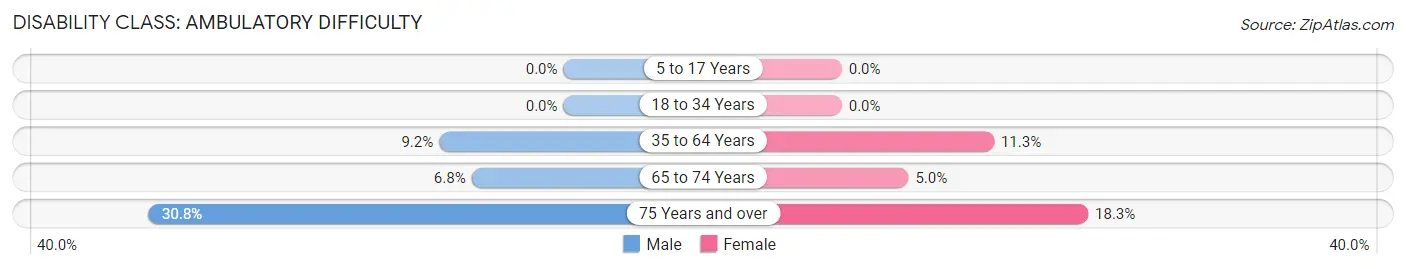
| Age Bracket | Male | Female |
| 5 to 17 Years | 0 (0.0%) | 0 (0.0%) |
| 18 to 34 Years | 0 (0.0%) | 0 (0.0%) |
| 35 to 64 Years | 12 (9.2%) | 20 (11.3%) |
| 65 to 74 Years | 6 (6.8%) | 5 (5.0%) |
| 75 Years and over | 16 (30.8%) | 32 (18.3%) |
Disability Class: Self-Care Difficulty
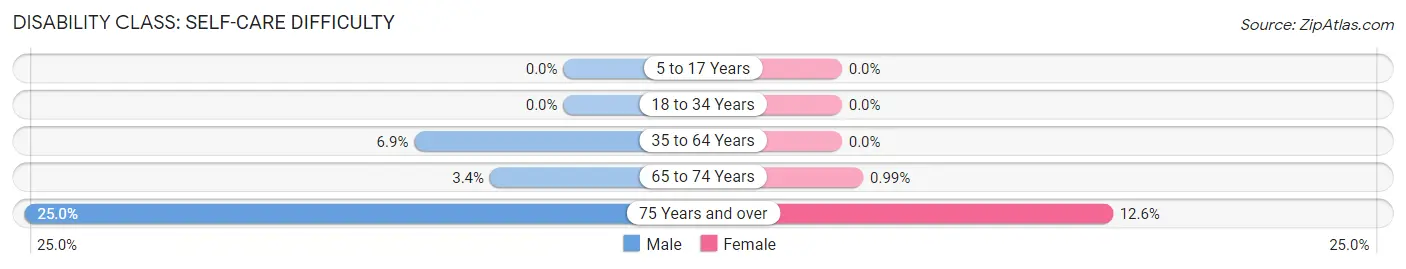
| Age Bracket | Male | Female |
| 5 to 17 Years | 0 (0.0%) | 0 (0.0%) |
| 18 to 34 Years | 0 (0.0%) | 0 (0.0%) |
| 35 to 64 Years | 9 (6.9%) | 0 (0.0%) |
| 65 to 74 Years | 3 (3.4%) | 1 (1.0%) |
| 75 Years and over | 13 (25.0%) | 22 (12.6%) |
Technology Access in Forest Park
Computing Device Access in Forest Park
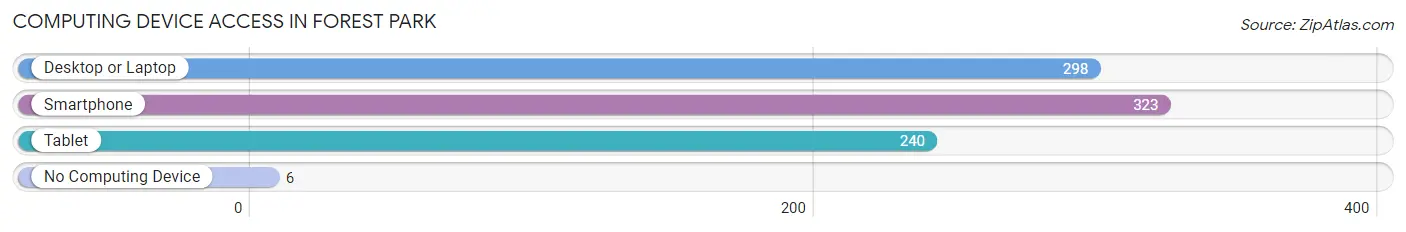
| Device Type | # Households | % Households |
| Desktop or Laptop | 298 | 85.4% |
| Smartphone | 323 | 92.5% |
| Tablet | 240 | 68.8% |
| No Computing Device | 6 | 1.7% |
| Total | 349 | 100.0% |
Internet Access in Forest Park
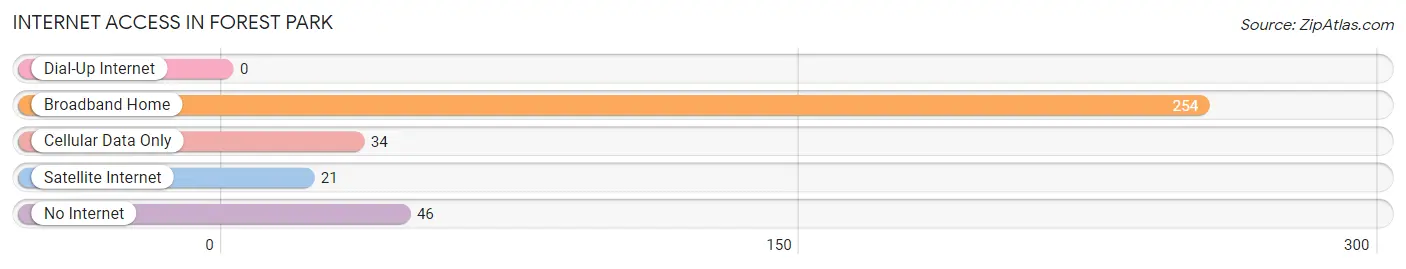
| Internet Type | # Households | % Households |
| Dial-Up Internet | 0 | 0.0% |
| Broadband Home | 254 | 72.8% |
| Cellular Data Only | 34 | 9.7% |
| Satellite Internet | 21 | 6.0% |
| No Internet | 46 | 13.2% |
| Total | 349 | 100.0% |
Forest Park Summary
Forest Park is a small town located in Oklahoma, United States. It is situated in the southeastern part of the state, in the county of Latimer. The town has a population of approximately 1,000 people, and is located about 20 miles south of the city of McAlester.
History
The town of Forest Park was founded in the late 1800s by a group of settlers from the Choctaw Nation. The town was originally known as “Choctaw Station”, and was established as a stop on the St. Louis and San Francisco Railroad. The town was renamed Forest Park in 1895, after the nearby forest.
In the early 1900s, the town began to grow and develop. The first school was built in 1906, and the first post office was established in 1907. The town also had a general store, a blacksmith shop, and a cotton gin.
In the 1920s, the town experienced a period of growth and prosperity. The population increased from around 500 to over 1,000, and the town was home to several businesses, including a bank, a hotel, and a movie theater.
Geography
Forest Park is located in the southeastern part of Oklahoma, in Latimer County. The town is situated on the banks of the Kiamichi River, and is surrounded by rolling hills and forests. The town is located about 20 miles south of the city of McAlester, and is about 90 miles east of Oklahoma City.
The climate in Forest Park is generally mild, with hot summers and cold winters. The average temperature in the summer is around 80 degrees Fahrenheit, and the average temperature in the winter is around 40 degrees Fahrenheit.
Economy
The economy of Forest Park is largely based on agriculture. The town is home to several farms, and the surrounding area is known for its production of cotton, soybeans, and wheat. The town also has a few small businesses, including a grocery store, a hardware store, and a restaurant.
Demographics
As of the 2010 census, the population of Forest Park was 1,000 people. The racial makeup of the town was 95.2% White, 0.7% African American, 0.7% Native American, 0.3% Asian, and 2.9% from other races. The median household income was $30,000, and the median family income was $35,000.
Conclusion
Forest Park is a small town located in Oklahoma, United States. It is situated in the southeastern part of the state, in the county of Latimer. The town has a population of approximately 1,000 people, and is located about 20 miles south of the city of McAlester. The town was founded in the late 1800s by a group of settlers from the Choctaw Nation, and has since grown and developed into a small but thriving community. The economy of Forest Park is largely based on agriculture, and the town is home to several farms and small businesses. The population of Forest Park is mostly White, with a small percentage of African American, Native American, and Asian residents.
Common Questions
What is the Total Population of Forest Park?
Total Population of Forest Park is 881.
What is the Total Male Population of Forest Park?
Total Male Population of Forest Park is 358.
What is the Total Female Population of Forest Park?
Total Female Population of Forest Park is 523.
What is the Ratio of Males per 100 Females in Forest Park?
There are 68.45 Males per 100 Females in Forest Park.
What is the Ratio of Females per 100 Males in Forest Park?
There are 146.09 Females per 100 Males in Forest Park.
What is the Median Population Age in Forest Park?
Median Population Age in Forest Park is 62.6 Years.
What is the Average Family Size in Forest Park
Average Family Size in Forest Park is 2.9 People.
What is the Average Household Size in Forest Park
Average Household Size in Forest Park is 2.5 People.
What is Per Capita Income in Forest Park?
Per Capita income in Forest Park is $47,659.
What is the Median Family Income in Forest Park?
Median Family Income in Forest Park is $98,750.
What is the Median Household income in Forest Park?
Median Household Income in Forest Park is $96,250.
What is Income or Wage Gap in Forest Park?
Income or Wage Gap in Forest Park is 13.4%.
Women in Forest Park earn 86.6 cents for every dollar earned by a man.
What is Inequality or Gini Index in Forest Park?
Inequality or Gini Index in Forest Park is 0.29.
How Large is the Labor Force in Forest Park?
There are 409 People in the Labor Forcein in Forest Park.
What is the Percentage of People in the Labor Force in Forest Park?
50.6% of People are in the Labor Force in Forest Park.
What is the Unemployment Rate in Forest Park?
Unemployment Rate in Forest Park is 1.2%.