Carrier, OK
Carrier Map
Carrier Overview
89
TOTAL POPULATION
37
MALE POPULATION
52
FEMALE POPULATION
71.15
MALES / 100 FEMALES
140.54
FEMALES / 100 MALES
43.9
MEDIAN AGE
3.3
AVG FAMILY SIZE
2.5
AVG HOUSEHOLD SIZE
$28,434
PER CAPITA INCOME
$78,000
AVG FAMILY INCOME
$62,500
AVG HOUSEHOLD INCOME
73.9%
WAGE / INCOME GAP [ % ]
26.1¢/ $1
WAGE / INCOME GAP [ $ ]
0.42
INEQUALITY / GINI INDEX
45
LABOR FORCE [ PEOPLE ]
69.2%
PERCENT IN LABOR FORCE
4.4%
UNEMPLOYMENT RATE
Carrier Zip Codes
Carrier Area Codes
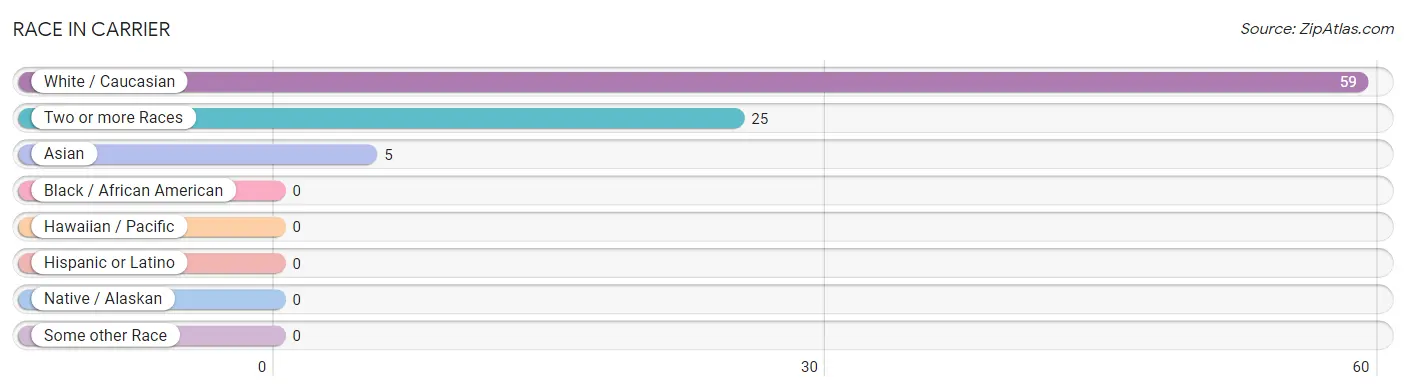
Race in Carrier
The most populous races in Carrier are White / Caucasian (59 | 66.3%), Two or more Races (25 | 28.1%), and Asian (5 | 5.6%).
| Race | # Population | % Population |
| Asian | 5 | 5.6% |
| Black / African American | 0 | 0.0% |
| Hawaiian / Pacific | 0 | 0.0% |
| Hispanic or Latino | 0 | 0.0% |
| Native / Alaskan | 0 | 0.0% |
| White / Caucasian | 59 | 66.3% |
| Two or more Races | 25 | 28.1% |
| Some other Race | 0 | 0.0% |
| Total | 89 | 100.0% |
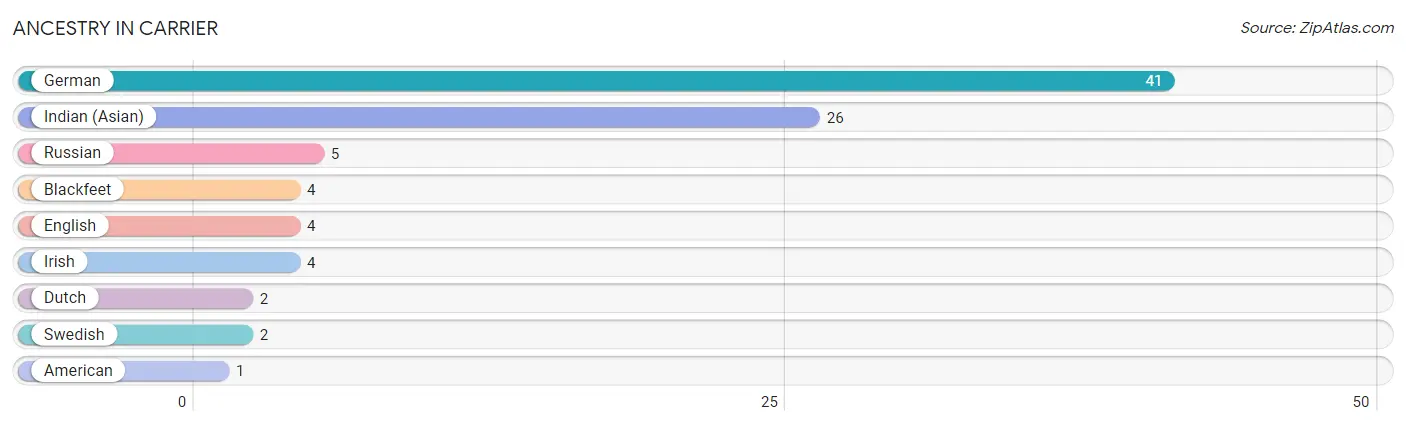
Ancestry in Carrier
The most populous ancestries reported in Carrier are German (41 | 46.1%), Indian (Asian) (26 | 29.2%), Russian (5 | 5.6%), Blackfeet (4 | 4.5%), and English (4 | 4.5%), together accounting for 89.9% of all Carrier residents.
| Ancestry | # Population | % Population |
| American | 1 | 1.1% |
| Blackfeet | 4 | 4.5% |
| Dutch | 2 | 2.2% |
| English | 4 | 4.5% |
| German | 41 | 46.1% |
| Indian (Asian) | 26 | 29.2% |
| Irish | 4 | 4.5% |
| Russian | 5 | 5.6% |
| Swedish | 2 | 2.2% | View All 9 Rows |
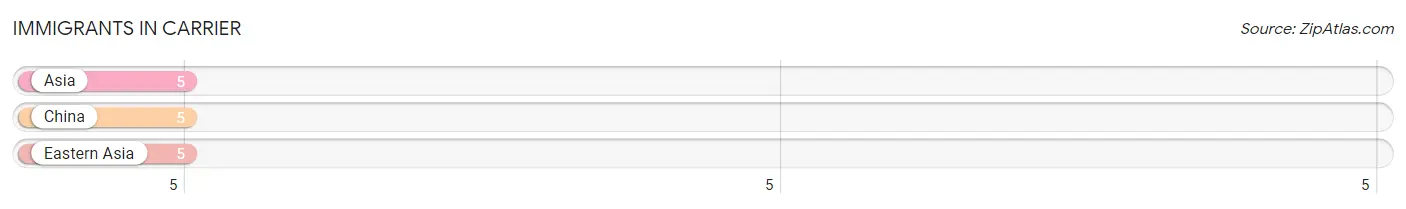
Immigrants in Carrier
The most numerous immigrant groups reported in Carrier came from Asia (5 | 5.6%), China (5 | 5.6%), and Eastern Asia (5 | 5.6%), together accounting for 16.9% of all Carrier residents.
| Immigration Origin | # Population | % Population |
| Asia | 5 | 5.6% |
| China | 5 | 5.6% |
| Eastern Asia | 5 | 5.6% | View All 3 Rows |
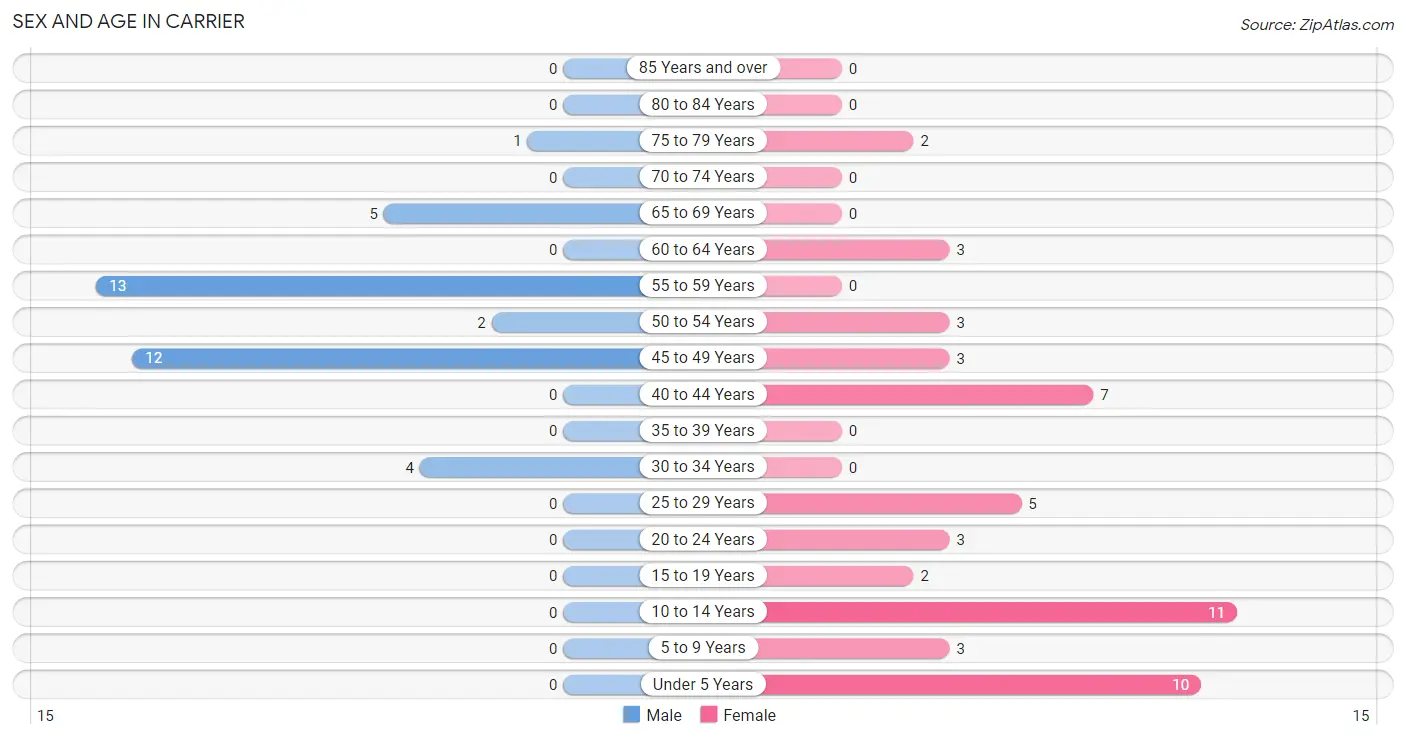
Sex and Age in Carrier
Sex and Age in Carrier
The most populous age groups in Carrier are 55 to 59 Years (13 | 35.1%) for men and 10 to 14 Years (11 | 21.1%) for women.
| Age Bracket | Male | Female |
| Under 5 Years | 0 (0.0%) | 10 (19.2%) |
| 5 to 9 Years | 0 (0.0%) | 3 (5.8%) |
| 10 to 14 Years | 0 (0.0%) | 11 (21.1%) |
| 15 to 19 Years | 0 (0.0%) | 2 (3.8%) |
| 20 to 24 Years | 0 (0.0%) | 3 (5.8%) |
| 25 to 29 Years | 0 (0.0%) | 5 (9.6%) |
| 30 to 34 Years | 4 (10.8%) | 0 (0.0%) |
| 35 to 39 Years | 0 (0.0%) | 0 (0.0%) |
| 40 to 44 Years | 0 (0.0%) | 7 (13.5%) |
| 45 to 49 Years | 12 (32.4%) | 3 (5.8%) |
| 50 to 54 Years | 2 (5.4%) | 3 (5.8%) |
| 55 to 59 Years | 13 (35.1%) | 0 (0.0%) |
| 60 to 64 Years | 0 (0.0%) | 3 (5.8%) |
| 65 to 69 Years | 5 (13.5%) | 0 (0.0%) |
| 70 to 74 Years | 0 (0.0%) | 0 (0.0%) |
| 75 to 79 Years | 1 (2.7%) | 2 (3.8%) |
| 80 to 84 Years | 0 (0.0%) | 0 (0.0%) |
| 85 Years and over | 0 (0.0%) | 0 (0.0%) |
| Total | 37 (100.0%) | 52 (100.0%) |
Families and Households in Carrier
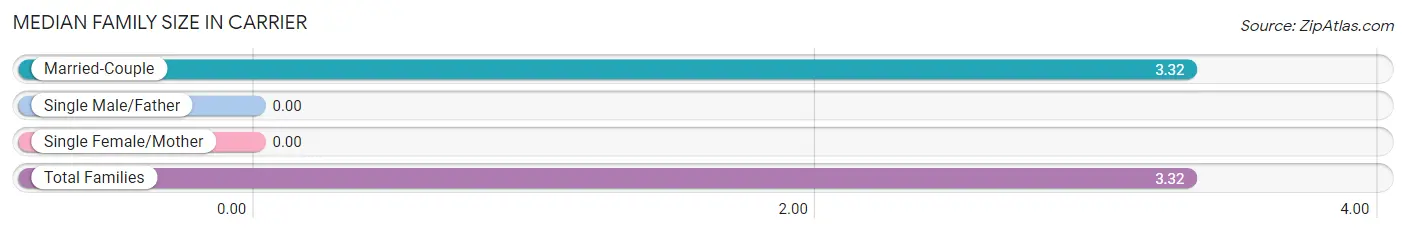
Median Family Size in Carrier
| Family Type | # Families | Family Size |
| Married-Couple | 22 (100.0%) | 3.32 |
| Single Male/Father | 0 (0.0%) | - |
| Single Female/Mother | 0 (0.0%) | - |
| Total Families | 22 (100.0%) | 3.32 |
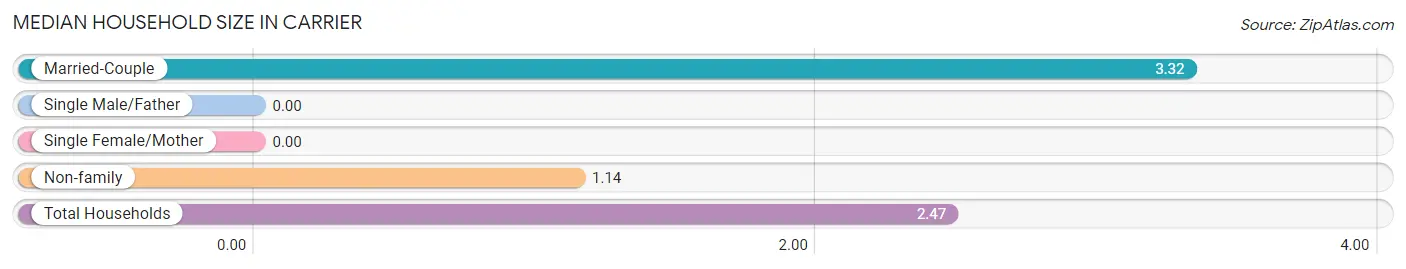
Median Household Size in Carrier
| Household Type | # Households | Household Size |
| Married-Couple | 22 (61.1%) | 3.32 |
| Single Male/Father | 0 (0.0%) | - |
| Single Female/Mother | 0 (0.0%) | - |
| Non-family | 14 (38.9%) | 1.14 |
| Total Households | 36 (100.0%) | 2.47 |
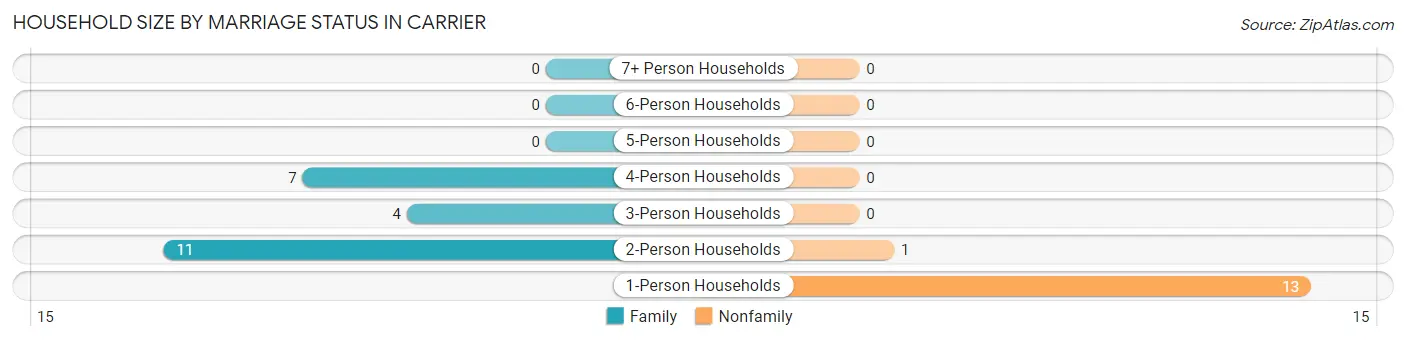
Household Size by Marriage Status in Carrier
Out of a total of 36 households in Carrier, 22 (61.1%) are family households, while 14 (38.9%) are nonfamily households. The most numerous type of family households are 2-person households, comprising 11, and the most common type of nonfamily households are 1-person households, comprising 13.
| Household Size | Family Households | Nonfamily Households |
| 1-Person Households | - | 13 (36.1%) |
| 2-Person Households | 11 (30.6%) | 1 (2.8%) |
| 3-Person Households | 4 (11.1%) | 0 (0.0%) |
| 4-Person Households | 7 (19.4%) | 0 (0.0%) |
| 5-Person Households | 0 (0.0%) | 0 (0.0%) |
| 6-Person Households | 0 (0.0%) | 0 (0.0%) |
| 7+ Person Households | 0 (0.0%) | 0 (0.0%) |
| Total | 22 (61.1%) | 14 (38.9%) |
Female Fertility in Carrier
Fertility by Age in Carrier
| Age Bracket | Women with Births | Births / 1,000 Women |
| 15 to 19 years | 0 (0.0%) | 0.0 |
| 20 to 34 years | 0 (0.0%) | 0.0 |
| 35 to 50 years | 0 (0.0%) | 0.0 |
| Total | 0 (0.0%) | 0.0 |
Fertility by Age by Marriage Status in Carrier
| Age Bracket | Married | Unmarried |
| 15 to 19 years | 0 (0.0%) | 0 (0.0%) |
| 20 to 34 years | 0 (0.0%) | 0 (0.0%) |
| 35 to 50 years | 0 (0.0%) | 0 (0.0%) |
| Total | 0 (0.0%) | 0 (0.0%) |
Fertility by Education in Carrier
| Educational Attainment | Women with Births | Births / 1,000 Women |
| Less than High School | 0 (0.0%) | 0.0 |
| High School Diploma | 0 (0.0%) | 0.0 |
| College or Associate's Degree | 0 (0.0%) | 0.0 |
| Bachelor's Degree | 0 (0.0%) | 0.0 |
| Graduate Degree | 0 (0.0%) | 0.0 |
| Total | 0 (0.0%) | 0.0 |
Fertility by Education by Marriage Status in Carrier
| Educational Attainment | Married | Unmarried |
| Less than High School | 0 (0.0%) | 0 (0.0%) |
| High School Diploma | 0 (0.0%) | 0 (0.0%) |
| College or Associate's Degree | 0 (0.0%) | 0 (0.0%) |
| Bachelor's Degree | 0 (0.0%) | 0 (0.0%) |
| Graduate Degree | 0 (0.0%) | 0 (0.0%) |
| Total | 0 (0.0%) | 0 (0.0%) |
Income in Carrier
Income Overview in Carrier
Per Capita Income in Carrier is $28,434, while median incomes of families and households are $78,000 and $62,500 respectively.
| Characteristic | Number | Measure |
| Per Capita Income | 89 | $28,434 |
| Median Family Income | 22 | $78,000 |
| Mean Family Income | 22 | $92,223 |
| Median Household Income | 36 | $62,500 |
| Mean Household Income | 36 | $69,369 |
| Income Deficit | 22 | $0 |
| Wage / Income Gap (%) | 89 | 73.88% |
| Wage / Income Gap ($) | 89 | 26.12¢ per $1 |
| Gini / Inequality Index | 89 | 0.42 |
Earnings by Sex in Carrier
Average Earnings in Carrier are $43,750, $61,250 for men and $16,000 for women, a difference of 73.9%.
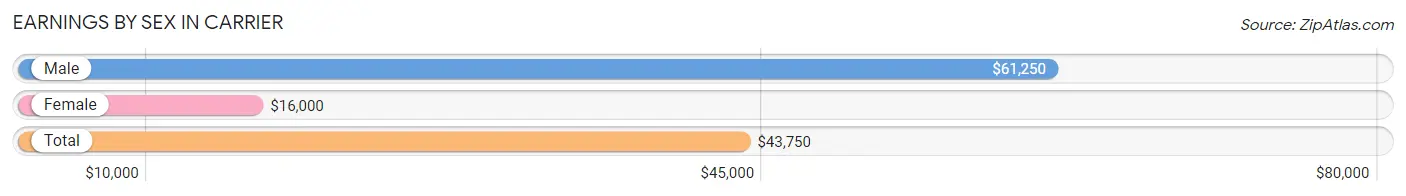
| Sex | Number | Average Earnings |
| Male | 20 (45.5%) | $61,250 |
| Female | 24 (54.5%) | $16,000 |
| Total | 44 (100.0%) | $43,750 |
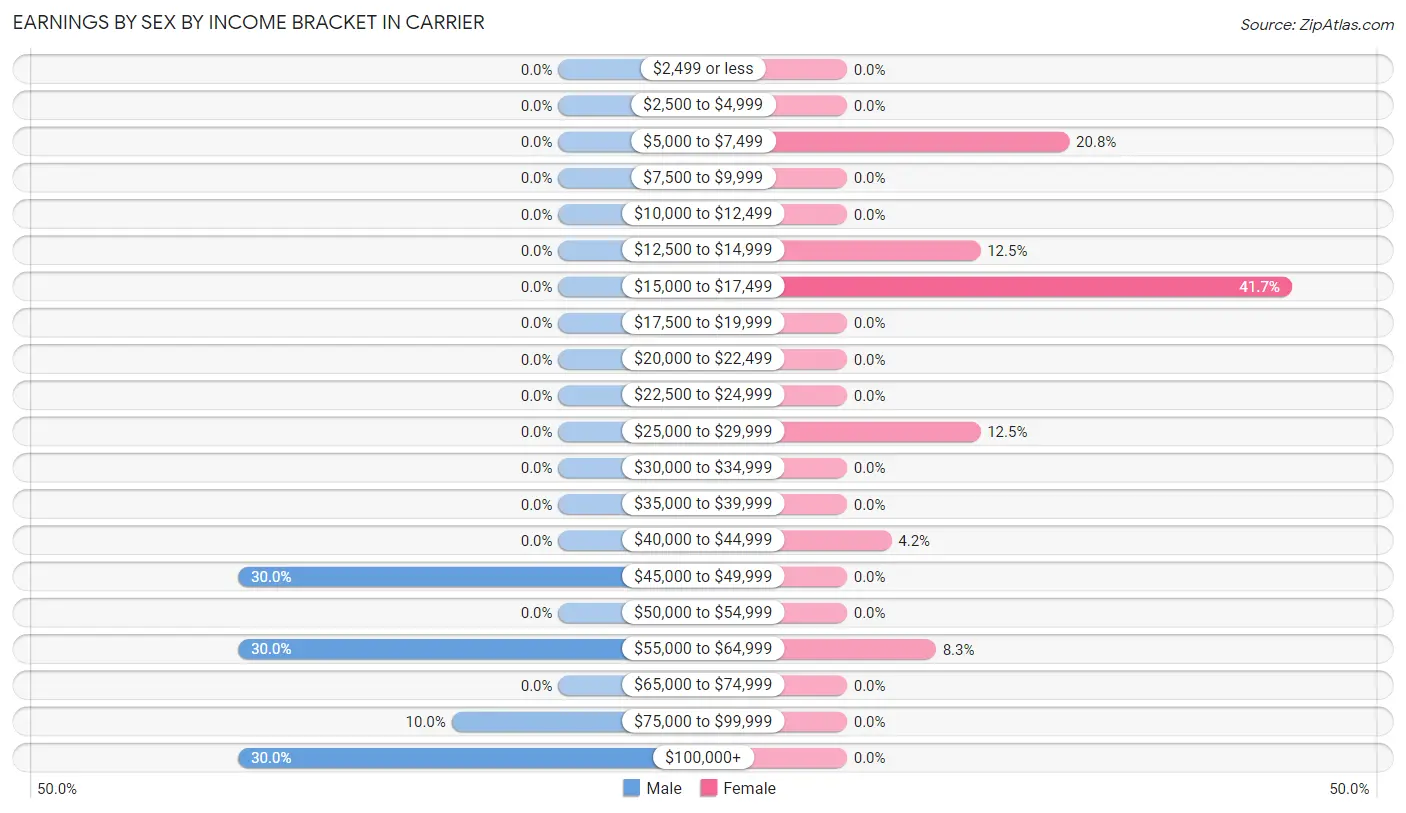
Earnings by Sex by Income Bracket in Carrier
The most common earnings brackets in Carrier are $45,000 to $49,999 for men (6 | 30.0%) and $15,000 to $17,499 for women (10 | 41.7%).
| Income | Male | Female |
| $2,499 or less | 0 (0.0%) | 0 (0.0%) |
| $2,500 to $4,999 | 0 (0.0%) | 0 (0.0%) |
| $5,000 to $7,499 | 0 (0.0%) | 5 (20.8%) |
| $7,500 to $9,999 | 0 (0.0%) | 0 (0.0%) |
| $10,000 to $12,499 | 0 (0.0%) | 0 (0.0%) |
| $12,500 to $14,999 | 0 (0.0%) | 3 (12.5%) |
| $15,000 to $17,499 | 0 (0.0%) | 10 (41.7%) |
| $17,500 to $19,999 | 0 (0.0%) | 0 (0.0%) |
| $20,000 to $22,499 | 0 (0.0%) | 0 (0.0%) |
| $22,500 to $24,999 | 0 (0.0%) | 0 (0.0%) |
| $25,000 to $29,999 | 0 (0.0%) | 3 (12.5%) |
| $30,000 to $34,999 | 0 (0.0%) | 0 (0.0%) |
| $35,000 to $39,999 | 0 (0.0%) | 0 (0.0%) |
| $40,000 to $44,999 | 0 (0.0%) | 1 (4.2%) |
| $45,000 to $49,999 | 6 (30.0%) | 0 (0.0%) |
| $50,000 to $54,999 | 0 (0.0%) | 0 (0.0%) |
| $55,000 to $64,999 | 6 (30.0%) | 2 (8.3%) |
| $65,000 to $74,999 | 0 (0.0%) | 0 (0.0%) |
| $75,000 to $99,999 | 2 (10.0%) | 0 (0.0%) |
| $100,000+ | 6 (30.0%) | 0 (0.0%) |
| Total | 20 (100.0%) | 24 (100.0%) |
Earnings by Sex by Educational Attainment in Carrier
Average earnings in Carrier are $61,250 for men and $16,375 for women, a difference of 73.3%. Men with an educational attainment of high school diploma enjoy the highest average annual earnings of $47,083, while those with high school diploma education earn the least with $47,083. Women with an educational attainment of high school diploma earn the most with the average annual earnings of $16,875, while those with high school diploma education have the smallest earnings of $16,875.
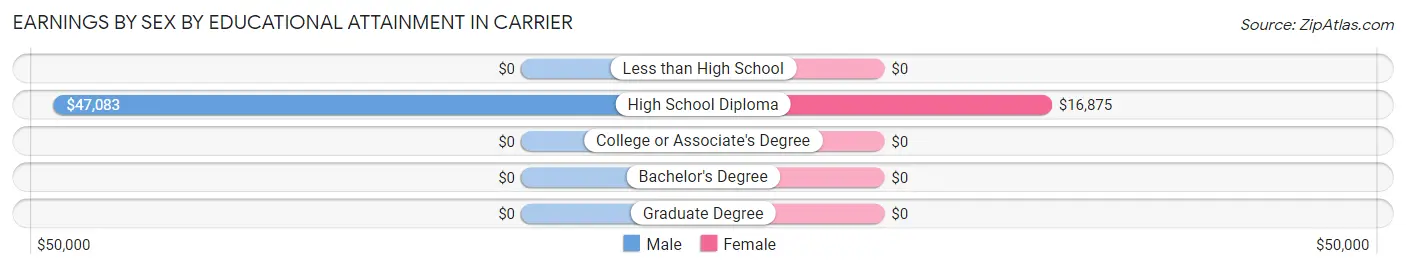
| Educational Attainment | Male Income | Female Income |
| Less than High School | - | - |
| High School Diploma | $47,083 | $16,875 |
| College or Associate's Degree | - | - |
| Bachelor's Degree | - | - |
| Graduate Degree | - | - |
| Total | $61,250 | $16,375 |
Family Income in Carrier
Family Income Brackets in Carrier
According to the Carrier family income data, there are 10 families falling into the $50,000 to $74,999 income range, which is the most common income bracket and makes up 45.5% of all families.
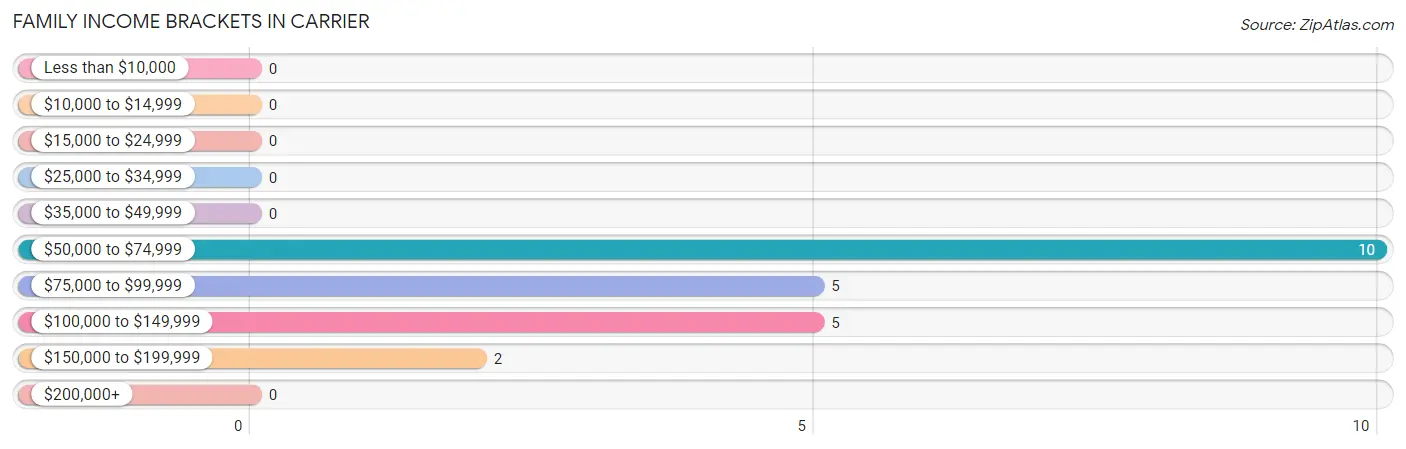
| Income Bracket | # Families | % Families |
| Less than $10,000 | 0 | 0.0% |
| $10,000 to $14,999 | 0 | 0.0% |
| $15,000 to $24,999 | 0 | 0.0% |
| $25,000 to $34,999 | 0 | 0.0% |
| $35,000 to $49,999 | 0 | 0.0% |
| $50,000 to $74,999 | 10 | 45.5% |
| $75,000 to $99,999 | 5 | 22.7% |
| $100,000 to $149,999 | 5 | 22.7% |
| $150,000 to $199,999 | 2 | 9.1% |
| $200,000+ | 0 | 0.0% |
Family Income by Famaliy Size in Carrier
| Income Bracket | # Families | Median Income |
| 2-Person Families | 11 (50.0%) | $0 |
| 3-Person Families | 4 (18.2%) | $0 |
| 4-Person Families | 7 (31.8%) | $0 |
| 5-Person Families | 0 (0.0%) | $0 |
| 6-Person Families | 0 (0.0%) | $0 |
| 7+ Person Families | 0 (0.0%) | $0 |
| Total | 22 (100.0%) | $78,000 |
Family Income by Number of Earners in Carrier
| Number of Earners | # Families | Median Income |
| No Earners | 0 (0.0%) | $0 |
| 1 Earner | 5 (22.7%) | $0 |
| 2 Earners | 15 (68.2%) | $0 |
| 3+ Earners | 2 (9.1%) | $0 |
| Total | 22 (100.0%) | $78,000 |
Household Income in Carrier
Household Income Brackets in Carrier
With 11 households falling in the category, the $10,000 to $14,999 income range is the most frequent in Carrier, accounting for 30.6% of all households.
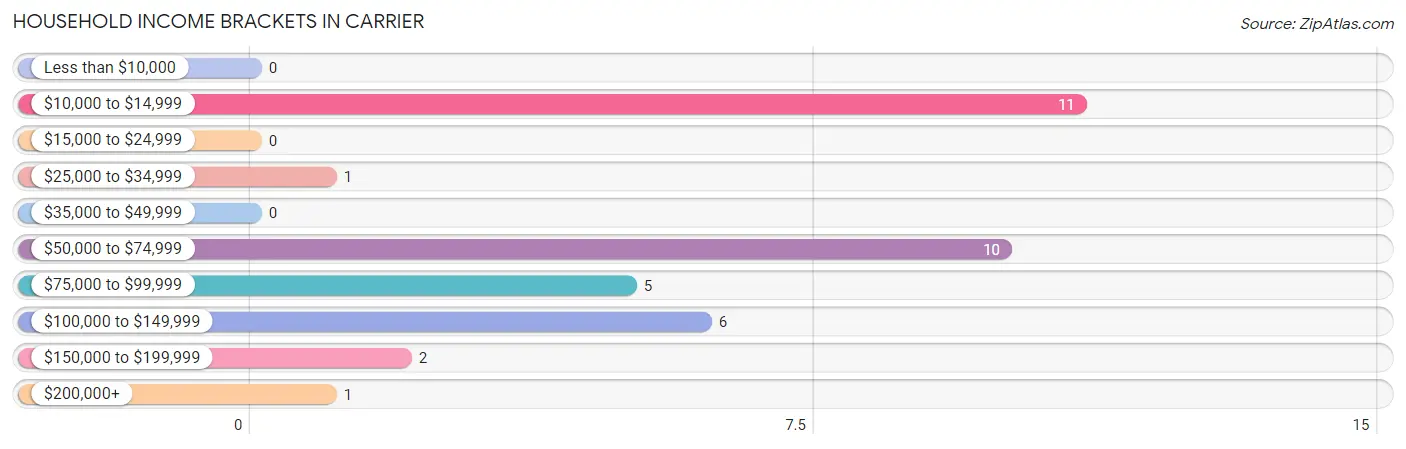
| Income Bracket | # Households | % Households |
| Less than $10,000 | 0 | 0.0% |
| $10,000 to $14,999 | 11 | 30.6% |
| $15,000 to $24,999 | 0 | 0.0% |
| $25,000 to $34,999 | 1 | 2.8% |
| $35,000 to $49,999 | 0 | 0.0% |
| $50,000 to $74,999 | 10 | 27.8% |
| $75,000 to $99,999 | 5 | 13.9% |
| $100,000 to $149,999 | 6 | 16.7% |
| $150,000 to $199,999 | 2 | 5.6% |
| $200,000+ | 1 | 2.8% |
Household Income by Householder Age in Carrier
| Income Bracket | # Households | Median Income |
| 15 to 24 Years | 0 (0.0%) | $0 |
| 25 to 44 Years | 6 (16.7%) | $0 |
| 45 to 64 Years | 24 (66.7%) | $0 |
| 65+ Years | 6 (16.7%) | $0 |
| Total | 36 (100.0%) | $62,500 |
Poverty in Carrier
Income Below Poverty by Sex and Age in Carrier
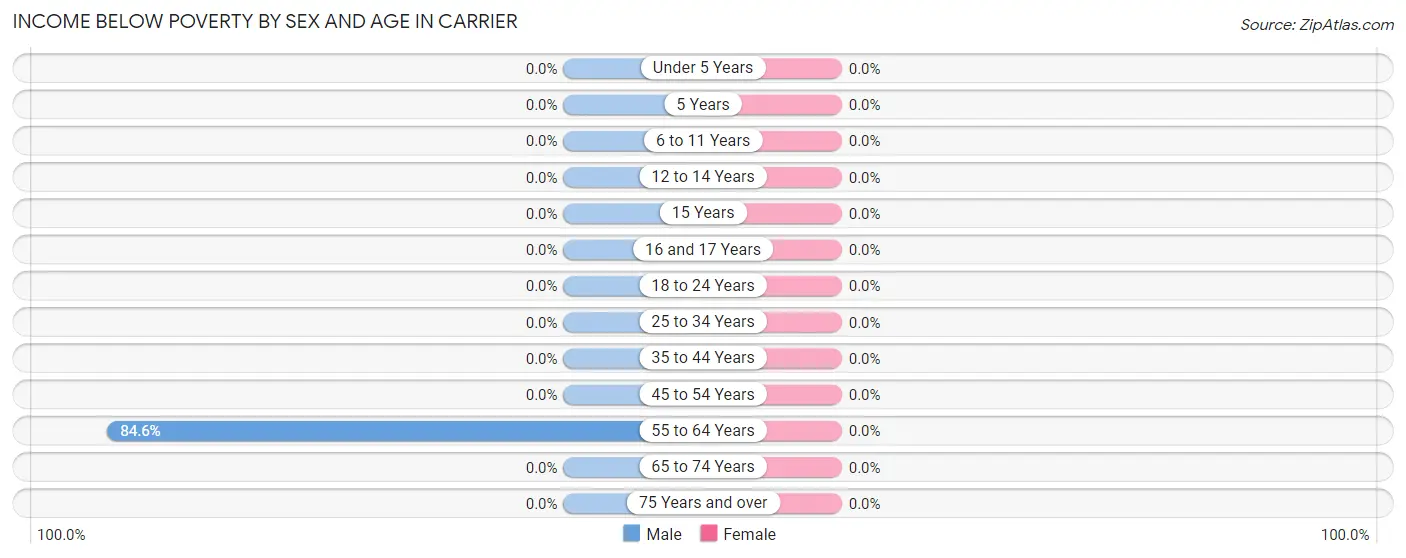
| Age Bracket | Male | Female |
| Under 5 Years | 0 (0.0%) | 0 (0.0%) |
| 5 Years | 0 (0.0%) | 0 (0.0%) |
| 6 to 11 Years | 0 (0.0%) | 0 (0.0%) |
| 12 to 14 Years | 0 (0.0%) | 0 (0.0%) |
| 15 Years | 0 (0.0%) | 0 (0.0%) |
| 16 and 17 Years | 0 (0.0%) | 0 (0.0%) |
| 18 to 24 Years | 0 (0.0%) | 0 (0.0%) |
| 25 to 34 Years | 0 (0.0%) | 0 (0.0%) |
| 35 to 44 Years | 0 (0.0%) | 0 (0.0%) |
| 45 to 54 Years | 0 (0.0%) | 0 (0.0%) |
| 55 to 64 Years | 11 (84.6%) | 0 (0.0%) |
| 65 to 74 Years | 0 (0.0%) | 0 (0.0%) |
| 75 Years and over | 0 (0.0%) | 0 (0.0%) |
| Total | 11 (29.7%) | 0 (0.0%) |
Income Above Poverty by Sex and Age in Carrier
According to the poverty statistics in Carrier, males aged 25 to 34 years and females aged under 5 years are the age groups that are most secure financially, with 100.0% of males and 100.0% of females in these age groups living above the poverty line.
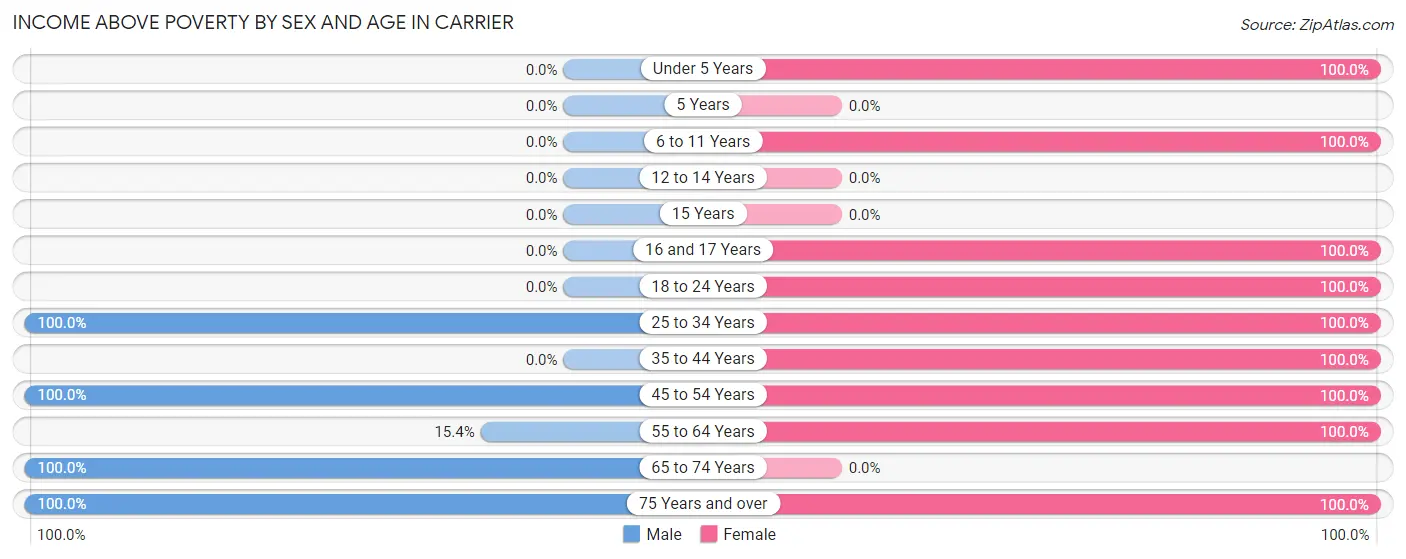
| Age Bracket | Male | Female |
| Under 5 Years | 0 (0.0%) | 10 (100.0%) |
| 5 Years | 0 (0.0%) | 0 (0.0%) |
| 6 to 11 Years | 0 (0.0%) | 14 (100.0%) |
| 12 to 14 Years | 0 (0.0%) | 0 (0.0%) |
| 15 Years | 0 (0.0%) | 0 (0.0%) |
| 16 and 17 Years | 0 (0.0%) | 2 (100.0%) |
| 18 to 24 Years | 0 (0.0%) | 3 (100.0%) |
| 25 to 34 Years | 4 (100.0%) | 5 (100.0%) |
| 35 to 44 Years | 0 (0.0%) | 7 (100.0%) |
| 45 to 54 Years | 14 (100.0%) | 6 (100.0%) |
| 55 to 64 Years | 2 (15.4%) | 3 (100.0%) |
| 65 to 74 Years | 5 (100.0%) | 0 (0.0%) |
| 75 Years and over | 1 (100.0%) | 2 (100.0%) |
| Total | 26 (70.3%) | 52 (100.0%) |
Income Below Poverty Among Married-Couple Families in Carrier
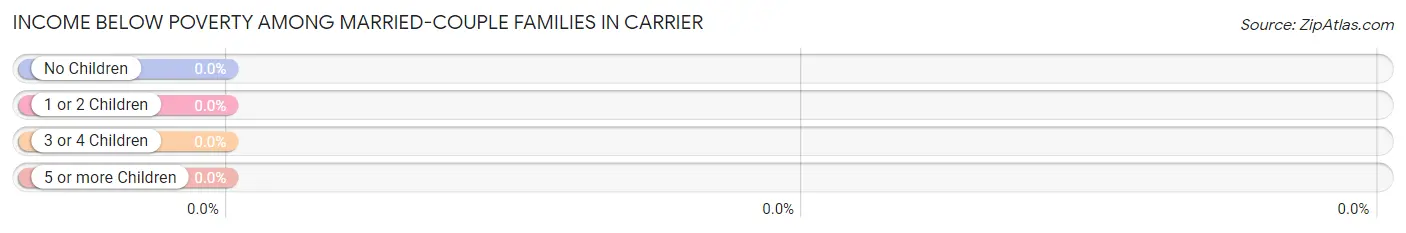
| Children | Above Poverty | Below Poverty |
| No Children | 15 (100.0%) | 0 (0.0%) |
| 1 or 2 Children | 7 (100.0%) | 0 (0.0%) |
| 3 or 4 Children | 0 (0.0%) | 0 (0.0%) |
| 5 or more Children | 0 (0.0%) | 0 (0.0%) |
| Total | 22 (100.0%) | 0 (0.0%) |
Income Below Poverty Among Single-Parent Households in Carrier
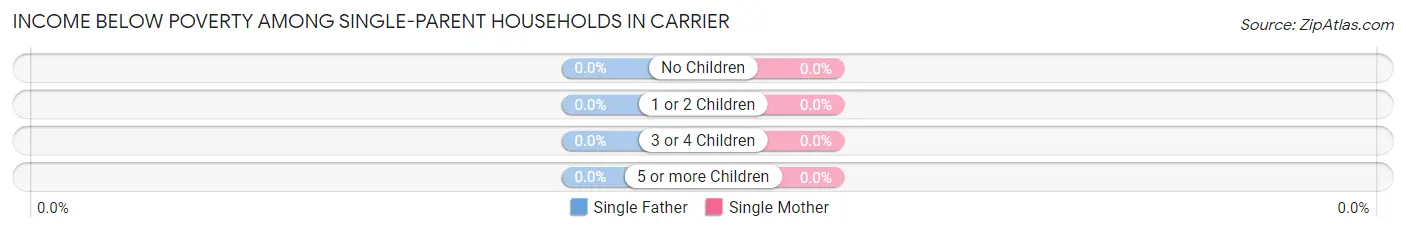
| Children | Single Father | Single Mother |
| No Children | 0 (0.0%) | 0 (0.0%) |
| 1 or 2 Children | 0 (0.0%) | 0 (0.0%) |
| 3 or 4 Children | 0 (0.0%) | 0 (0.0%) |
| 5 or more Children | 0 (0.0%) | 0 (0.0%) |
| Total | 0 (0.0%) | 0 (0.0%) |
Income Below Poverty Among Married-Couple vs Single-Parent Households in Carrier
| Children | Married-Couple Families | Single-Parent Households |
| No Children | 0 (0.0%) | 0 (0.0%) |
| 1 or 2 Children | 0 (0.0%) | 0 (0.0%) |
| 3 or 4 Children | 0 (0.0%) | 0 (0.0%) |
| 5 or more Children | 0 (0.0%) | 0 (0.0%) |
| Total | 0 (0.0%) | 0 (0.0%) |
Employment Characteristics in Carrier
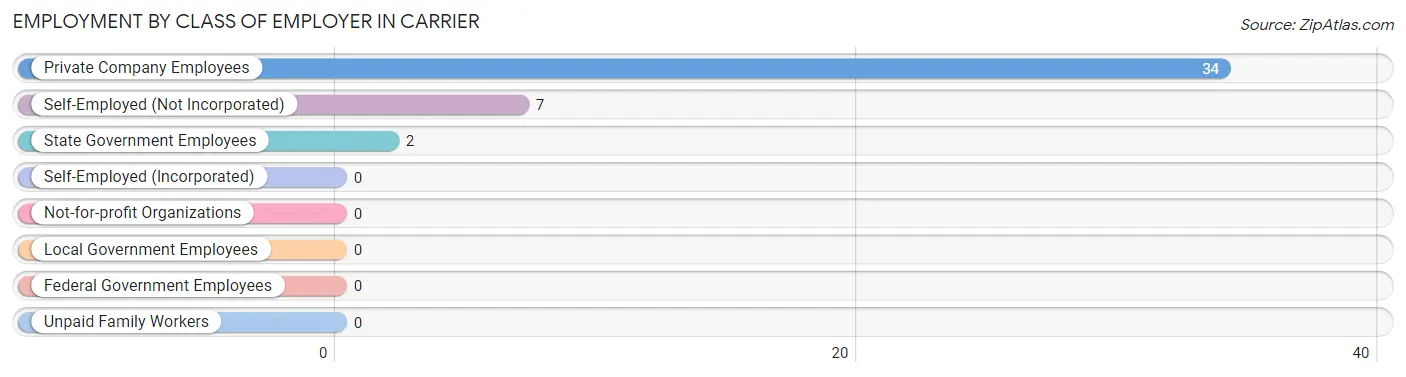
Employment by Class of Employer in Carrier
Among the 43 employed individuals in Carrier, private company employees (34 | 79.1%), self-employed (not incorporated) (7 | 16.3%), and state government employees (2 | 4.6%) make up the most common classes of employment.
| Employer Class | # Employees | % Employees |
| Private Company Employees | 34 | 79.1% |
| Self-Employed (Incorporated) | 0 | 0.0% |
| Self-Employed (Not Incorporated) | 7 | 16.3% |
| Not-for-profit Organizations | 0 | 0.0% |
| Local Government Employees | 0 | 0.0% |
| State Government Employees | 2 | 4.6% |
| Federal Government Employees | 0 | 0.0% |
| Unpaid Family Workers | 0 | 0.0% |
| Total | 43 | 100.0% |
Employment Status by Age in Carrier
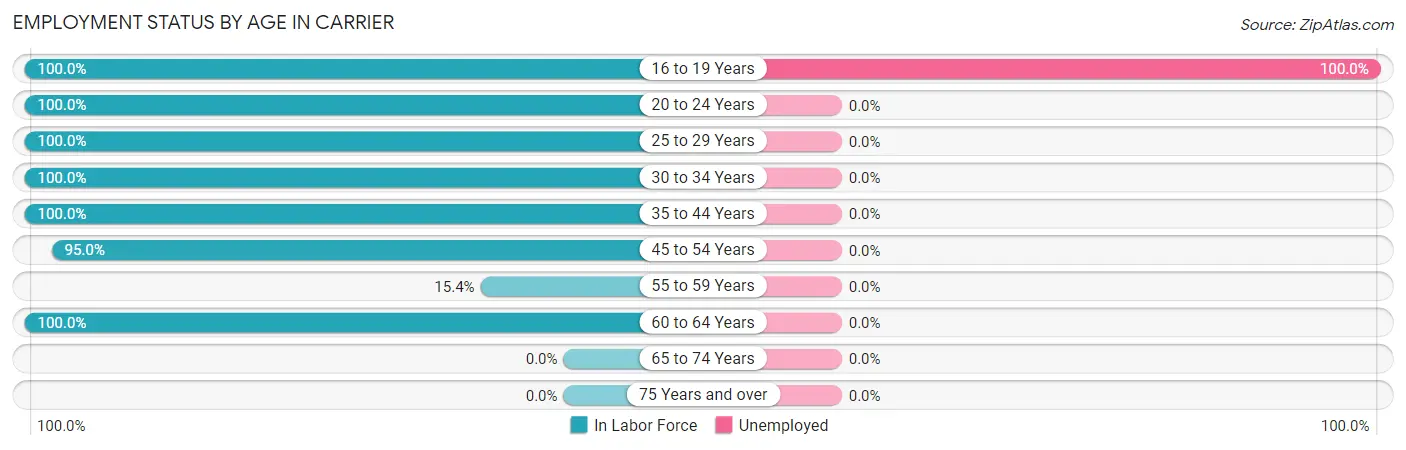
According to the labor force statistics for Carrier, out of the total population over 16 years of age (65), 69.2% or 45 individuals are in the labor force, with 4.4% or 2 of them unemployed. The age group with the highest labor force participation rate is 16 to 19 years, with 100.0% or 2 individuals in the labor force. Within the labor force, the 16 to 19 years age range has the highest percentage of unemployed individuals, with 100.0% or 2 of them being unemployed.
| Age Bracket | In Labor Force | Unemployed |
| 16 to 19 Years | 2 (100.0%) | 2 (100.0%) |
| 20 to 24 Years | 3 (100.0%) | 0 (0.0%) |
| 25 to 29 Years | 5 (100.0%) | 0 (0.0%) |
| 30 to 34 Years | 4 (100.0%) | 0 (0.0%) |
| 35 to 44 Years | 7 (100.0%) | 0 (0.0%) |
| 45 to 54 Years | 19 (95.0%) | 0 (0.0%) |
| 55 to 59 Years | 2 (15.4%) | 0 (0.0%) |
| 60 to 64 Years | 3 (100.0%) | 0 (0.0%) |
| 65 to 74 Years | 0 (0.0%) | 0 (0.0%) |
| 75 Years and over | 0 (0.0%) | 0 (0.0%) |
| Total | 45 (69.2%) | 2 (4.4%) |
Employment Status by Educational Attainment in Carrier
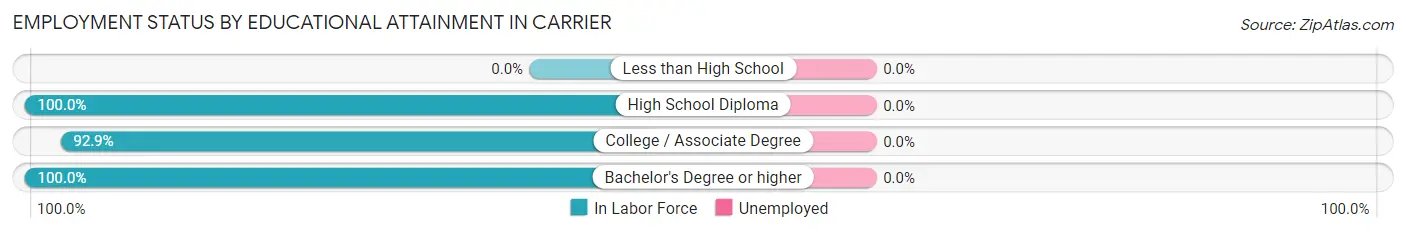
| Educational Attainment | In Labor Force | Unemployed |
| Less than High School | 0 (0.0%) | 0 (0.0%) |
| High School Diploma | 22 (100.0%) | 0 (0.0%) |
| College / Associate Degree | 13 (92.9%) | 0 (0.0%) |
| Bachelor's Degree or higher | 5 (100.0%) | 0 (0.0%) |
| Total | 40 (76.9%) | 0 (0.0%) |
Employment Occupations by Sex in Carrier
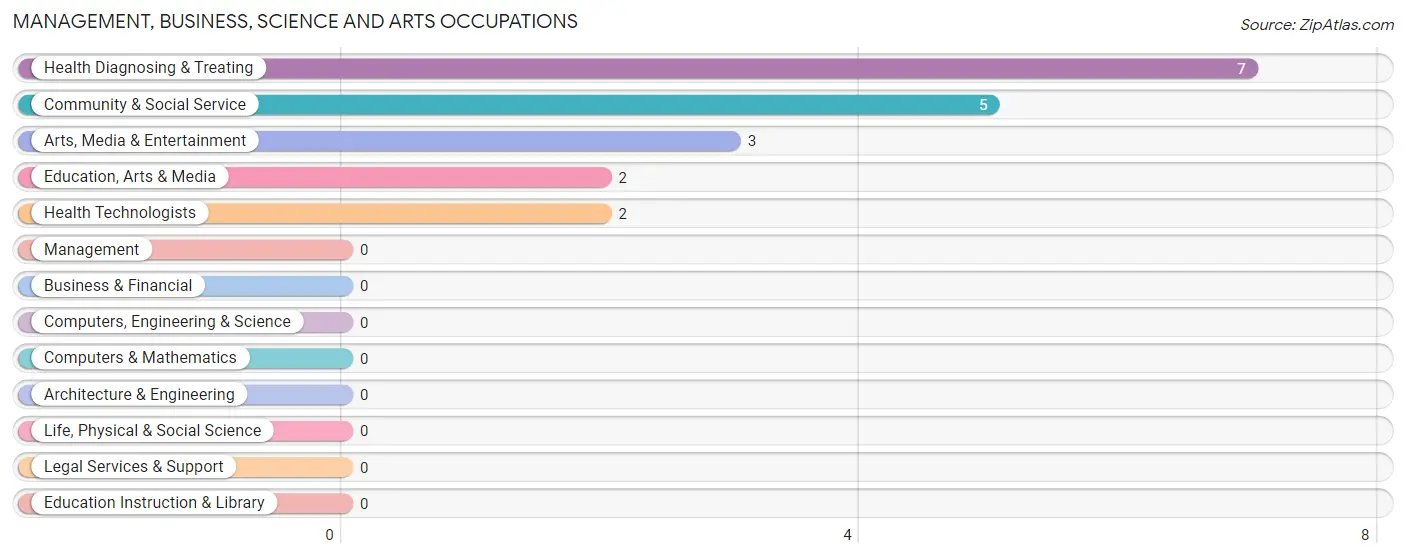
Management, Business, Science and Arts Occupations
The most common Management, Business, Science and Arts occupations in Carrier are Health Diagnosing & Treating (7 | 16.3%), Community & Social Service (5 | 11.6%), Arts, Media & Entertainment (3 | 7.0%), Education, Arts & Media (2 | 4.6%), and Health Technologists (2 | 4.6%).
Management, Business, Science and Arts Occupations by Sex
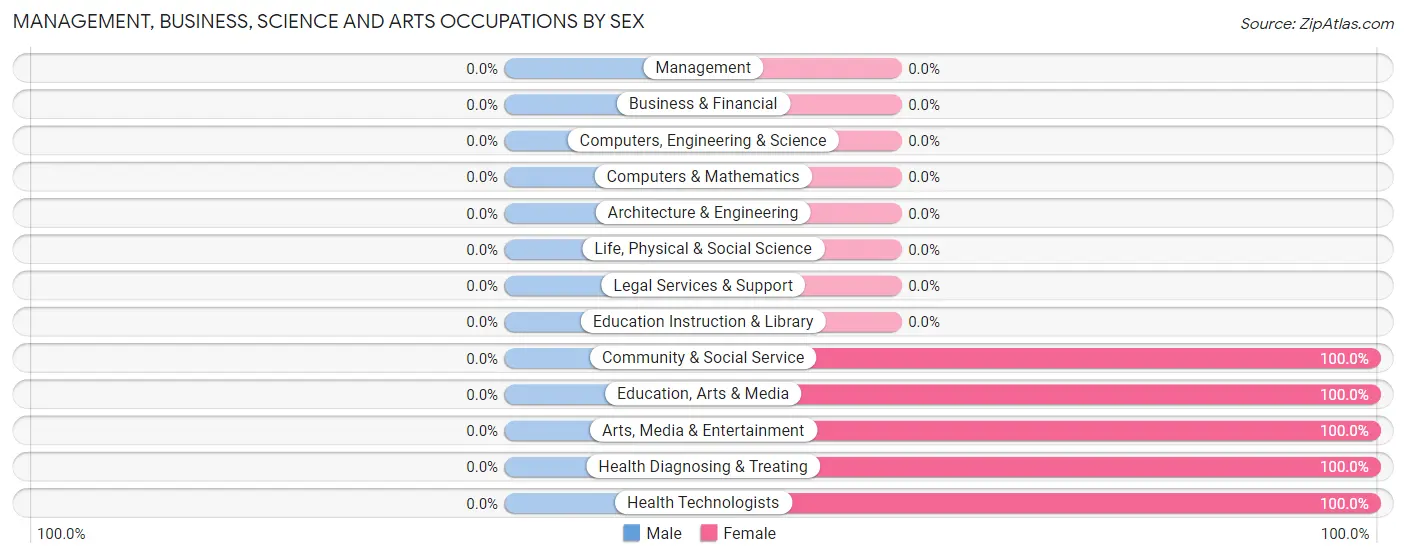
| Occupation | Male | Female |
| Management | 0 (0.0%) | 0 (0.0%) |
| Business & Financial | 0 (0.0%) | 0 (0.0%) |
| Computers, Engineering & Science | 0 (0.0%) | 0 (0.0%) |
| Computers & Mathematics | 0 (0.0%) | 0 (0.0%) |
| Architecture & Engineering | 0 (0.0%) | 0 (0.0%) |
| Life, Physical & Social Science | 0 (0.0%) | 0 (0.0%) |
| Community & Social Service | 0 (0.0%) | 5 (100.0%) |
| Education, Arts & Media | 0 (0.0%) | 2 (100.0%) |
| Legal Services & Support | 0 (0.0%) | 0 (0.0%) |
| Education Instruction & Library | 0 (0.0%) | 0 (0.0%) |
| Arts, Media & Entertainment | 0 (0.0%) | 3 (100.0%) |
| Health Diagnosing & Treating | 0 (0.0%) | 7 (100.0%) |
| Health Technologists | 0 (0.0%) | 2 (100.0%) |
| Total (Category) | 0 (0.0%) | 12 (100.0%) |
| Total (Overall) | 19 (44.2%) | 24 (55.8%) |
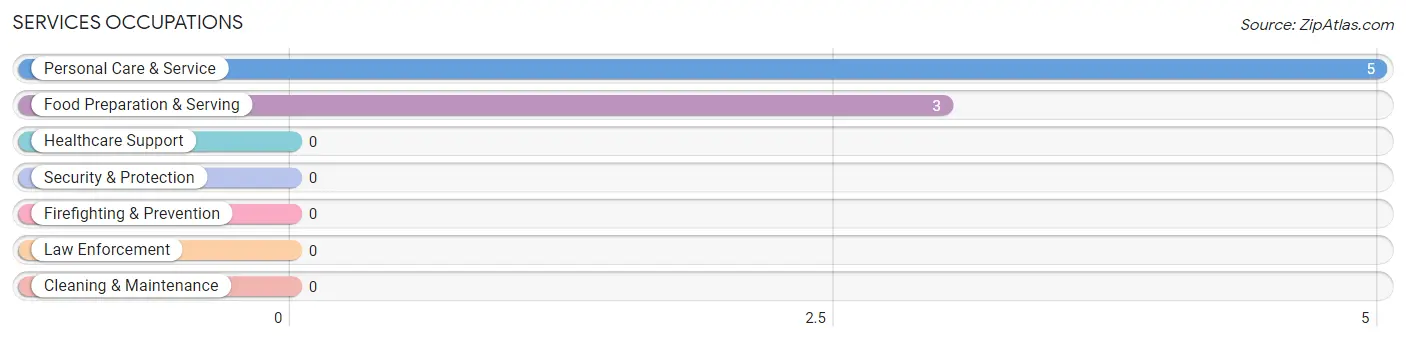
Services Occupations
The most common Services occupations in Carrier are Personal Care & Service (5 | 11.6%), and Food Preparation & Serving (3 | 7.0%).
Services Occupations by Sex
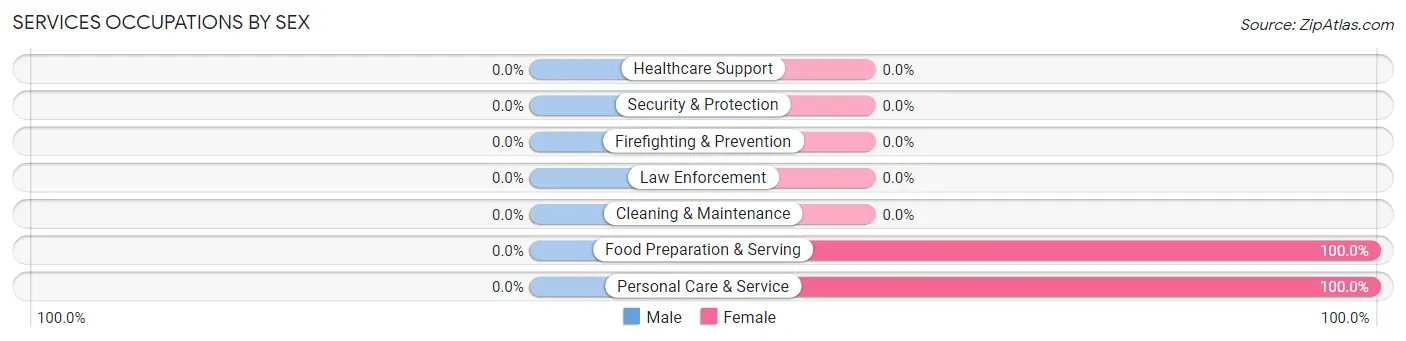
| Occupation | Male | Female |
| Healthcare Support | 0 (0.0%) | 0 (0.0%) |
| Security & Protection | 0 (0.0%) | 0 (0.0%) |
| Firefighting & Prevention | 0 (0.0%) | 0 (0.0%) |
| Law Enforcement | 0 (0.0%) | 0 (0.0%) |
| Food Preparation & Serving | 0 (0.0%) | 3 (100.0%) |
| Cleaning & Maintenance | 0 (0.0%) | 0 (0.0%) |
| Personal Care & Service | 0 (0.0%) | 5 (100.0%) |
| Total (Category) | 0 (0.0%) | 8 (100.0%) |
| Total (Overall) | 19 (44.2%) | 24 (55.8%) |
Sales and Office Occupations
The most common Sales and Office occupations in Carrier are Sales & Related (8 | 18.6%), and Office & Administration (8 | 18.6%).
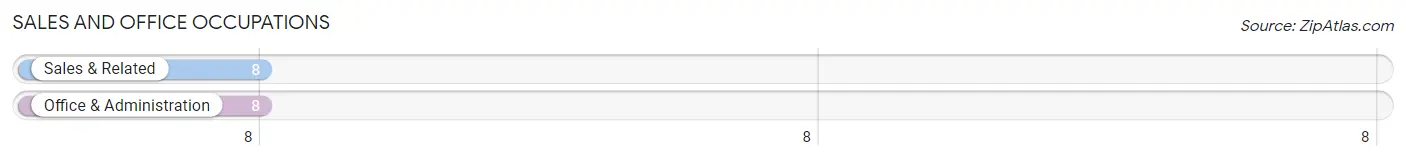
Sales and Office Occupations by Sex

| Occupation | Male | Female |
| Sales & Related | 8 (100.0%) | 0 (0.0%) |
| Office & Administration | 4 (50.0%) | 4 (50.0%) |
| Total (Category) | 12 (75.0%) | 4 (25.0%) |
| Total (Overall) | 19 (44.2%) | 24 (55.8%) |
Natural Resources, Construction and Maintenance Occupations
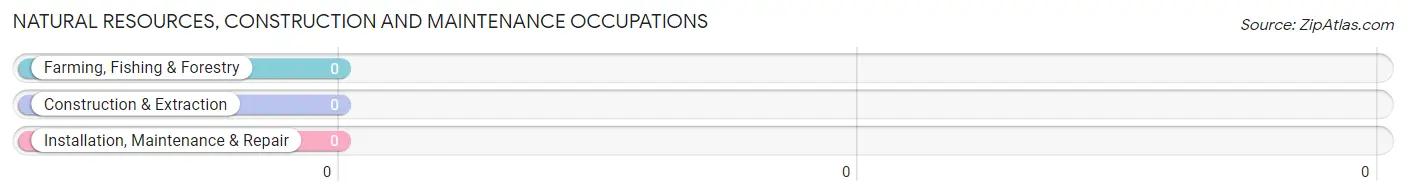
Natural Resources, Construction and Maintenance Occupations by Sex
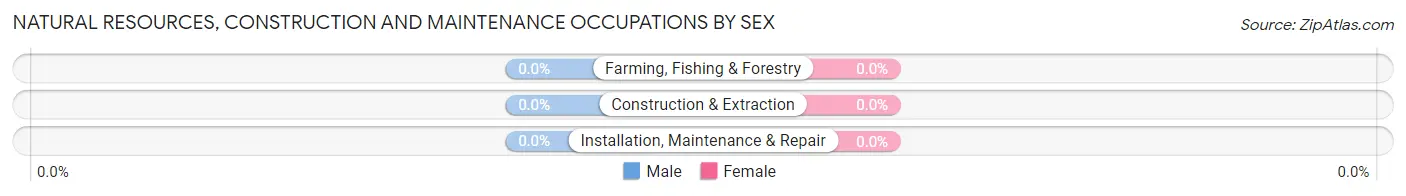
| Occupation | Male | Female |
| Farming, Fishing & Forestry | 0 (0.0%) | 0 (0.0%) |
| Construction & Extraction | 0 (0.0%) | 0 (0.0%) |
| Installation, Maintenance & Repair | 0 (0.0%) | 0 (0.0%) |
| Total (Category) | 0 (0.0%) | 0 (0.0%) |
| Total (Overall) | 19 (44.2%) | 24 (55.8%) |
Production, Transportation and Moving Occupations
The most common Production, Transportation and Moving occupations in Carrier are Transportation (4 | 9.3%), and Production (3 | 7.0%).
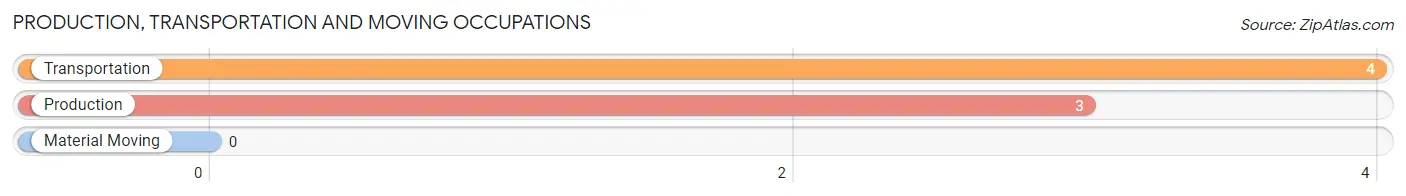
Production, Transportation and Moving Occupations by Sex
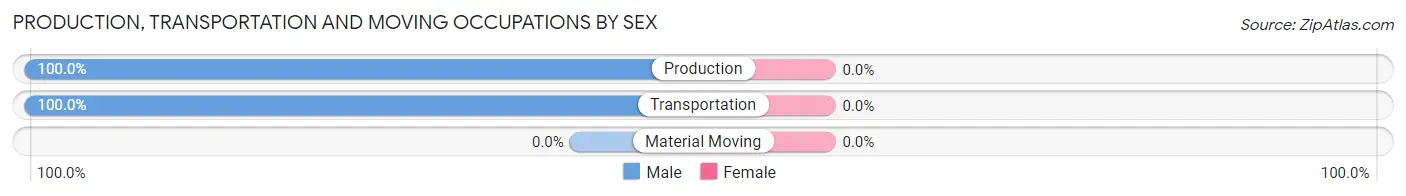
| Occupation | Male | Female |
| Production | 3 (100.0%) | 0 (0.0%) |
| Transportation | 4 (100.0%) | 0 (0.0%) |
| Material Moving | 0 (0.0%) | 0 (0.0%) |
| Total (Category) | 7 (100.0%) | 0 (0.0%) |
| Total (Overall) | 19 (44.2%) | 24 (55.8%) |
Employment Industries by Sex in Carrier
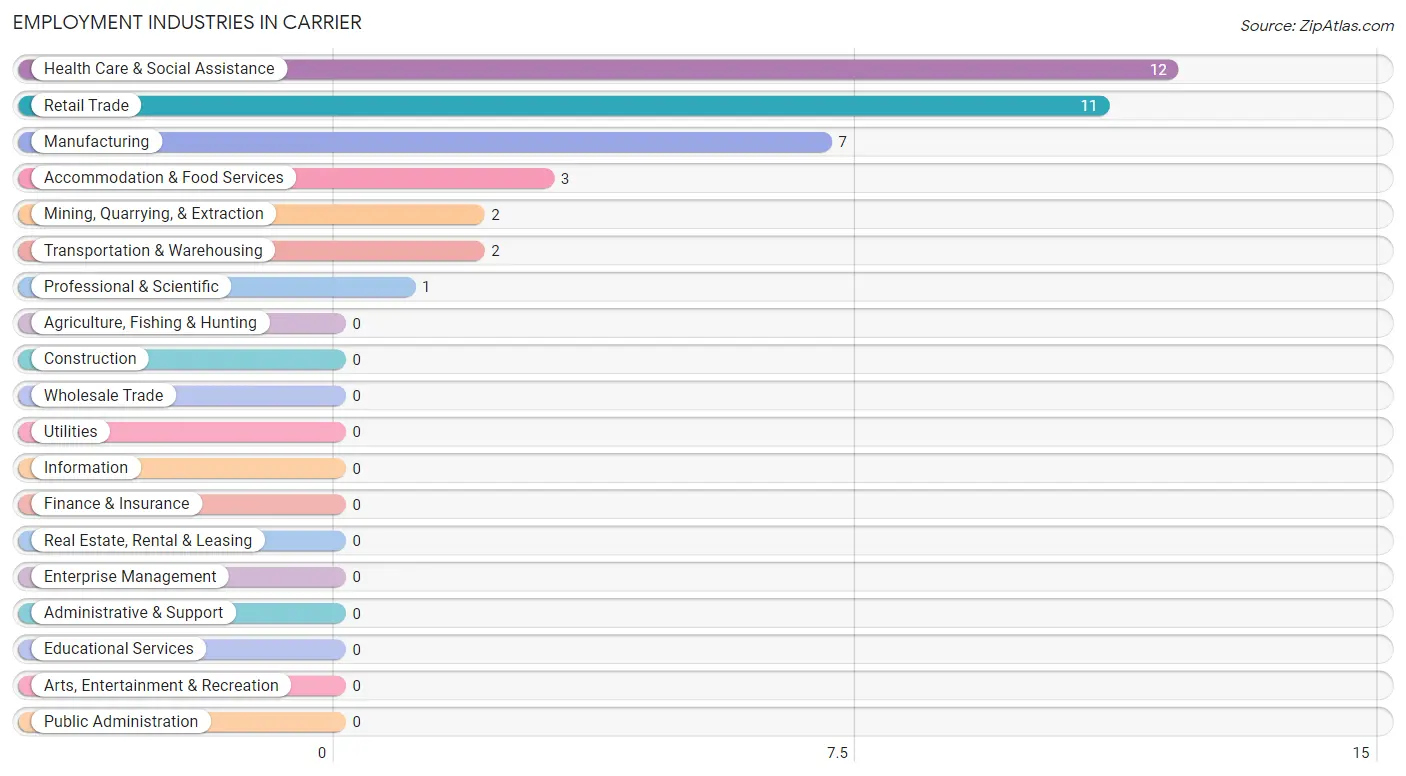
Employment Industries in Carrier
The major employment industries in Carrier include Health Care & Social Assistance (12 | 27.9%), Retail Trade (11 | 25.6%), Manufacturing (7 | 16.3%), Accommodation & Food Services (3 | 7.0%), and Mining, Quarrying, & Extraction (2 | 4.6%).
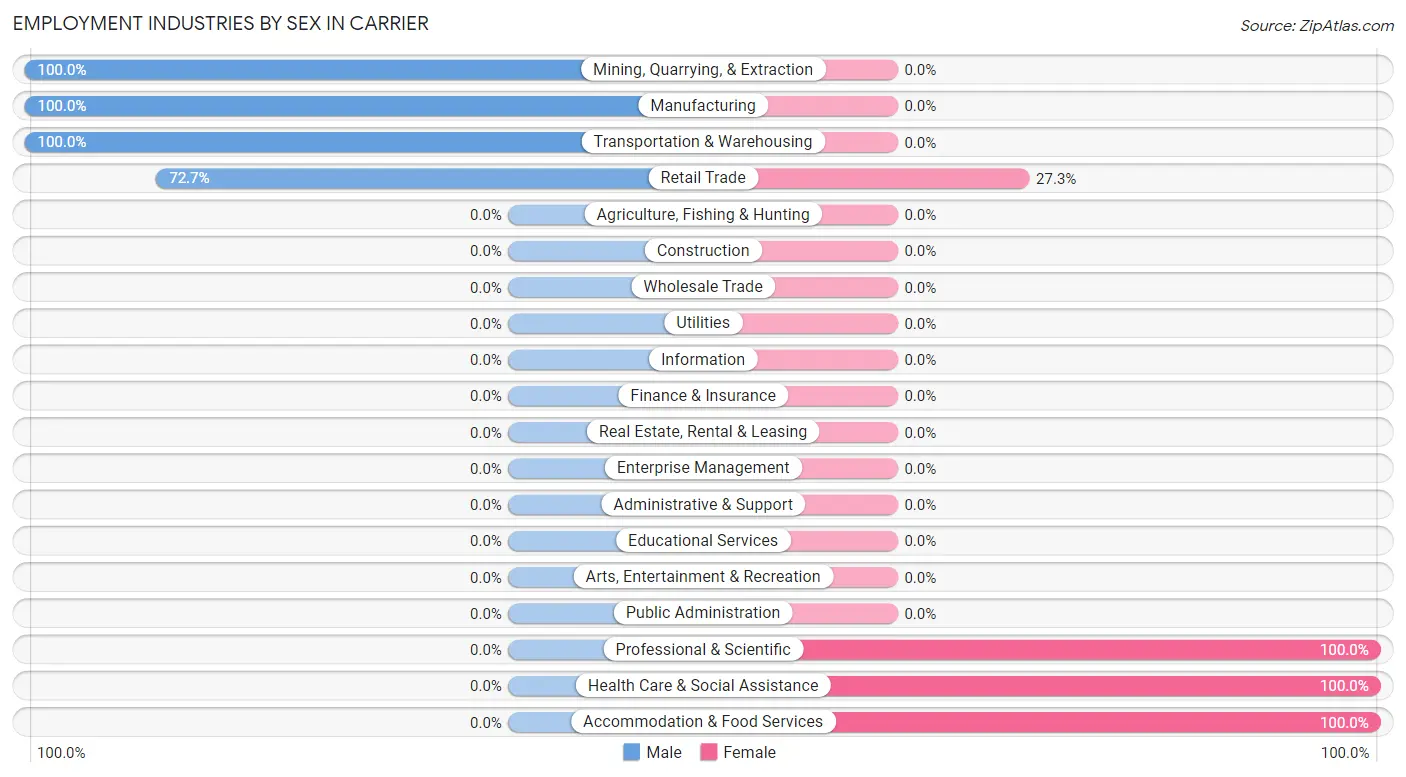
Employment Industries by Sex in Carrier
The Carrier industries that see more men than women are Mining, Quarrying, & Extraction (100.0%), Manufacturing (100.0%), and Transportation & Warehousing (100.0%), whereas the industries that tend to have a higher number of women are Professional & Scientific (100.0%), Health Care & Social Assistance (100.0%), and Accommodation & Food Services (100.0%).
| Industry | Male | Female |
| Agriculture, Fishing & Hunting | 0 (0.0%) | 0 (0.0%) |
| Mining, Quarrying, & Extraction | 2 (100.0%) | 0 (0.0%) |
| Construction | 0 (0.0%) | 0 (0.0%) |
| Manufacturing | 7 (100.0%) | 0 (0.0%) |
| Wholesale Trade | 0 (0.0%) | 0 (0.0%) |
| Retail Trade | 8 (72.7%) | 3 (27.3%) |
| Transportation & Warehousing | 2 (100.0%) | 0 (0.0%) |
| Utilities | 0 (0.0%) | 0 (0.0%) |
| Information | 0 (0.0%) | 0 (0.0%) |
| Finance & Insurance | 0 (0.0%) | 0 (0.0%) |
| Real Estate, Rental & Leasing | 0 (0.0%) | 0 (0.0%) |
| Professional & Scientific | 0 (0.0%) | 1 (100.0%) |
| Enterprise Management | 0 (0.0%) | 0 (0.0%) |
| Administrative & Support | 0 (0.0%) | 0 (0.0%) |
| Educational Services | 0 (0.0%) | 0 (0.0%) |
| Health Care & Social Assistance | 0 (0.0%) | 12 (100.0%) |
| Arts, Entertainment & Recreation | 0 (0.0%) | 0 (0.0%) |
| Accommodation & Food Services | 0 (0.0%) | 3 (100.0%) |
| Public Administration | 0 (0.0%) | 0 (0.0%) |
| Total | 19 (44.2%) | 24 (55.8%) |
Education in Carrier
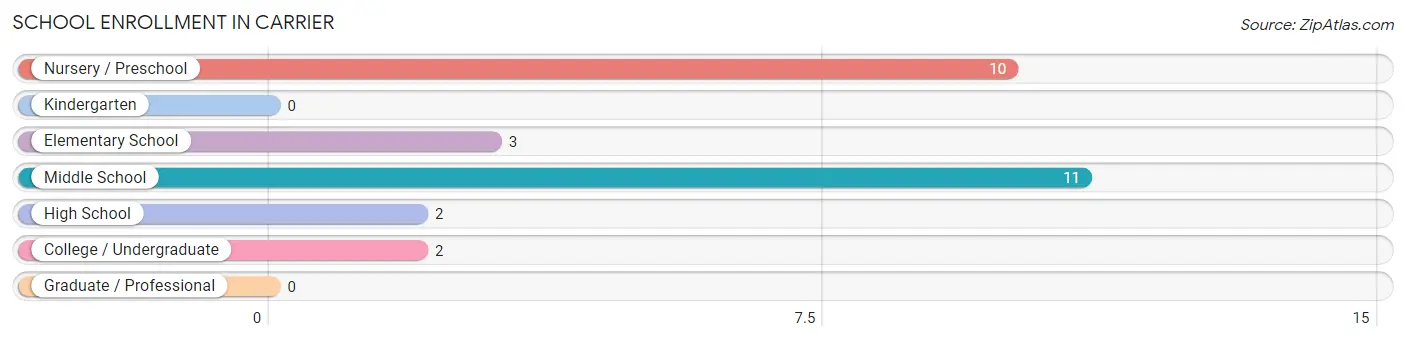
School Enrollment in Carrier
The most common levels of schooling among the 28 students in Carrier are middle school (11 | 39.3%), nursery / preschool (10 | 35.7%), and elementary school (3 | 10.7%).
| School Level | # Students | % Students |
| Nursery / Preschool | 10 | 35.7% |
| Kindergarten | 0 | 0.0% |
| Elementary School | 3 | 10.7% |
| Middle School | 11 | 39.3% |
| High School | 2 | 7.1% |
| College / Undergraduate | 2 | 7.1% |
| Graduate / Professional | 0 | 0.0% |
| Total | 28 | 100.0% |
School Enrollment by Age by Funding Source in Carrier
Out of a total of 28 students who are enrolled in schools in Carrier, 3 (10.7%) attend a private institution, while the remaining 25 (89.3%) are enrolled in public schools. The age group of 5 to 9 year old has the highest likelihood of being enrolled in private schools, with 3 (100.0% in the age bracket) enrolled. Conversely, the age group of 3 to 4 year olds has the lowest likelihood of being enrolled in a private school, with 10 (100.0% in the age bracket) attending a public institution.
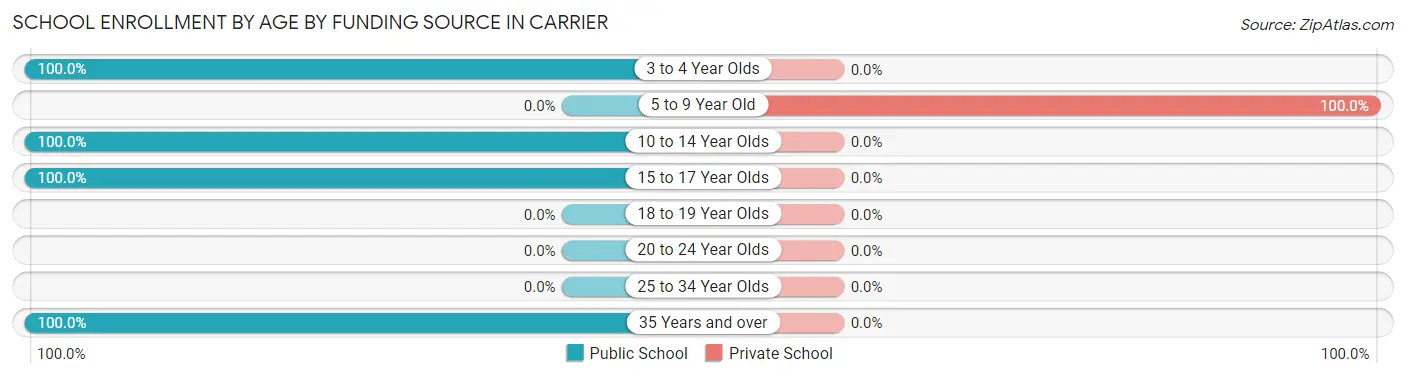
| Age Bracket | Public School | Private School |
| 3 to 4 Year Olds | 10 (100.0%) | 0 (0.0%) |
| 5 to 9 Year Old | 0 (0.0%) | 3 (100.0%) |
| 10 to 14 Year Olds | 11 (100.0%) | 0 (0.0%) |
| 15 to 17 Year Olds | 2 (100.0%) | 0 (0.0%) |
| 18 to 19 Year Olds | 0 (0.0%) | 0 (0.0%) |
| 20 to 24 Year Olds | 0 (0.0%) | 0 (0.0%) |
| 25 to 34 Year Olds | 0 (0.0%) | 0 (0.0%) |
| 35 Years and over | 2 (100.0%) | 0 (0.0%) |
| Total | 25 (89.3%) | 3 (10.7%) |
Educational Attainment by Field of Study in Carrier
Business (3 | 50.0%), education (2 | 33.3%), and bio, nature & agricultural (1 | 16.7%) are the most common fields of study among 6 individuals in Carrier who have obtained a bachelor's degree or higher.
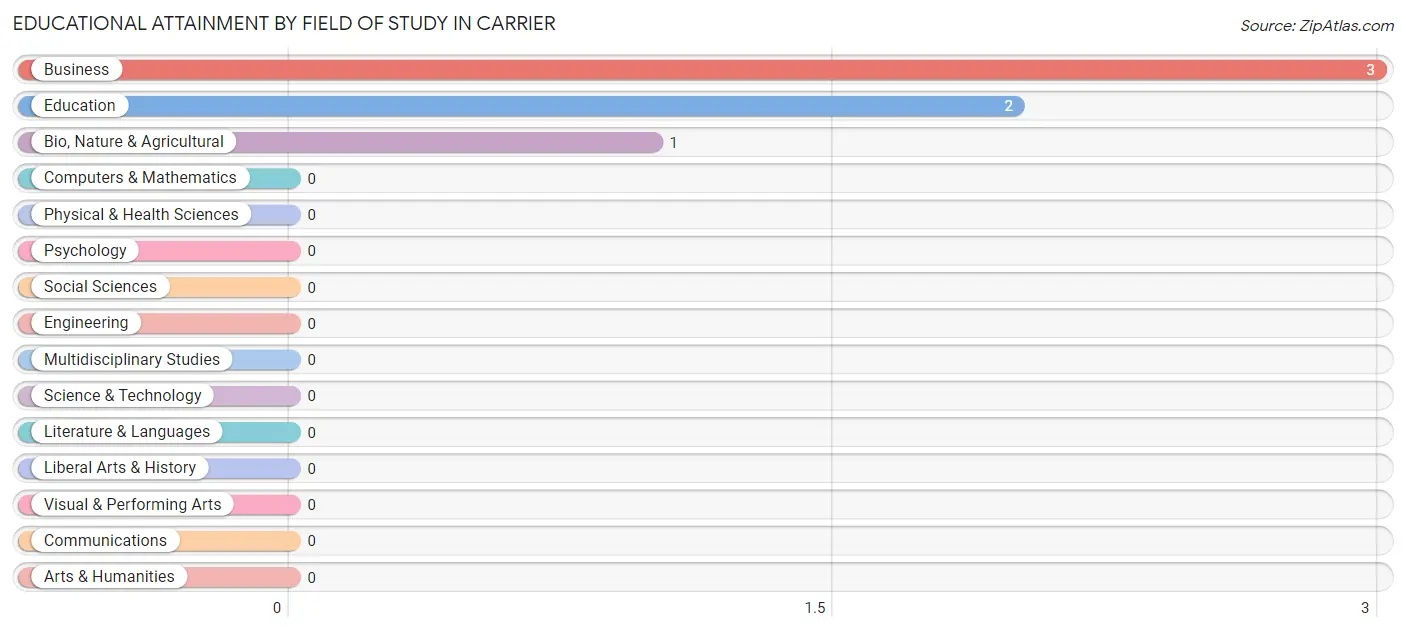
| Field of Study | # Graduates | % Graduates |
| Computers & Mathematics | 0 | 0.0% |
| Bio, Nature & Agricultural | 1 | 16.7% |
| Physical & Health Sciences | 0 | 0.0% |
| Psychology | 0 | 0.0% |
| Social Sciences | 0 | 0.0% |
| Engineering | 0 | 0.0% |
| Multidisciplinary Studies | 0 | 0.0% |
| Science & Technology | 0 | 0.0% |
| Business | 3 | 50.0% |
| Education | 2 | 33.3% |
| Literature & Languages | 0 | 0.0% |
| Liberal Arts & History | 0 | 0.0% |
| Visual & Performing Arts | 0 | 0.0% |
| Communications | 0 | 0.0% |
| Arts & Humanities | 0 | 0.0% |
| Total | 6 | 100.0% |
Transportation & Commute in Carrier
Vehicle Availability by Sex in Carrier
The most prevalent vehicle ownership categories in Carrier are males with 4 vehicles (8, accounting for 42.1%) and females with 4 vehicles (13, making up 33.3%).
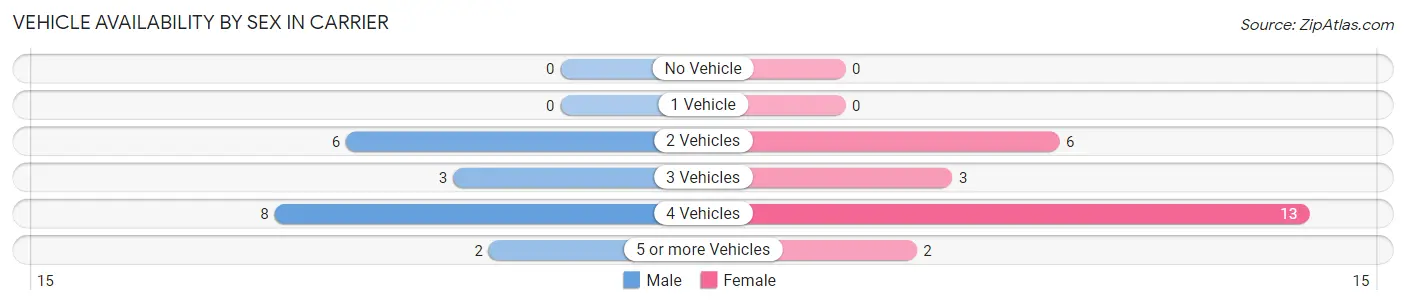
| Vehicles Available | Male | Female |
| No Vehicle | 0 (0.0%) | 0 (0.0%) |
| 1 Vehicle | 0 (0.0%) | 0 (0.0%) |
| 2 Vehicles | 6 (31.6%) | 6 (25.0%) |
| 3 Vehicles | 3 (15.8%) | 3 (12.5%) |
| 4 Vehicles | 8 (42.1%) | 13 (54.2%) |
| 5 or more Vehicles | 2 (10.5%) | 2 (8.3%) |
| Total | 19 (100.0%) | 24 (100.0%) |
Commute Time in Carrier
The most frequently occuring commute durations in Carrier are 15 to 19 minutes (22 commuters, 51.2%), 20 to 24 minutes (8 commuters, 18.6%), and 25 to 29 minutes (8 commuters, 18.6%).
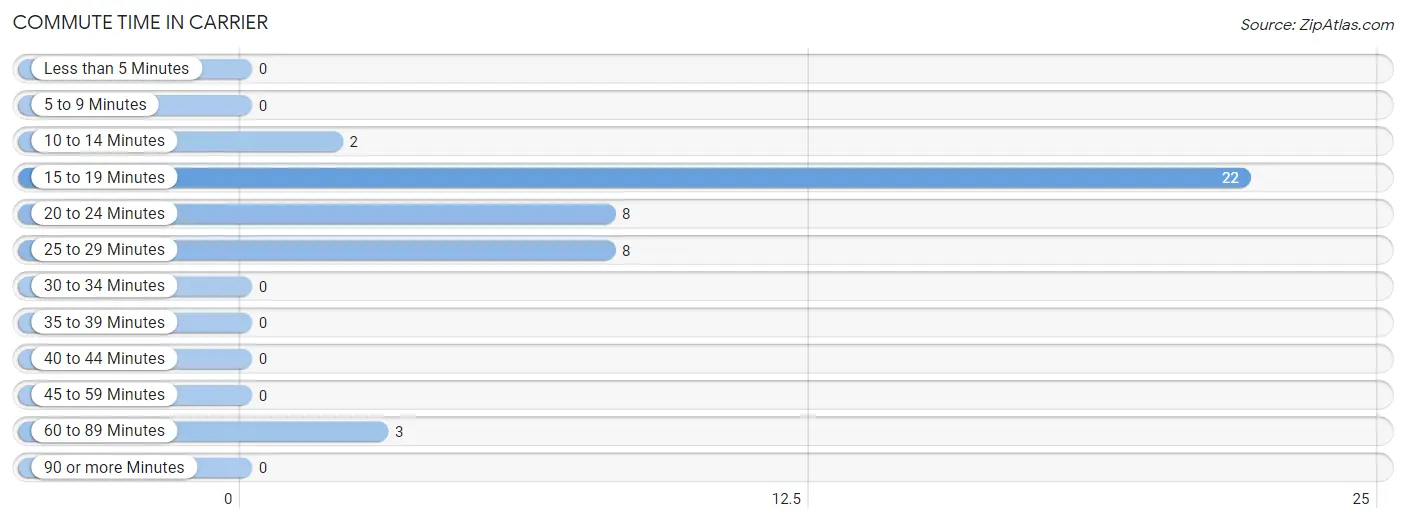
| Commute Time | # Commuters | % Commuters |
| Less than 5 Minutes | 0 | 0.0% |
| 5 to 9 Minutes | 0 | 0.0% |
| 10 to 14 Minutes | 2 | 4.6% |
| 15 to 19 Minutes | 22 | 51.2% |
| 20 to 24 Minutes | 8 | 18.6% |
| 25 to 29 Minutes | 8 | 18.6% |
| 30 to 34 Minutes | 0 | 0.0% |
| 35 to 39 Minutes | 0 | 0.0% |
| 40 to 44 Minutes | 0 | 0.0% |
| 45 to 59 Minutes | 0 | 0.0% |
| 60 to 89 Minutes | 3 | 7.0% |
| 90 or more Minutes | 0 | 0.0% |
Commute Time by Sex in Carrier
The most common commute times in Carrier are 15 to 19 minutes (12 commuters, 63.2%) for males and 15 to 19 minutes (10 commuters, 41.7%) for females.
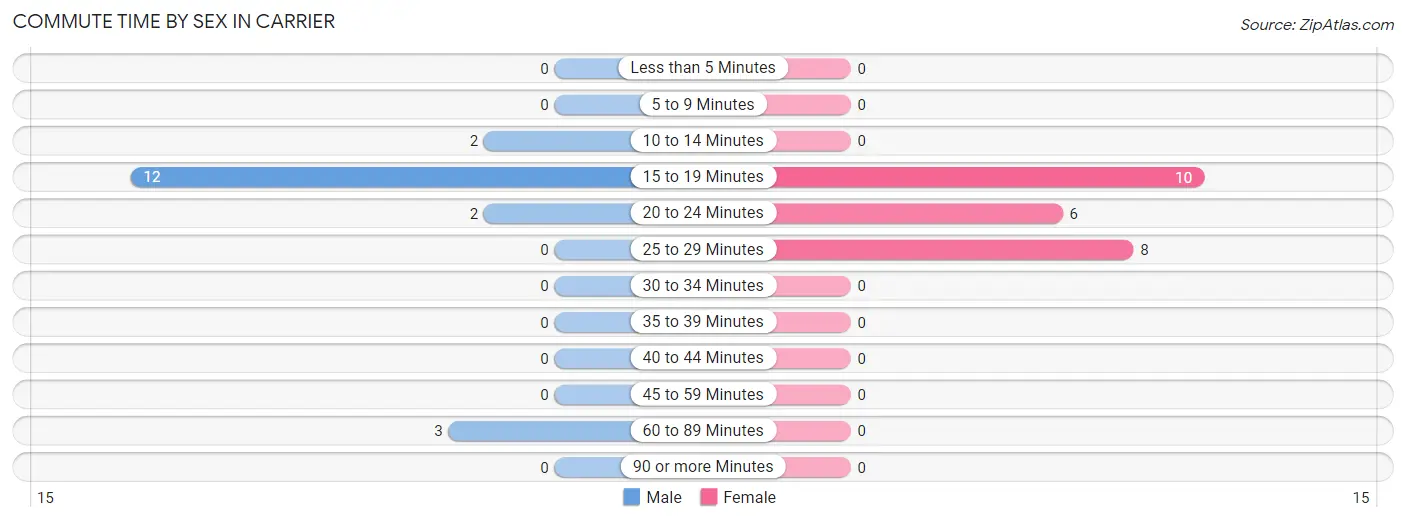
| Commute Time | Male | Female |
| Less than 5 Minutes | 0 (0.0%) | 0 (0.0%) |
| 5 to 9 Minutes | 0 (0.0%) | 0 (0.0%) |
| 10 to 14 Minutes | 2 (10.5%) | 0 (0.0%) |
| 15 to 19 Minutes | 12 (63.2%) | 10 (41.7%) |
| 20 to 24 Minutes | 2 (10.5%) | 6 (25.0%) |
| 25 to 29 Minutes | 0 (0.0%) | 8 (33.3%) |
| 30 to 34 Minutes | 0 (0.0%) | 0 (0.0%) |
| 35 to 39 Minutes | 0 (0.0%) | 0 (0.0%) |
| 40 to 44 Minutes | 0 (0.0%) | 0 (0.0%) |
| 45 to 59 Minutes | 0 (0.0%) | 0 (0.0%) |
| 60 to 89 Minutes | 3 (15.8%) | 0 (0.0%) |
| 90 or more Minutes | 0 (0.0%) | 0 (0.0%) |
Time of Departure to Work by Sex in Carrier
The most frequent times of departure to work in Carrier are 7:00 AM to 7:29 AM (8, 42.1%) for males and 7:00 AM to 7:29 AM (11, 45.8%) for females.
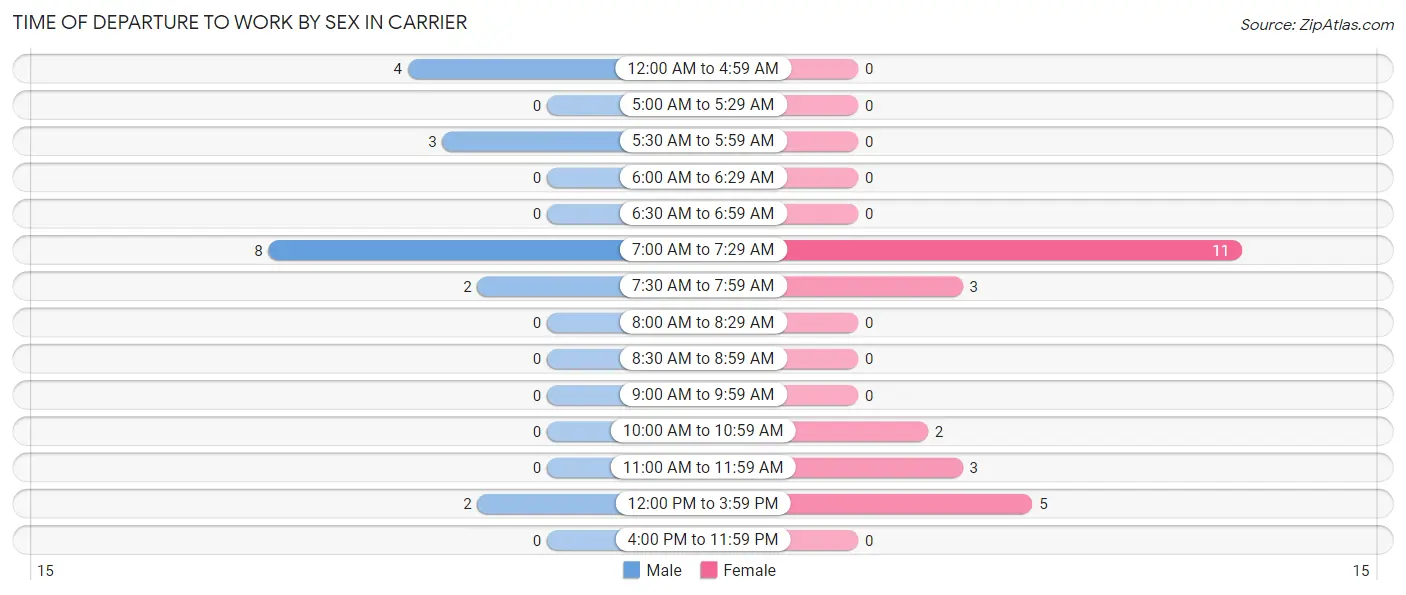
| Time of Departure | Male | Female |
| 12:00 AM to 4:59 AM | 4 (21.0%) | 0 (0.0%) |
| 5:00 AM to 5:29 AM | 0 (0.0%) | 0 (0.0%) |
| 5:30 AM to 5:59 AM | 3 (15.8%) | 0 (0.0%) |
| 6:00 AM to 6:29 AM | 0 (0.0%) | 0 (0.0%) |
| 6:30 AM to 6:59 AM | 0 (0.0%) | 0 (0.0%) |
| 7:00 AM to 7:29 AM | 8 (42.1%) | 11 (45.8%) |
| 7:30 AM to 7:59 AM | 2 (10.5%) | 3 (12.5%) |
| 8:00 AM to 8:29 AM | 0 (0.0%) | 0 (0.0%) |
| 8:30 AM to 8:59 AM | 0 (0.0%) | 0 (0.0%) |
| 9:00 AM to 9:59 AM | 0 (0.0%) | 0 (0.0%) |
| 10:00 AM to 10:59 AM | 0 (0.0%) | 2 (8.3%) |
| 11:00 AM to 11:59 AM | 0 (0.0%) | 3 (12.5%) |
| 12:00 PM to 3:59 PM | 2 (10.5%) | 5 (20.8%) |
| 4:00 PM to 11:59 PM | 0 (0.0%) | 0 (0.0%) |
| Total | 19 (100.0%) | 24 (100.0%) |
Housing Occupancy in Carrier
Occupancy by Ownership in Carrier
Of the total 36 dwellings in Carrier, owner-occupied units account for 36 (100.0%), while renter-occupied units make up 0 (0.0%).
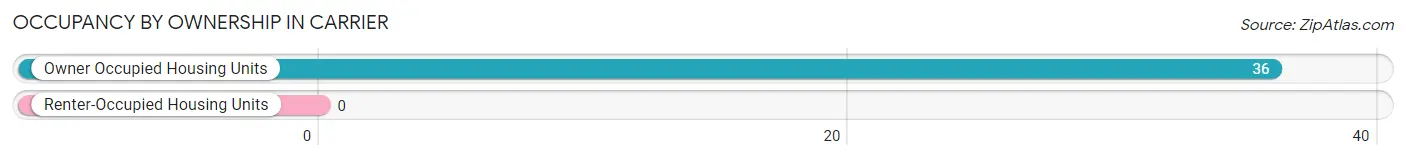
| Occupancy | # Housing Units | % Housing Units |
| Owner Occupied Housing Units | 36 | 100.0% |
| Renter-Occupied Housing Units | 0 | 0.0% |
| Total Occupied Housing Units | 36 | 100.0% |
Occupancy by Household Size in Carrier
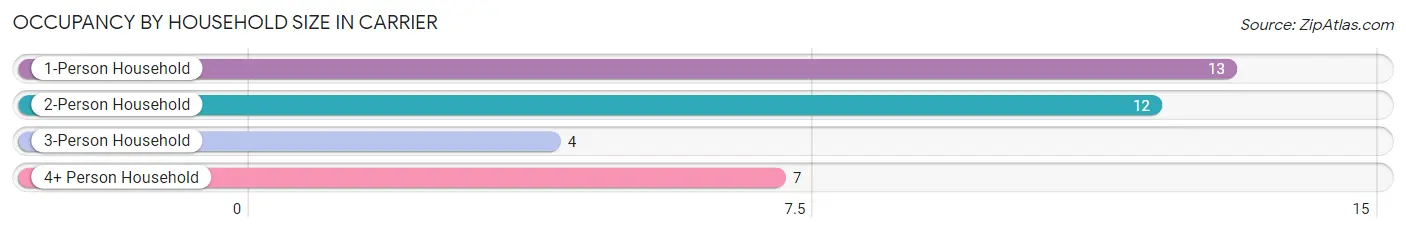
| Household Size | # Housing Units | % Housing Units |
| 1-Person Household | 13 | 36.1% |
| 2-Person Household | 12 | 33.3% |
| 3-Person Household | 4 | 11.1% |
| 4+ Person Household | 7 | 19.4% |
| Total Housing Units | 36 | 100.0% |
Occupancy by Ownership by Household Size in Carrier
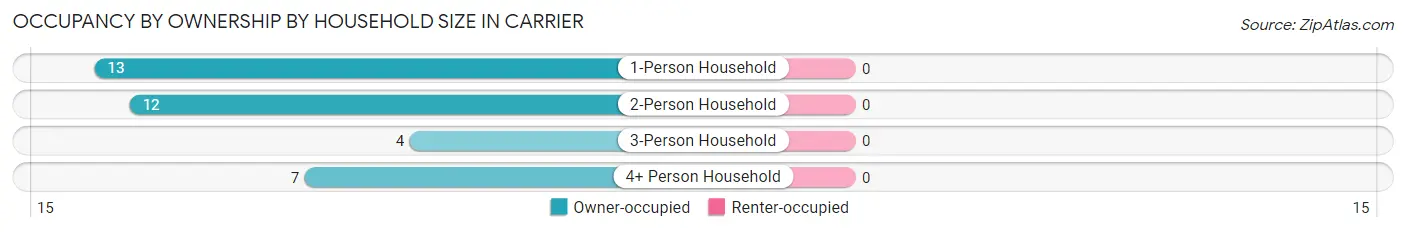
| Household Size | Owner-occupied | Renter-occupied |
| 1-Person Household | 13 (100.0%) | 0 (0.0%) |
| 2-Person Household | 12 (100.0%) | 0 (0.0%) |
| 3-Person Household | 4 (100.0%) | 0 (0.0%) |
| 4+ Person Household | 7 (100.0%) | 0 (0.0%) |
| Total Housing Units | 36 (100.0%) | 0 (0.0%) |
Occupancy by Educational Attainment in Carrier
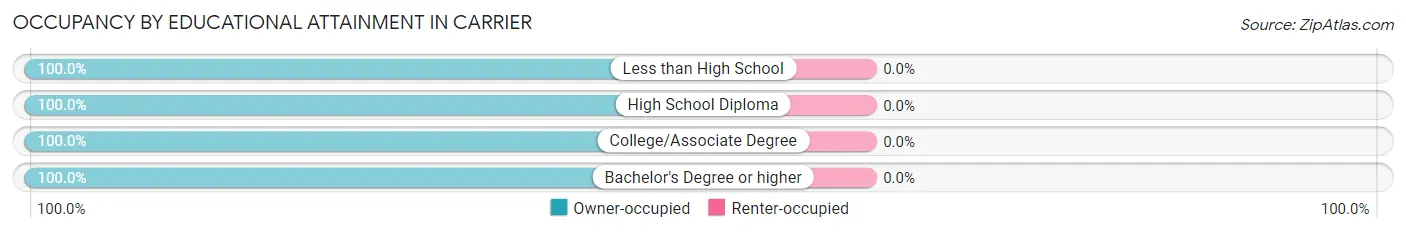
| Household Size | Owner-occupied | Renter-occupied |
| Less than High School | 11 (100.0%) | 0 (0.0%) |
| High School Diploma | 17 (100.0%) | 0 (0.0%) |
| College/Associate Degree | 7 (100.0%) | 0 (0.0%) |
| Bachelor's Degree or higher | 1 (100.0%) | 0 (0.0%) |
Occupancy by Age of Householder in Carrier
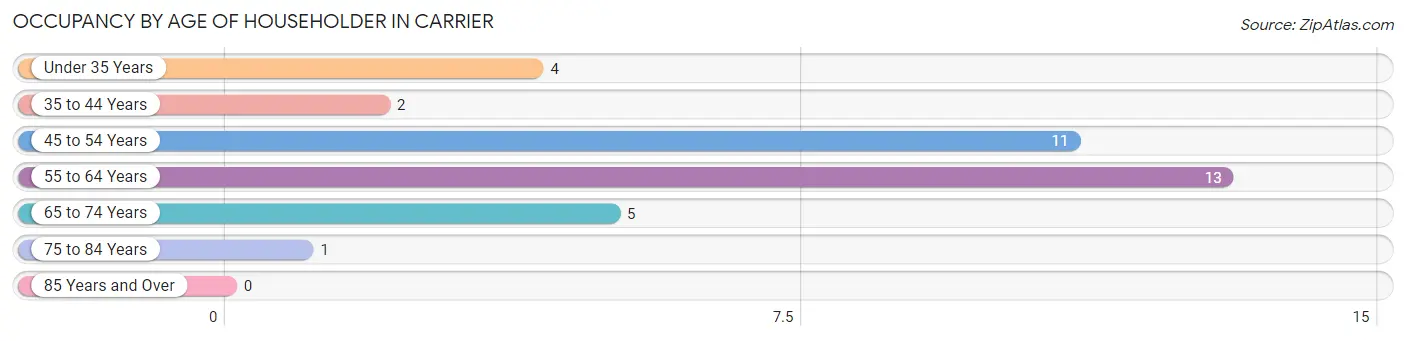
| Age Bracket | # Households | % Households |
| Under 35 Years | 4 | 11.1% |
| 35 to 44 Years | 2 | 5.6% |
| 45 to 54 Years | 11 | 30.6% |
| 55 to 64 Years | 13 | 36.1% |
| 65 to 74 Years | 5 | 13.9% |
| 75 to 84 Years | 1 | 2.8% |
| 85 Years and Over | 0 | 0.0% |
| Total | 36 | 100.0% |
Housing Finances in Carrier
Median Income by Occupancy in Carrier
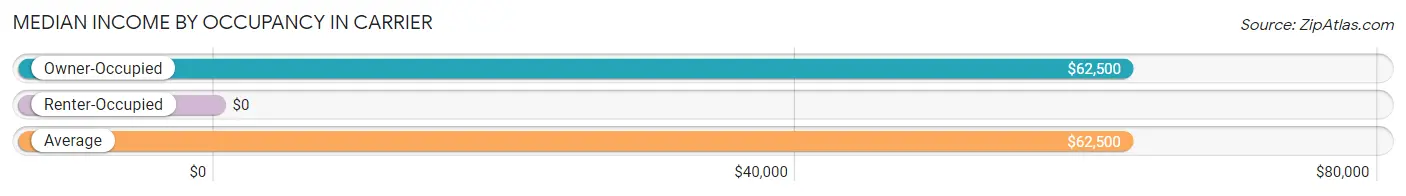
| Occupancy Type | # Households | Median Income |
| Owner-Occupied | 36 (100.0%) | $62,500 |
| Renter-Occupied | 0 (0.0%) | $0 |
| Average | 36 (100.0%) | $62,500 |
Occupancy by Householder Income Bracket in Carrier
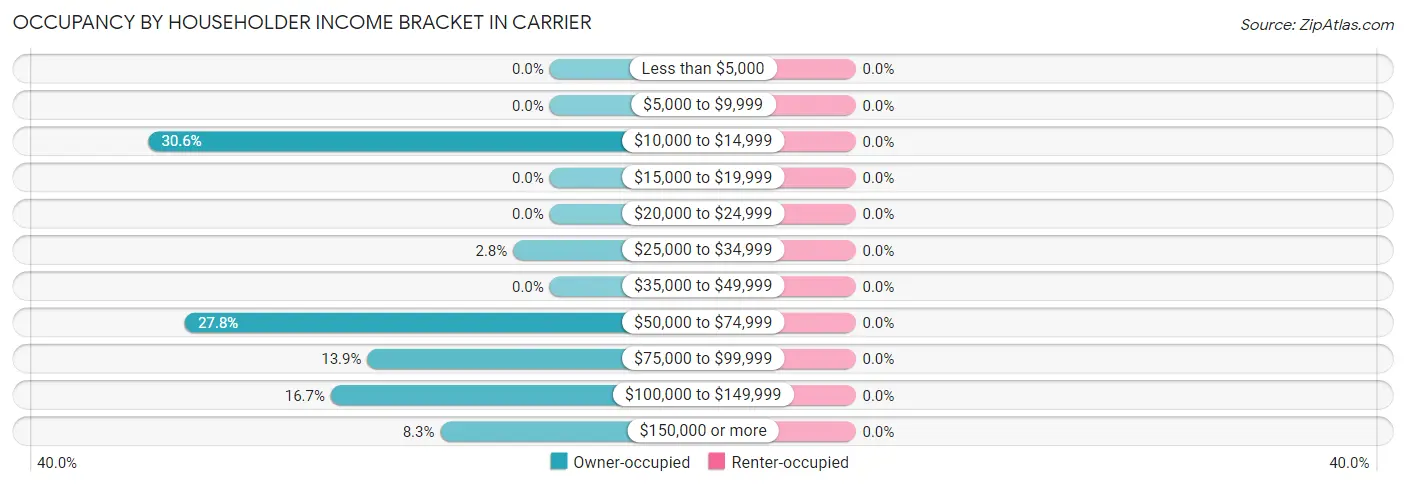
| Income Bracket | Owner-occupied | Renter-occupied |
| Less than $5,000 | 0 (0.0%) | 0 (0.0%) |
| $5,000 to $9,999 | 0 (0.0%) | 0 (0.0%) |
| $10,000 to $14,999 | 11 (30.6%) | 0 (0.0%) |
| $15,000 to $19,999 | 0 (0.0%) | 0 (0.0%) |
| $20,000 to $24,999 | 0 (0.0%) | 0 (0.0%) |
| $25,000 to $34,999 | 1 (2.8%) | 0 (0.0%) |
| $35,000 to $49,999 | 0 (0.0%) | 0 (0.0%) |
| $50,000 to $74,999 | 10 (27.8%) | 0 (0.0%) |
| $75,000 to $99,999 | 5 (13.9%) | 0 (0.0%) |
| $100,000 to $149,999 | 6 (16.7%) | 0 (0.0%) |
| $150,000 or more | 3 (8.3%) | 0 (0.0%) |
| Total | 36 (100.0%) | 0 (0.0%) |
Monthly Housing Cost Tiers in Carrier
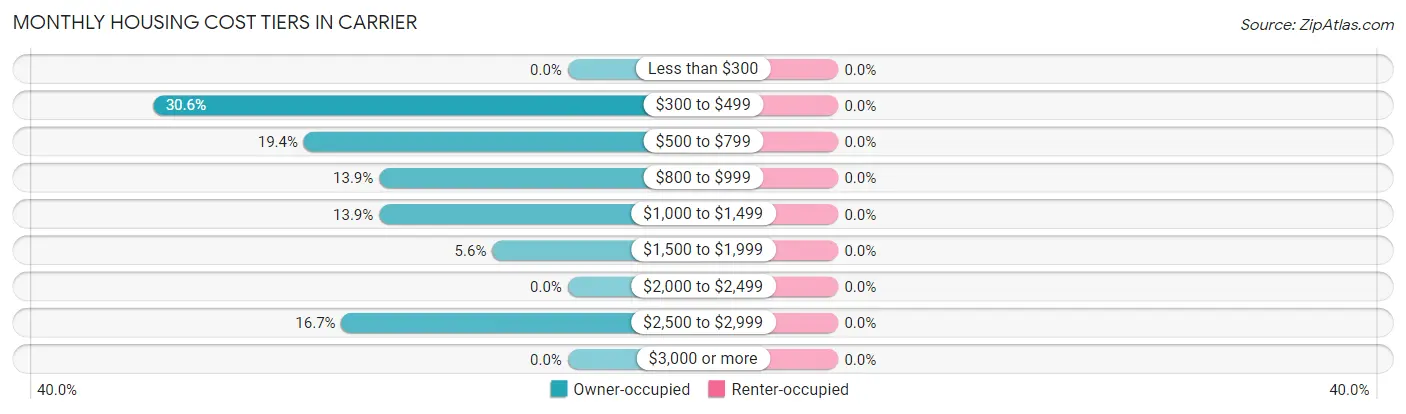
| Monthly Cost | Owner-occupied | Renter-occupied |
| Less than $300 | 0 (0.0%) | 0 (0.0%) |
| $300 to $499 | 11 (30.6%) | 0 (0.0%) |
| $500 to $799 | 7 (19.4%) | 0 (0.0%) |
| $800 to $999 | 5 (13.9%) | 0 (0.0%) |
| $1,000 to $1,499 | 5 (13.9%) | 0 (0.0%) |
| $1,500 to $1,999 | 2 (5.6%) | 0 (0.0%) |
| $2,000 to $2,499 | 0 (0.0%) | 0 (0.0%) |
| $2,500 to $2,999 | 6 (16.7%) | 0 (0.0%) |
| $3,000 or more | 0 (0.0%) | 0 (0.0%) |
| Total | 36 (100.0%) | 0 (0.0%) |
Physical Housing Characteristics in Carrier
Housing Structures in Carrier
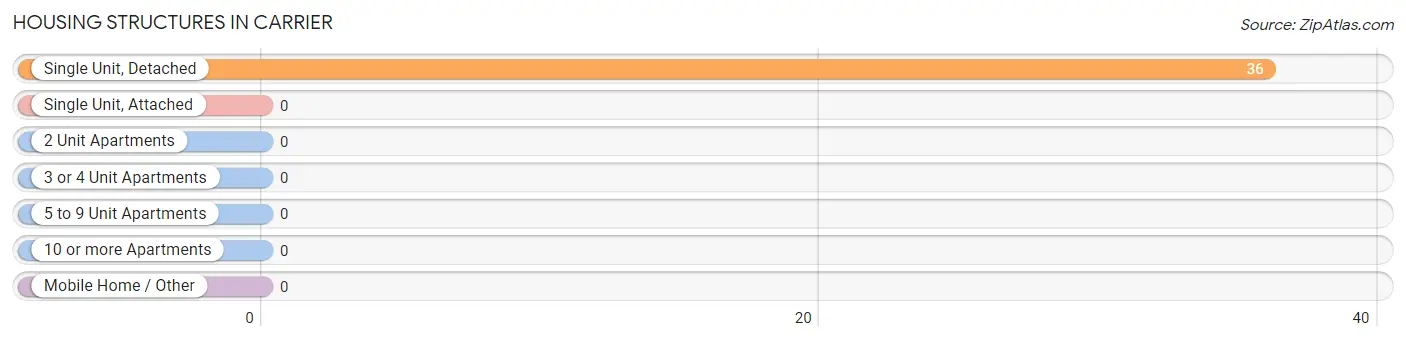
| Structure Type | # Housing Units | % Housing Units |
| Single Unit, Detached | 36 | 100.0% |
| Single Unit, Attached | 0 | 0.0% |
| 2 Unit Apartments | 0 | 0.0% |
| 3 or 4 Unit Apartments | 0 | 0.0% |
| 5 to 9 Unit Apartments | 0 | 0.0% |
| 10 or more Apartments | 0 | 0.0% |
| Mobile Home / Other | 0 | 0.0% |
| Total | 36 | 100.0% |
Housing Structures by Occupancy in Carrier
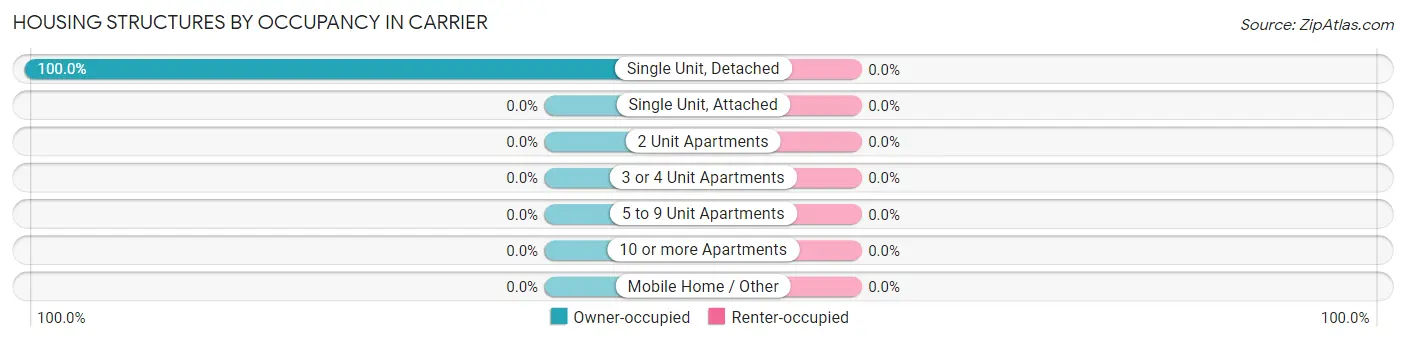
| Structure Type | Owner-occupied | Renter-occupied |
| Single Unit, Detached | 36 (100.0%) | 0 (0.0%) |
| Single Unit, Attached | 0 (0.0%) | 0 (0.0%) |
| 2 Unit Apartments | 0 (0.0%) | 0 (0.0%) |
| 3 or 4 Unit Apartments | 0 (0.0%) | 0 (0.0%) |
| 5 to 9 Unit Apartments | 0 (0.0%) | 0 (0.0%) |
| 10 or more Apartments | 0 (0.0%) | 0 (0.0%) |
| Mobile Home / Other | 0 (0.0%) | 0 (0.0%) |
| Total | 36 (100.0%) | 0 (0.0%) |
Housing Structures by Number of Rooms in Carrier
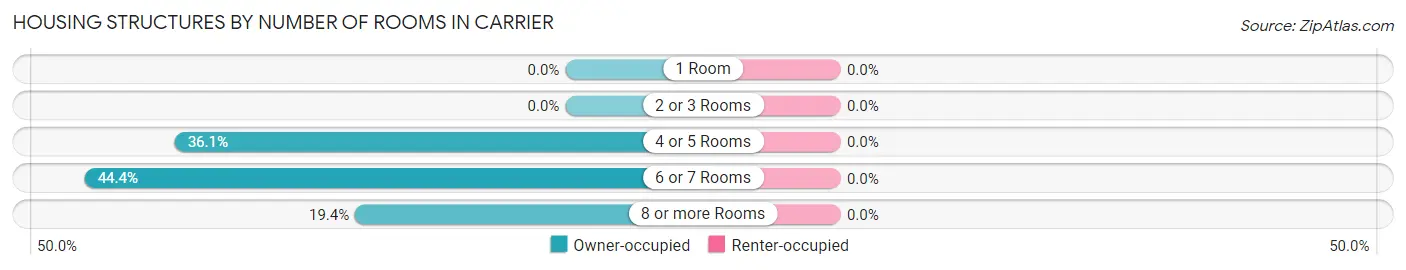
| Number of Rooms | Owner-occupied | Renter-occupied |
| 1 Room | 0 (0.0%) | 0 (0.0%) |
| 2 or 3 Rooms | 0 (0.0%) | 0 (0.0%) |
| 4 or 5 Rooms | 13 (36.1%) | 0 (0.0%) |
| 6 or 7 Rooms | 16 (44.4%) | 0 (0.0%) |
| 8 or more Rooms | 7 (19.4%) | 0 (0.0%) |
| Total | 36 (100.0%) | 0 (0.0%) |
Housing Structure by Heating Type in Carrier
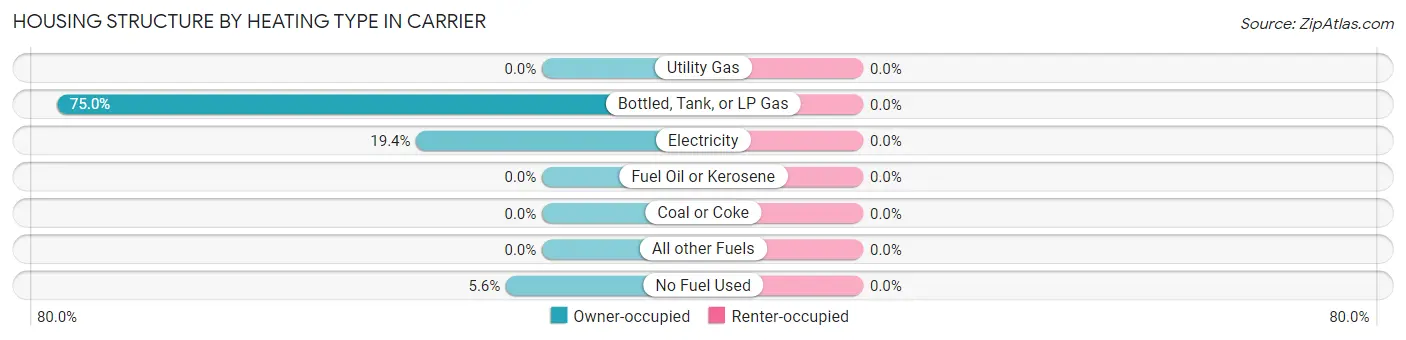
| Heating Type | Owner-occupied | Renter-occupied |
| Utility Gas | 0 (0.0%) | 0 (0.0%) |
| Bottled, Tank, or LP Gas | 27 (75.0%) | 0 (0.0%) |
| Electricity | 7 (19.4%) | 0 (0.0%) |
| Fuel Oil or Kerosene | 0 (0.0%) | 0 (0.0%) |
| Coal or Coke | 0 (0.0%) | 0 (0.0%) |
| All other Fuels | 0 (0.0%) | 0 (0.0%) |
| No Fuel Used | 2 (5.6%) | 0 (0.0%) |
| Total | 36 (100.0%) | 0 (0.0%) |
Household Vehicle Usage in Carrier
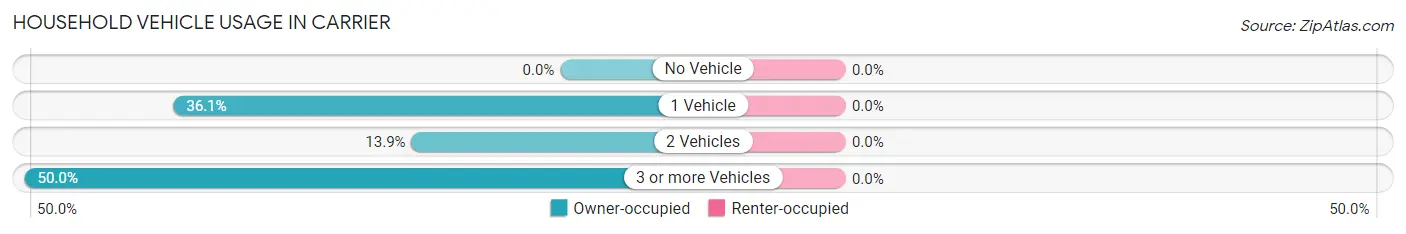
| Vehicles per Household | Owner-occupied | Renter-occupied |
| No Vehicle | 0 (0.0%) | 0 (0.0%) |
| 1 Vehicle | 13 (36.1%) | 0 (0.0%) |
| 2 Vehicles | 5 (13.9%) | 0 (0.0%) |
| 3 or more Vehicles | 18 (50.0%) | 0 (0.0%) |
| Total | 36 (100.0%) | 0 (0.0%) |
Real Estate & Mortgages in Carrier
Real Estate and Mortgage Overview in Carrier
| Characteristic | Without Mortgage | With Mortgage |
| Housing Units | 9 | 27 |
| Median Property Value | $343,800 | $96,300 |
| Median Household Income | $79,250 | $2 |
| Monthly Housing Costs | $590 | $0 |
| Real Estate Taxes | $1,350 | $0 |
Property Value by Mortgage Status in Carrier
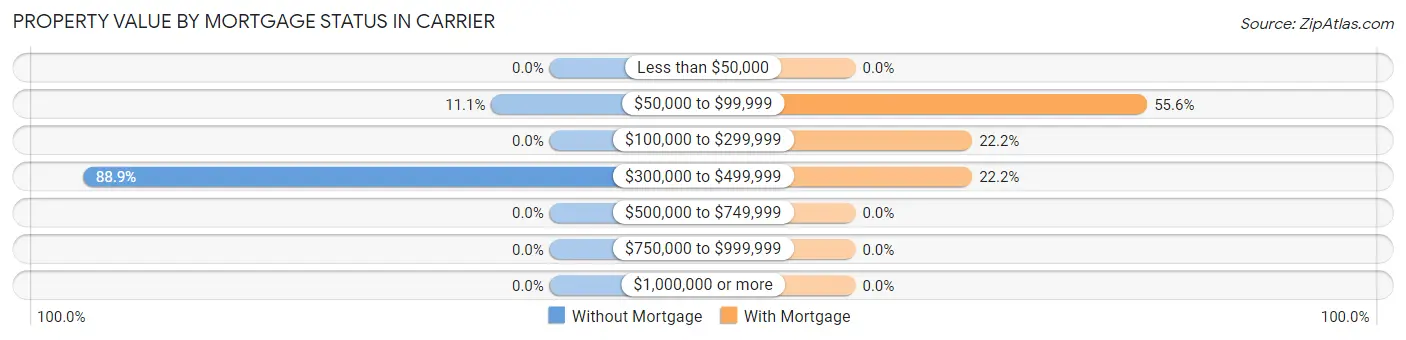
| Property Value | Without Mortgage | With Mortgage |
| Less than $50,000 | 0 (0.0%) | 0 (0.0%) |
| $50,000 to $99,999 | 1 (11.1%) | 15 (55.6%) |
| $100,000 to $299,999 | 0 (0.0%) | 6 (22.2%) |
| $300,000 to $499,999 | 8 (88.9%) | 6 (22.2%) |
| $500,000 to $749,999 | 0 (0.0%) | 0 (0.0%) |
| $750,000 to $999,999 | 0 (0.0%) | 0 (0.0%) |
| $1,000,000 or more | 0 (0.0%) | 0 (0.0%) |
| Total | 9 (100.0%) | 27 (100.0%) |
Household Income by Mortgage Status in Carrier
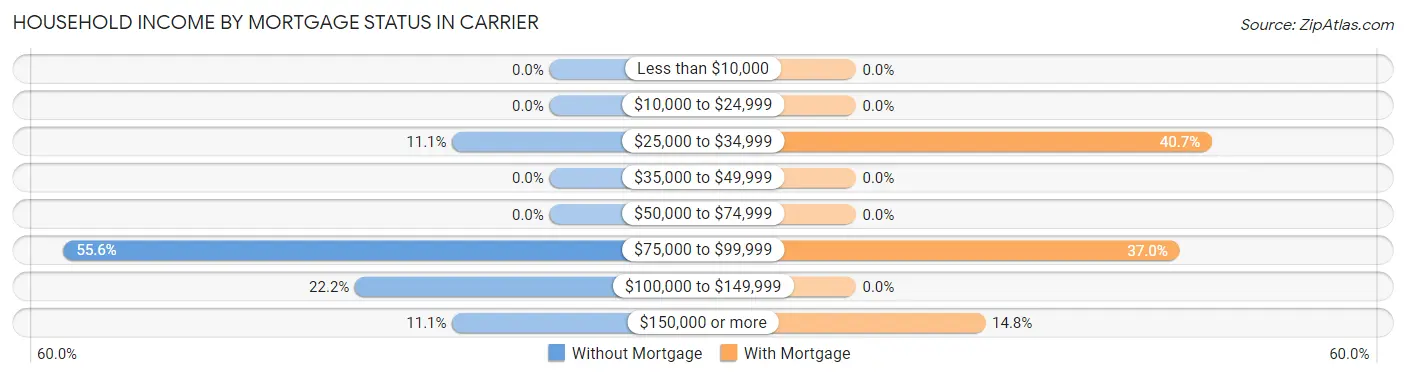
| Household Income | Without Mortgage | With Mortgage |
| Less than $10,000 | 0 (0.0%) | 0 (0.0%) |
| $10,000 to $24,999 | 0 (0.0%) | 0 (0.0%) |
| $25,000 to $34,999 | 1 (11.1%) | 11 (40.7%) |
| $35,000 to $49,999 | 0 (0.0%) | 0 (0.0%) |
| $50,000 to $74,999 | 0 (0.0%) | 0 (0.0%) |
| $75,000 to $99,999 | 5 (55.6%) | 10 (37.0%) |
| $100,000 to $149,999 | 2 (22.2%) | 0 (0.0%) |
| $150,000 or more | 1 (11.1%) | 4 (14.8%) |
| Total | 9 (100.0%) | 27 (100.0%) |
Property Value to Household Income Ratio in Carrier
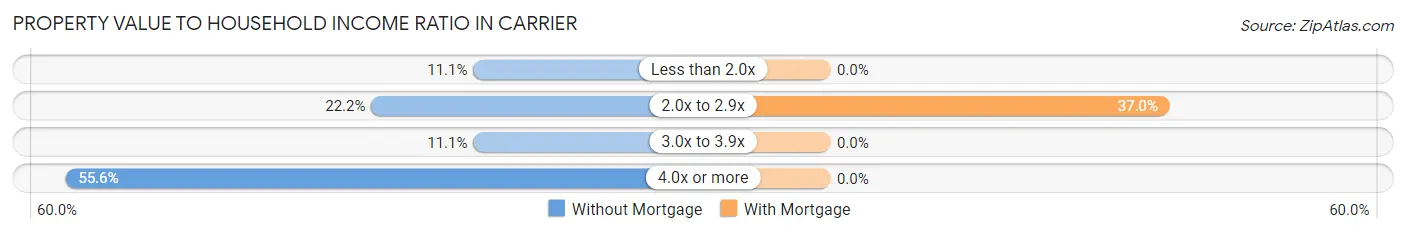
| Value-to-Income Ratio | Without Mortgage | With Mortgage |
| Less than 2.0x | 1 (11.1%) | 0 (0.0%) |
| 2.0x to 2.9x | 2 (22.2%) | 10 (37.0%) |
| 3.0x to 3.9x | 1 (11.1%) | 0 (0.0%) |
| 4.0x or more | 5 (55.6%) | 0 (0.0%) |
| Total | 9 (100.0%) | 27 (100.0%) |
Real Estate Taxes by Mortgage Status in Carrier
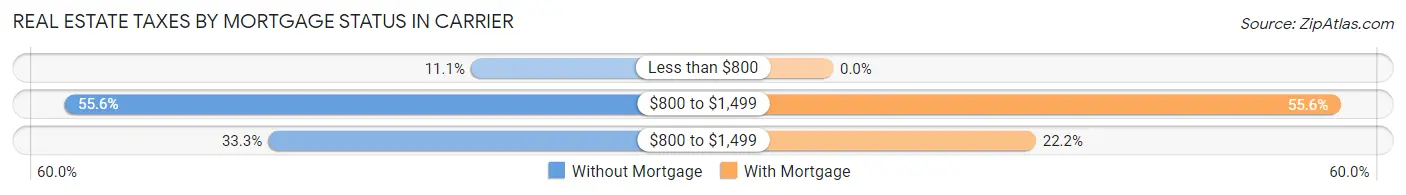
| Property Taxes | Without Mortgage | With Mortgage |
| Less than $800 | 1 (11.1%) | 0 (0.0%) |
| $800 to $1,499 | 5 (55.6%) | 15 (55.6%) |
| $800 to $1,499 | 3 (33.3%) | 6 (22.2%) |
| Total | 9 (100.0%) | 27 (100.0%) |
Health & Disability in Carrier
Health Insurance Coverage by Age in Carrier
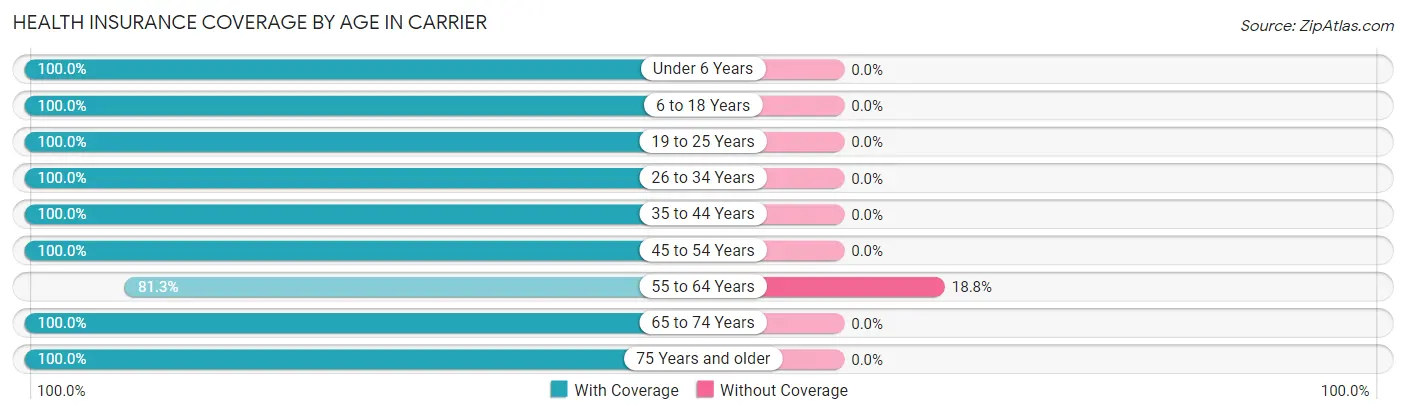
| Age Bracket | With Coverage | Without Coverage |
| Under 6 Years | 10 (100.0%) | 0 (0.0%) |
| 6 to 18 Years | 16 (100.0%) | 0 (0.0%) |
| 19 to 25 Years | 3 (100.0%) | 0 (0.0%) |
| 26 to 34 Years | 9 (100.0%) | 0 (0.0%) |
| 35 to 44 Years | 7 (100.0%) | 0 (0.0%) |
| 45 to 54 Years | 20 (100.0%) | 0 (0.0%) |
| 55 to 64 Years | 13 (81.2%) | 3 (18.8%) |
| 65 to 74 Years | 5 (100.0%) | 0 (0.0%) |
| 75 Years and older | 3 (100.0%) | 0 (0.0%) |
| Total | 86 (96.6%) | 3 (3.4%) |
Health Insurance Coverage by Citizenship Status in Carrier
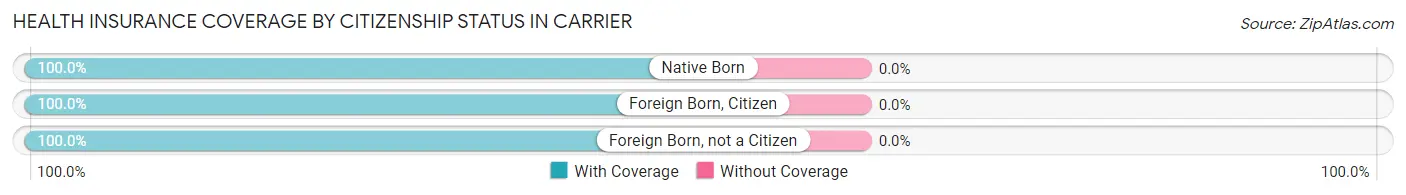
| Citizenship Status | With Coverage | Without Coverage |
| Native Born | 10 (100.0%) | 0 (0.0%) |
| Foreign Born, Citizen | 16 (100.0%) | 0 (0.0%) |
| Foreign Born, not a Citizen | 3 (100.0%) | 0 (0.0%) |
Health Insurance Coverage by Household Income in Carrier
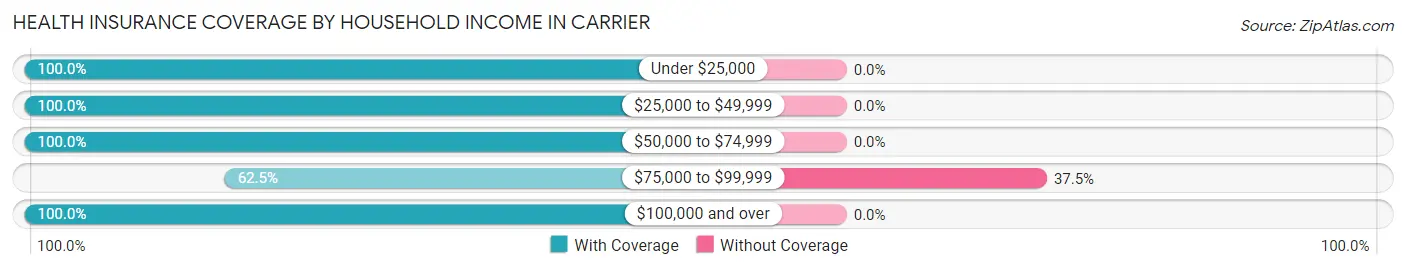
| Household Income | With Coverage | Without Coverage |
| Under $25,000 | 11 (100.0%) | 0 (0.0%) |
| $25,000 to $49,999 | 1 (100.0%) | 0 (0.0%) |
| $50,000 to $74,999 | 41 (100.0%) | 0 (0.0%) |
| $75,000 to $99,999 | 5 (62.5%) | 3 (37.5%) |
| $100,000 and over | 28 (100.0%) | 0 (0.0%) |
Public vs Private Health Insurance Coverage by Age in Carrier
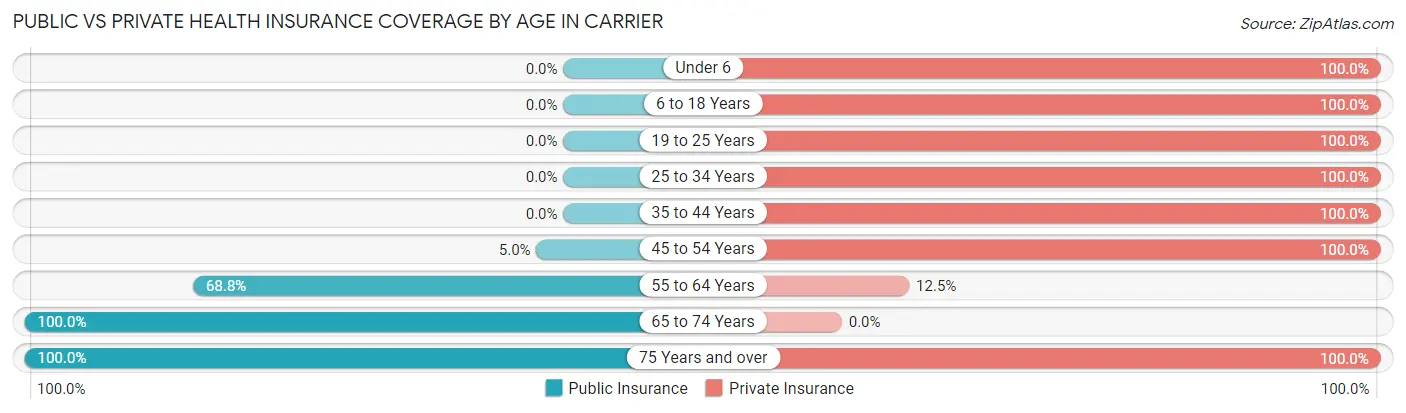
| Age Bracket | Public Insurance | Private Insurance |
| Under 6 | 0 (0.0%) | 10 (100.0%) |
| 6 to 18 Years | 0 (0.0%) | 16 (100.0%) |
| 19 to 25 Years | 0 (0.0%) | 3 (100.0%) |
| 25 to 34 Years | 0 (0.0%) | 9 (100.0%) |
| 35 to 44 Years | 0 (0.0%) | 7 (100.0%) |
| 45 to 54 Years | 1 (5.0%) | 20 (100.0%) |
| 55 to 64 Years | 11 (68.8%) | 2 (12.5%) |
| 65 to 74 Years | 5 (100.0%) | 0 (0.0%) |
| 75 Years and over | 3 (100.0%) | 3 (100.0%) |
| Total | 20 (22.5%) | 70 (78.6%) |
Disability Status by Sex by Age in Carrier
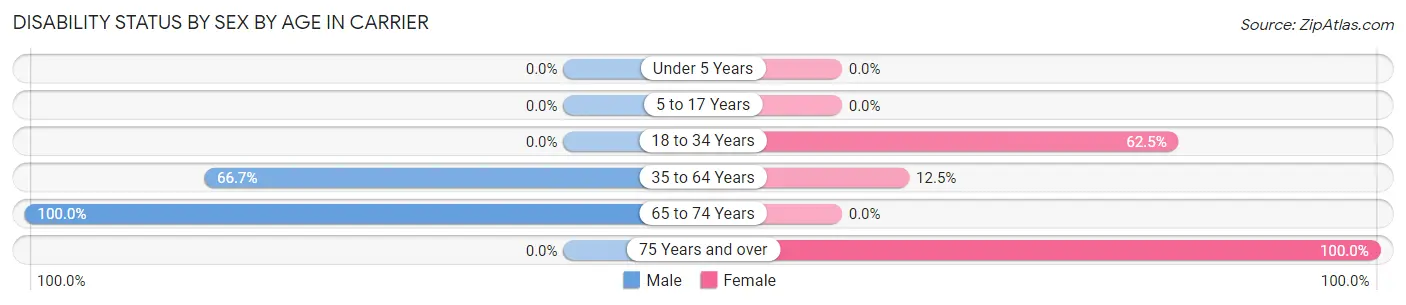
| Age Bracket | Male | Female |
| Under 5 Years | 0 (0.0%) | 0 (0.0%) |
| 5 to 17 Years | 0 (0.0%) | 0 (0.0%) |
| 18 to 34 Years | 0 (0.0%) | 5 (62.5%) |
| 35 to 64 Years | 18 (66.7%) | 2 (12.5%) |
| 65 to 74 Years | 5 (100.0%) | 0 (0.0%) |
| 75 Years and over | 0 (0.0%) | 2 (100.0%) |
Disability Class by Sex by Age in Carrier
Disability Class: Hearing Difficulty
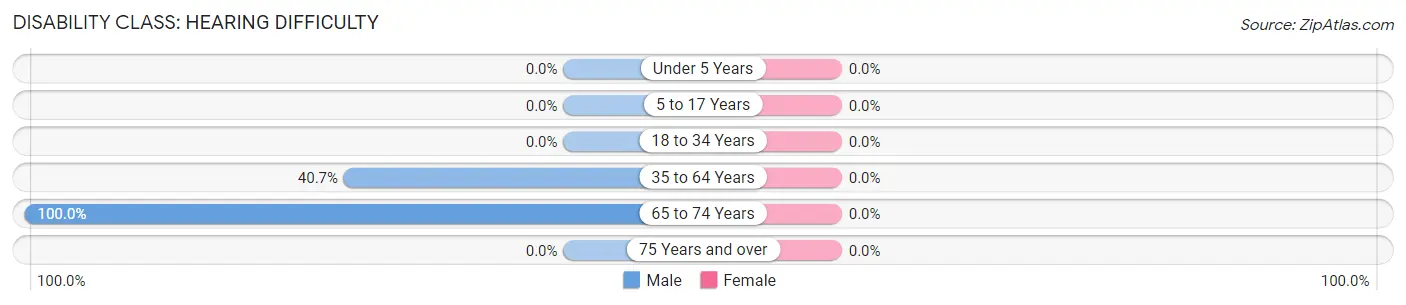
| Age Bracket | Male | Female |
| Under 5 Years | 0 (0.0%) | 0 (0.0%) |
| 5 to 17 Years | 0 (0.0%) | 0 (0.0%) |
| 18 to 34 Years | 0 (0.0%) | 0 (0.0%) |
| 35 to 64 Years | 11 (40.7%) | 0 (0.0%) |
| 65 to 74 Years | 5 (100.0%) | 0 (0.0%) |
| 75 Years and over | 0 (0.0%) | 0 (0.0%) |
Disability Class: Vision Difficulty
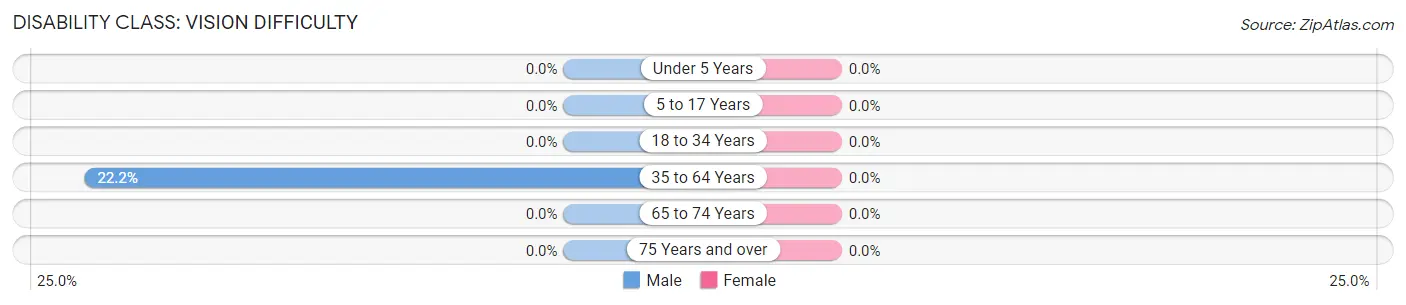
| Age Bracket | Male | Female |
| Under 5 Years | 0 (0.0%) | 0 (0.0%) |
| 5 to 17 Years | 0 (0.0%) | 0 (0.0%) |
| 18 to 34 Years | 0 (0.0%) | 0 (0.0%) |
| 35 to 64 Years | 6 (22.2%) | 0 (0.0%) |
| 65 to 74 Years | 0 (0.0%) | 0 (0.0%) |
| 75 Years and over | 0 (0.0%) | 0 (0.0%) |
Disability Class: Cognitive Difficulty
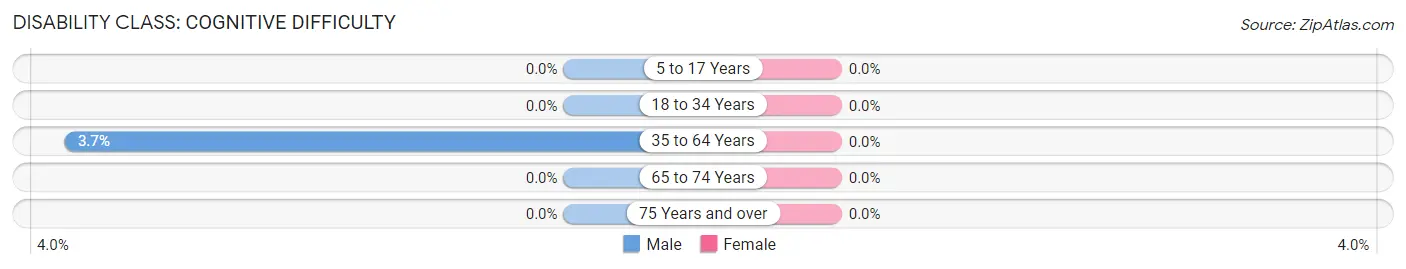
| Age Bracket | Male | Female |
| 5 to 17 Years | 0 (0.0%) | 0 (0.0%) |
| 18 to 34 Years | 0 (0.0%) | 0 (0.0%) |
| 35 to 64 Years | 1 (3.7%) | 0 (0.0%) |
| 65 to 74 Years | 0 (0.0%) | 0 (0.0%) |
| 75 Years and over | 0 (0.0%) | 0 (0.0%) |
Disability Class: Ambulatory Difficulty
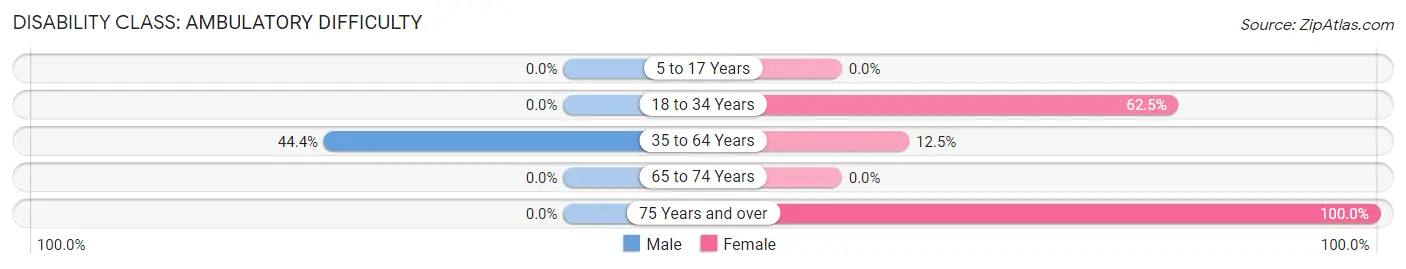
| Age Bracket | Male | Female |
| 5 to 17 Years | 0 (0.0%) | 0 (0.0%) |
| 18 to 34 Years | 0 (0.0%) | 5 (62.5%) |
| 35 to 64 Years | 12 (44.4%) | 2 (12.5%) |
| 65 to 74 Years | 0 (0.0%) | 0 (0.0%) |
| 75 Years and over | 0 (0.0%) | 2 (100.0%) |
Disability Class: Self-Care Difficulty
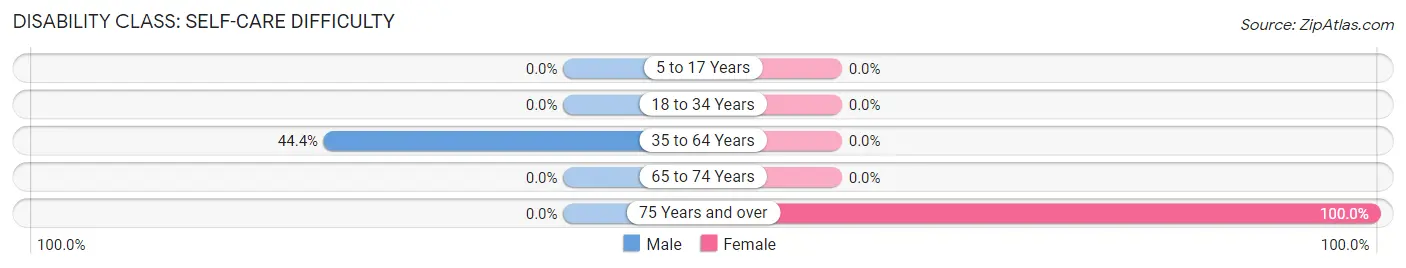
| Age Bracket | Male | Female |
| 5 to 17 Years | 0 (0.0%) | 0 (0.0%) |
| 18 to 34 Years | 0 (0.0%) | 0 (0.0%) |
| 35 to 64 Years | 12 (44.4%) | 0 (0.0%) |
| 65 to 74 Years | 0 (0.0%) | 0 (0.0%) |
| 75 Years and over | 0 (0.0%) | 2 (100.0%) |
Technology Access in Carrier
Computing Device Access in Carrier
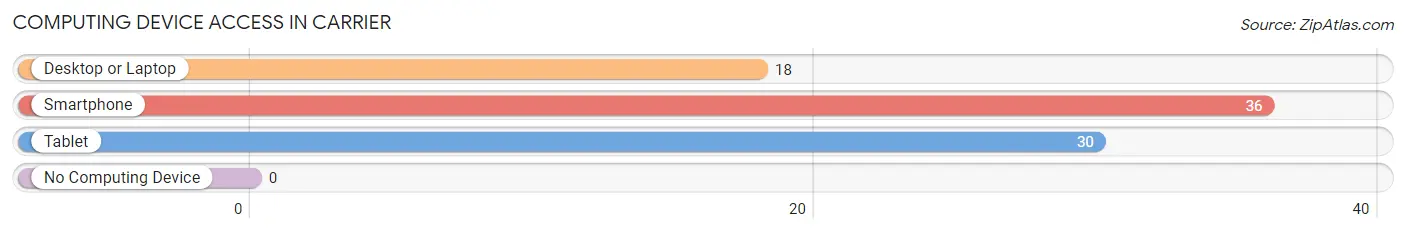
| Device Type | # Households | % Households |
| Desktop or Laptop | 18 | 50.0% |
| Smartphone | 36 | 100.0% |
| Tablet | 30 | 83.3% |
| No Computing Device | 0 | 0.0% |
| Total | 36 | 100.0% |
Internet Access in Carrier
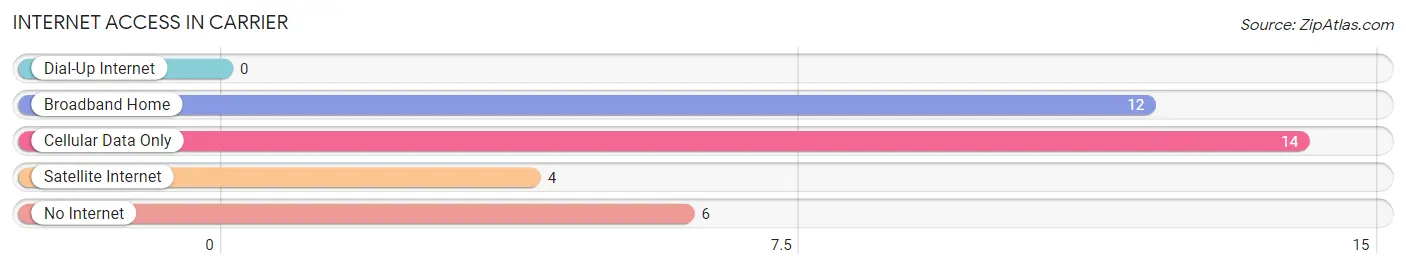
| Internet Type | # Households | % Households |
| Dial-Up Internet | 0 | 0.0% |
| Broadband Home | 12 | 33.3% |
| Cellular Data Only | 14 | 38.9% |
| Satellite Internet | 4 | 11.1% |
| No Internet | 6 | 16.7% |
| Total | 36 | 100.0% |
Carrier Summary
Carrier is a small town located in the state of Oklahoma, in the United States. It is situated in the northeastern part of the state, in the county of Garfield. The town has a population of approximately 1,000 people, and is located about 20 miles south of Enid, the county seat.
History
The town of Carrier was founded in 1891, when the Santa Fe Railroad was built through the area. The town was named after the railroad's chief engineer, William Carrier. The town was originally a farming community, and the main crops grown were wheat, corn, and cotton.
In the early 1900s, the town began to grow and develop. A post office was established in 1906, and a school was built in 1908. The town also had a bank, a hotel, a general store, and a blacksmith shop.
In the 1920s, the town began to decline. The Great Depression caused many of the businesses to close, and the population began to decrease. The town was able to survive, however, and by the 1950s, the population had begun to increase again.
Geography
Carrier is located in the northeastern part of Oklahoma, in Garfield County. The town is situated on the banks of the Cimarron River, and is surrounded by rolling hills and prairies. The town is located about 20 miles south of Enid, the county seat.
The climate in Carrier is generally mild, with hot summers and cold winters. The average annual temperature is around 60 degrees Fahrenheit. The average annual precipitation is around 30 inches.
Economy
The economy of Carrier is largely based on agriculture. The main crops grown in the area are wheat, corn, and cotton. The town also has a few small businesses, including a grocery store, a hardware store, and a few restaurants.
Demographics
As of the 2010 census, the population of Carrier was 1,000 people. The racial makeup of the town was 95.2% White, 0.7% African American, 0.7% Native American, 0.3% Asian, and 2.9% from other races. The median household income was $35,000, and the median family income was $41,000.
Conclusion
Carrier is a small town located in the northeastern part of Oklahoma. It was founded in 1891, and has a population of approximately 1,000 people. The economy of the town is largely based on agriculture, and the main crops grown are wheat, corn, and cotton. The town also has a few small businesses, including a grocery store, a hardware store, and a few restaurants. The racial makeup of the town is 95.2% White, 0.7% African American, 0.7% Native American, 0.3% Asian, and 2.9% from other races. The median household income is $35,000, and the median family income is $41,000.
Common Questions
What is the Total Population of Carrier?
Total Population of Carrier is 89.
What is the Total Male Population of Carrier?
Total Male Population of Carrier is 37.
What is the Total Female Population of Carrier?
Total Female Population of Carrier is 52.
What is the Ratio of Males per 100 Females in Carrier?
There are 71.15 Males per 100 Females in Carrier.
What is the Ratio of Females per 100 Males in Carrier?
There are 140.54 Females per 100 Males in Carrier.
What is the Median Population Age in Carrier?
Median Population Age in Carrier is 43.9 Years.
What is the Average Family Size in Carrier
Average Family Size in Carrier is 3.3 People.
What is the Average Household Size in Carrier
Average Household Size in Carrier is 2.5 People.
What is Per Capita Income in Carrier?
Per Capita income in Carrier is $28,434.
What is the Median Family Income in Carrier?
Median Family Income in Carrier is $78,000.
What is the Median Household income in Carrier?
Median Household Income in Carrier is $62,500.
What is Income or Wage Gap in Carrier?
Income or Wage Gap in Carrier is 73.9%.
Women in Carrier earn 26.1 cents for every dollar earned by a man.
What is Inequality or Gini Index in Carrier?
Inequality or Gini Index in Carrier is 0.42.
How Large is the Labor Force in Carrier?
There are 45 People in the Labor Forcein in Carrier.
What is the Percentage of People in the Labor Force in Carrier?
69.2% of People are in the Labor Force in Carrier.
What is the Unemployment Rate in Carrier?
Unemployment Rate in Carrier is 4.4%.