Parkville, MO
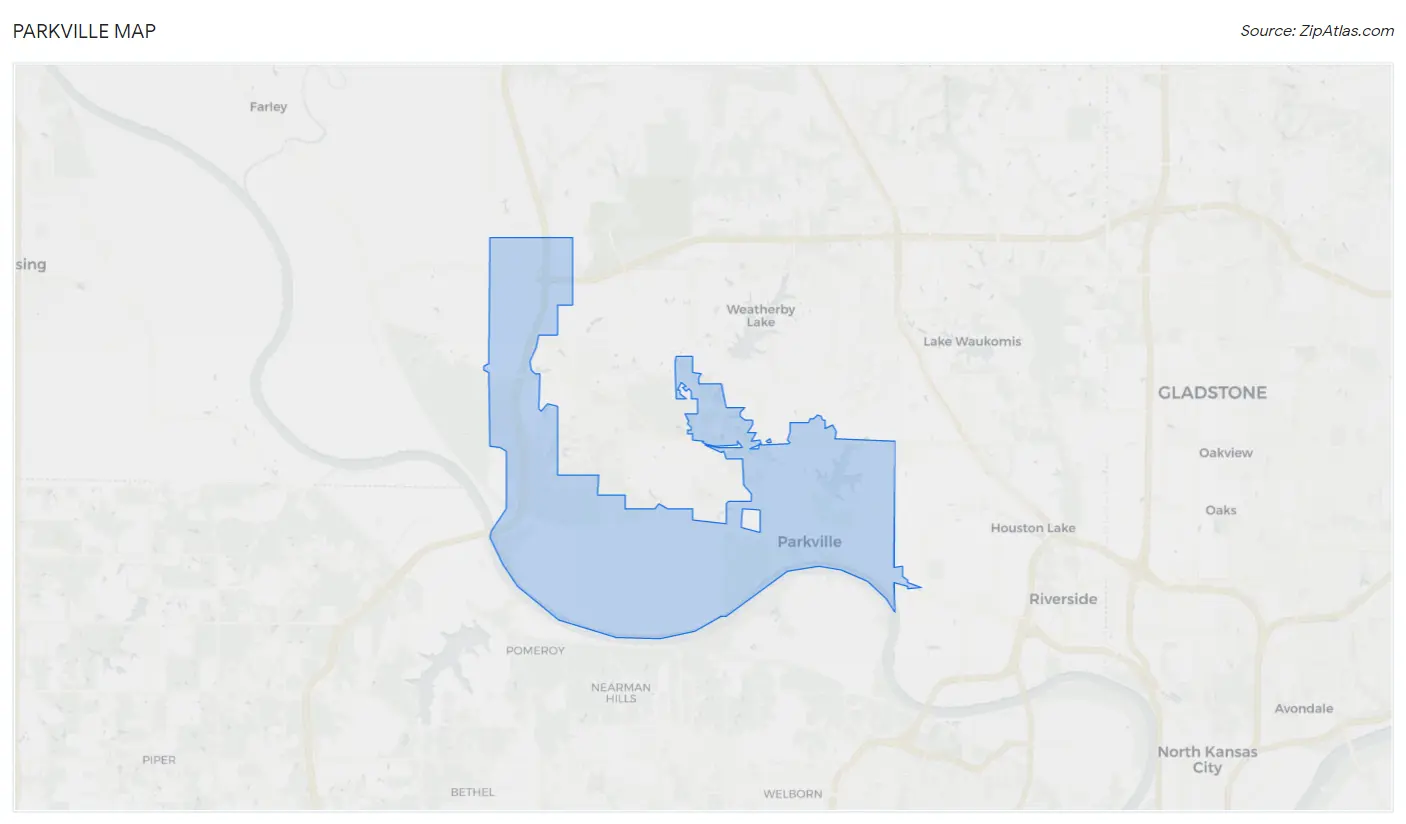
Parkville Map
Parkville Overview
7,669
TOTAL POPULATION
4,218
MALE POPULATION
3,451
FEMALE POPULATION
122.23
MALES / 100 FEMALES
81.82
FEMALES / 100 MALES
40.0
MEDIAN AGE
3.2
AVG FAMILY SIZE
2.8
AVG HOUSEHOLD SIZE
$75,435
PER CAPITA INCOME
$202,219
AVG FAMILY INCOME
$166,563
AVG HOUSEHOLD INCOME
46.4%
WAGE / INCOME GAP [ % ]
53.6¢/ $1
WAGE / INCOME GAP [ $ ]
0.45
INEQUALITY / GINI INDEX
4,066
LABOR FORCE [ PEOPLE ]
69.4%
PERCENT IN LABOR FORCE
3.6%
UNEMPLOYMENT RATE
Parkville Area Codes
Race in Parkville
The most populous races in Parkville are White / Caucasian (6,349 | 82.8%), Hispanic or Latino (588 | 7.7%), and Two or more Races (463 | 6.0%).
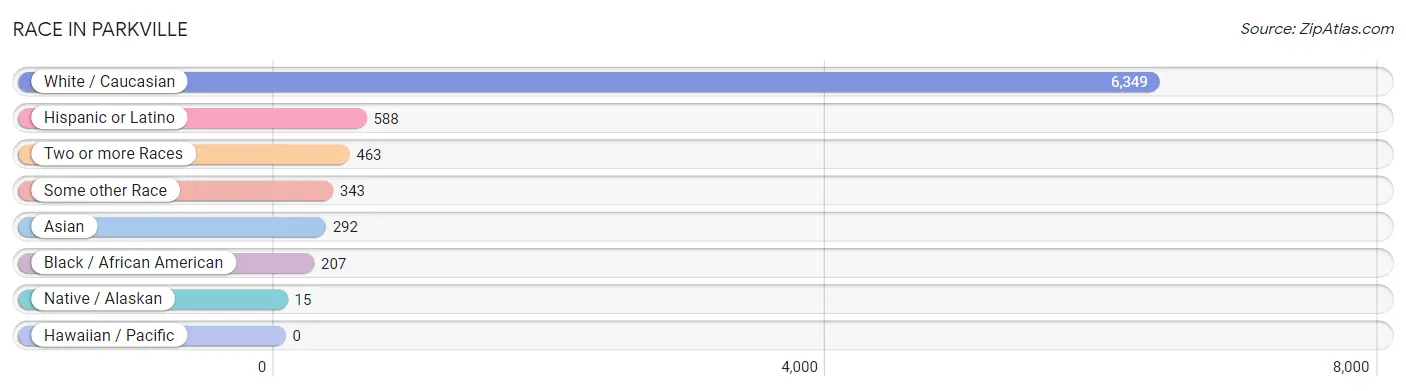
| Race | # Population | % Population |
| Asian | 292 | 3.8% |
| Black / African American | 207 | 2.7% |
| Hawaiian / Pacific | 0 | 0.0% |
| Hispanic or Latino | 588 | 7.7% |
| Native / Alaskan | 15 | 0.2% |
| White / Caucasian | 6,349 | 82.8% |
| Two or more Races | 463 | 6.0% |
| Some other Race | 343 | 4.5% |
| Total | 7,669 | 100.0% |
Ancestry in Parkville
The most populous ancestries reported in Parkville are German (1,916 | 25.0%), English (936 | 12.2%), Irish (847 | 11.0%), Scottish (620 | 8.1%), and Mexican (457 | 6.0%), together accounting for 62.3% of all Parkville residents.
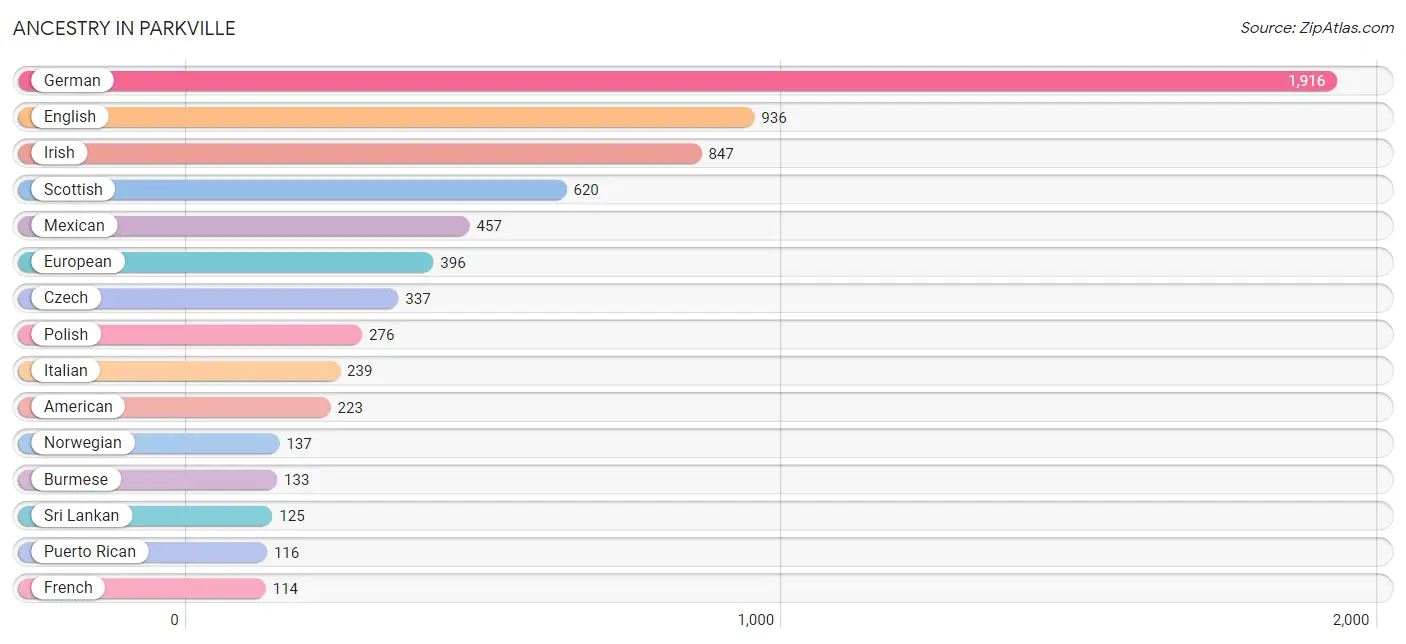
| Ancestry | # Population | % Population |
| African | 52 | 0.7% |
| American | 223 | 2.9% |
| Arab | 14 | 0.2% |
| British | 39 | 0.5% |
| Burmese | 133 | 1.7% |
| Central American | 5 | 0.1% |
| Cherokee | 12 | 0.2% |
| Chippewa | 3 | 0.0% |
| Choctaw | 17 | 0.2% |
| Croatian | 29 | 0.4% |
| Czech | 337 | 4.4% |
| Czechoslovakian | 11 | 0.1% |
| Danish | 15 | 0.2% |
| Dutch | 38 | 0.5% |
| Ecuadorian | 2 | 0.0% |
| English | 936 | 12.2% |
| European | 396 | 5.2% |
| French | 114 | 1.5% |
| German | 1,916 | 25.0% |
| Haitian | 81 | 1.1% |
| Indian (Asian) | 17 | 0.2% |
| Irish | 847 | 11.0% |
| Italian | 239 | 3.1% |
| Lebanese | 14 | 0.2% |
| Lithuanian | 54 | 0.7% |
| Mexican | 457 | 6.0% |
| Northern European | 101 | 1.3% |
| Norwegian | 137 | 1.8% |
| Polish | 276 | 3.6% |
| Potawatomi | 1 | 0.0% |
| Puerto Rican | 116 | 1.5% |
| Russian | 15 | 0.2% |
| Salvadoran | 5 | 0.1% |
| Scandinavian | 20 | 0.3% |
| Scotch-Irish | 90 | 1.2% |
| Scottish | 620 | 8.1% |
| South American | 6 | 0.1% |
| Spaniard | 4 | 0.1% |
| Sri Lankan | 125 | 1.6% |
| Subsaharan African | 52 | 0.7% |
| Swedish | 111 | 1.5% |
| Swiss | 34 | 0.4% |
| Thai | 71 | 0.9% |
| Venezuelan | 4 | 0.1% |
| Welsh | 53 | 0.7% | View All 45 Rows |
Immigrants in Parkville
The most numerous immigrant groups reported in Parkville came from Asia (80 | 1.0%), Latin America (50 | 0.6%), Eastern Asia (34 | 0.4%), Caribbean (32 | 0.4%), and Haiti (32 | 0.4%), together accounting for 3.0% of all Parkville residents.
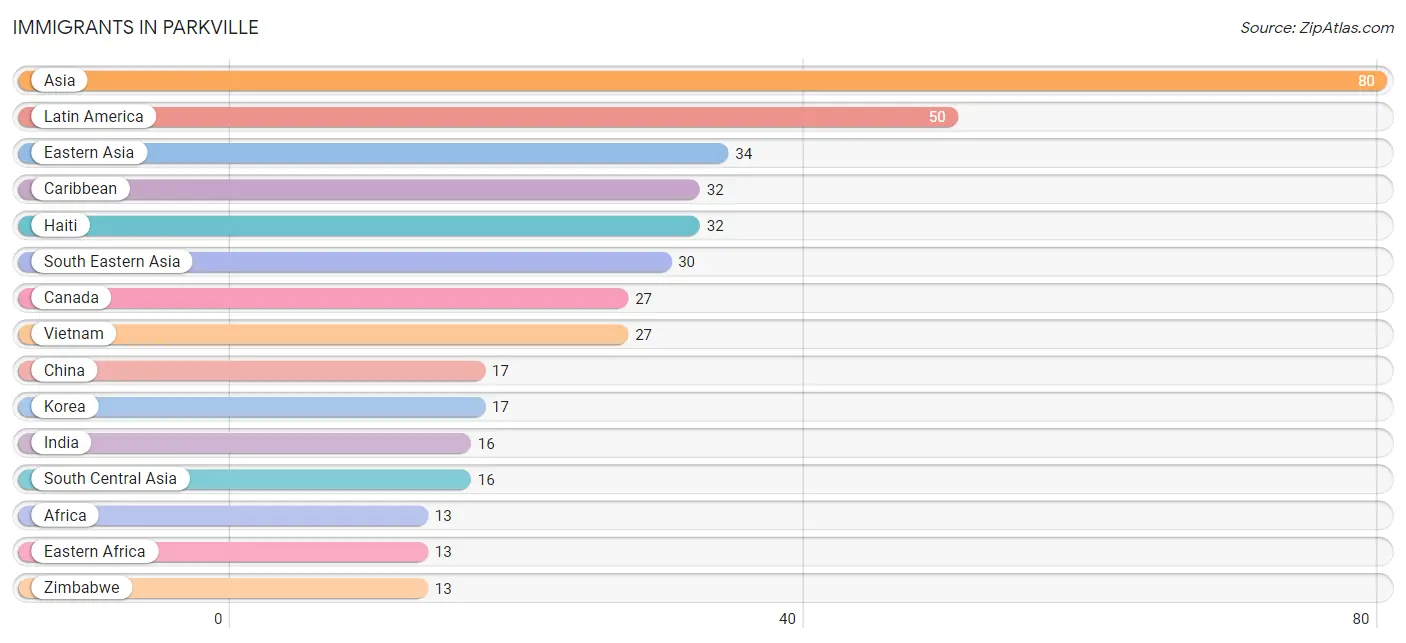
| Immigration Origin | # Population | % Population |
| Africa | 13 | 0.2% |
| Asia | 80 | 1.0% |
| Canada | 27 | 0.4% |
| Caribbean | 32 | 0.4% |
| Central America | 12 | 0.2% |
| China | 17 | 0.2% |
| Eastern Africa | 13 | 0.2% |
| Eastern Asia | 34 | 0.4% |
| Eastern Europe | 10 | 0.1% |
| Ecuador | 2 | 0.0% |
| El Salvador | 5 | 0.1% |
| Europe | 10 | 0.1% |
| Haiti | 32 | 0.4% |
| India | 16 | 0.2% |
| Korea | 17 | 0.2% |
| Latin America | 50 | 0.6% |
| Mexico | 7 | 0.1% |
| Russia | 10 | 0.1% |
| South America | 6 | 0.1% |
| South Central Asia | 16 | 0.2% |
| South Eastern Asia | 30 | 0.4% |
| Thailand | 3 | 0.0% |
| Venezuela | 4 | 0.1% |
| Vietnam | 27 | 0.4% |
| Zimbabwe | 13 | 0.2% | View All 25 Rows |
Sex and Age in Parkville
Sex and Age in Parkville
The most populous age groups in Parkville are 35 to 39 Years (468 | 11.1%) for men and 5 to 9 Years (362 | 10.5%) for women.
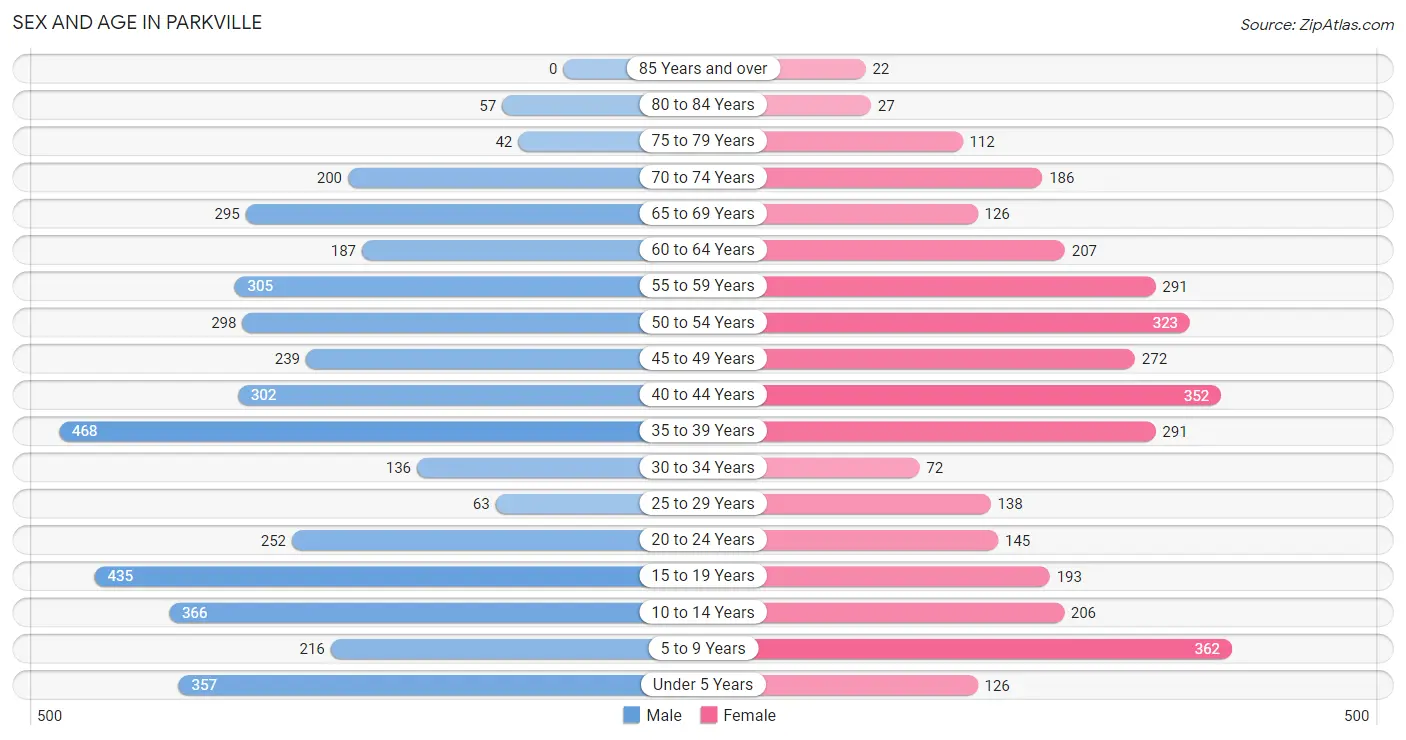
| Age Bracket | Male | Female |
| Under 5 Years | 357 (8.5%) | 126 (3.6%) |
| 5 to 9 Years | 216 (5.1%) | 362 (10.5%) |
| 10 to 14 Years | 366 (8.7%) | 206 (6.0%) |
| 15 to 19 Years | 435 (10.3%) | 193 (5.6%) |
| 20 to 24 Years | 252 (6.0%) | 145 (4.2%) |
| 25 to 29 Years | 63 (1.5%) | 138 (4.0%) |
| 30 to 34 Years | 136 (3.2%) | 72 (2.1%) |
| 35 to 39 Years | 468 (11.1%) | 291 (8.4%) |
| 40 to 44 Years | 302 (7.2%) | 352 (10.2%) |
| 45 to 49 Years | 239 (5.7%) | 272 (7.9%) |
| 50 to 54 Years | 298 (7.1%) | 323 (9.4%) |
| 55 to 59 Years | 305 (7.2%) | 291 (8.4%) |
| 60 to 64 Years | 187 (4.4%) | 207 (6.0%) |
| 65 to 69 Years | 295 (7.0%) | 126 (3.6%) |
| 70 to 74 Years | 200 (4.7%) | 186 (5.4%) |
| 75 to 79 Years | 42 (1.0%) | 112 (3.3%) |
| 80 to 84 Years | 57 (1.3%) | 27 (0.8%) |
| 85 Years and over | 0 (0.0%) | 22 (0.6%) |
| Total | 4,218 (100.0%) | 3,451 (100.0%) |
Families and Households in Parkville
Median Family Size in Parkville
The median family size in Parkville is 3.21 persons per family, with married-couple families (1,947 | 93.4%) accounting for the largest median family size of 3.27 persons per family. On the other hand, single male/father families (56 | 2.7%) represent the smallest median family size with 2.30 persons per family.
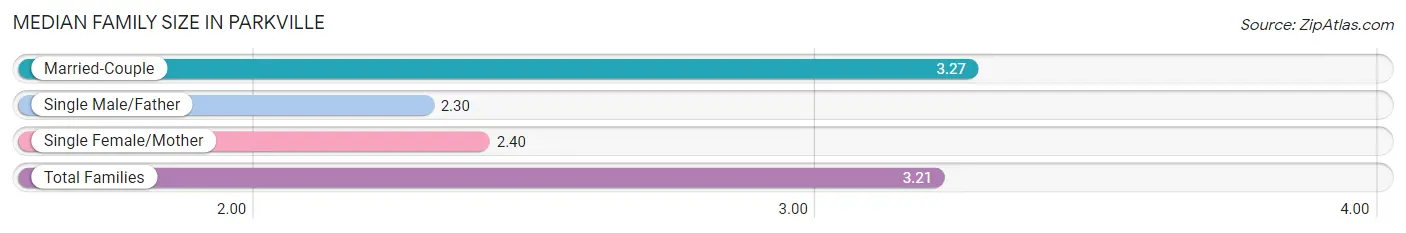
| Family Type | # Families | Family Size |
| Married-Couple | 1,947 (93.4%) | 3.27 |
| Single Male/Father | 56 (2.7%) | 2.30 |
| Single Female/Mother | 82 (3.9%) | 2.40 |
| Total Families | 2,085 (100.0%) | 3.21 |
Median Household Size in Parkville
The median household size in Parkville is 2.78 persons per household, with married-couple households (1,947 | 72.7%) accounting for the largest median household size of 3.27 persons per household. non-family households (595 | 22.2%) represent the smallest median household size with 1.27 persons per household.
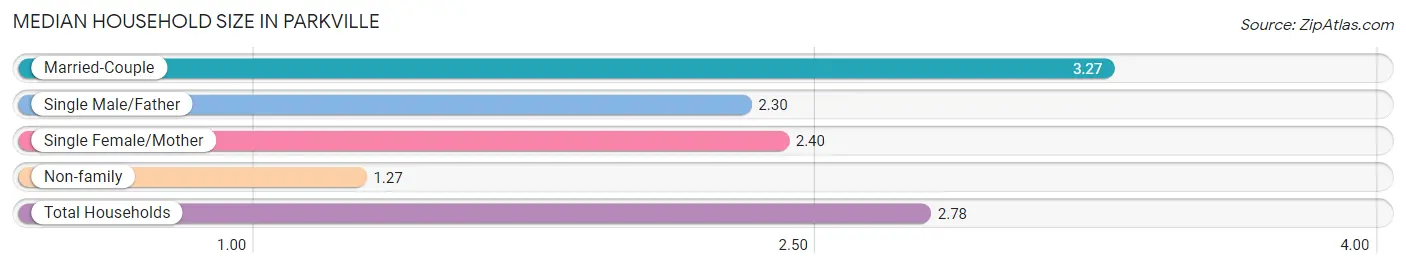
| Household Type | # Households | Household Size |
| Married-Couple | 1,947 (72.7%) | 3.27 |
| Single Male/Father | 56 (2.1%) | 2.30 |
| Single Female/Mother | 82 (3.1%) | 2.40 |
| Non-family | 595 (22.2%) | 1.27 |
| Total Households | 2,680 (100.0%) | 2.78 |
Household Size by Marriage Status in Parkville
Out of a total of 2,680 households in Parkville, 2,085 (77.8%) are family households, while 595 (22.2%) are nonfamily households. The most numerous type of family households are 2-person households, comprising 814, and the most common type of nonfamily households are 1-person households, comprising 492.
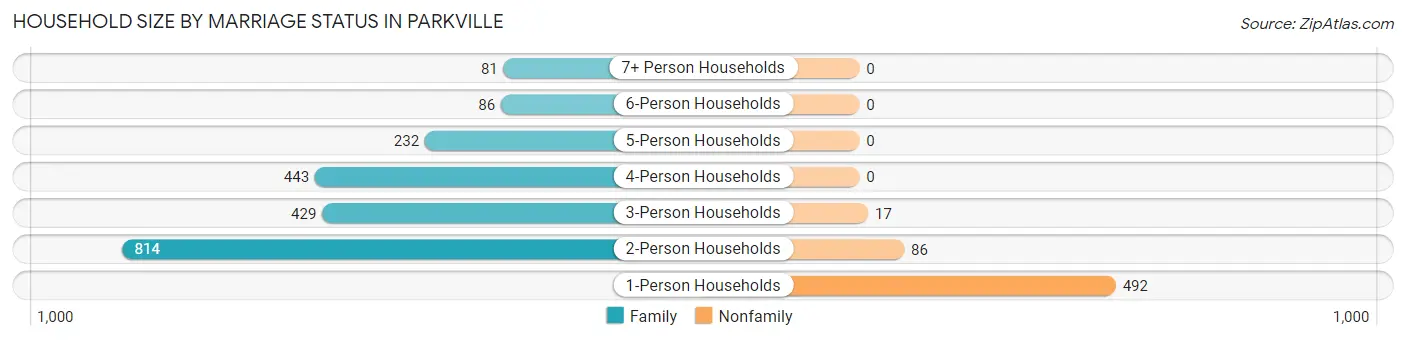
| Household Size | Family Households | Nonfamily Households |
| 1-Person Households | - | 492 (18.4%) |
| 2-Person Households | 814 (30.4%) | 86 (3.2%) |
| 3-Person Households | 429 (16.0%) | 17 (0.6%) |
| 4-Person Households | 443 (16.5%) | 0 (0.0%) |
| 5-Person Households | 232 (8.7%) | 0 (0.0%) |
| 6-Person Households | 86 (3.2%) | 0 (0.0%) |
| 7+ Person Households | 81 (3.0%) | 0 (0.0%) |
| Total | 2,085 (77.8%) | 595 (22.2%) |
Female Fertility in Parkville
Fertility by Age in Parkville
Average fertility rate in Parkville is 61.0 births per 1,000 women. Women in the age bracket of 35 to 50 years have the highest fertility rate with 83.0 births per 1,000 women. Women in the age bracket of 35 to 50 years acount for 88.2% of all women with births.
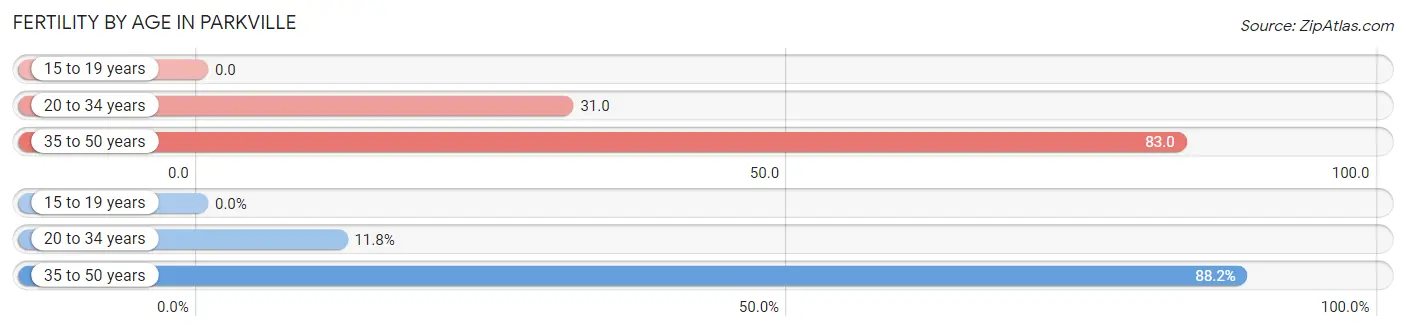
| Age Bracket | Women with Births | Births / 1,000 Women |
| 15 to 19 years | 0 (0.0%) | 0.0 |
| 20 to 34 years | 11 (11.8%) | 31.0 |
| 35 to 50 years | 82 (88.2%) | 83.0 |
| Total | 93 (100.0%) | 61.0 |
Fertility by Age by Marriage Status in Parkville
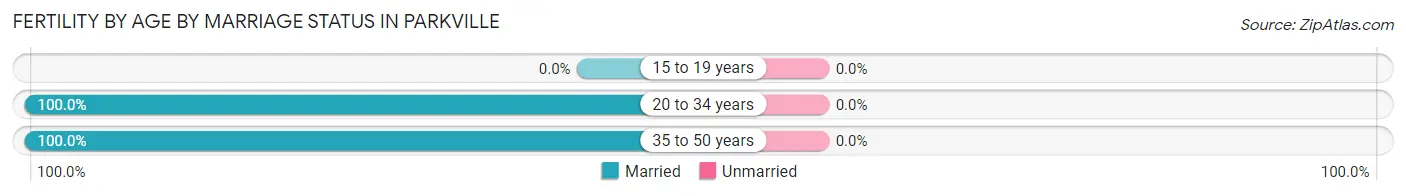
| Age Bracket | Married | Unmarried |
| 15 to 19 years | 0 (0.0%) | 0 (0.0%) |
| 20 to 34 years | 11 (100.0%) | 0 (0.0%) |
| 35 to 50 years | 82 (100.0%) | 0 (0.0%) |
| Total | 93 (100.0%) | 0 (0.0%) |
Fertility by Education in Parkville
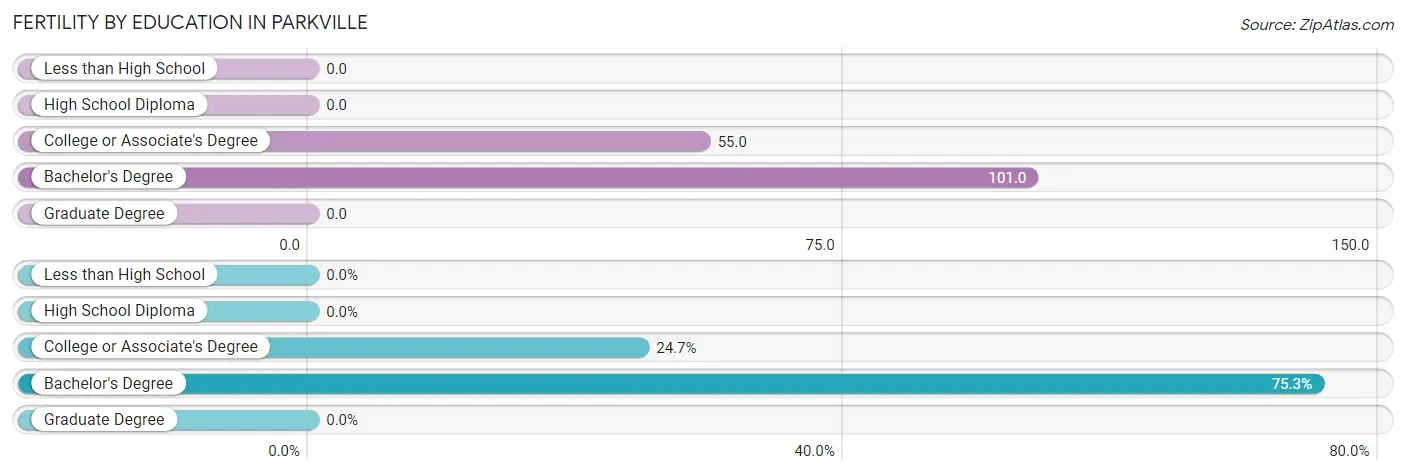
| Educational Attainment | Women with Births | Births / 1,000 Women |
| Less than High School | 0 (0.0%) | 0.0 |
| High School Diploma | 0 (0.0%) | 0.0 |
| College or Associate's Degree | 23 (24.7%) | 55.0 |
| Bachelor's Degree | 70 (75.3%) | 101.0 |
| Graduate Degree | 0 (0.0%) | 0.0 |
| Total | 93 (100.0%) | 61.0 |
Fertility by Education by Marriage Status in Parkville
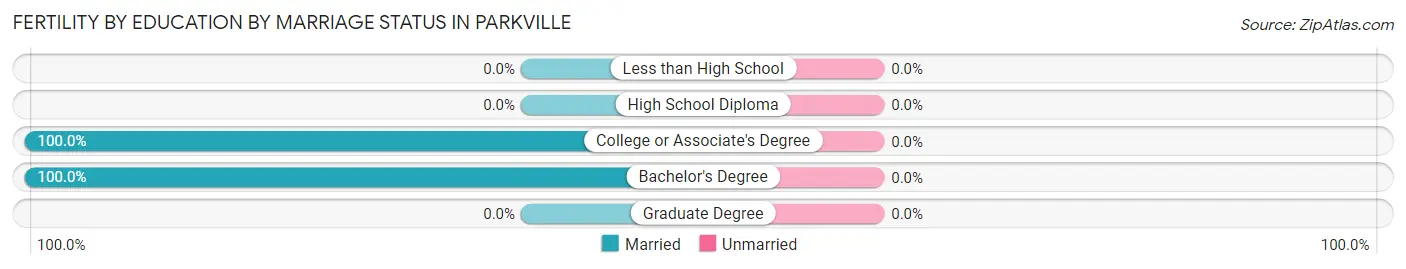
| Educational Attainment | Married | Unmarried |
| Less than High School | 0 (0.0%) | 0 (0.0%) |
| High School Diploma | 0 (0.0%) | 0 (0.0%) |
| College or Associate's Degree | 23 (100.0%) | 0 (0.0%) |
| Bachelor's Degree | 70 (100.0%) | 0 (0.0%) |
| Graduate Degree | 0 (0.0%) | 0 (0.0%) |
| Total | 93 (100.0%) | 0 (0.0%) |
Income in Parkville
Income Overview in Parkville
Per Capita Income in Parkville is $75,435, while median incomes of families and households are $202,219 and $166,563 respectively.
| Characteristic | Number | Measure |
| Per Capita Income | 7,669 | $75,435 |
| Median Family Income | 2,085 | $202,219 |
| Mean Family Income | 2,085 | $258,964 |
| Median Household Income | 2,680 | $166,563 |
| Mean Household Income | 2,680 | $216,909 |
| Income Deficit | 2,085 | $0 |
| Wage / Income Gap (%) | 7,669 | 46.35% |
| Wage / Income Gap ($) | 7,669 | 53.65¢ per $1 |
| Gini / Inequality Index | 7,669 | 0.45 |
Earnings by Sex in Parkville
Average Earnings in Parkville are $62,518, $85,250 for men and $45,733 for women, a difference of 46.4%.
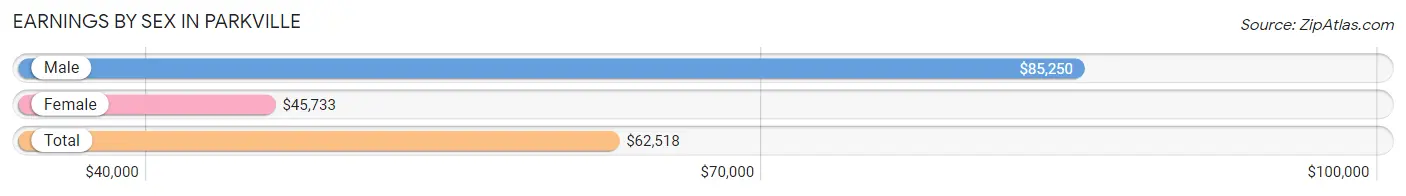
| Sex | Number | Average Earnings |
| Male | 2,407 (56.7%) | $85,250 |
| Female | 1,839 (43.3%) | $45,733 |
| Total | 4,246 (100.0%) | $62,518 |
Earnings by Sex by Income Bracket in Parkville
The most common earnings brackets in Parkville are $100,000+ for men (1,108 | 46.0%) and $100,000+ for women (396 | 21.5%).
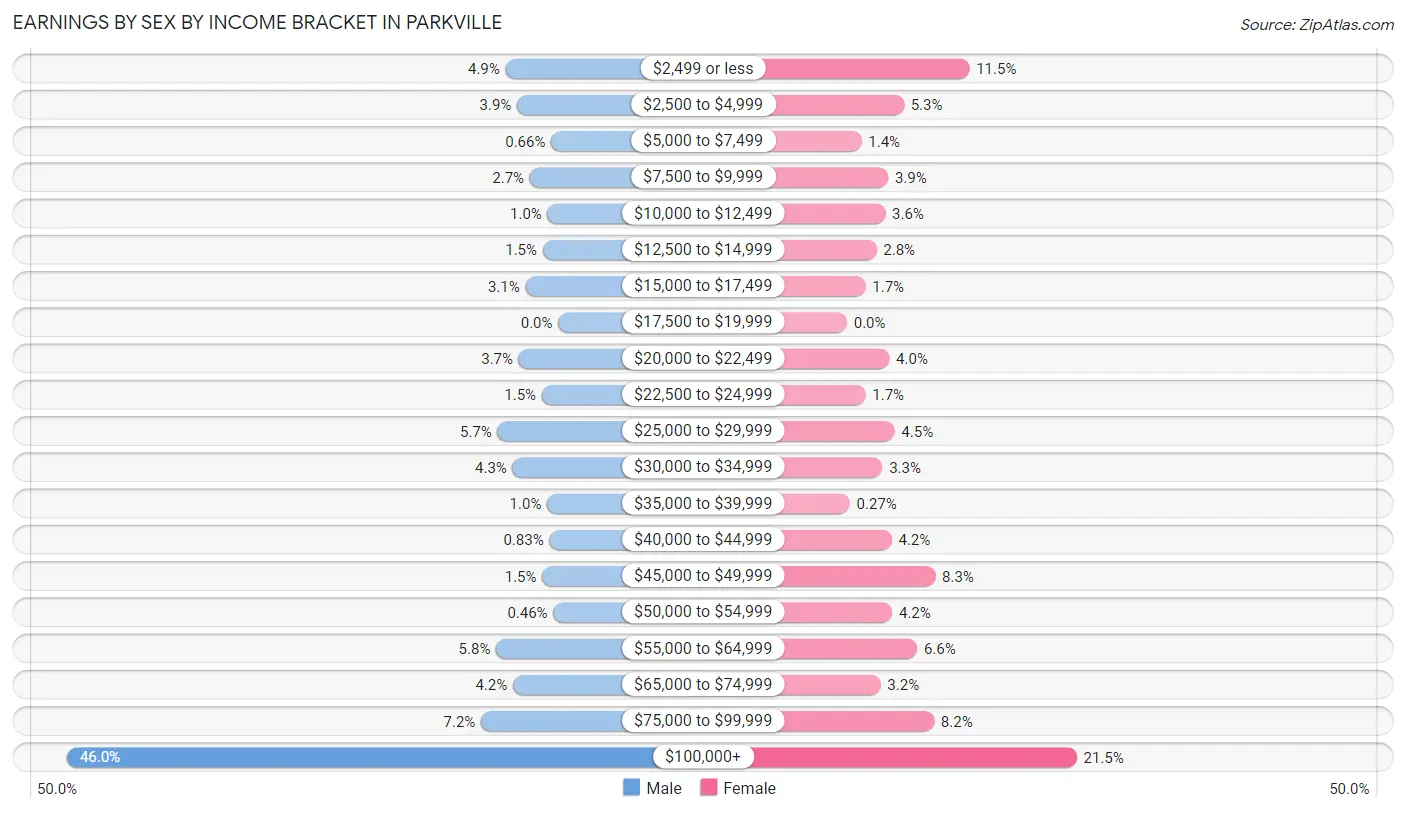
| Income | Male | Female |
| $2,499 or less | 119 (4.9%) | 211 (11.5%) |
| $2,500 to $4,999 | 93 (3.9%) | 98 (5.3%) |
| $5,000 to $7,499 | 16 (0.7%) | 25 (1.4%) |
| $7,500 to $9,999 | 64 (2.7%) | 71 (3.9%) |
| $10,000 to $12,499 | 24 (1.0%) | 66 (3.6%) |
| $12,500 to $14,999 | 35 (1.5%) | 51 (2.8%) |
| $15,000 to $17,499 | 74 (3.1%) | 32 (1.7%) |
| $17,500 to $19,999 | 0 (0.0%) | 0 (0.0%) |
| $20,000 to $22,499 | 89 (3.7%) | 73 (4.0%) |
| $22,500 to $24,999 | 37 (1.5%) | 32 (1.7%) |
| $25,000 to $29,999 | 137 (5.7%) | 82 (4.5%) |
| $30,000 to $34,999 | 103 (4.3%) | 61 (3.3%) |
| $35,000 to $39,999 | 25 (1.0%) | 5 (0.3%) |
| $40,000 to $44,999 | 20 (0.8%) | 77 (4.2%) |
| $45,000 to $49,999 | 36 (1.5%) | 152 (8.3%) |
| $50,000 to $54,999 | 11 (0.5%) | 78 (4.2%) |
| $55,000 to $64,999 | 140 (5.8%) | 121 (6.6%) |
| $65,000 to $74,999 | 102 (4.2%) | 58 (3.2%) |
| $75,000 to $99,999 | 174 (7.2%) | 150 (8.2%) |
| $100,000+ | 1,108 (46.0%) | 396 (21.5%) |
| Total | 2,407 (100.0%) | 1,839 (100.0%) |
Earnings by Sex by Educational Attainment in Parkville
Average earnings in Parkville are $115,543 for men and $50,000 for women, a difference of 56.7%. Men with an educational attainment of graduate degree enjoy the highest average annual earnings of $158,273, while those with college or associate's degree education earn the least with $95,057. Women with an educational attainment of graduate degree earn the most with the average annual earnings of $64,728, while those with high school diploma education have the smallest earnings of $43,500.
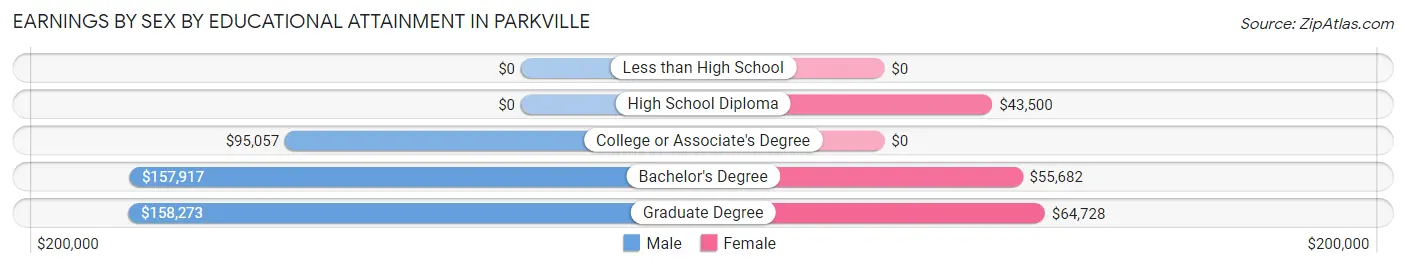
| Educational Attainment | Male Income | Female Income |
| Less than High School | - | - |
| High School Diploma | - | - |
| College or Associate's Degree | $95,057 | $0 |
| Bachelor's Degree | $157,917 | $55,682 |
| Graduate Degree | $158,273 | $64,728 |
| Total | $115,543 | $50,000 |
Family Income in Parkville
Family Income Brackets in Parkville
According to the Parkville family income data, there are 1,086 families falling into the $200,000+ income range, which is the most common income bracket and makes up 52.1% of all families.
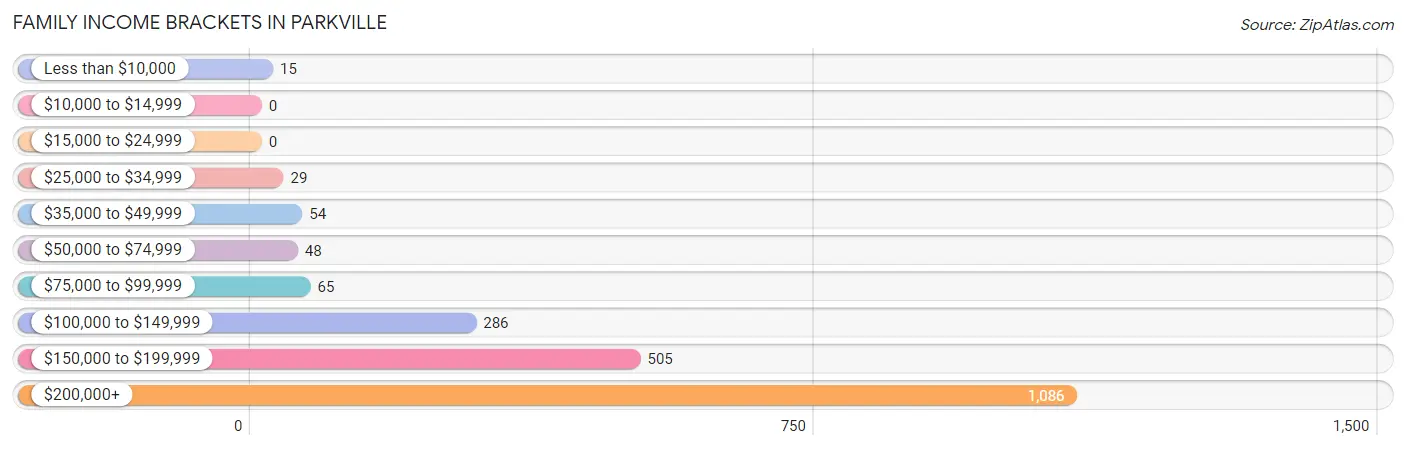
| Income Bracket | # Families | % Families |
| Less than $10,000 | 15 | 0.7% |
| $10,000 to $14,999 | 0 | 0.0% |
| $15,000 to $24,999 | 0 | 0.0% |
| $25,000 to $34,999 | 29 | 1.4% |
| $35,000 to $49,999 | 54 | 2.6% |
| $50,000 to $74,999 | 48 | 2.3% |
| $75,000 to $99,999 | 65 | 3.1% |
| $100,000 to $149,999 | 286 | 13.7% |
| $150,000 to $199,999 | 505 | 24.2% |
| $200,000+ | 1,086 | 52.1% |
Family Income by Famaliy Size in Parkville
5-person families (232 | 11.1%) account for the highest median family income in Parkville with $247,353 per family, while 2-person families (814 | 39.0%) have the highest median income of $100,673 per family member.
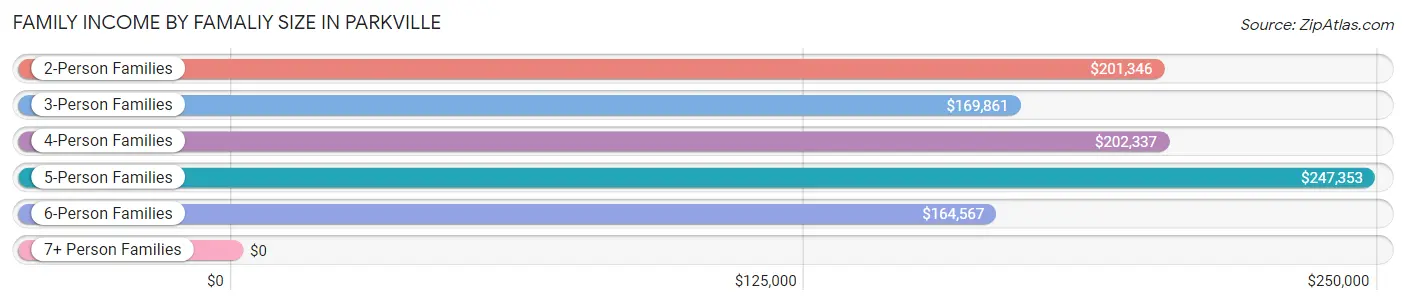
| Income Bracket | # Families | Median Income |
| 2-Person Families | 814 (39.0%) | $201,346 |
| 3-Person Families | 429 (20.6%) | $169,861 |
| 4-Person Families | 443 (21.2%) | $202,337 |
| 5-Person Families | 232 (11.1%) | $247,353 |
| 6-Person Families | 86 (4.1%) | $164,567 |
| 7+ Person Families | 81 (3.9%) | $0 |
| Total | 2,085 (100.0%) | $202,219 |
Family Income by Number of Earners in Parkville
The median family income in Parkville is $202,219, with families comprising 1 earner (727) having the highest median family income of $225,846, while families with 2 earners (924) have the lowest median family income of $179,194, accounting for 34.9% and 44.3% of families, respectively.
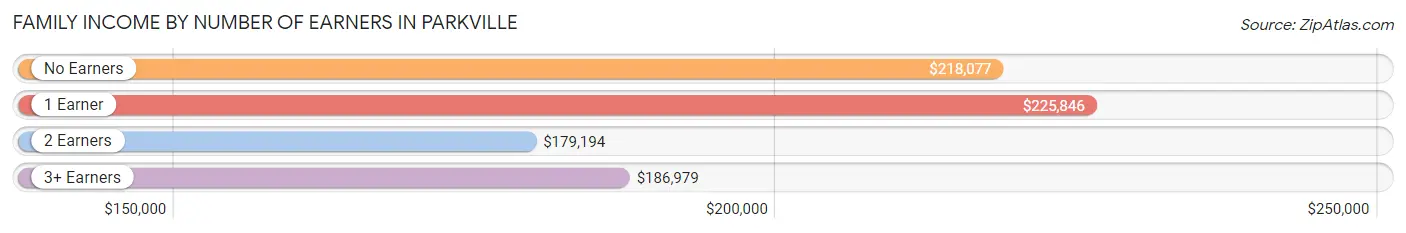
| Number of Earners | # Families | Median Income |
| No Earners | 148 (7.1%) | $218,077 |
| 1 Earner | 727 (34.9%) | $225,846 |
| 2 Earners | 924 (44.3%) | $179,194 |
| 3+ Earners | 286 (13.7%) | $186,979 |
| Total | 2,085 (100.0%) | $202,219 |
Household Income in Parkville
Household Income Brackets in Parkville
With 1,107 households falling in the category, the $200,000+ income range is the most frequent in Parkville, accounting for 41.3% of all households.
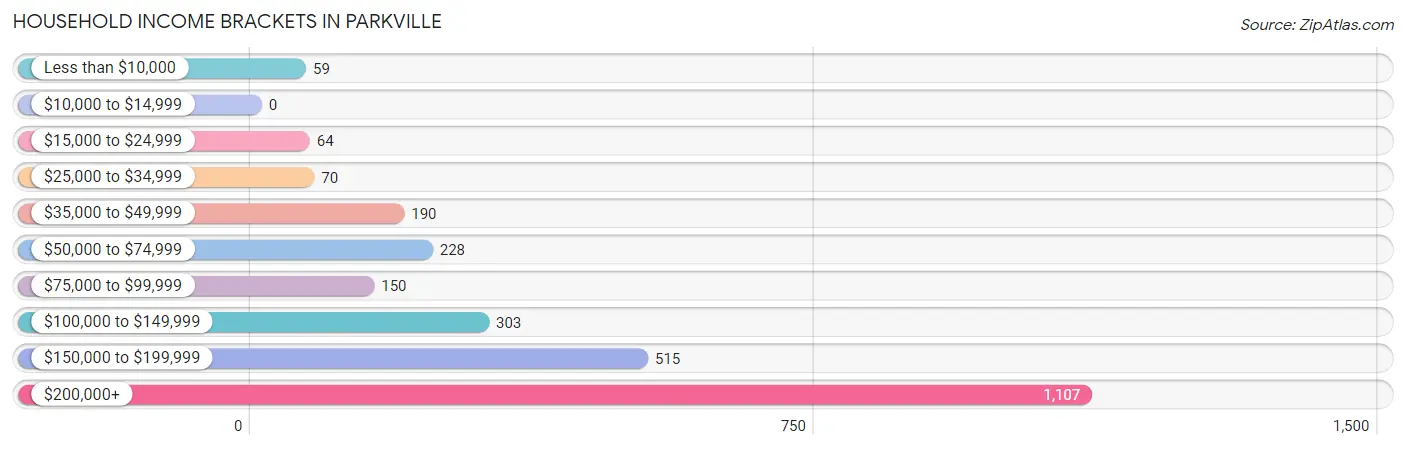
| Income Bracket | # Households | % Households |
| Less than $10,000 | 59 | 2.2% |
| $10,000 to $14,999 | 0 | 0.0% |
| $15,000 to $24,999 | 64 | 2.4% |
| $25,000 to $34,999 | 70 | 2.6% |
| $35,000 to $49,999 | 190 | 7.1% |
| $50,000 to $74,999 | 228 | 8.5% |
| $75,000 to $99,999 | 150 | 5.6% |
| $100,000 to $149,999 | 303 | 11.3% |
| $150,000 to $199,999 | 515 | 19.2% |
| $200,000+ | 1,107 | 41.3% |
Household Income by Householder Age in Parkville
The median household income in Parkville is $166,563, with the highest median household income of $222,586 found in the 45 to 64 years age bracket for the primary householder. A total of 1,172 households (43.7%) fall into this category. Meanwhile, the 15 to 24 years age bracket for the primary householder has the lowest median household income of $0, with 3 households (0.1%) in this group.
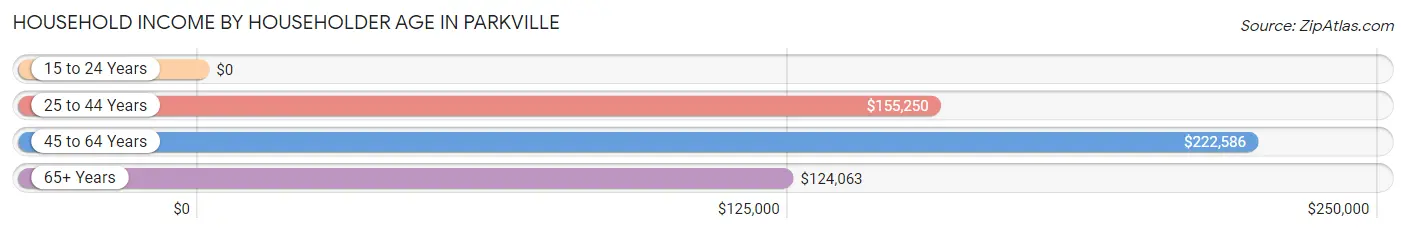
| Income Bracket | # Households | Median Income |
| 15 to 24 Years | 3 (0.1%) | $0 |
| 25 to 44 Years | 838 (31.3%) | $155,250 |
| 45 to 64 Years | 1,172 (43.7%) | $222,586 |
| 65+ Years | 667 (24.9%) | $124,063 |
| Total | 2,680 (100.0%) | $166,563 |
Poverty in Parkville
Income Below Poverty by Sex and Age in Parkville
With 1.1% poverty level for males and 2.0% for females among the residents of Parkville, 6 to 11 year old males and 75 year old and over females are the most vulnerable to poverty, with 13 males (4.0%) and 30 females (18.6%) in their respective age groups living below the poverty level.
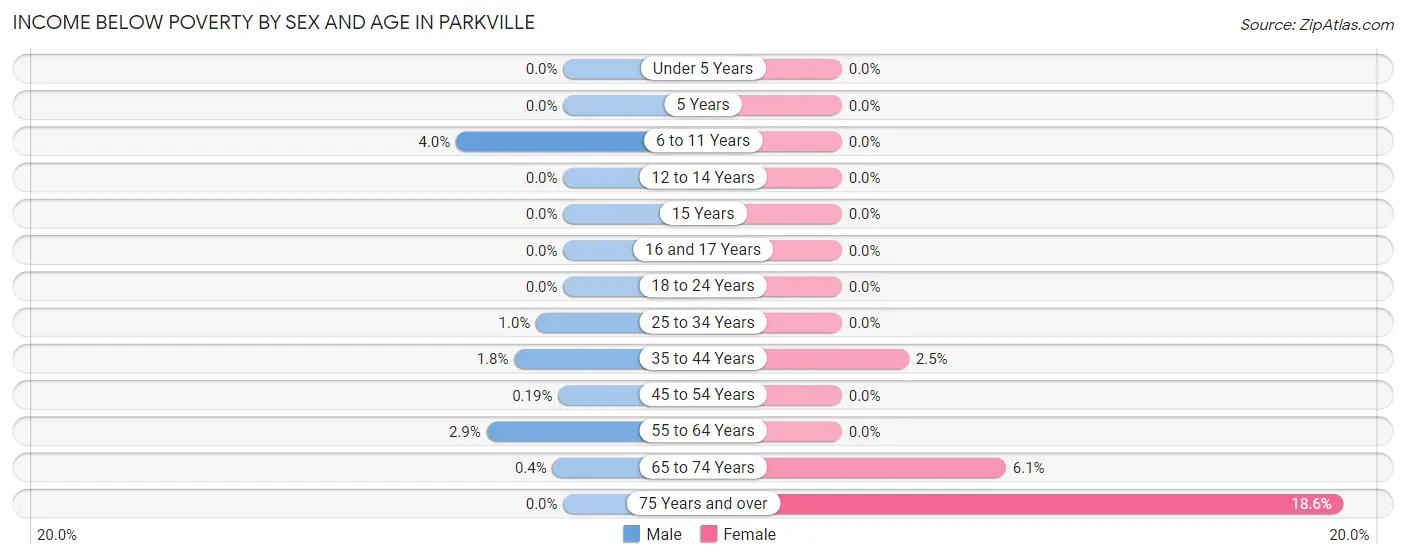
| Age Bracket | Male | Female |
| Under 5 Years | 0 (0.0%) | 0 (0.0%) |
| 5 Years | 0 (0.0%) | 0 (0.0%) |
| 6 to 11 Years | 13 (4.0%) | 0 (0.0%) |
| 12 to 14 Years | 0 (0.0%) | 0 (0.0%) |
| 15 Years | 0 (0.0%) | 0 (0.0%) |
| 16 and 17 Years | 0 (0.0%) | 0 (0.0%) |
| 18 to 24 Years | 0 (0.0%) | 0 (0.0%) |
| 25 to 34 Years | 2 (1.0%) | 0 (0.0%) |
| 35 to 44 Years | 14 (1.8%) | 16 (2.5%) |
| 45 to 54 Years | 1 (0.2%) | 0 (0.0%) |
| 55 to 64 Years | 14 (2.9%) | 0 (0.0%) |
| 65 to 74 Years | 2 (0.4%) | 19 (6.1%) |
| 75 Years and over | 0 (0.0%) | 30 (18.6%) |
| Total | 46 (1.1%) | 65 (2.0%) |
Income Above Poverty by Sex and Age in Parkville
According to the poverty statistics in Parkville, males aged under 5 years and females aged under 5 years are the age groups that are most secure financially, with 100.0% of males and 100.0% of females in these age groups living above the poverty line.
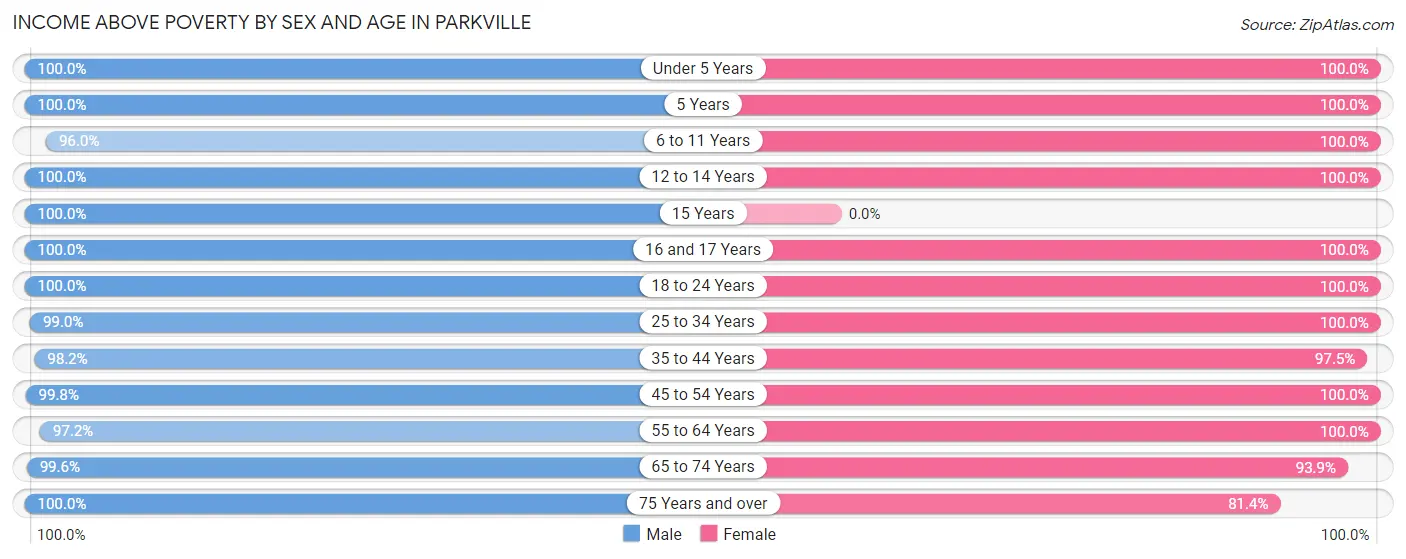
| Age Bracket | Male | Female |
| Under 5 Years | 326 (100.0%) | 106 (100.0%) |
| 5 Years | 19 (100.0%) | 5 (100.0%) |
| 6 to 11 Years | 314 (96.0%) | 401 (100.0%) |
| 12 to 14 Years | 236 (100.0%) | 162 (100.0%) |
| 15 Years | 177 (100.0%) | 0 (0.0%) |
| 16 and 17 Years | 134 (100.0%) | 22 (100.0%) |
| 18 to 24 Years | 306 (100.0%) | 208 (100.0%) |
| 25 to 34 Years | 197 (99.0%) | 193 (100.0%) |
| 35 to 44 Years | 756 (98.2%) | 627 (97.5%) |
| 45 to 54 Years | 536 (99.8%) | 595 (100.0%) |
| 55 to 64 Years | 478 (97.2%) | 498 (100.0%) |
| 65 to 74 Years | 493 (99.6%) | 293 (93.9%) |
| 75 Years and over | 99 (100.0%) | 131 (81.4%) |
| Total | 4,071 (98.9%) | 3,241 (98.0%) |
Income Below Poverty Among Married-Couple Families in Parkville
The poverty statistics for married-couple families in Parkville show that 0.7% or 14 of the total 1,947 families live below the poverty line. Families with 1 or 2 children have the highest poverty rate of 1.9%, comprising of 14 families. On the other hand, families with no children have the lowest poverty rate of 0.0%, which includes 0 families.
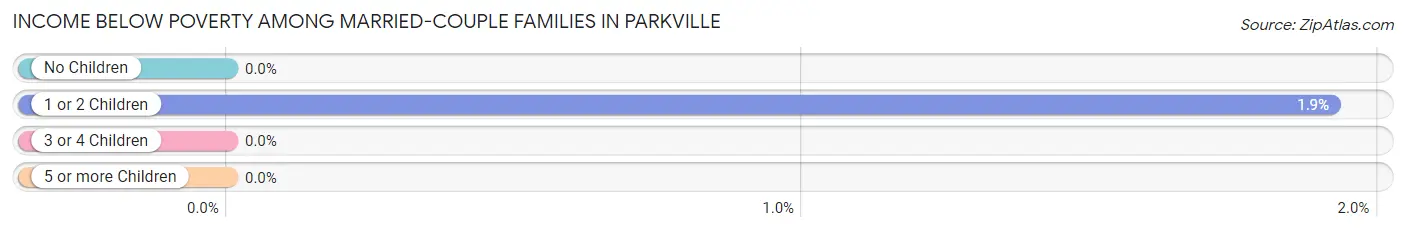
| Children | Above Poverty | Below Poverty |
| No Children | 924 (100.0%) | 0 (0.0%) |
| 1 or 2 Children | 715 (98.1%) | 14 (1.9%) |
| 3 or 4 Children | 213 (100.0%) | 0 (0.0%) |
| 5 or more Children | 81 (100.0%) | 0 (0.0%) |
| Total | 1,933 (99.3%) | 14 (0.7%) |
Income Below Poverty Among Single-Parent Households in Parkville
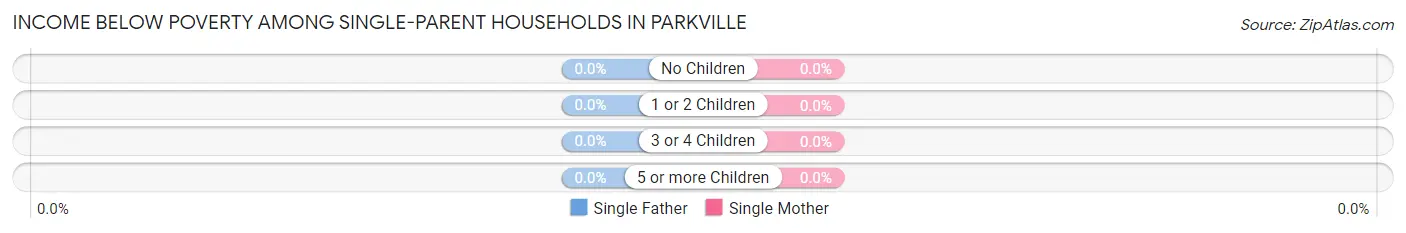
| Children | Single Father | Single Mother |
| No Children | 0 (0.0%) | 0 (0.0%) |
| 1 or 2 Children | 0 (0.0%) | 0 (0.0%) |
| 3 or 4 Children | 0 (0.0%) | 0 (0.0%) |
| 5 or more Children | 0 (0.0%) | 0 (0.0%) |
| Total | 0 (0.0%) | 0 (0.0%) |
Income Below Poverty Among Married-Couple vs Single-Parent Households in Parkville
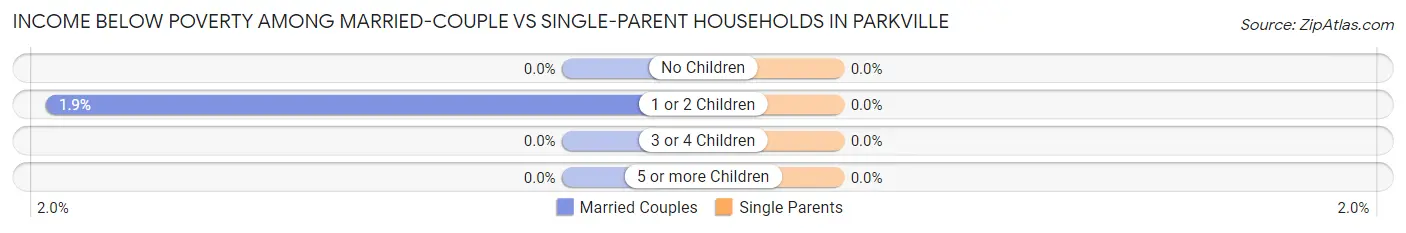
| Children | Married-Couple Families | Single-Parent Households |
| No Children | 0 (0.0%) | 0 (0.0%) |
| 1 or 2 Children | 14 (1.9%) | 0 (0.0%) |
| 3 or 4 Children | 0 (0.0%) | 0 (0.0%) |
| 5 or more Children | 0 (0.0%) | 0 (0.0%) |
| Total | 14 (0.7%) | 0 (0.0%) |
Employment Characteristics in Parkville
Employment by Class of Employer in Parkville
Among the 3,787 employed individuals in Parkville, private company employees (2,502 | 66.1%), not-for-profit organizations (337 | 8.9%), and self-employed (not incorporated) (324 | 8.6%) make up the most common classes of employment.
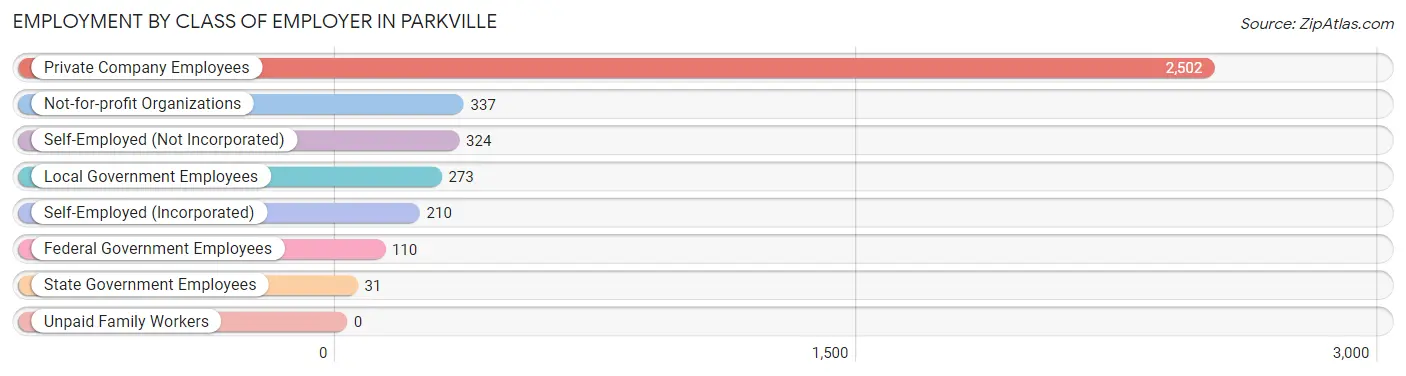
| Employer Class | # Employees | % Employees |
| Private Company Employees | 2,502 | 66.1% |
| Self-Employed (Incorporated) | 210 | 5.6% |
| Self-Employed (Not Incorporated) | 324 | 8.6% |
| Not-for-profit Organizations | 337 | 8.9% |
| Local Government Employees | 273 | 7.2% |
| State Government Employees | 31 | 0.8% |
| Federal Government Employees | 110 | 2.9% |
| Unpaid Family Workers | 0 | 0.0% |
| Total | 3,787 | 100.0% |
Employment Status by Age in Parkville
According to the labor force statistics for Parkville, out of the total population over 16 years of age (5,859), 69.4% or 4,066 individuals are in the labor force, with 3.6% or 146 of them unemployed. The age group with the highest labor force participation rate is 25 to 29 years, with 100.0% or 201 individuals in the labor force. Within the labor force, the 20 to 24 years age range has the highest percentage of unemployed individuals, with 16.8% or 53 of them being unemployed.
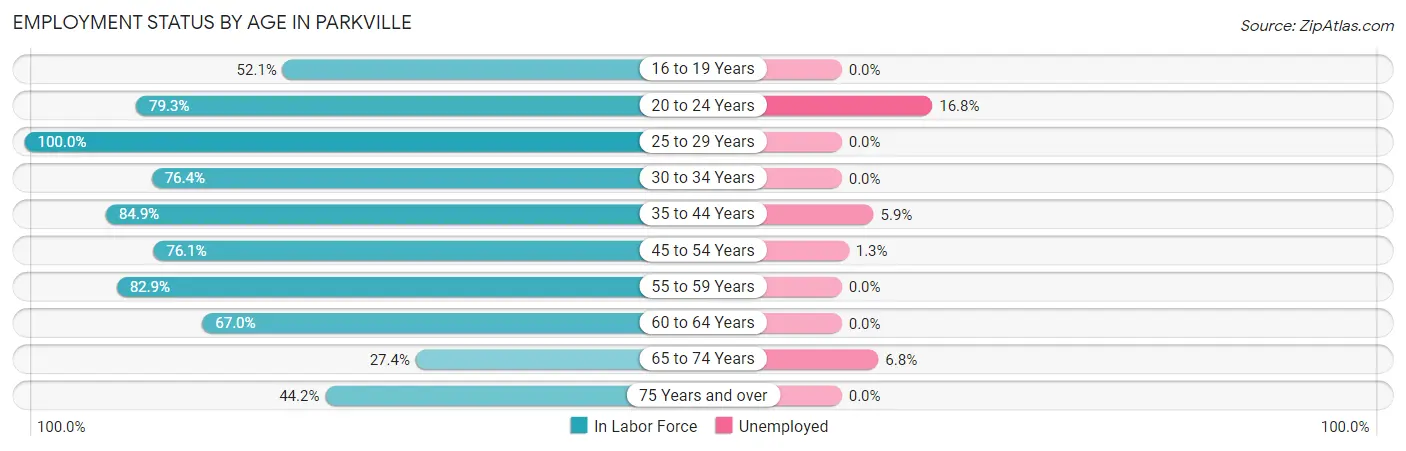
| Age Bracket | In Labor Force | Unemployed |
| 16 to 19 Years | 235 (52.1%) | 0 (0.0%) |
| 20 to 24 Years | 315 (79.3%) | 53 (16.8%) |
| 25 to 29 Years | 201 (100.0%) | 0 (0.0%) |
| 30 to 34 Years | 159 (76.4%) | 0 (0.0%) |
| 35 to 44 Years | 1,200 (84.9%) | 71 (5.9%) |
| 45 to 54 Years | 861 (76.1%) | 11 (1.3%) |
| 55 to 59 Years | 494 (82.9%) | 0 (0.0%) |
| 60 to 64 Years | 264 (67.0%) | 0 (0.0%) |
| 65 to 74 Years | 221 (27.4%) | 15 (6.8%) |
| 75 Years and over | 115 (44.2%) | 0 (0.0%) |
| Total | 4,066 (69.4%) | 146 (3.6%) |
Employment Status by Educational Attainment in Parkville
According to labor force statistics for Parkville, 80.6% of individuals (3,179) out of the total population between 25 and 64 years of age (3,944) are in the labor force, with 2.5% or 79 of them being unemployed. The group with the highest labor force participation rate are those with the educational attainment of less than high school, with 98.6% or 143 individuals in the labor force. Within the labor force, individuals with less than high school education have the highest percentage of unemployment, with 46.2% or 66 of them being unemployed.
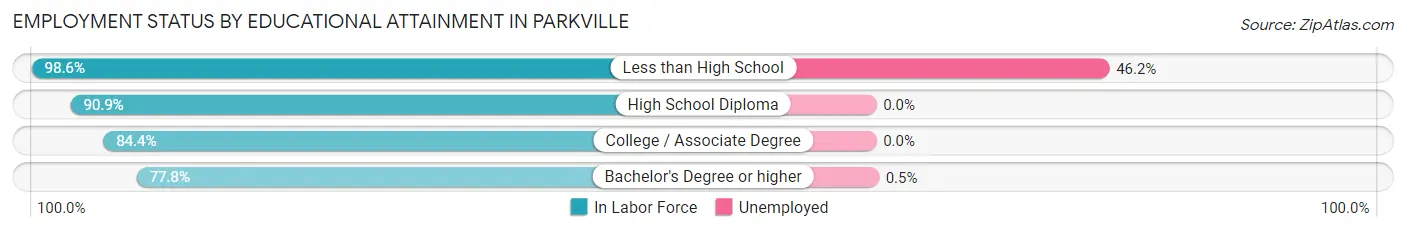
| Educational Attainment | In Labor Force | Unemployed |
| Less than High School | 143 (98.6%) | 67 (46.2%) |
| High School Diploma | 241 (90.9%) | 0 (0.0%) |
| College / Associate Degree | 585 (84.4%) | 0 (0.0%) |
| Bachelor's Degree or higher | 2,210 (77.8%) | 14 (0.5%) |
| Total | 3,179 (80.6%) | 99 (2.5%) |
Employment Occupations by Sex in Parkville
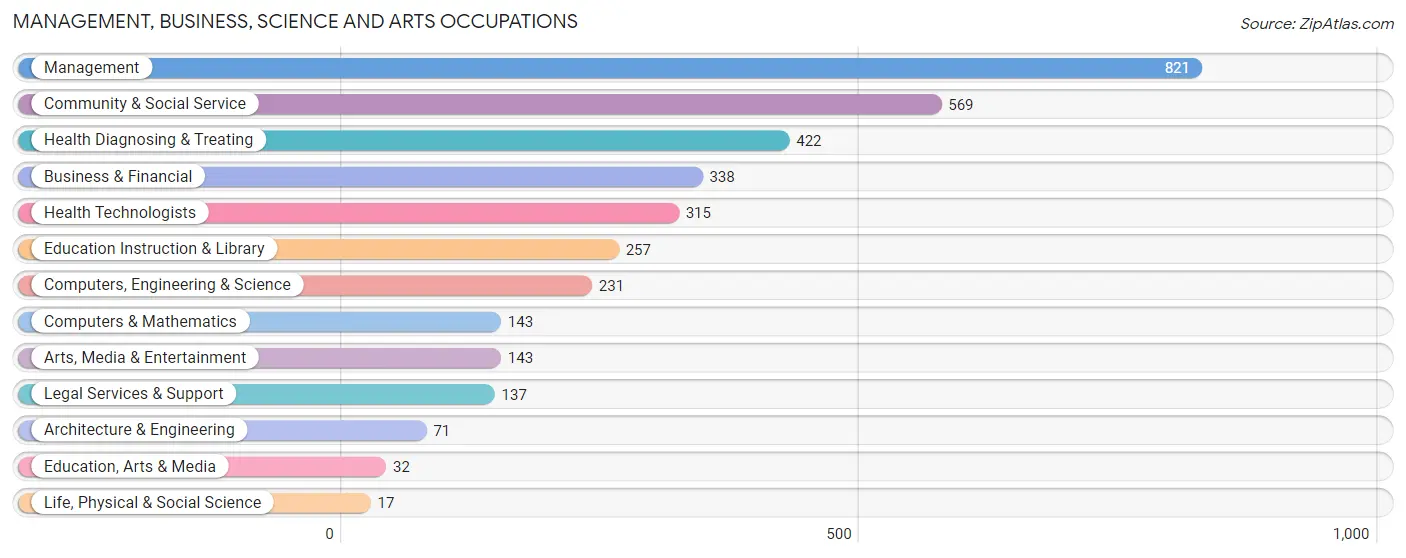
Management, Business, Science and Arts Occupations
The most common Management, Business, Science and Arts occupations in Parkville are Management (821 | 21.4%), Community & Social Service (569 | 14.8%), Health Diagnosing & Treating (422 | 11.0%), Business & Financial (338 | 8.8%), and Health Technologists (315 | 8.2%).
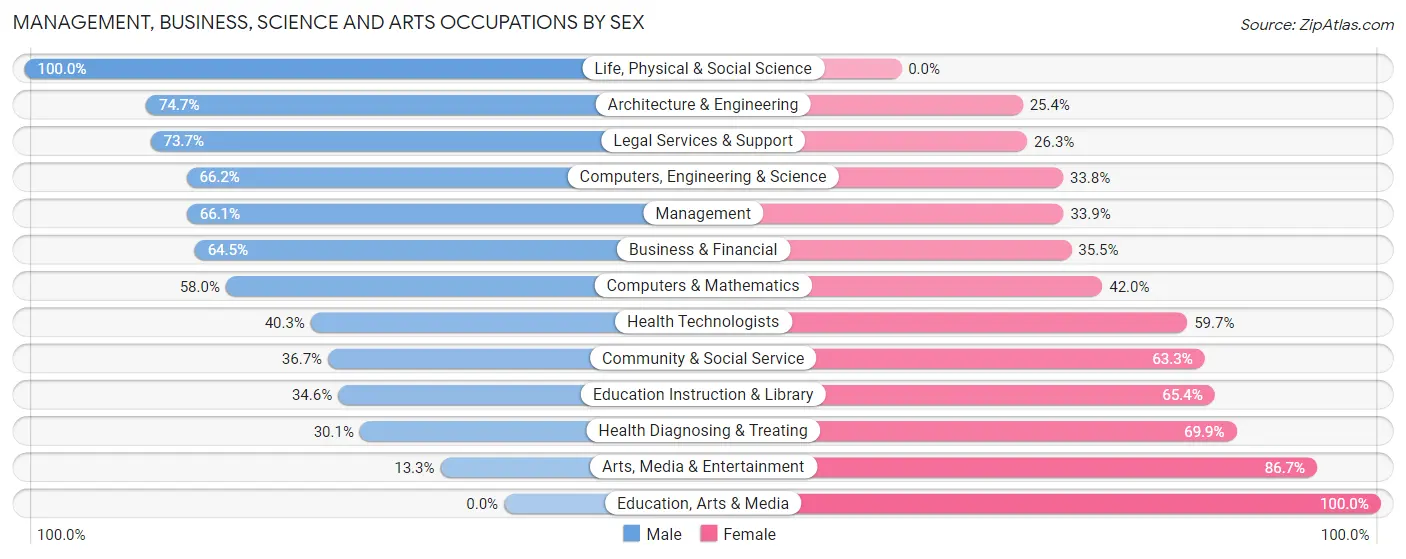
Management, Business, Science and Arts Occupations by Sex
Within the Management, Business, Science and Arts occupations in Parkville, the most male-oriented occupations are Life, Physical & Social Science (100.0%), Architecture & Engineering (74.7%), and Legal Services & Support (73.7%), while the most female-oriented occupations are Education, Arts & Media (100.0%), Arts, Media & Entertainment (86.7%), and Health Diagnosing & Treating (69.9%).
| Occupation | Male | Female |
| Management | 543 (66.1%) | 278 (33.9%) |
| Business & Financial | 218 (64.5%) | 120 (35.5%) |
| Computers, Engineering & Science | 153 (66.2%) | 78 (33.8%) |
| Computers & Mathematics | 83 (58.0%) | 60 (42.0%) |
| Architecture & Engineering | 53 (74.7%) | 18 (25.4%) |
| Life, Physical & Social Science | 17 (100.0%) | 0 (0.0%) |
| Community & Social Service | 209 (36.7%) | 360 (63.3%) |
| Education, Arts & Media | 0 (0.0%) | 32 (100.0%) |
| Legal Services & Support | 101 (73.7%) | 36 (26.3%) |
| Education Instruction & Library | 89 (34.6%) | 168 (65.4%) |
| Arts, Media & Entertainment | 19 (13.3%) | 124 (86.7%) |
| Health Diagnosing & Treating | 127 (30.1%) | 295 (69.9%) |
| Health Technologists | 127 (40.3%) | 188 (59.7%) |
| Total (Category) | 1,250 (52.5%) | 1,131 (47.5%) |
| Total (Overall) | 2,206 (57.5%) | 1,632 (42.5%) |
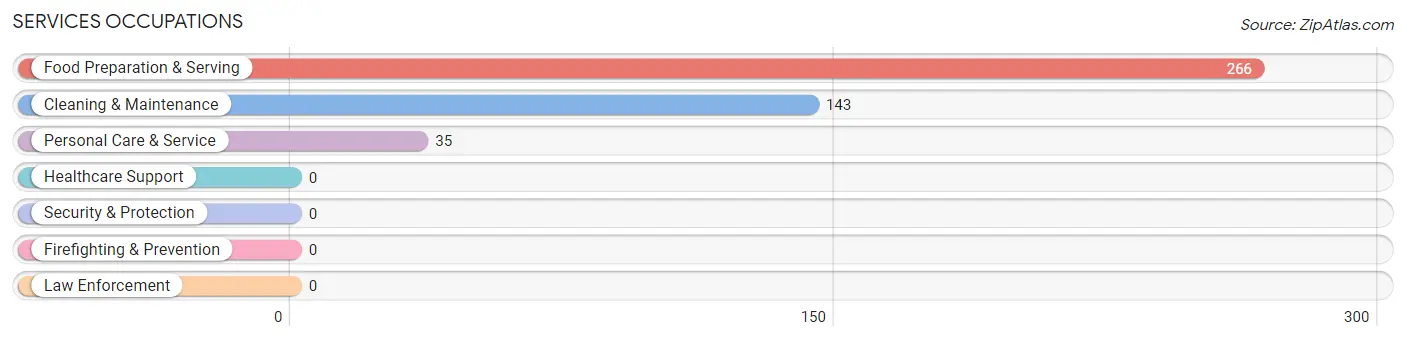
Services Occupations
The most common Services occupations in Parkville are Food Preparation & Serving (266 | 6.9%), Cleaning & Maintenance (143 | 3.7%), and Personal Care & Service (35 | 0.9%).
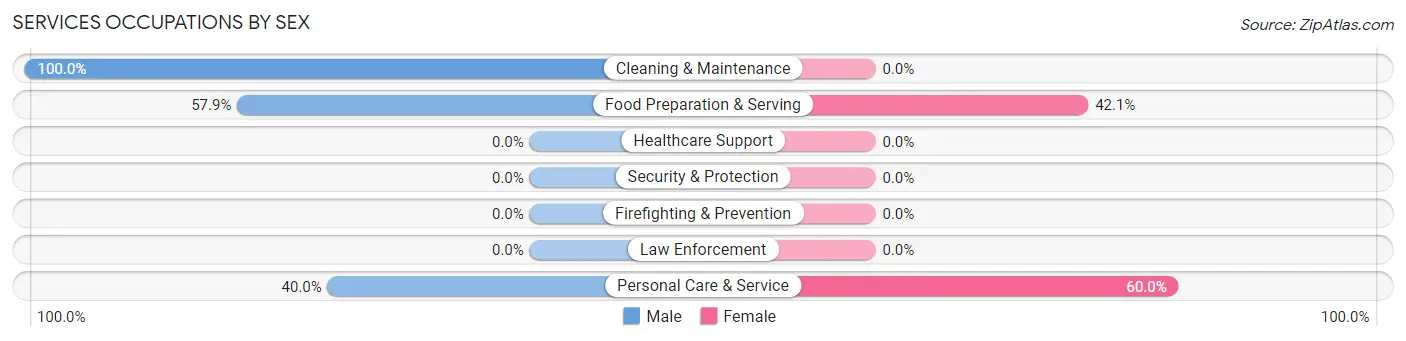
Services Occupations by Sex
Within the Services occupations in Parkville, the most male-oriented occupations are Cleaning & Maintenance (100.0%), Food Preparation & Serving (57.9%), and Personal Care & Service (40.0%), while the most female-oriented occupations are Personal Care & Service (60.0%), and Food Preparation & Serving (42.1%).
| Occupation | Male | Female |
| Healthcare Support | 0 (0.0%) | 0 (0.0%) |
| Security & Protection | 0 (0.0%) | 0 (0.0%) |
| Firefighting & Prevention | 0 (0.0%) | 0 (0.0%) |
| Law Enforcement | 0 (0.0%) | 0 (0.0%) |
| Food Preparation & Serving | 154 (57.9%) | 112 (42.1%) |
| Cleaning & Maintenance | 143 (100.0%) | 0 (0.0%) |
| Personal Care & Service | 14 (40.0%) | 21 (60.0%) |
| Total (Category) | 311 (70.1%) | 133 (29.9%) |
| Total (Overall) | 2,206 (57.5%) | 1,632 (42.5%) |
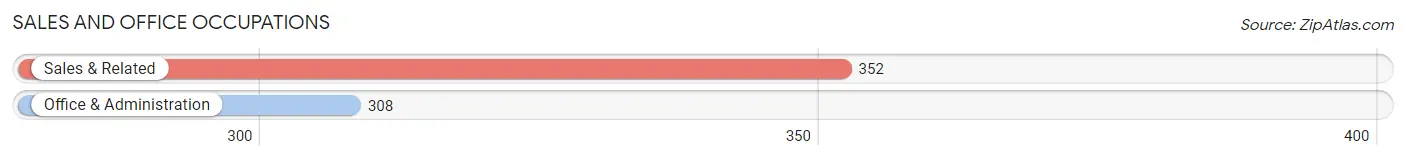
Sales and Office Occupations
The most common Sales and Office occupations in Parkville are Sales & Related (352 | 9.2%), and Office & Administration (308 | 8.0%).
Sales and Office Occupations by Sex
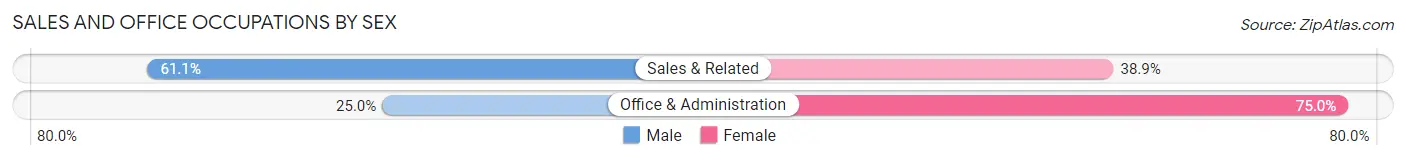
| Occupation | Male | Female |
| Sales & Related | 215 (61.1%) | 137 (38.9%) |
| Office & Administration | 77 (25.0%) | 231 (75.0%) |
| Total (Category) | 292 (44.2%) | 368 (55.8%) |
| Total (Overall) | 2,206 (57.5%) | 1,632 (42.5%) |
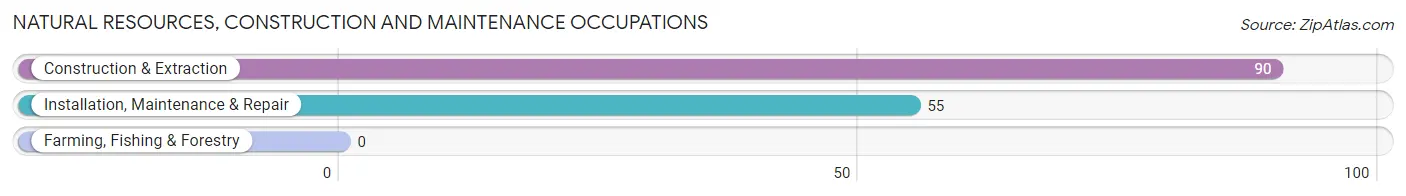
Natural Resources, Construction and Maintenance Occupations
The most common Natural Resources, Construction and Maintenance occupations in Parkville are Construction & Extraction (90 | 2.3%), and Installation, Maintenance & Repair (55 | 1.4%).
Natural Resources, Construction and Maintenance Occupations by Sex
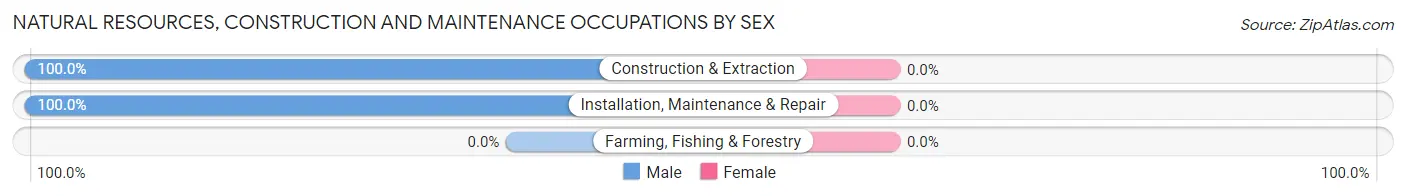
| Occupation | Male | Female |
| Farming, Fishing & Forestry | 0 (0.0%) | 0 (0.0%) |
| Construction & Extraction | 90 (100.0%) | 0 (0.0%) |
| Installation, Maintenance & Repair | 55 (100.0%) | 0 (0.0%) |
| Total (Category) | 145 (100.0%) | 0 (0.0%) |
| Total (Overall) | 2,206 (57.5%) | 1,632 (42.5%) |
Production, Transportation and Moving Occupations
The most common Production, Transportation and Moving occupations in Parkville are Production (88 | 2.3%), Transportation (67 | 1.8%), and Material Moving (53 | 1.4%).
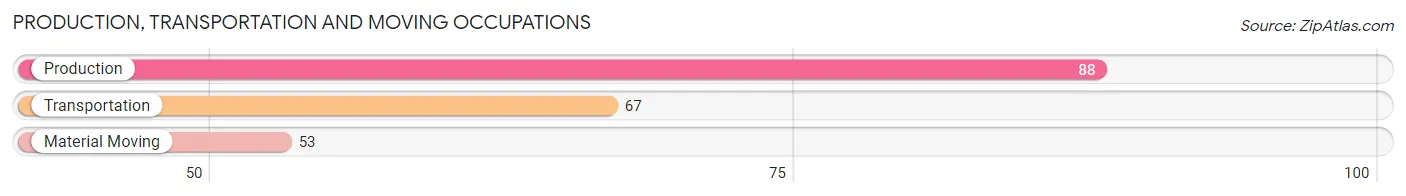
Production, Transportation and Moving Occupations by Sex
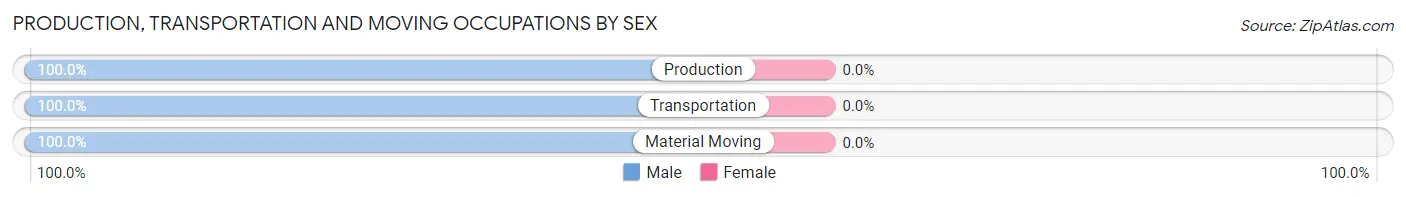
| Occupation | Male | Female |
| Production | 88 (100.0%) | 0 (0.0%) |
| Transportation | 67 (100.0%) | 0 (0.0%) |
| Material Moving | 53 (100.0%) | 0 (0.0%) |
| Total (Category) | 208 (100.0%) | 0 (0.0%) |
| Total (Overall) | 2,206 (57.5%) | 1,632 (42.5%) |
Employment Industries by Sex in Parkville
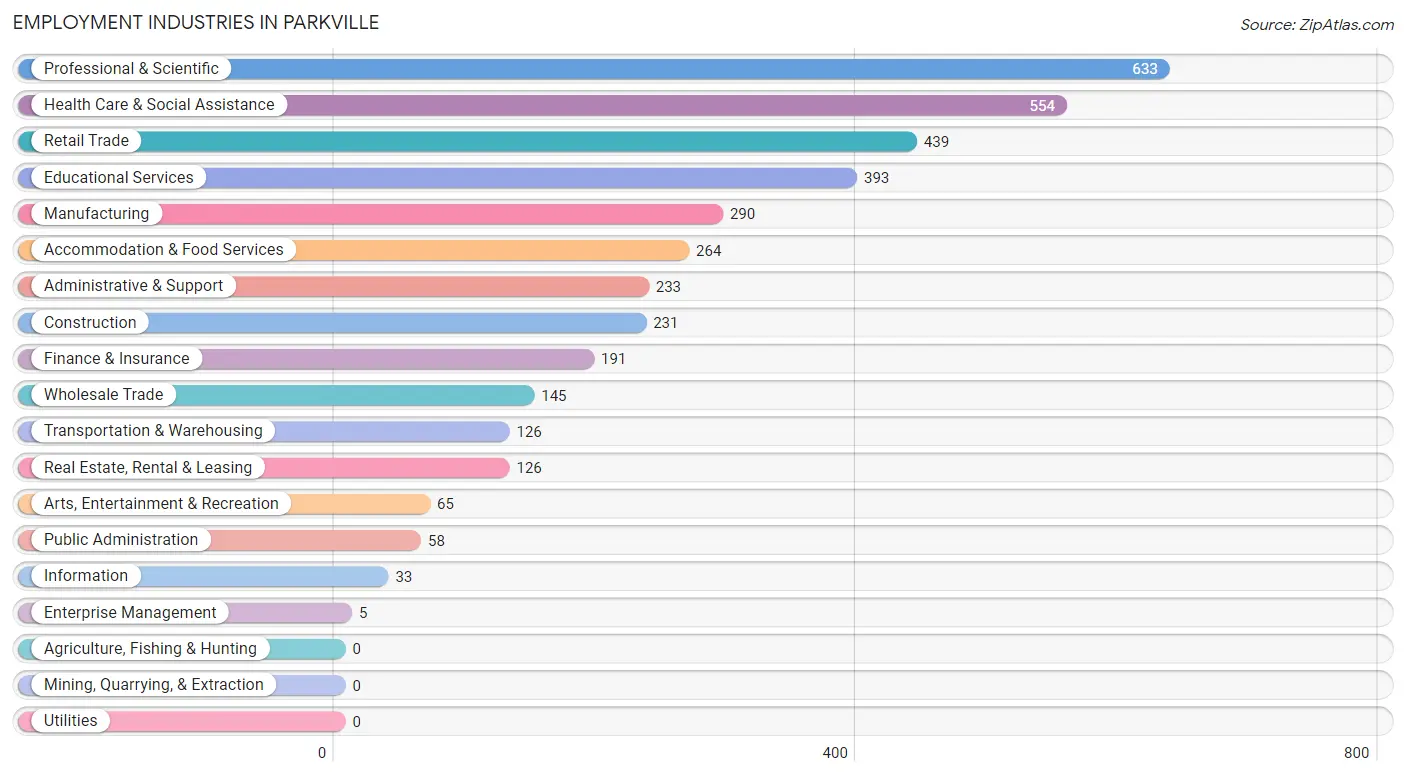
Employment Industries in Parkville
The major employment industries in Parkville include Professional & Scientific (633 | 16.5%), Health Care & Social Assistance (554 | 14.4%), Retail Trade (439 | 11.4%), Educational Services (393 | 10.2%), and Manufacturing (290 | 7.6%).
Employment Industries by Sex in Parkville
The Parkville industries that see more men than women are Arts, Entertainment & Recreation (100.0%), Construction (85.3%), and Transportation & Warehousing (80.2%), whereas the industries that tend to have a higher number of women are Enterprise Management (100.0%), Educational Services (77.9%), and Retail Trade (67.4%).
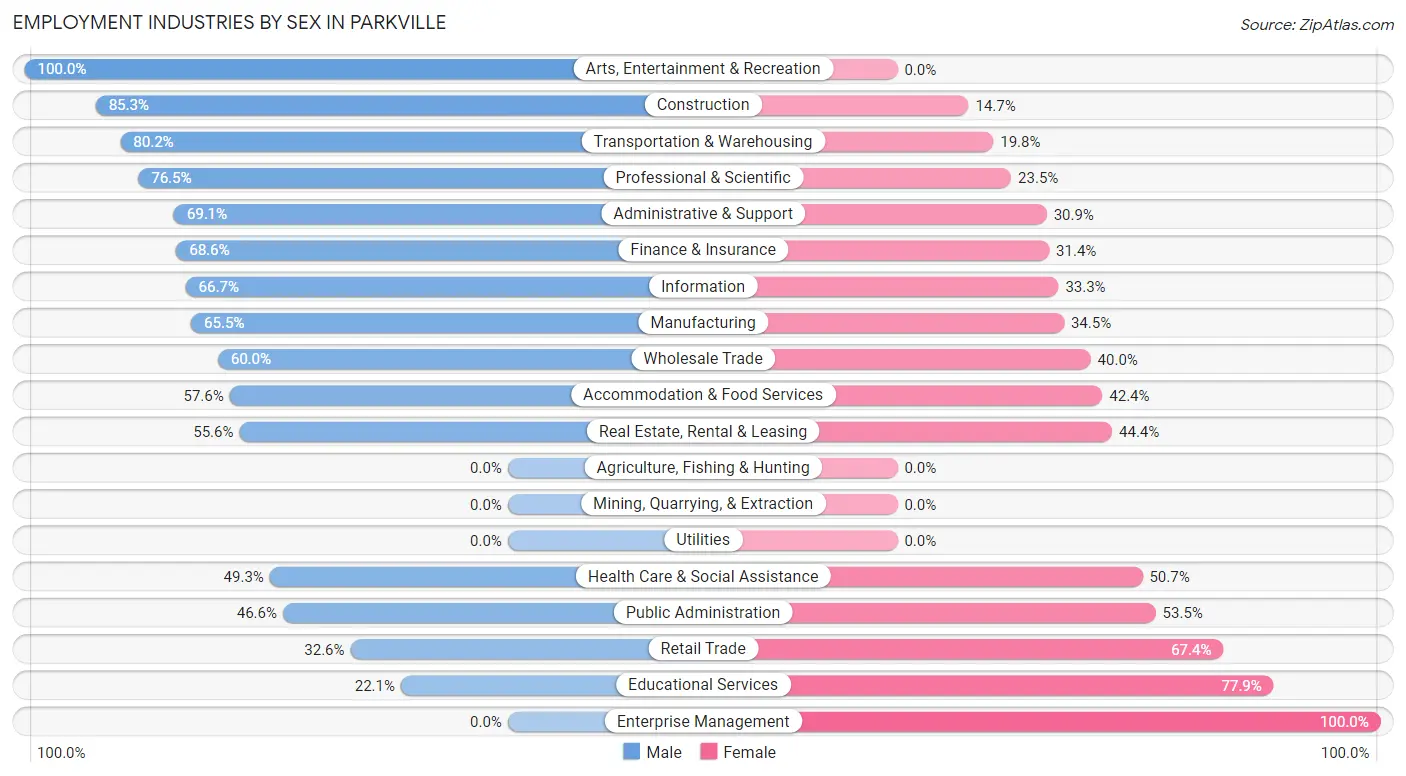
| Industry | Male | Female |
| Agriculture, Fishing & Hunting | 0 (0.0%) | 0 (0.0%) |
| Mining, Quarrying, & Extraction | 0 (0.0%) | 0 (0.0%) |
| Construction | 197 (85.3%) | 34 (14.7%) |
| Manufacturing | 190 (65.5%) | 100 (34.5%) |
| Wholesale Trade | 87 (60.0%) | 58 (40.0%) |
| Retail Trade | 143 (32.6%) | 296 (67.4%) |
| Transportation & Warehousing | 101 (80.2%) | 25 (19.8%) |
| Utilities | 0 (0.0%) | 0 (0.0%) |
| Information | 22 (66.7%) | 11 (33.3%) |
| Finance & Insurance | 131 (68.6%) | 60 (31.4%) |
| Real Estate, Rental & Leasing | 70 (55.6%) | 56 (44.4%) |
| Professional & Scientific | 484 (76.5%) | 149 (23.5%) |
| Enterprise Management | 0 (0.0%) | 5 (100.0%) |
| Administrative & Support | 161 (69.1%) | 72 (30.9%) |
| Educational Services | 87 (22.1%) | 306 (77.9%) |
| Health Care & Social Assistance | 273 (49.3%) | 281 (50.7%) |
| Arts, Entertainment & Recreation | 65 (100.0%) | 0 (0.0%) |
| Accommodation & Food Services | 152 (57.6%) | 112 (42.4%) |
| Public Administration | 27 (46.6%) | 31 (53.4%) |
| Total | 2,206 (57.5%) | 1,632 (42.5%) |
Education in Parkville
School Enrollment in Parkville
The most common levels of schooling among the 2,259 students in Parkville are elementary school (518 | 22.9%), middle school (451 | 20.0%), and high school (402 | 17.8%).
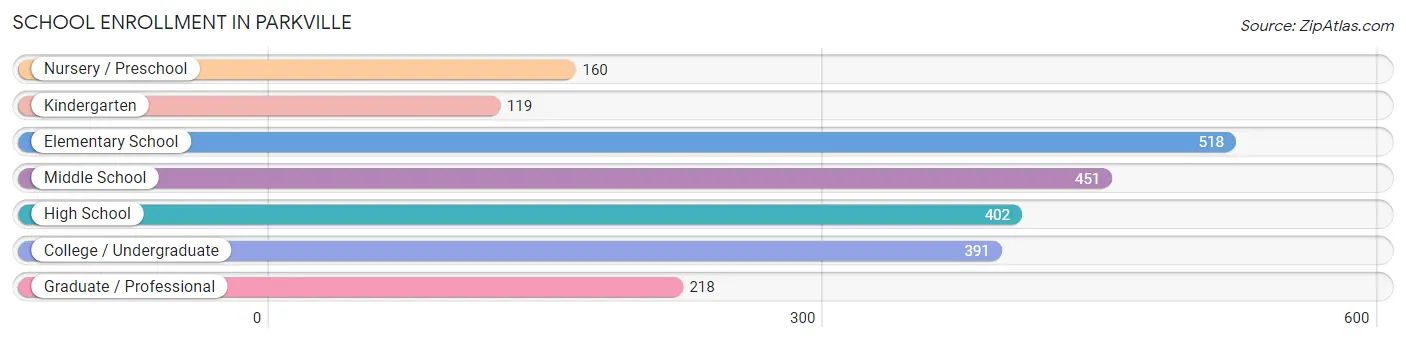
| School Level | # Students | % Students |
| Nursery / Preschool | 160 | 7.1% |
| Kindergarten | 119 | 5.3% |
| Elementary School | 518 | 22.9% |
| Middle School | 451 | 20.0% |
| High School | 402 | 17.8% |
| College / Undergraduate | 391 | 17.3% |
| Graduate / Professional | 218 | 9.7% |
| Total | 2,259 | 100.0% |
School Enrollment by Age by Funding Source in Parkville
Out of a total of 2,259 students who are enrolled in schools in Parkville, 389 (17.2%) attend a private institution, while the remaining 1,870 (82.8%) are enrolled in public schools. The age group of 25 to 34 year olds has the highest likelihood of being enrolled in private schools, with 36 (100.0% in the age bracket) enrolled. Conversely, the age group of 15 to 17 year olds has the lowest likelihood of being enrolled in a private school, with 333 (100.0% in the age bracket) attending a public institution.
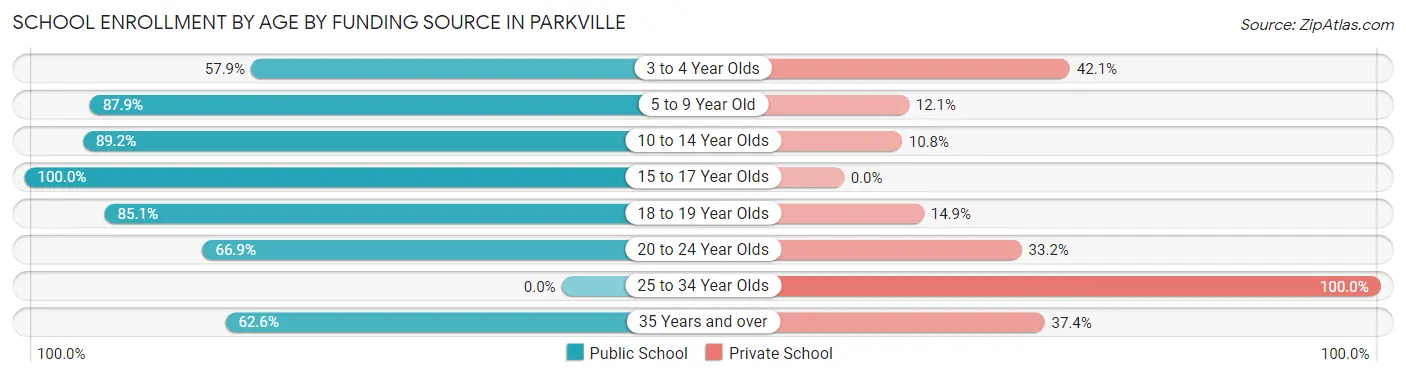
| Age Bracket | Public School | Private School |
| 3 to 4 Year Olds | 81 (57.9%) | 59 (42.1%) |
| 5 to 9 Year Old | 471 (87.9%) | 65 (12.1%) |
| 10 to 14 Year Olds | 510 (89.2%) | 62 (10.8%) |
| 15 to 17 Year Olds | 333 (100.0%) | 0 (0.0%) |
| 18 to 19 Year Olds | 251 (85.1%) | 44 (14.9%) |
| 20 to 24 Year Olds | 123 (66.8%) | 61 (33.2%) |
| 25 to 34 Year Olds | 0 (0.0%) | 36 (100.0%) |
| 35 Years and over | 102 (62.6%) | 61 (37.4%) |
| Total | 1,870 (82.8%) | 389 (17.2%) |
Educational Attainment by Field of Study in Parkville
Business (1,157 | 31.6%), science & technology (452 | 12.4%), social sciences (359 | 9.8%), education (268 | 7.3%), and engineering (248 | 6.8%) are the most common fields of study among 3,658 individuals in Parkville who have obtained a bachelor's degree or higher.
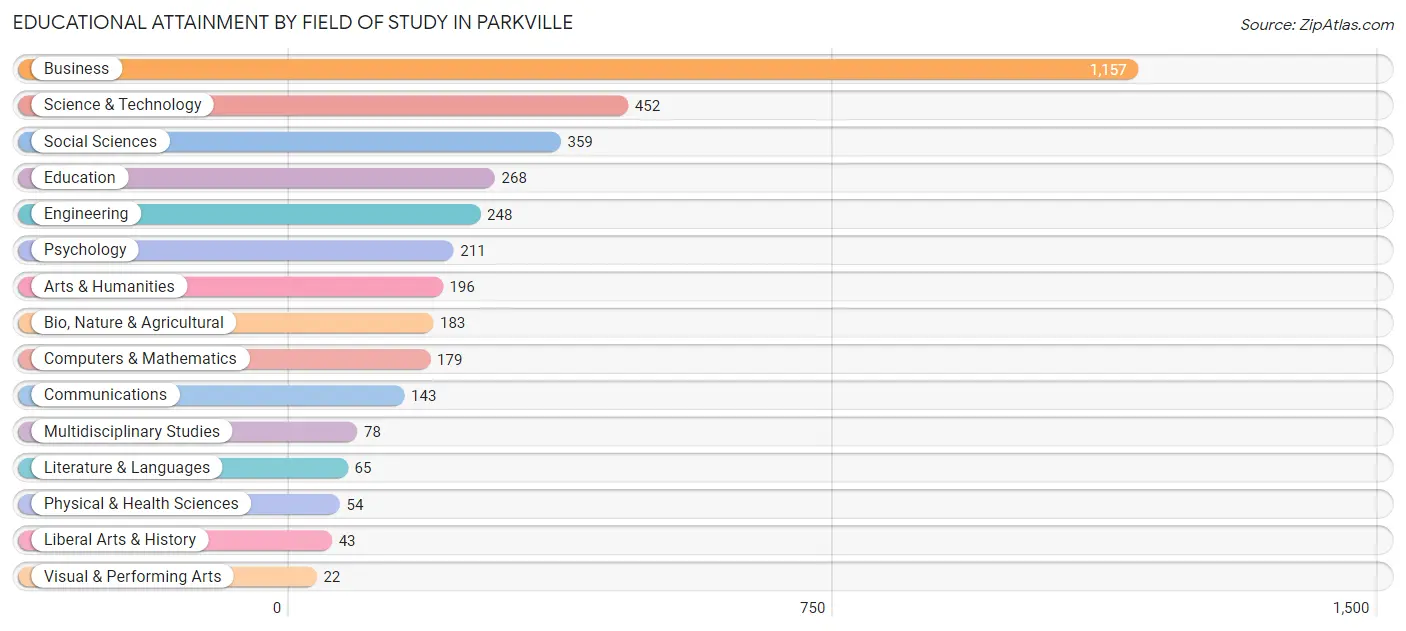
| Field of Study | # Graduates | % Graduates |
| Computers & Mathematics | 179 | 4.9% |
| Bio, Nature & Agricultural | 183 | 5.0% |
| Physical & Health Sciences | 54 | 1.5% |
| Psychology | 211 | 5.8% |
| Social Sciences | 359 | 9.8% |
| Engineering | 248 | 6.8% |
| Multidisciplinary Studies | 78 | 2.1% |
| Science & Technology | 452 | 12.4% |
| Business | 1,157 | 31.6% |
| Education | 268 | 7.3% |
| Literature & Languages | 65 | 1.8% |
| Liberal Arts & History | 43 | 1.2% |
| Visual & Performing Arts | 22 | 0.6% |
| Communications | 143 | 3.9% |
| Arts & Humanities | 196 | 5.4% |
| Total | 3,658 | 100.0% |
Transportation & Commute in Parkville
Vehicle Availability by Sex in Parkville
The most prevalent vehicle ownership categories in Parkville are males with 2 vehicles (1,066, accounting for 50.1%) and females with 2 vehicles (755, making up 67.0%).
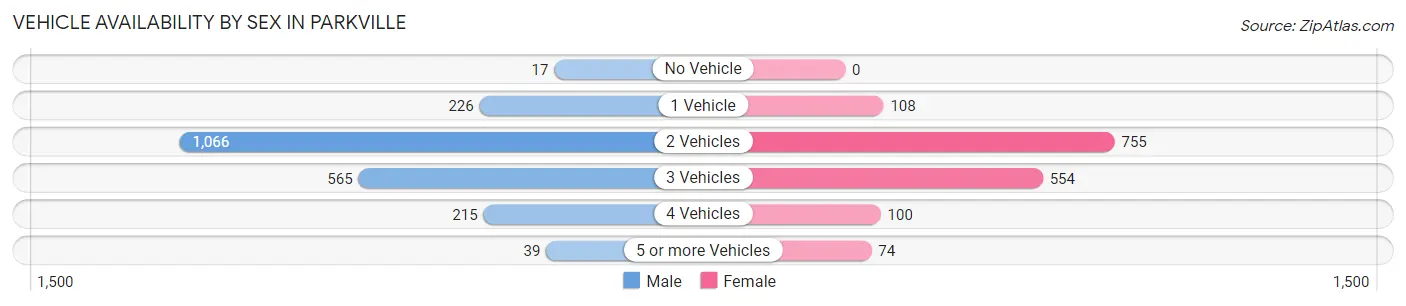
| Vehicles Available | Male | Female |
| No Vehicle | 17 (0.8%) | 0 (0.0%) |
| 1 Vehicle | 226 (10.6%) | 108 (6.8%) |
| 2 Vehicles | 1,066 (50.1%) | 755 (47.4%) |
| 3 Vehicles | 565 (26.6%) | 554 (34.8%) |
| 4 Vehicles | 215 (10.1%) | 100 (6.3%) |
| 5 or more Vehicles | 39 (1.8%) | 74 (4.6%) |
| Total | 2,128 (100.0%) | 1,591 (100.0%) |
Commute Time in Parkville
The most frequently occuring commute durations in Parkville are 20 to 24 minutes (726 commuters, 22.4%), 15 to 19 minutes (677 commuters, 20.9%), and 30 to 34 minutes (477 commuters, 14.7%).
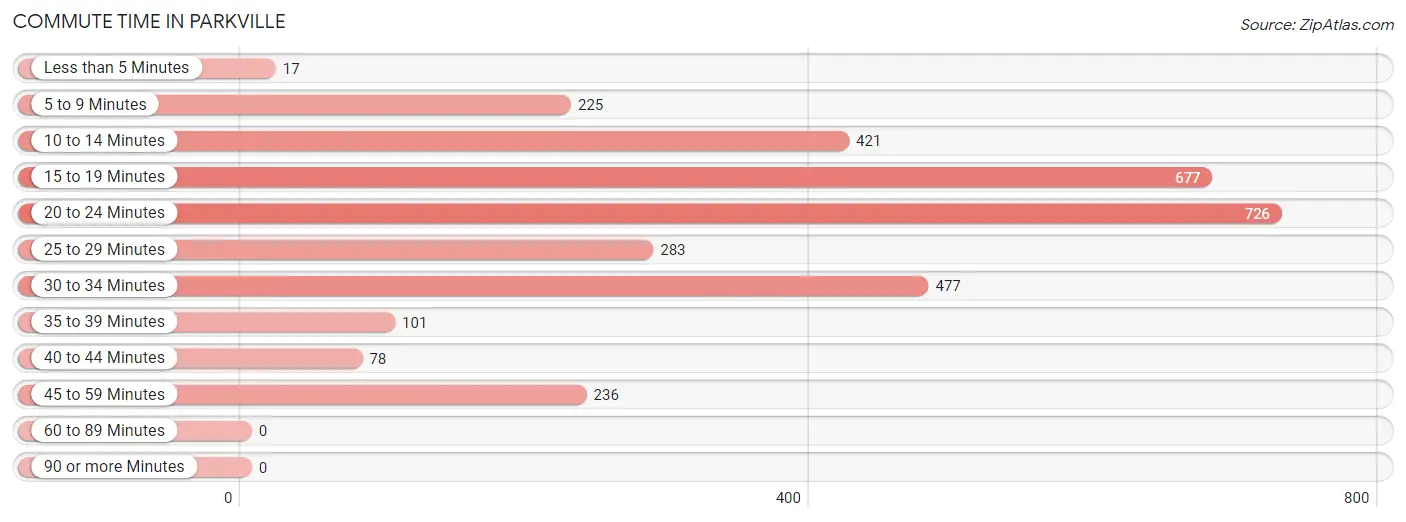
| Commute Time | # Commuters | % Commuters |
| Less than 5 Minutes | 17 | 0.5% |
| 5 to 9 Minutes | 225 | 6.9% |
| 10 to 14 Minutes | 421 | 13.0% |
| 15 to 19 Minutes | 677 | 20.9% |
| 20 to 24 Minutes | 726 | 22.4% |
| 25 to 29 Minutes | 283 | 8.7% |
| 30 to 34 Minutes | 477 | 14.7% |
| 35 to 39 Minutes | 101 | 3.1% |
| 40 to 44 Minutes | 78 | 2.4% |
| 45 to 59 Minutes | 236 | 7.3% |
| 60 to 89 Minutes | 0 | 0.0% |
| 90 or more Minutes | 0 | 0.0% |
Commute Time by Sex in Parkville
The most common commute times in Parkville are 20 to 24 minutes (523 commuters, 27.4%) for males and 15 to 19 minutes (318 commuters, 23.9%) for females.
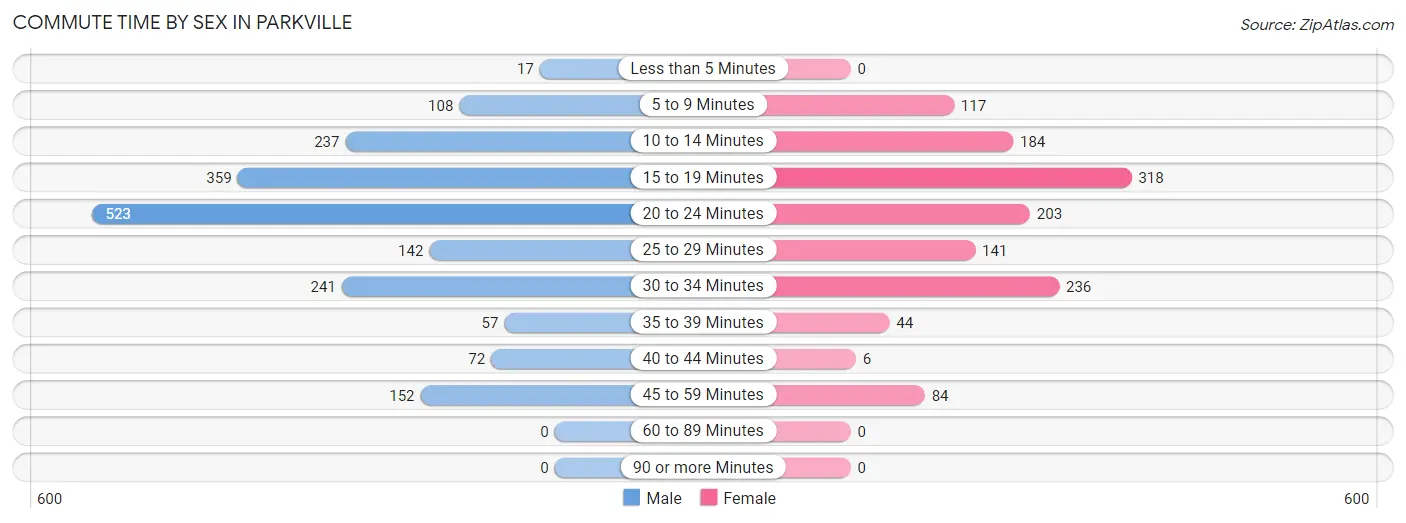
| Commute Time | Male | Female |
| Less than 5 Minutes | 17 (0.9%) | 0 (0.0%) |
| 5 to 9 Minutes | 108 (5.7%) | 117 (8.8%) |
| 10 to 14 Minutes | 237 (12.4%) | 184 (13.8%) |
| 15 to 19 Minutes | 359 (18.8%) | 318 (23.9%) |
| 20 to 24 Minutes | 523 (27.4%) | 203 (15.2%) |
| 25 to 29 Minutes | 142 (7.4%) | 141 (10.6%) |
| 30 to 34 Minutes | 241 (12.6%) | 236 (17.7%) |
| 35 to 39 Minutes | 57 (3.0%) | 44 (3.3%) |
| 40 to 44 Minutes | 72 (3.8%) | 6 (0.4%) |
| 45 to 59 Minutes | 152 (8.0%) | 84 (6.3%) |
| 60 to 89 Minutes | 0 (0.0%) | 0 (0.0%) |
| 90 or more Minutes | 0 (0.0%) | 0 (0.0%) |
Time of Departure to Work by Sex in Parkville
The most frequent times of departure to work in Parkville are 7:30 AM to 7:59 AM (328, 17.2%) for males and 8:00 AM to 8:29 AM (269, 20.2%) for females.
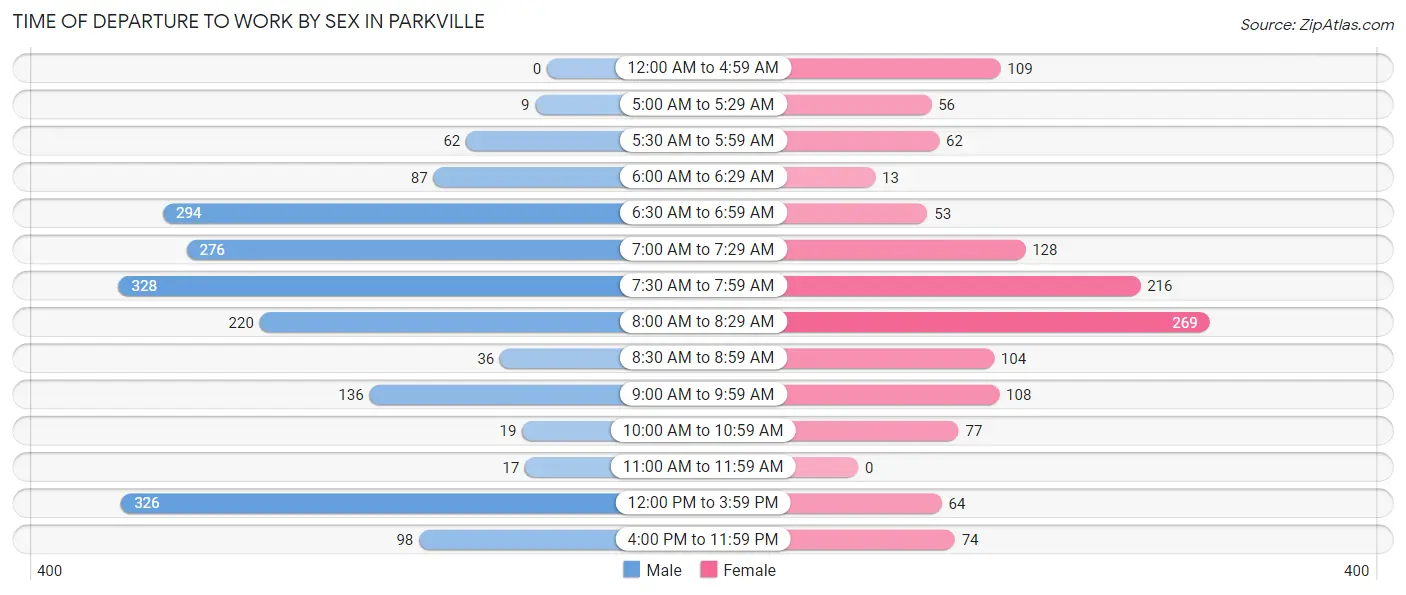
| Time of Departure | Male | Female |
| 12:00 AM to 4:59 AM | 0 (0.0%) | 109 (8.2%) |
| 5:00 AM to 5:29 AM | 9 (0.5%) | 56 (4.2%) |
| 5:30 AM to 5:59 AM | 62 (3.3%) | 62 (4.6%) |
| 6:00 AM to 6:29 AM | 87 (4.6%) | 13 (1.0%) |
| 6:30 AM to 6:59 AM | 294 (15.4%) | 53 (4.0%) |
| 7:00 AM to 7:29 AM | 276 (14.5%) | 128 (9.6%) |
| 7:30 AM to 7:59 AM | 328 (17.2%) | 216 (16.2%) |
| 8:00 AM to 8:29 AM | 220 (11.5%) | 269 (20.2%) |
| 8:30 AM to 8:59 AM | 36 (1.9%) | 104 (7.8%) |
| 9:00 AM to 9:59 AM | 136 (7.1%) | 108 (8.1%) |
| 10:00 AM to 10:59 AM | 19 (1.0%) | 77 (5.8%) |
| 11:00 AM to 11:59 AM | 17 (0.9%) | 0 (0.0%) |
| 12:00 PM to 3:59 PM | 326 (17.1%) | 64 (4.8%) |
| 4:00 PM to 11:59 PM | 98 (5.1%) | 74 (5.6%) |
| Total | 1,908 (100.0%) | 1,333 (100.0%) |
Housing Occupancy in Parkville
Occupancy by Ownership in Parkville
Of the total 2,680 dwellings in Parkville, owner-occupied units account for 2,229 (83.2%), while renter-occupied units make up 451 (16.8%).
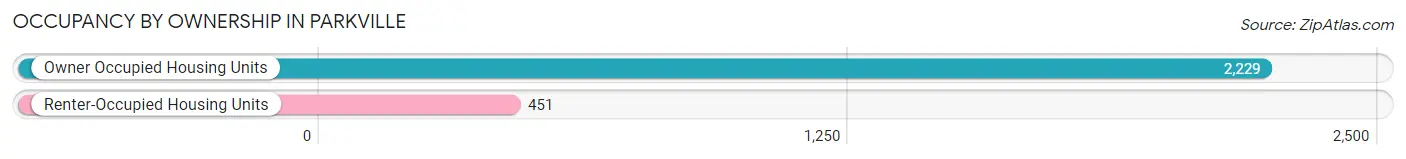
| Occupancy | # Housing Units | % Housing Units |
| Owner Occupied Housing Units | 2,229 | 83.2% |
| Renter-Occupied Housing Units | 451 | 16.8% |
| Total Occupied Housing Units | 2,680 | 100.0% |
Occupancy by Household Size in Parkville
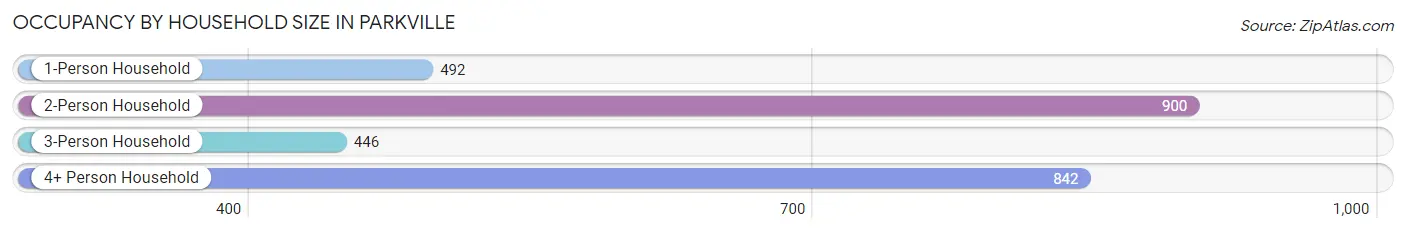
| Household Size | # Housing Units | % Housing Units |
| 1-Person Household | 492 | 18.4% |
| 2-Person Household | 900 | 33.6% |
| 3-Person Household | 446 | 16.6% |
| 4+ Person Household | 842 | 31.4% |
| Total Housing Units | 2,680 | 100.0% |
Occupancy by Ownership by Household Size in Parkville
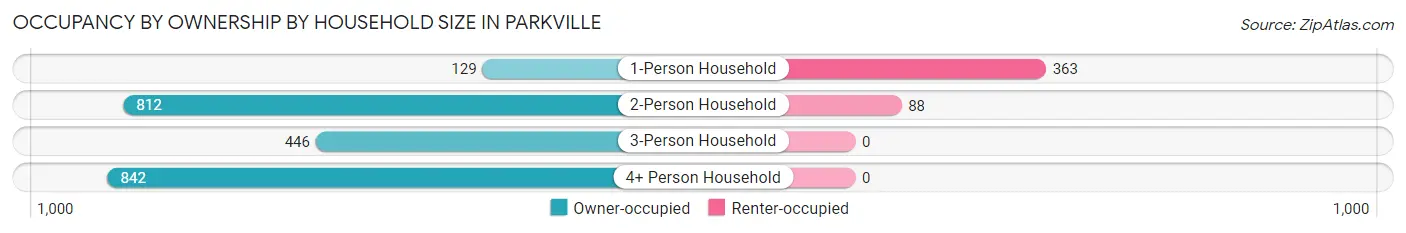
| Household Size | Owner-occupied | Renter-occupied |
| 1-Person Household | 129 (26.2%) | 363 (73.8%) |
| 2-Person Household | 812 (90.2%) | 88 (9.8%) |
| 3-Person Household | 446 (100.0%) | 0 (0.0%) |
| 4+ Person Household | 842 (100.0%) | 0 (0.0%) |
| Total Housing Units | 2,229 (83.2%) | 451 (16.8%) |
Occupancy by Educational Attainment in Parkville
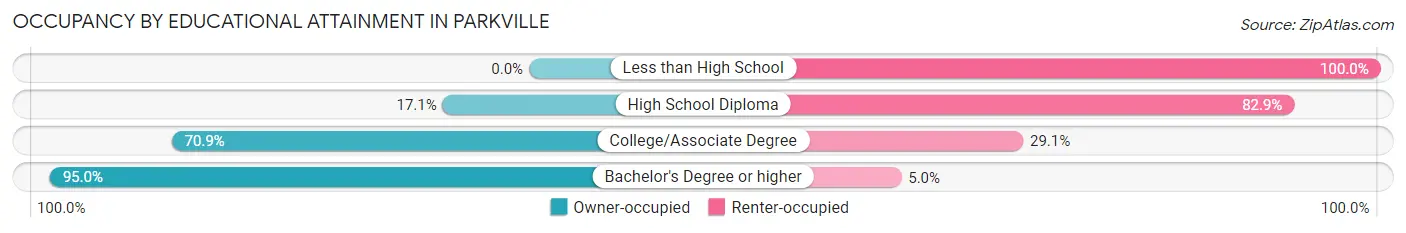
| Household Size | Owner-occupied | Renter-occupied |
| Less than High School | 0 (0.0%) | 22 (100.0%) |
| High School Diploma | 43 (17.1%) | 208 (82.9%) |
| College/Associate Degree | 297 (70.9%) | 122 (29.1%) |
| Bachelor's Degree or higher | 1,889 (95.0%) | 99 (5.0%) |
Occupancy by Age of Householder in Parkville
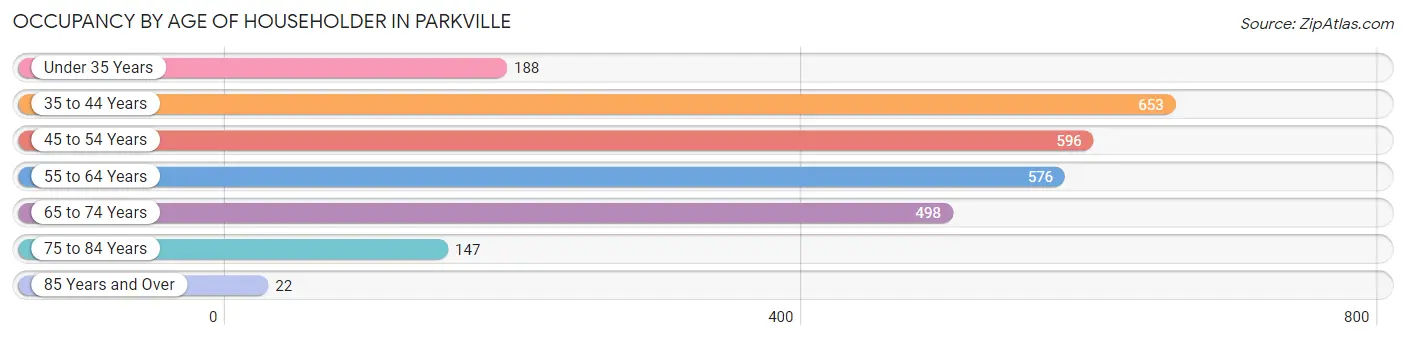
| Age Bracket | # Households | % Households |
| Under 35 Years | 188 | 7.0% |
| 35 to 44 Years | 653 | 24.4% |
| 45 to 54 Years | 596 | 22.2% |
| 55 to 64 Years | 576 | 21.5% |
| 65 to 74 Years | 498 | 18.6% |
| 75 to 84 Years | 147 | 5.5% |
| 85 Years and Over | 22 | 0.8% |
| Total | 2,680 | 100.0% |
Housing Finances in Parkville
Median Income by Occupancy in Parkville
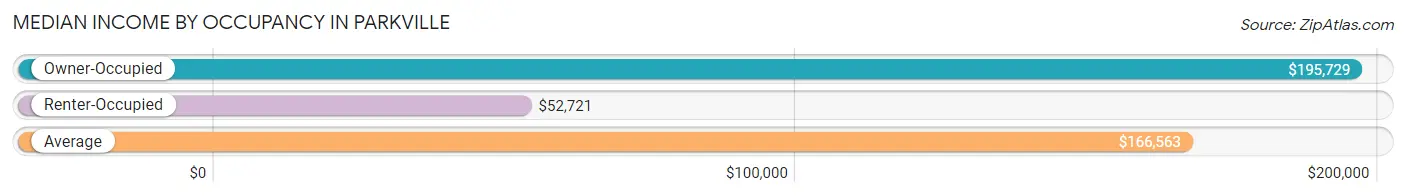
| Occupancy Type | # Households | Median Income |
| Owner-Occupied | 2,229 (83.2%) | $195,729 |
| Renter-Occupied | 451 (16.8%) | $52,721 |
| Average | 2,680 (100.0%) | $166,563 |
Occupancy by Householder Income Bracket in Parkville
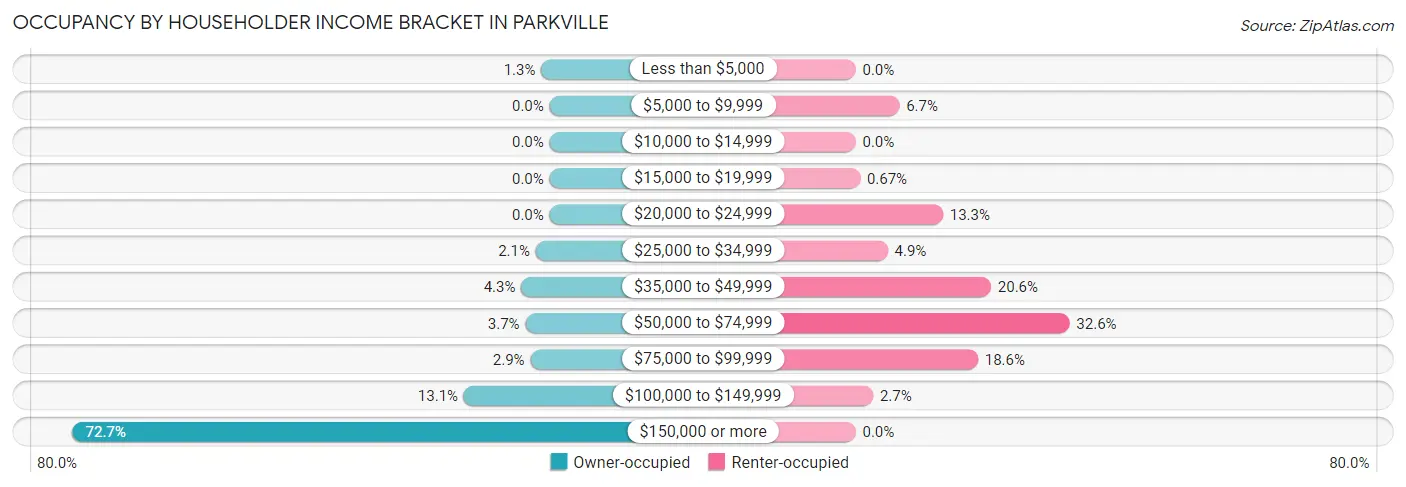
| Income Bracket | Owner-occupied | Renter-occupied |
| Less than $5,000 | 28 (1.3%) | 0 (0.0%) |
| $5,000 to $9,999 | 0 (0.0%) | 30 (6.7%) |
| $10,000 to $14,999 | 0 (0.0%) | 0 (0.0%) |
| $15,000 to $19,999 | 0 (0.0%) | 3 (0.7%) |
| $20,000 to $24,999 | 0 (0.0%) | 60 (13.3%) |
| $25,000 to $34,999 | 47 (2.1%) | 22 (4.9%) |
| $35,000 to $49,999 | 96 (4.3%) | 93 (20.6%) |
| $50,000 to $74,999 | 82 (3.7%) | 147 (32.6%) |
| $75,000 to $99,999 | 65 (2.9%) | 84 (18.6%) |
| $100,000 to $149,999 | 291 (13.1%) | 12 (2.7%) |
| $150,000 or more | 1,620 (72.7%) | 0 (0.0%) |
| Total | 2,229 (100.0%) | 451 (100.0%) |
Monthly Housing Cost Tiers in Parkville
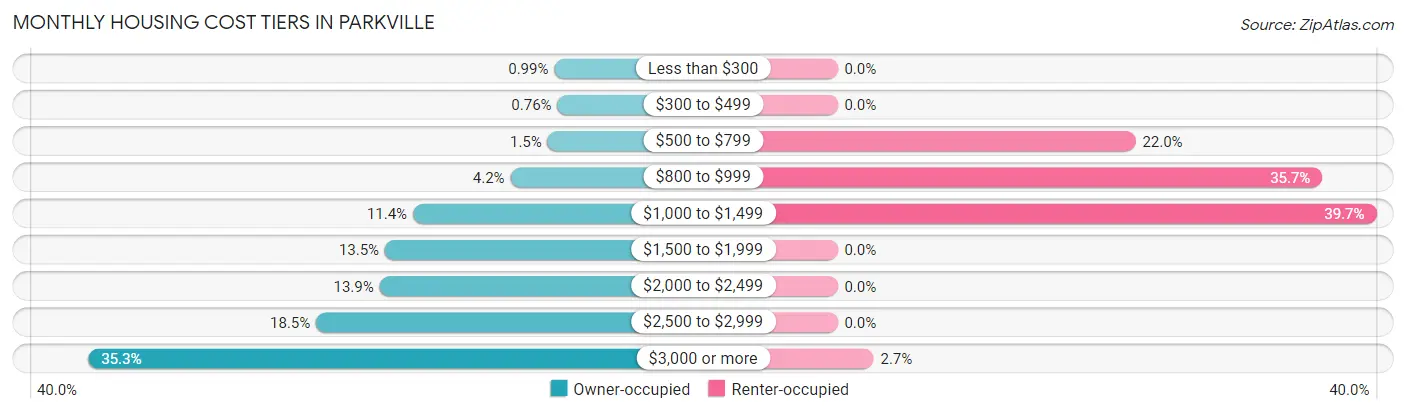
| Monthly Cost | Owner-occupied | Renter-occupied |
| Less than $300 | 22 (1.0%) | 0 (0.0%) |
| $300 to $499 | 17 (0.8%) | 0 (0.0%) |
| $500 to $799 | 33 (1.5%) | 99 (22.0%) |
| $800 to $999 | 94 (4.2%) | 161 (35.7%) |
| $1,000 to $1,499 | 254 (11.4%) | 179 (39.7%) |
| $1,500 to $1,999 | 300 (13.5%) | 0 (0.0%) |
| $2,000 to $2,499 | 309 (13.9%) | 0 (0.0%) |
| $2,500 to $2,999 | 413 (18.5%) | 0 (0.0%) |
| $3,000 or more | 787 (35.3%) | 12 (2.7%) |
| Total | 2,229 (100.0%) | 451 (100.0%) |
Physical Housing Characteristics in Parkville
Housing Structures in Parkville
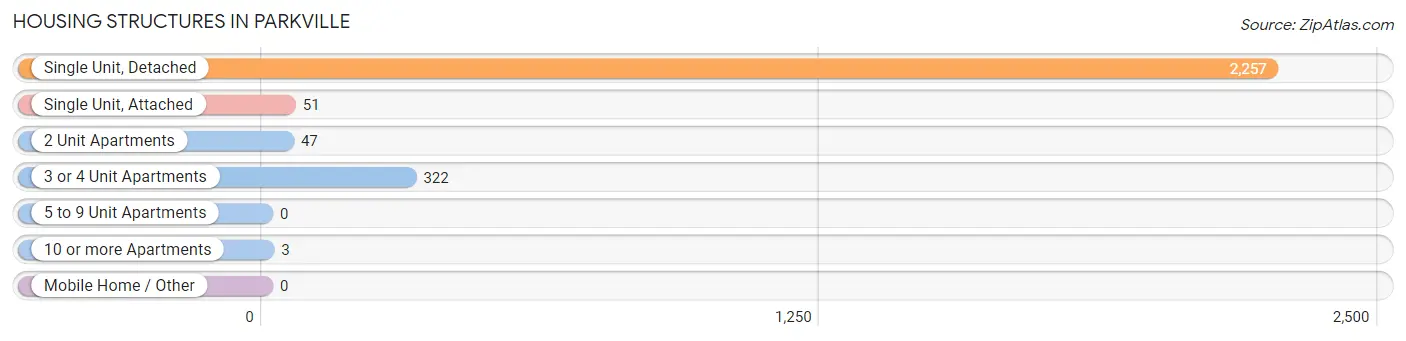
| Structure Type | # Housing Units | % Housing Units |
| Single Unit, Detached | 2,257 | 84.2% |
| Single Unit, Attached | 51 | 1.9% |
| 2 Unit Apartments | 47 | 1.8% |
| 3 or 4 Unit Apartments | 322 | 12.0% |
| 5 to 9 Unit Apartments | 0 | 0.0% |
| 10 or more Apartments | 3 | 0.1% |
| Mobile Home / Other | 0 | 0.0% |
| Total | 2,680 | 100.0% |
Housing Structures by Occupancy in Parkville
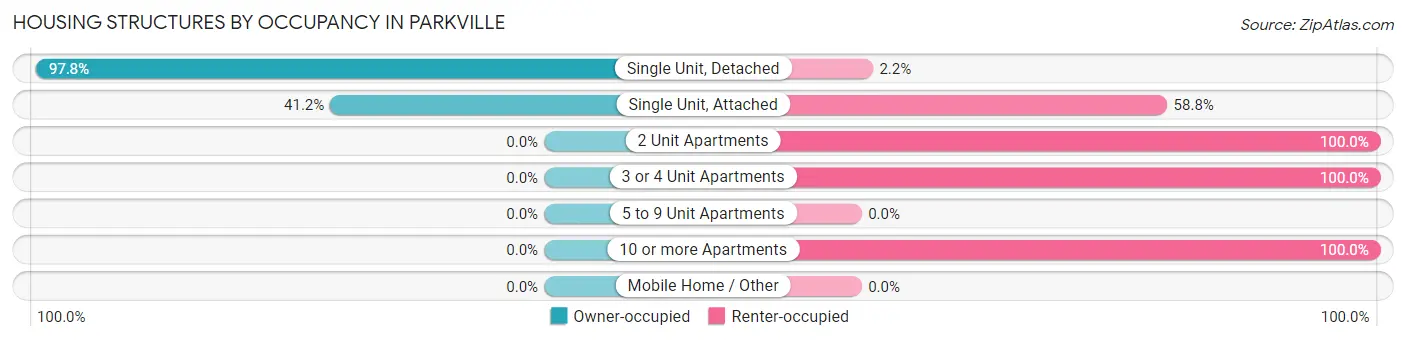
| Structure Type | Owner-occupied | Renter-occupied |
| Single Unit, Detached | 2,208 (97.8%) | 49 (2.2%) |
| Single Unit, Attached | 21 (41.2%) | 30 (58.8%) |
| 2 Unit Apartments | 0 (0.0%) | 47 (100.0%) |
| 3 or 4 Unit Apartments | 0 (0.0%) | 322 (100.0%) |
| 5 to 9 Unit Apartments | 0 (0.0%) | 0 (0.0%) |
| 10 or more Apartments | 0 (0.0%) | 3 (100.0%) |
| Mobile Home / Other | 0 (0.0%) | 0 (0.0%) |
| Total | 2,229 (83.2%) | 451 (16.8%) |
Housing Structures by Number of Rooms in Parkville
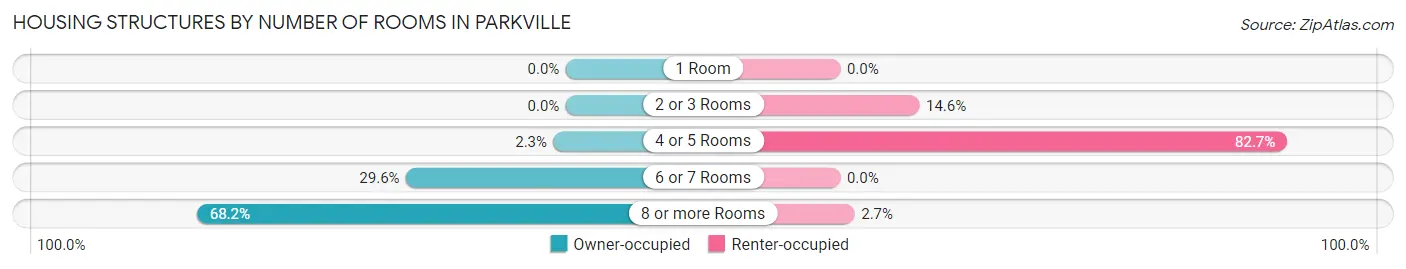
| Number of Rooms | Owner-occupied | Renter-occupied |
| 1 Room | 0 (0.0%) | 0 (0.0%) |
| 2 or 3 Rooms | 0 (0.0%) | 66 (14.6%) |
| 4 or 5 Rooms | 51 (2.3%) | 373 (82.7%) |
| 6 or 7 Rooms | 659 (29.6%) | 0 (0.0%) |
| 8 or more Rooms | 1,519 (68.1%) | 12 (2.7%) |
| Total | 2,229 (100.0%) | 451 (100.0%) |
Housing Structure by Heating Type in Parkville
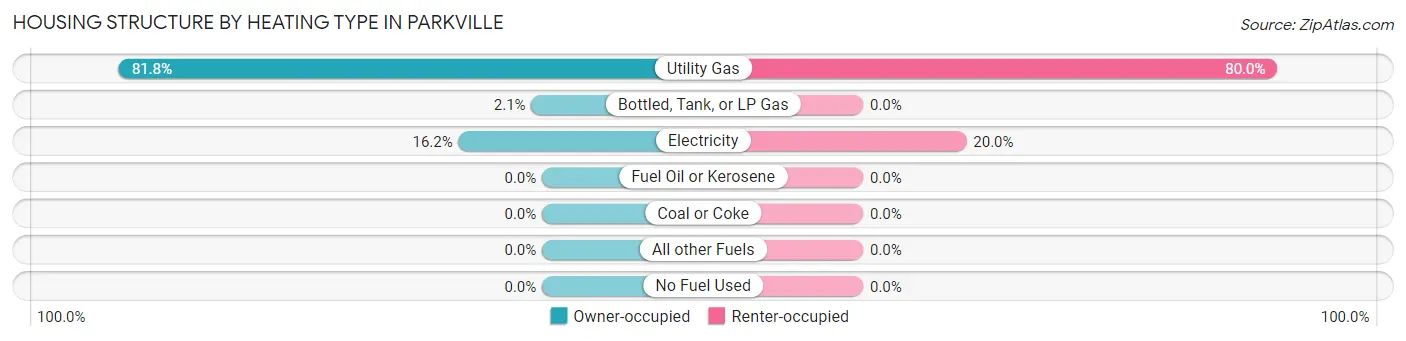
| Heating Type | Owner-occupied | Renter-occupied |
| Utility Gas | 1,823 (81.8%) | 361 (80.0%) |
| Bottled, Tank, or LP Gas | 46 (2.1%) | 0 (0.0%) |
| Electricity | 360 (16.2%) | 90 (20.0%) |
| Fuel Oil or Kerosene | 0 (0.0%) | 0 (0.0%) |
| Coal or Coke | 0 (0.0%) | 0 (0.0%) |
| All other Fuels | 0 (0.0%) | 0 (0.0%) |
| No Fuel Used | 0 (0.0%) | 0 (0.0%) |
| Total | 2,229 (100.0%) | 451 (100.0%) |
Household Vehicle Usage in Parkville
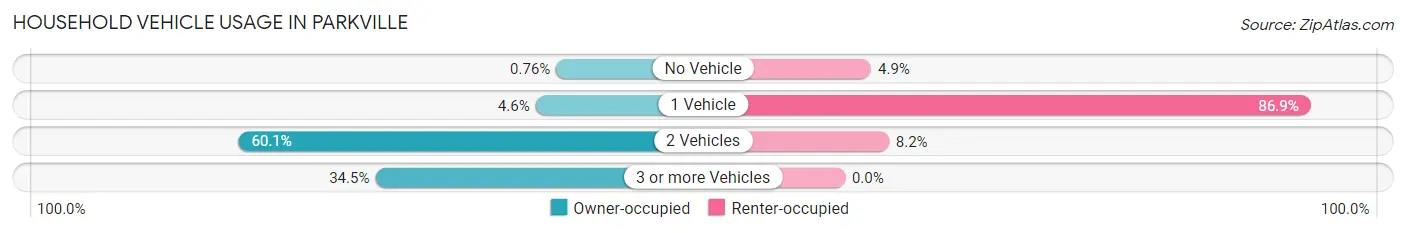
| Vehicles per Household | Owner-occupied | Renter-occupied |
| No Vehicle | 17 (0.8%) | 22 (4.9%) |
| 1 Vehicle | 103 (4.6%) | 392 (86.9%) |
| 2 Vehicles | 1,339 (60.1%) | 37 (8.2%) |
| 3 or more Vehicles | 770 (34.5%) | 0 (0.0%) |
| Total | 2,229 (100.0%) | 451 (100.0%) |
Real Estate & Mortgages in Parkville
Real Estate and Mortgage Overview in Parkville
| Characteristic | Without Mortgage | With Mortgage |
| Housing Units | 468 | 1,761 |
| Median Property Value | $551,700 | $557,800 |
| Median Household Income | $159,038 | $1,342 |
| Monthly Housing Costs | $1,190 | $787 |
| Real Estate Taxes | $6,552 | $12 |
Property Value by Mortgage Status in Parkville
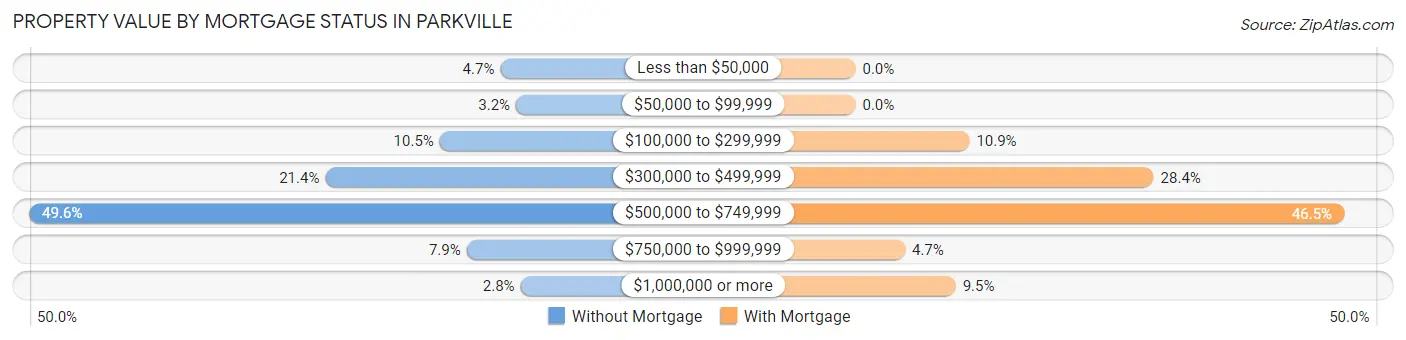
| Property Value | Without Mortgage | With Mortgage |
| Less than $50,000 | 22 (4.7%) | 0 (0.0%) |
| $50,000 to $99,999 | 15 (3.2%) | 0 (0.0%) |
| $100,000 to $299,999 | 49 (10.5%) | 191 (10.8%) |
| $300,000 to $499,999 | 100 (21.4%) | 500 (28.4%) |
| $500,000 to $749,999 | 232 (49.6%) | 819 (46.5%) |
| $750,000 to $999,999 | 37 (7.9%) | 83 (4.7%) |
| $1,000,000 or more | 13 (2.8%) | 168 (9.5%) |
| Total | 468 (100.0%) | 1,761 (100.0%) |
Household Income by Mortgage Status in Parkville
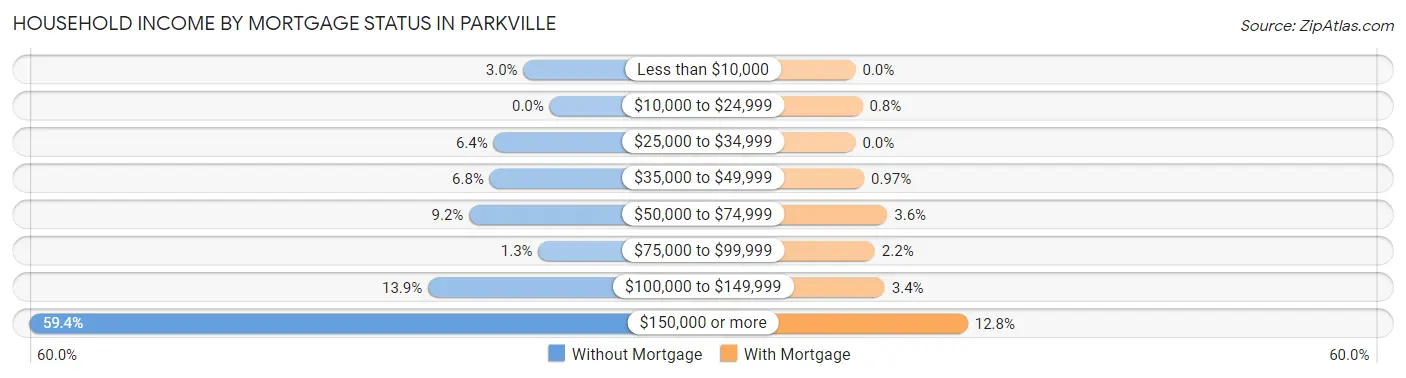
| Household Income | Without Mortgage | With Mortgage |
| Less than $10,000 | 14 (3.0%) | 0 (0.0%) |
| $10,000 to $24,999 | 0 (0.0%) | 14 (0.8%) |
| $25,000 to $34,999 | 30 (6.4%) | 0 (0.0%) |
| $35,000 to $49,999 | 32 (6.8%) | 17 (1.0%) |
| $50,000 to $74,999 | 43 (9.2%) | 64 (3.6%) |
| $75,000 to $99,999 | 6 (1.3%) | 39 (2.2%) |
| $100,000 to $149,999 | 65 (13.9%) | 59 (3.4%) |
| $150,000 or more | 278 (59.4%) | 226 (12.8%) |
| Total | 468 (100.0%) | 1,761 (100.0%) |
Property Value to Household Income Ratio in Parkville
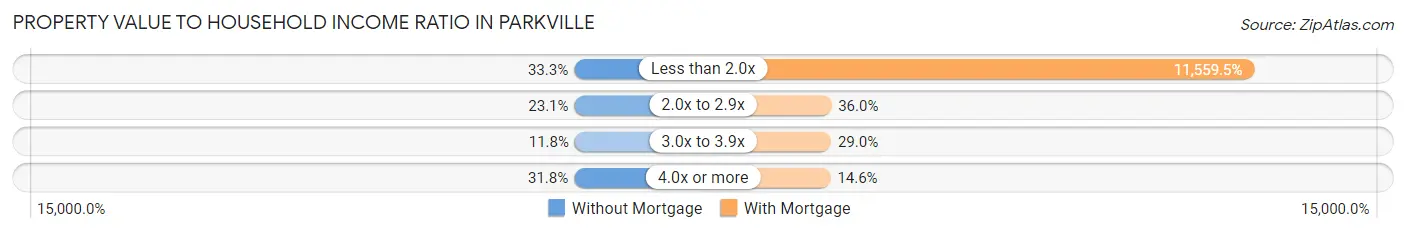
| Value-to-Income Ratio | Without Mortgage | With Mortgage |
| Less than 2.0x | 156 (33.3%) | 203,563 (11,559.5%) |
| 2.0x to 2.9x | 108 (23.1%) | 634 (36.0%) |
| 3.0x to 3.9x | 55 (11.7%) | 510 (29.0%) |
| 4.0x or more | 149 (31.8%) | 257 (14.6%) |
| Total | 468 (100.0%) | 1,761 (100.0%) |
Real Estate Taxes by Mortgage Status in Parkville
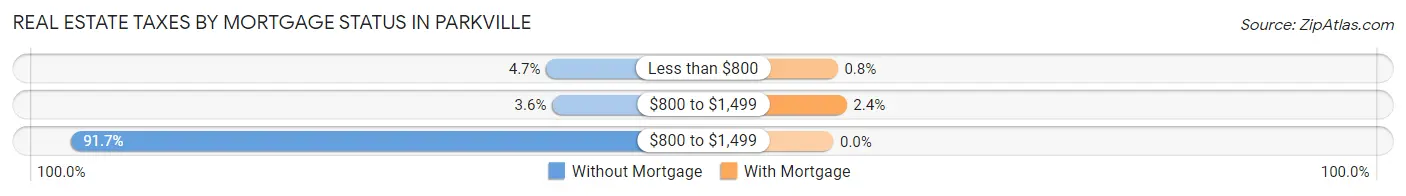
| Property Taxes | Without Mortgage | With Mortgage |
| Less than $800 | 22 (4.7%) | 14 (0.8%) |
| $800 to $1,499 | 17 (3.6%) | 43 (2.4%) |
| $800 to $1,499 | 429 (91.7%) | 0 (0.0%) |
| Total | 468 (100.0%) | 1,761 (100.0%) |
Health & Disability in Parkville
Health Insurance Coverage by Age in Parkville
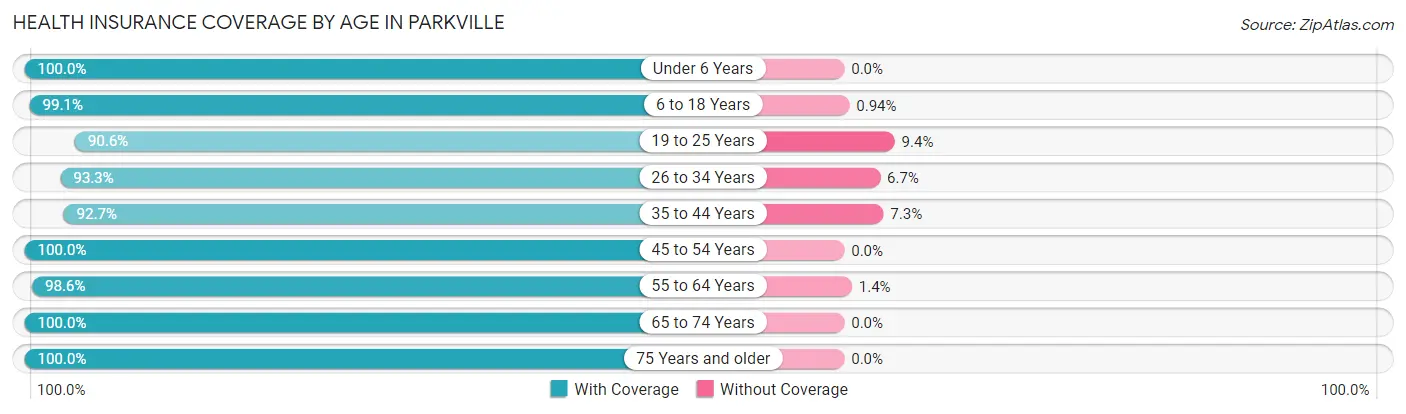
| Age Bracket | With Coverage | Without Coverage |
| Under 6 Years | 507 (100.0%) | 0 (0.0%) |
| 6 to 18 Years | 1,688 (99.1%) | 16 (0.9%) |
| 19 to 25 Years | 463 (90.6%) | 48 (9.4%) |
| 26 to 34 Years | 322 (93.3%) | 23 (6.7%) |
| 35 to 44 Years | 1,233 (92.7%) | 97 (7.3%) |
| 45 to 54 Years | 1,132 (100.0%) | 0 (0.0%) |
| 55 to 64 Years | 976 (98.6%) | 14 (1.4%) |
| 65 to 74 Years | 807 (100.0%) | 0 (0.0%) |
| 75 Years and older | 260 (100.0%) | 0 (0.0%) |
| Total | 7,388 (97.4%) | 198 (2.6%) |
Health Insurance Coverage by Citizenship Status in Parkville
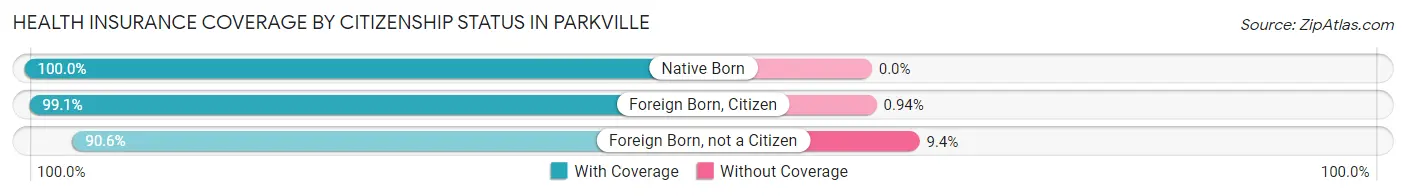
| Citizenship Status | With Coverage | Without Coverage |
| Native Born | 507 (100.0%) | 0 (0.0%) |
| Foreign Born, Citizen | 1,688 (99.1%) | 16 (0.9%) |
| Foreign Born, not a Citizen | 463 (90.6%) | 48 (9.4%) |
Health Insurance Coverage by Household Income in Parkville
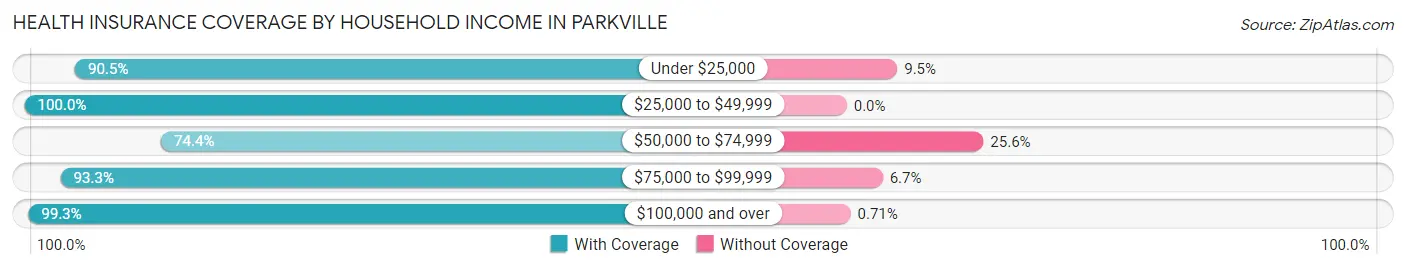
| Household Income | With Coverage | Without Coverage |
| Under $25,000 | 134 (90.5%) | 14 (9.5%) |
| $25,000 to $49,999 | 397 (100.0%) | 0 (0.0%) |
| $50,000 to $74,999 | 282 (74.4%) | 97 (25.6%) |
| $75,000 to $99,999 | 319 (93.3%) | 23 (6.7%) |
| $100,000 and over | 6,056 (99.3%) | 43 (0.7%) |
Public vs Private Health Insurance Coverage by Age in Parkville
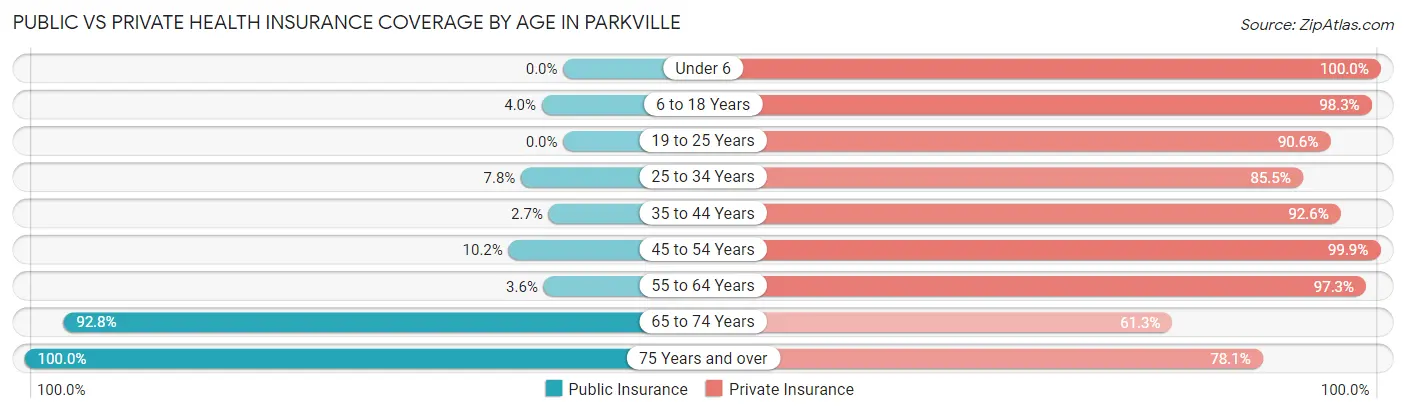
| Age Bracket | Public Insurance | Private Insurance |
| Under 6 | 0 (0.0%) | 507 (100.0%) |
| 6 to 18 Years | 68 (4.0%) | 1,675 (98.3%) |
| 19 to 25 Years | 0 (0.0%) | 463 (90.6%) |
| 25 to 34 Years | 27 (7.8%) | 295 (85.5%) |
| 35 to 44 Years | 36 (2.7%) | 1,231 (92.6%) |
| 45 to 54 Years | 115 (10.2%) | 1,131 (99.9%) |
| 55 to 64 Years | 36 (3.6%) | 963 (97.3%) |
| 65 to 74 Years | 749 (92.8%) | 495 (61.3%) |
| 75 Years and over | 260 (100.0%) | 203 (78.1%) |
| Total | 1,291 (17.0%) | 6,963 (91.8%) |
Disability Status by Sex by Age in Parkville
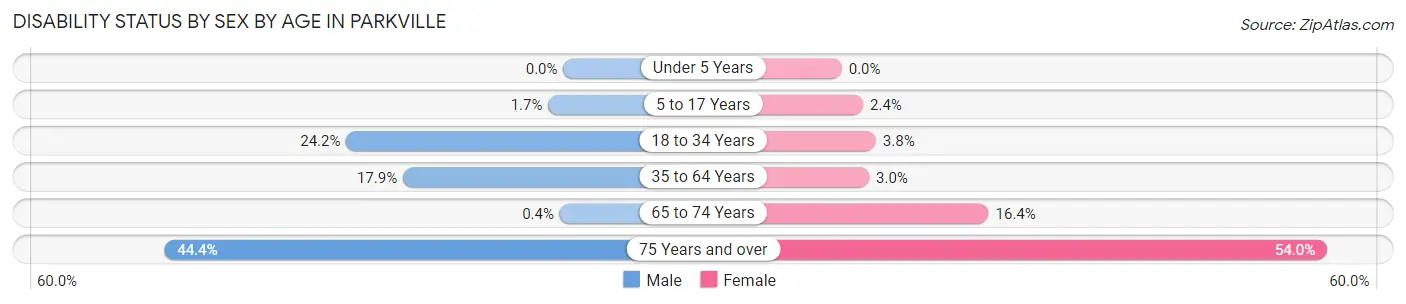
| Age Bracket | Male | Female |
| Under 5 Years | 0 (0.0%) | 0 (0.0%) |
| 5 to 17 Years | 15 (1.7%) | 14 (2.4%) |
| 18 to 34 Years | 139 (24.2%) | 20 (3.8%) |
| 35 to 64 Years | 317 (17.9%) | 51 (3.0%) |
| 65 to 74 Years | 2 (0.4%) | 51 (16.4%) |
| 75 Years and over | 44 (44.4%) | 87 (54.0%) |
Disability Class by Sex by Age in Parkville
Disability Class: Hearing Difficulty
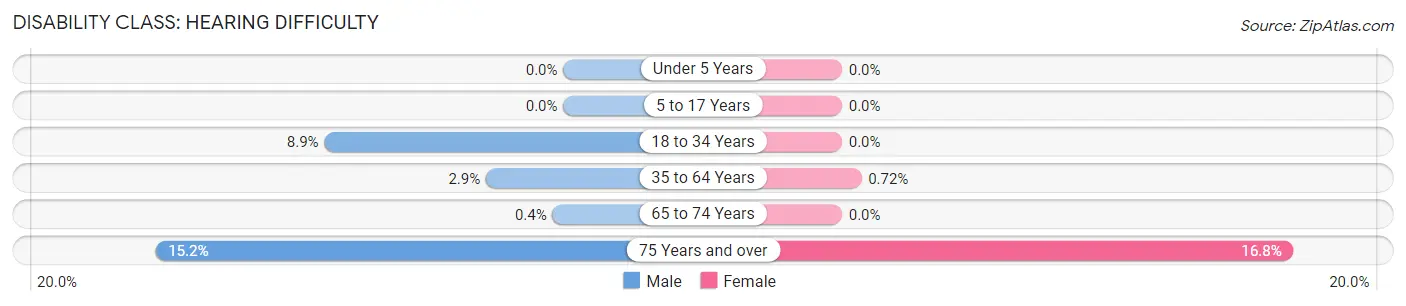
| Age Bracket | Male | Female |
| Under 5 Years | 0 (0.0%) | 0 (0.0%) |
| 5 to 17 Years | 0 (0.0%) | 0 (0.0%) |
| 18 to 34 Years | 51 (8.9%) | 0 (0.0%) |
| 35 to 64 Years | 51 (2.9%) | 12 (0.7%) |
| 65 to 74 Years | 2 (0.4%) | 0 (0.0%) |
| 75 Years and over | 15 (15.1%) | 27 (16.8%) |
Disability Class: Vision Difficulty
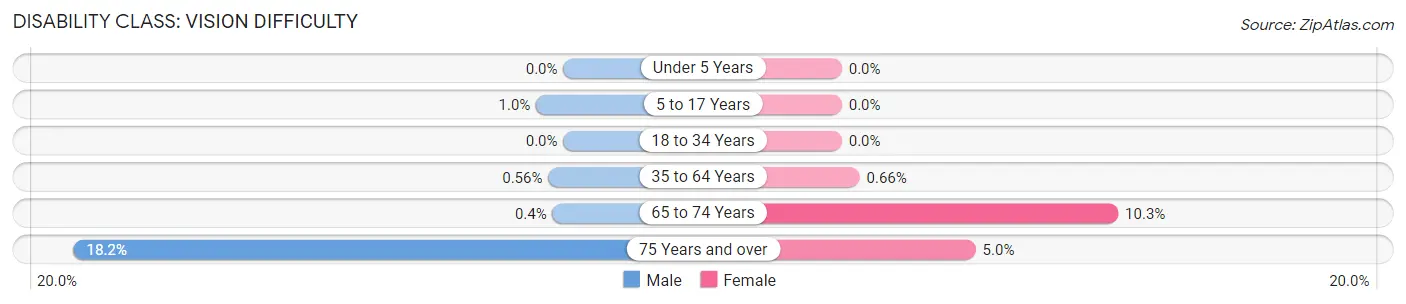
| Age Bracket | Male | Female |
| Under 5 Years | 0 (0.0%) | 0 (0.0%) |
| 5 to 17 Years | 9 (1.0%) | 0 (0.0%) |
| 18 to 34 Years | 0 (0.0%) | 0 (0.0%) |
| 35 to 64 Years | 10 (0.6%) | 11 (0.7%) |
| 65 to 74 Years | 2 (0.4%) | 32 (10.3%) |
| 75 Years and over | 18 (18.2%) | 8 (5.0%) |
Disability Class: Cognitive Difficulty
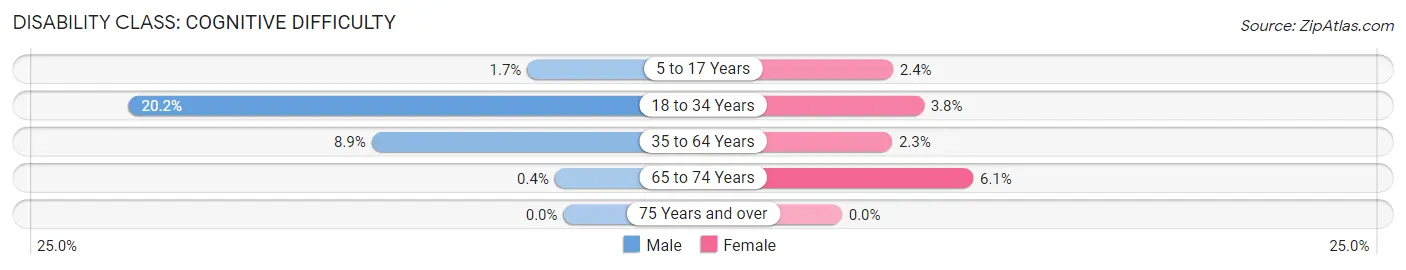
| Age Bracket | Male | Female |
| 5 to 17 Years | 15 (1.7%) | 14 (2.4%) |
| 18 to 34 Years | 116 (20.2%) | 20 (3.8%) |
| 35 to 64 Years | 158 (8.9%) | 39 (2.3%) |
| 65 to 74 Years | 2 (0.4%) | 19 (6.1%) |
| 75 Years and over | 0 (0.0%) | 0 (0.0%) |
Disability Class: Ambulatory Difficulty
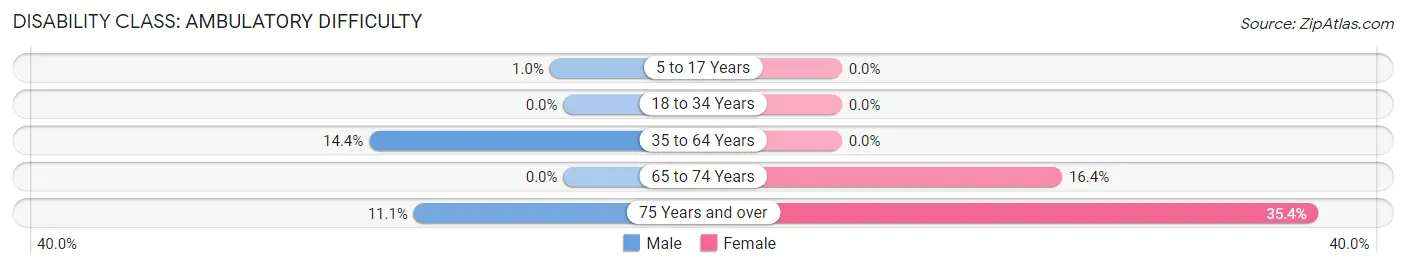
| Age Bracket | Male | Female |
| 5 to 17 Years | 9 (1.0%) | 0 (0.0%) |
| 18 to 34 Years | 0 (0.0%) | 0 (0.0%) |
| 35 to 64 Years | 256 (14.4%) | 0 (0.0%) |
| 65 to 74 Years | 0 (0.0%) | 51 (16.4%) |
| 75 Years and over | 11 (11.1%) | 57 (35.4%) |
Disability Class: Self-Care Difficulty
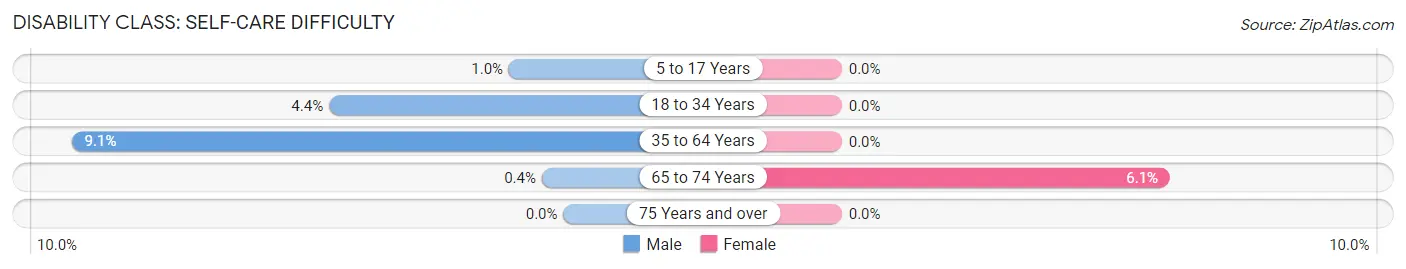
| Age Bracket | Male | Female |
| 5 to 17 Years | 9 (1.0%) | 0 (0.0%) |
| 18 to 34 Years | 25 (4.3%) | 0 (0.0%) |
| 35 to 64 Years | 162 (9.1%) | 0 (0.0%) |
| 65 to 74 Years | 2 (0.4%) | 19 (6.1%) |
| 75 Years and over | 0 (0.0%) | 0 (0.0%) |
Technology Access in Parkville
Computing Device Access in Parkville
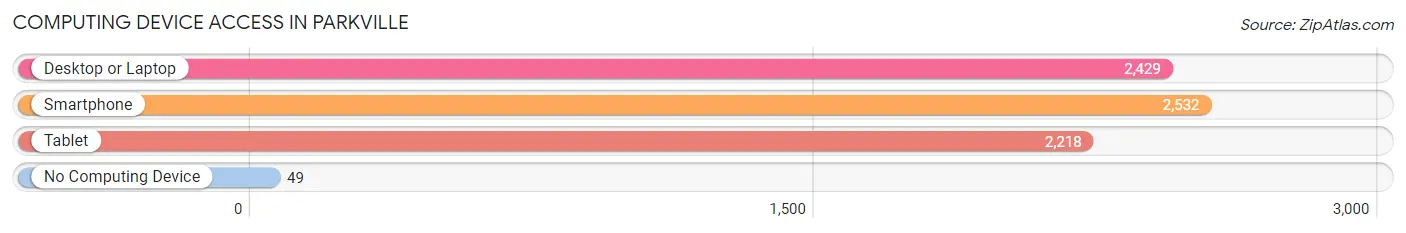
| Device Type | # Households | % Households |
| Desktop or Laptop | 2,429 | 90.6% |
| Smartphone | 2,532 | 94.5% |
| Tablet | 2,218 | 82.8% |
| No Computing Device | 49 | 1.8% |
| Total | 2,680 | 100.0% |
Internet Access in Parkville
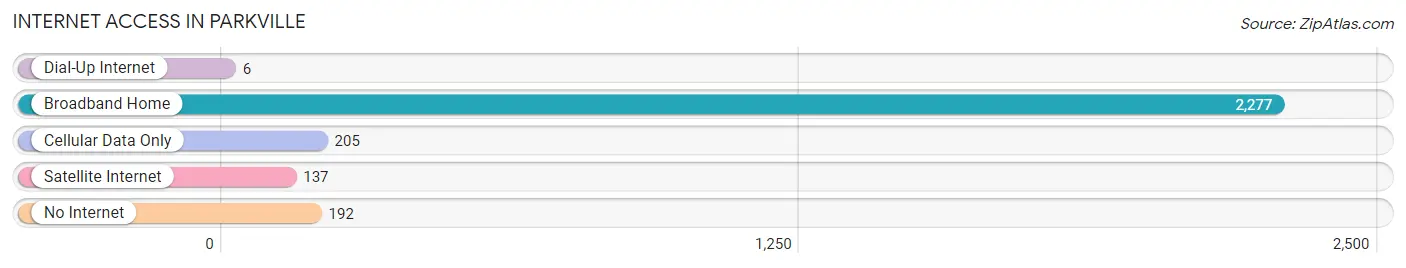
| Internet Type | # Households | % Households |
| Dial-Up Internet | 6 | 0.2% |
| Broadband Home | 2,277 | 85.0% |
| Cellular Data Only | 205 | 7.6% |
| Satellite Internet | 137 | 5.1% |
| No Internet | 192 | 7.2% |
| Total | 2,680 | 100.0% |
Parkville Summary
Parkville, Missouri is a small city located in Platte County, Missouri, just north of Kansas City. It is part of the Kansas City Metropolitan Area and is home to approximately 6,500 people. Parkville is known for its historic downtown area, which is home to many unique shops and restaurants.
History
Parkville was founded in 1844 by a group of settlers from Kentucky. The town was named after the nearby Parkville Landing, which was a popular spot for steamboats to dock. The town quickly grew and by the late 1800s, it was a thriving community with a variety of businesses, including a flour mill, a sawmill, a blacksmith shop, and a general store.
In the early 1900s, Parkville began to experience a period of growth and development. The town was incorporated in 1908 and the first mayor was elected in 1909. The town continued to grow and by the 1950s, it had become a popular destination for tourists and visitors.
Geography
Parkville is located in Platte County, Missouri, just north of Kansas City. It is situated on the Missouri River and is bordered by the cities of Riverside, Platte City, and Weatherby Lake. The city covers an area of 4.3 square miles and has an elevation of 890 feet.
The climate in Parkville is humid continental, with hot, humid summers and cold, snowy winters. The average annual temperature is 54 degrees Fahrenheit and the average annual precipitation is 40 inches.
Economy
The economy of Parkville is largely based on tourism and retail. The city is home to several unique shops and restaurants, as well as a variety of attractions, such as the Parkville Nature Sanctuary and the Parkville Historical Museum.
In addition, Parkville is home to several large employers, including Park University, Park Hill School District, and the Parkville Medical Center. The city also has a thriving business community, with a variety of small businesses, including restaurants, retail stores, and professional services.
Demographics
As of the 2010 census, the population of Parkville was 6,500. The racial makeup of the city was 87.3% White, 5.3% African American, 0.7% Native American, 1.2% Asian, and 4.5% from other races. The median household income was $50,945 and the median family income was $60,945.
Conclusion
Parkville, Missouri is a small city located in Platte County, Missouri, just north of Kansas City. It is part of the Kansas City Metropolitan Area and is home to approximately 6,500 people. Parkville is known for its historic downtown area, which is home to many unique shops and restaurants. The economy of Parkville is largely based on tourism and retail, and the city is home to several large employers. The population of Parkville is predominantly White, with a small percentage of African American, Native American, and Asian residents.
Common Questions
What is the Total Population of Parkville?
Total Population of Parkville is 7,669.
What is the Total Male Population of Parkville?
Total Male Population of Parkville is 4,218.
What is the Total Female Population of Parkville?
Total Female Population of Parkville is 3,451.
What is the Ratio of Males per 100 Females in Parkville?
There are 122.23 Males per 100 Females in Parkville.
What is the Ratio of Females per 100 Males in Parkville?
There are 81.82 Females per 100 Males in Parkville.
What is the Median Population Age in Parkville?
Median Population Age in Parkville is 40.0 Years.
What is the Average Family Size in Parkville
Average Family Size in Parkville is 3.2 People.
What is the Average Household Size in Parkville
Average Household Size in Parkville is 2.8 People.
What is Per Capita Income in Parkville?
Per Capita income in Parkville is $75,435.
What is the Median Family Income in Parkville?
Median Family Income in Parkville is $202,219.
What is the Median Household income in Parkville?
Median Household Income in Parkville is $166,563.
What is Income or Wage Gap in Parkville?
Income or Wage Gap in Parkville is 46.4%.
Women in Parkville earn 53.6 cents for every dollar earned by a man.
What is Inequality or Gini Index in Parkville?
Inequality or Gini Index in Parkville is 0.45.
How Large is the Labor Force in Parkville?
There are 4,066 People in the Labor Forcein in Parkville.
What is the Percentage of People in the Labor Force in Parkville?
69.4% of People are in the Labor Force in Parkville.
What is the Unemployment Rate in Parkville?
Unemployment Rate in Parkville is 3.6%.