Airport Drive, MO
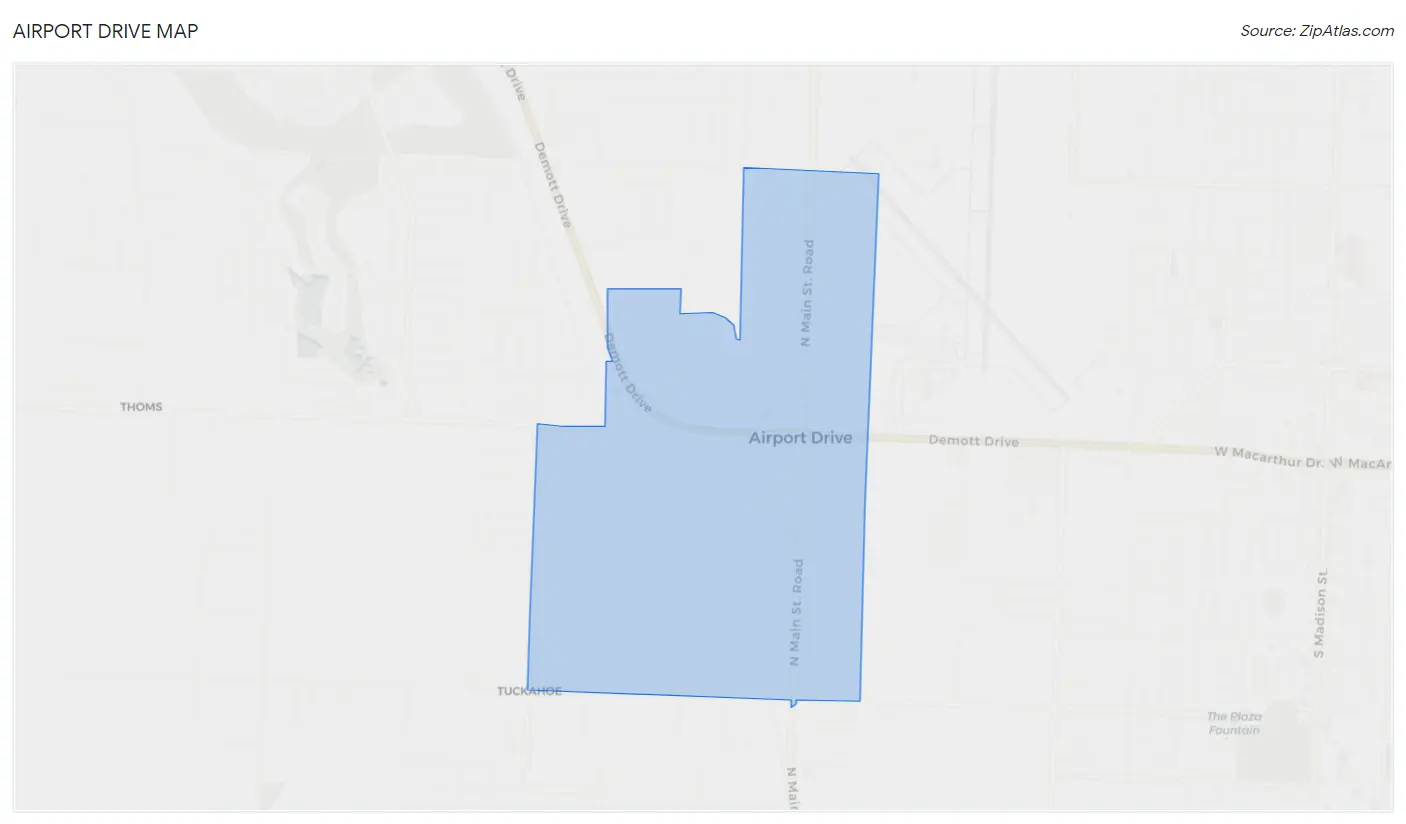
Airport Drive Map
Airport Drive Overview
675
TOTAL POPULATION
326
MALE POPULATION
349
FEMALE POPULATION
93.41
MALES / 100 FEMALES
107.06
FEMALES / 100 MALES
39.2
MEDIAN AGE
2.8
AVG FAMILY SIZE
2.2
AVG HOUSEHOLD SIZE
$40,483
PER CAPITA INCOME
$124,375
AVG FAMILY INCOME
$60,000
AVG HOUSEHOLD INCOME
34.1%
WAGE / INCOME GAP [ % ]
65.9¢/ $1
WAGE / INCOME GAP [ $ ]
$11,150
FAMILY INCOME DEFICIT
0.45
INEQUALITY / GINI INDEX
431
LABOR FORCE [ PEOPLE ]
72.8%
PERCENT IN LABOR FORCE
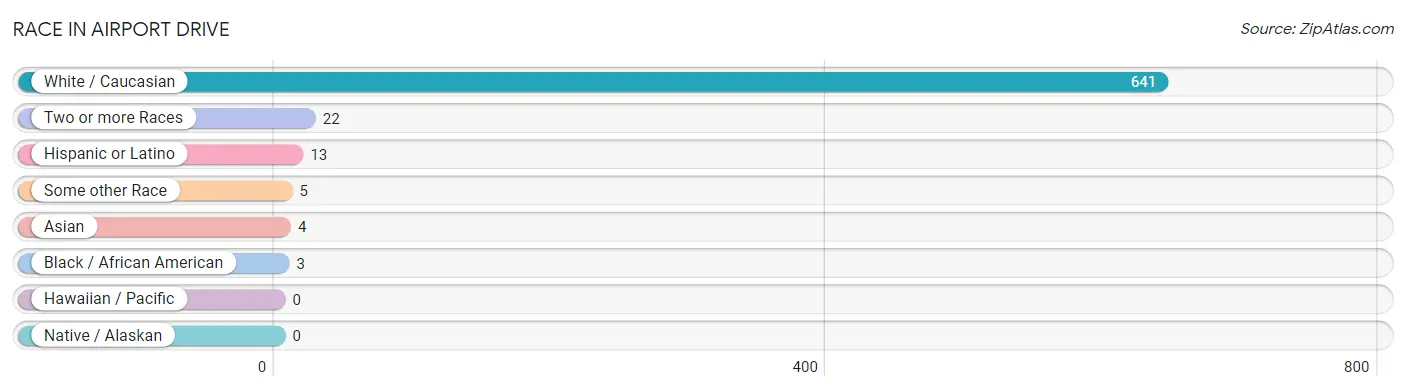
Race in Airport Drive
The most populous races in Airport Drive are White / Caucasian (641 | 95.0%), Two or more Races (22 | 3.3%), and Hispanic or Latino (13 | 1.9%).
| Race | # Population | % Population |
| Asian | 4 | 0.6% |
| Black / African American | 3 | 0.4% |
| Hawaiian / Pacific | 0 | 0.0% |
| Hispanic or Latino | 13 | 1.9% |
| Native / Alaskan | 0 | 0.0% |
| White / Caucasian | 641 | 95.0% |
| Two or more Races | 22 | 3.3% |
| Some other Race | 5 | 0.7% |
| Total | 675 | 100.0% |
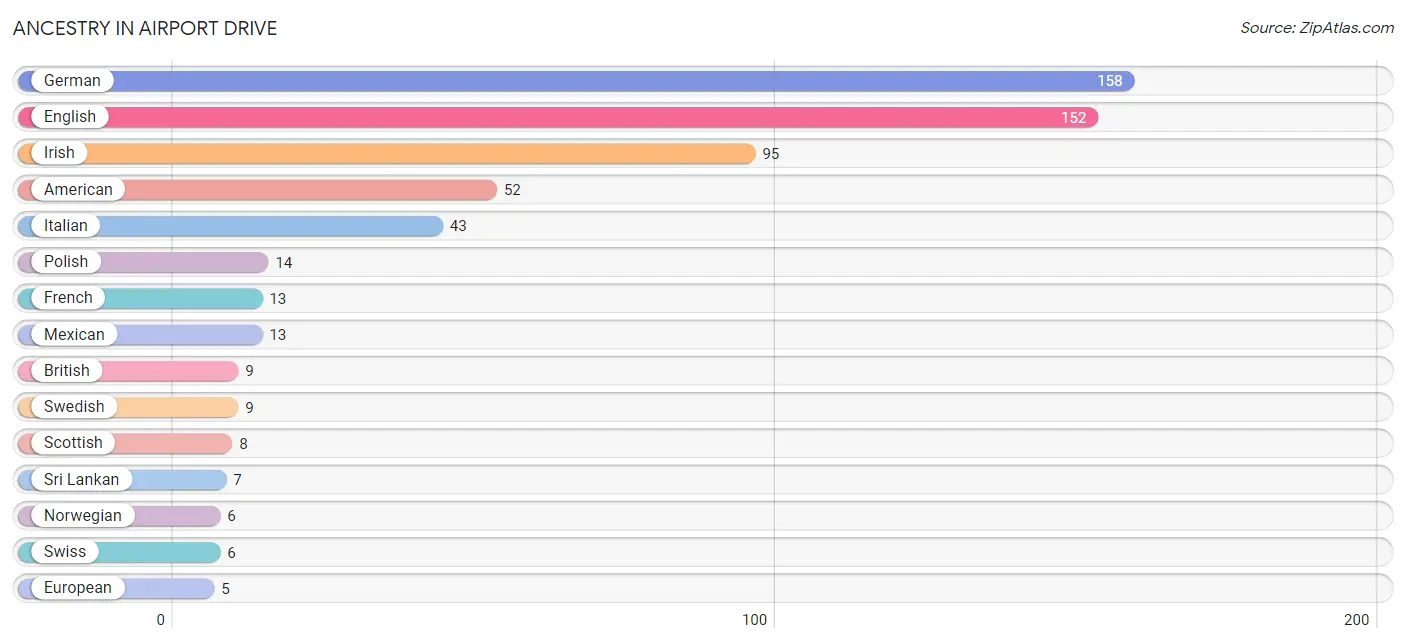
Ancestry in Airport Drive
The most populous ancestries reported in Airport Drive are German (158 | 23.4%), English (152 | 22.5%), Irish (95 | 14.1%), American (52 | 7.7%), and Italian (43 | 6.4%), together accounting for 74.1% of all Airport Drive residents.
| Ancestry | # Population | % Population |
| American | 52 | 7.7% |
| Bhutanese | 1 | 0.2% |
| British | 9 | 1.3% |
| Burmese | 2 | 0.3% |
| Cherokee | 2 | 0.3% |
| Czech | 3 | 0.4% |
| Dutch | 4 | 0.6% |
| Eastern European | 1 | 0.2% |
| English | 152 | 22.5% |
| European | 5 | 0.7% |
| French | 13 | 1.9% |
| German | 158 | 23.4% |
| Hungarian | 2 | 0.3% |
| Indian (Asian) | 2 | 0.3% |
| Irish | 95 | 14.1% |
| Iroquois | 5 | 0.7% |
| Italian | 43 | 6.4% |
| Mexican | 13 | 1.9% |
| Norwegian | 6 | 0.9% |
| Osage | 5 | 0.7% |
| Polish | 14 | 2.1% |
| Russian | 3 | 0.4% |
| Scandinavian | 2 | 0.3% |
| Scotch-Irish | 2 | 0.3% |
| Scottish | 8 | 1.2% |
| Sri Lankan | 7 | 1.0% |
| Swedish | 9 | 1.3% |
| Swiss | 6 | 0.9% |
| Welsh | 1 | 0.2% | View All 29 Rows |
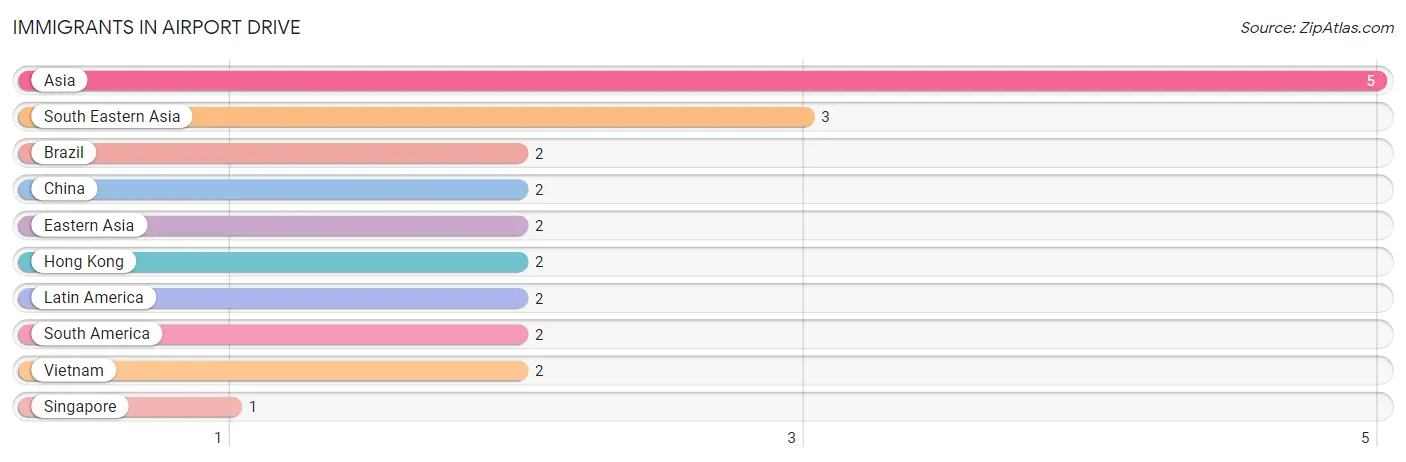
Immigrants in Airport Drive
The most numerous immigrant groups reported in Airport Drive came from Asia (5 | 0.7%), South Eastern Asia (3 | 0.4%), Brazil (2 | 0.3%), China (2 | 0.3%), and Eastern Asia (2 | 0.3%), together accounting for 2.1% of all Airport Drive residents.
| Immigration Origin | # Population | % Population |
| Asia | 5 | 0.7% |
| Brazil | 2 | 0.3% |
| China | 2 | 0.3% |
| Eastern Asia | 2 | 0.3% |
| Hong Kong | 2 | 0.3% |
| Latin America | 2 | 0.3% |
| Singapore | 1 | 0.2% |
| South America | 2 | 0.3% |
| South Eastern Asia | 3 | 0.4% |
| Vietnam | 2 | 0.3% | View All 10 Rows |
Sex and Age in Airport Drive
Sex and Age in Airport Drive
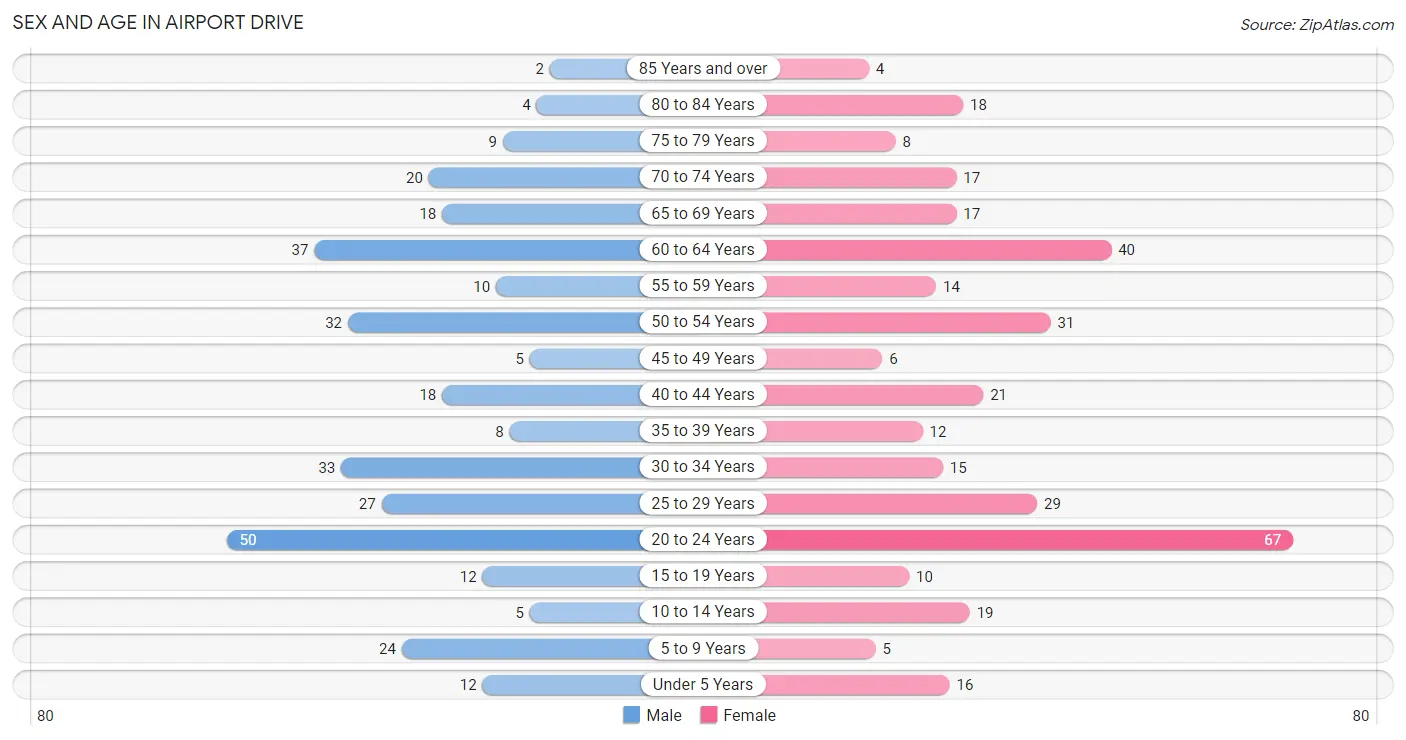
The most populous age groups in Airport Drive are 20 to 24 Years (50 | 15.3%) for men and 20 to 24 Years (67 | 19.2%) for women.
| Age Bracket | Male | Female |
| Under 5 Years | 12 (3.7%) | 16 (4.6%) |
| 5 to 9 Years | 24 (7.4%) | 5 (1.4%) |
| 10 to 14 Years | 5 (1.5%) | 19 (5.4%) |
| 15 to 19 Years | 12 (3.7%) | 10 (2.9%) |
| 20 to 24 Years | 50 (15.3%) | 67 (19.2%) |
| 25 to 29 Years | 27 (8.3%) | 29 (8.3%) |
| 30 to 34 Years | 33 (10.1%) | 15 (4.3%) |
| 35 to 39 Years | 8 (2.5%) | 12 (3.4%) |
| 40 to 44 Years | 18 (5.5%) | 21 (6.0%) |
| 45 to 49 Years | 5 (1.5%) | 6 (1.7%) |
| 50 to 54 Years | 32 (9.8%) | 31 (8.9%) |
| 55 to 59 Years | 10 (3.1%) | 14 (4.0%) |
| 60 to 64 Years | 37 (11.4%) | 40 (11.5%) |
| 65 to 69 Years | 18 (5.5%) | 17 (4.9%) |
| 70 to 74 Years | 20 (6.1%) | 17 (4.9%) |
| 75 to 79 Years | 9 (2.8%) | 8 (2.3%) |
| 80 to 84 Years | 4 (1.2%) | 18 (5.2%) |
| 85 Years and over | 2 (0.6%) | 4 (1.1%) |
| Total | 326 (100.0%) | 349 (100.0%) |
Families and Households in Airport Drive
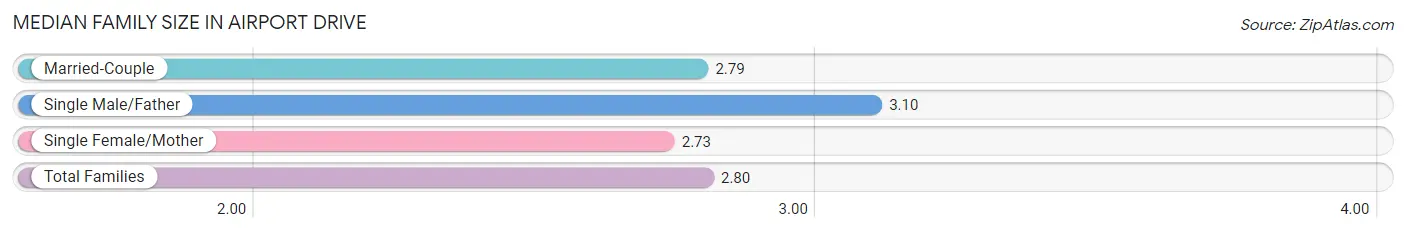
Median Family Size in Airport Drive
The median family size in Airport Drive is 2.80 persons per family, with single male/father families (10 | 5.4%) accounting for the largest median family size of 3.1 persons per family. On the other hand, single female/mother families (22 | 11.9%) represent the smallest median family size with 2.73 persons per family.
| Family Type | # Families | Family Size |
| Married-Couple | 153 (82.7%) | 2.79 |
| Single Male/Father | 10 (5.4%) | 3.10 |
| Single Female/Mother | 22 (11.9%) | 2.73 |
| Total Families | 185 (100.0%) | 2.80 |
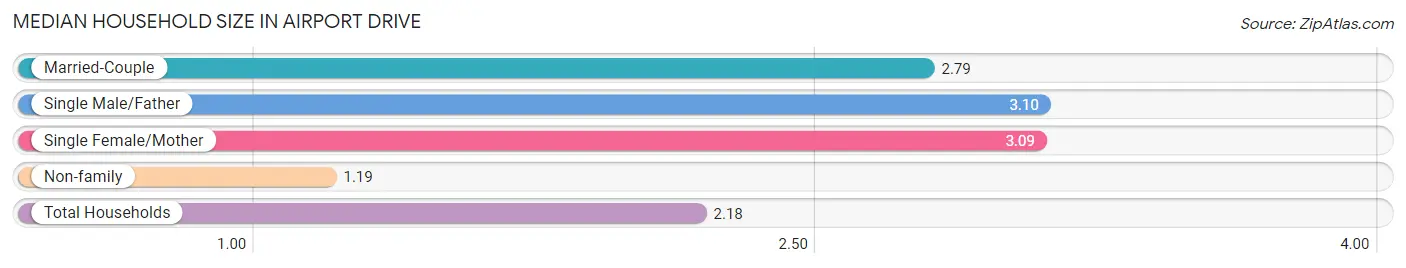
Median Household Size in Airport Drive
The median household size in Airport Drive is 2.18 persons per household, with single male/father households (10 | 3.2%) accounting for the largest median household size of 3.1 persons per household. non-family households (125 | 40.3%) represent the smallest median household size with 1.19 persons per household.
| Household Type | # Households | Household Size |
| Married-Couple | 153 (49.3%) | 2.79 |
| Single Male/Father | 10 (3.2%) | 3.10 |
| Single Female/Mother | 22 (7.1%) | 3.09 |
| Non-family | 125 (40.3%) | 1.19 |
| Total Households | 310 (100.0%) | 2.18 |
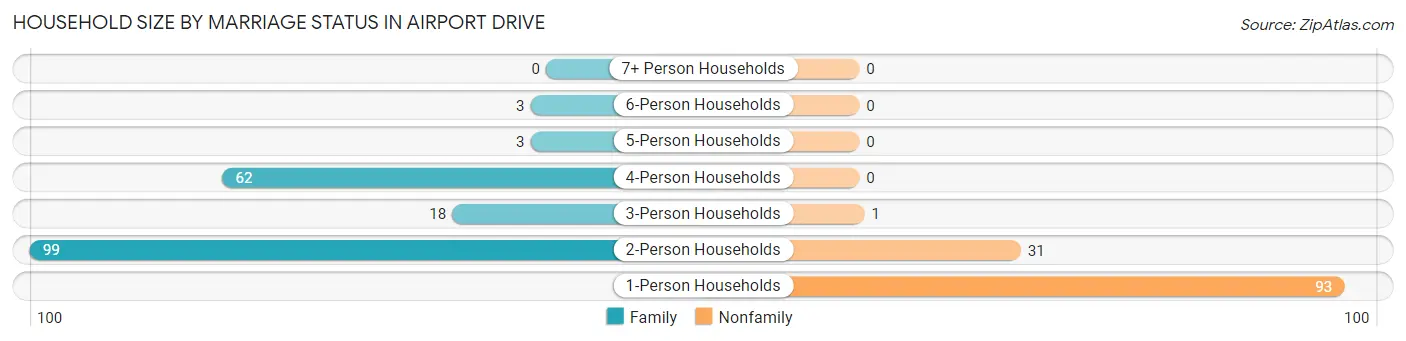
Household Size by Marriage Status in Airport Drive
Out of a total of 310 households in Airport Drive, 185 (59.7%) are family households, while 125 (40.3%) are nonfamily households. The most numerous type of family households are 2-person households, comprising 99, and the most common type of nonfamily households are 1-person households, comprising 93.
| Household Size | Family Households | Nonfamily Households |
| 1-Person Households | - | 93 (30.0%) |
| 2-Person Households | 99 (31.9%) | 31 (10.0%) |
| 3-Person Households | 18 (5.8%) | 1 (0.3%) |
| 4-Person Households | 62 (20.0%) | 0 (0.0%) |
| 5-Person Households | 3 (1.0%) | 0 (0.0%) |
| 6-Person Households | 3 (1.0%) | 0 (0.0%) |
| 7+ Person Households | 0 (0.0%) | 0 (0.0%) |
| Total | 185 (59.7%) | 125 (40.3%) |
Female Fertility in Airport Drive
Fertility by Age in Airport Drive
Average fertility rate in Airport Drive is 13.0 births per 1,000 women. Women in the age bracket of 20 to 34 years have the highest fertility rate with 18.0 births per 1,000 women. Women in the age bracket of 20 to 34 years acount for 100.0% of all women with births.
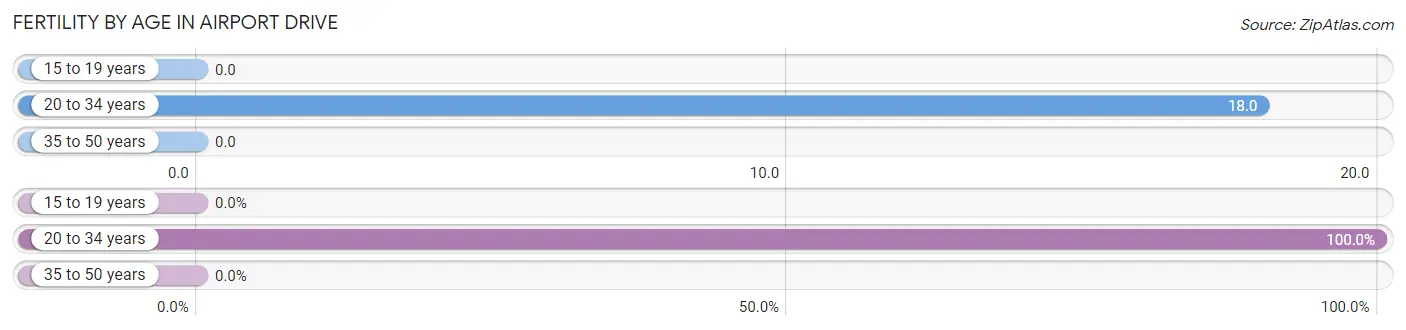
| Age Bracket | Women with Births | Births / 1,000 Women |
| 15 to 19 years | 0 (0.0%) | 0.0 |
| 20 to 34 years | 2 (100.0%) | 18.0 |
| 35 to 50 years | 0 (0.0%) | 0.0 |
| Total | 2 (100.0%) | 13.0 |
Fertility by Age by Marriage Status in Airport Drive
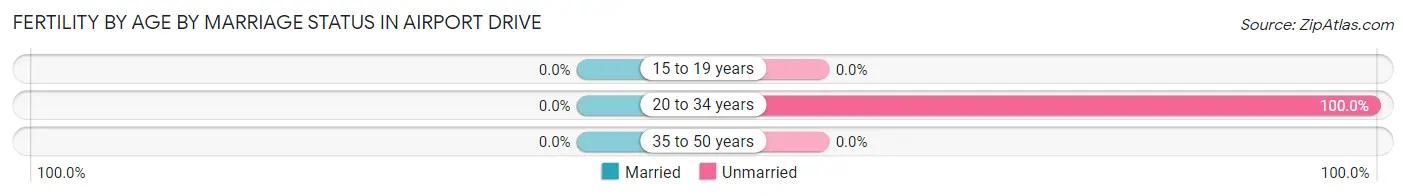
| Age Bracket | Married | Unmarried |
| 15 to 19 years | 0 (0.0%) | 0 (0.0%) |
| 20 to 34 years | 0 (0.0%) | 2 (100.0%) |
| 35 to 50 years | 0 (0.0%) | 0 (0.0%) |
| Total | 0 (0.0%) | 2 (100.0%) |
Fertility by Education in Airport Drive
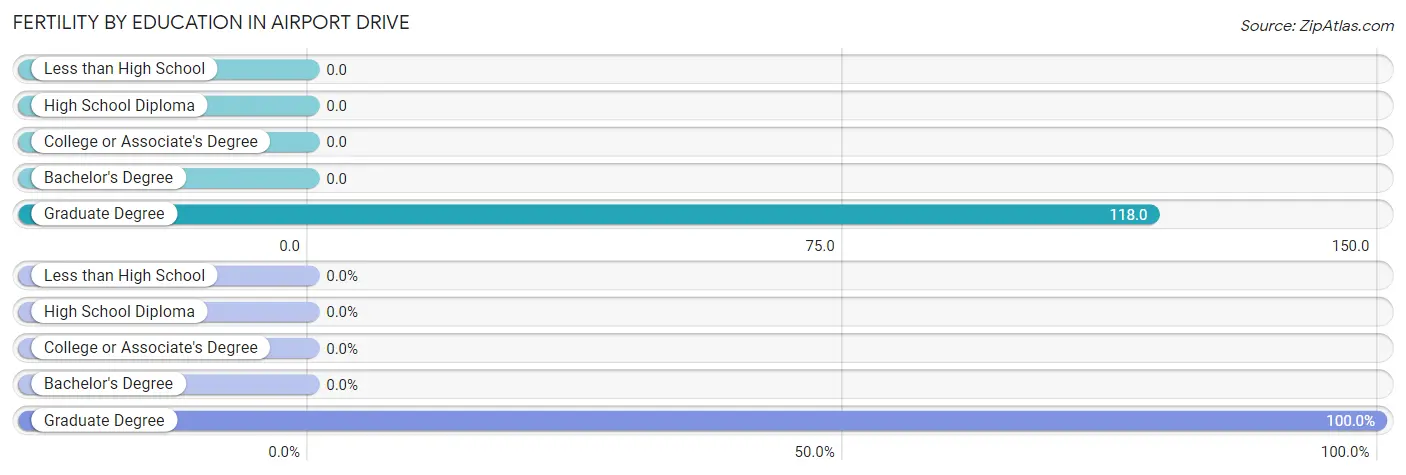
| Educational Attainment | Women with Births | Births / 1,000 Women |
| Less than High School | 0 (0.0%) | 0.0 |
| High School Diploma | 0 (0.0%) | 0.0 |
| College or Associate's Degree | 0 (0.0%) | 0.0 |
| Bachelor's Degree | 0 (0.0%) | 0.0 |
| Graduate Degree | 2 (100.0%) | 118.0 |
| Total | 2 (100.0%) | 13.0 |
Fertility by Education by Marriage Status in Airport Drive
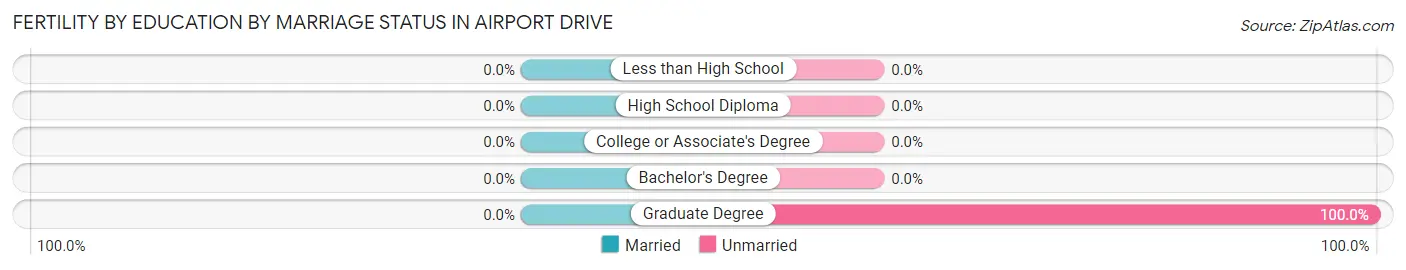
| Educational Attainment | Married | Unmarried |
| Less than High School | 0 (0.0%) | 0 (0.0%) |
| High School Diploma | 0 (0.0%) | 0 (0.0%) |
| College or Associate's Degree | 0 (0.0%) | 0 (0.0%) |
| Bachelor's Degree | 0 (0.0%) | 0 (0.0%) |
| Graduate Degree | 0 (0.0%) | 2 (100.0%) |
| Total | 0 (0.0%) | 2 (100.0%) |
Income in Airport Drive
Income Overview in Airport Drive
Per Capita Income in Airport Drive is $40,483, while median incomes of families and households are $124,375 and $60,000 respectively.
| Characteristic | Number | Measure |
| Per Capita Income | 675 | $40,483 |
| Median Family Income | 185 | $124,375 |
| Mean Family Income | 185 | $116,717 |
| Median Household Income | 310 | $60,000 |
| Mean Household Income | 310 | $89,332 |
| Income Deficit | 185 | $11,150 |
| Wage / Income Gap (%) | 675 | 34.15% |
| Wage / Income Gap ($) | 675 | 65.85¢ per $1 |
| Gini / Inequality Index | 675 | 0.45 |
Earnings by Sex in Airport Drive
Average Earnings in Airport Drive are $38,458, $48,594 for men and $32,000 for women, a difference of 34.2%.
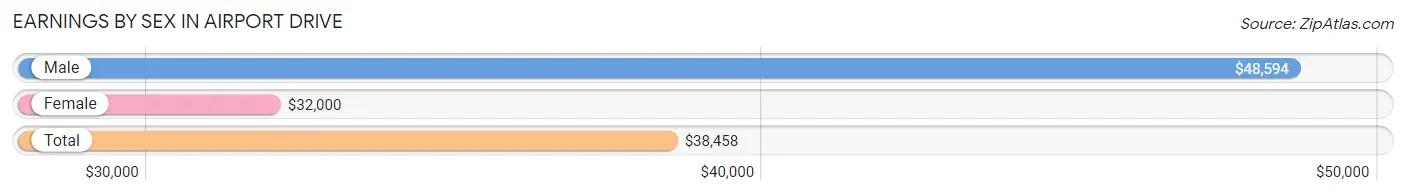
| Sex | Number | Average Earnings |
| Male | 227 (51.0%) | $48,594 |
| Female | 218 (49.0%) | $32,000 |
| Total | 445 (100.0%) | $38,458 |
Earnings by Sex by Income Bracket in Airport Drive
The most common earnings brackets in Airport Drive are $100,000+ for men (42 | 18.5%) and $35,000 to $39,999 for women (36 | 16.5%).
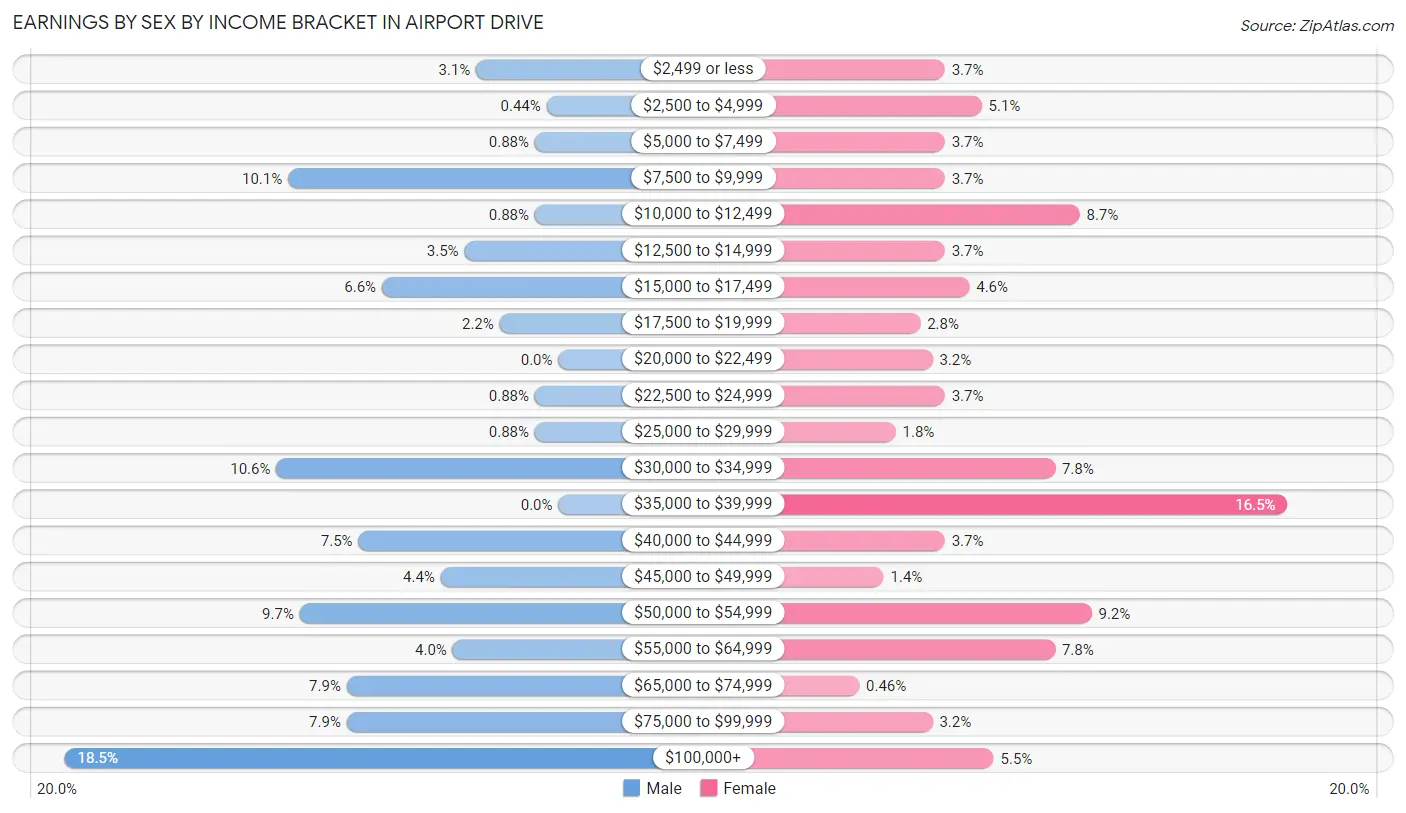
| Income | Male | Female |
| $2,499 or less | 7 (3.1%) | 8 (3.7%) |
| $2,500 to $4,999 | 1 (0.4%) | 11 (5.1%) |
| $5,000 to $7,499 | 2 (0.9%) | 8 (3.7%) |
| $7,500 to $9,999 | 23 (10.1%) | 8 (3.7%) |
| $10,000 to $12,499 | 2 (0.9%) | 19 (8.7%) |
| $12,500 to $14,999 | 8 (3.5%) | 8 (3.7%) |
| $15,000 to $17,499 | 15 (6.6%) | 10 (4.6%) |
| $17,500 to $19,999 | 5 (2.2%) | 6 (2.8%) |
| $20,000 to $22,499 | 0 (0.0%) | 7 (3.2%) |
| $22,500 to $24,999 | 2 (0.9%) | 8 (3.7%) |
| $25,000 to $29,999 | 2 (0.9%) | 4 (1.8%) |
| $30,000 to $34,999 | 24 (10.6%) | 17 (7.8%) |
| $35,000 to $39,999 | 0 (0.0%) | 36 (16.5%) |
| $40,000 to $44,999 | 17 (7.5%) | 8 (3.7%) |
| $45,000 to $49,999 | 10 (4.4%) | 3 (1.4%) |
| $50,000 to $54,999 | 22 (9.7%) | 20 (9.2%) |
| $55,000 to $64,999 | 9 (4.0%) | 17 (7.8%) |
| $65,000 to $74,999 | 18 (7.9%) | 1 (0.5%) |
| $75,000 to $99,999 | 18 (7.9%) | 7 (3.2%) |
| $100,000+ | 42 (18.5%) | 12 (5.5%) |
| Total | 227 (100.0%) | 218 (100.0%) |
Earnings by Sex by Educational Attainment in Airport Drive
Average earnings in Airport Drive are $52,440 for men and $39,125 for women, a difference of 25.4%. Men with an educational attainment of graduate degree enjoy the highest average annual earnings of $125,313, while those with high school diploma education earn the least with $49,219. Women with an educational attainment of graduate degree earn the most with the average annual earnings of $56,000, while those with bachelor's degree education have the smallest earnings of $36,250.
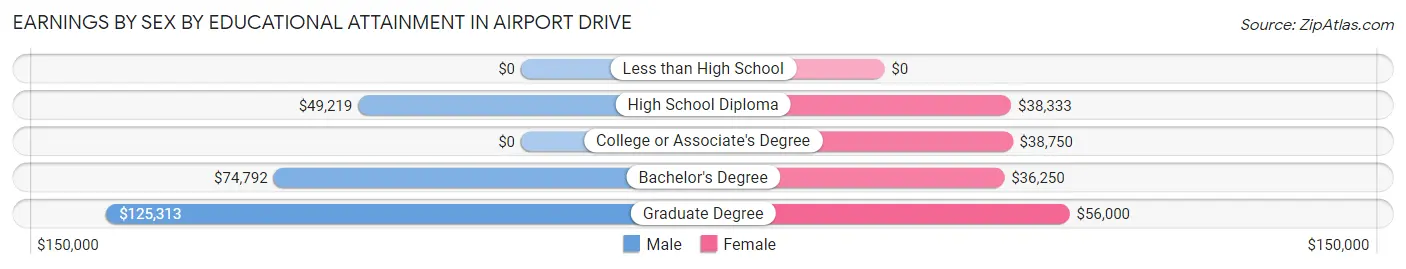
| Educational Attainment | Male Income | Female Income |
| Less than High School | - | - |
| High School Diploma | $49,219 | $38,333 |
| College or Associate's Degree | - | - |
| Bachelor's Degree | $74,792 | $36,250 |
| Graduate Degree | $125,313 | $56,000 |
| Total | $52,440 | $39,125 |
Family Income in Airport Drive
Family Income Brackets in Airport Drive
According to the Airport Drive family income data, there are 67 families falling into the $100,000 to $149,999 income range, which is the most common income bracket and makes up 36.2% of all families. Conversely, the $15,000 to $24,999 income bracket is the least frequent group with only 4 families (2.2%) belonging to this category.
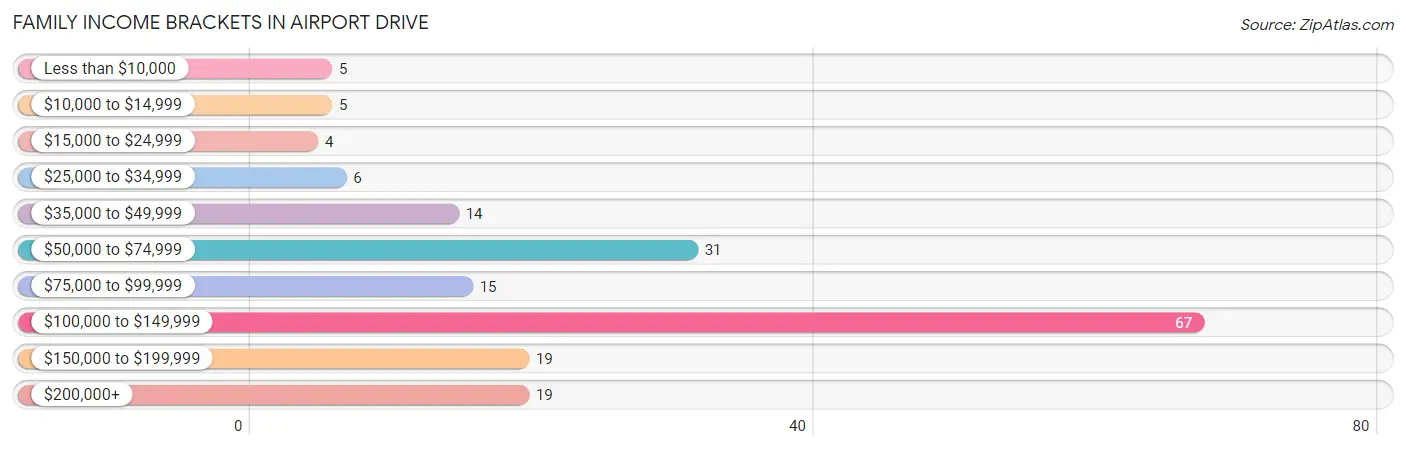
| Income Bracket | # Families | % Families |
| Less than $10,000 | 5 | 2.7% |
| $10,000 to $14,999 | 5 | 2.7% |
| $15,000 to $24,999 | 4 | 2.2% |
| $25,000 to $34,999 | 6 | 3.2% |
| $35,000 to $49,999 | 14 | 7.6% |
| $50,000 to $74,999 | 31 | 16.8% |
| $75,000 to $99,999 | 15 | 8.1% |
| $100,000 to $149,999 | 67 | 36.2% |
| $150,000 to $199,999 | 19 | 10.3% |
| $200,000+ | 19 | 10.3% |
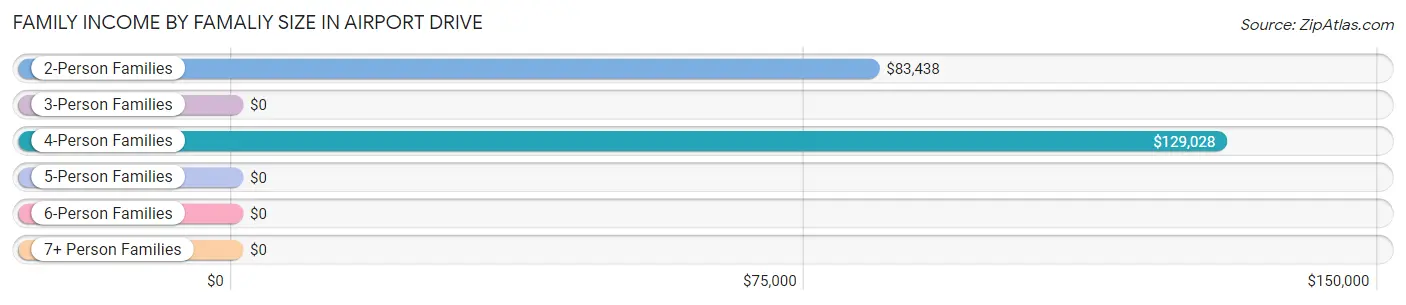
Family Income by Famaliy Size in Airport Drive
4-person families (58 | 31.4%) account for the highest median family income in Airport Drive with $129,028 per family, while 2-person families (103 | 55.7%) have the highest median income of $41,719 per family member.
| Income Bracket | # Families | Median Income |
| 2-Person Families | 103 (55.7%) | $83,438 |
| 3-Person Families | 18 (9.7%) | $0 |
| 4-Person Families | 58 (31.4%) | $129,028 |
| 5-Person Families | 3 (1.6%) | $0 |
| 6-Person Families | 3 (1.6%) | $0 |
| 7+ Person Families | 0 (0.0%) | $0 |
| Total | 185 (100.0%) | $124,375 |
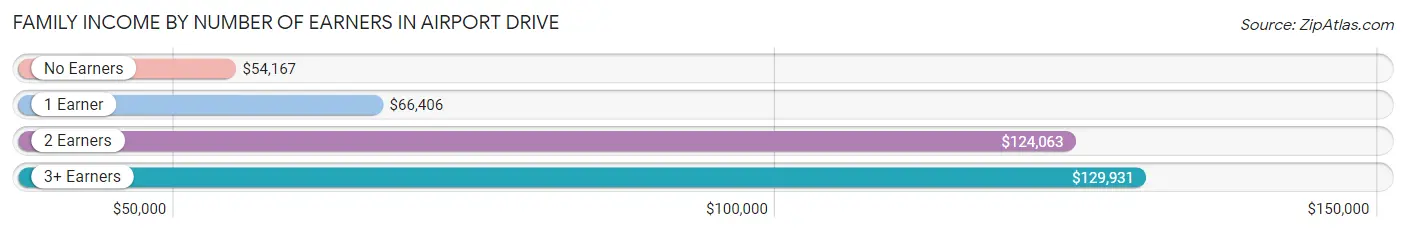
Family Income by Number of Earners in Airport Drive
The median family income in Airport Drive is $124,375, with families comprising 3+ earners (39) having the highest median family income of $129,931, while families with no earners (26) have the lowest median family income of $54,167, accounting for 21.1% and 14.1% of families, respectively.
| Number of Earners | # Families | Median Income |
| No Earners | 26 (14.1%) | $54,167 |
| 1 Earner | 41 (22.2%) | $66,406 |
| 2 Earners | 79 (42.7%) | $124,063 |
| 3+ Earners | 39 (21.1%) | $129,931 |
| Total | 185 (100.0%) | $124,375 |
Household Income in Airport Drive
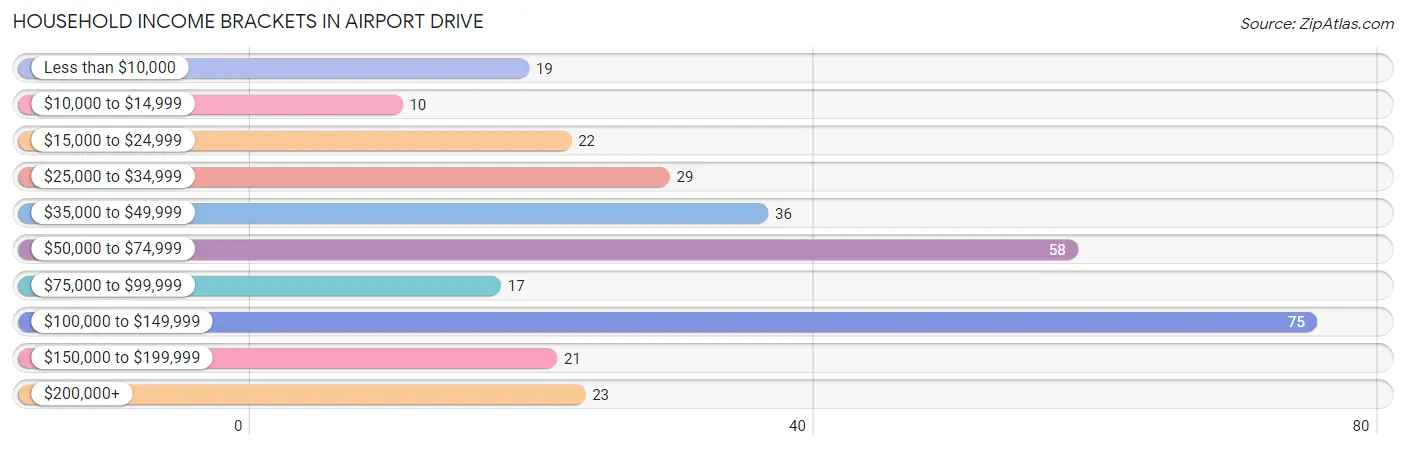
Household Income Brackets in Airport Drive
With 75 households falling in the category, the $100,000 to $149,999 income range is the most frequent in Airport Drive, accounting for 24.2% of all households. In contrast, only 10 households (3.2%) fall into the $10,000 to $14,999 income bracket, making it the least populous group.
| Income Bracket | # Households | % Households |
| Less than $10,000 | 19 | 6.1% |
| $10,000 to $14,999 | 10 | 3.2% |
| $15,000 to $24,999 | 22 | 7.1% |
| $25,000 to $34,999 | 29 | 9.4% |
| $35,000 to $49,999 | 36 | 11.6% |
| $50,000 to $74,999 | 58 | 18.7% |
| $75,000 to $99,999 | 17 | 5.5% |
| $100,000 to $149,999 | 75 | 24.2% |
| $150,000 to $199,999 | 21 | 6.8% |
| $200,000+ | 23 | 7.4% |
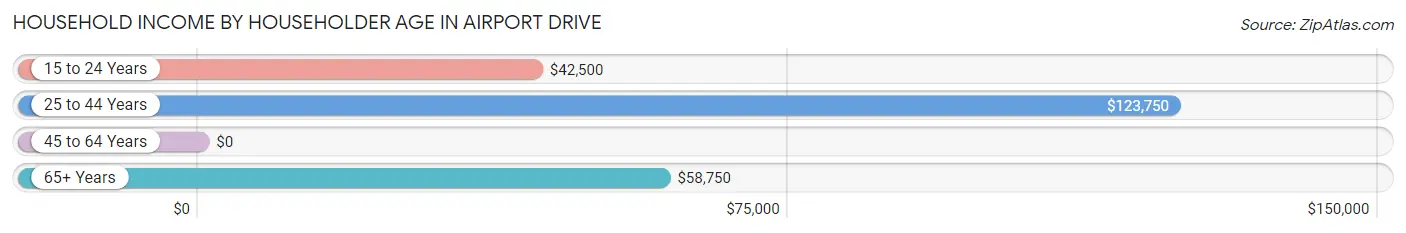
Household Income by Householder Age in Airport Drive
The median household income in Airport Drive is $60,000, with the highest median household income of $123,750 found in the 25 to 44 years age bracket for the primary householder. A total of 77 households (24.8%) fall into this category. Meanwhile, the 45 to 64 years age bracket for the primary householder has the lowest median household income of $0, with 97 households (31.3%) in this group.
| Income Bracket | # Households | Median Income |
| 15 to 24 Years | 52 (16.8%) | $42,500 |
| 25 to 44 Years | 77 (24.8%) | $123,750 |
| 45 to 64 Years | 97 (31.3%) | $0 |
| 65+ Years | 84 (27.1%) | $58,750 |
| Total | 310 (100.0%) | $60,000 |
Poverty in Airport Drive
Income Below Poverty by Sex and Age in Airport Drive
With 2.5% poverty level for males and 15.5% for females among the residents of Airport Drive, 12 to 14 year old males and 16 and 17 year old females are the most vulnerable to poverty, with 3 males (60.0%) and 4 females (100.0%) in their respective age groups living below the poverty level.
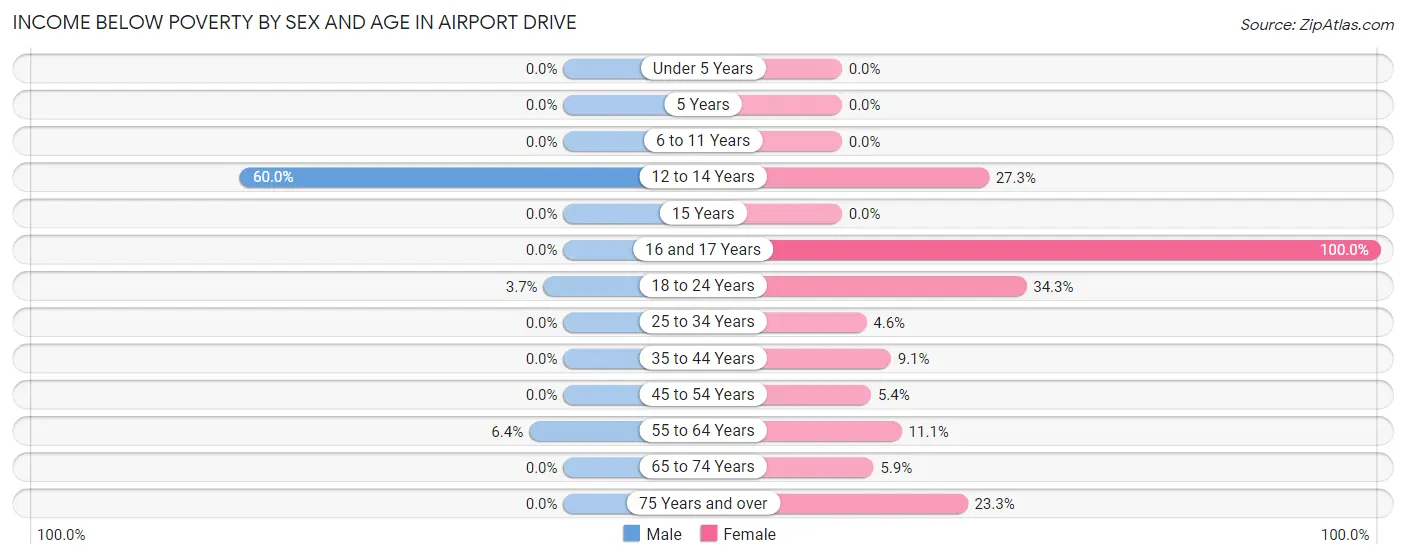
| Age Bracket | Male | Female |
| Under 5 Years | 0 (0.0%) | 0 (0.0%) |
| 5 Years | 0 (0.0%) | 0 (0.0%) |
| 6 to 11 Years | 0 (0.0%) | 0 (0.0%) |
| 12 to 14 Years | 3 (60.0%) | 3 (27.3%) |
| 15 Years | 0 (0.0%) | 0 (0.0%) |
| 16 and 17 Years | 0 (0.0%) | 4 (100.0%) |
| 18 to 24 Years | 2 (3.7%) | 25 (34.3%) |
| 25 to 34 Years | 0 (0.0%) | 2 (4.5%) |
| 35 to 44 Years | 0 (0.0%) | 3 (9.1%) |
| 45 to 54 Years | 0 (0.0%) | 2 (5.4%) |
| 55 to 64 Years | 3 (6.4%) | 6 (11.1%) |
| 65 to 74 Years | 0 (0.0%) | 2 (5.9%) |
| 75 Years and over | 0 (0.0%) | 7 (23.3%) |
| Total | 8 (2.5%) | 54 (15.5%) |
Income Above Poverty by Sex and Age in Airport Drive
According to the poverty statistics in Airport Drive, males aged under 5 years and females aged under 5 years are the age groups that are most secure financially, with 100.0% of males and 100.0% of females in these age groups living above the poverty line.
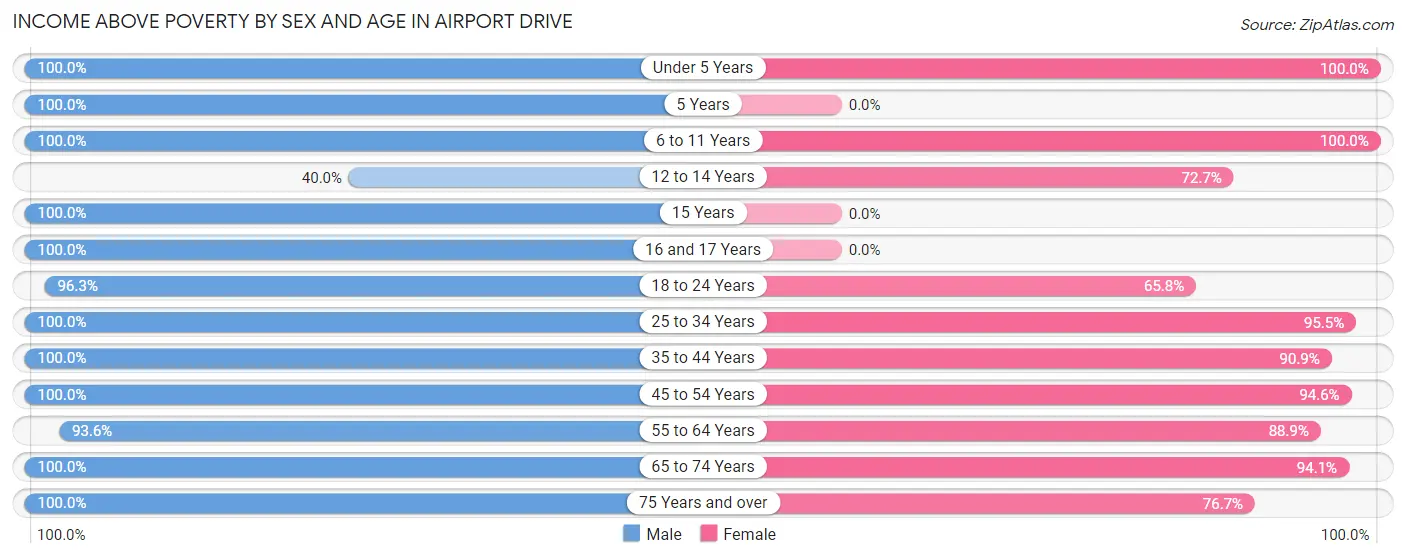
| Age Bracket | Male | Female |
| Under 5 Years | 12 (100.0%) | 16 (100.0%) |
| 5 Years | 5 (100.0%) | 0 (0.0%) |
| 6 to 11 Years | 19 (100.0%) | 13 (100.0%) |
| 12 to 14 Years | 2 (40.0%) | 8 (72.7%) |
| 15 Years | 2 (100.0%) | 0 (0.0%) |
| 16 and 17 Years | 6 (100.0%) | 0 (0.0%) |
| 18 to 24 Years | 52 (96.3%) | 48 (65.7%) |
| 25 to 34 Years | 60 (100.0%) | 42 (95.5%) |
| 35 to 44 Years | 26 (100.0%) | 30 (90.9%) |
| 45 to 54 Years | 37 (100.0%) | 35 (94.6%) |
| 55 to 64 Years | 44 (93.6%) | 48 (88.9%) |
| 65 to 74 Years | 38 (100.0%) | 32 (94.1%) |
| 75 Years and over | 15 (100.0%) | 23 (76.7%) |
| Total | 318 (97.6%) | 295 (84.5%) |
Income Below Poverty Among Married-Couple Families in Airport Drive
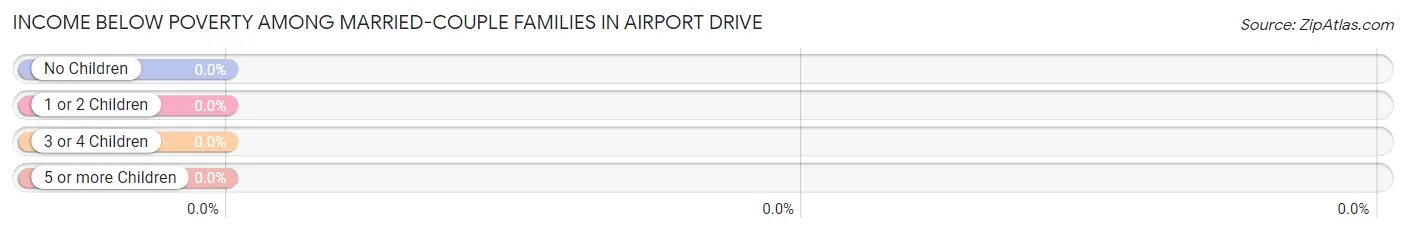
| Children | Above Poverty | Below Poverty |
| No Children | 119 (100.0%) | 0 (0.0%) |
| 1 or 2 Children | 31 (100.0%) | 0 (0.0%) |
| 3 or 4 Children | 3 (100.0%) | 0 (0.0%) |
| 5 or more Children | 0 (0.0%) | 0 (0.0%) |
| Total | 153 (100.0%) | 0 (0.0%) |
Income Below Poverty Among Single-Parent Households in Airport Drive
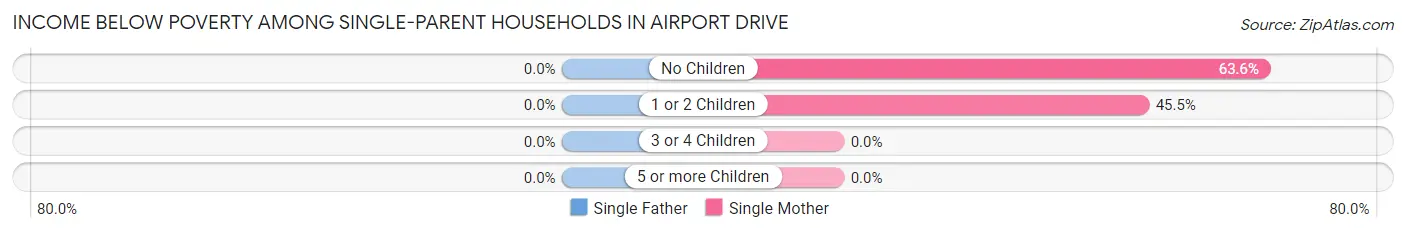
| Children | Single Father | Single Mother |
| No Children | 0 (0.0%) | 7 (63.6%) |
| 1 or 2 Children | 0 (0.0%) | 5 (45.5%) |
| 3 or 4 Children | 0 (0.0%) | 0 (0.0%) |
| 5 or more Children | 0 (0.0%) | 0 (0.0%) |
| Total | 0 (0.0%) | 12 (54.5%) |
Income Below Poverty Among Married-Couple vs Single-Parent Households in Airport Drive
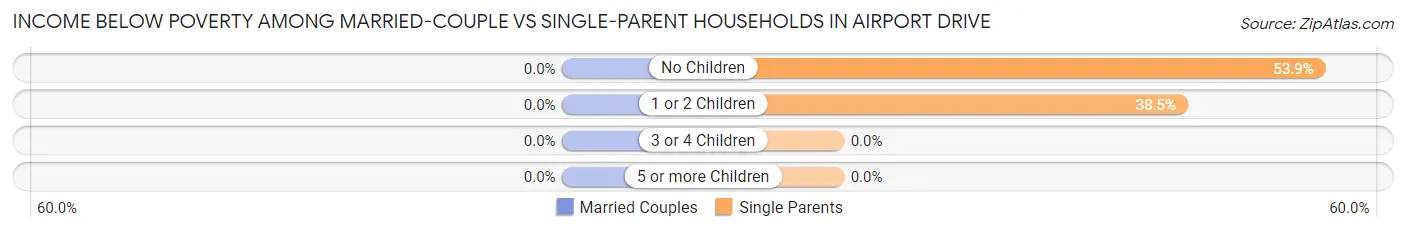
| Children | Married-Couple Families | Single-Parent Households |
| No Children | 0 (0.0%) | 7 (53.8%) |
| 1 or 2 Children | 0 (0.0%) | 5 (38.5%) |
| 3 or 4 Children | 0 (0.0%) | 0 (0.0%) |
| 5 or more Children | 0 (0.0%) | 0 (0.0%) |
| Total | 0 (0.0%) | 12 (37.5%) |
Employment Characteristics in Airport Drive
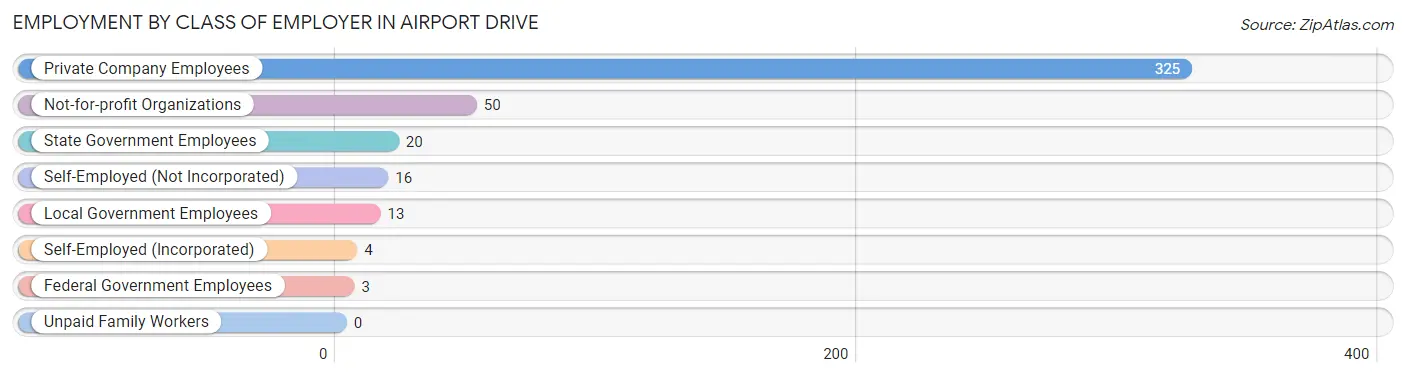
Employment by Class of Employer in Airport Drive
Among the 431 employed individuals in Airport Drive, private company employees (325 | 75.4%), not-for-profit organizations (50 | 11.6%), and state government employees (20 | 4.6%) make up the most common classes of employment.
| Employer Class | # Employees | % Employees |
| Private Company Employees | 325 | 75.4% |
| Self-Employed (Incorporated) | 4 | 0.9% |
| Self-Employed (Not Incorporated) | 16 | 3.7% |
| Not-for-profit Organizations | 50 | 11.6% |
| Local Government Employees | 13 | 3.0% |
| State Government Employees | 20 | 4.6% |
| Federal Government Employees | 3 | 0.7% |
| Unpaid Family Workers | 0 | 0.0% |
| Total | 431 | 100.0% |
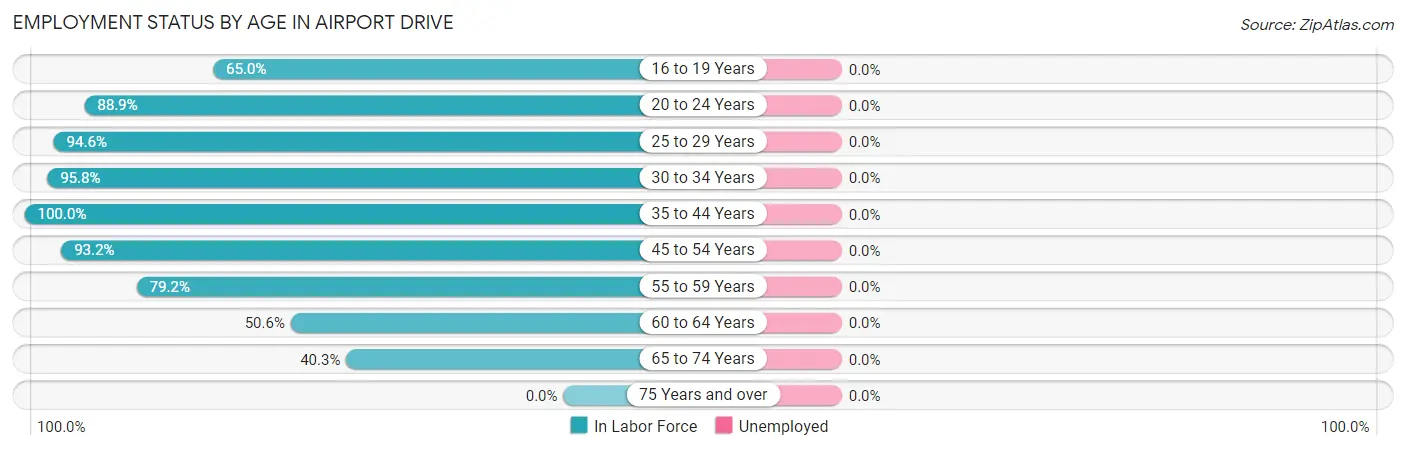
Employment Status by Age in Airport Drive
| Age Bracket | In Labor Force | Unemployed |
| 16 to 19 Years | 13 (65.0%) | 0 (0.0%) |
| 20 to 24 Years | 104 (88.9%) | 0 (0.0%) |
| 25 to 29 Years | 53 (94.6%) | 0 (0.0%) |
| 30 to 34 Years | 46 (95.8%) | 0 (0.0%) |
| 35 to 44 Years | 59 (100.0%) | 0 (0.0%) |
| 45 to 54 Years | 69 (93.2%) | 0 (0.0%) |
| 55 to 59 Years | 19 (79.2%) | 0 (0.0%) |
| 60 to 64 Years | 39 (50.6%) | 0 (0.0%) |
| 65 to 74 Years | 29 (40.3%) | 0 (0.0%) |
| 75 Years and over | 0 (0.0%) | 0 (0.0%) |
| Total | 431 (72.8%) | 0 (0.0%) |
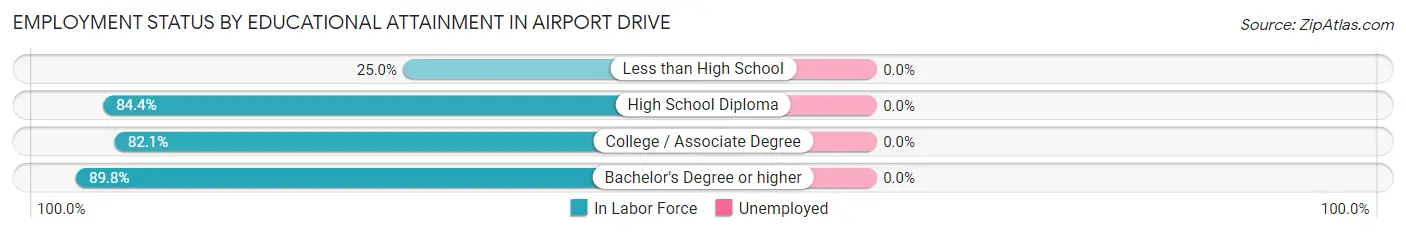
Employment Status by Educational Attainment in Airport Drive
| Educational Attainment | In Labor Force | Unemployed |
| Less than High School | 2 (25.0%) | 0 (0.0%) |
| High School Diploma | 81 (84.4%) | 0 (0.0%) |
| College / Associate Degree | 87 (82.1%) | 0 (0.0%) |
| Bachelor's Degree or higher | 115 (89.8%) | 0 (0.0%) |
| Total | 285 (84.3%) | 0 (0.0%) |
Employment Occupations by Sex in Airport Drive
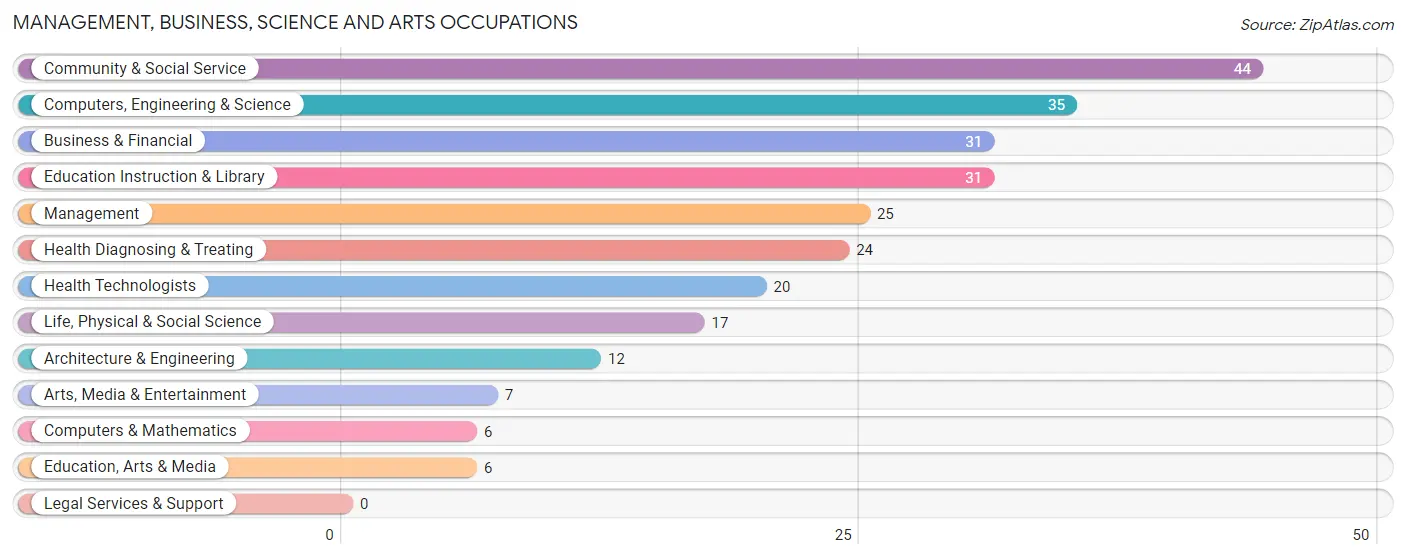
Management, Business, Science and Arts Occupations
The most common Management, Business, Science and Arts occupations in Airport Drive are Community & Social Service (44 | 10.2%), Computers, Engineering & Science (35 | 8.1%), Business & Financial (31 | 7.2%), Education Instruction & Library (31 | 7.2%), and Management (25 | 5.8%).
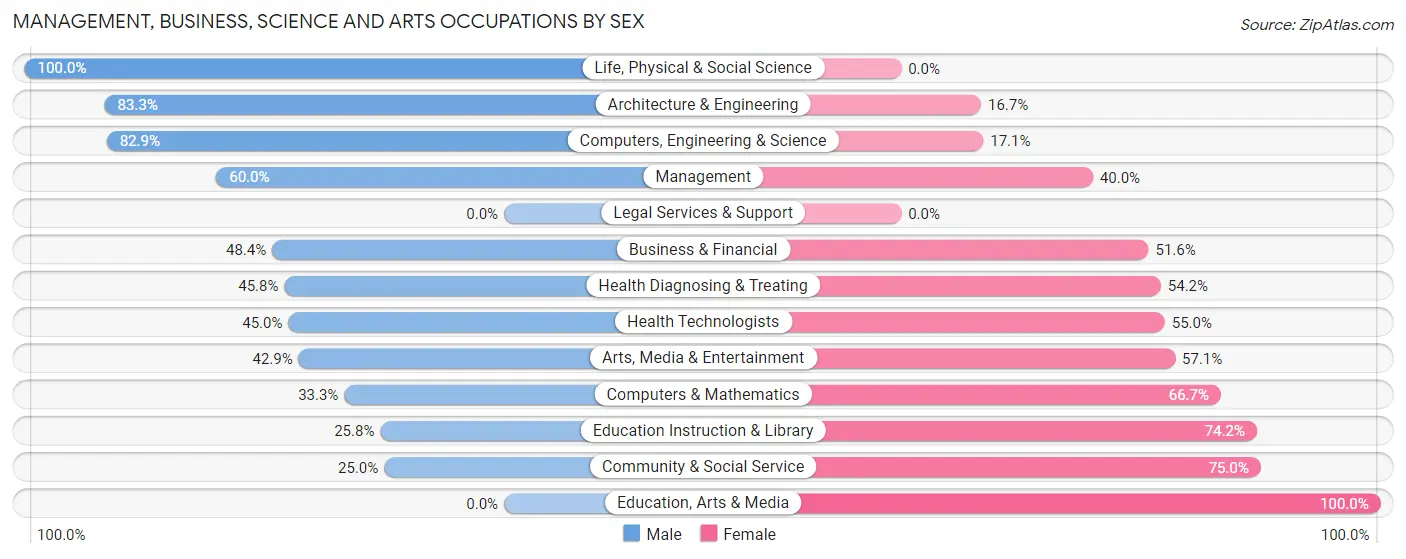
Management, Business, Science and Arts Occupations by Sex
Within the Management, Business, Science and Arts occupations in Airport Drive, the most male-oriented occupations are Life, Physical & Social Science (100.0%), Architecture & Engineering (83.3%), and Computers, Engineering & Science (82.9%), while the most female-oriented occupations are Education, Arts & Media (100.0%), Community & Social Service (75.0%), and Education Instruction & Library (74.2%).
| Occupation | Male | Female |
| Management | 15 (60.0%) | 10 (40.0%) |
| Business & Financial | 15 (48.4%) | 16 (51.6%) |
| Computers, Engineering & Science | 29 (82.9%) | 6 (17.1%) |
| Computers & Mathematics | 2 (33.3%) | 4 (66.7%) |
| Architecture & Engineering | 10 (83.3%) | 2 (16.7%) |
| Life, Physical & Social Science | 17 (100.0%) | 0 (0.0%) |
| Community & Social Service | 11 (25.0%) | 33 (75.0%) |
| Education, Arts & Media | 0 (0.0%) | 6 (100.0%) |
| Legal Services & Support | 0 (0.0%) | 0 (0.0%) |
| Education Instruction & Library | 8 (25.8%) | 23 (74.2%) |
| Arts, Media & Entertainment | 3 (42.9%) | 4 (57.1%) |
| Health Diagnosing & Treating | 11 (45.8%) | 13 (54.2%) |
| Health Technologists | 9 (45.0%) | 11 (55.0%) |
| Total (Category) | 81 (50.9%) | 78 (49.1%) |
| Total (Overall) | 224 (52.0%) | 207 (48.0%) |
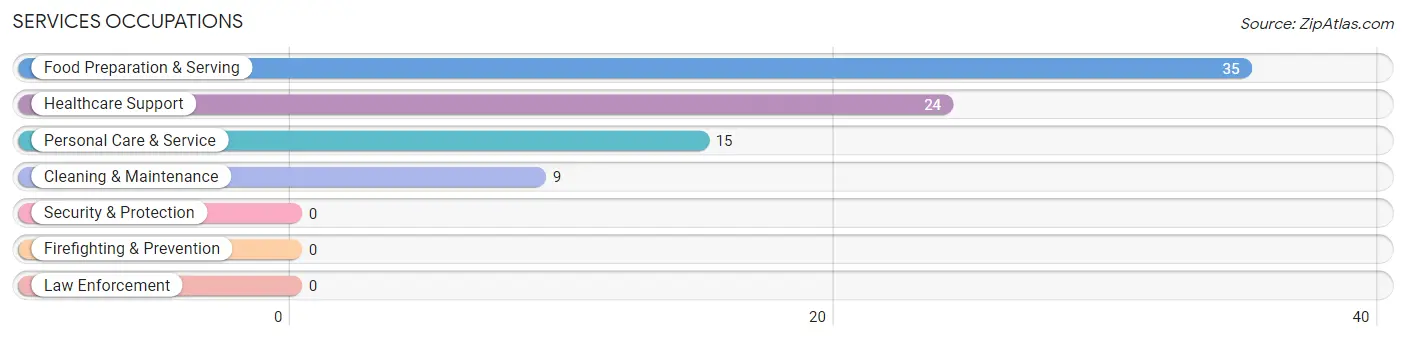
Services Occupations
The most common Services occupations in Airport Drive are Food Preparation & Serving (35 | 8.1%), Healthcare Support (24 | 5.6%), Personal Care & Service (15 | 3.5%), and Cleaning & Maintenance (9 | 2.1%).
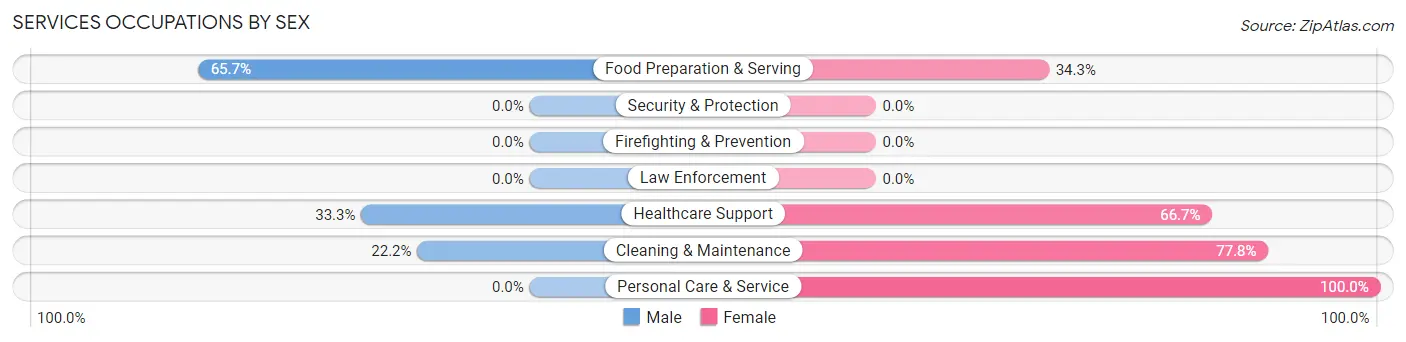
Services Occupations by Sex
Within the Services occupations in Airport Drive, the most male-oriented occupations are Food Preparation & Serving (65.7%), Healthcare Support (33.3%), and Cleaning & Maintenance (22.2%), while the most female-oriented occupations are Personal Care & Service (100.0%), Cleaning & Maintenance (77.8%), and Healthcare Support (66.7%).
| Occupation | Male | Female |
| Healthcare Support | 8 (33.3%) | 16 (66.7%) |
| Security & Protection | 0 (0.0%) | 0 (0.0%) |
| Firefighting & Prevention | 0 (0.0%) | 0 (0.0%) |
| Law Enforcement | 0 (0.0%) | 0 (0.0%) |
| Food Preparation & Serving | 23 (65.7%) | 12 (34.3%) |
| Cleaning & Maintenance | 2 (22.2%) | 7 (77.8%) |
| Personal Care & Service | 0 (0.0%) | 15 (100.0%) |
| Total (Category) | 33 (39.8%) | 50 (60.2%) |
| Total (Overall) | 224 (52.0%) | 207 (48.0%) |
Sales and Office Occupations
The most common Sales and Office occupations in Airport Drive are Office & Administration (51 | 11.8%), and Sales & Related (38 | 8.8%).
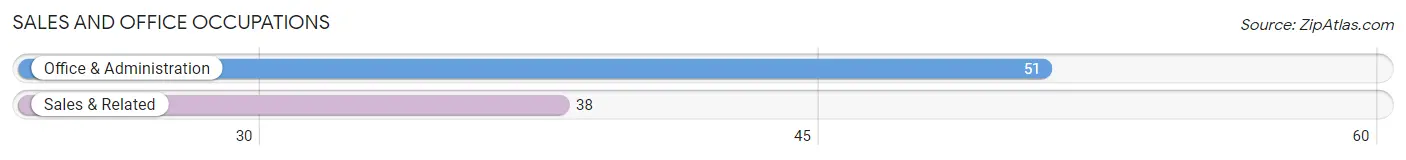
Sales and Office Occupations by Sex
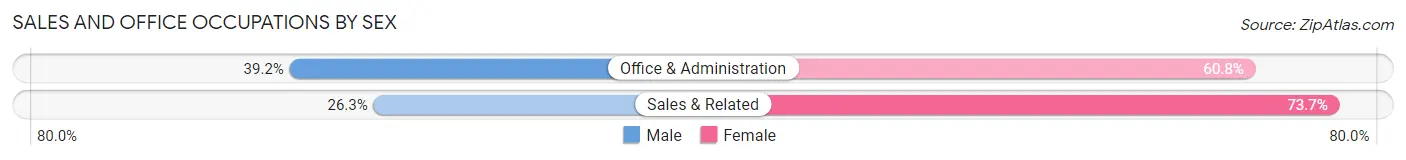
| Occupation | Male | Female |
| Sales & Related | 10 (26.3%) | 28 (73.7%) |
| Office & Administration | 20 (39.2%) | 31 (60.8%) |
| Total (Category) | 30 (33.7%) | 59 (66.3%) |
| Total (Overall) | 224 (52.0%) | 207 (48.0%) |
Natural Resources, Construction and Maintenance Occupations
The most common Natural Resources, Construction and Maintenance occupations in Airport Drive are Construction & Extraction (9 | 2.1%), and Installation, Maintenance & Repair (4 | 0.9%).
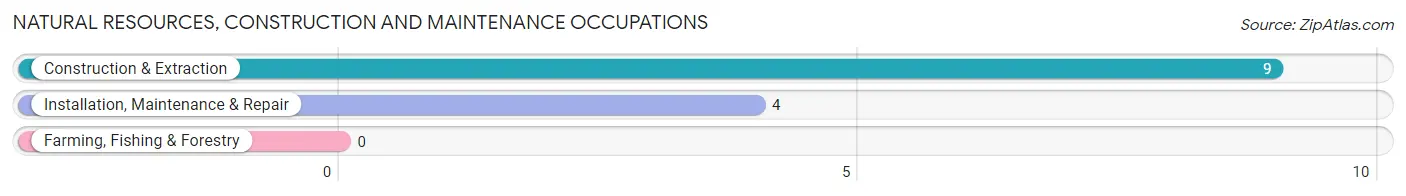
Natural Resources, Construction and Maintenance Occupations by Sex

| Occupation | Male | Female |
| Farming, Fishing & Forestry | 0 (0.0%) | 0 (0.0%) |
| Construction & Extraction | 9 (100.0%) | 0 (0.0%) |
| Installation, Maintenance & Repair | 4 (100.0%) | 0 (0.0%) |
| Total (Category) | 13 (100.0%) | 0 (0.0%) |
| Total (Overall) | 224 (52.0%) | 207 (48.0%) |
Production, Transportation and Moving Occupations
The most common Production, Transportation and Moving occupations in Airport Drive are Production (41 | 9.5%), Transportation (27 | 6.3%), and Material Moving (19 | 4.4%).
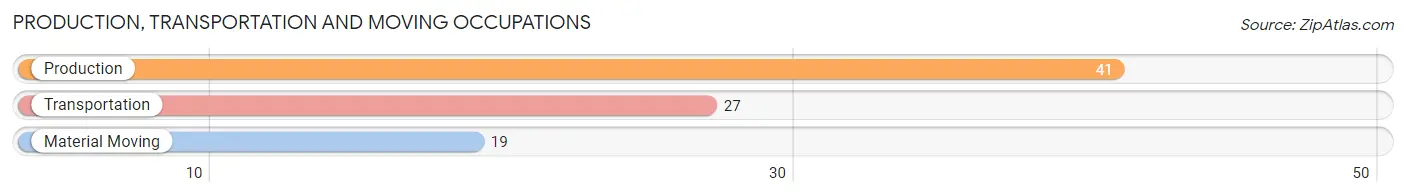
Production, Transportation and Moving Occupations by Sex
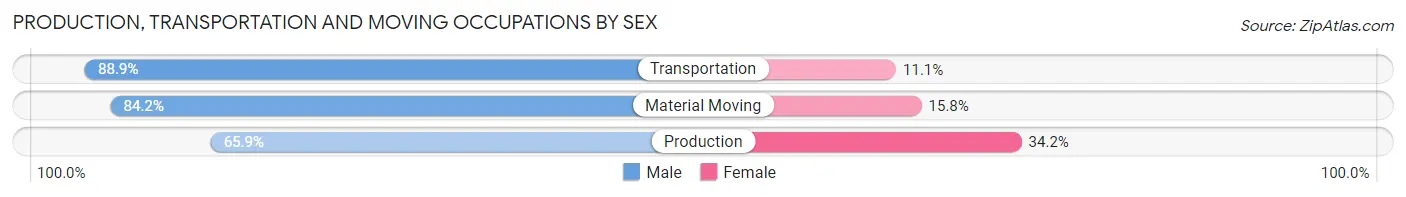
| Occupation | Male | Female |
| Production | 27 (65.8%) | 14 (34.2%) |
| Transportation | 24 (88.9%) | 3 (11.1%) |
| Material Moving | 16 (84.2%) | 3 (15.8%) |
| Total (Category) | 67 (77.0%) | 20 (23.0%) |
| Total (Overall) | 224 (52.0%) | 207 (48.0%) |
Employment Industries by Sex in Airport Drive
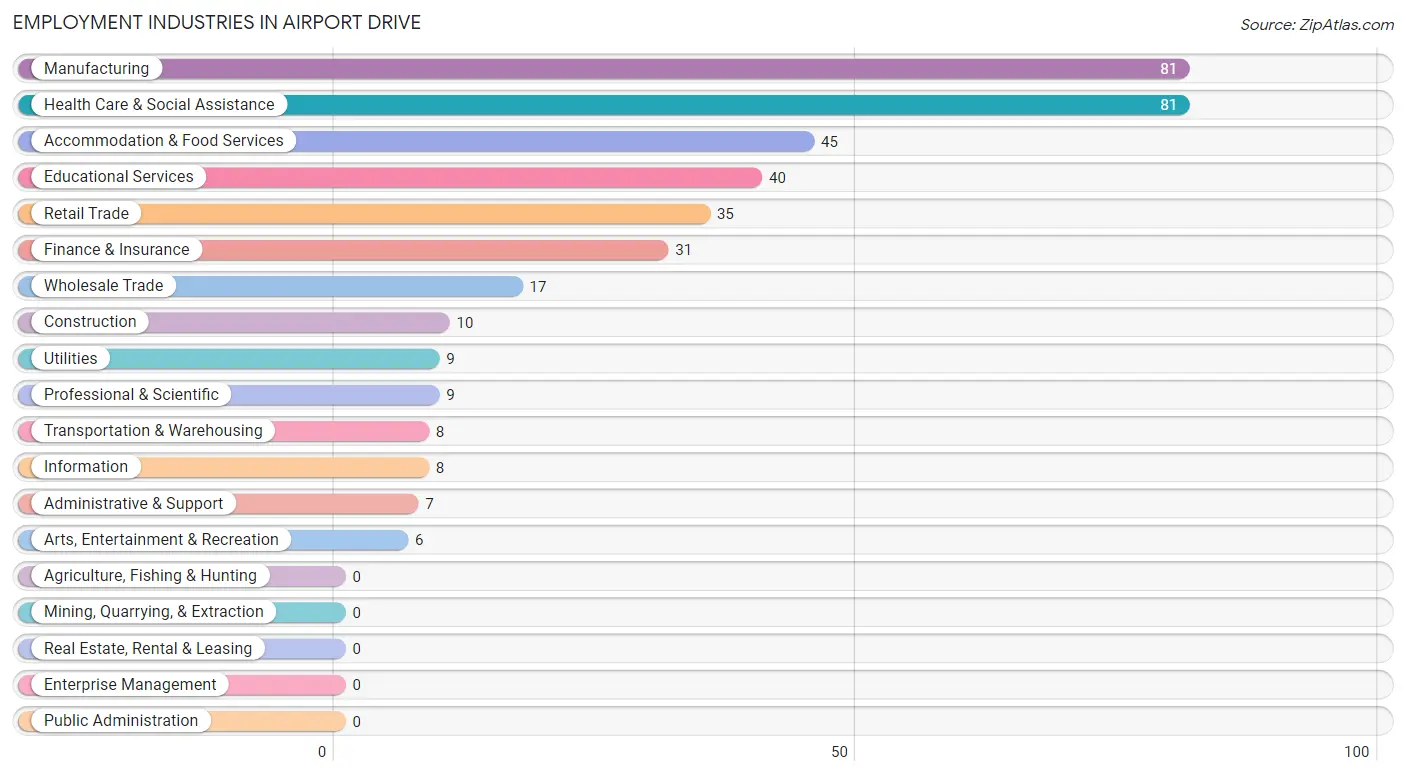
Employment Industries in Airport Drive
The major employment industries in Airport Drive include Manufacturing (81 | 18.8%), Health Care & Social Assistance (81 | 18.8%), Accommodation & Food Services (45 | 10.4%), Educational Services (40 | 9.3%), and Retail Trade (35 | 8.1%).
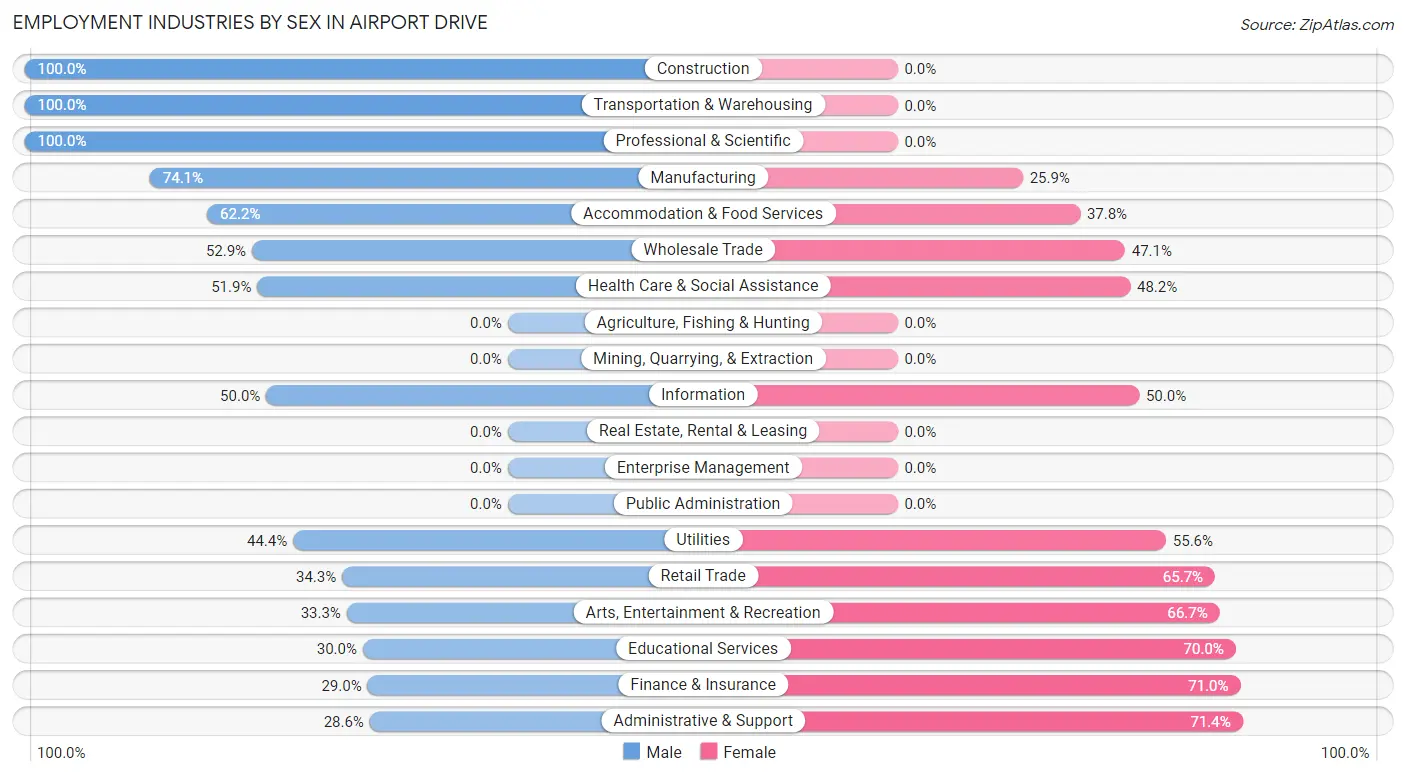
Employment Industries by Sex in Airport Drive
The Airport Drive industries that see more men than women are Construction (100.0%), Transportation & Warehousing (100.0%), and Professional & Scientific (100.0%), whereas the industries that tend to have a higher number of women are Administrative & Support (71.4%), Finance & Insurance (71.0%), and Educational Services (70.0%).
| Industry | Male | Female |
| Agriculture, Fishing & Hunting | 0 (0.0%) | 0 (0.0%) |
| Mining, Quarrying, & Extraction | 0 (0.0%) | 0 (0.0%) |
| Construction | 10 (100.0%) | 0 (0.0%) |
| Manufacturing | 60 (74.1%) | 21 (25.9%) |
| Wholesale Trade | 9 (52.9%) | 8 (47.1%) |
| Retail Trade | 12 (34.3%) | 23 (65.7%) |
| Transportation & Warehousing | 8 (100.0%) | 0 (0.0%) |
| Utilities | 4 (44.4%) | 5 (55.6%) |
| Information | 4 (50.0%) | 4 (50.0%) |
| Finance & Insurance | 9 (29.0%) | 22 (71.0%) |
| Real Estate, Rental & Leasing | 0 (0.0%) | 0 (0.0%) |
| Professional & Scientific | 9 (100.0%) | 0 (0.0%) |
| Enterprise Management | 0 (0.0%) | 0 (0.0%) |
| Administrative & Support | 2 (28.6%) | 5 (71.4%) |
| Educational Services | 12 (30.0%) | 28 (70.0%) |
| Health Care & Social Assistance | 42 (51.8%) | 39 (48.1%) |
| Arts, Entertainment & Recreation | 2 (33.3%) | 4 (66.7%) |
| Accommodation & Food Services | 28 (62.2%) | 17 (37.8%) |
| Public Administration | 0 (0.0%) | 0 (0.0%) |
| Total | 224 (52.0%) | 207 (48.0%) |
Education in Airport Drive
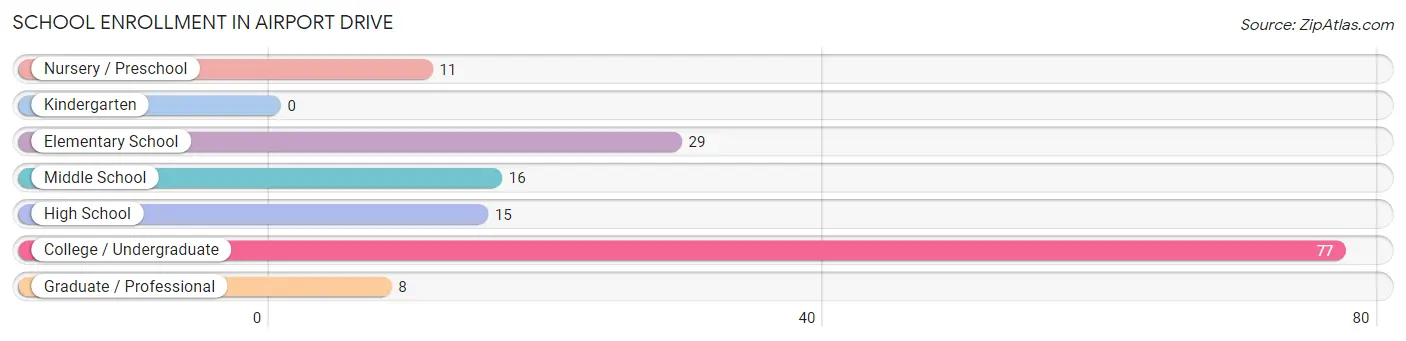
School Enrollment in Airport Drive
The most common levels of schooling among the 156 students in Airport Drive are college / undergraduate (77 | 49.4%), elementary school (29 | 18.6%), and middle school (16 | 10.3%).
| School Level | # Students | % Students |
| Nursery / Preschool | 11 | 7.0% |
| Kindergarten | 0 | 0.0% |
| Elementary School | 29 | 18.6% |
| Middle School | 16 | 10.3% |
| High School | 15 | 9.6% |
| College / Undergraduate | 77 | 49.4% |
| Graduate / Professional | 8 | 5.1% |
| Total | 156 | 100.0% |
School Enrollment by Age by Funding Source in Airport Drive
Out of a total of 156 students who are enrolled in schools in Airport Drive, 29 (18.6%) attend a private institution, while the remaining 127 (81.4%) are enrolled in public schools. The age group of 35 years and over has the highest likelihood of being enrolled in private schools, with 3 (75.0% in the age bracket) enrolled. Conversely, the age group of 10 to 14 year olds has the lowest likelihood of being enrolled in a private school, with 24 (100.0% in the age bracket) attending a public institution.
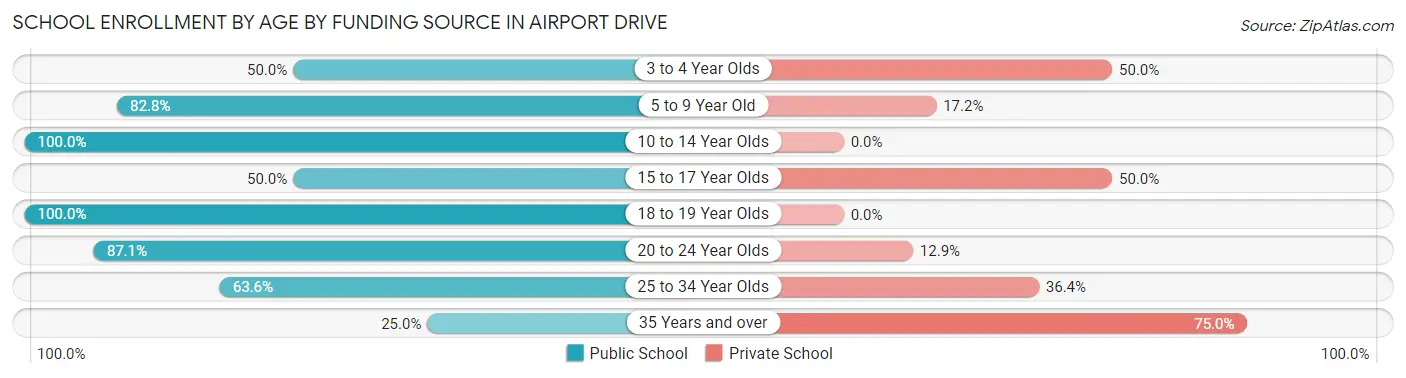
| Age Bracket | Public School | Private School |
| 3 to 4 Year Olds | 3 (50.0%) | 3 (50.0%) |
| 5 to 9 Year Old | 24 (82.8%) | 5 (17.2%) |
| 10 to 14 Year Olds | 24 (100.0%) | 0 (0.0%) |
| 15 to 17 Year Olds | 6 (50.0%) | 6 (50.0%) |
| 18 to 19 Year Olds | 8 (100.0%) | 0 (0.0%) |
| 20 to 24 Year Olds | 54 (87.1%) | 8 (12.9%) |
| 25 to 34 Year Olds | 7 (63.6%) | 4 (36.4%) |
| 35 Years and over | 1 (25.0%) | 3 (75.0%) |
| Total | 127 (81.4%) | 29 (18.6%) |
Educational Attainment by Field of Study in Airport Drive
Science & technology (33 | 19.1%), education (31 | 17.9%), liberal arts & history (28 | 16.2%), business (22 | 12.7%), and engineering (21 | 12.1%) are the most common fields of study among 173 individuals in Airport Drive who have obtained a bachelor's degree or higher.
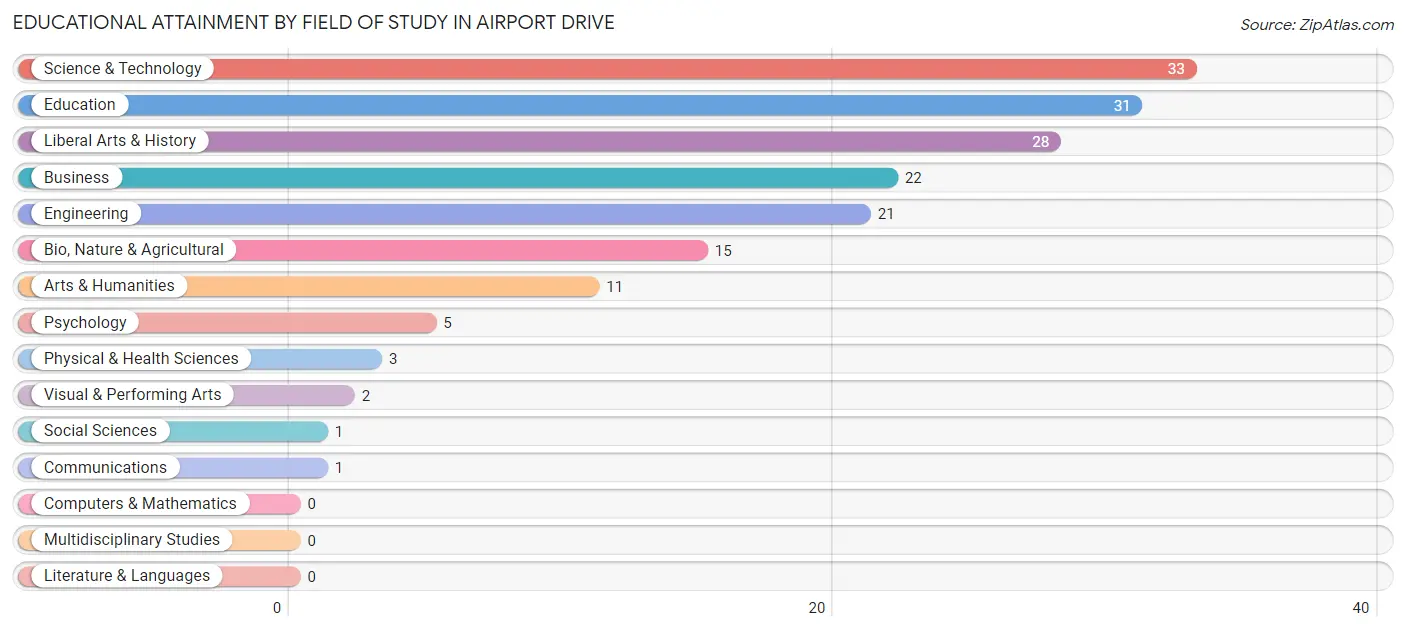
| Field of Study | # Graduates | % Graduates |
| Computers & Mathematics | 0 | 0.0% |
| Bio, Nature & Agricultural | 15 | 8.7% |
| Physical & Health Sciences | 3 | 1.7% |
| Psychology | 5 | 2.9% |
| Social Sciences | 1 | 0.6% |
| Engineering | 21 | 12.1% |
| Multidisciplinary Studies | 0 | 0.0% |
| Science & Technology | 33 | 19.1% |
| Business | 22 | 12.7% |
| Education | 31 | 17.9% |
| Literature & Languages | 0 | 0.0% |
| Liberal Arts & History | 28 | 16.2% |
| Visual & Performing Arts | 2 | 1.2% |
| Communications | 1 | 0.6% |
| Arts & Humanities | 11 | 6.4% |
| Total | 173 | 100.0% |
Transportation & Commute in Airport Drive
Vehicle Availability by Sex in Airport Drive
The most prevalent vehicle ownership categories in Airport Drive are males with 2 vehicles (105, accounting for 46.9%) and females with 2 vehicles (99, making up 50.7%).
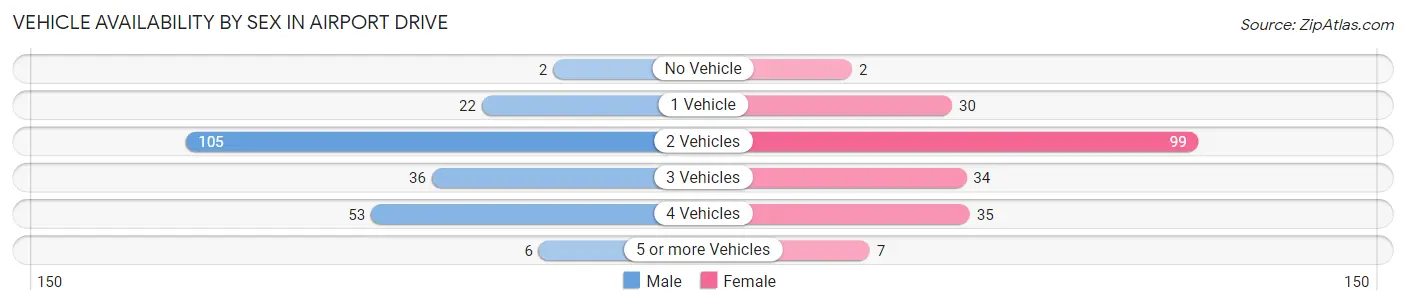
| Vehicles Available | Male | Female |
| No Vehicle | 2 (0.9%) | 2 (1.0%) |
| 1 Vehicle | 22 (9.8%) | 30 (14.5%) |
| 2 Vehicles | 105 (46.9%) | 99 (47.8%) |
| 3 Vehicles | 36 (16.1%) | 34 (16.4%) |
| 4 Vehicles | 53 (23.7%) | 35 (16.9%) |
| 5 or more Vehicles | 6 (2.7%) | 7 (3.4%) |
| Total | 224 (100.0%) | 207 (100.0%) |
Commute Time in Airport Drive
The most frequently occuring commute durations in Airport Drive are 15 to 19 minutes (130 commuters, 31.1%), 10 to 14 minutes (109 commuters, 26.1%), and 20 to 24 minutes (63 commuters, 15.1%).
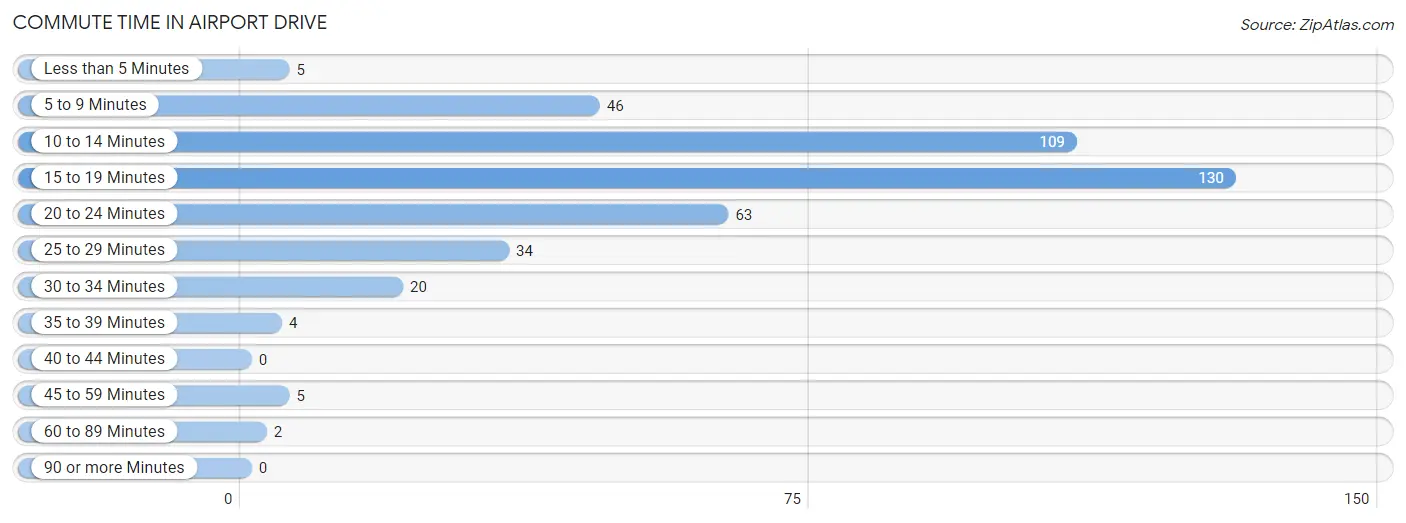
| Commute Time | # Commuters | % Commuters |
| Less than 5 Minutes | 5 | 1.2% |
| 5 to 9 Minutes | 46 | 11.0% |
| 10 to 14 Minutes | 109 | 26.1% |
| 15 to 19 Minutes | 130 | 31.1% |
| 20 to 24 Minutes | 63 | 15.1% |
| 25 to 29 Minutes | 34 | 8.1% |
| 30 to 34 Minutes | 20 | 4.8% |
| 35 to 39 Minutes | 4 | 1.0% |
| 40 to 44 Minutes | 0 | 0.0% |
| 45 to 59 Minutes | 5 | 1.2% |
| 60 to 89 Minutes | 2 | 0.5% |
| 90 or more Minutes | 0 | 0.0% |
Commute Time by Sex in Airport Drive
The most common commute times in Airport Drive are 15 to 19 minutes (72 commuters, 33.2%) for males and 10 to 14 minutes (60 commuters, 29.8%) for females.
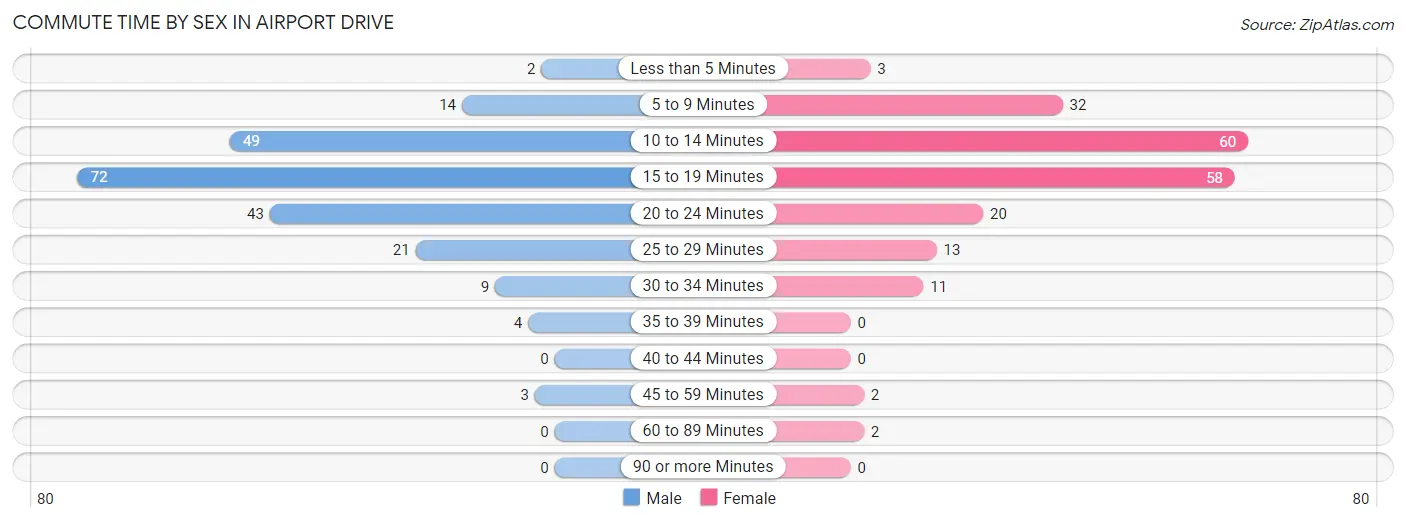
| Commute Time | Male | Female |
| Less than 5 Minutes | 2 (0.9%) | 3 (1.5%) |
| 5 to 9 Minutes | 14 (6.5%) | 32 (15.9%) |
| 10 to 14 Minutes | 49 (22.6%) | 60 (29.8%) |
| 15 to 19 Minutes | 72 (33.2%) | 58 (28.9%) |
| 20 to 24 Minutes | 43 (19.8%) | 20 (10.0%) |
| 25 to 29 Minutes | 21 (9.7%) | 13 (6.5%) |
| 30 to 34 Minutes | 9 (4.2%) | 11 (5.5%) |
| 35 to 39 Minutes | 4 (1.8%) | 0 (0.0%) |
| 40 to 44 Minutes | 0 (0.0%) | 0 (0.0%) |
| 45 to 59 Minutes | 3 (1.4%) | 2 (1.0%) |
| 60 to 89 Minutes | 0 (0.0%) | 2 (1.0%) |
| 90 or more Minutes | 0 (0.0%) | 0 (0.0%) |
Time of Departure to Work by Sex in Airport Drive
The most frequent times of departure to work in Airport Drive are 7:30 AM to 7:59 AM (55, 25.4%) for males and 6:30 AM to 6:59 AM (48, 23.9%) for females.
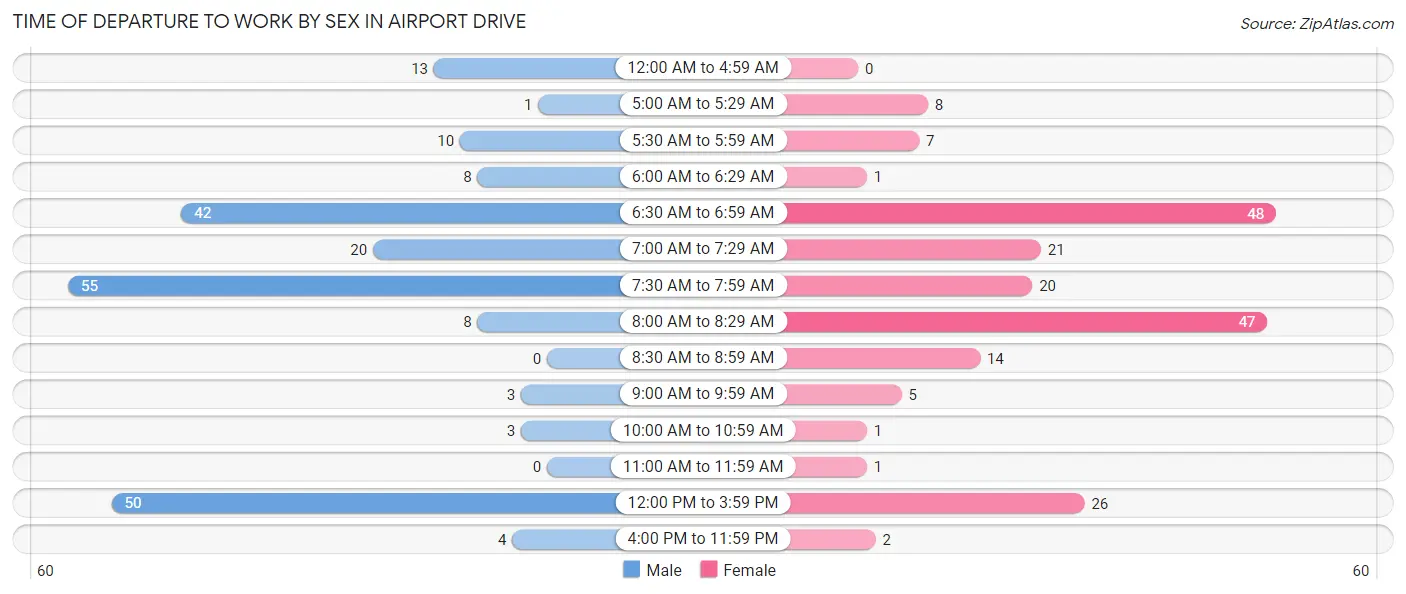
| Time of Departure | Male | Female |
| 12:00 AM to 4:59 AM | 13 (6.0%) | 0 (0.0%) |
| 5:00 AM to 5:29 AM | 1 (0.5%) | 8 (4.0%) |
| 5:30 AM to 5:59 AM | 10 (4.6%) | 7 (3.5%) |
| 6:00 AM to 6:29 AM | 8 (3.7%) | 1 (0.5%) |
| 6:30 AM to 6:59 AM | 42 (19.4%) | 48 (23.9%) |
| 7:00 AM to 7:29 AM | 20 (9.2%) | 21 (10.4%) |
| 7:30 AM to 7:59 AM | 55 (25.4%) | 20 (10.0%) |
| 8:00 AM to 8:29 AM | 8 (3.7%) | 47 (23.4%) |
| 8:30 AM to 8:59 AM | 0 (0.0%) | 14 (7.0%) |
| 9:00 AM to 9:59 AM | 3 (1.4%) | 5 (2.5%) |
| 10:00 AM to 10:59 AM | 3 (1.4%) | 1 (0.5%) |
| 11:00 AM to 11:59 AM | 0 (0.0%) | 1 (0.5%) |
| 12:00 PM to 3:59 PM | 50 (23.0%) | 26 (12.9%) |
| 4:00 PM to 11:59 PM | 4 (1.8%) | 2 (1.0%) |
| Total | 217 (100.0%) | 201 (100.0%) |
Housing Occupancy in Airport Drive
Occupancy by Ownership in Airport Drive
Of the total 310 dwellings in Airport Drive, owner-occupied units account for 221 (71.3%), while renter-occupied units make up 89 (28.7%).
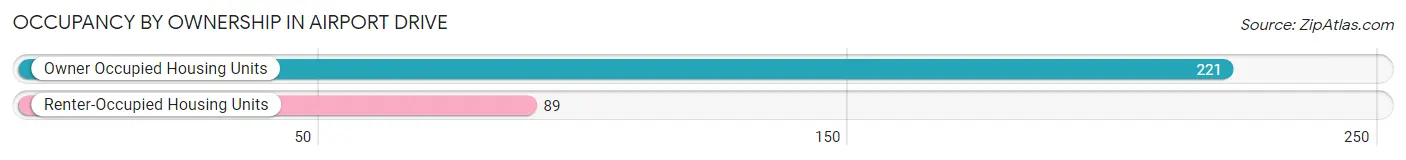
| Occupancy | # Housing Units | % Housing Units |
| Owner Occupied Housing Units | 221 | 71.3% |
| Renter-Occupied Housing Units | 89 | 28.7% |
| Total Occupied Housing Units | 310 | 100.0% |
Occupancy by Household Size in Airport Drive
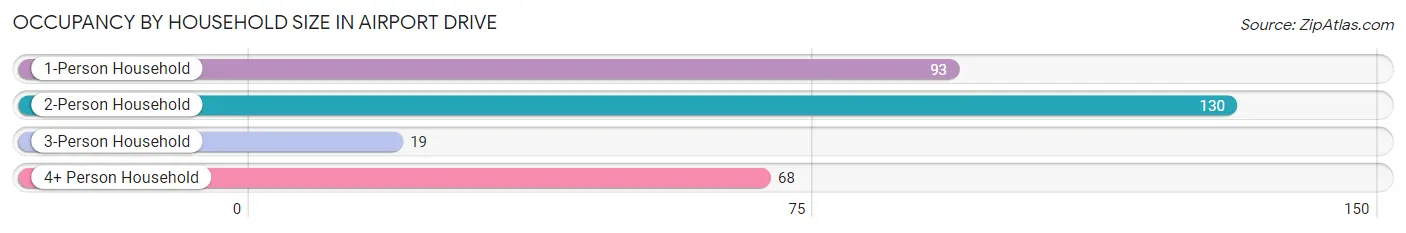
| Household Size | # Housing Units | % Housing Units |
| 1-Person Household | 93 | 30.0% |
| 2-Person Household | 130 | 41.9% |
| 3-Person Household | 19 | 6.1% |
| 4+ Person Household | 68 | 21.9% |
| Total Housing Units | 310 | 100.0% |
Occupancy by Ownership by Household Size in Airport Drive
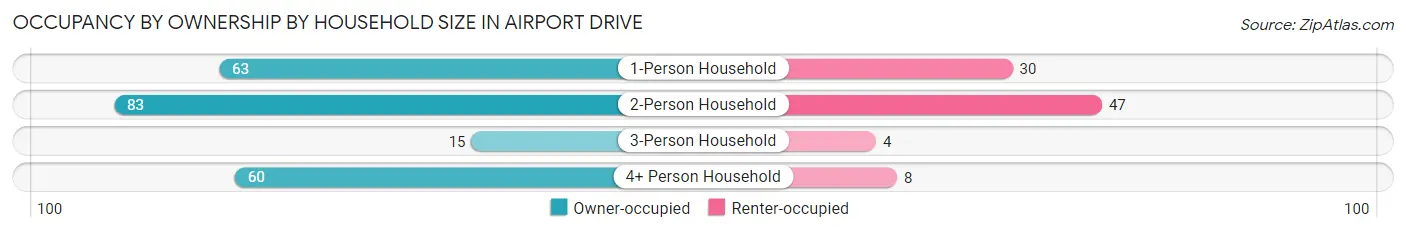
| Household Size | Owner-occupied | Renter-occupied |
| 1-Person Household | 63 (67.7%) | 30 (32.3%) |
| 2-Person Household | 83 (63.8%) | 47 (36.1%) |
| 3-Person Household | 15 (78.9%) | 4 (21.0%) |
| 4+ Person Household | 60 (88.2%) | 8 (11.8%) |
| Total Housing Units | 221 (71.3%) | 89 (28.7%) |
Occupancy by Educational Attainment in Airport Drive
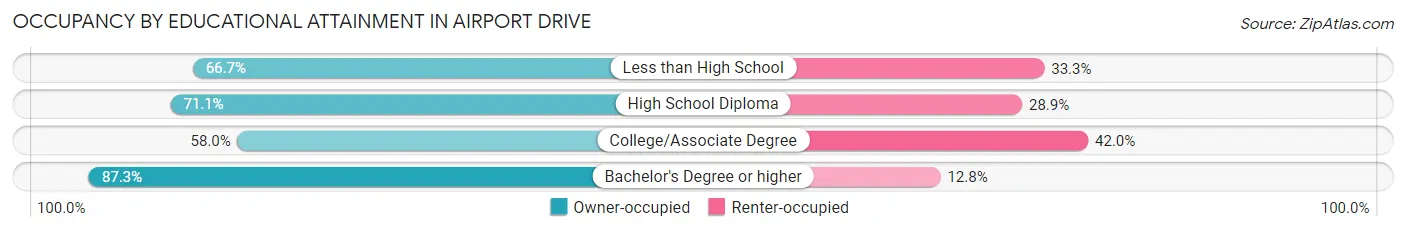
| Household Size | Owner-occupied | Renter-occupied |
| Less than High School | 4 (66.7%) | 2 (33.3%) |
| High School Diploma | 59 (71.1%) | 24 (28.9%) |
| College/Associate Degree | 69 (58.0%) | 50 (42.0%) |
| Bachelor's Degree or higher | 89 (87.3%) | 13 (12.8%) |
Occupancy by Age of Householder in Airport Drive
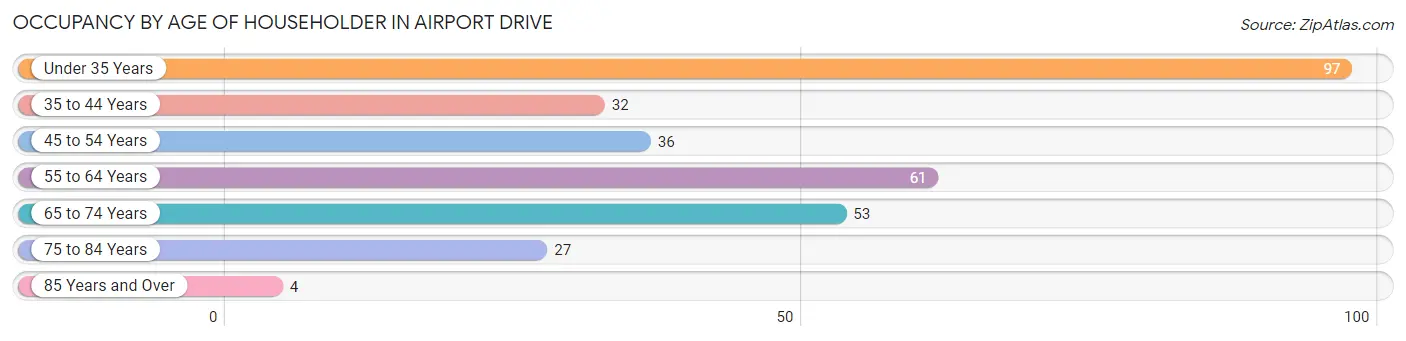
| Age Bracket | # Households | % Households |
| Under 35 Years | 97 | 31.3% |
| 35 to 44 Years | 32 | 10.3% |
| 45 to 54 Years | 36 | 11.6% |
| 55 to 64 Years | 61 | 19.7% |
| 65 to 74 Years | 53 | 17.1% |
| 75 to 84 Years | 27 | 8.7% |
| 85 Years and Over | 4 | 1.3% |
| Total | 310 | 100.0% |
Housing Finances in Airport Drive
Median Income by Occupancy in Airport Drive
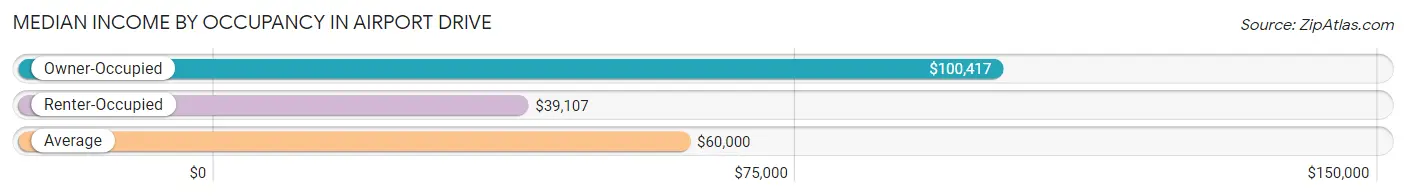
| Occupancy Type | # Households | Median Income |
| Owner-Occupied | 221 (71.3%) | $100,417 |
| Renter-Occupied | 89 (28.7%) | $39,107 |
| Average | 310 (100.0%) | $60,000 |
Occupancy by Householder Income Bracket in Airport Drive
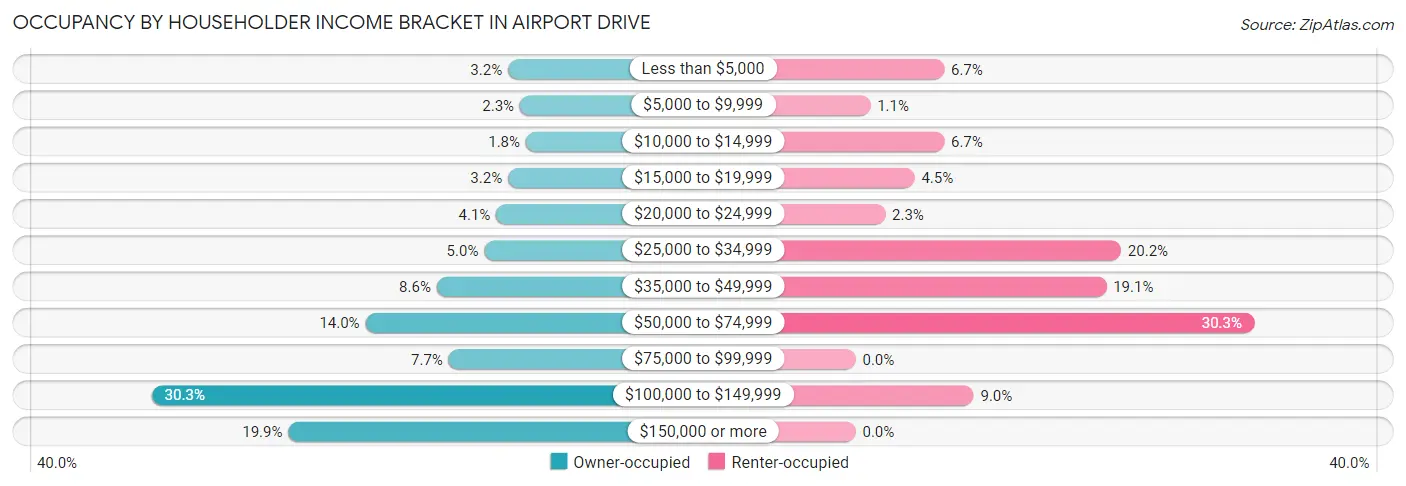
| Income Bracket | Owner-occupied | Renter-occupied |
| Less than $5,000 | 7 (3.2%) | 6 (6.7%) |
| $5,000 to $9,999 | 5 (2.3%) | 1 (1.1%) |
| $10,000 to $14,999 | 4 (1.8%) | 6 (6.7%) |
| $15,000 to $19,999 | 7 (3.2%) | 4 (4.5%) |
| $20,000 to $24,999 | 9 (4.1%) | 2 (2.2%) |
| $25,000 to $34,999 | 11 (5.0%) | 18 (20.2%) |
| $35,000 to $49,999 | 19 (8.6%) | 17 (19.1%) |
| $50,000 to $74,999 | 31 (14.0%) | 27 (30.3%) |
| $75,000 to $99,999 | 17 (7.7%) | 0 (0.0%) |
| $100,000 to $149,999 | 67 (30.3%) | 8 (9.0%) |
| $150,000 or more | 44 (19.9%) | 0 (0.0%) |
| Total | 221 (100.0%) | 89 (100.0%) |
Monthly Housing Cost Tiers in Airport Drive
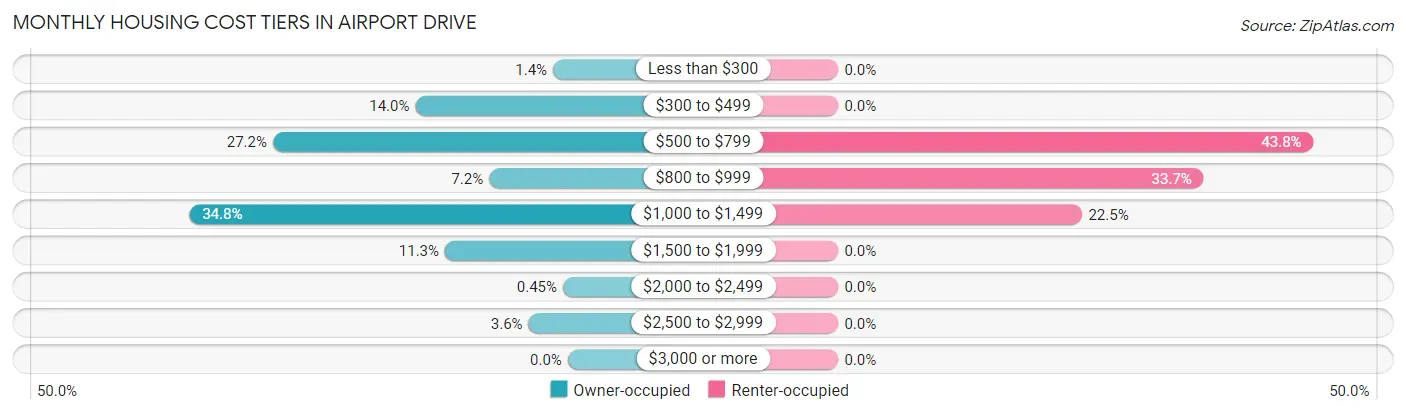
| Monthly Cost | Owner-occupied | Renter-occupied |
| Less than $300 | 3 (1.4%) | 0 (0.0%) |
| $300 to $499 | 31 (14.0%) | 0 (0.0%) |
| $500 to $799 | 60 (27.2%) | 39 (43.8%) |
| $800 to $999 | 16 (7.2%) | 30 (33.7%) |
| $1,000 to $1,499 | 77 (34.8%) | 20 (22.5%) |
| $1,500 to $1,999 | 25 (11.3%) | 0 (0.0%) |
| $2,000 to $2,499 | 1 (0.4%) | 0 (0.0%) |
| $2,500 to $2,999 | 8 (3.6%) | 0 (0.0%) |
| $3,000 or more | 0 (0.0%) | 0 (0.0%) |
| Total | 221 (100.0%) | 89 (100.0%) |
Physical Housing Characteristics in Airport Drive
Housing Structures in Airport Drive
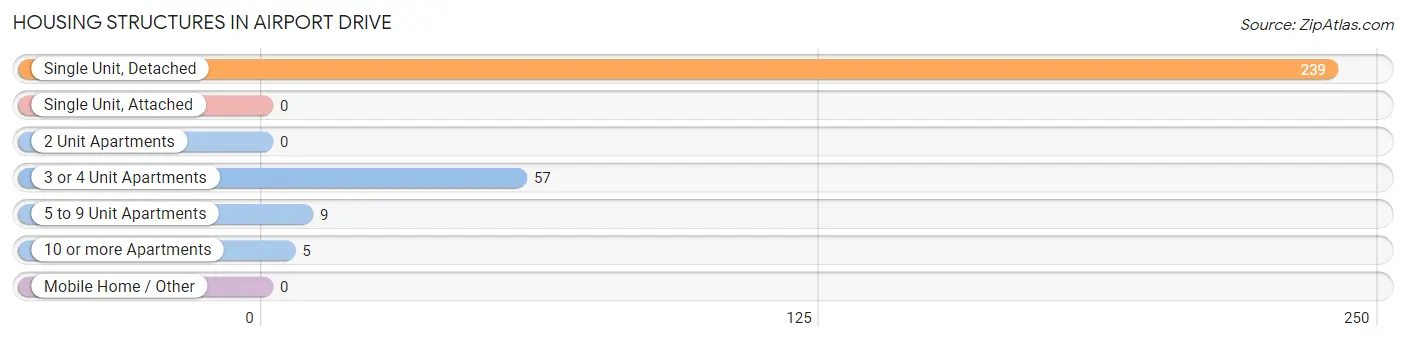
| Structure Type | # Housing Units | % Housing Units |
| Single Unit, Detached | 239 | 77.1% |
| Single Unit, Attached | 0 | 0.0% |
| 2 Unit Apartments | 0 | 0.0% |
| 3 or 4 Unit Apartments | 57 | 18.4% |
| 5 to 9 Unit Apartments | 9 | 2.9% |
| 10 or more Apartments | 5 | 1.6% |
| Mobile Home / Other | 0 | 0.0% |
| Total | 310 | 100.0% |
Housing Structures by Occupancy in Airport Drive
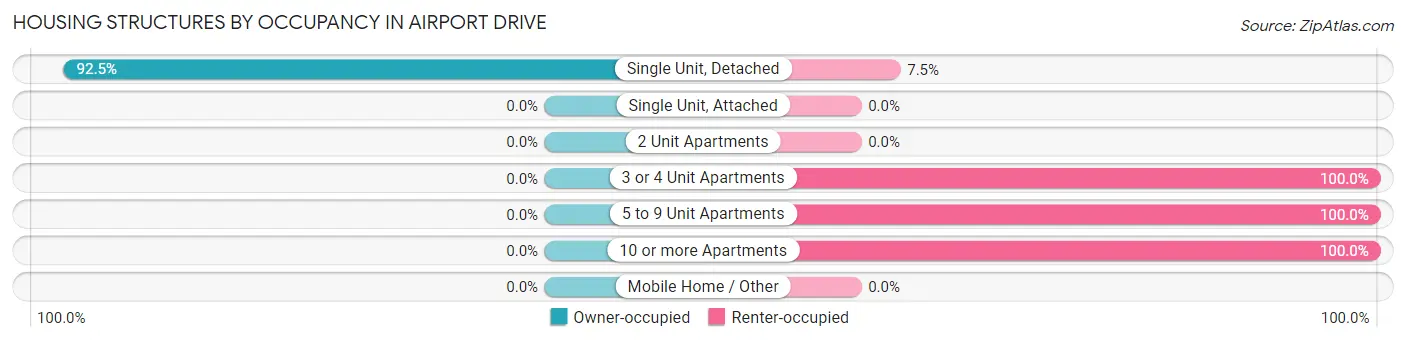
| Structure Type | Owner-occupied | Renter-occupied |
| Single Unit, Detached | 221 (92.5%) | 18 (7.5%) |
| Single Unit, Attached | 0 (0.0%) | 0 (0.0%) |
| 2 Unit Apartments | 0 (0.0%) | 0 (0.0%) |
| 3 or 4 Unit Apartments | 0 (0.0%) | 57 (100.0%) |
| 5 to 9 Unit Apartments | 0 (0.0%) | 9 (100.0%) |
| 10 or more Apartments | 0 (0.0%) | 5 (100.0%) |
| Mobile Home / Other | 0 (0.0%) | 0 (0.0%) |
| Total | 221 (71.3%) | 89 (28.7%) |
Housing Structures by Number of Rooms in Airport Drive
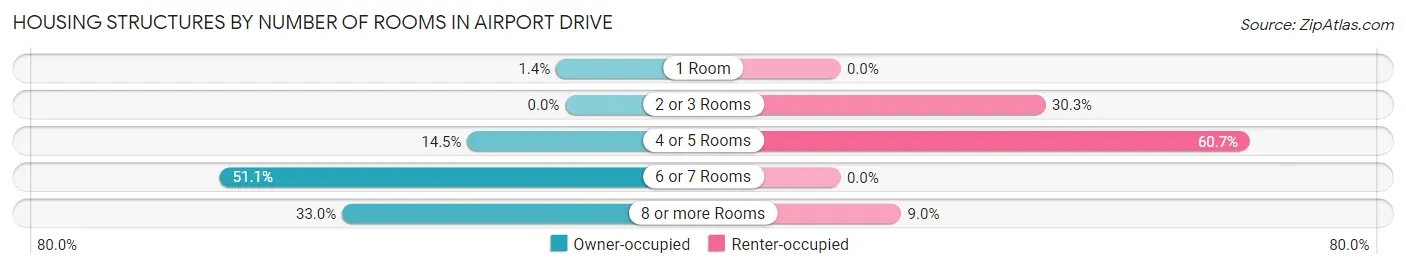
| Number of Rooms | Owner-occupied | Renter-occupied |
| 1 Room | 3 (1.4%) | 0 (0.0%) |
| 2 or 3 Rooms | 0 (0.0%) | 27 (30.3%) |
| 4 or 5 Rooms | 32 (14.5%) | 54 (60.7%) |
| 6 or 7 Rooms | 113 (51.1%) | 0 (0.0%) |
| 8 or more Rooms | 73 (33.0%) | 8 (9.0%) |
| Total | 221 (100.0%) | 89 (100.0%) |
Housing Structure by Heating Type in Airport Drive
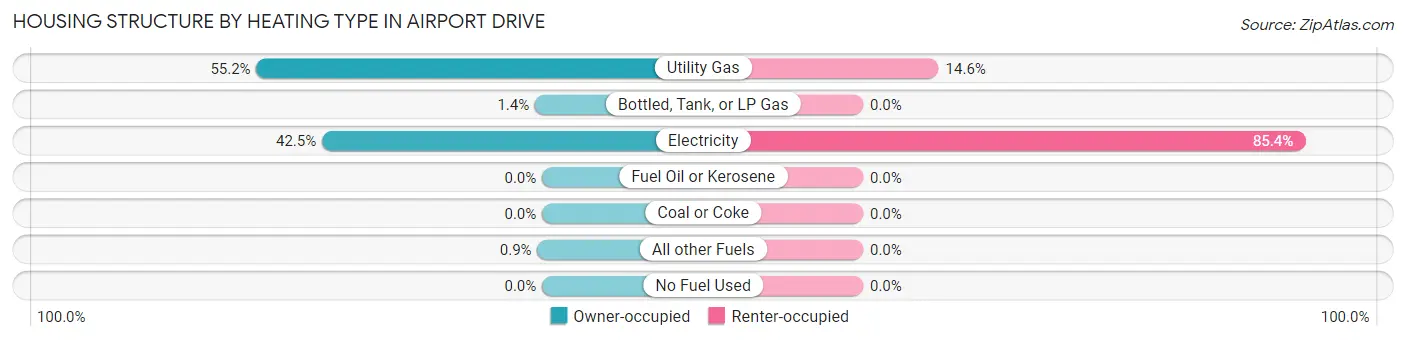
| Heating Type | Owner-occupied | Renter-occupied |
| Utility Gas | 122 (55.2%) | 13 (14.6%) |
| Bottled, Tank, or LP Gas | 3 (1.4%) | 0 (0.0%) |
| Electricity | 94 (42.5%) | 76 (85.4%) |
| Fuel Oil or Kerosene | 0 (0.0%) | 0 (0.0%) |
| Coal or Coke | 0 (0.0%) | 0 (0.0%) |
| All other Fuels | 2 (0.9%) | 0 (0.0%) |
| No Fuel Used | 0 (0.0%) | 0 (0.0%) |
| Total | 221 (100.0%) | 89 (100.0%) |
Household Vehicle Usage in Airport Drive
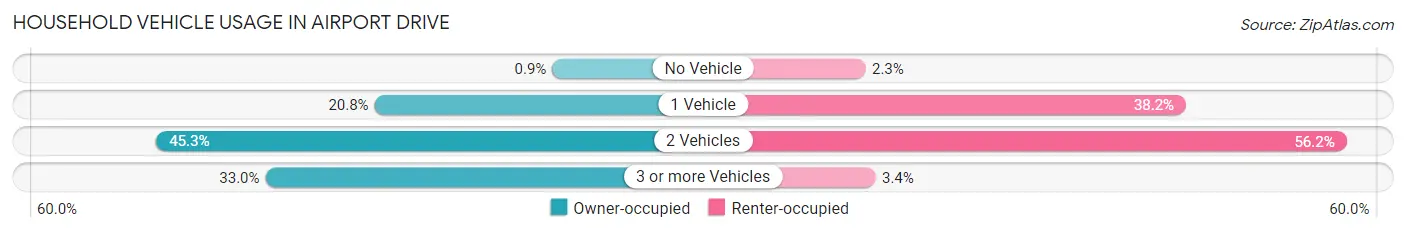
| Vehicles per Household | Owner-occupied | Renter-occupied |
| No Vehicle | 2 (0.9%) | 2 (2.2%) |
| 1 Vehicle | 46 (20.8%) | 34 (38.2%) |
| 2 Vehicles | 100 (45.3%) | 50 (56.2%) |
| 3 or more Vehicles | 73 (33.0%) | 3 (3.4%) |
| Total | 221 (100.0%) | 89 (100.0%) |
Real Estate & Mortgages in Airport Drive
Real Estate and Mortgage Overview in Airport Drive
| Characteristic | Without Mortgage | With Mortgage |
| Housing Units | 88 | 133 |
| Median Property Value | $206,300 | $192,700 |
| Median Household Income | $51,500 | $34 |
| Monthly Housing Costs | $552 | $0 |
| Real Estate Taxes | $1,273 | $1 |
Property Value by Mortgage Status in Airport Drive
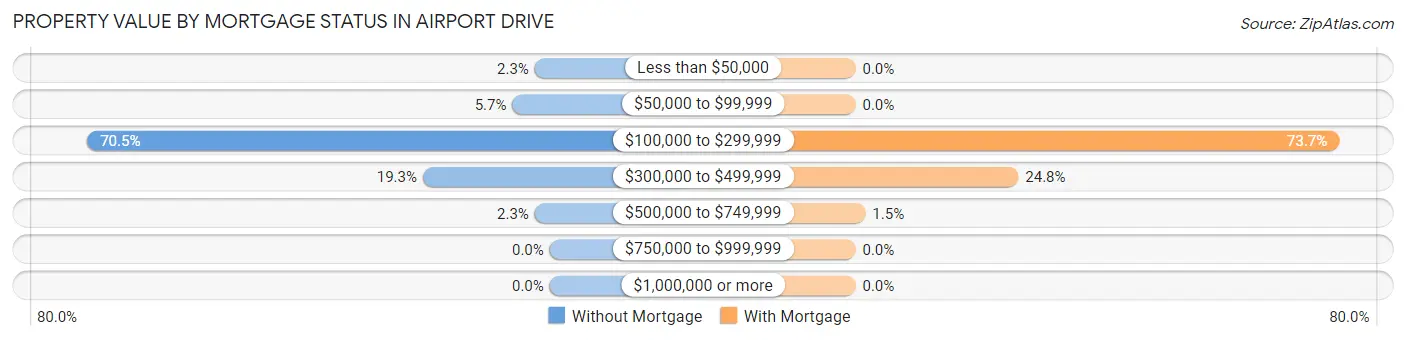
| Property Value | Without Mortgage | With Mortgage |
| Less than $50,000 | 2 (2.3%) | 0 (0.0%) |
| $50,000 to $99,999 | 5 (5.7%) | 0 (0.0%) |
| $100,000 to $299,999 | 62 (70.5%) | 98 (73.7%) |
| $300,000 to $499,999 | 17 (19.3%) | 33 (24.8%) |
| $500,000 to $749,999 | 2 (2.3%) | 2 (1.5%) |
| $750,000 to $999,999 | 0 (0.0%) | 0 (0.0%) |
| $1,000,000 or more | 0 (0.0%) | 0 (0.0%) |
| Total | 88 (100.0%) | 133 (100.0%) |
Household Income by Mortgage Status in Airport Drive
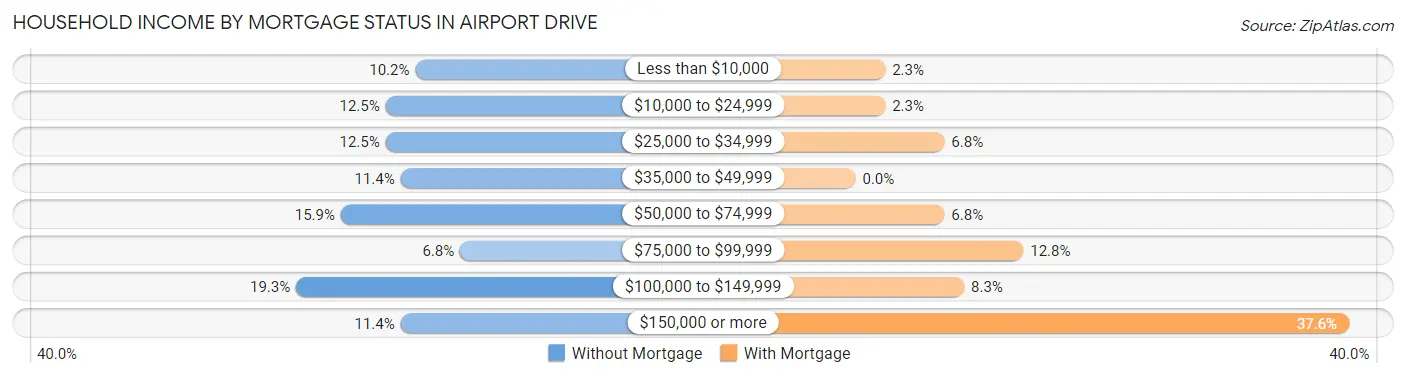
| Household Income | Without Mortgage | With Mortgage |
| Less than $10,000 | 9 (10.2%) | 3 (2.3%) |
| $10,000 to $24,999 | 11 (12.5%) | 3 (2.3%) |
| $25,000 to $34,999 | 11 (12.5%) | 9 (6.8%) |
| $35,000 to $49,999 | 10 (11.4%) | 0 (0.0%) |
| $50,000 to $74,999 | 14 (15.9%) | 9 (6.8%) |
| $75,000 to $99,999 | 6 (6.8%) | 17 (12.8%) |
| $100,000 to $149,999 | 17 (19.3%) | 11 (8.3%) |
| $150,000 or more | 10 (11.4%) | 50 (37.6%) |
| Total | 88 (100.0%) | 133 (100.0%) |
Property Value to Household Income Ratio in Airport Drive
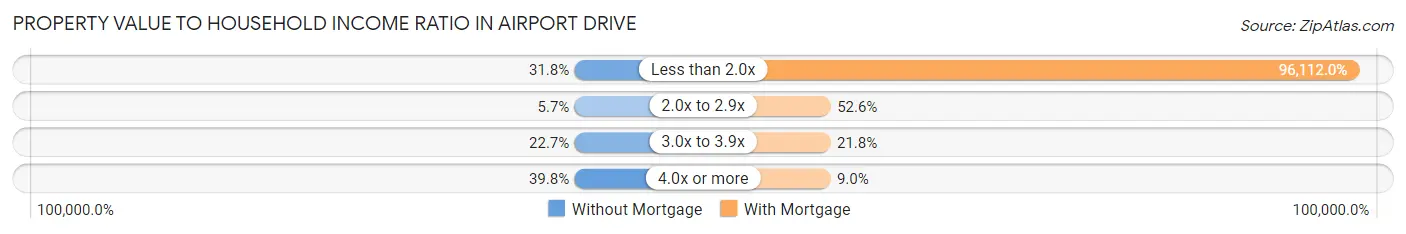
| Value-to-Income Ratio | Without Mortgage | With Mortgage |
| Less than 2.0x | 28 (31.8%) | 127,829 (96,112.0%) |
| 2.0x to 2.9x | 5 (5.7%) | 70 (52.6%) |
| 3.0x to 3.9x | 20 (22.7%) | 29 (21.8%) |
| 4.0x or more | 35 (39.8%) | 12 (9.0%) |
| Total | 88 (100.0%) | 133 (100.0%) |
Real Estate Taxes by Mortgage Status in Airport Drive
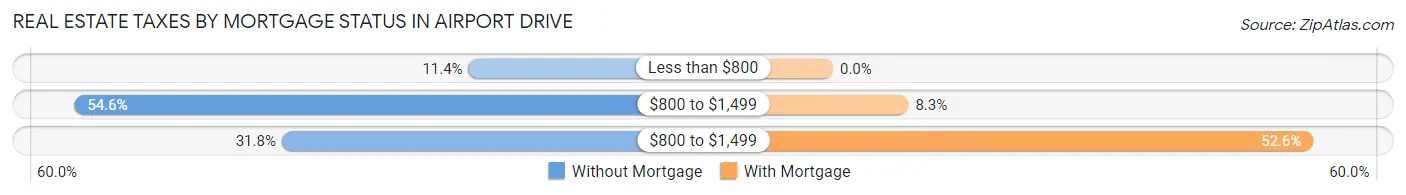
| Property Taxes | Without Mortgage | With Mortgage |
| Less than $800 | 10 (11.4%) | 0 (0.0%) |
| $800 to $1,499 | 48 (54.5%) | 11 (8.3%) |
| $800 to $1,499 | 28 (31.8%) | 70 (52.6%) |
| Total | 88 (100.0%) | 133 (100.0%) |
Health & Disability in Airport Drive
Health Insurance Coverage by Age in Airport Drive
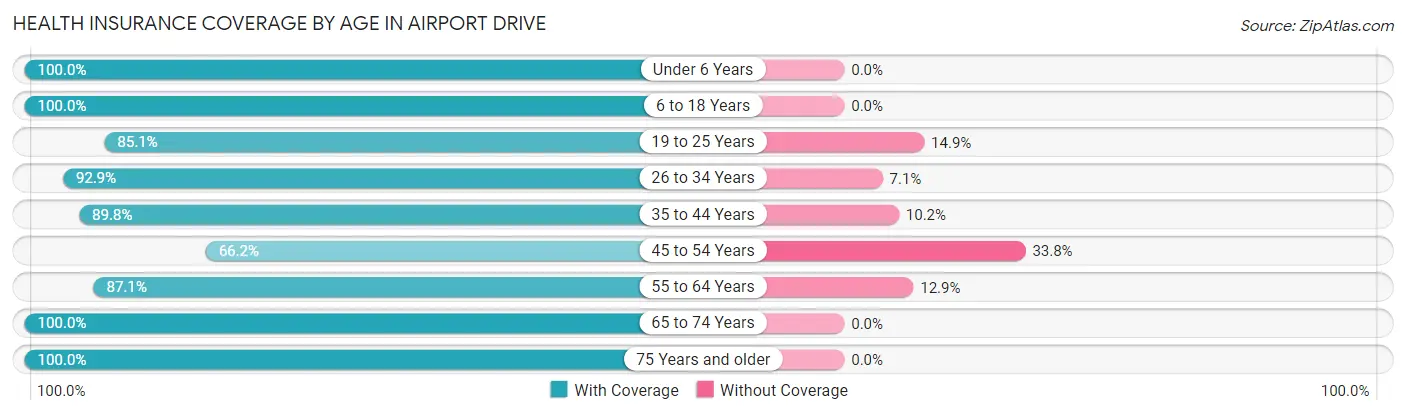
| Age Bracket | With Coverage | Without Coverage |
| Under 6 Years | 33 (100.0%) | 0 (0.0%) |
| 6 to 18 Years | 66 (100.0%) | 0 (0.0%) |
| 19 to 25 Years | 120 (85.1%) | 21 (14.9%) |
| 26 to 34 Years | 78 (92.9%) | 6 (7.1%) |
| 35 to 44 Years | 53 (89.8%) | 6 (10.2%) |
| 45 to 54 Years | 49 (66.2%) | 25 (33.8%) |
| 55 to 64 Years | 88 (87.1%) | 13 (12.9%) |
| 65 to 74 Years | 72 (100.0%) | 0 (0.0%) |
| 75 Years and older | 45 (100.0%) | 0 (0.0%) |
| Total | 604 (89.5%) | 71 (10.5%) |
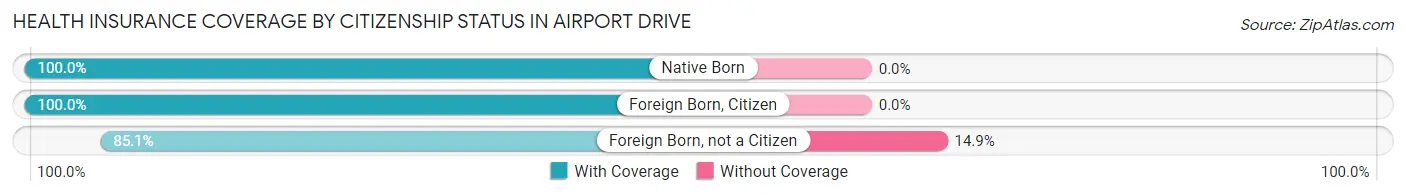
Health Insurance Coverage by Citizenship Status in Airport Drive
| Citizenship Status | With Coverage | Without Coverage |
| Native Born | 33 (100.0%) | 0 (0.0%) |
| Foreign Born, Citizen | 66 (100.0%) | 0 (0.0%) |
| Foreign Born, not a Citizen | 120 (85.1%) | 21 (14.9%) |
Health Insurance Coverage by Household Income in Airport Drive
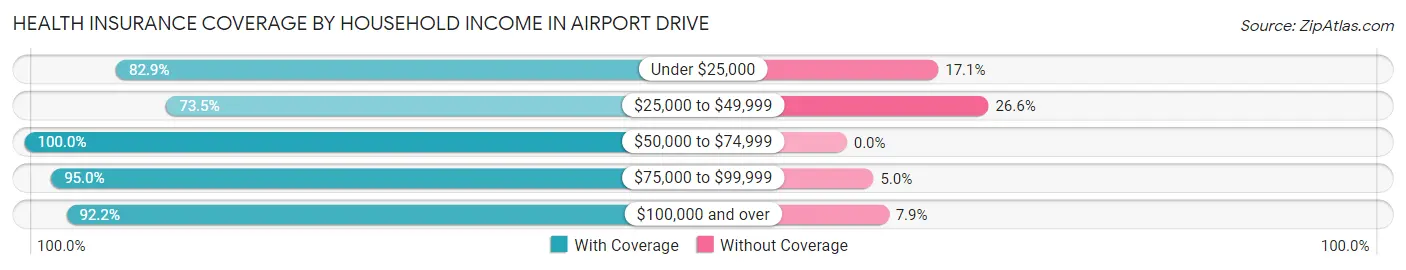
| Household Income | With Coverage | Without Coverage |
| Under $25,000 | 58 (82.9%) | 12 (17.1%) |
| $25,000 to $49,999 | 83 (73.5%) | 30 (26.6%) |
| $50,000 to $74,999 | 108 (100.0%) | 0 (0.0%) |
| $75,000 to $99,999 | 38 (95.0%) | 2 (5.0%) |
| $100,000 and over | 317 (92.1%) | 27 (7.9%) |
Public vs Private Health Insurance Coverage by Age in Airport Drive
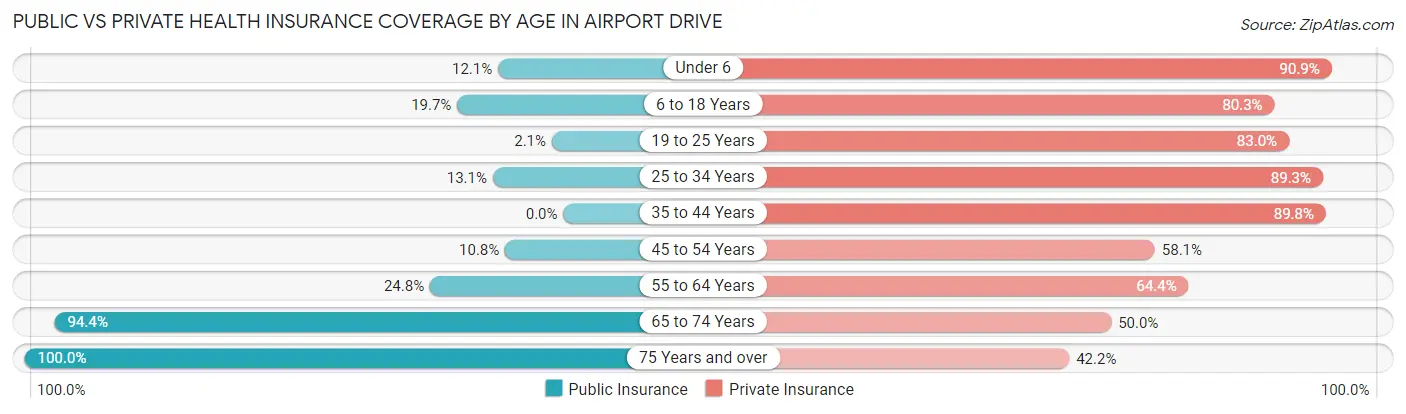
| Age Bracket | Public Insurance | Private Insurance |
| Under 6 | 4 (12.1%) | 30 (90.9%) |
| 6 to 18 Years | 13 (19.7%) | 53 (80.3%) |
| 19 to 25 Years | 3 (2.1%) | 117 (83.0%) |
| 25 to 34 Years | 11 (13.1%) | 75 (89.3%) |
| 35 to 44 Years | 0 (0.0%) | 53 (89.8%) |
| 45 to 54 Years | 8 (10.8%) | 43 (58.1%) |
| 55 to 64 Years | 25 (24.7%) | 65 (64.4%) |
| 65 to 74 Years | 68 (94.4%) | 36 (50.0%) |
| 75 Years and over | 45 (100.0%) | 19 (42.2%) |
| Total | 177 (26.2%) | 491 (72.7%) |
Disability Status by Sex by Age in Airport Drive
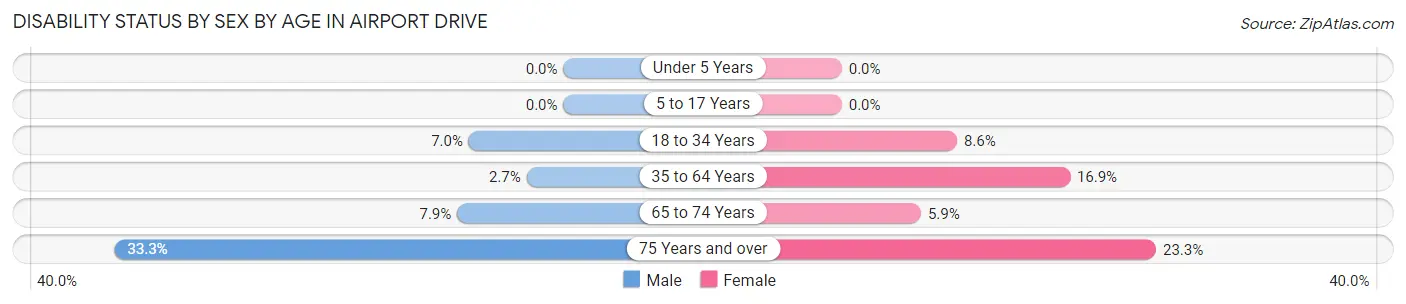
| Age Bracket | Male | Female |
| Under 5 Years | 0 (0.0%) | 0 (0.0%) |
| 5 to 17 Years | 0 (0.0%) | 0 (0.0%) |
| 18 to 34 Years | 8 (7.0%) | 10 (8.6%) |
| 35 to 64 Years | 3 (2.7%) | 21 (16.9%) |
| 65 to 74 Years | 3 (7.9%) | 2 (5.9%) |
| 75 Years and over | 5 (33.3%) | 7 (23.3%) |
Disability Class by Sex by Age in Airport Drive
Disability Class: Hearing Difficulty
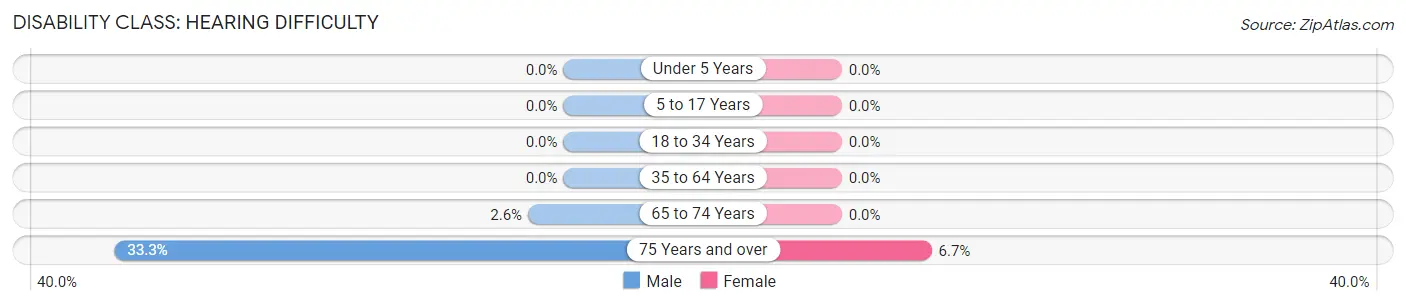
| Age Bracket | Male | Female |
| Under 5 Years | 0 (0.0%) | 0 (0.0%) |
| 5 to 17 Years | 0 (0.0%) | 0 (0.0%) |
| 18 to 34 Years | 0 (0.0%) | 0 (0.0%) |
| 35 to 64 Years | 0 (0.0%) | 0 (0.0%) |
| 65 to 74 Years | 1 (2.6%) | 0 (0.0%) |
| 75 Years and over | 5 (33.3%) | 2 (6.7%) |
Disability Class: Vision Difficulty
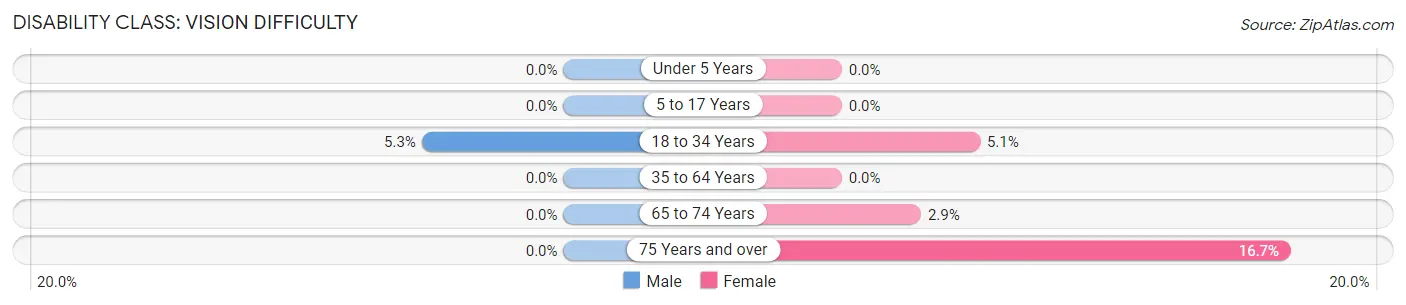
| Age Bracket | Male | Female |
| Under 5 Years | 0 (0.0%) | 0 (0.0%) |
| 5 to 17 Years | 0 (0.0%) | 0 (0.0%) |
| 18 to 34 Years | 6 (5.3%) | 6 (5.1%) |
| 35 to 64 Years | 0 (0.0%) | 0 (0.0%) |
| 65 to 74 Years | 0 (0.0%) | 1 (2.9%) |
| 75 Years and over | 0 (0.0%) | 5 (16.7%) |
Disability Class: Cognitive Difficulty
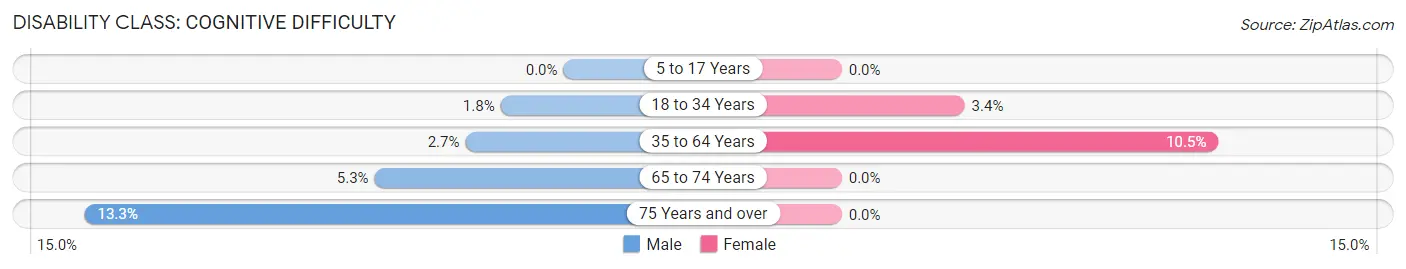
| Age Bracket | Male | Female |
| 5 to 17 Years | 0 (0.0%) | 0 (0.0%) |
| 18 to 34 Years | 2 (1.8%) | 4 (3.4%) |
| 35 to 64 Years | 3 (2.7%) | 13 (10.5%) |
| 65 to 74 Years | 2 (5.3%) | 0 (0.0%) |
| 75 Years and over | 2 (13.3%) | 0 (0.0%) |
Disability Class: Ambulatory Difficulty
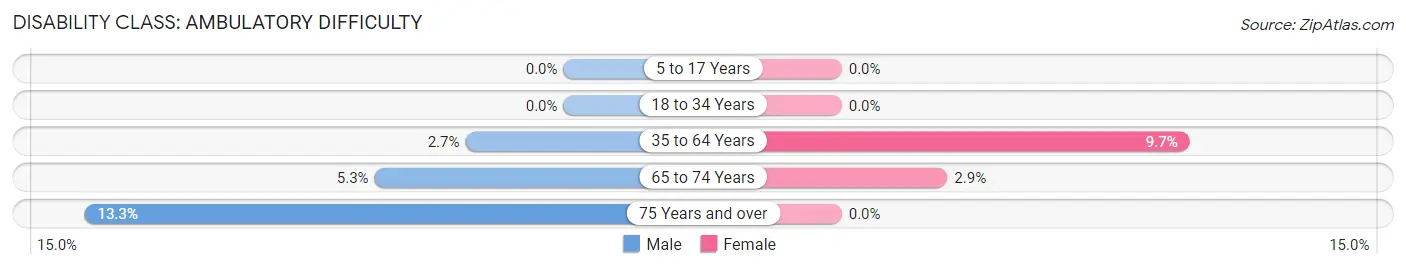
| Age Bracket | Male | Female |
| 5 to 17 Years | 0 (0.0%) | 0 (0.0%) |
| 18 to 34 Years | 0 (0.0%) | 0 (0.0%) |
| 35 to 64 Years | 3 (2.7%) | 12 (9.7%) |
| 65 to 74 Years | 2 (5.3%) | 1 (2.9%) |
| 75 Years and over | 2 (13.3%) | 0 (0.0%) |
Disability Class: Self-Care Difficulty
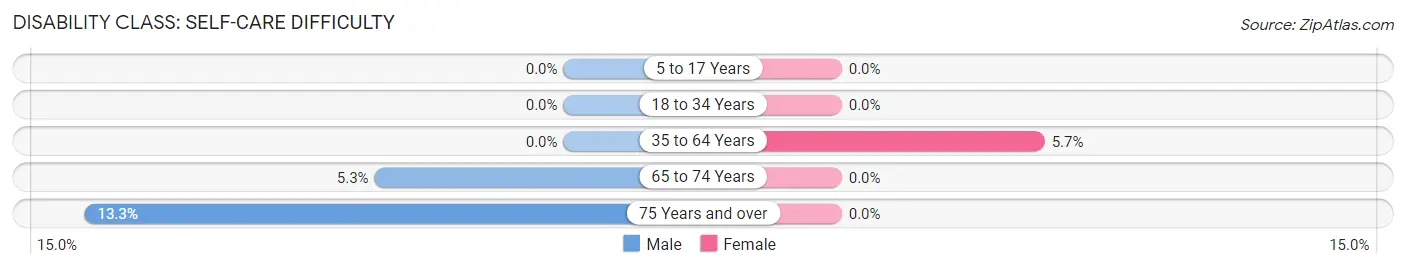
| Age Bracket | Male | Female |
| 5 to 17 Years | 0 (0.0%) | 0 (0.0%) |
| 18 to 34 Years | 0 (0.0%) | 0 (0.0%) |
| 35 to 64 Years | 0 (0.0%) | 7 (5.7%) |
| 65 to 74 Years | 2 (5.3%) | 0 (0.0%) |
| 75 Years and over | 2 (13.3%) | 0 (0.0%) |
Technology Access in Airport Drive
Computing Device Access in Airport Drive
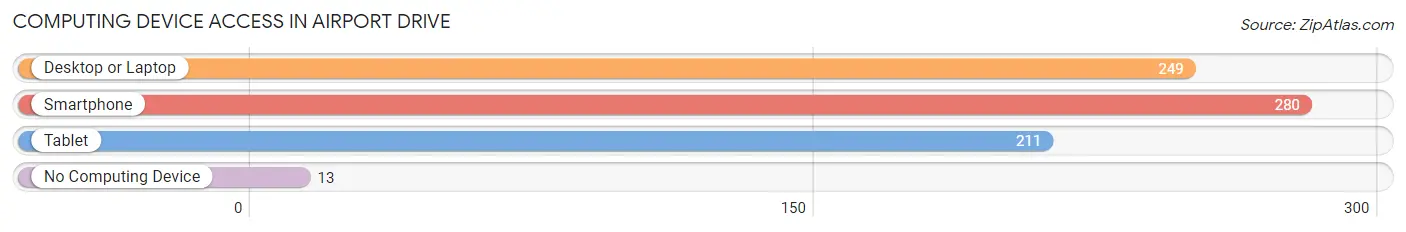
| Device Type | # Households | % Households |
| Desktop or Laptop | 249 | 80.3% |
| Smartphone | 280 | 90.3% |
| Tablet | 211 | 68.1% |
| No Computing Device | 13 | 4.2% |
| Total | 310 | 100.0% |
Internet Access in Airport Drive
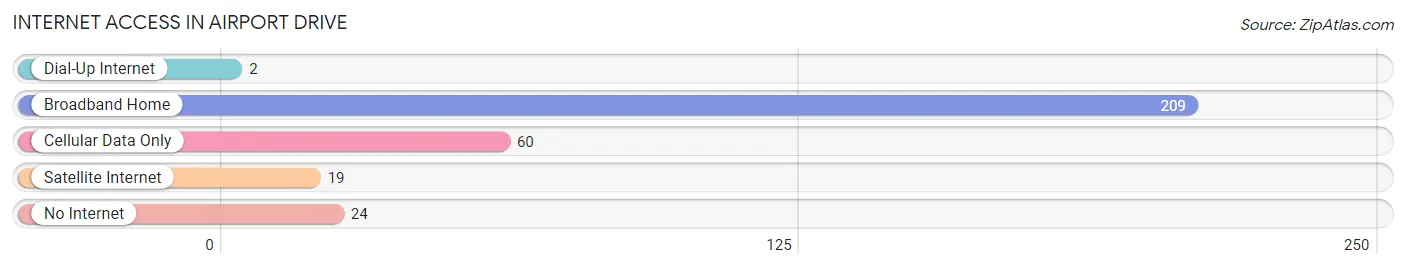
| Internet Type | # Households | % Households |
| Dial-Up Internet | 2 | 0.6% |
| Broadband Home | 209 | 67.4% |
| Cellular Data Only | 60 | 19.4% |
| Satellite Internet | 19 | 6.1% |
| No Internet | 24 | 7.7% |
| Total | 310 | 100.0% |
Airport Drive Summary
Airport Drive is a small unincorporated community located in St. Louis County, Missouri. It is situated in the northwest corner of the county, just south of the Lambert-St. Louis International Airport. The community is bordered by the cities of Bridgeton, Maryland Heights, and St. Ann. Airport Drive is a small, rural community with a population of just over 1,000 people.
History
Airport Drive was first settled in the late 1800s by German immigrants. The area was originally known as “Klein”, which is German for “small”. The community was later renamed Airport Drive in the early 1900s when the Lambert-St. Louis International Airport was built nearby. The airport was built in the late 1920s and was the first major airport in the St. Louis area.
Geography
Airport Drive is located in the northwest corner of St. Louis County, just south of the Lambert-St. Louis International Airport. The community is bordered by the cities of Bridgeton, Maryland Heights, and St. Ann. Airport Drive is a small, rural community with a population of just over 1,000 people. The area is mostly flat with some rolling hills. The climate is humid continental with hot summers and cold winters.
Economy
Airport Drive is a small, rural community with a limited economy. The main industry in the area is agriculture, with many of the residents employed in farming. There are also a few small businesses in the area, including a gas station, a convenience store, and a few restaurants. The Lambert-St. Louis International Airport is also a major employer in the area, providing jobs for many of the residents.
Demographics
As of the 2010 census, the population of Airport Drive was 1,072. The racial makeup of the community was 94.3% White, 2.2% African American, 0.7% Asian, 0.3% Native American, and 2.5% from other races. The median household income was $45,000, and the median age was 37. The majority of the population (90.3%) was born in the United States, with the remaining 9.7% born in other countries.
Airport Drive is a small, rural community with a limited economy and a diverse population. The area is mostly flat with some rolling hills, and the climate is humid continental with hot summers and cold winters. The main industry in the area is agriculture, with many of the residents employed in farming. The Lambert-St. Louis International Airport is also a major employer in the area, providing jobs for many of the residents.
Common Questions
What is the Total Population of Airport Drive?
Total Population of Airport Drive is 675.
What is the Total Male Population of Airport Drive?
Total Male Population of Airport Drive is 326.
What is the Total Female Population of Airport Drive?
Total Female Population of Airport Drive is 349.
What is the Ratio of Males per 100 Females in Airport Drive?
There are 93.41 Males per 100 Females in Airport Drive.
What is the Ratio of Females per 100 Males in Airport Drive?
There are 107.06 Females per 100 Males in Airport Drive.
What is the Median Population Age in Airport Drive?
Median Population Age in Airport Drive is 39.2 Years.
What is the Average Family Size in Airport Drive
Average Family Size in Airport Drive is 2.8 People.
What is the Average Household Size in Airport Drive
Average Household Size in Airport Drive is 2.2 People.
What is Per Capita Income in Airport Drive?
Per Capita income in Airport Drive is $40,483.
What is the Median Family Income in Airport Drive?
Median Family Income in Airport Drive is $124,375.
What is the Median Household income in Airport Drive?
Median Household Income in Airport Drive is $60,000.
What is Income or Wage Gap in Airport Drive?
Income or Wage Gap in Airport Drive is 34.1%.
Women in Airport Drive earn 65.9 cents for every dollar earned by a man.
What is Family Income Deficit in Airport Drive?
Family Income Deficit in Airport Drive is $11,150.
Families that are below poverty line in Airport Drive earn $11,150 less on average than the poverty threshold level.
What is Inequality or Gini Index in Airport Drive?
Inequality or Gini Index in Airport Drive is 0.45.
How Large is the Labor Force in Airport Drive?
There are 431 People in the Labor Forcein in Airport Drive.
What is the Percentage of People in the Labor Force in Airport Drive?
72.8% of People are in the Labor Force in Airport Drive.