Claycomo, MO
Claycomo Map
Claycomo Overview
1,815
TOTAL POPULATION
996
MALE POPULATION
819
FEMALE POPULATION
121.61
MALES / 100 FEMALES
82.23
FEMALES / 100 MALES
36.5
MEDIAN AGE
3.4
AVG FAMILY SIZE
2.5
AVG HOUSEHOLD SIZE
$26,380
PER CAPITA INCOME
$60,156
AVG FAMILY INCOME
$46,890
AVG HOUSEHOLD INCOME
5.0%
WAGE / INCOME GAP [ % ]
95.0¢/ $1
WAGE / INCOME GAP [ $ ]
0.40
INEQUALITY / GINI INDEX
947
LABOR FORCE [ PEOPLE ]
68.9%
PERCENT IN LABOR FORCE
6.1%
UNEMPLOYMENT RATE
Claycomo Area Codes
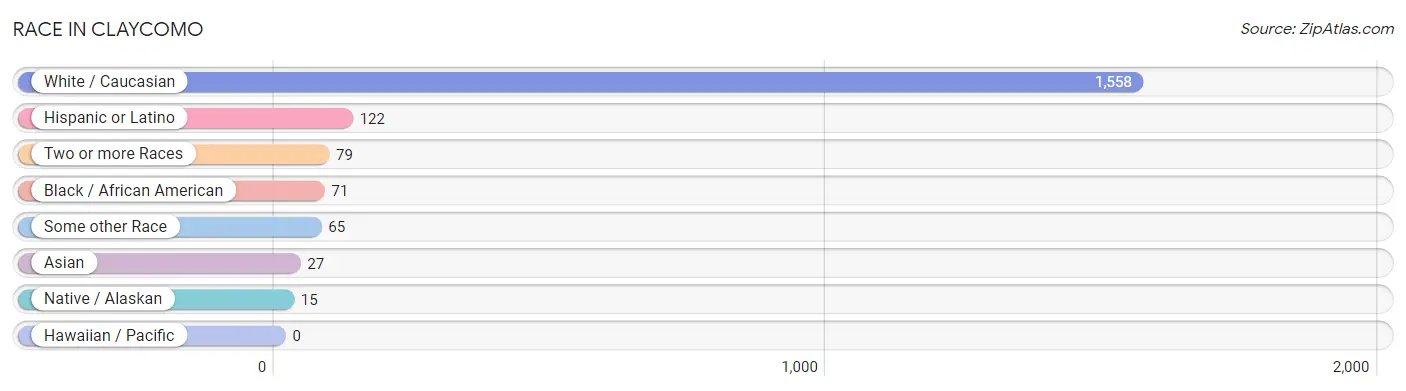
Race in Claycomo
The most populous races in Claycomo are White / Caucasian (1,558 | 85.8%), Hispanic or Latino (122 | 6.7%), and Two or more Races (79 | 4.3%).
| Race | # Population | % Population |
| Asian | 27 | 1.5% |
| Black / African American | 71 | 3.9% |
| Hawaiian / Pacific | 0 | 0.0% |
| Hispanic or Latino | 122 | 6.7% |
| Native / Alaskan | 15 | 0.8% |
| White / Caucasian | 1,558 | 85.8% |
| Two or more Races | 79 | 4.3% |
| Some other Race | 65 | 3.6% |
| Total | 1,815 | 100.0% |
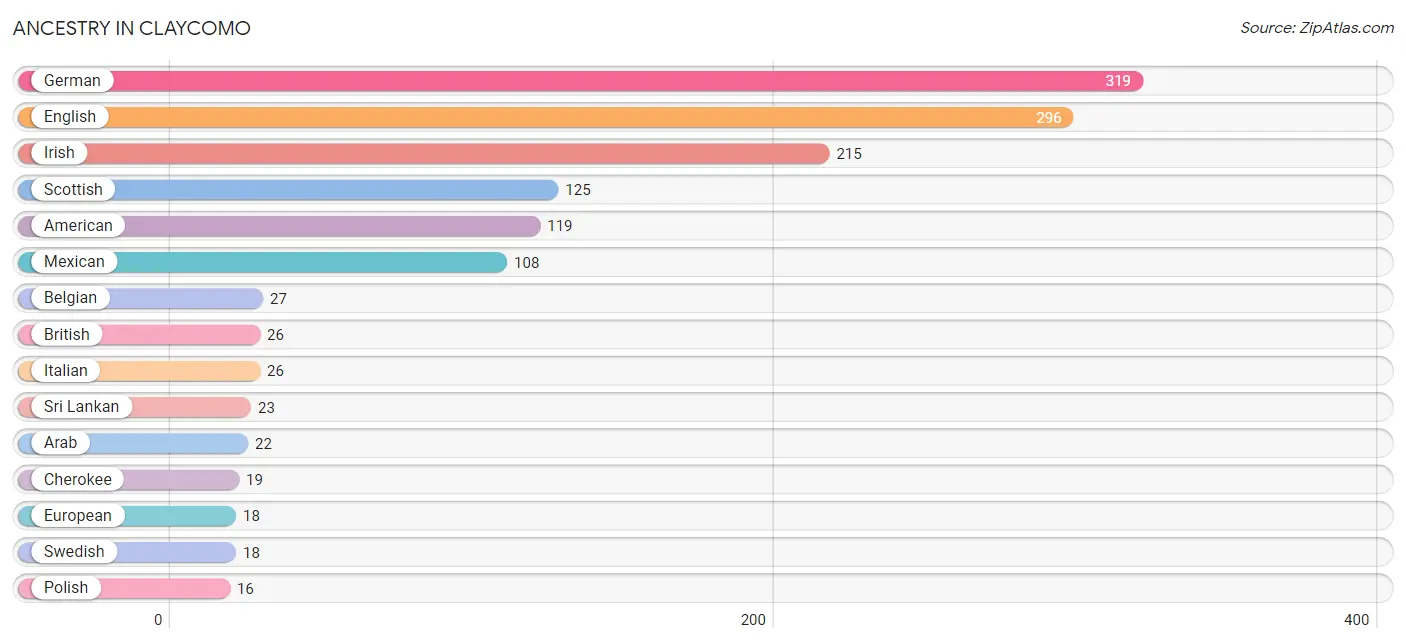
Ancestry in Claycomo
The most populous ancestries reported in Claycomo are German (319 | 17.6%), English (296 | 16.3%), Irish (215 | 11.8%), Scottish (125 | 6.9%), and American (119 | 6.6%), together accounting for 59.2% of all Claycomo residents.
| Ancestry | # Population | % Population |
| American | 119 | 6.6% |
| Arab | 22 | 1.2% |
| Belgian | 27 | 1.5% |
| British | 26 | 1.4% |
| Central American | 9 | 0.5% |
| Cherokee | 19 | 1.1% |
| Croatian | 6 | 0.3% |
| Dutch | 4 | 0.2% |
| Eastern European | 7 | 0.4% |
| English | 296 | 16.3% |
| European | 18 | 1.0% |
| French | 13 | 0.7% |
| French Canadian | 5 | 0.3% |
| German | 319 | 17.6% |
| Honduran | 9 | 0.5% |
| Hungarian | 3 | 0.2% |
| Irish | 215 | 11.8% |
| Italian | 26 | 1.4% |
| Lebanese | 9 | 0.5% |
| Mexican | 108 | 5.9% |
| Norwegian | 5 | 0.3% |
| Pakistani | 2 | 0.1% |
| Pennsylvania German | 3 | 0.2% |
| Polish | 16 | 0.9% |
| Portuguese | 3 | 0.2% |
| Scandinavian | 15 | 0.8% |
| Scotch-Irish | 10 | 0.5% |
| Scottish | 125 | 6.9% |
| Spaniard | 5 | 0.3% |
| Sri Lankan | 23 | 1.3% |
| Swedish | 18 | 1.0% |
| Syrian | 13 | 0.7% |
| Thai | 2 | 0.1% |
| Ukrainian | 3 | 0.2% |
| Welsh | 11 | 0.6% | View All 35 Rows |
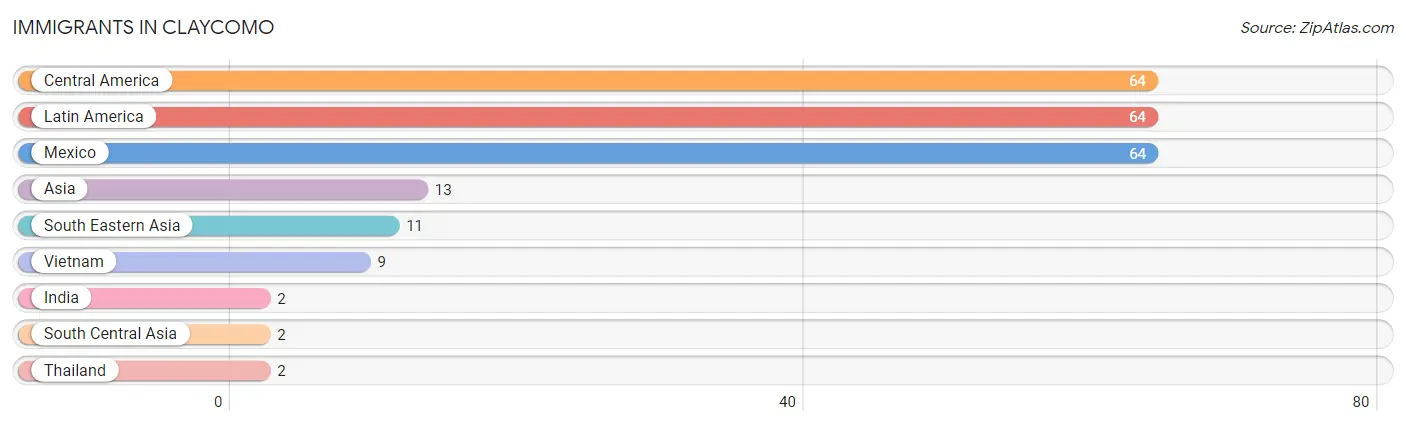
Immigrants in Claycomo
The most numerous immigrant groups reported in Claycomo came from Central America (64 | 3.5%), Latin America (64 | 3.5%), Mexico (64 | 3.5%), Asia (13 | 0.7%), and South Eastern Asia (11 | 0.6%), together accounting for 11.9% of all Claycomo residents.
| Immigration Origin | # Population | % Population |
| Asia | 13 | 0.7% |
| Central America | 64 | 3.5% |
| India | 2 | 0.1% |
| Latin America | 64 | 3.5% |
| Mexico | 64 | 3.5% |
| South Central Asia | 2 | 0.1% |
| South Eastern Asia | 11 | 0.6% |
| Thailand | 2 | 0.1% |
| Vietnam | 9 | 0.5% | View All 9 Rows |
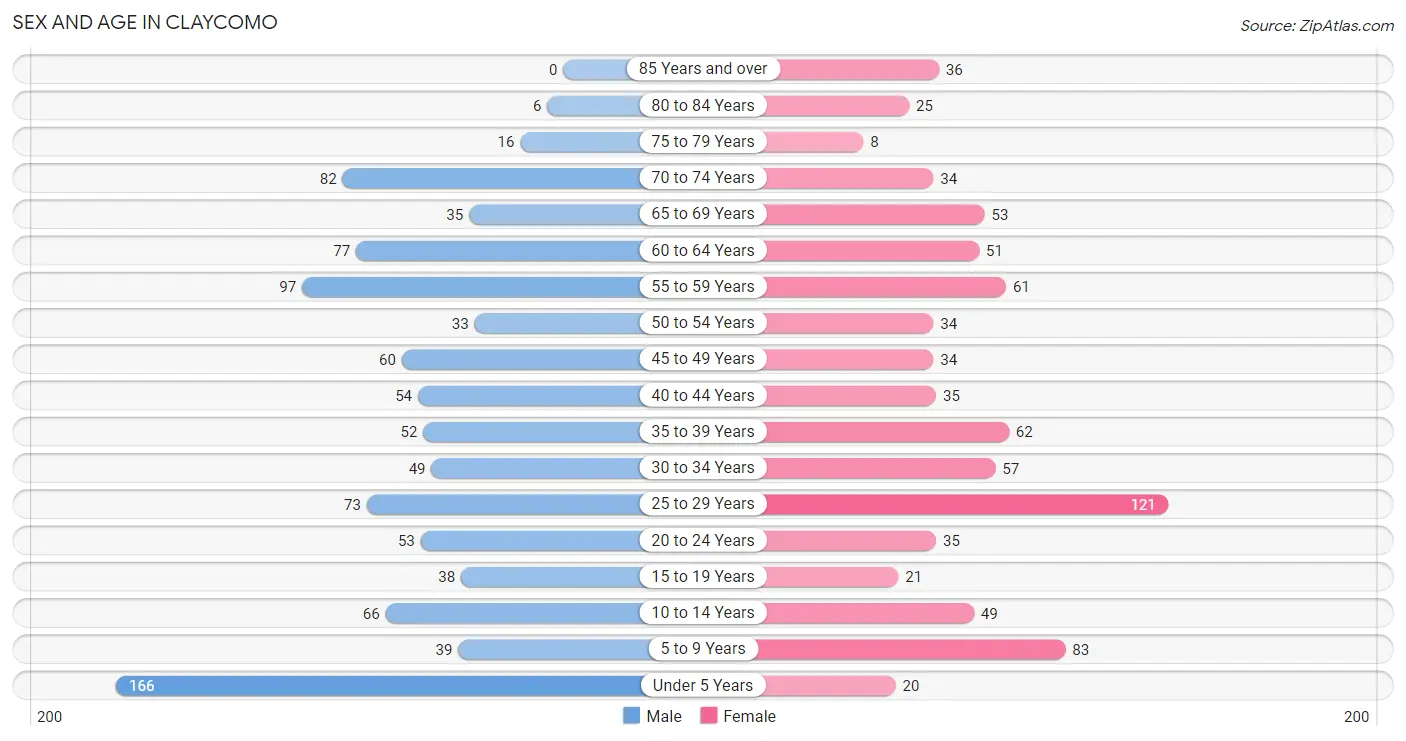
Sex and Age in Claycomo
Sex and Age in Claycomo
The most populous age groups in Claycomo are Under 5 Years (166 | 16.7%) for men and 25 to 29 Years (121 | 14.8%) for women.
| Age Bracket | Male | Female |
| Under 5 Years | 166 (16.7%) | 20 (2.4%) |
| 5 to 9 Years | 39 (3.9%) | 83 (10.1%) |
| 10 to 14 Years | 66 (6.6%) | 49 (6.0%) |
| 15 to 19 Years | 38 (3.8%) | 21 (2.6%) |
| 20 to 24 Years | 53 (5.3%) | 35 (4.3%) |
| 25 to 29 Years | 73 (7.3%) | 121 (14.8%) |
| 30 to 34 Years | 49 (4.9%) | 57 (7.0%) |
| 35 to 39 Years | 52 (5.2%) | 62 (7.6%) |
| 40 to 44 Years | 54 (5.4%) | 35 (4.3%) |
| 45 to 49 Years | 60 (6.0%) | 34 (4.2%) |
| 50 to 54 Years | 33 (3.3%) | 34 (4.2%) |
| 55 to 59 Years | 97 (9.7%) | 61 (7.4%) |
| 60 to 64 Years | 77 (7.7%) | 51 (6.2%) |
| 65 to 69 Years | 35 (3.5%) | 53 (6.5%) |
| 70 to 74 Years | 82 (8.2%) | 34 (4.2%) |
| 75 to 79 Years | 16 (1.6%) | 8 (1.0%) |
| 80 to 84 Years | 6 (0.6%) | 25 (3.0%) |
| 85 Years and over | 0 (0.0%) | 36 (4.4%) |
| Total | 996 (100.0%) | 819 (100.0%) |
Families and Households in Claycomo
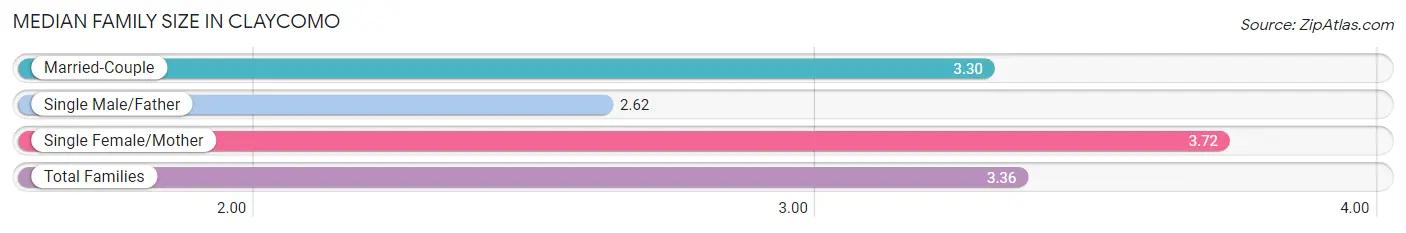
Median Family Size in Claycomo
The median family size in Claycomo is 3.36 persons per family, with single female/mother families (151 | 36.9%) accounting for the largest median family size of 3.72 persons per family. On the other hand, single male/father families (55 | 13.5%) represent the smallest median family size with 2.62 persons per family.
| Family Type | # Families | Family Size |
| Married-Couple | 203 (49.6%) | 3.30 |
| Single Male/Father | 55 (13.5%) | 2.62 |
| Single Female/Mother | 151 (36.9%) | 3.72 |
| Total Families | 409 (100.0%) | 3.36 |
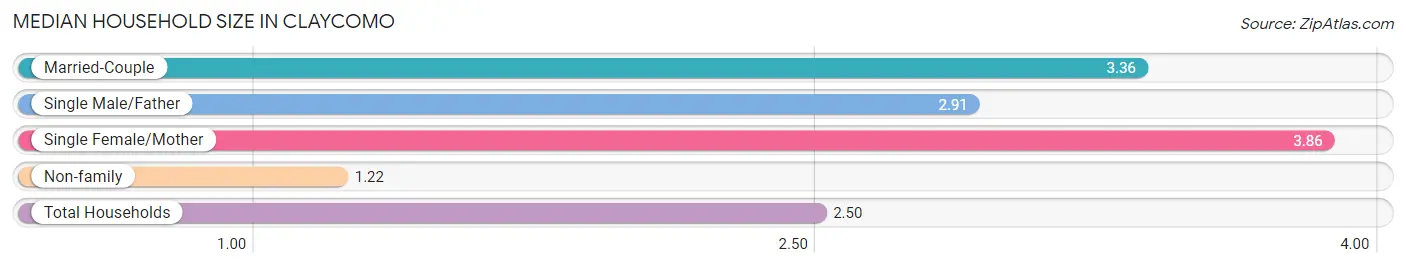
Median Household Size in Claycomo
The median household size in Claycomo is 2.50 persons per household, with single female/mother households (151 | 20.8%) accounting for the largest median household size of 3.86 persons per household. non-family households (318 | 43.7%) represent the smallest median household size with 1.22 persons per household.
| Household Type | # Households | Household Size |
| Married-Couple | 203 (27.9%) | 3.36 |
| Single Male/Father | 55 (7.6%) | 2.91 |
| Single Female/Mother | 151 (20.8%) | 3.86 |
| Non-family | 318 (43.7%) | 1.22 |
| Total Households | 727 (100.0%) | 2.50 |
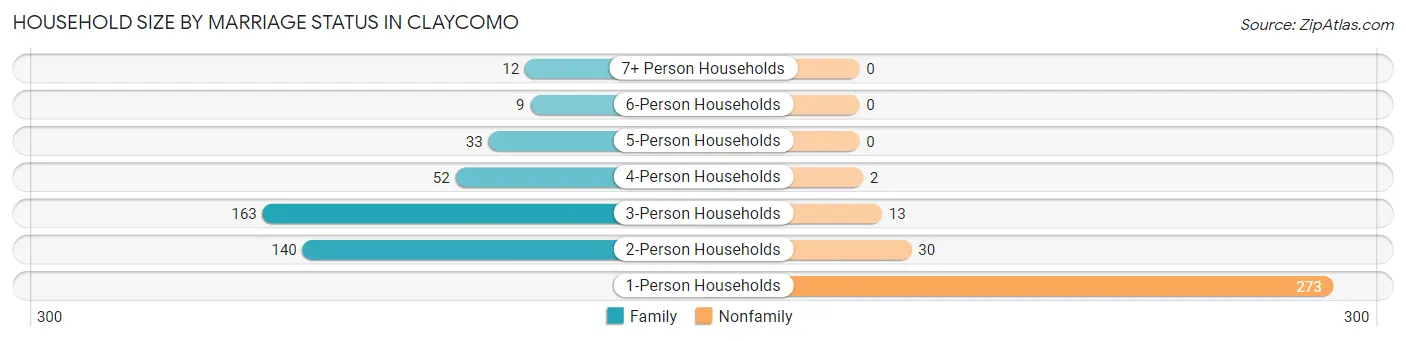
Household Size by Marriage Status in Claycomo
Out of a total of 727 households in Claycomo, 409 (56.3%) are family households, while 318 (43.7%) are nonfamily households. The most numerous type of family households are 3-person households, comprising 163, and the most common type of nonfamily households are 1-person households, comprising 273.
| Household Size | Family Households | Nonfamily Households |
| 1-Person Households | - | 273 (37.6%) |
| 2-Person Households | 140 (19.3%) | 30 (4.1%) |
| 3-Person Households | 163 (22.4%) | 13 (1.8%) |
| 4-Person Households | 52 (7.1%) | 2 (0.3%) |
| 5-Person Households | 33 (4.5%) | 0 (0.0%) |
| 6-Person Households | 9 (1.2%) | 0 (0.0%) |
| 7+ Person Households | 12 (1.7%) | 0 (0.0%) |
| Total | 409 (56.3%) | 318 (43.7%) |
Female Fertility in Claycomo
Fertility by Age in Claycomo
Average fertility rate in Claycomo is 44.0 births per 1,000 women. Women in the age bracket of 20 to 34 years have the highest fertility rate with 61.0 births per 1,000 women. Women in the age bracket of 20 to 34 years acount for 81.2% of all women with births.
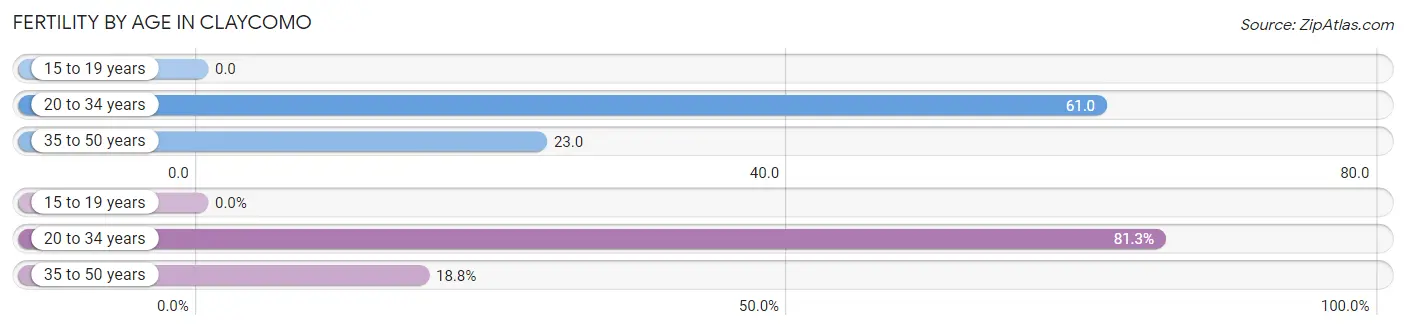
| Age Bracket | Women with Births | Births / 1,000 Women |
| 15 to 19 years | 0 (0.0%) | 0.0 |
| 20 to 34 years | 13 (81.2%) | 61.0 |
| 35 to 50 years | 3 (18.8%) | 23.0 |
| Total | 16 (100.0%) | 44.0 |
Fertility by Age by Marriage Status in Claycomo
75.0% of women with births (16) in Claycomo are married. The highest percentage of unmarried women with births falls into 20 to 34 years age bracket with 30.8% of them unmarried at the time of birth, while the lowest percentage of unmarried women with births belong to 35 to 50 years age bracket with 0.0% of them unmarried.
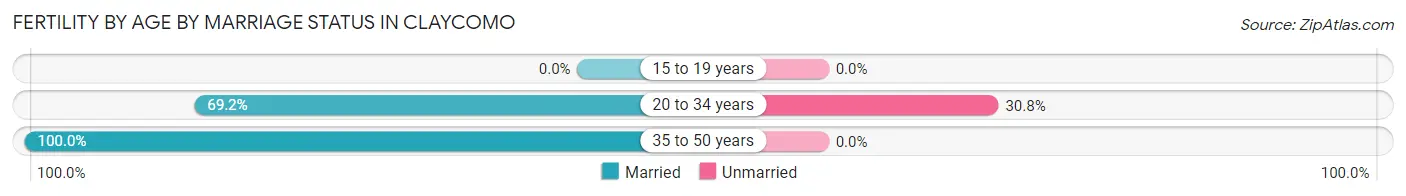
| Age Bracket | Married | Unmarried |
| 15 to 19 years | 0 (0.0%) | 0 (0.0%) |
| 20 to 34 years | 9 (69.2%) | 4 (30.8%) |
| 35 to 50 years | 3 (100.0%) | 0 (0.0%) |
| Total | 12 (75.0%) | 4 (25.0%) |
Fertility by Education in Claycomo
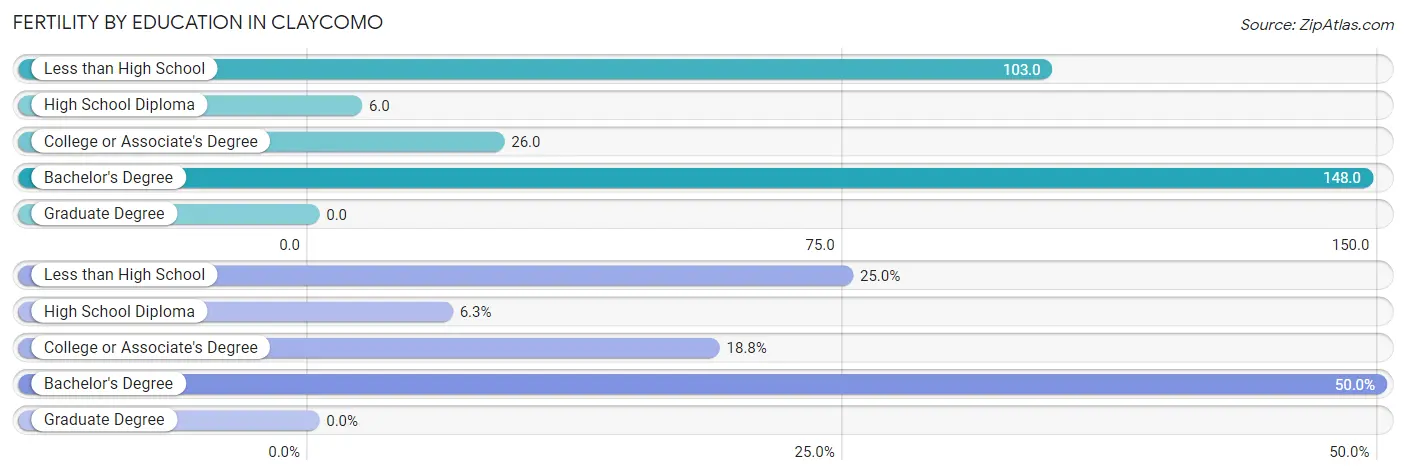
| Educational Attainment | Women with Births | Births / 1,000 Women |
| Less than High School | 4 (25.0%) | 103.0 |
| High School Diploma | 1 (6.2%) | 6.0 |
| College or Associate's Degree | 3 (18.8%) | 26.0 |
| Bachelor's Degree | 8 (50.0%) | 148.0 |
| Graduate Degree | 0 (0.0%) | 0.0 |
| Total | 16 (100.0%) | 44.0 |
Fertility by Education by Marriage Status in Claycomo
25.0% of women with births in Claycomo are unmarried. Women with the educational attainment of high school diploma are most likely to be married with 100.0% of them married at childbirth, while women with the educational attainment of less than high school are least likely to be married with 100.0% of them unmarried at childbirth.
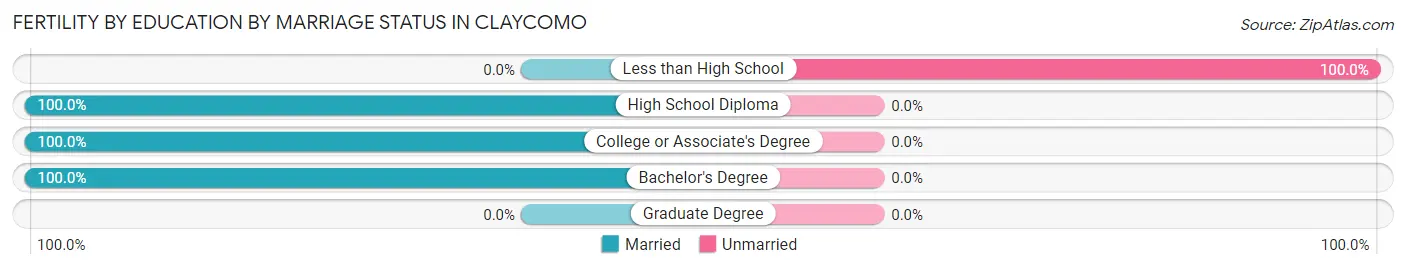
| Educational Attainment | Married | Unmarried |
| Less than High School | 0 (0.0%) | 4 (100.0%) |
| High School Diploma | 1 (100.0%) | 0 (0.0%) |
| College or Associate's Degree | 3 (100.0%) | 0 (0.0%) |
| Bachelor's Degree | 8 (100.0%) | 0 (0.0%) |
| Graduate Degree | 0 (0.0%) | 0 (0.0%) |
| Total | 12 (75.0%) | 4 (25.0%) |
Income in Claycomo
Income Overview in Claycomo
Per Capita Income in Claycomo is $26,380, while median incomes of families and households are $60,156 and $46,890 respectively.
| Characteristic | Number | Measure |
| Per Capita Income | 1,815 | $26,380 |
| Median Family Income | 409 | $60,156 |
| Mean Family Income | 409 | $74,406 |
| Median Household Income | 727 | $46,890 |
| Mean Household Income | 727 | $62,061 |
| Income Deficit | 409 | $0 |
| Wage / Income Gap (%) | 1,815 | 4.97% |
| Wage / Income Gap ($) | 1,815 | 95.03¢ per $1 |
| Gini / Inequality Index | 1,815 | 0.40 |
Earnings by Sex in Claycomo
Average Earnings in Claycomo are $38,967, $39,342 for men and $37,386 for women, a difference of 5.0%.
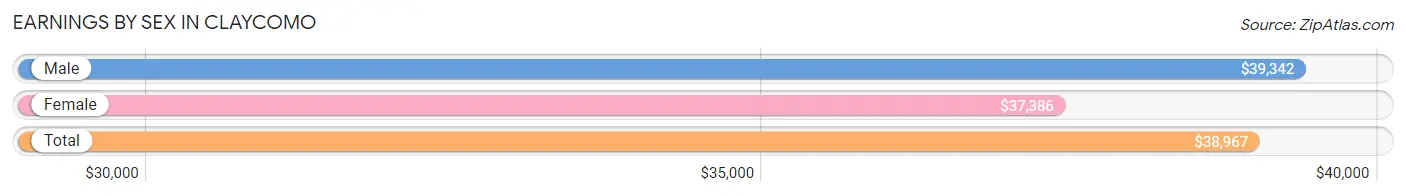
| Sex | Number | Average Earnings |
| Male | 508 (54.3%) | $39,342 |
| Female | 427 (45.7%) | $37,386 |
| Total | 935 (100.0%) | $38,967 |
Earnings by Sex by Income Bracket in Claycomo
The most common earnings brackets in Claycomo are $55,000 to $64,999 for men (69 | 13.6%) and $45,000 to $49,999 for women (79 | 18.5%).
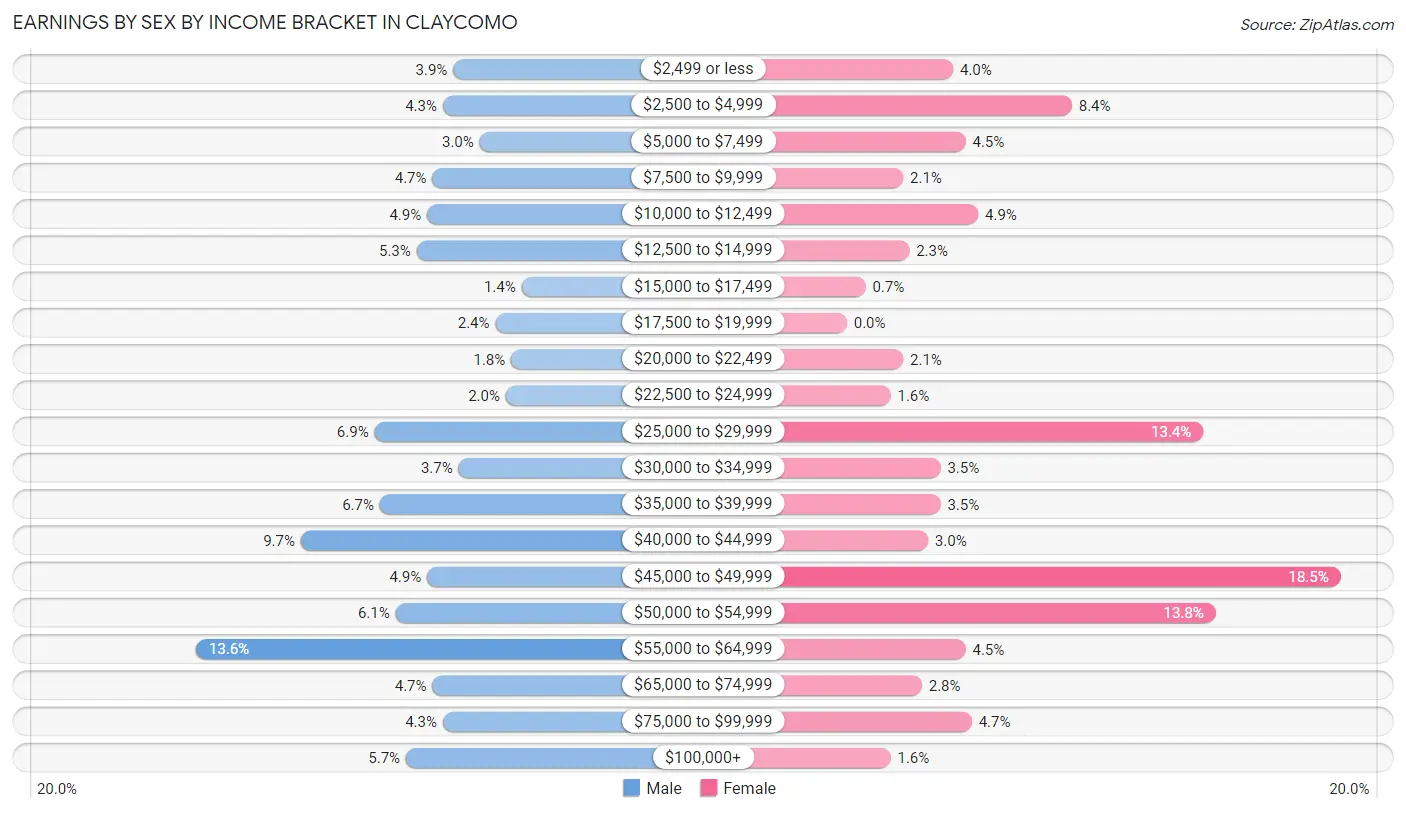
| Income | Male | Female |
| $2,499 or less | 20 (3.9%) | 17 (4.0%) |
| $2,500 to $4,999 | 22 (4.3%) | 36 (8.4%) |
| $5,000 to $7,499 | 15 (2.9%) | 19 (4.4%) |
| $7,500 to $9,999 | 24 (4.7%) | 9 (2.1%) |
| $10,000 to $12,499 | 25 (4.9%) | 21 (4.9%) |
| $12,500 to $14,999 | 27 (5.3%) | 10 (2.3%) |
| $15,000 to $17,499 | 7 (1.4%) | 3 (0.7%) |
| $17,500 to $19,999 | 12 (2.4%) | 0 (0.0%) |
| $20,000 to $22,499 | 9 (1.8%) | 9 (2.1%) |
| $22,500 to $24,999 | 10 (2.0%) | 7 (1.6%) |
| $25,000 to $29,999 | 35 (6.9%) | 57 (13.4%) |
| $30,000 to $34,999 | 19 (3.7%) | 15 (3.5%) |
| $35,000 to $39,999 | 34 (6.7%) | 15 (3.5%) |
| $40,000 to $44,999 | 49 (9.7%) | 13 (3.0%) |
| $45,000 to $49,999 | 25 (4.9%) | 79 (18.5%) |
| $50,000 to $54,999 | 31 (6.1%) | 59 (13.8%) |
| $55,000 to $64,999 | 69 (13.6%) | 19 (4.4%) |
| $65,000 to $74,999 | 24 (4.7%) | 12 (2.8%) |
| $75,000 to $99,999 | 22 (4.3%) | 20 (4.7%) |
| $100,000+ | 29 (5.7%) | 7 (1.6%) |
| Total | 508 (100.0%) | 427 (100.0%) |
Earnings by Sex by Educational Attainment in Claycomo
Average earnings in Claycomo are $41,359 for men and $45,236 for women, a difference of 8.6%. Men with an educational attainment of college or associate's degree enjoy the highest average annual earnings of $42,024, while those with high school diploma education earn the least with $39,063. Women with an educational attainment of high school diploma earn the most with the average annual earnings of $46,138, while those with bachelor's degree education have the smallest earnings of $27,266.
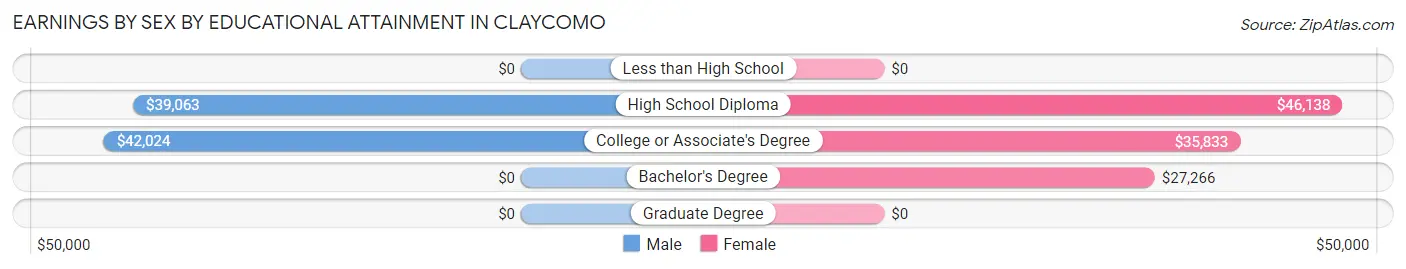
| Educational Attainment | Male Income | Female Income |
| Less than High School | - | - |
| High School Diploma | $39,063 | $46,138 |
| College or Associate's Degree | $42,024 | $35,833 |
| Bachelor's Degree | - | - |
| Graduate Degree | - | - |
| Total | $41,359 | $45,236 |
Family Income in Claycomo
Family Income Brackets in Claycomo
According to the Claycomo family income data, there are 100 families falling into the $35,000 to $49,999 income range, which is the most common income bracket and makes up 24.4% of all families. Conversely, the $200,000+ income bracket is the least frequent group with only 4 families (1.0%) belonging to this category.
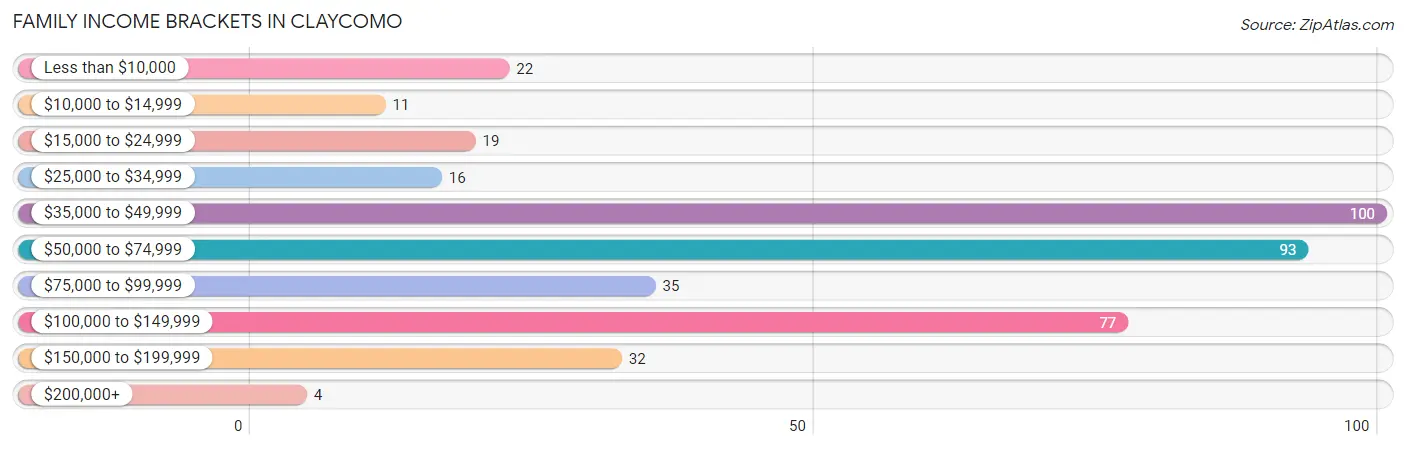
| Income Bracket | # Families | % Families |
| Less than $10,000 | 22 | 5.4% |
| $10,000 to $14,999 | 11 | 2.7% |
| $15,000 to $24,999 | 19 | 4.6% |
| $25,000 to $34,999 | 16 | 3.9% |
| $35,000 to $49,999 | 100 | 24.4% |
| $50,000 to $74,999 | 93 | 22.7% |
| $75,000 to $99,999 | 35 | 8.6% |
| $100,000 to $149,999 | 77 | 18.8% |
| $150,000 to $199,999 | 32 | 7.8% |
| $200,000+ | 4 | 1.0% |
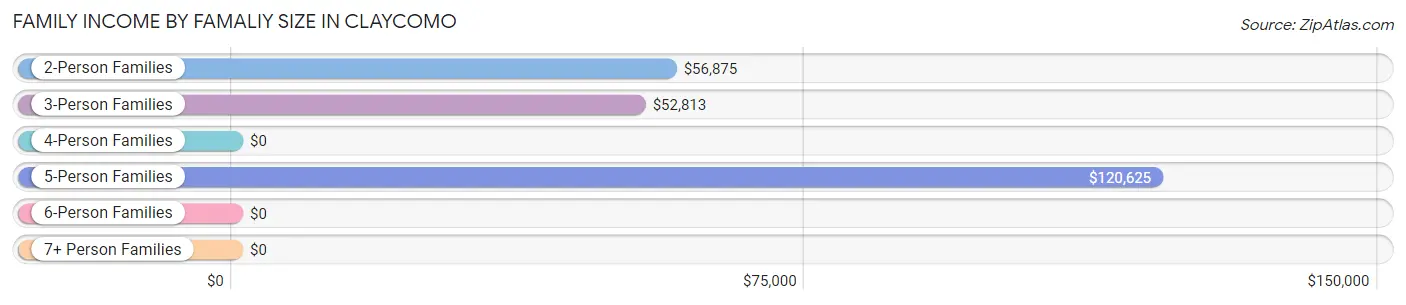
Family Income by Famaliy Size in Claycomo
5-person families (18 | 4.4%) account for the highest median family income in Claycomo with $120,625 per family, while 2-person families (153 | 37.4%) have the highest median income of $28,438 per family member.
| Income Bracket | # Families | Median Income |
| 2-Person Families | 153 (37.4%) | $56,875 |
| 3-Person Families | 165 (40.3%) | $52,813 |
| 4-Person Families | 52 (12.7%) | $0 |
| 5-Person Families | 18 (4.4%) | $120,625 |
| 6-Person Families | 9 (2.2%) | $0 |
| 7+ Person Families | 12 (2.9%) | $0 |
| Total | 409 (100.0%) | $60,156 |
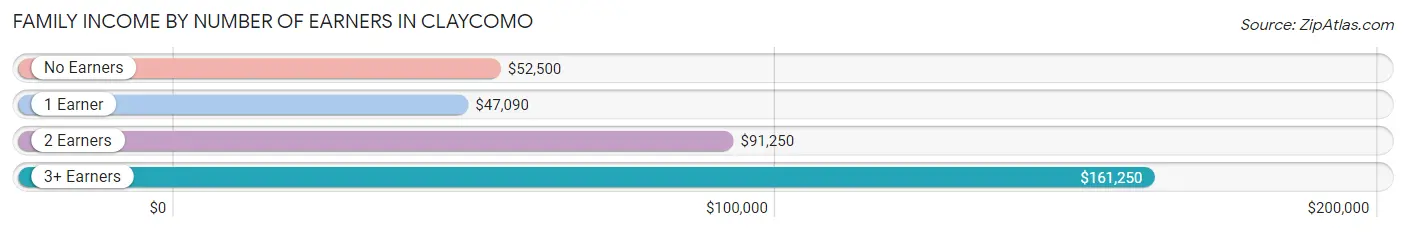
Family Income by Number of Earners in Claycomo
The median family income in Claycomo is $60,156, with families comprising 3+ earners (34) having the highest median family income of $161,250, while families with 1 earner (238) have the lowest median family income of $47,090, accounting for 8.3% and 58.2% of families, respectively.
| Number of Earners | # Families | Median Income |
| No Earners | 22 (5.4%) | $52,500 |
| 1 Earner | 238 (58.2%) | $47,090 |
| 2 Earners | 115 (28.1%) | $91,250 |
| 3+ Earners | 34 (8.3%) | $161,250 |
| Total | 409 (100.0%) | $60,156 |
Household Income in Claycomo
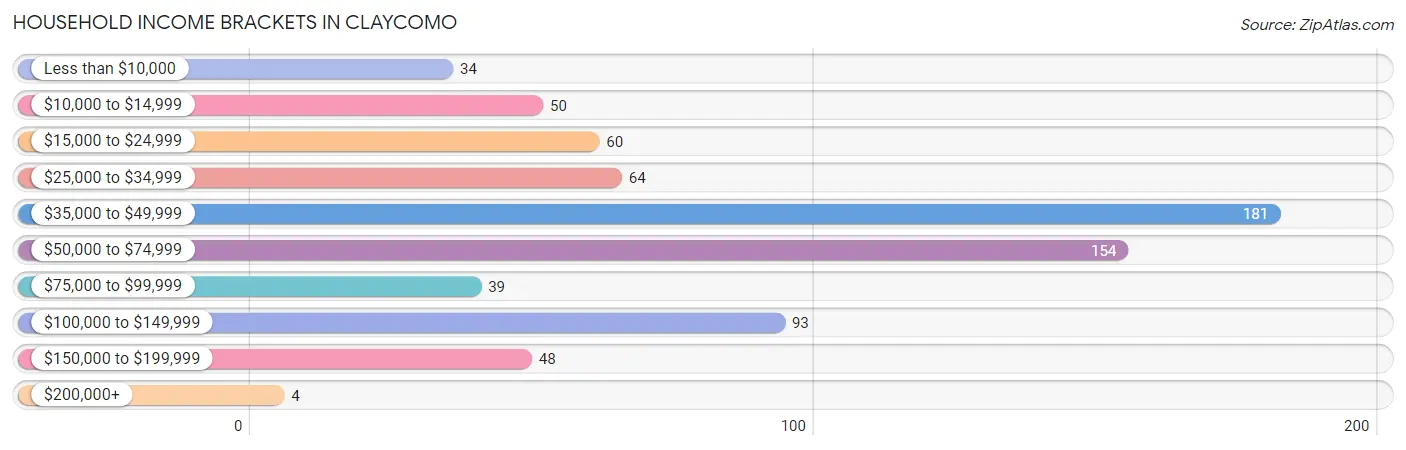
Household Income Brackets in Claycomo
With 181 households falling in the category, the $35,000 to $49,999 income range is the most frequent in Claycomo, accounting for 24.9% of all households. In contrast, only 4 households (0.5%) fall into the $200,000+ income bracket, making it the least populous group.
| Income Bracket | # Households | % Households |
| Less than $10,000 | 34 | 4.7% |
| $10,000 to $14,999 | 50 | 6.9% |
| $15,000 to $24,999 | 60 | 8.3% |
| $25,000 to $34,999 | 64 | 8.8% |
| $35,000 to $49,999 | 181 | 24.9% |
| $50,000 to $74,999 | 154 | 21.2% |
| $75,000 to $99,999 | 39 | 5.4% |
| $100,000 to $149,999 | 93 | 12.8% |
| $150,000 to $199,999 | 48 | 6.6% |
| $200,000+ | 4 | 0.6% |
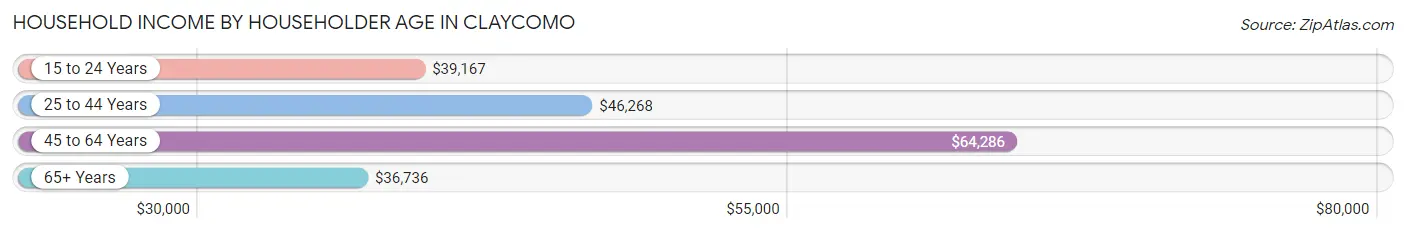
Household Income by Householder Age in Claycomo
The median household income in Claycomo is $46,890, with the highest median household income of $64,286 found in the 45 to 64 years age bracket for the primary householder. A total of 268 households (36.9%) fall into this category. Meanwhile, the 65+ years age bracket for the primary householder has the lowest median household income of $36,736, with 169 households (23.3%) in this group.
| Income Bracket | # Households | Median Income |
| 15 to 24 Years | 26 (3.6%) | $39,167 |
| 25 to 44 Years | 264 (36.3%) | $46,268 |
| 45 to 64 Years | 268 (36.9%) | $64,286 |
| 65+ Years | 169 (23.3%) | $36,736 |
| Total | 727 (100.0%) | $46,890 |
Poverty in Claycomo
Income Below Poverty by Sex and Age in Claycomo
With 22.4% poverty level for males and 13.9% for females among the residents of Claycomo, 15 year old males and 15 year old females are the most vulnerable to poverty, with 11 males (73.3%) and 3 females (100.0%) in their respective age groups living below the poverty level.
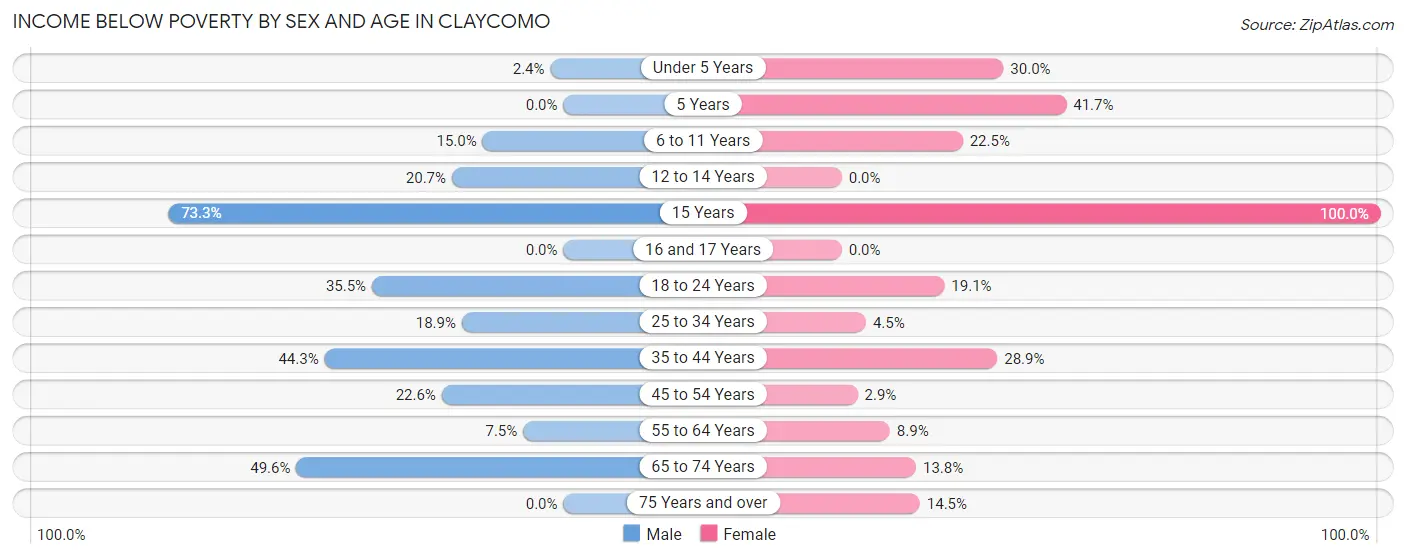
| Age Bracket | Male | Female |
| Under 5 Years | 4 (2.4%) | 6 (30.0%) |
| 5 Years | 0 (0.0%) | 5 (41.7%) |
| 6 to 11 Years | 6 (15.0%) | 22 (22.5%) |
| 12 to 14 Years | 12 (20.7%) | 0 (0.0%) |
| 15 Years | 11 (73.3%) | 3 (100.0%) |
| 16 and 17 Years | 0 (0.0%) | 0 (0.0%) |
| 18 to 24 Years | 27 (35.5%) | 8 (19.1%) |
| 25 to 34 Years | 23 (18.9%) | 8 (4.5%) |
| 35 to 44 Years | 47 (44.3%) | 28 (28.9%) |
| 45 to 54 Years | 21 (22.6%) | 2 (2.9%) |
| 55 to 64 Years | 13 (7.5%) | 10 (8.9%) |
| 65 to 74 Years | 58 (49.6%) | 12 (13.8%) |
| 75 Years and over | 0 (0.0%) | 10 (14.5%) |
| Total | 222 (22.4%) | 114 (13.9%) |
Income Above Poverty by Sex and Age in Claycomo
According to the poverty statistics in Claycomo, males aged 5 years and females aged 12 to 14 years are the age groups that are most secure financially, with 100.0% of males and 100.0% of females in these age groups living above the poverty line.
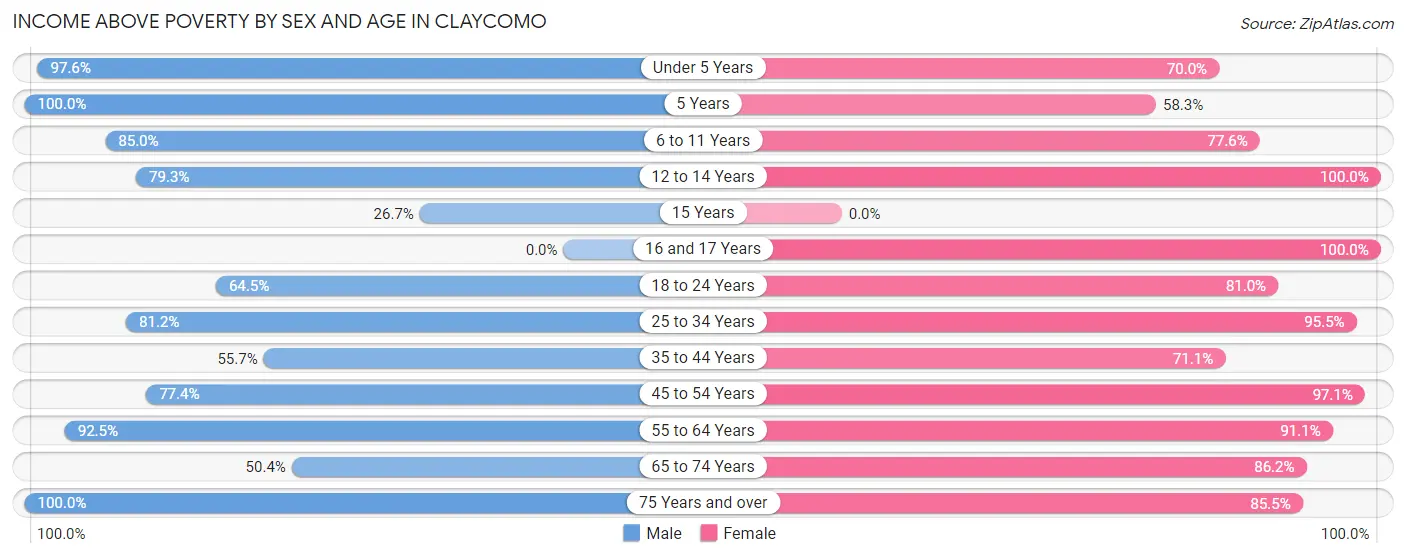
| Age Bracket | Male | Female |
| Under 5 Years | 162 (97.6%) | 14 (70.0%) |
| 5 Years | 3 (100.0%) | 7 (58.3%) |
| 6 to 11 Years | 34 (85.0%) | 76 (77.5%) |
| 12 to 14 Years | 46 (79.3%) | 22 (100.0%) |
| 15 Years | 4 (26.7%) | 0 (0.0%) |
| 16 and 17 Years | 0 (0.0%) | 11 (100.0%) |
| 18 to 24 Years | 49 (64.5%) | 34 (80.9%) |
| 25 to 34 Years | 99 (81.1%) | 170 (95.5%) |
| 35 to 44 Years | 59 (55.7%) | 69 (71.1%) |
| 45 to 54 Years | 72 (77.4%) | 66 (97.1%) |
| 55 to 64 Years | 161 (92.5%) | 102 (91.1%) |
| 65 to 74 Years | 59 (50.4%) | 75 (86.2%) |
| 75 Years and over | 22 (100.0%) | 59 (85.5%) |
| Total | 770 (77.6%) | 705 (86.1%) |
Income Below Poverty Among Married-Couple Families in Claycomo
The poverty statistics for married-couple families in Claycomo show that 13.3% or 27 of the total 203 families live below the poverty line. Families with 3 or 4 children have the highest poverty rate of 50.0%, comprising of 3 families. On the other hand, families with 1 or 2 children have the lowest poverty rate of 11.6%, which includes 5 families.
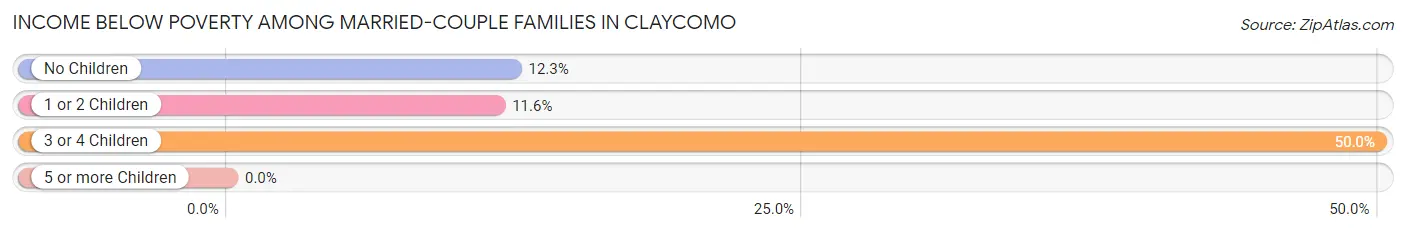
| Children | Above Poverty | Below Poverty |
| No Children | 135 (87.7%) | 19 (12.3%) |
| 1 or 2 Children | 38 (88.4%) | 5 (11.6%) |
| 3 or 4 Children | 3 (50.0%) | 3 (50.0%) |
| 5 or more Children | 0 (0.0%) | 0 (0.0%) |
| Total | 176 (86.7%) | 27 (13.3%) |
Income Below Poverty Among Single-Parent Households in Claycomo
According to the poverty data in Claycomo, 23.6% or 13 single-father households and 8.6% or 13 single-mother households are living below the poverty line. Among single-father households, those with 3 or 4 children have the highest poverty rate, with 2 households (100.0%) experiencing poverty. Likewise, among single-mother households, those with 3 or 4 children have the highest poverty rate, with 3 households (30.0%) falling below the poverty line.
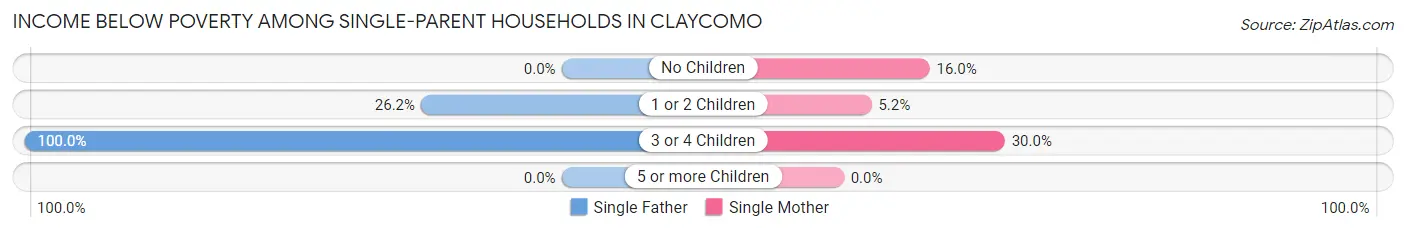
| Children | Single Father | Single Mother |
| No Children | 0 (0.0%) | 4 (16.0%) |
| 1 or 2 Children | 11 (26.2%) | 6 (5.2%) |
| 3 or 4 Children | 2 (100.0%) | 3 (30.0%) |
| 5 or more Children | 0 (0.0%) | 0 (0.0%) |
| Total | 13 (23.6%) | 13 (8.6%) |
Income Below Poverty Among Married-Couple vs Single-Parent Households in Claycomo
The poverty data for Claycomo shows that 27 of the married-couple family households (13.3%) and 26 of the single-parent households (12.6%) are living below the poverty level. Within the married-couple family households, those with 3 or 4 children have the highest poverty rate, with 3 households (50.0%) falling below the poverty line. Among the single-parent households, those with 3 or 4 children have the highest poverty rate, with 5 household (41.7%) living below poverty.
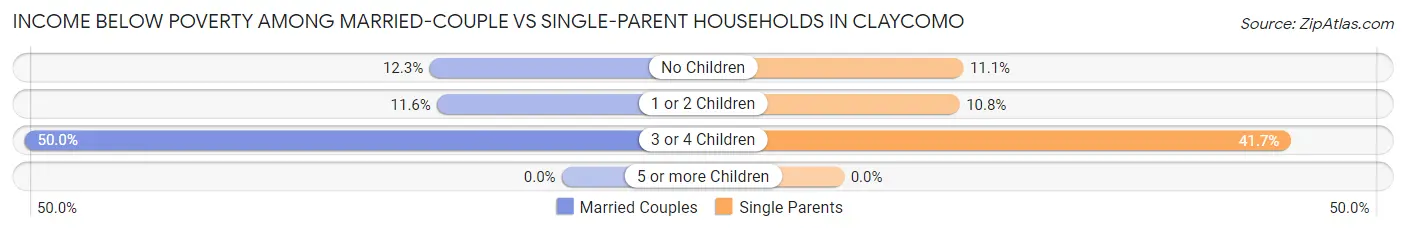
| Children | Married-Couple Families | Single-Parent Households |
| No Children | 19 (12.3%) | 4 (11.1%) |
| 1 or 2 Children | 5 (11.6%) | 17 (10.8%) |
| 3 or 4 Children | 3 (50.0%) | 5 (41.7%) |
| 5 or more Children | 0 (0.0%) | 0 (0.0%) |
| Total | 27 (13.3%) | 26 (12.6%) |
Employment Characteristics in Claycomo
Employment by Class of Employer in Claycomo
Among the 852 employed individuals in Claycomo, private company employees (702 | 82.4%), self-employed (not incorporated) (57 | 6.7%), and not-for-profit organizations (29 | 3.4%) make up the most common classes of employment.
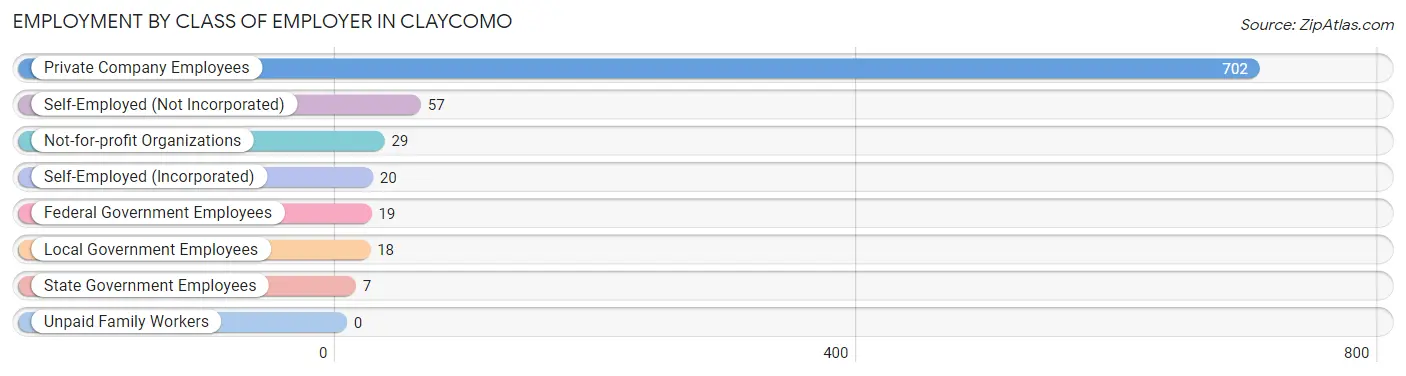
| Employer Class | # Employees | % Employees |
| Private Company Employees | 702 | 82.4% |
| Self-Employed (Incorporated) | 20 | 2.4% |
| Self-Employed (Not Incorporated) | 57 | 6.7% |
| Not-for-profit Organizations | 29 | 3.4% |
| Local Government Employees | 18 | 2.1% |
| State Government Employees | 7 | 0.8% |
| Federal Government Employees | 19 | 2.2% |
| Unpaid Family Workers | 0 | 0.0% |
| Total | 852 | 100.0% |
Employment Status by Age in Claycomo
According to the labor force statistics for Claycomo, out of the total population over 16 years of age (1,374), 68.9% or 947 individuals are in the labor force, with 6.1% or 58 of them unemployed. The age group with the highest labor force participation rate is 30 to 34 years, with 97.2% or 103 individuals in the labor force. Within the labor force, the 20 to 24 years age range has the highest percentage of unemployed individuals, with 15.9% or 13 of them being unemployed.
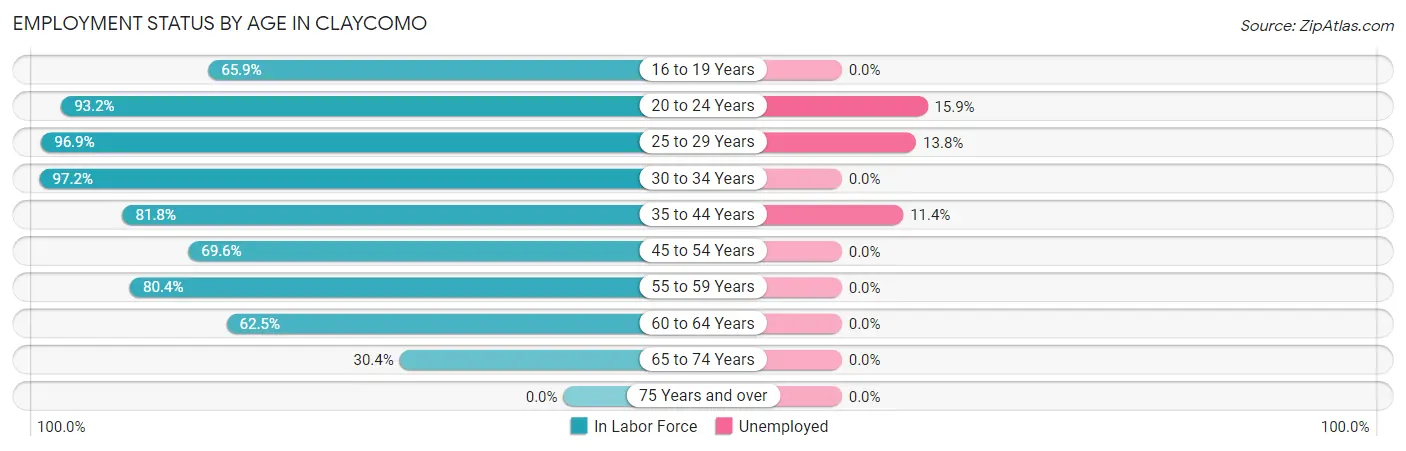
| Age Bracket | In Labor Force | Unemployed |
| 16 to 19 Years | 27 (65.9%) | 0 (0.0%) |
| 20 to 24 Years | 82 (93.2%) | 13 (15.9%) |
| 25 to 29 Years | 188 (96.9%) | 26 (13.8%) |
| 30 to 34 Years | 103 (97.2%) | 0 (0.0%) |
| 35 to 44 Years | 166 (81.8%) | 19 (11.4%) |
| 45 to 54 Years | 112 (69.6%) | 0 (0.0%) |
| 55 to 59 Years | 127 (80.4%) | 0 (0.0%) |
| 60 to 64 Years | 80 (62.5%) | 0 (0.0%) |
| 65 to 74 Years | 62 (30.4%) | 0 (0.0%) |
| 75 Years and over | 0 (0.0%) | 0 (0.0%) |
| Total | 947 (68.9%) | 58 (6.1%) |
Employment Status by Educational Attainment in Claycomo
According to labor force statistics for Claycomo, 81.7% of individuals (776) out of the total population between 25 and 64 years of age (950) are in the labor force, with 5.8% or 45 of them being unemployed. The group with the highest labor force participation rate are those with the educational attainment of bachelor's degree or higher, with 90.5% or 95 individuals in the labor force. Within the labor force, individuals with less than high school education have the highest percentage of unemployment, with 50.0% or 13 of them being unemployed.
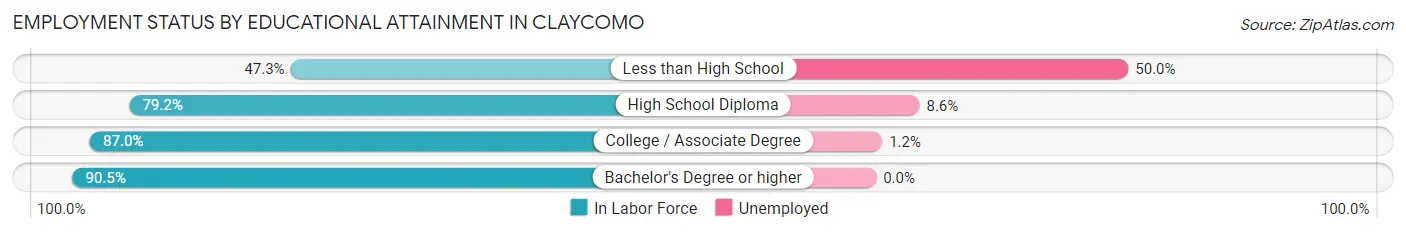
| Educational Attainment | In Labor Force | Unemployed |
| Less than High School | 26 (47.3%) | 28 (50.0%) |
| High School Diploma | 327 (79.2%) | 36 (8.6%) |
| College / Associate Degree | 328 (87.0%) | 5 (1.2%) |
| Bachelor's Degree or higher | 95 (90.5%) | 0 (0.0%) |
| Total | 776 (81.7%) | 55 (5.8%) |
Employment Occupations by Sex in Claycomo
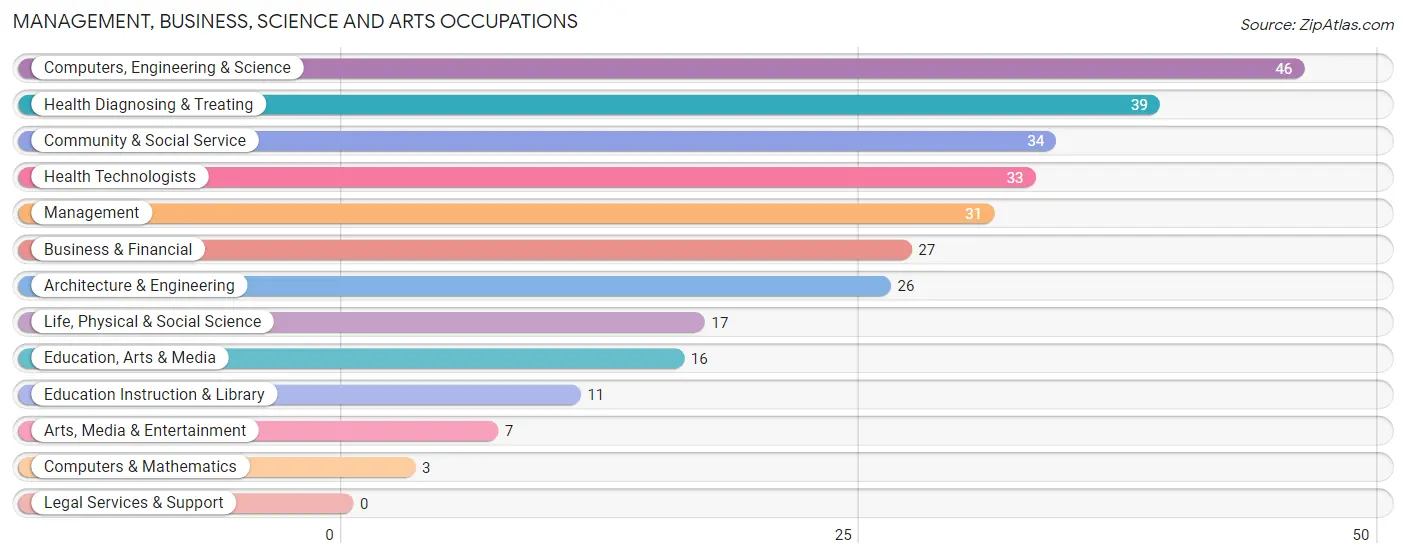
Management, Business, Science and Arts Occupations
The most common Management, Business, Science and Arts occupations in Claycomo are Computers, Engineering & Science (46 | 5.2%), Health Diagnosing & Treating (39 | 4.4%), Community & Social Service (34 | 3.8%), Health Technologists (33 | 3.7%), and Management (31 | 3.5%).
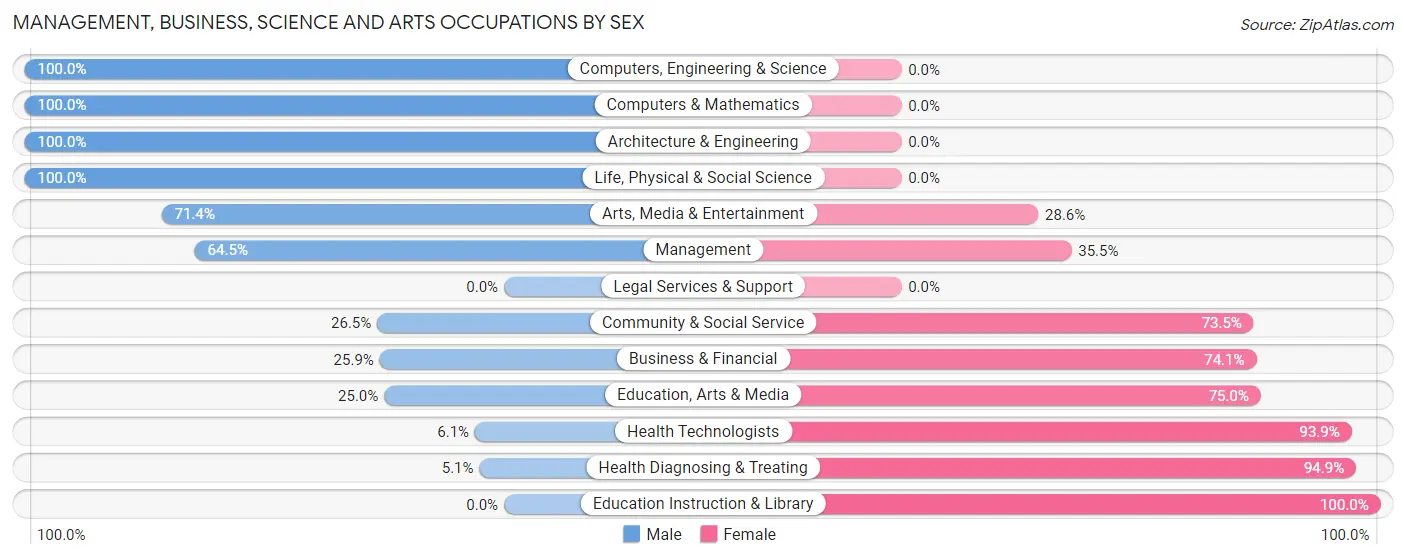
Management, Business, Science and Arts Occupations by Sex
Within the Management, Business, Science and Arts occupations in Claycomo, the most male-oriented occupations are Computers, Engineering & Science (100.0%), Computers & Mathematics (100.0%), and Architecture & Engineering (100.0%), while the most female-oriented occupations are Education Instruction & Library (100.0%), Health Diagnosing & Treating (94.9%), and Health Technologists (93.9%).
| Occupation | Male | Female |
| Management | 20 (64.5%) | 11 (35.5%) |
| Business & Financial | 7 (25.9%) | 20 (74.1%) |
| Computers, Engineering & Science | 46 (100.0%) | 0 (0.0%) |
| Computers & Mathematics | 3 (100.0%) | 0 (0.0%) |
| Architecture & Engineering | 26 (100.0%) | 0 (0.0%) |
| Life, Physical & Social Science | 17 (100.0%) | 0 (0.0%) |
| Community & Social Service | 9 (26.5%) | 25 (73.5%) |
| Education, Arts & Media | 4 (25.0%) | 12 (75.0%) |
| Legal Services & Support | 0 (0.0%) | 0 (0.0%) |
| Education Instruction & Library | 0 (0.0%) | 11 (100.0%) |
| Arts, Media & Entertainment | 5 (71.4%) | 2 (28.6%) |
| Health Diagnosing & Treating | 2 (5.1%) | 37 (94.9%) |
| Health Technologists | 2 (6.1%) | 31 (93.9%) |
| Total (Category) | 84 (47.5%) | 93 (52.5%) |
| Total (Overall) | 478 (53.8%) | 411 (46.2%) |
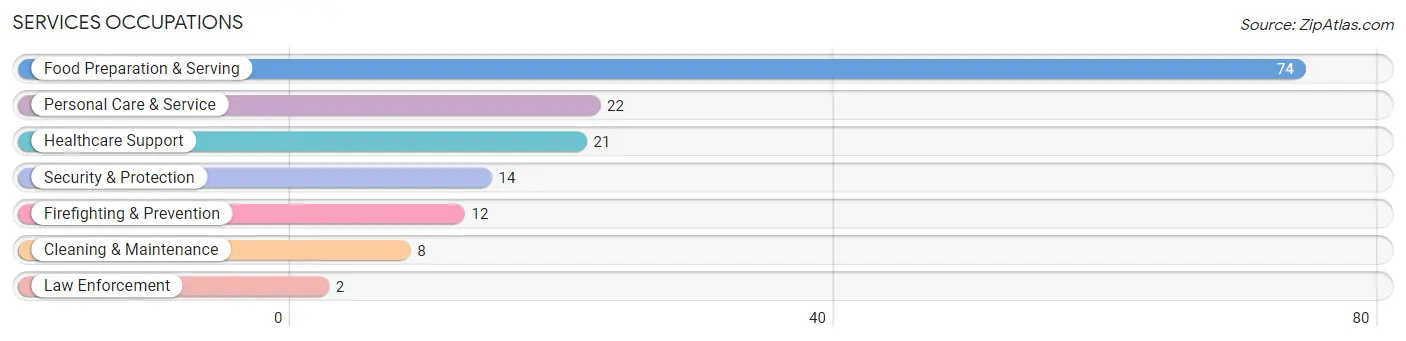
Services Occupations
The most common Services occupations in Claycomo are Food Preparation & Serving (74 | 8.3%), Personal Care & Service (22 | 2.5%), Healthcare Support (21 | 2.4%), Security & Protection (14 | 1.6%), and Firefighting & Prevention (12 | 1.3%).
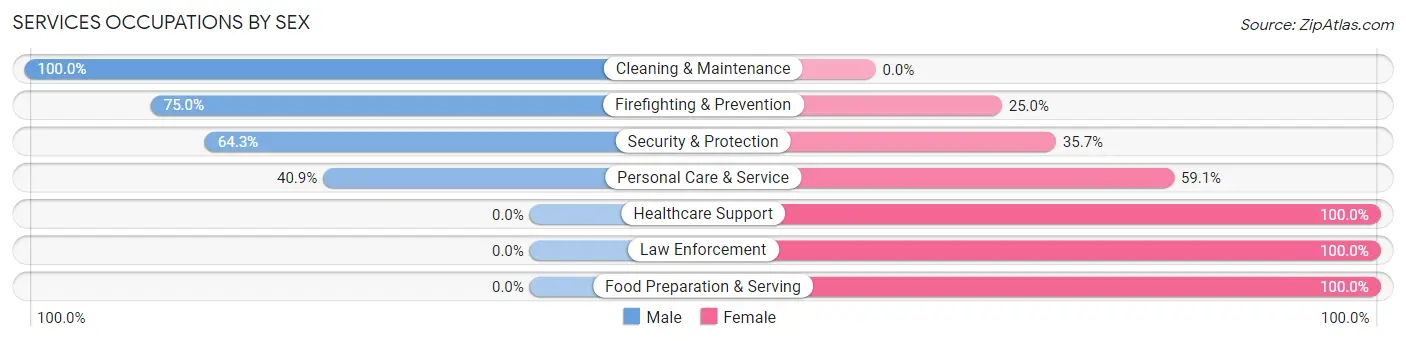
Services Occupations by Sex
Within the Services occupations in Claycomo, the most male-oriented occupations are Cleaning & Maintenance (100.0%), Firefighting & Prevention (75.0%), and Security & Protection (64.3%), while the most female-oriented occupations are Healthcare Support (100.0%), Law Enforcement (100.0%), and Food Preparation & Serving (100.0%).
| Occupation | Male | Female |
| Healthcare Support | 0 (0.0%) | 21 (100.0%) |
| Security & Protection | 9 (64.3%) | 5 (35.7%) |
| Firefighting & Prevention | 9 (75.0%) | 3 (25.0%) |
| Law Enforcement | 0 (0.0%) | 2 (100.0%) |
| Food Preparation & Serving | 0 (0.0%) | 74 (100.0%) |
| Cleaning & Maintenance | 8 (100.0%) | 0 (0.0%) |
| Personal Care & Service | 9 (40.9%) | 13 (59.1%) |
| Total (Category) | 26 (18.7%) | 113 (81.3%) |
| Total (Overall) | 478 (53.8%) | 411 (46.2%) |
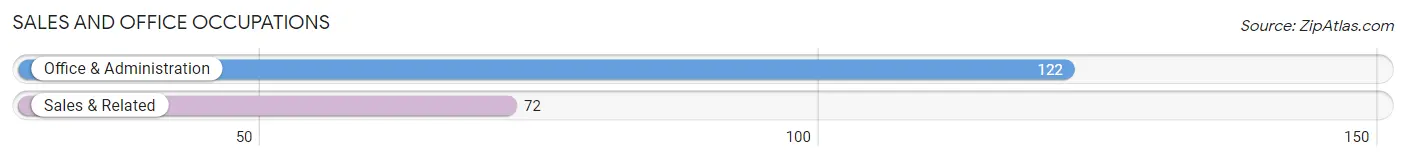
Sales and Office Occupations
The most common Sales and Office occupations in Claycomo are Office & Administration (122 | 13.7%), and Sales & Related (72 | 8.1%).
Sales and Office Occupations by Sex
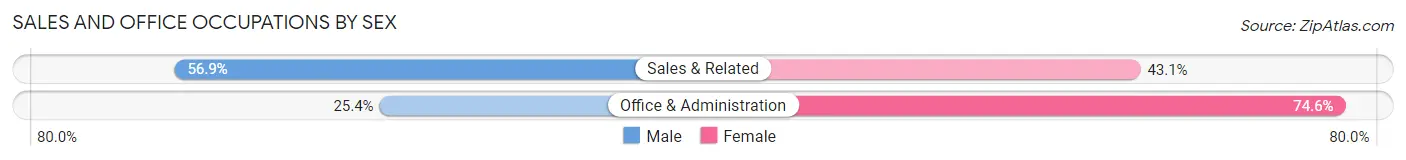
| Occupation | Male | Female |
| Sales & Related | 41 (56.9%) | 31 (43.1%) |
| Office & Administration | 31 (25.4%) | 91 (74.6%) |
| Total (Category) | 72 (37.1%) | 122 (62.9%) |
| Total (Overall) | 478 (53.8%) | 411 (46.2%) |
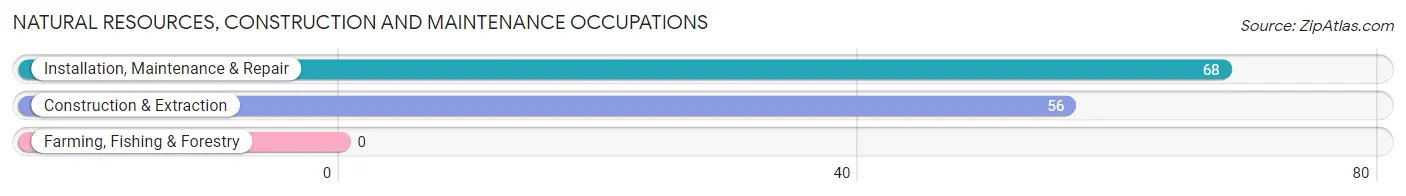
Natural Resources, Construction and Maintenance Occupations
The most common Natural Resources, Construction and Maintenance occupations in Claycomo are Installation, Maintenance & Repair (68 | 7.6%), and Construction & Extraction (56 | 6.3%).
Natural Resources, Construction and Maintenance Occupations by Sex
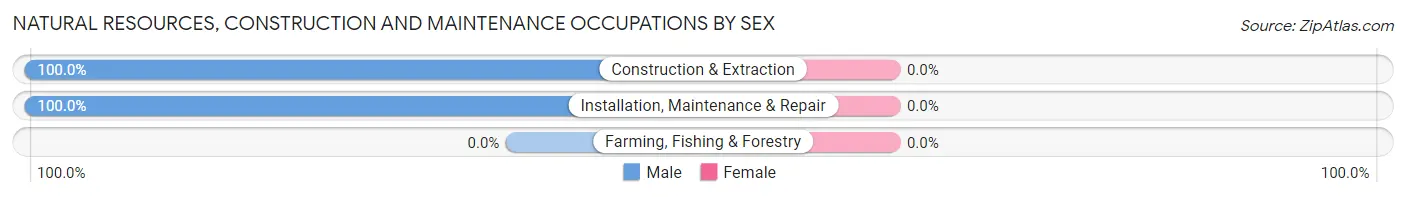
| Occupation | Male | Female |
| Farming, Fishing & Forestry | 0 (0.0%) | 0 (0.0%) |
| Construction & Extraction | 56 (100.0%) | 0 (0.0%) |
| Installation, Maintenance & Repair | 68 (100.0%) | 0 (0.0%) |
| Total (Category) | 124 (100.0%) | 0 (0.0%) |
| Total (Overall) | 478 (53.8%) | 411 (46.2%) |
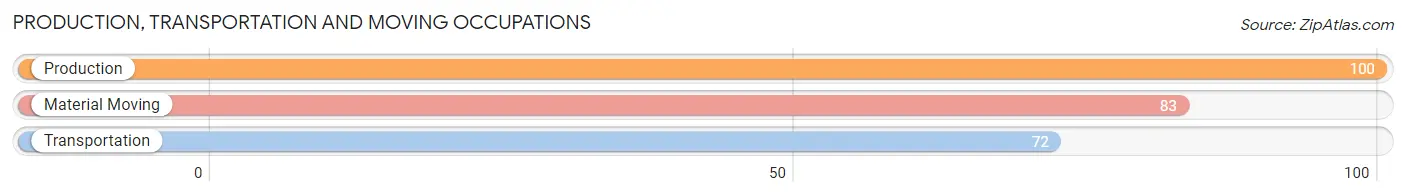
Production, Transportation and Moving Occupations
The most common Production, Transportation and Moving occupations in Claycomo are Production (100 | 11.3%), Material Moving (83 | 9.3%), and Transportation (72 | 8.1%).
Production, Transportation and Moving Occupations by Sex
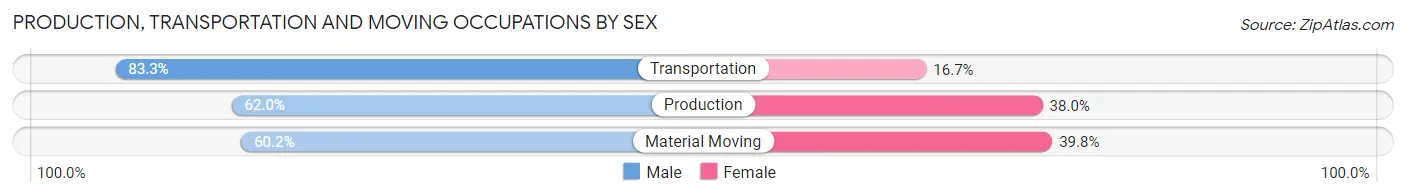
| Occupation | Male | Female |
| Production | 62 (62.0%) | 38 (38.0%) |
| Transportation | 60 (83.3%) | 12 (16.7%) |
| Material Moving | 50 (60.2%) | 33 (39.8%) |
| Total (Category) | 172 (67.4%) | 83 (32.6%) |
| Total (Overall) | 478 (53.8%) | 411 (46.2%) |
Employment Industries by Sex in Claycomo
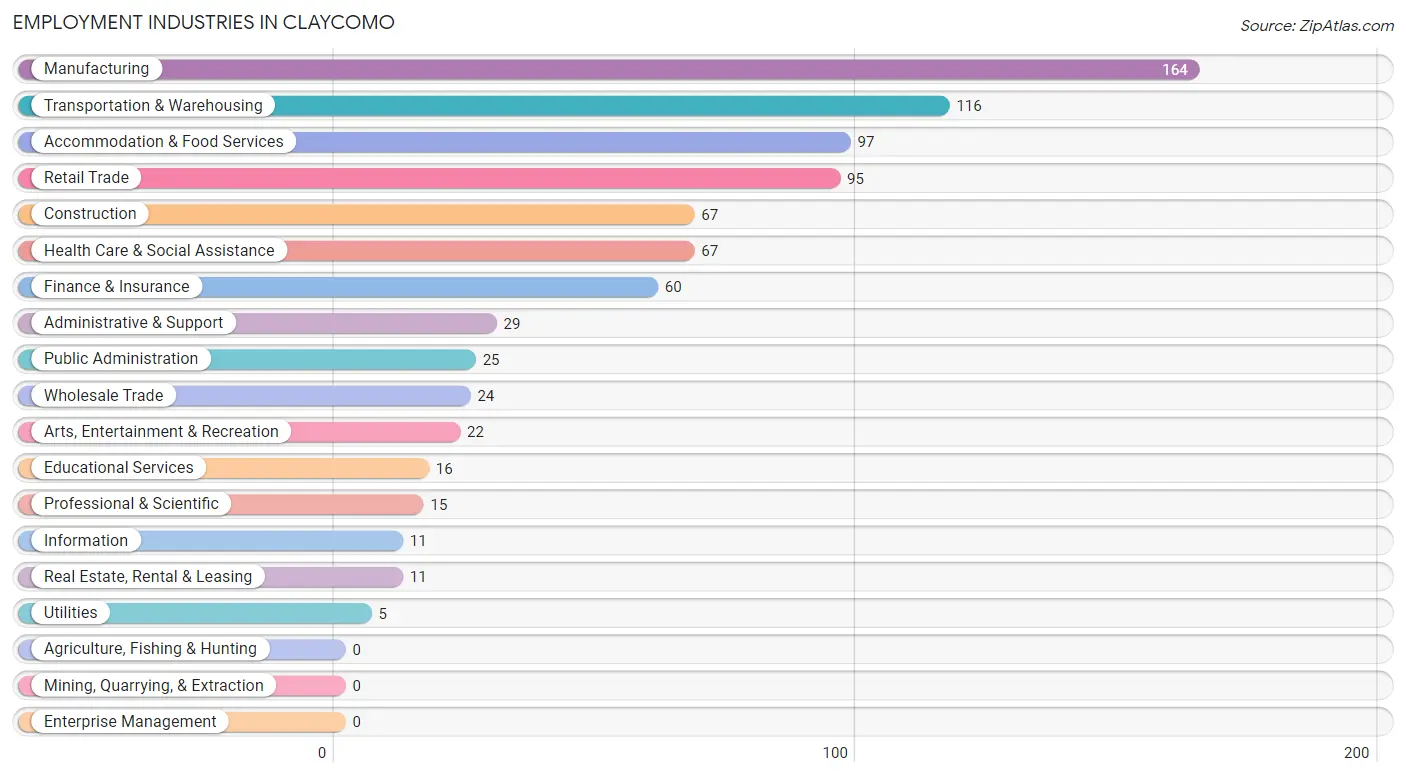
Employment Industries in Claycomo
The major employment industries in Claycomo include Manufacturing (164 | 18.4%), Transportation & Warehousing (116 | 13.1%), Accommodation & Food Services (97 | 10.9%), Retail Trade (95 | 10.7%), and Construction (67 | 7.5%).
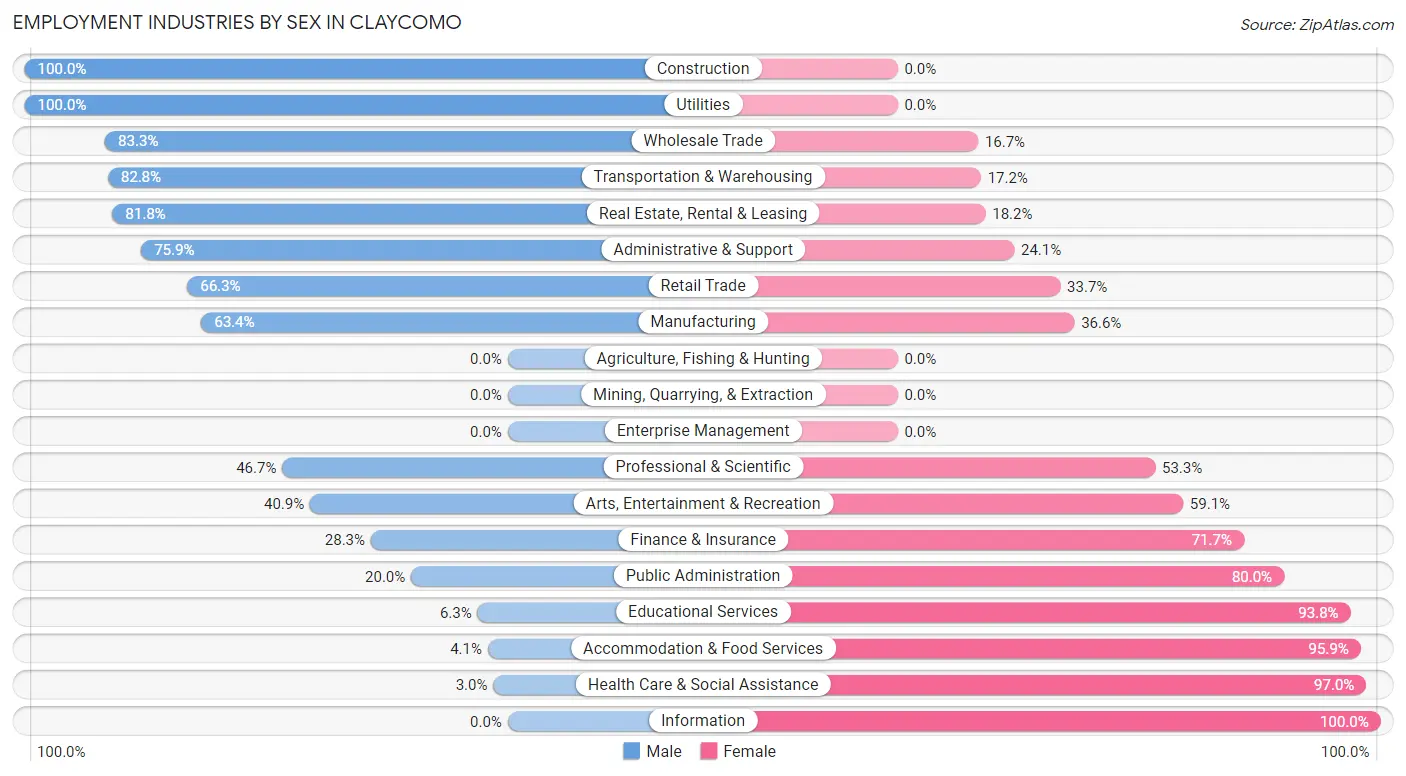
Employment Industries by Sex in Claycomo
The Claycomo industries that see more men than women are Construction (100.0%), Utilities (100.0%), and Wholesale Trade (83.3%), whereas the industries that tend to have a higher number of women are Information (100.0%), Health Care & Social Assistance (97.0%), and Accommodation & Food Services (95.9%).
| Industry | Male | Female |
| Agriculture, Fishing & Hunting | 0 (0.0%) | 0 (0.0%) |
| Mining, Quarrying, & Extraction | 0 (0.0%) | 0 (0.0%) |
| Construction | 67 (100.0%) | 0 (0.0%) |
| Manufacturing | 104 (63.4%) | 60 (36.6%) |
| Wholesale Trade | 20 (83.3%) | 4 (16.7%) |
| Retail Trade | 63 (66.3%) | 32 (33.7%) |
| Transportation & Warehousing | 96 (82.8%) | 20 (17.2%) |
| Utilities | 5 (100.0%) | 0 (0.0%) |
| Information | 0 (0.0%) | 11 (100.0%) |
| Finance & Insurance | 17 (28.3%) | 43 (71.7%) |
| Real Estate, Rental & Leasing | 9 (81.8%) | 2 (18.2%) |
| Professional & Scientific | 7 (46.7%) | 8 (53.3%) |
| Enterprise Management | 0 (0.0%) | 0 (0.0%) |
| Administrative & Support | 22 (75.9%) | 7 (24.1%) |
| Educational Services | 1 (6.2%) | 15 (93.8%) |
| Health Care & Social Assistance | 2 (3.0%) | 65 (97.0%) |
| Arts, Entertainment & Recreation | 9 (40.9%) | 13 (59.1%) |
| Accommodation & Food Services | 4 (4.1%) | 93 (95.9%) |
| Public Administration | 5 (20.0%) | 20 (80.0%) |
| Total | 478 (53.8%) | 411 (46.2%) |
Education in Claycomo
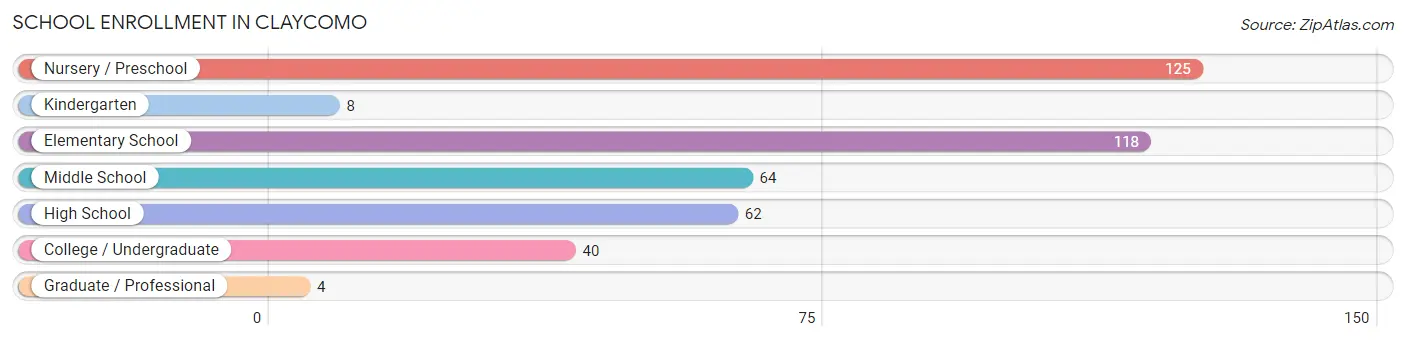
School Enrollment in Claycomo
The most common levels of schooling among the 421 students in Claycomo are nursery / preschool (125 | 29.7%), elementary school (118 | 28.0%), and middle school (64 | 15.2%).
| School Level | # Students | % Students |
| Nursery / Preschool | 125 | 29.7% |
| Kindergarten | 8 | 1.9% |
| Elementary School | 118 | 28.0% |
| Middle School | 64 | 15.2% |
| High School | 62 | 14.7% |
| College / Undergraduate | 40 | 9.5% |
| Graduate / Professional | 4 | 0.9% |
| Total | 421 | 100.0% |
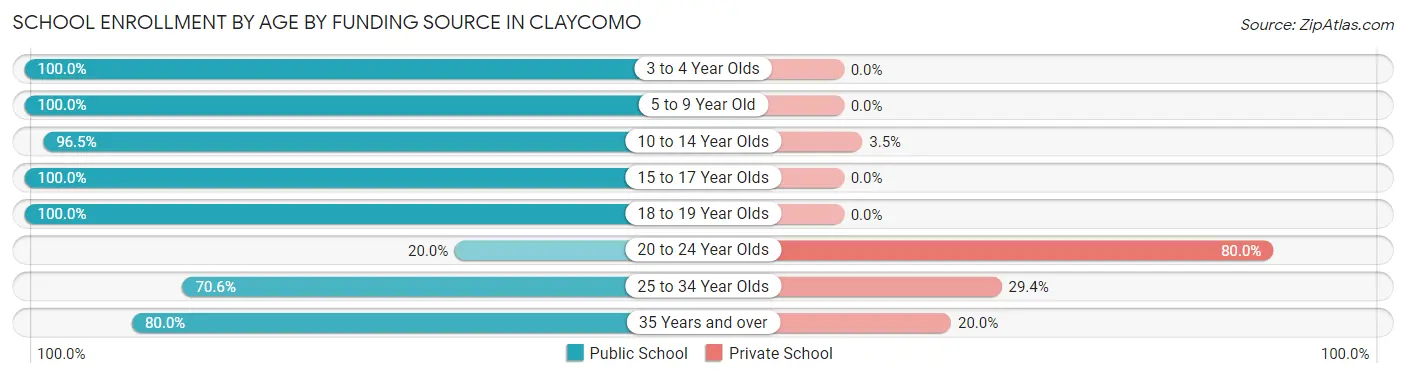
School Enrollment by Age by Funding Source in Claycomo
Out of a total of 421 students who are enrolled in schools in Claycomo, 19 (4.5%) attend a private institution, while the remaining 402 (95.5%) are enrolled in public schools. The age group of 20 to 24 year olds has the highest likelihood of being enrolled in private schools, with 8 (80.0% in the age bracket) enrolled. Conversely, the age group of 3 to 4 year olds has the lowest likelihood of being enrolled in a private school, with 121 (100.0% in the age bracket) attending a public institution.
| Age Bracket | Public School | Private School |
| 3 to 4 Year Olds | 121 (100.0%) | 0 (0.0%) |
| 5 to 9 Year Old | 109 (100.0%) | 0 (0.0%) |
| 10 to 14 Year Olds | 111 (96.5%) | 4 (3.5%) |
| 15 to 17 Year Olds | 29 (100.0%) | 0 (0.0%) |
| 18 to 19 Year Olds | 10 (100.0%) | 0 (0.0%) |
| 20 to 24 Year Olds | 2 (20.0%) | 8 (80.0%) |
| 25 to 34 Year Olds | 12 (70.6%) | 5 (29.4%) |
| 35 Years and over | 8 (80.0%) | 2 (20.0%) |
| Total | 402 (95.5%) | 19 (4.5%) |
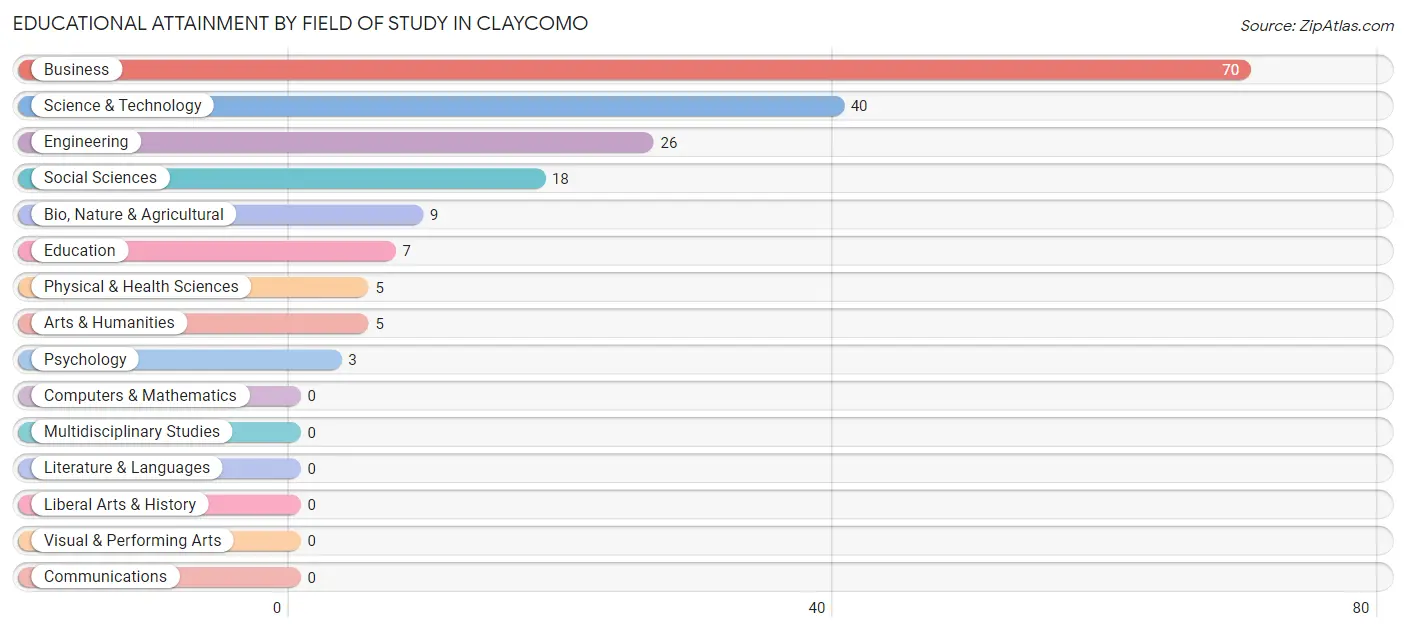
Educational Attainment by Field of Study in Claycomo
Business (70 | 38.3%), science & technology (40 | 21.9%), engineering (26 | 14.2%), social sciences (18 | 9.8%), and bio, nature & agricultural (9 | 4.9%) are the most common fields of study among 183 individuals in Claycomo who have obtained a bachelor's degree or higher.
| Field of Study | # Graduates | % Graduates |
| Computers & Mathematics | 0 | 0.0% |
| Bio, Nature & Agricultural | 9 | 4.9% |
| Physical & Health Sciences | 5 | 2.7% |
| Psychology | 3 | 1.6% |
| Social Sciences | 18 | 9.8% |
| Engineering | 26 | 14.2% |
| Multidisciplinary Studies | 0 | 0.0% |
| Science & Technology | 40 | 21.9% |
| Business | 70 | 38.3% |
| Education | 7 | 3.8% |
| Literature & Languages | 0 | 0.0% |
| Liberal Arts & History | 0 | 0.0% |
| Visual & Performing Arts | 0 | 0.0% |
| Communications | 0 | 0.0% |
| Arts & Humanities | 5 | 2.7% |
| Total | 183 | 100.0% |
Transportation & Commute in Claycomo
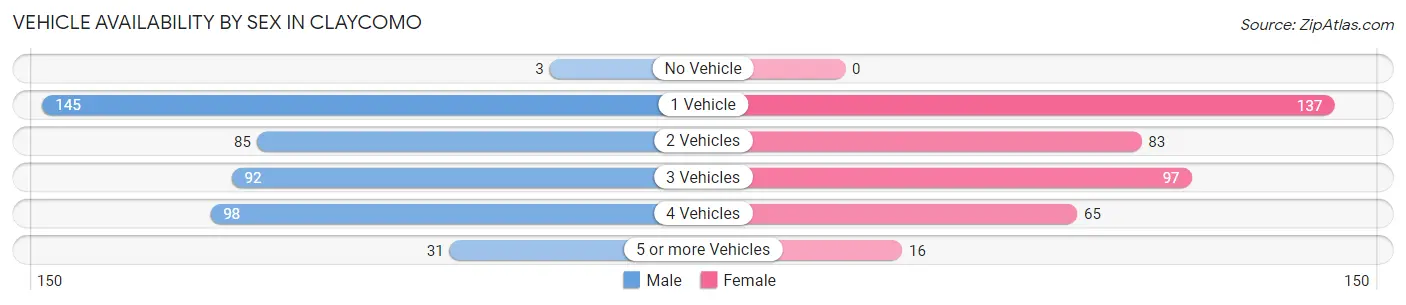
Vehicle Availability by Sex in Claycomo
The most prevalent vehicle ownership categories in Claycomo are males with 1 vehicle (145, accounting for 31.9%) and females with 1 vehicle (137, making up 36.4%).
| Vehicles Available | Male | Female |
| No Vehicle | 3 (0.7%) | 0 (0.0%) |
| 1 Vehicle | 145 (31.9%) | 137 (34.4%) |
| 2 Vehicles | 85 (18.7%) | 83 (20.8%) |
| 3 Vehicles | 92 (20.3%) | 97 (24.4%) |
| 4 Vehicles | 98 (21.6%) | 65 (16.3%) |
| 5 or more Vehicles | 31 (6.8%) | 16 (4.0%) |
| Total | 454 (100.0%) | 398 (100.0%) |
Commute Time in Claycomo
The most frequently occuring commute durations in Claycomo are 15 to 19 minutes (164 commuters, 21.5%), 5 to 9 minutes (154 commuters, 20.2%), and 20 to 24 minutes (140 commuters, 18.4%).
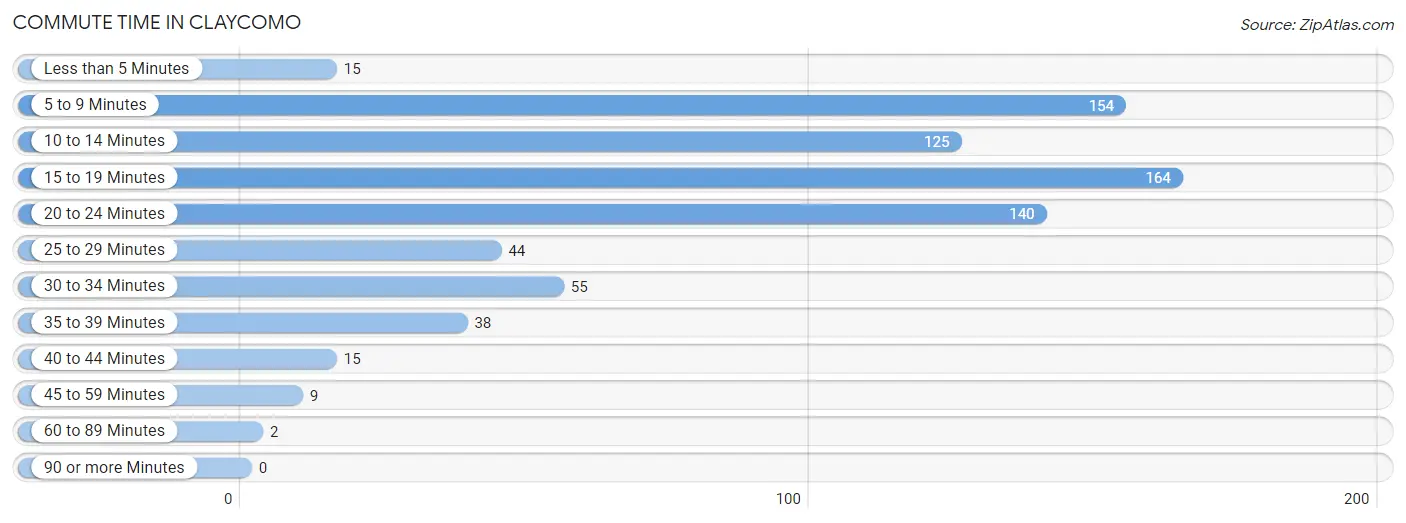
| Commute Time | # Commuters | % Commuters |
| Less than 5 Minutes | 15 | 2.0% |
| 5 to 9 Minutes | 154 | 20.2% |
| 10 to 14 Minutes | 125 | 16.4% |
| 15 to 19 Minutes | 164 | 21.5% |
| 20 to 24 Minutes | 140 | 18.4% |
| 25 to 29 Minutes | 44 | 5.8% |
| 30 to 34 Minutes | 55 | 7.2% |
| 35 to 39 Minutes | 38 | 5.0% |
| 40 to 44 Minutes | 15 | 2.0% |
| 45 to 59 Minutes | 9 | 1.2% |
| 60 to 89 Minutes | 2 | 0.3% |
| 90 or more Minutes | 0 | 0.0% |
Commute Time by Sex in Claycomo
The most common commute times in Claycomo are 15 to 19 minutes (96 commuters, 24.5%) for males and 5 to 9 minutes (102 commuters, 27.6%) for females.
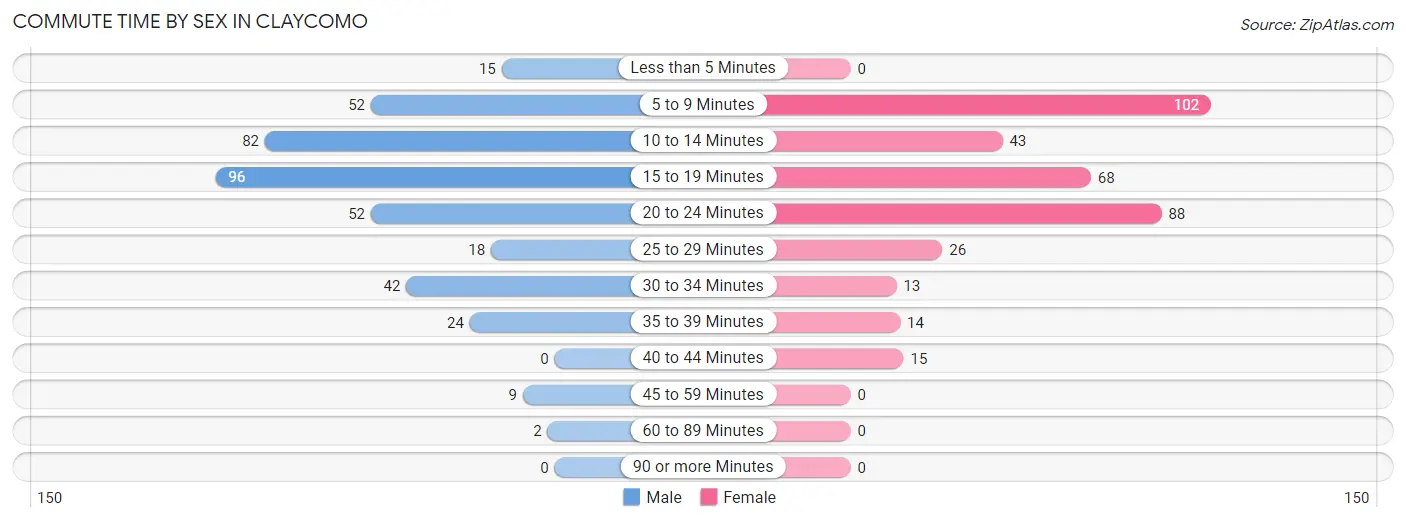
| Commute Time | Male | Female |
| Less than 5 Minutes | 15 (3.8%) | 0 (0.0%) |
| 5 to 9 Minutes | 52 (13.3%) | 102 (27.6%) |
| 10 to 14 Minutes | 82 (20.9%) | 43 (11.7%) |
| 15 to 19 Minutes | 96 (24.5%) | 68 (18.4%) |
| 20 to 24 Minutes | 52 (13.3%) | 88 (23.8%) |
| 25 to 29 Minutes | 18 (4.6%) | 26 (7.0%) |
| 30 to 34 Minutes | 42 (10.7%) | 13 (3.5%) |
| 35 to 39 Minutes | 24 (6.1%) | 14 (3.8%) |
| 40 to 44 Minutes | 0 (0.0%) | 15 (4.1%) |
| 45 to 59 Minutes | 9 (2.3%) | 0 (0.0%) |
| 60 to 89 Minutes | 2 (0.5%) | 0 (0.0%) |
| 90 or more Minutes | 0 (0.0%) | 0 (0.0%) |
Time of Departure to Work by Sex in Claycomo
The most frequent times of departure to work in Claycomo are 7:00 AM to 7:29 AM (46, 11.7%) for males and 12:00 AM to 4:59 AM (99, 26.8%) for females.
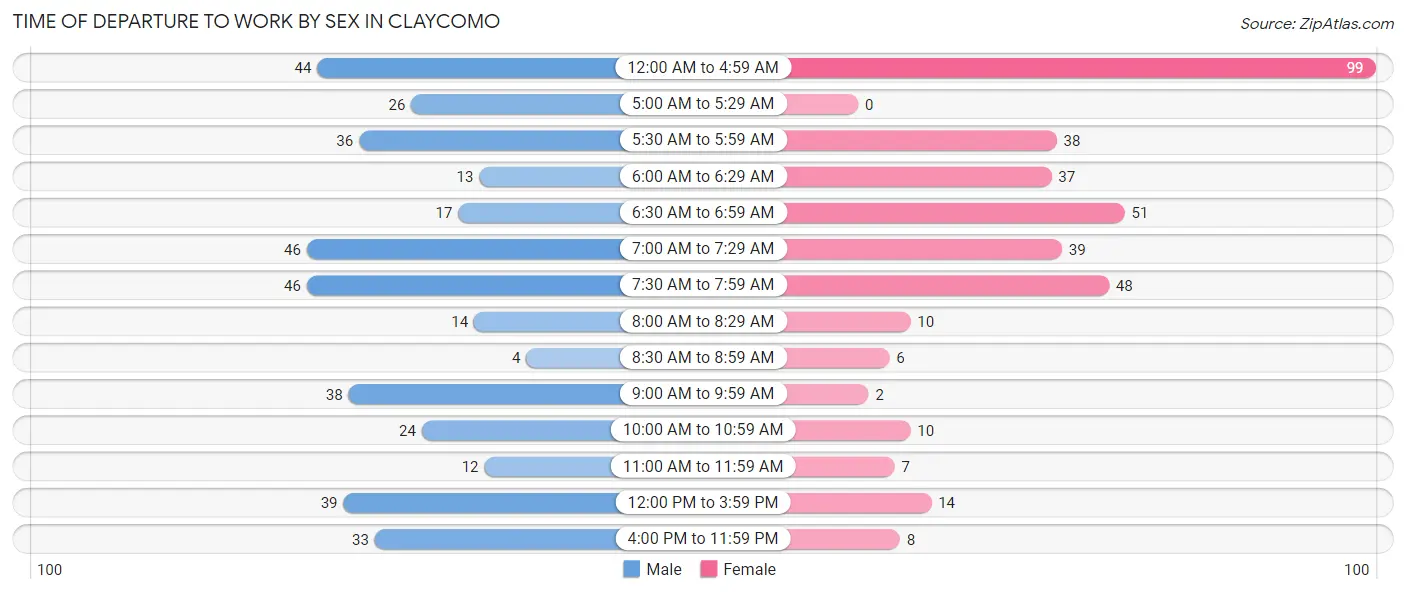
| Time of Departure | Male | Female |
| 12:00 AM to 4:59 AM | 44 (11.2%) | 99 (26.8%) |
| 5:00 AM to 5:29 AM | 26 (6.6%) | 0 (0.0%) |
| 5:30 AM to 5:59 AM | 36 (9.2%) | 38 (10.3%) |
| 6:00 AM to 6:29 AM | 13 (3.3%) | 37 (10.0%) |
| 6:30 AM to 6:59 AM | 17 (4.3%) | 51 (13.8%) |
| 7:00 AM to 7:29 AM | 46 (11.7%) | 39 (10.6%) |
| 7:30 AM to 7:59 AM | 46 (11.7%) | 48 (13.0%) |
| 8:00 AM to 8:29 AM | 14 (3.6%) | 10 (2.7%) |
| 8:30 AM to 8:59 AM | 4 (1.0%) | 6 (1.6%) |
| 9:00 AM to 9:59 AM | 38 (9.7%) | 2 (0.5%) |
| 10:00 AM to 10:59 AM | 24 (6.1%) | 10 (2.7%) |
| 11:00 AM to 11:59 AM | 12 (3.1%) | 7 (1.9%) |
| 12:00 PM to 3:59 PM | 39 (10.0%) | 14 (3.8%) |
| 4:00 PM to 11:59 PM | 33 (8.4%) | 8 (2.2%) |
| Total | 392 (100.0%) | 369 (100.0%) |
Housing Occupancy in Claycomo
Occupancy by Ownership in Claycomo
Of the total 727 dwellings in Claycomo, owner-occupied units account for 398 (54.7%), while renter-occupied units make up 329 (45.3%).
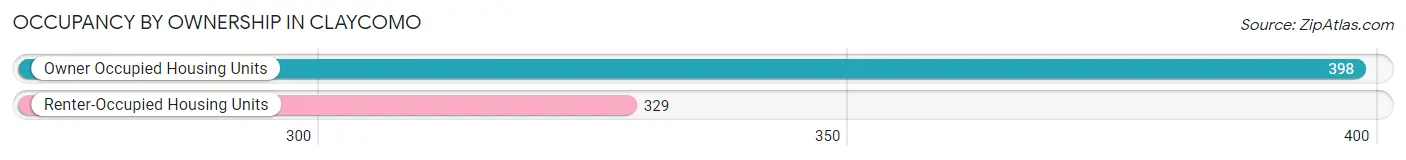
| Occupancy | # Housing Units | % Housing Units |
| Owner Occupied Housing Units | 398 | 54.7% |
| Renter-Occupied Housing Units | 329 | 45.3% |
| Total Occupied Housing Units | 727 | 100.0% |
Occupancy by Household Size in Claycomo
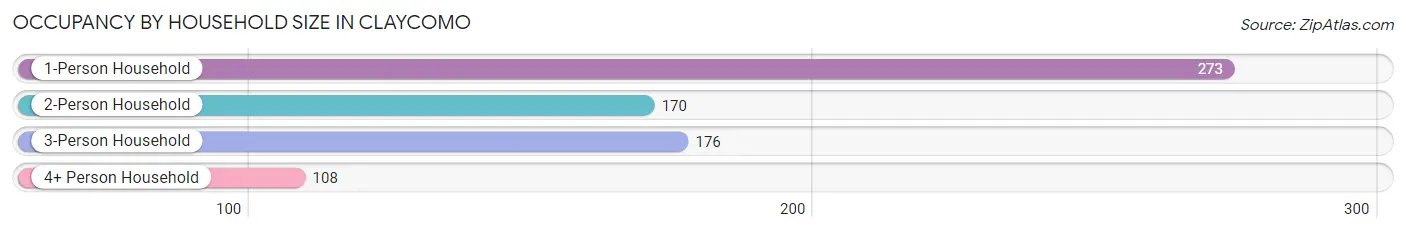
| Household Size | # Housing Units | % Housing Units |
| 1-Person Household | 273 | 37.6% |
| 2-Person Household | 170 | 23.4% |
| 3-Person Household | 176 | 24.2% |
| 4+ Person Household | 108 | 14.9% |
| Total Housing Units | 727 | 100.0% |
Occupancy by Ownership by Household Size in Claycomo
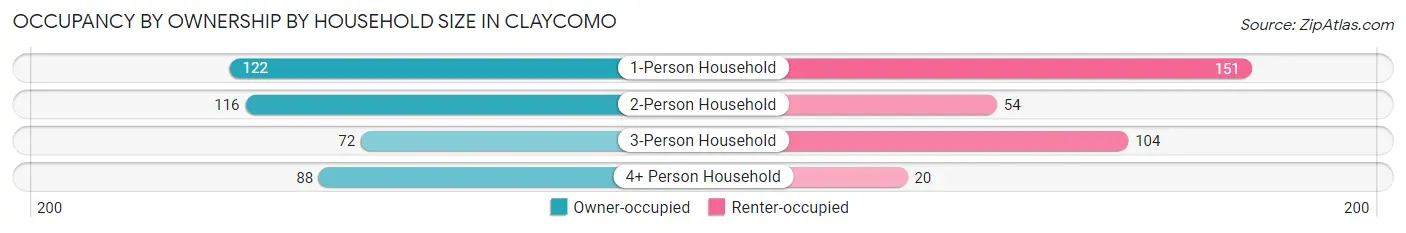
| Household Size | Owner-occupied | Renter-occupied |
| 1-Person Household | 122 (44.7%) | 151 (55.3%) |
| 2-Person Household | 116 (68.2%) | 54 (31.8%) |
| 3-Person Household | 72 (40.9%) | 104 (59.1%) |
| 4+ Person Household | 88 (81.5%) | 20 (18.5%) |
| Total Housing Units | 398 (54.7%) | 329 (45.3%) |
Occupancy by Educational Attainment in Claycomo
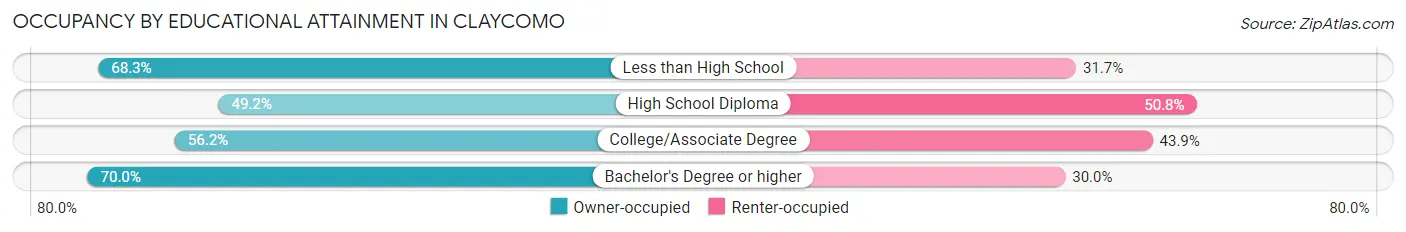
| Household Size | Owner-occupied | Renter-occupied |
| Less than High School | 28 (68.3%) | 13 (31.7%) |
| High School Diploma | 157 (49.2%) | 162 (50.8%) |
| College/Associate Degree | 178 (56.1%) | 139 (43.9%) |
| Bachelor's Degree or higher | 35 (70.0%) | 15 (30.0%) |
Occupancy by Age of Householder in Claycomo
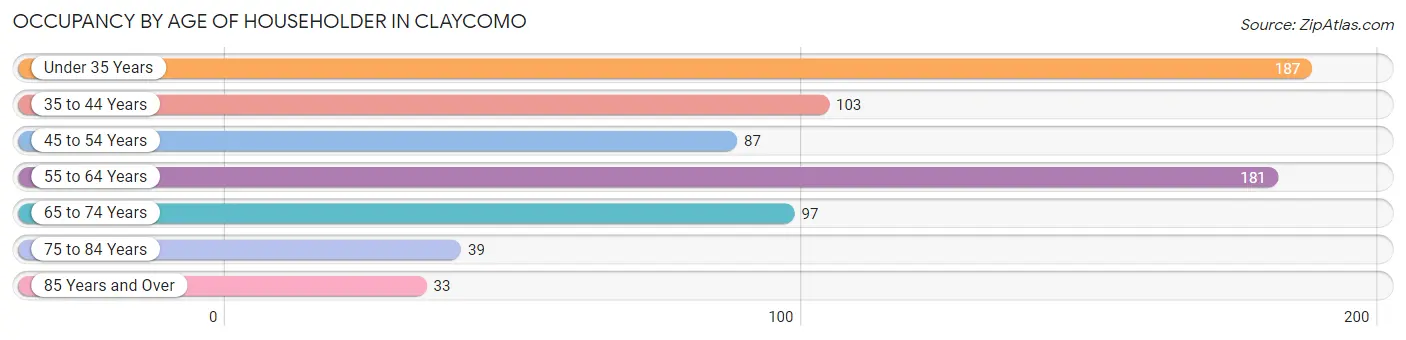
| Age Bracket | # Households | % Households |
| Under 35 Years | 187 | 25.7% |
| 35 to 44 Years | 103 | 14.2% |
| 45 to 54 Years | 87 | 12.0% |
| 55 to 64 Years | 181 | 24.9% |
| 65 to 74 Years | 97 | 13.3% |
| 75 to 84 Years | 39 | 5.4% |
| 85 Years and Over | 33 | 4.5% |
| Total | 727 | 100.0% |
Housing Finances in Claycomo
Median Income by Occupancy in Claycomo
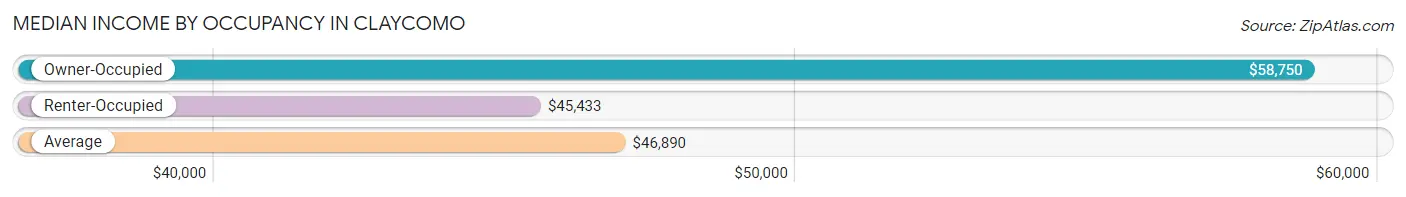
| Occupancy Type | # Households | Median Income |
| Owner-Occupied | 398 (54.7%) | $58,750 |
| Renter-Occupied | 329 (45.3%) | $45,433 |
| Average | 727 (100.0%) | $46,890 |
Occupancy by Householder Income Bracket in Claycomo
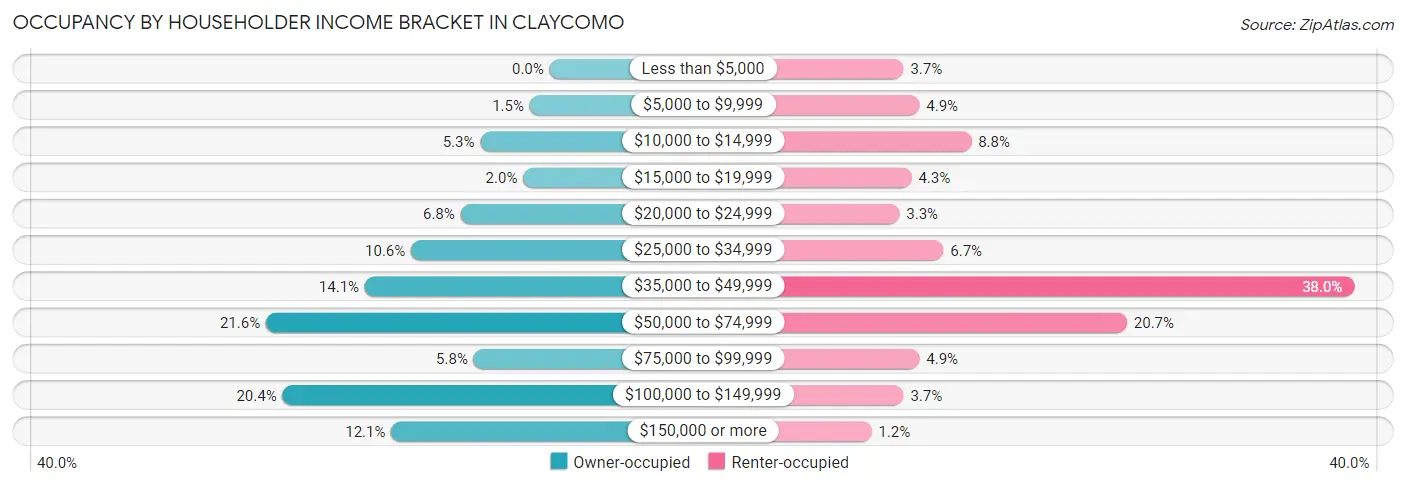
| Income Bracket | Owner-occupied | Renter-occupied |
| Less than $5,000 | 0 (0.0%) | 12 (3.6%) |
| $5,000 to $9,999 | 6 (1.5%) | 16 (4.9%) |
| $10,000 to $14,999 | 21 (5.3%) | 29 (8.8%) |
| $15,000 to $19,999 | 8 (2.0%) | 14 (4.3%) |
| $20,000 to $24,999 | 27 (6.8%) | 11 (3.3%) |
| $25,000 to $34,999 | 42 (10.5%) | 22 (6.7%) |
| $35,000 to $49,999 | 56 (14.1%) | 125 (38.0%) |
| $50,000 to $74,999 | 86 (21.6%) | 68 (20.7%) |
| $75,000 to $99,999 | 23 (5.8%) | 16 (4.9%) |
| $100,000 to $149,999 | 81 (20.3%) | 12 (3.6%) |
| $150,000 or more | 48 (12.1%) | 4 (1.2%) |
| Total | 398 (100.0%) | 329 (100.0%) |
Monthly Housing Cost Tiers in Claycomo
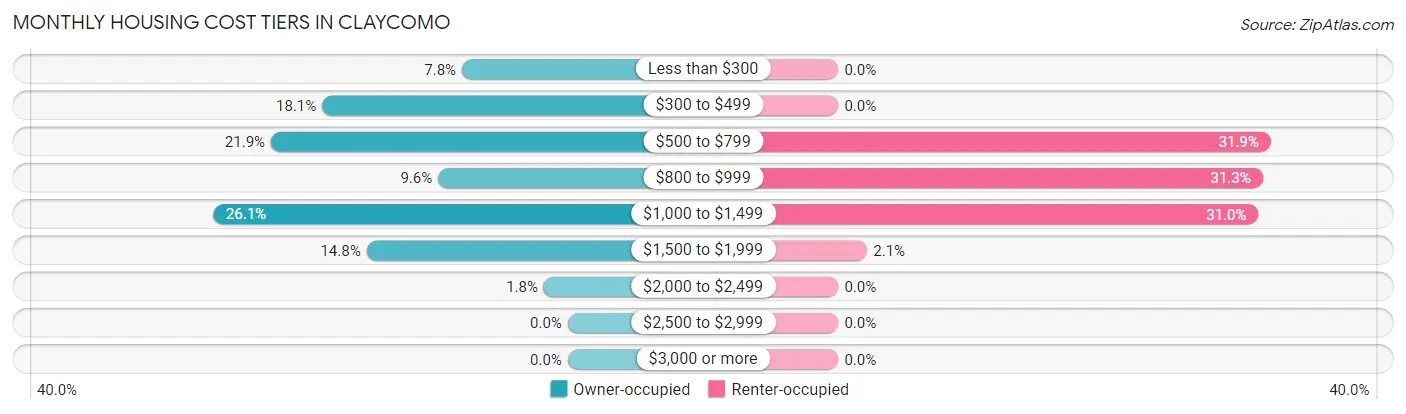
| Monthly Cost | Owner-occupied | Renter-occupied |
| Less than $300 | 31 (7.8%) | 0 (0.0%) |
| $300 to $499 | 72 (18.1%) | 0 (0.0%) |
| $500 to $799 | 87 (21.9%) | 105 (31.9%) |
| $800 to $999 | 38 (9.6%) | 103 (31.3%) |
| $1,000 to $1,499 | 104 (26.1%) | 102 (31.0%) |
| $1,500 to $1,999 | 59 (14.8%) | 7 (2.1%) |
| $2,000 to $2,499 | 7 (1.8%) | 0 (0.0%) |
| $2,500 to $2,999 | 0 (0.0%) | 0 (0.0%) |
| $3,000 or more | 0 (0.0%) | 0 (0.0%) |
| Total | 398 (100.0%) | 329 (100.0%) |
Physical Housing Characteristics in Claycomo
Housing Structures in Claycomo
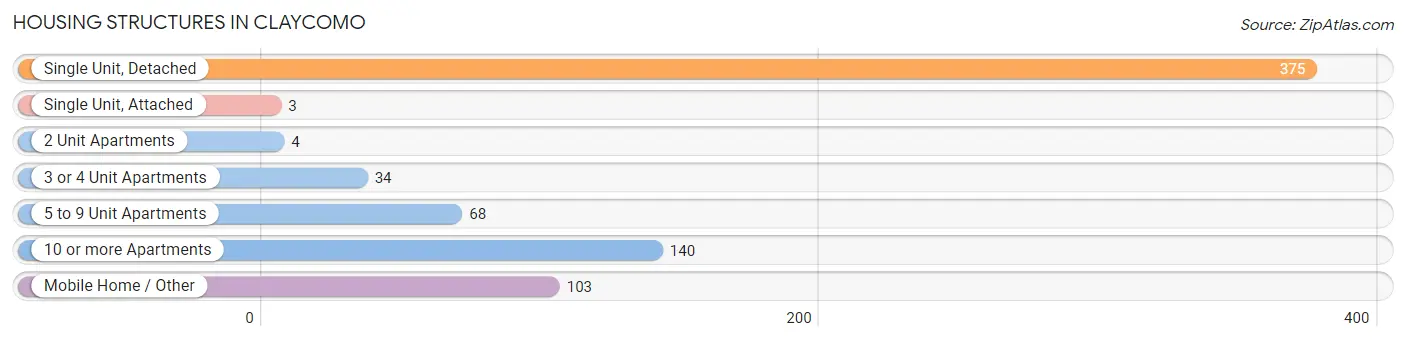
| Structure Type | # Housing Units | % Housing Units |
| Single Unit, Detached | 375 | 51.6% |
| Single Unit, Attached | 3 | 0.4% |
| 2 Unit Apartments | 4 | 0.5% |
| 3 or 4 Unit Apartments | 34 | 4.7% |
| 5 to 9 Unit Apartments | 68 | 9.3% |
| 10 or more Apartments | 140 | 19.3% |
| Mobile Home / Other | 103 | 14.2% |
| Total | 727 | 100.0% |
Housing Structures by Occupancy in Claycomo
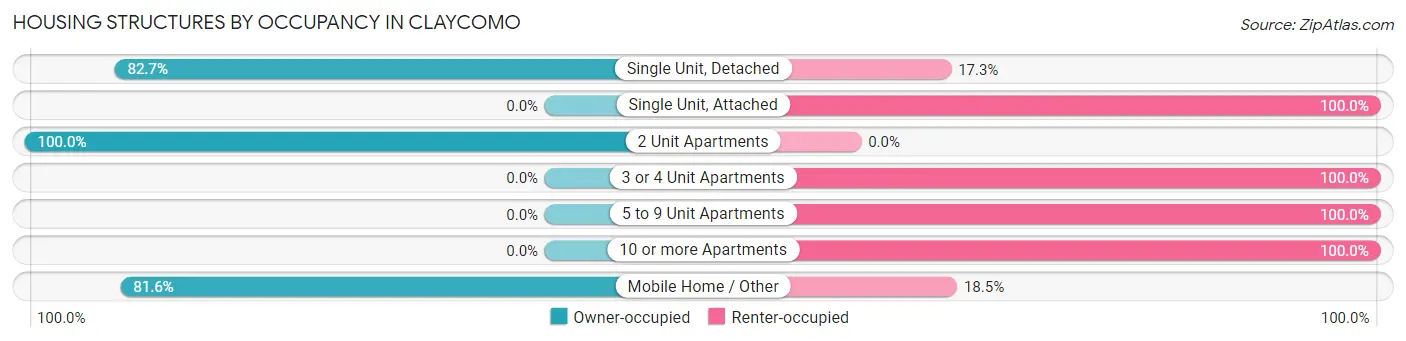
| Structure Type | Owner-occupied | Renter-occupied |
| Single Unit, Detached | 310 (82.7%) | 65 (17.3%) |
| Single Unit, Attached | 0 (0.0%) | 3 (100.0%) |
| 2 Unit Apartments | 4 (100.0%) | 0 (0.0%) |
| 3 or 4 Unit Apartments | 0 (0.0%) | 34 (100.0%) |
| 5 to 9 Unit Apartments | 0 (0.0%) | 68 (100.0%) |
| 10 or more Apartments | 0 (0.0%) | 140 (100.0%) |
| Mobile Home / Other | 84 (81.6%) | 19 (18.4%) |
| Total | 398 (54.7%) | 329 (45.3%) |
Housing Structures by Number of Rooms in Claycomo
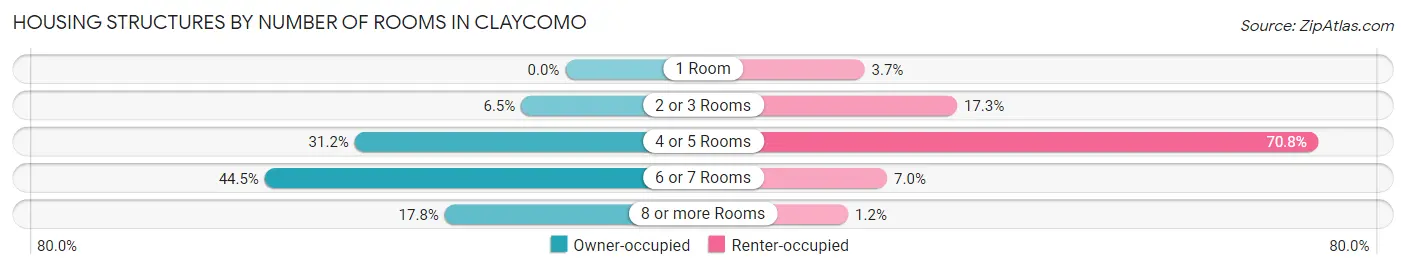
| Number of Rooms | Owner-occupied | Renter-occupied |
| 1 Room | 0 (0.0%) | 12 (3.6%) |
| 2 or 3 Rooms | 26 (6.5%) | 57 (17.3%) |
| 4 or 5 Rooms | 124 (31.2%) | 233 (70.8%) |
| 6 or 7 Rooms | 177 (44.5%) | 23 (7.0%) |
| 8 or more Rooms | 71 (17.8%) | 4 (1.2%) |
| Total | 398 (100.0%) | 329 (100.0%) |
Housing Structure by Heating Type in Claycomo
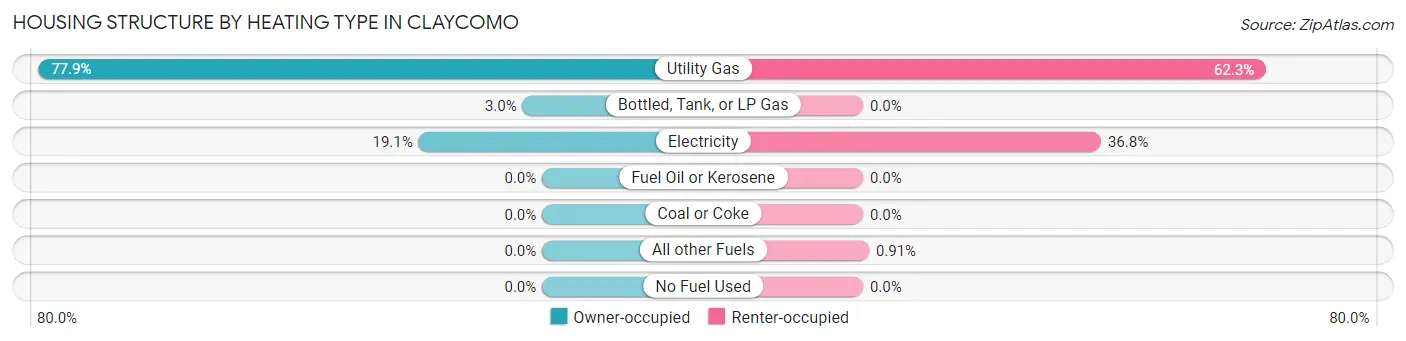
| Heating Type | Owner-occupied | Renter-occupied |
| Utility Gas | 310 (77.9%) | 205 (62.3%) |
| Bottled, Tank, or LP Gas | 12 (3.0%) | 0 (0.0%) |
| Electricity | 76 (19.1%) | 121 (36.8%) |
| Fuel Oil or Kerosene | 0 (0.0%) | 0 (0.0%) |
| Coal or Coke | 0 (0.0%) | 0 (0.0%) |
| All other Fuels | 0 (0.0%) | 3 (0.9%) |
| No Fuel Used | 0 (0.0%) | 0 (0.0%) |
| Total | 398 (100.0%) | 329 (100.0%) |
Household Vehicle Usage in Claycomo
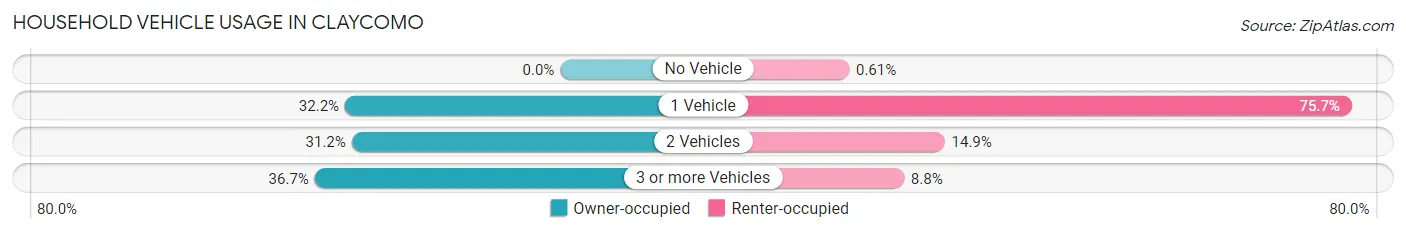
| Vehicles per Household | Owner-occupied | Renter-occupied |
| No Vehicle | 0 (0.0%) | 2 (0.6%) |
| 1 Vehicle | 128 (32.2%) | 249 (75.7%) |
| 2 Vehicles | 124 (31.2%) | 49 (14.9%) |
| 3 or more Vehicles | 146 (36.7%) | 29 (8.8%) |
| Total | 398 (100.0%) | 329 (100.0%) |
Real Estate & Mortgages in Claycomo
Real Estate and Mortgage Overview in Claycomo
| Characteristic | Without Mortgage | With Mortgage |
| Housing Units | 188 | 210 |
| Median Property Value | $104,700 | $149,500 |
| Median Household Income | $50,455 | $22 |
| Monthly Housing Costs | $511 | $0 |
| Real Estate Taxes | $1,596 | $5 |
Property Value by Mortgage Status in Claycomo
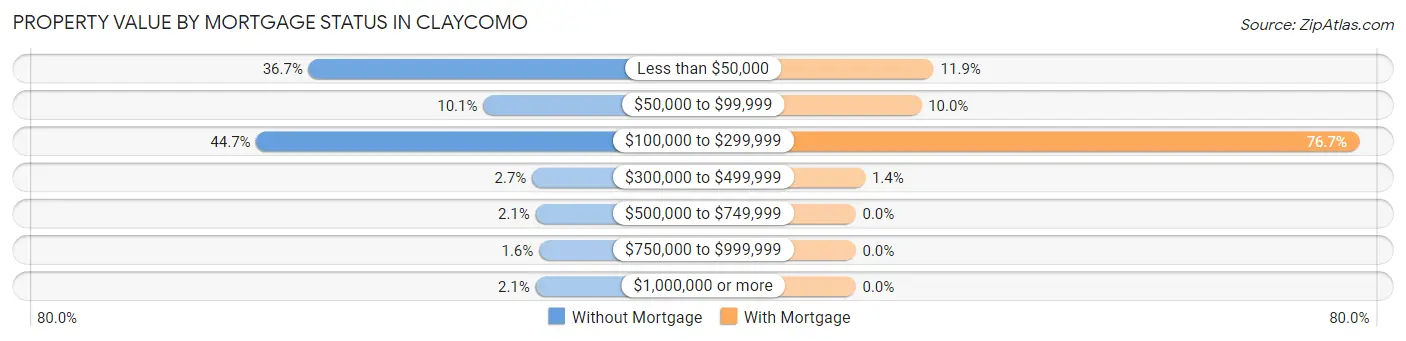
| Property Value | Without Mortgage | With Mortgage |
| Less than $50,000 | 69 (36.7%) | 25 (11.9%) |
| $50,000 to $99,999 | 19 (10.1%) | 21 (10.0%) |
| $100,000 to $299,999 | 84 (44.7%) | 161 (76.7%) |
| $300,000 to $499,999 | 5 (2.7%) | 3 (1.4%) |
| $500,000 to $749,999 | 4 (2.1%) | 0 (0.0%) |
| $750,000 to $999,999 | 3 (1.6%) | 0 (0.0%) |
| $1,000,000 or more | 4 (2.1%) | 0 (0.0%) |
| Total | 188 (100.0%) | 210 (100.0%) |
Household Income by Mortgage Status in Claycomo
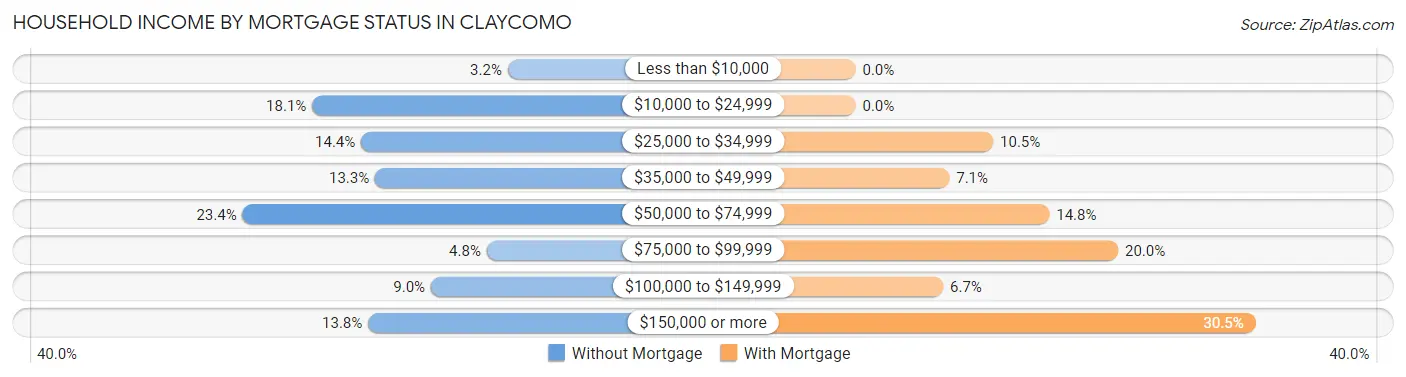
| Household Income | Without Mortgage | With Mortgage |
| Less than $10,000 | 6 (3.2%) | 0 (0.0%) |
| $10,000 to $24,999 | 34 (18.1%) | 0 (0.0%) |
| $25,000 to $34,999 | 27 (14.4%) | 22 (10.5%) |
| $35,000 to $49,999 | 25 (13.3%) | 15 (7.1%) |
| $50,000 to $74,999 | 44 (23.4%) | 31 (14.8%) |
| $75,000 to $99,999 | 9 (4.8%) | 42 (20.0%) |
| $100,000 to $149,999 | 17 (9.0%) | 14 (6.7%) |
| $150,000 or more | 26 (13.8%) | 64 (30.5%) |
| Total | 188 (100.0%) | 210 (100.0%) |
Property Value to Household Income Ratio in Claycomo
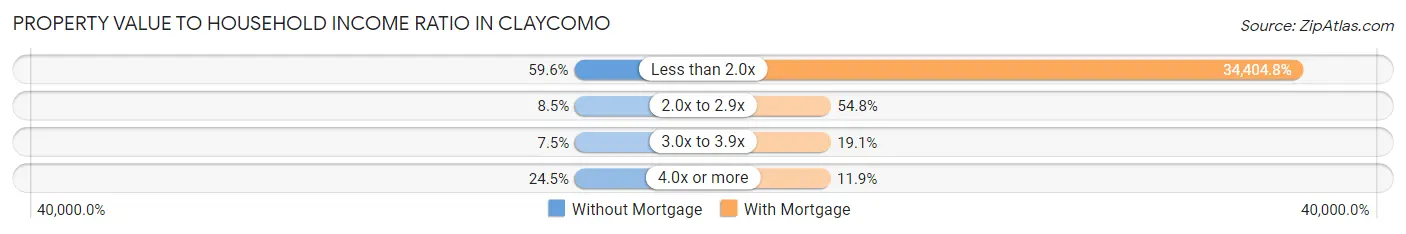
| Value-to-Income Ratio | Without Mortgage | With Mortgage |
| Less than 2.0x | 112 (59.6%) | 72,250 (34,404.8%) |
| 2.0x to 2.9x | 16 (8.5%) | 115 (54.8%) |
| 3.0x to 3.9x | 14 (7.4%) | 40 (19.1%) |
| 4.0x or more | 46 (24.5%) | 25 (11.9%) |
| Total | 188 (100.0%) | 210 (100.0%) |
Real Estate Taxes by Mortgage Status in Claycomo
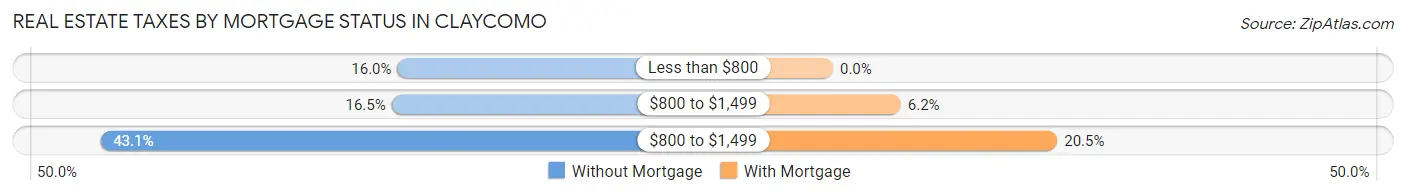
| Property Taxes | Without Mortgage | With Mortgage |
| Less than $800 | 30 (16.0%) | 0 (0.0%) |
| $800 to $1,499 | 31 (16.5%) | 13 (6.2%) |
| $800 to $1,499 | 81 (43.1%) | 43 (20.5%) |
| Total | 188 (100.0%) | 210 (100.0%) |
Health & Disability in Claycomo
Health Insurance Coverage by Age in Claycomo

| Age Bracket | With Coverage | Without Coverage |
| Under 6 Years | 201 (100.0%) | 0 (0.0%) |
| 6 to 18 Years | 214 (83.0%) | 44 (17.1%) |
| 19 to 25 Years | 89 (57.8%) | 65 (42.2%) |
| 26 to 34 Years | 223 (86.8%) | 34 (13.2%) |
| 35 to 44 Years | 154 (75.9%) | 49 (24.1%) |
| 45 to 54 Years | 115 (71.4%) | 46 (28.6%) |
| 55 to 64 Years | 258 (90.2%) | 28 (9.8%) |
| 65 to 74 Years | 204 (100.0%) | 0 (0.0%) |
| 75 Years and older | 91 (100.0%) | 0 (0.0%) |
| Total | 1,549 (85.3%) | 266 (14.7%) |
Health Insurance Coverage by Citizenship Status in Claycomo
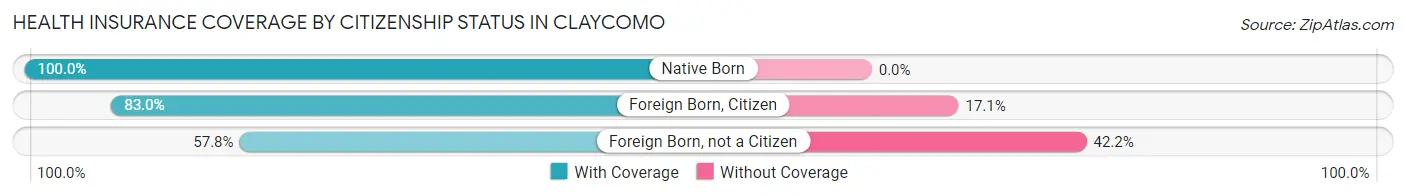
| Citizenship Status | With Coverage | Without Coverage |
| Native Born | 201 (100.0%) | 0 (0.0%) |
| Foreign Born, Citizen | 214 (83.0%) | 44 (17.1%) |
| Foreign Born, not a Citizen | 89 (57.8%) | 65 (42.2%) |
Health Insurance Coverage by Household Income in Claycomo
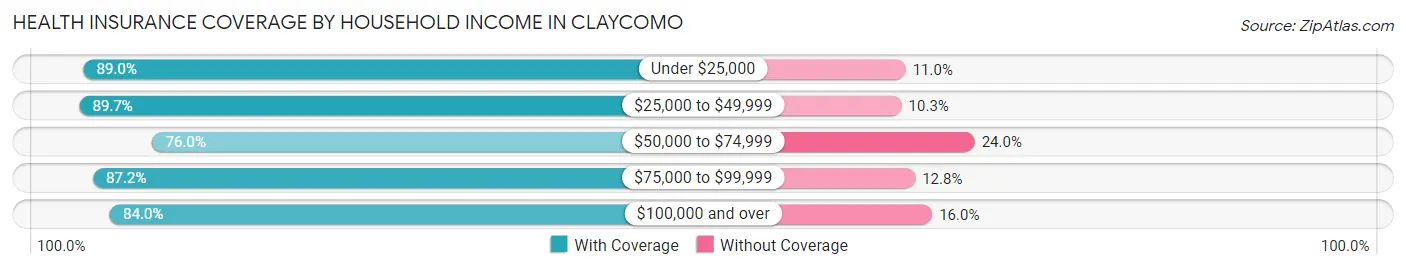
| Household Income | With Coverage | Without Coverage |
| Under $25,000 | 274 (89.0%) | 34 (11.0%) |
| $25,000 to $49,999 | 480 (89.7%) | 55 (10.3%) |
| $50,000 to $74,999 | 241 (76.0%) | 76 (24.0%) |
| $75,000 to $99,999 | 102 (87.2%) | 15 (12.8%) |
| $100,000 and over | 451 (84.0%) | 86 (16.0%) |
Public vs Private Health Insurance Coverage by Age in Claycomo
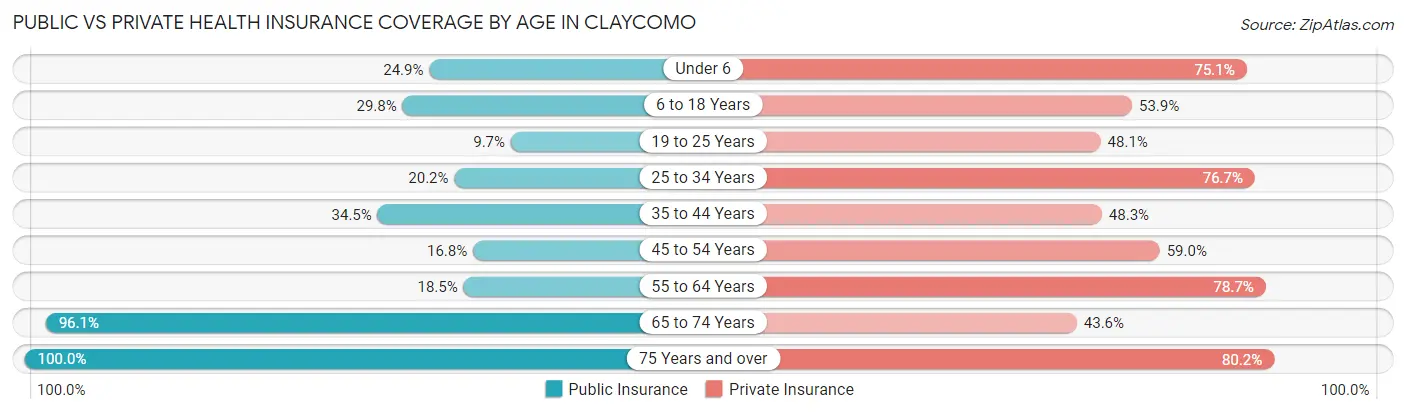
| Age Bracket | Public Insurance | Private Insurance |
| Under 6 | 50 (24.9%) | 151 (75.1%) |
| 6 to 18 Years | 77 (29.8%) | 139 (53.9%) |
| 19 to 25 Years | 15 (9.7%) | 74 (48.0%) |
| 25 to 34 Years | 52 (20.2%) | 197 (76.6%) |
| 35 to 44 Years | 70 (34.5%) | 98 (48.3%) |
| 45 to 54 Years | 27 (16.8%) | 95 (59.0%) |
| 55 to 64 Years | 53 (18.5%) | 225 (78.7%) |
| 65 to 74 Years | 196 (96.1%) | 89 (43.6%) |
| 75 Years and over | 91 (100.0%) | 73 (80.2%) |
| Total | 631 (34.8%) | 1,141 (62.9%) |
Disability Status by Sex by Age in Claycomo
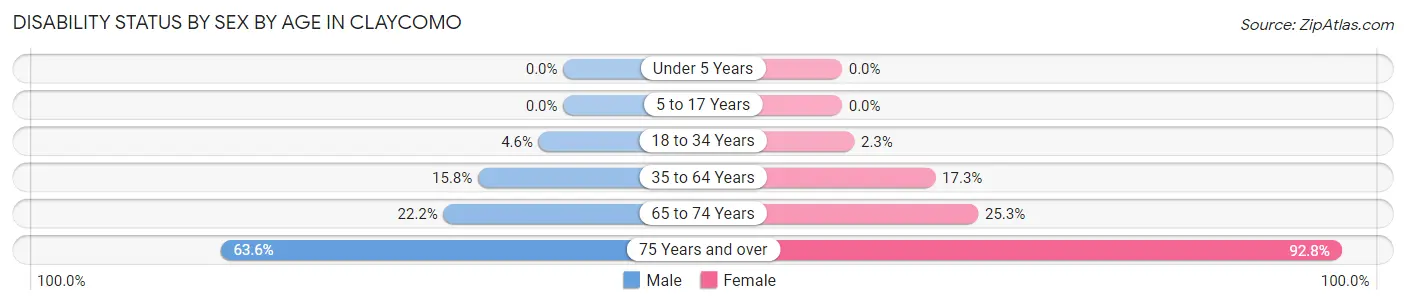
| Age Bracket | Male | Female |
| Under 5 Years | 0 (0.0%) | 0 (0.0%) |
| 5 to 17 Years | 0 (0.0%) | 0 (0.0%) |
| 18 to 34 Years | 9 (4.5%) | 5 (2.3%) |
| 35 to 64 Years | 59 (15.8%) | 48 (17.3%) |
| 65 to 74 Years | 26 (22.2%) | 22 (25.3%) |
| 75 Years and over | 14 (63.6%) | 64 (92.7%) |
Disability Class by Sex by Age in Claycomo
Disability Class: Hearing Difficulty
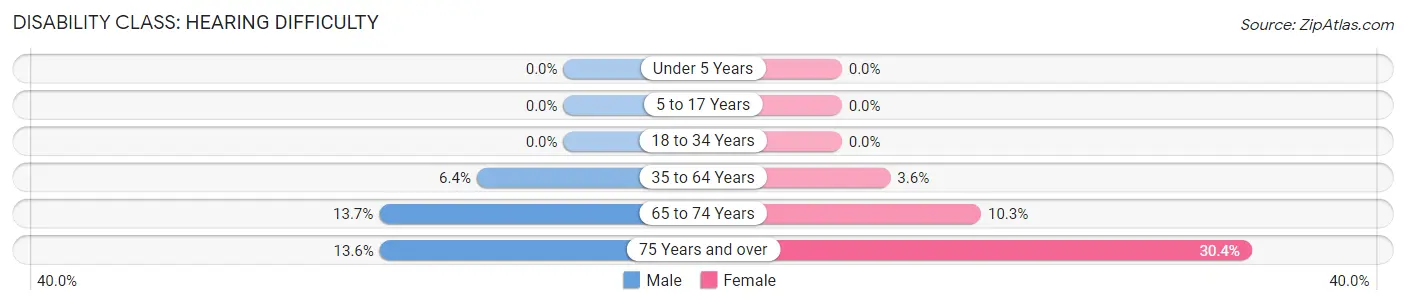
| Age Bracket | Male | Female |
| Under 5 Years | 0 (0.0%) | 0 (0.0%) |
| 5 to 17 Years | 0 (0.0%) | 0 (0.0%) |
| 18 to 34 Years | 0 (0.0%) | 0 (0.0%) |
| 35 to 64 Years | 24 (6.4%) | 10 (3.6%) |
| 65 to 74 Years | 16 (13.7%) | 9 (10.3%) |
| 75 Years and over | 3 (13.6%) | 21 (30.4%) |
Disability Class: Vision Difficulty
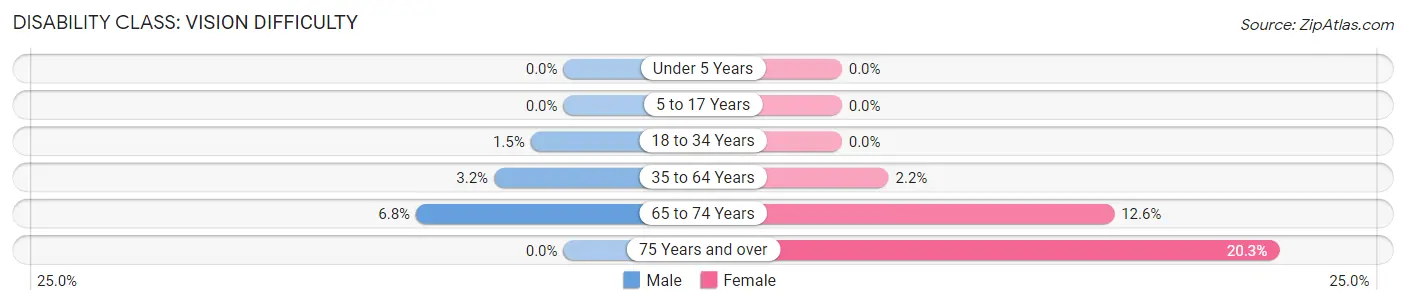
| Age Bracket | Male | Female |
| Under 5 Years | 0 (0.0%) | 0 (0.0%) |
| 5 to 17 Years | 0 (0.0%) | 0 (0.0%) |
| 18 to 34 Years | 3 (1.5%) | 0 (0.0%) |
| 35 to 64 Years | 12 (3.2%) | 6 (2.2%) |
| 65 to 74 Years | 8 (6.8%) | 11 (12.6%) |
| 75 Years and over | 0 (0.0%) | 14 (20.3%) |
Disability Class: Cognitive Difficulty
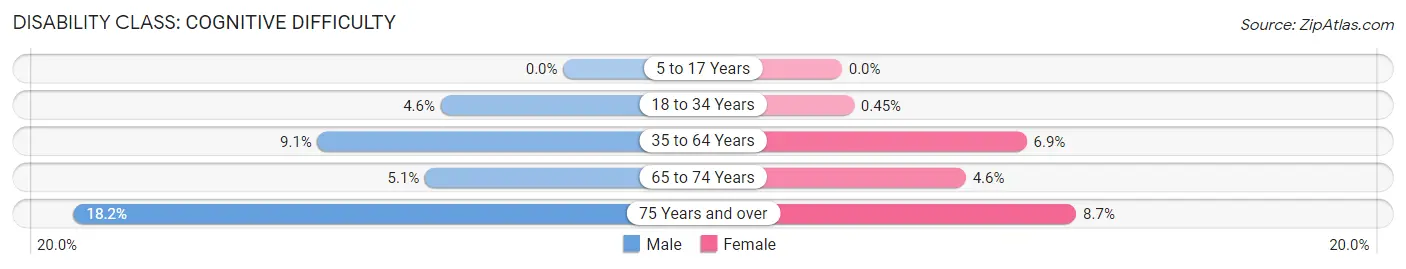
| Age Bracket | Male | Female |
| 5 to 17 Years | 0 (0.0%) | 0 (0.0%) |
| 18 to 34 Years | 9 (4.5%) | 1 (0.4%) |
| 35 to 64 Years | 34 (9.1%) | 19 (6.9%) |
| 65 to 74 Years | 6 (5.1%) | 4 (4.6%) |
| 75 Years and over | 4 (18.2%) | 6 (8.7%) |
Disability Class: Ambulatory Difficulty
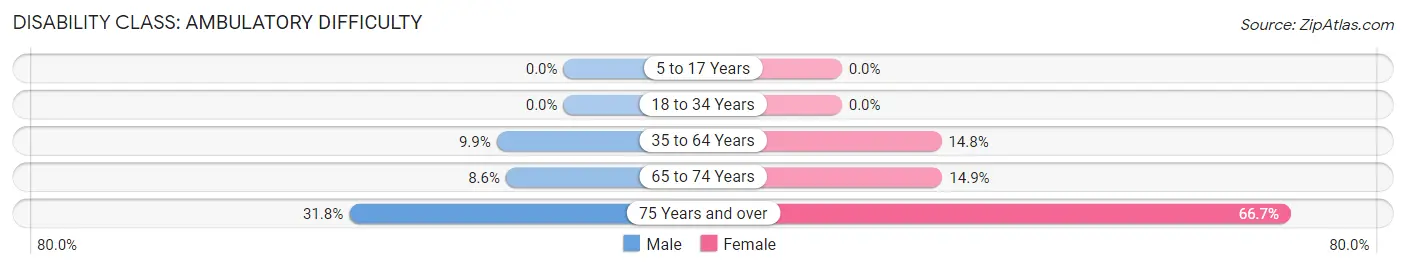
| Age Bracket | Male | Female |
| 5 to 17 Years | 0 (0.0%) | 0 (0.0%) |
| 18 to 34 Years | 0 (0.0%) | 0 (0.0%) |
| 35 to 64 Years | 37 (9.9%) | 41 (14.8%) |
| 65 to 74 Years | 10 (8.6%) | 13 (14.9%) |
| 75 Years and over | 7 (31.8%) | 46 (66.7%) |
Disability Class: Self-Care Difficulty
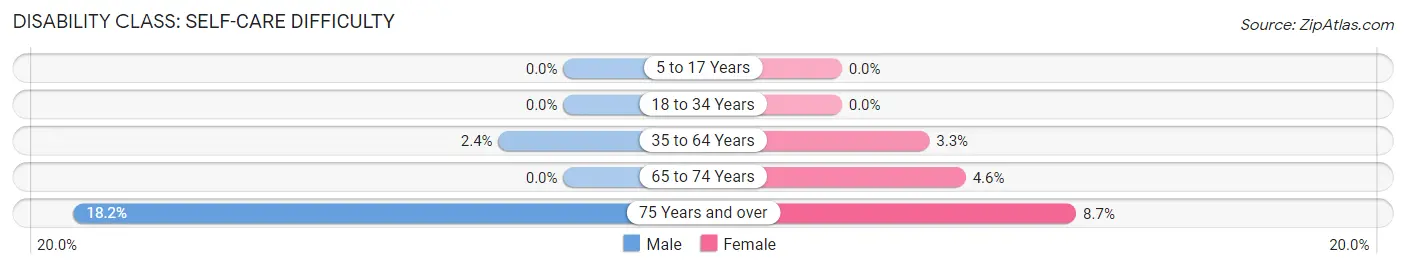
| Age Bracket | Male | Female |
| 5 to 17 Years | 0 (0.0%) | 0 (0.0%) |
| 18 to 34 Years | 0 (0.0%) | 0 (0.0%) |
| 35 to 64 Years | 9 (2.4%) | 9 (3.3%) |
| 65 to 74 Years | 0 (0.0%) | 4 (4.6%) |
| 75 Years and over | 4 (18.2%) | 6 (8.7%) |
Technology Access in Claycomo
Computing Device Access in Claycomo
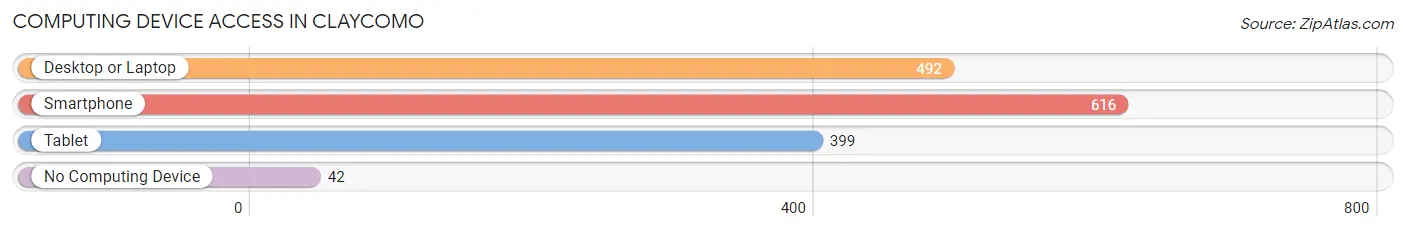
| Device Type | # Households | % Households |
| Desktop or Laptop | 492 | 67.7% |
| Smartphone | 616 | 84.7% |
| Tablet | 399 | 54.9% |
| No Computing Device | 42 | 5.8% |
| Total | 727 | 100.0% |
Internet Access in Claycomo
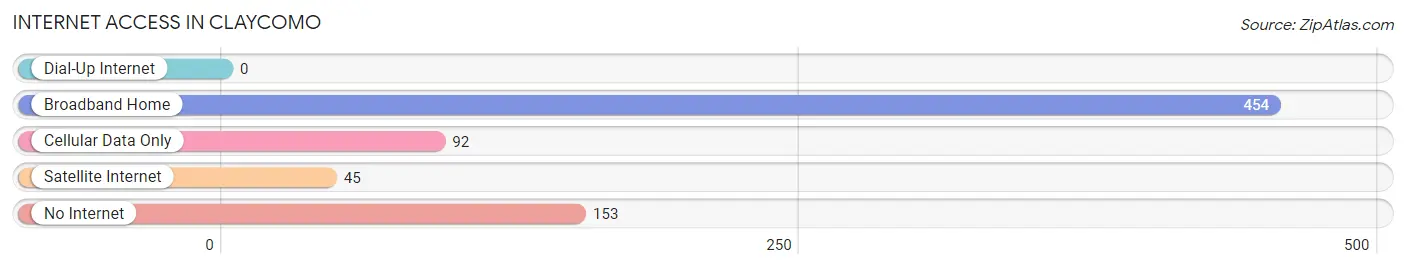
| Internet Type | # Households | % Households |
| Dial-Up Internet | 0 | 0.0% |
| Broadband Home | 454 | 62.5% |
| Cellular Data Only | 92 | 12.7% |
| Satellite Internet | 45 | 6.2% |
| No Internet | 153 | 21.0% |
| Total | 727 | 100.0% |
Claycomo Summary
Claycomo, Missouri is a small city located in Platte County, Missouri, just north of Kansas City. The city is home to approximately 4,000 people and is part of the Kansas City metropolitan area. Claycomo is known for its small-town charm and its close proximity to the larger city of Kansas City.
History
Claycomo was founded in 1887 by the Claycomb family, who were originally from Kentucky. The family purchased land in the area and began to develop it into a small farming community. The town was named after the Claycomb family, and the name was later changed to Claycomo. The town grew slowly over the years, and by the early 1900s, it had become a thriving community with a population of around 500 people.
In the 1950s, Claycomo began to experience rapid growth due to its proximity to Kansas City. The city was annexed by Kansas City in 1957, and the population grew to over 4,000 by the year 2000.
Geography
Claycomo is located in Platte County, Missouri, just north of Kansas City. The city is situated on the Missouri River, and is bordered by the cities of Riverside, Parkville, and Platte City. The city covers an area of approximately 4.5 square miles, and has a population density of 890 people per square mile.
The climate in Claycomo is typical of the Midwest, with hot summers and cold winters. The average temperature in the summer is around 80 degrees Fahrenheit, and the average temperature in the winter is around 30 degrees Fahrenheit.
Economy
The economy of Claycomo is largely based on the service industry. The city is home to several small businesses, including restaurants, retail stores, and professional services. The city is also home to several manufacturing companies, including a paper mill and a plastics factory.
The city is also home to several large employers, including the Ford Motor Company, which has a large plant in Claycomo. The city is also home to several educational institutions, including the University of Missouri-Kansas City and the Metropolitan Community College.
Demographics
As of the 2010 census, the population of Claycomo was 4,068. The racial makeup of the city was 87.3% White, 8.2% African American, 0.3% Native American, 0.7% Asian, 0.1% Pacific Islander, and 2.4% from other races. The median household income in Claycomo was $45,945, and the median family income was $51,945.
The city is home to a diverse population, with a variety of religious backgrounds. The largest religious group in Claycomo is the Catholic Church, followed by the United Methodist Church, the Church of Jesus Christ of Latter-day Saints, and the Presbyterian Church.
Conclusion
Claycomo, Missouri is a small city located in Platte County, Missouri, just north of Kansas City. The city is home to approximately 4,000 people and is part of the Kansas City metropolitan area. Claycomo is known for its small-town charm and its close proximity to the larger city of Kansas City. The city has a diverse population and a strong economy based on the service industry and manufacturing. Claycomo is a great place to live and work, and is a great example of a small city with big city amenities.
Common Questions
What is the Total Population of Claycomo?
Total Population of Claycomo is 1,815.
What is the Total Male Population of Claycomo?
Total Male Population of Claycomo is 996.
What is the Total Female Population of Claycomo?
Total Female Population of Claycomo is 819.
What is the Ratio of Males per 100 Females in Claycomo?
There are 121.61 Males per 100 Females in Claycomo.
What is the Ratio of Females per 100 Males in Claycomo?
There are 82.23 Females per 100 Males in Claycomo.
What is the Median Population Age in Claycomo?
Median Population Age in Claycomo is 36.5 Years.
What is the Average Family Size in Claycomo
Average Family Size in Claycomo is 3.4 People.
What is the Average Household Size in Claycomo
Average Household Size in Claycomo is 2.5 People.
What is Per Capita Income in Claycomo?
Per Capita income in Claycomo is $26,380.
What is the Median Family Income in Claycomo?
Median Family Income in Claycomo is $60,156.
What is the Median Household income in Claycomo?
Median Household Income in Claycomo is $46,890.
What is Income or Wage Gap in Claycomo?
Income or Wage Gap in Claycomo is 5.0%.
Women in Claycomo earn 95.0 cents for every dollar earned by a man.
What is Inequality or Gini Index in Claycomo?
Inequality or Gini Index in Claycomo is 0.40.
How Large is the Labor Force in Claycomo?
There are 947 People in the Labor Forcein in Claycomo.
What is the Percentage of People in the Labor Force in Claycomo?
68.9% of People are in the Labor Force in Claycomo.
What is the Unemployment Rate in Claycomo?
Unemployment Rate in Claycomo is 6.1%.