Big Lake, MO
Big Lake Map
Big Lake Overview
69
TOTAL POPULATION
31
MALE POPULATION
38
FEMALE POPULATION
81.58
MALES / 100 FEMALES
122.58
FEMALES / 100 MALES
61.6
MEDIAN AGE
2.0
AVG FAMILY SIZE
1.6
AVG HOUSEHOLD SIZE
$60,293
PER CAPITA INCOME
$85,833
AVG FAMILY INCOME
$75,000
AVG HOUSEHOLD INCOME
0.48
INEQUALITY / GINI INDEX
23
LABOR FORCE [ PEOPLE ]
35.4%
PERCENT IN LABOR FORCE
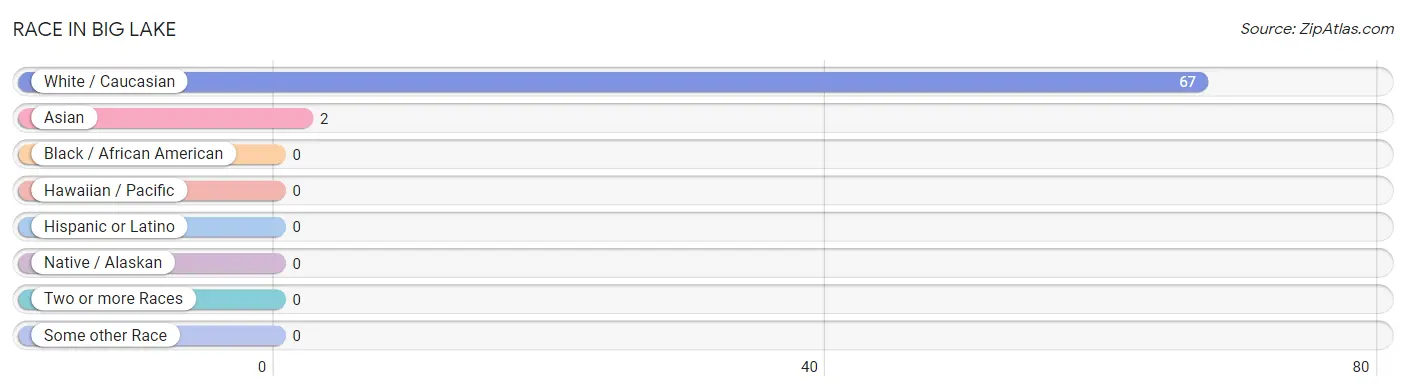
Race in Big Lake
The most populous races in Big Lake are White / Caucasian (67 | 97.1%), and Asian (2 | 2.9%).
| Race | # Population | % Population |
| Asian | 2 | 2.9% |
| Black / African American | 0 | 0.0% |
| Hawaiian / Pacific | 0 | 0.0% |
| Hispanic or Latino | 0 | 0.0% |
| Native / Alaskan | 0 | 0.0% |
| White / Caucasian | 67 | 97.1% |
| Two or more Races | 0 | 0.0% |
| Some other Race | 0 | 0.0% |
| Total | 69 | 100.0% |
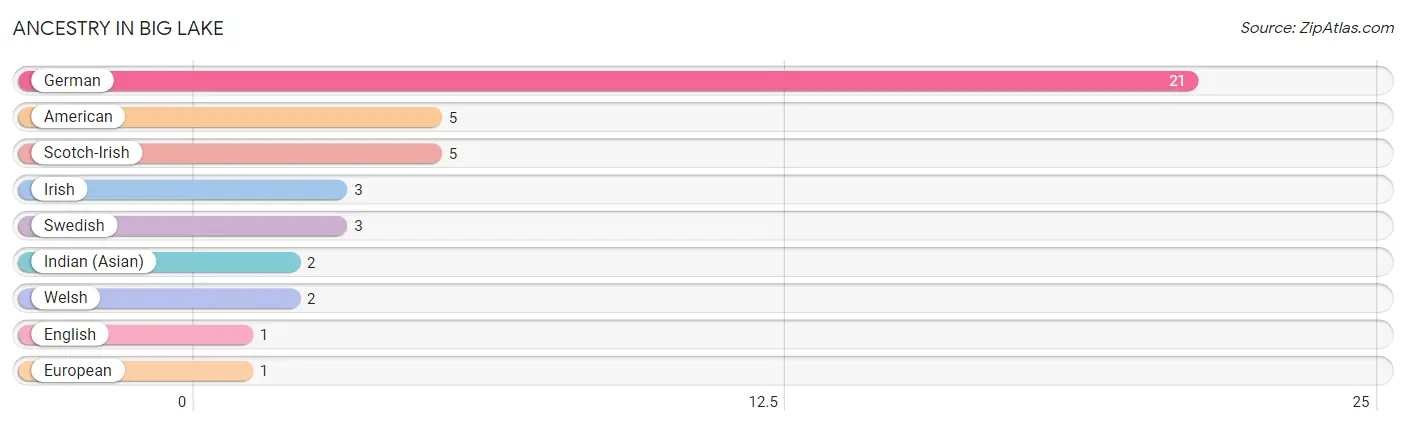
Ancestry in Big Lake
The most populous ancestries reported in Big Lake are German (21 | 30.4%), American (5 | 7.2%), Scotch-Irish (5 | 7.2%), Irish (3 | 4.3%), and Swedish (3 | 4.3%), together accounting for 53.6% of all Big Lake residents.
| Ancestry | # Population | % Population |
| American | 5 | 7.2% |
| English | 1 | 1.5% |
| European | 1 | 1.5% |
| German | 21 | 30.4% |
| Indian (Asian) | 2 | 2.9% |
| Irish | 3 | 4.3% |
| Scotch-Irish | 5 | 7.2% |
| Swedish | 3 | 4.3% |
| Welsh | 2 | 2.9% | View All 9 Rows |
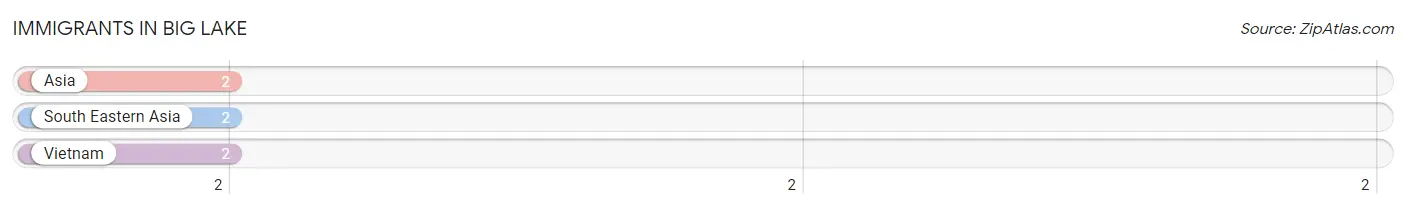
Immigrants in Big Lake
The most numerous immigrant groups reported in Big Lake came from Asia (2 | 2.9%), South Eastern Asia (2 | 2.9%), and Vietnam (2 | 2.9%), together accounting for 8.7% of all Big Lake residents.
| Immigration Origin | # Population | % Population |
| Asia | 2 | 2.9% |
| South Eastern Asia | 2 | 2.9% |
| Vietnam | 2 | 2.9% | View All 3 Rows |
Sex and Age in Big Lake
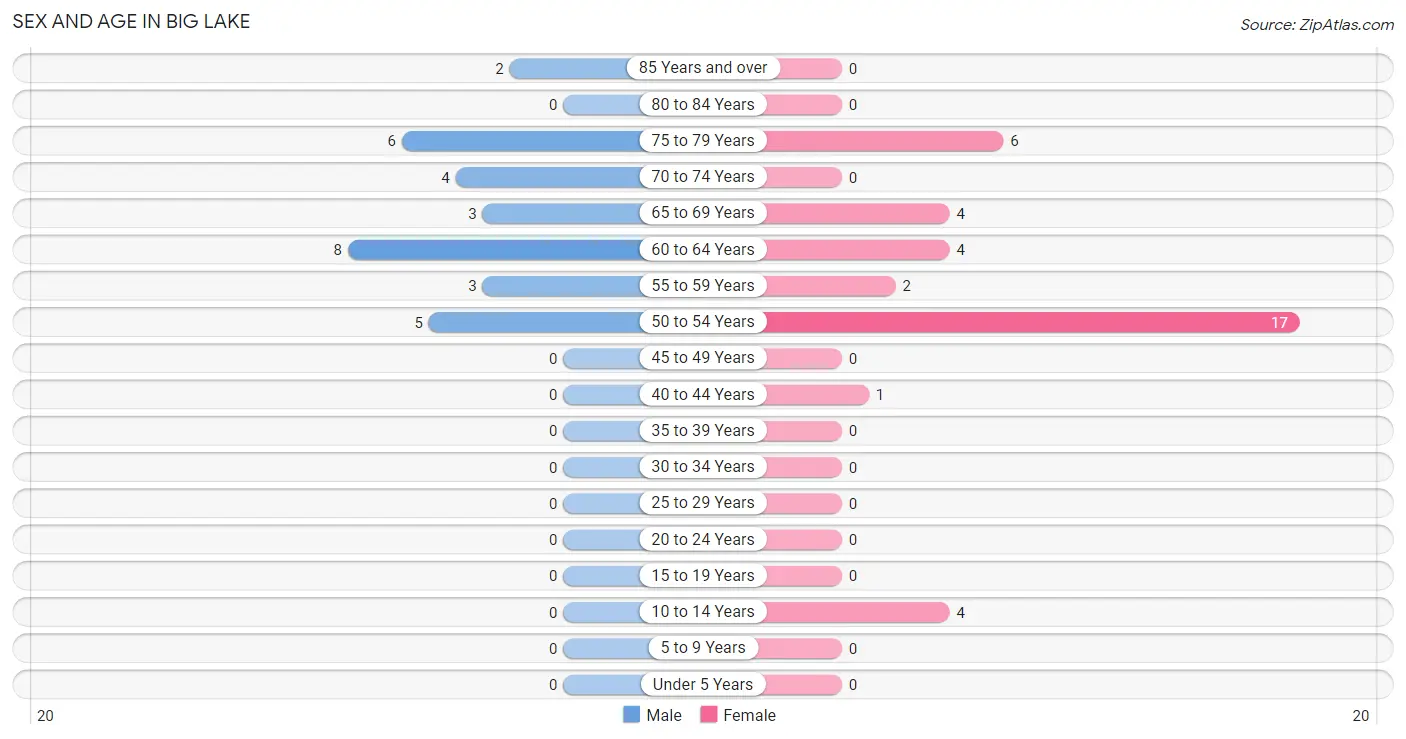
Sex and Age in Big Lake
The most populous age groups in Big Lake are 60 to 64 Years (8 | 25.8%) for men and 50 to 54 Years (17 | 44.7%) for women.
| Age Bracket | Male | Female |
| Under 5 Years | 0 (0.0%) | 0 (0.0%) |
| 5 to 9 Years | 0 (0.0%) | 0 (0.0%) |
| 10 to 14 Years | 0 (0.0%) | 4 (10.5%) |
| 15 to 19 Years | 0 (0.0%) | 0 (0.0%) |
| 20 to 24 Years | 0 (0.0%) | 0 (0.0%) |
| 25 to 29 Years | 0 (0.0%) | 0 (0.0%) |
| 30 to 34 Years | 0 (0.0%) | 0 (0.0%) |
| 35 to 39 Years | 0 (0.0%) | 0 (0.0%) |
| 40 to 44 Years | 0 (0.0%) | 1 (2.6%) |
| 45 to 49 Years | 0 (0.0%) | 0 (0.0%) |
| 50 to 54 Years | 5 (16.1%) | 17 (44.7%) |
| 55 to 59 Years | 3 (9.7%) | 2 (5.3%) |
| 60 to 64 Years | 8 (25.8%) | 4 (10.5%) |
| 65 to 69 Years | 3 (9.7%) | 4 (10.5%) |
| 70 to 74 Years | 4 (12.9%) | 0 (0.0%) |
| 75 to 79 Years | 6 (19.4%) | 6 (15.8%) |
| 80 to 84 Years | 0 (0.0%) | 0 (0.0%) |
| 85 Years and over | 2 (6.5%) | 0 (0.0%) |
| Total | 31 (100.0%) | 38 (100.0%) |
Families and Households in Big Lake
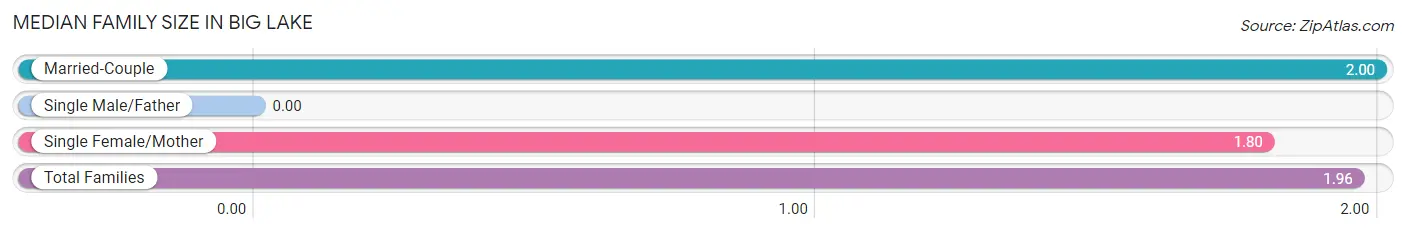
Median Family Size in Big Lake
| Family Type | # Families | Family Size |
| Married-Couple | 21 (80.8%) | 2.00 |
| Single Male/Father | 0 (0.0%) | - |
| Single Female/Mother | 5 (19.2%) | 1.80 |
| Total Families | 26 (100.0%) | 1.96 |
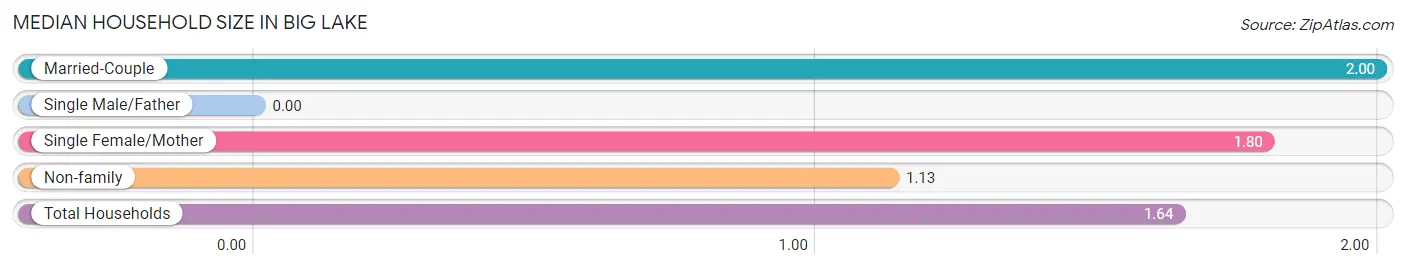
Median Household Size in Big Lake
| Household Type | # Households | Household Size |
| Married-Couple | 21 (50.0%) | 2.00 |
| Single Male/Father | 0 (0.0%) | - |
| Single Female/Mother | 5 (11.9%) | 1.80 |
| Non-family | 16 (38.1%) | 1.13 |
| Total Households | 42 (100.0%) | 1.64 |
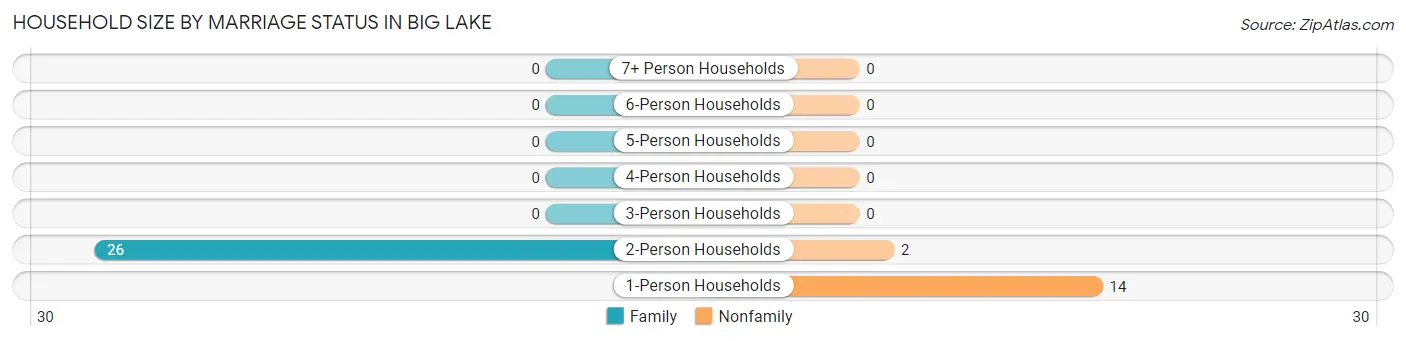
Household Size by Marriage Status in Big Lake
Out of a total of 42 households in Big Lake, 26 (61.9%) are family households, while 16 (38.1%) are nonfamily households. The most numerous type of family households are 2-person households, comprising 26, and the most common type of nonfamily households are 1-person households, comprising 14.
| Household Size | Family Households | Nonfamily Households |
| 1-Person Households | - | 14 (33.3%) |
| 2-Person Households | 26 (61.9%) | 2 (4.8%) |
| 3-Person Households | 0 (0.0%) | 0 (0.0%) |
| 4-Person Households | 0 (0.0%) | 0 (0.0%) |
| 5-Person Households | 0 (0.0%) | 0 (0.0%) |
| 6-Person Households | 0 (0.0%) | 0 (0.0%) |
| 7+ Person Households | 0 (0.0%) | 0 (0.0%) |
| Total | 26 (61.9%) | 16 (38.1%) |
Female Fertility in Big Lake
Fertility by Age in Big Lake
Average fertility rate in Big Lake is 333.0 births per 1,000 women. Women in the age bracket of 35 to 50 years have the highest fertility rate with 333.0 births per 1,000 women. Women in the age bracket of 35 to 50 years acount for 100.0% of all women with births.
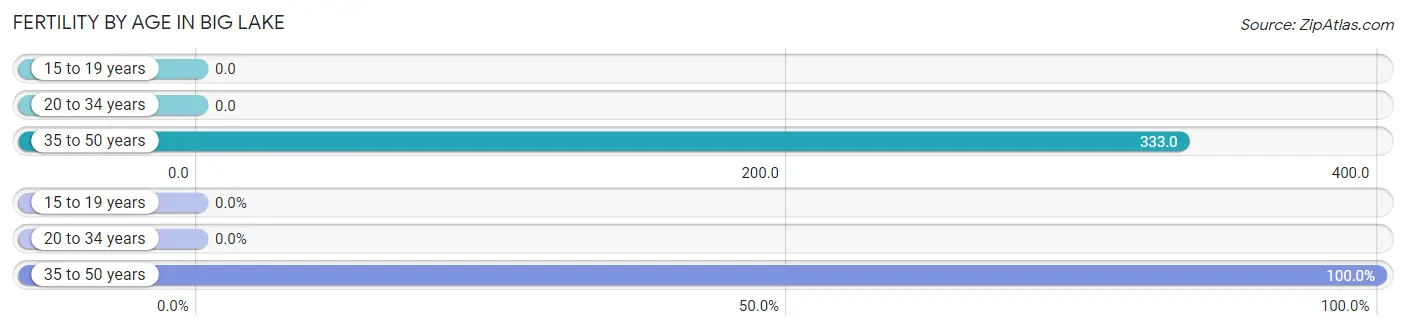
| Age Bracket | Women with Births | Births / 1,000 Women |
| 15 to 19 years | 0 (0.0%) | 0.0 |
| 20 to 34 years | 0 (0.0%) | 0.0 |
| 35 to 50 years | 1 (100.0%) | 333.0 |
| Total | 1 (100.0%) | 333.0 |
Fertility by Age by Marriage Status in Big Lake
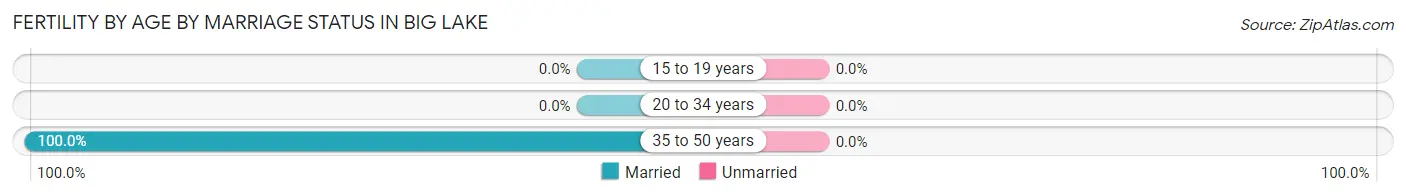
| Age Bracket | Married | Unmarried |
| 15 to 19 years | 0 (0.0%) | 0 (0.0%) |
| 20 to 34 years | 0 (0.0%) | 0 (0.0%) |
| 35 to 50 years | 1 (100.0%) | 0 (0.0%) |
| Total | 1 (100.0%) | 0 (0.0%) |
Fertility by Education in Big Lake
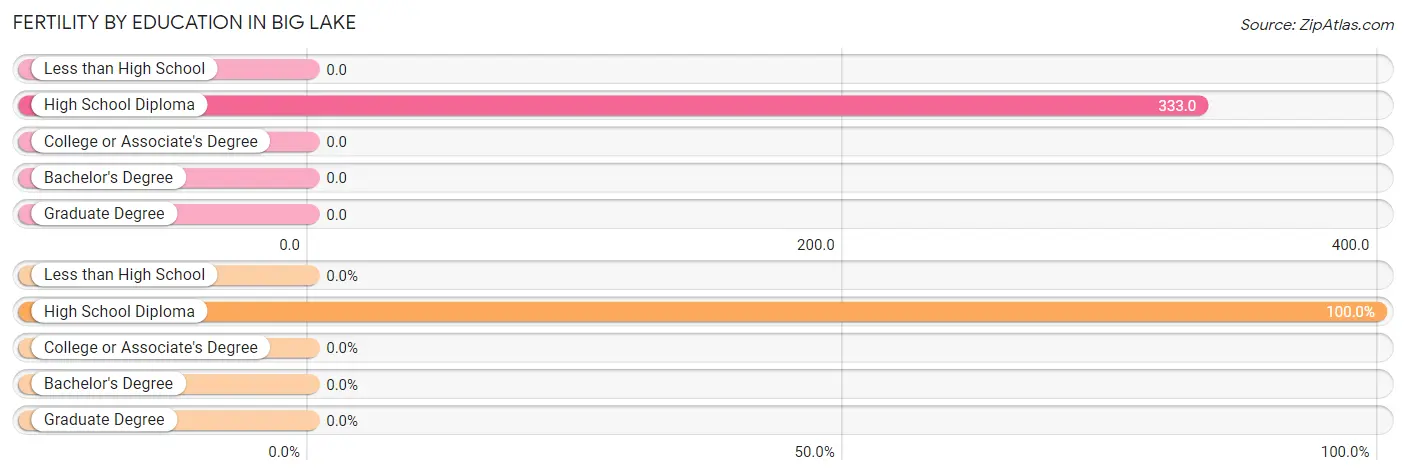
| Educational Attainment | Women with Births | Births / 1,000 Women |
| Less than High School | 0 (0.0%) | 0.0 |
| High School Diploma | 1 (100.0%) | 333.0 |
| College or Associate's Degree | 0 (0.0%) | 0.0 |
| Bachelor's Degree | 0 (0.0%) | 0.0 |
| Graduate Degree | 0 (0.0%) | 0.0 |
| Total | 1 (100.0%) | 333.0 |
Fertility by Education by Marriage Status in Big Lake
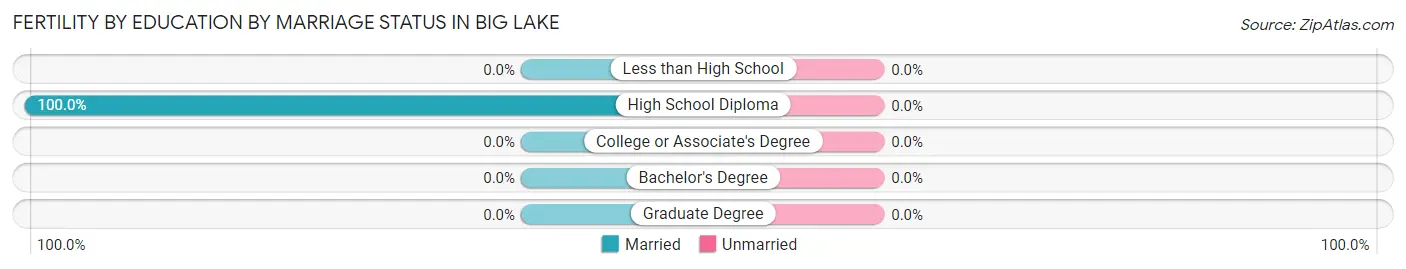
| Educational Attainment | Married | Unmarried |
| Less than High School | 0 (0.0%) | 0 (0.0%) |
| High School Diploma | 1 (100.0%) | 0 (0.0%) |
| College or Associate's Degree | 0 (0.0%) | 0 (0.0%) |
| Bachelor's Degree | 0 (0.0%) | 0 (0.0%) |
| Graduate Degree | 0 (0.0%) | 0 (0.0%) |
| Total | 1 (100.0%) | 0 (0.0%) |
Income in Big Lake
Income Overview in Big Lake
Per Capita Income in Big Lake is $60,293, while median incomes of families and households are $85,833 and $75,000 respectively.
| Characteristic | Number | Measure |
| Per Capita Income | 69 | $60,293 |
| Median Family Income | 26 | $85,833 |
| Mean Family Income | 26 | $70,173 |
| Median Household Income | 42 | $75,000 |
| Mean Household Income | 42 | $99,036 |
| Income Deficit | 26 | $0 |
| Wage / Income Gap (%) | 69 | 0.00% |
| Wage / Income Gap ($) | 69 | 100.00¢ per $1 |
| Gini / Inequality Index | 69 | 0.48 |
Earnings by Sex in Big Lake
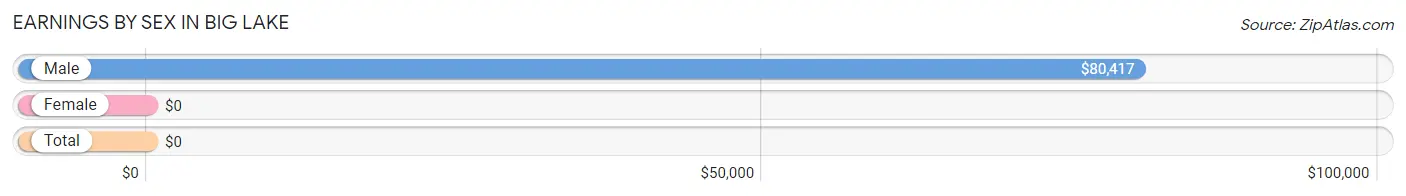
| Sex | Number | Average Earnings |
| Male | 13 (40.6%) | $80,417 |
| Female | 19 (59.4%) | $0 |
| Total | 32 (100.0%) | $0 |
Earnings by Sex by Income Bracket in Big Lake
The most common earnings brackets in Big Lake are $75,000 to $99,999 for men (6 | 46.2%) and $50,000 to $54,999 for women (6 | 31.6%).
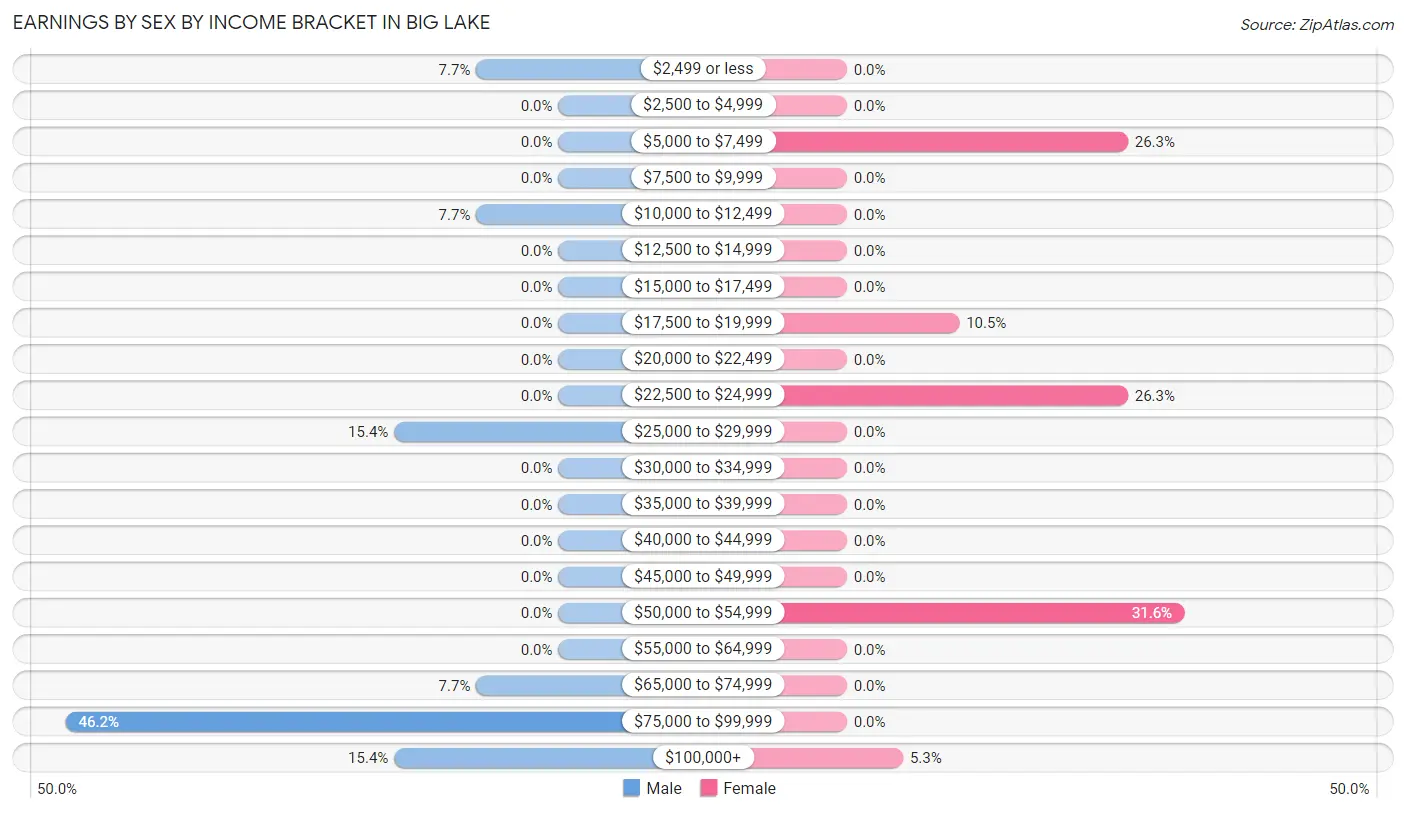
| Income | Male | Female |
| $2,499 or less | 1 (7.7%) | 0 (0.0%) |
| $2,500 to $4,999 | 0 (0.0%) | 0 (0.0%) |
| $5,000 to $7,499 | 0 (0.0%) | 5 (26.3%) |
| $7,500 to $9,999 | 0 (0.0%) | 0 (0.0%) |
| $10,000 to $12,499 | 1 (7.7%) | 0 (0.0%) |
| $12,500 to $14,999 | 0 (0.0%) | 0 (0.0%) |
| $15,000 to $17,499 | 0 (0.0%) | 0 (0.0%) |
| $17,500 to $19,999 | 0 (0.0%) | 2 (10.5%) |
| $20,000 to $22,499 | 0 (0.0%) | 0 (0.0%) |
| $22,500 to $24,999 | 0 (0.0%) | 5 (26.3%) |
| $25,000 to $29,999 | 2 (15.4%) | 0 (0.0%) |
| $30,000 to $34,999 | 0 (0.0%) | 0 (0.0%) |
| $35,000 to $39,999 | 0 (0.0%) | 0 (0.0%) |
| $40,000 to $44,999 | 0 (0.0%) | 0 (0.0%) |
| $45,000 to $49,999 | 0 (0.0%) | 0 (0.0%) |
| $50,000 to $54,999 | 0 (0.0%) | 6 (31.6%) |
| $55,000 to $64,999 | 0 (0.0%) | 0 (0.0%) |
| $65,000 to $74,999 | 1 (7.7%) | 0 (0.0%) |
| $75,000 to $99,999 | 6 (46.2%) | 0 (0.0%) |
| $100,000+ | 2 (15.4%) | 1 (5.3%) |
| Total | 13 (100.0%) | 19 (100.0%) |
Earnings by Sex by Educational Attainment in Big Lake
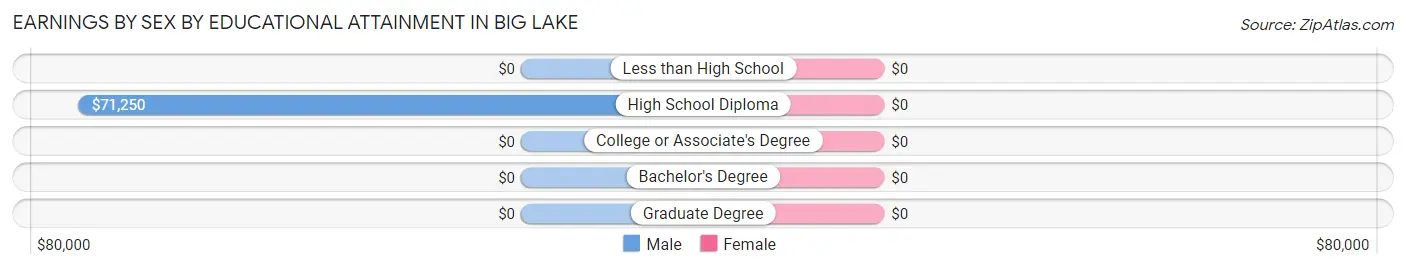
| Educational Attainment | Male Income | Female Income |
| Less than High School | - | - |
| High School Diploma | $71,250 | $0 |
| College or Associate's Degree | - | - |
| Bachelor's Degree | - | - |
| Graduate Degree | - | - |
| Total | $80,417 | $0 |
Family Income in Big Lake
Family Income Brackets in Big Lake
According to the Big Lake family income data, there are 11 families falling into the $75,000 to $99,999 income range, which is the most common income bracket and makes up 42.3% of all families.
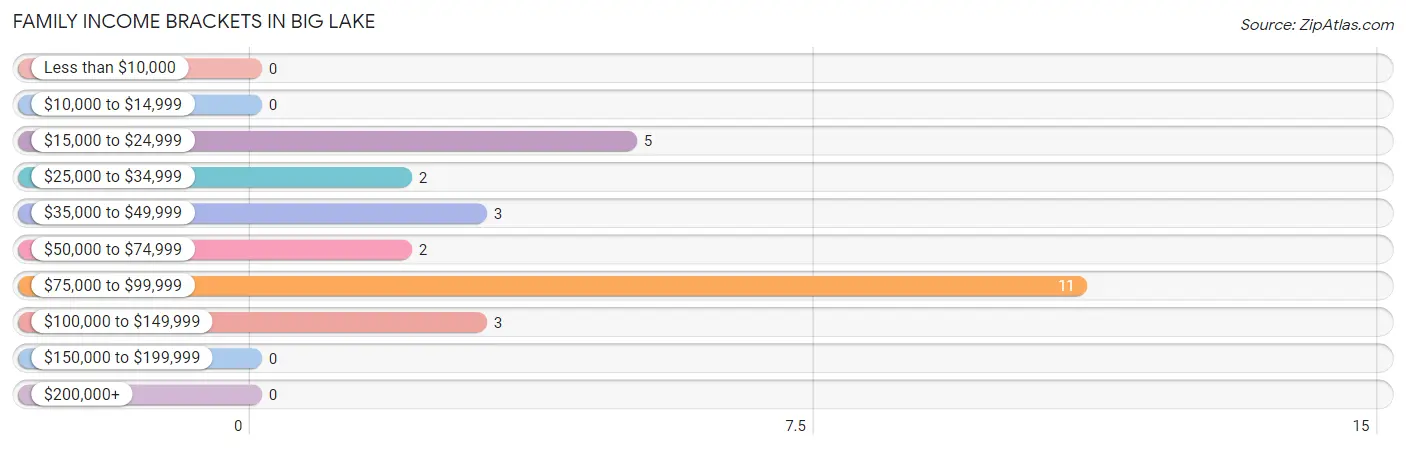
| Income Bracket | # Families | % Families |
| Less than $10,000 | 0 | 0.0% |
| $10,000 to $14,999 | 0 | 0.0% |
| $15,000 to $24,999 | 5 | 19.2% |
| $25,000 to $34,999 | 2 | 7.7% |
| $35,000 to $49,999 | 3 | 11.5% |
| $50,000 to $74,999 | 2 | 7.7% |
| $75,000 to $99,999 | 11 | 42.3% |
| $100,000 to $149,999 | 3 | 11.5% |
| $150,000 to $199,999 | 0 | 0.0% |
| $200,000+ | 0 | 0.0% |
Family Income by Famaliy Size in Big Lake
2-person families (26 | 100.0%) account for the highest median family income in Big Lake with $85,833 per family, while 2-person families (26 | 100.0%) have the highest median income of $42,916 per family member.
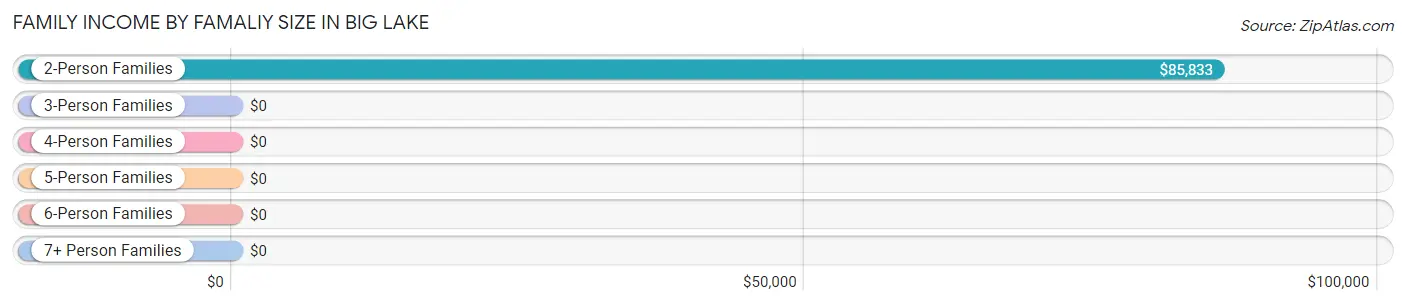
| Income Bracket | # Families | Median Income |
| 2-Person Families | 26 (100.0%) | $85,833 |
| 3-Person Families | 0 (0.0%) | $0 |
| 4-Person Families | 0 (0.0%) | $0 |
| 5-Person Families | 0 (0.0%) | $0 |
| 6-Person Families | 0 (0.0%) | $0 |
| 7+ Person Families | 0 (0.0%) | $0 |
| Total | 26 (100.0%) | $85,833 |
Family Income by Number of Earners in Big Lake
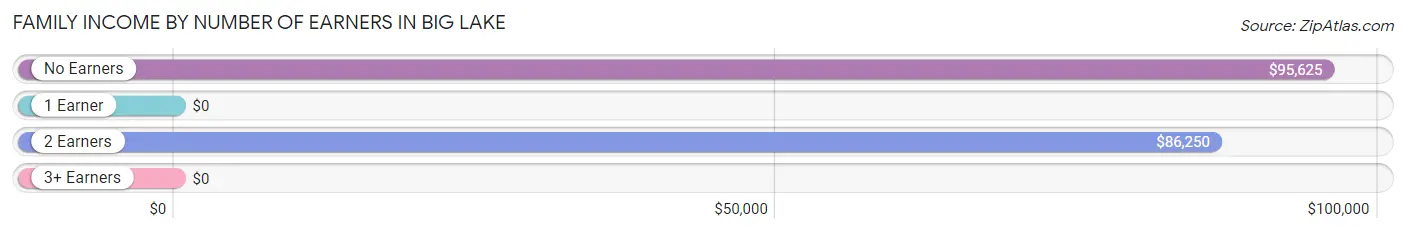
| Number of Earners | # Families | Median Income |
| No Earners | 9 (34.6%) | $95,625 |
| 1 Earner | 12 (46.2%) | $0 |
| 2 Earners | 5 (19.2%) | $86,250 |
| 3+ Earners | 0 (0.0%) | $0 |
| Total | 26 (100.0%) | $85,833 |
Household Income in Big Lake
Household Income Brackets in Big Lake
With 14 households falling in the category, the $75,000 to $99,999 income range is the most frequent in Big Lake, accounting for 33.3% of all households.
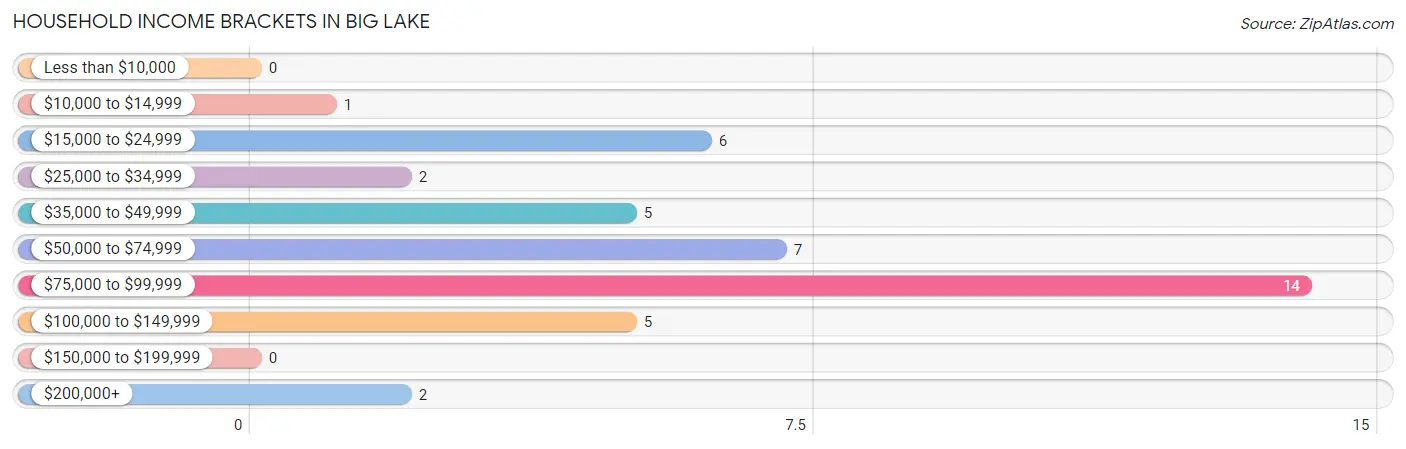
| Income Bracket | # Households | % Households |
| Less than $10,000 | 0 | 0.0% |
| $10,000 to $14,999 | 1 | 2.4% |
| $15,000 to $24,999 | 6 | 14.3% |
| $25,000 to $34,999 | 2 | 4.8% |
| $35,000 to $49,999 | 5 | 11.9% |
| $50,000 to $74,999 | 7 | 16.7% |
| $75,000 to $99,999 | 14 | 33.3% |
| $100,000 to $149,999 | 5 | 11.9% |
| $150,000 to $199,999 | 0 | 0.0% |
| $200,000+ | 2 | 4.8% |
Household Income by Householder Age in Big Lake
The median household income in Big Lake is $75,000, with the highest median household income of $95,417 found in the 65+ years age bracket for the primary householder. A total of 14 households (33.3%) fall into this category.
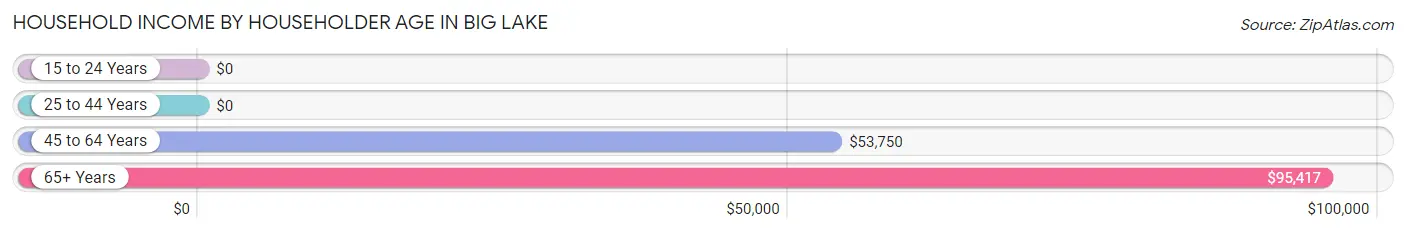
| Income Bracket | # Households | Median Income |
| 15 to 24 Years | 0 (0.0%) | $0 |
| 25 to 44 Years | 1 (2.4%) | $0 |
| 45 to 64 Years | 27 (64.3%) | $53,750 |
| 65+ Years | 14 (33.3%) | $95,417 |
| Total | 42 (100.0%) | $75,000 |
Poverty in Big Lake
Income Below Poverty by Sex and Age in Big Lake
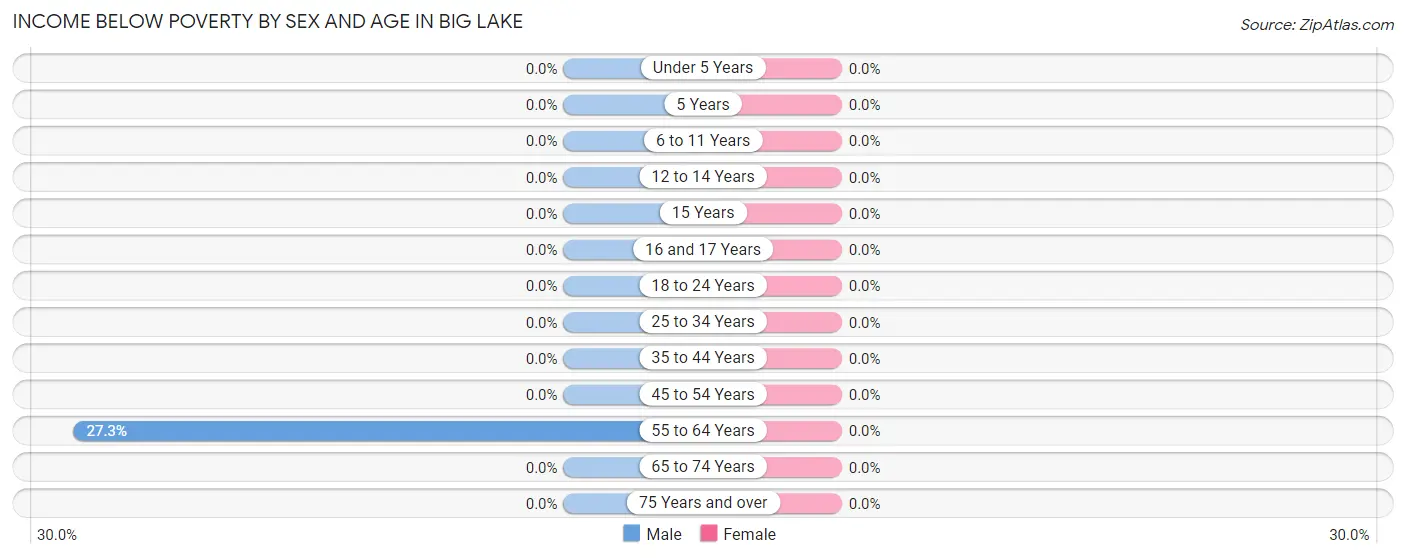
| Age Bracket | Male | Female |
| Under 5 Years | 0 (0.0%) | 0 (0.0%) |
| 5 Years | 0 (0.0%) | 0 (0.0%) |
| 6 to 11 Years | 0 (0.0%) | 0 (0.0%) |
| 12 to 14 Years | 0 (0.0%) | 0 (0.0%) |
| 15 Years | 0 (0.0%) | 0 (0.0%) |
| 16 and 17 Years | 0 (0.0%) | 0 (0.0%) |
| 18 to 24 Years | 0 (0.0%) | 0 (0.0%) |
| 25 to 34 Years | 0 (0.0%) | 0 (0.0%) |
| 35 to 44 Years | 0 (0.0%) | 0 (0.0%) |
| 45 to 54 Years | 0 (0.0%) | 0 (0.0%) |
| 55 to 64 Years | 3 (27.3%) | 0 (0.0%) |
| 65 to 74 Years | 0 (0.0%) | 0 (0.0%) |
| 75 Years and over | 0 (0.0%) | 0 (0.0%) |
| Total | 3 (9.7%) | 0 (0.0%) |
Income Above Poverty by Sex and Age in Big Lake
According to the poverty statistics in Big Lake, males aged 45 to 54 years and females aged 12 to 14 years are the age groups that are most secure financially, with 100.0% of males and 100.0% of females in these age groups living above the poverty line.
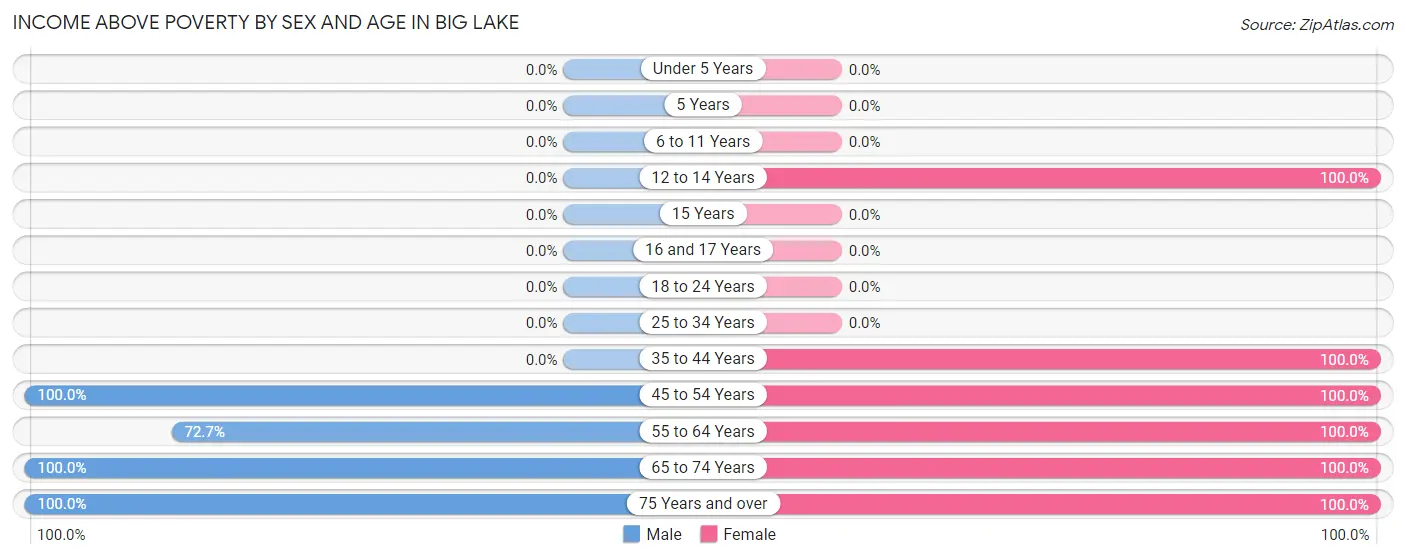
| Age Bracket | Male | Female |
| Under 5 Years | 0 (0.0%) | 0 (0.0%) |
| 5 Years | 0 (0.0%) | 0 (0.0%) |
| 6 to 11 Years | 0 (0.0%) | 0 (0.0%) |
| 12 to 14 Years | 0 (0.0%) | 4 (100.0%) |
| 15 Years | 0 (0.0%) | 0 (0.0%) |
| 16 and 17 Years | 0 (0.0%) | 0 (0.0%) |
| 18 to 24 Years | 0 (0.0%) | 0 (0.0%) |
| 25 to 34 Years | 0 (0.0%) | 0 (0.0%) |
| 35 to 44 Years | 0 (0.0%) | 1 (100.0%) |
| 45 to 54 Years | 5 (100.0%) | 17 (100.0%) |
| 55 to 64 Years | 8 (72.7%) | 6 (100.0%) |
| 65 to 74 Years | 7 (100.0%) | 4 (100.0%) |
| 75 Years and over | 8 (100.0%) | 6 (100.0%) |
| Total | 28 (90.3%) | 38 (100.0%) |
Income Below Poverty Among Married-Couple Families in Big Lake
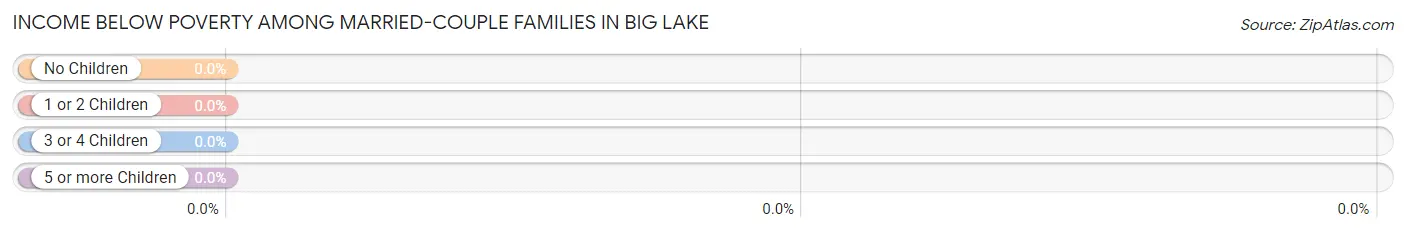
| Children | Above Poverty | Below Poverty |
| No Children | 21 (100.0%) | 0 (0.0%) |
| 1 or 2 Children | 0 (0.0%) | 0 (0.0%) |
| 3 or 4 Children | 0 (0.0%) | 0 (0.0%) |
| 5 or more Children | 0 (0.0%) | 0 (0.0%) |
| Total | 21 (100.0%) | 0 (0.0%) |
Income Below Poverty Among Single-Parent Households in Big Lake
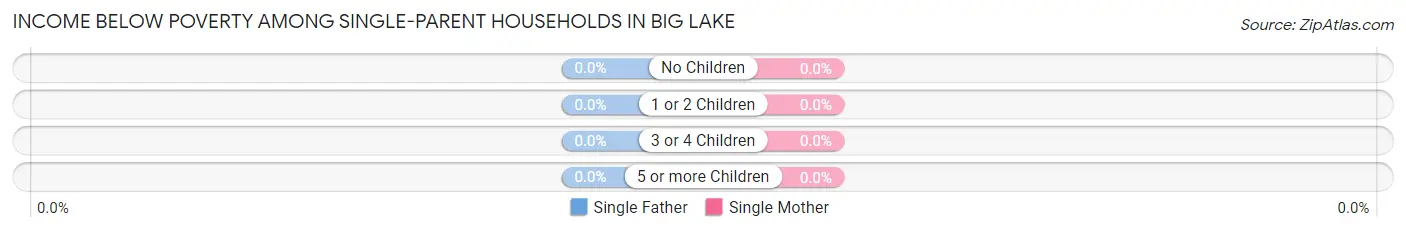
| Children | Single Father | Single Mother |
| No Children | 0 (0.0%) | 0 (0.0%) |
| 1 or 2 Children | 0 (0.0%) | 0 (0.0%) |
| 3 or 4 Children | 0 (0.0%) | 0 (0.0%) |
| 5 or more Children | 0 (0.0%) | 0 (0.0%) |
| Total | 0 (0.0%) | 0 (0.0%) |
Income Below Poverty Among Married-Couple vs Single-Parent Households in Big Lake
| Children | Married-Couple Families | Single-Parent Households |
| No Children | 0 (0.0%) | 0 (0.0%) |
| 1 or 2 Children | 0 (0.0%) | 0 (0.0%) |
| 3 or 4 Children | 0 (0.0%) | 0 (0.0%) |
| 5 or more Children | 0 (0.0%) | 0 (0.0%) |
| Total | 0 (0.0%) | 0 (0.0%) |
Employment Characteristics in Big Lake
Employment by Class of Employer in Big Lake
Among the 23 employed individuals in Big Lake, private company employees (11 | 47.8%), state government employees (5 | 21.7%), and self-employed (incorporated) (4 | 17.4%) make up the most common classes of employment.
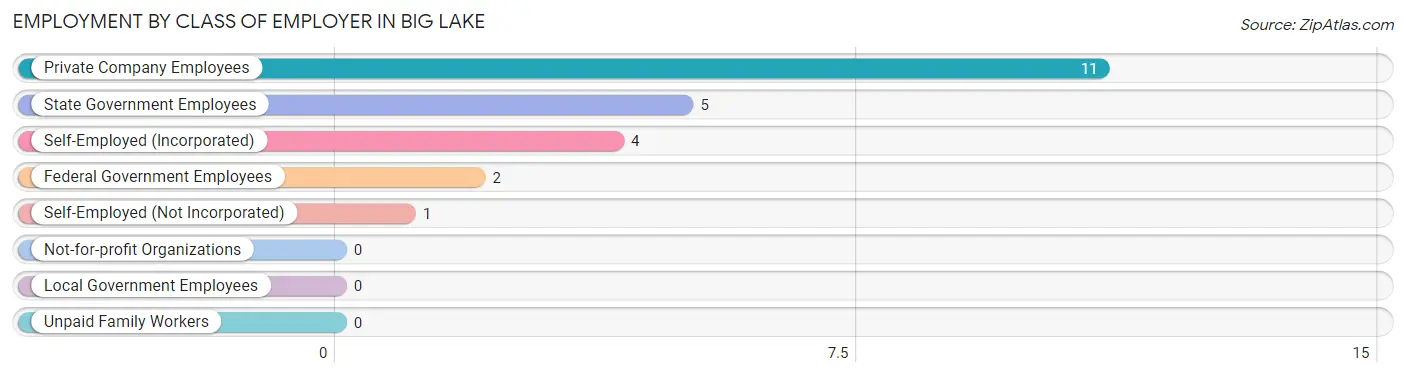
| Employer Class | # Employees | % Employees |
| Private Company Employees | 11 | 47.8% |
| Self-Employed (Incorporated) | 4 | 17.4% |
| Self-Employed (Not Incorporated) | 1 | 4.3% |
| Not-for-profit Organizations | 0 | 0.0% |
| Local Government Employees | 0 | 0.0% |
| State Government Employees | 5 | 21.7% |
| Federal Government Employees | 2 | 8.7% |
| Unpaid Family Workers | 0 | 0.0% |
| Total | 23 | 100.0% |
Employment Status by Age in Big Lake
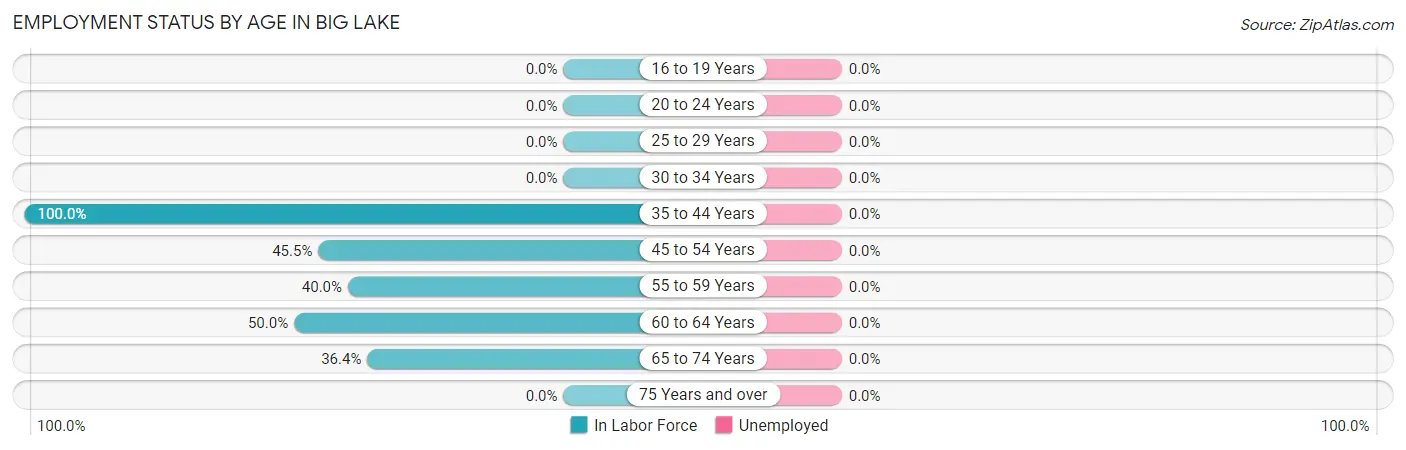
| Age Bracket | In Labor Force | Unemployed |
| 16 to 19 Years | 0 (0.0%) | 0 (0.0%) |
| 20 to 24 Years | 0 (0.0%) | 0 (0.0%) |
| 25 to 29 Years | 0 (0.0%) | 0 (0.0%) |
| 30 to 34 Years | 0 (0.0%) | 0 (0.0%) |
| 35 to 44 Years | 1 (100.0%) | 0 (0.0%) |
| 45 to 54 Years | 10 (45.5%) | 0 (0.0%) |
| 55 to 59 Years | 2 (40.0%) | 0 (0.0%) |
| 60 to 64 Years | 6 (50.0%) | 0 (0.0%) |
| 65 to 74 Years | 4 (36.4%) | 0 (0.0%) |
| 75 Years and over | 0 (0.0%) | 0 (0.0%) |
| Total | 23 (35.4%) | 0 (0.0%) |
Employment Status by Educational Attainment in Big Lake
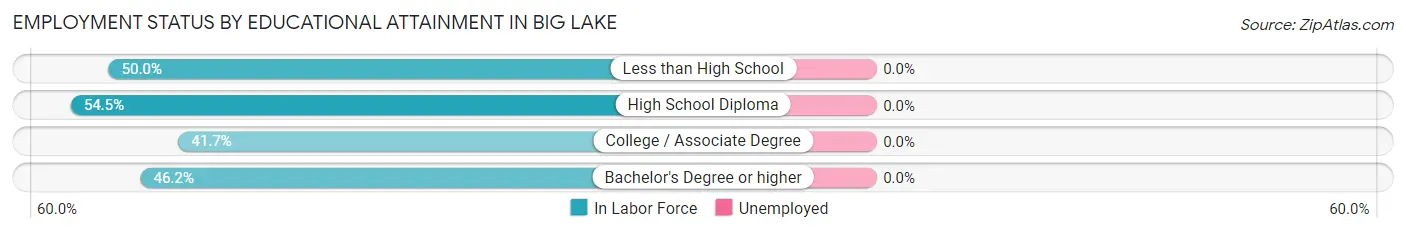
| Educational Attainment | In Labor Force | Unemployed |
| Less than High School | 2 (50.0%) | 0 (0.0%) |
| High School Diploma | 6 (54.5%) | 0 (0.0%) |
| College / Associate Degree | 5 (41.7%) | 0 (0.0%) |
| Bachelor's Degree or higher | 6 (46.2%) | 0 (0.0%) |
| Total | 19 (47.5%) | 0 (0.0%) |
Employment Occupations by Sex in Big Lake
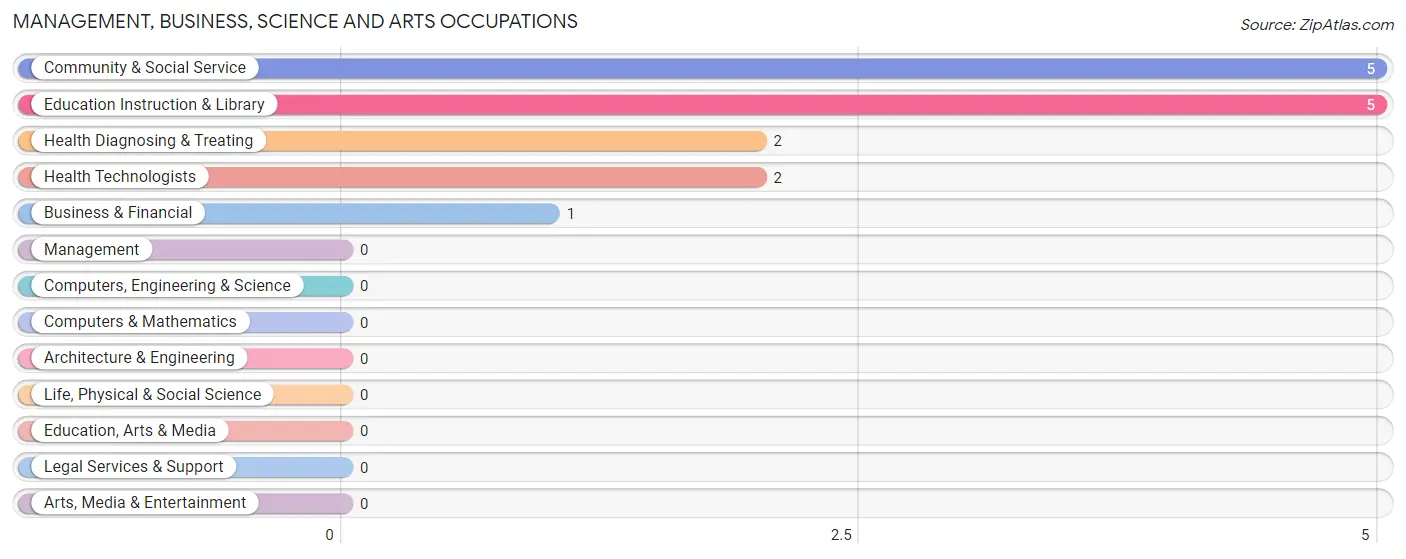
Management, Business, Science and Arts Occupations
The most common Management, Business, Science and Arts occupations in Big Lake are Community & Social Service (5 | 23.8%), Education Instruction & Library (5 | 23.8%), Health Diagnosing & Treating (2 | 9.5%), Health Technologists (2 | 9.5%), and Business & Financial (1 | 4.8%).
Management, Business, Science and Arts Occupations by Sex
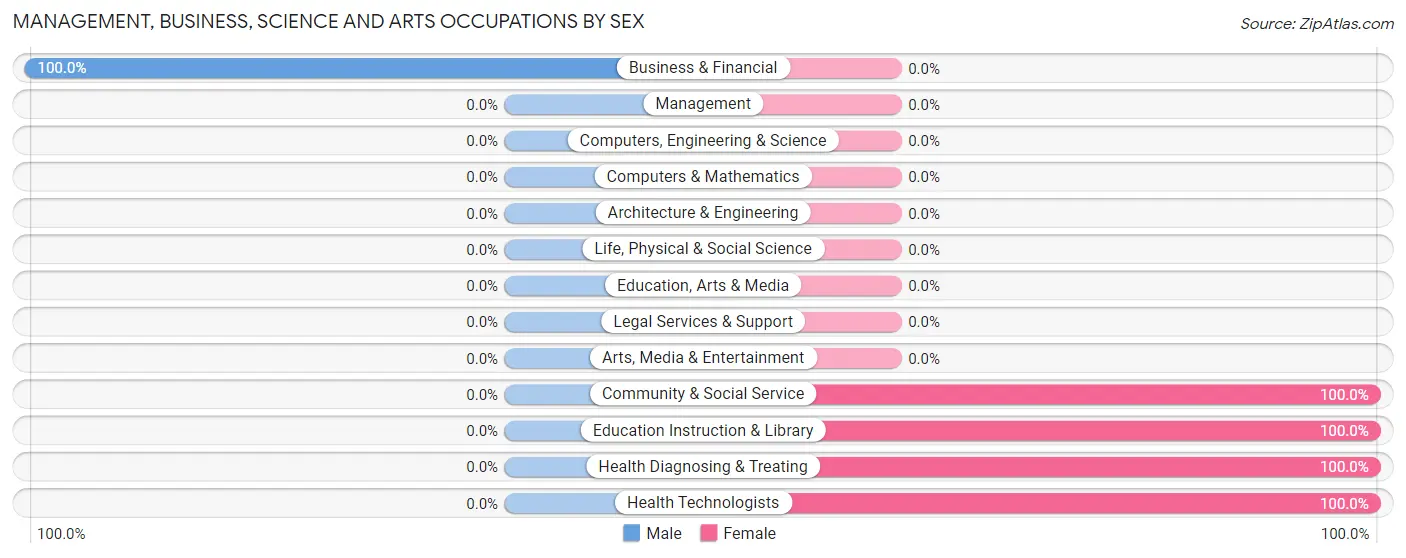
| Occupation | Male | Female |
| Management | 0 (0.0%) | 0 (0.0%) |
| Business & Financial | 1 (100.0%) | 0 (0.0%) |
| Computers, Engineering & Science | 0 (0.0%) | 0 (0.0%) |
| Computers & Mathematics | 0 (0.0%) | 0 (0.0%) |
| Architecture & Engineering | 0 (0.0%) | 0 (0.0%) |
| Life, Physical & Social Science | 0 (0.0%) | 0 (0.0%) |
| Community & Social Service | 0 (0.0%) | 5 (100.0%) |
| Education, Arts & Media | 0 (0.0%) | 0 (0.0%) |
| Legal Services & Support | 0 (0.0%) | 0 (0.0%) |
| Education Instruction & Library | 0 (0.0%) | 5 (100.0%) |
| Arts, Media & Entertainment | 0 (0.0%) | 0 (0.0%) |
| Health Diagnosing & Treating | 0 (0.0%) | 2 (100.0%) |
| Health Technologists | 0 (0.0%) | 2 (100.0%) |
| Total (Category) | 1 (12.5%) | 7 (87.5%) |
| Total (Overall) | 8 (38.1%) | 13 (61.9%) |
Services Occupations
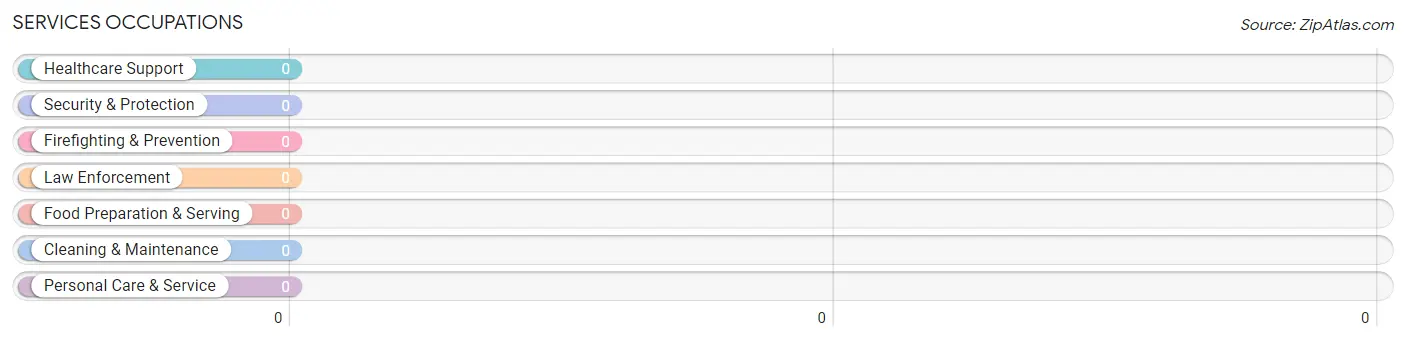
Services Occupations by Sex
| Occupation | Male | Female |
| Healthcare Support | 0 (0.0%) | 0 (0.0%) |
| Security & Protection | 0 (0.0%) | 0 (0.0%) |
| Firefighting & Prevention | 0 (0.0%) | 0 (0.0%) |
| Law Enforcement | 0 (0.0%) | 0 (0.0%) |
| Food Preparation & Serving | 0 (0.0%) | 0 (0.0%) |
| Cleaning & Maintenance | 0 (0.0%) | 0 (0.0%) |
| Personal Care & Service | 0 (0.0%) | 0 (0.0%) |
| Total (Category) | 0 (0.0%) | 0 (0.0%) |
| Total (Overall) | 8 (38.1%) | 13 (61.9%) |
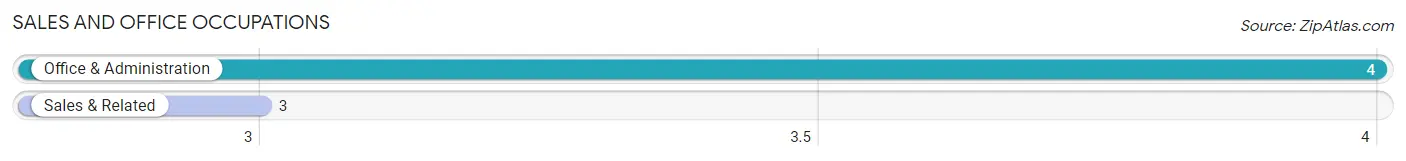
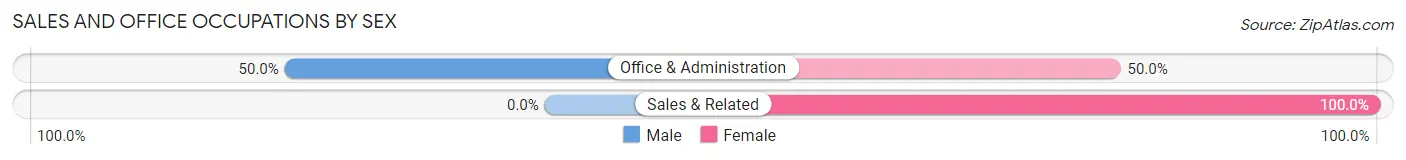
Sales and Office Occupations
The most common Sales and Office occupations in Big Lake are Office & Administration (4 | 19.1%), and Sales & Related (3 | 14.3%).
Sales and Office Occupations by Sex
| Occupation | Male | Female |
| Sales & Related | 0 (0.0%) | 3 (100.0%) |
| Office & Administration | 2 (50.0%) | 2 (50.0%) |
| Total (Category) | 2 (28.6%) | 5 (71.4%) |
| Total (Overall) | 8 (38.1%) | 13 (61.9%) |
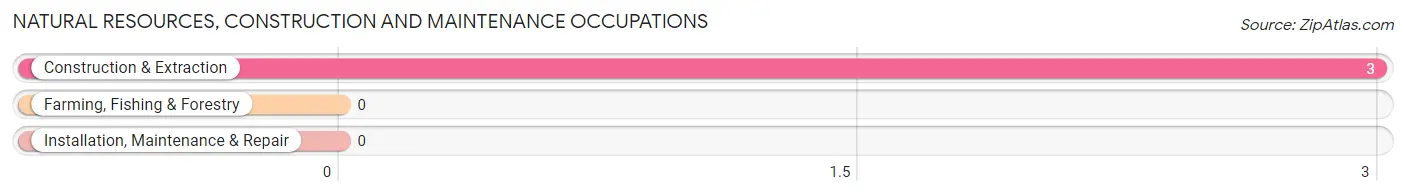
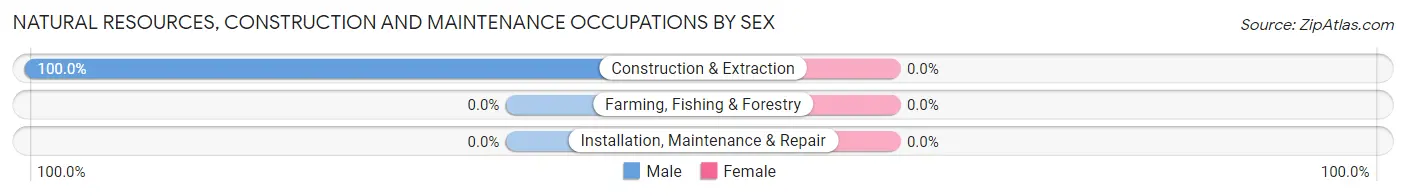
Natural Resources, Construction and Maintenance Occupations
The most common Natural Resources, Construction and Maintenance occupations in Big Lake are , and Construction & Extraction (3 | 14.3%).
Natural Resources, Construction and Maintenance Occupations by Sex
| Occupation | Male | Female |
| Farming, Fishing & Forestry | 0 (0.0%) | 0 (0.0%) |
| Construction & Extraction | 3 (100.0%) | 0 (0.0%) |
| Installation, Maintenance & Repair | 0 (0.0%) | 0 (0.0%) |
| Total (Category) | 3 (100.0%) | 0 (0.0%) |
| Total (Overall) | 8 (38.1%) | 13 (61.9%) |
Production, Transportation and Moving Occupations
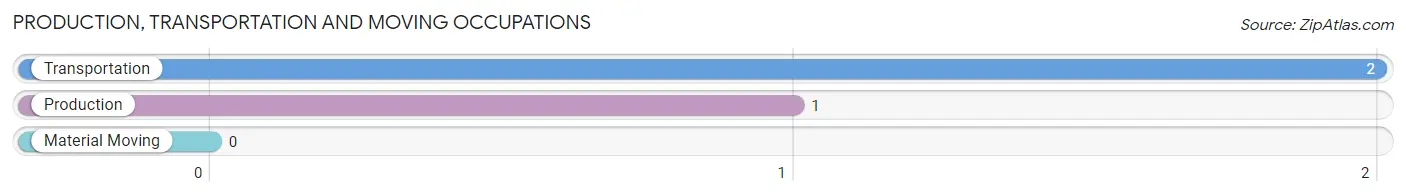
The most common Production, Transportation and Moving occupations in Big Lake are Transportation (2 | 9.5%), and Production (1 | 4.8%).
Production, Transportation and Moving Occupations by Sex
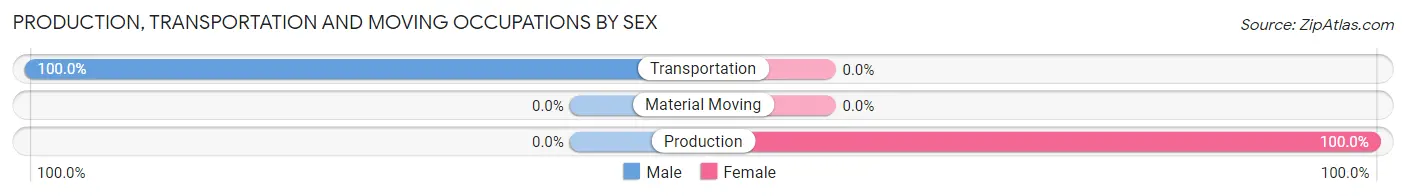
| Occupation | Male | Female |
| Production | 0 (0.0%) | 1 (100.0%) |
| Transportation | 2 (100.0%) | 0 (0.0%) |
| Material Moving | 0 (0.0%) | 0 (0.0%) |
| Total (Category) | 2 (66.7%) | 1 (33.3%) |
| Total (Overall) | 8 (38.1%) | 13 (61.9%) |
Employment Industries by Sex in Big Lake
Employment Industries in Big Lake
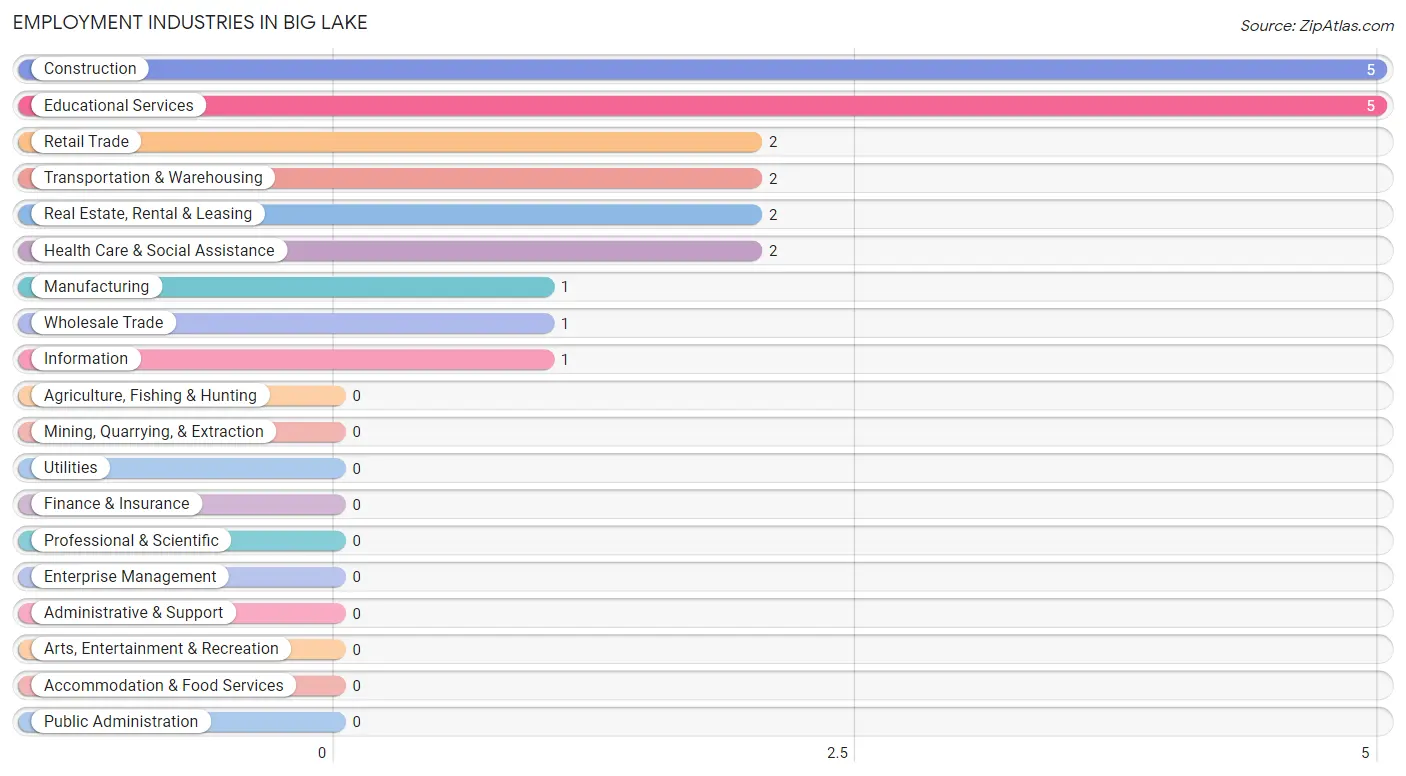
The major employment industries in Big Lake include Construction (5 | 23.8%), Educational Services (5 | 23.8%), Retail Trade (2 | 9.5%), Transportation & Warehousing (2 | 9.5%), and Real Estate, Rental & Leasing (2 | 9.5%).
Employment Industries by Sex in Big Lake
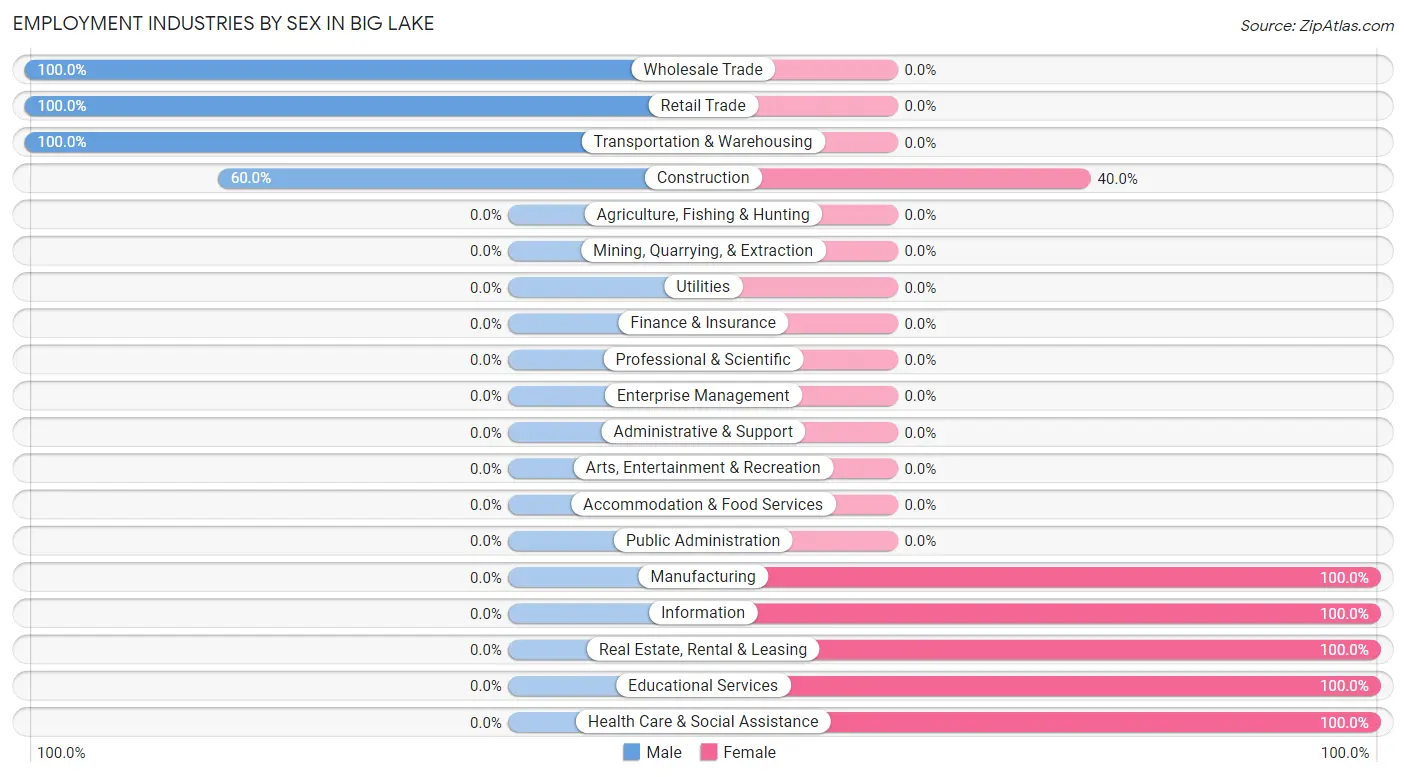
The Big Lake industries that see more men than women are Wholesale Trade (100.0%), Retail Trade (100.0%), and Transportation & Warehousing (100.0%), whereas the industries that tend to have a higher number of women are Manufacturing (100.0%), Information (100.0%), and Real Estate, Rental & Leasing (100.0%).
| Industry | Male | Female |
| Agriculture, Fishing & Hunting | 0 (0.0%) | 0 (0.0%) |
| Mining, Quarrying, & Extraction | 0 (0.0%) | 0 (0.0%) |
| Construction | 3 (60.0%) | 2 (40.0%) |
| Manufacturing | 0 (0.0%) | 1 (100.0%) |
| Wholesale Trade | 1 (100.0%) | 0 (0.0%) |
| Retail Trade | 2 (100.0%) | 0 (0.0%) |
| Transportation & Warehousing | 2 (100.0%) | 0 (0.0%) |
| Utilities | 0 (0.0%) | 0 (0.0%) |
| Information | 0 (0.0%) | 1 (100.0%) |
| Finance & Insurance | 0 (0.0%) | 0 (0.0%) |
| Real Estate, Rental & Leasing | 0 (0.0%) | 2 (100.0%) |
| Professional & Scientific | 0 (0.0%) | 0 (0.0%) |
| Enterprise Management | 0 (0.0%) | 0 (0.0%) |
| Administrative & Support | 0 (0.0%) | 0 (0.0%) |
| Educational Services | 0 (0.0%) | 5 (100.0%) |
| Health Care & Social Assistance | 0 (0.0%) | 2 (100.0%) |
| Arts, Entertainment & Recreation | 0 (0.0%) | 0 (0.0%) |
| Accommodation & Food Services | 0 (0.0%) | 0 (0.0%) |
| Public Administration | 0 (0.0%) | 0 (0.0%) |
| Total | 8 (38.1%) | 13 (61.9%) |
Education in Big Lake
School Enrollment in Big Lake
The most common levels of schooling among the 7 students in Big Lake are middle school (4 | 57.1%), and college / undergraduate (3 | 42.9%).
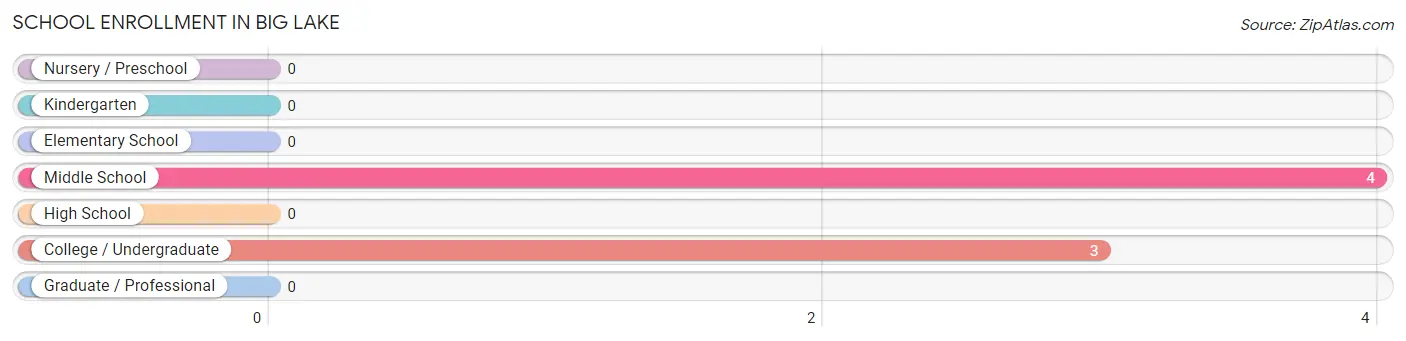
| School Level | # Students | % Students |
| Nursery / Preschool | 0 | 0.0% |
| Kindergarten | 0 | 0.0% |
| Elementary School | 0 | 0.0% |
| Middle School | 4 | 57.1% |
| High School | 0 | 0.0% |
| College / Undergraduate | 3 | 42.9% |
| Graduate / Professional | 0 | 0.0% |
| Total | 7 | 100.0% |
School Enrollment by Age by Funding Source in Big Lake
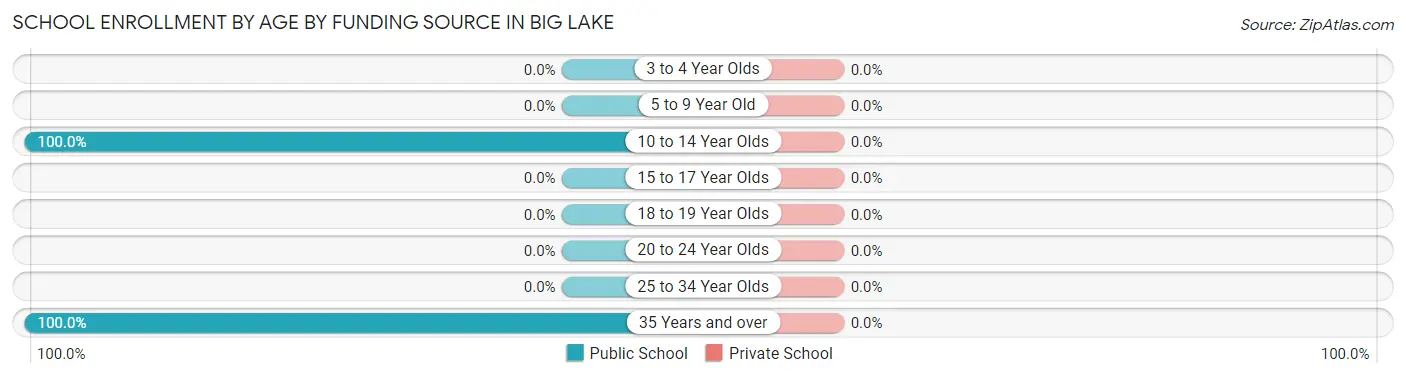
| Age Bracket | Public School | Private School |
| 3 to 4 Year Olds | 0 (0.0%) | 0 (0.0%) |
| 5 to 9 Year Old | 0 (0.0%) | 0 (0.0%) |
| 10 to 14 Year Olds | 4 (100.0%) | 0 (0.0%) |
| 15 to 17 Year Olds | 0 (0.0%) | 0 (0.0%) |
| 18 to 19 Year Olds | 0 (0.0%) | 0 (0.0%) |
| 20 to 24 Year Olds | 0 (0.0%) | 0 (0.0%) |
| 25 to 34 Year Olds | 0 (0.0%) | 0 (0.0%) |
| 35 Years and over | 3 (100.0%) | 0 (0.0%) |
| Total | 7 (100.0%) | 0 (0.0%) |
Educational Attainment by Field of Study in Big Lake
Science & technology (7 | 25.0%), education (7 | 25.0%), engineering (6 | 21.4%), literature & languages (5 | 17.9%), and bio, nature & agricultural (1 | 3.6%) are the most common fields of study among 28 individuals in Big Lake who have obtained a bachelor's degree or higher.
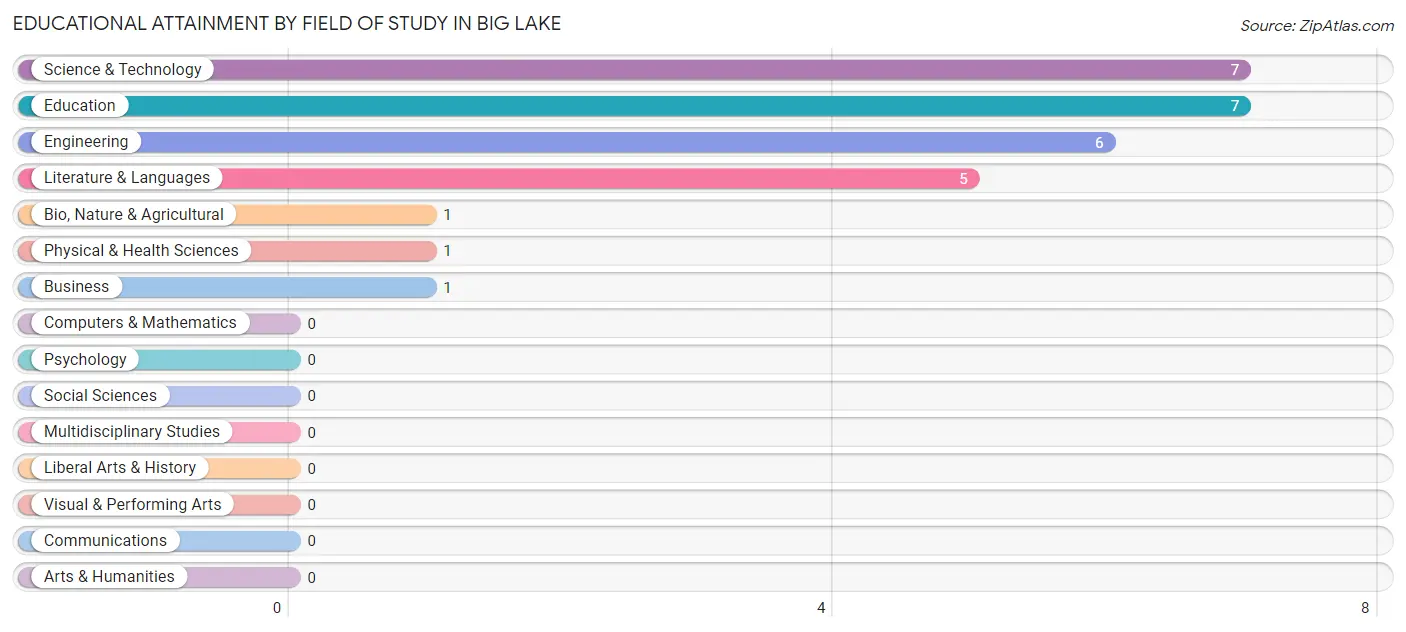
| Field of Study | # Graduates | % Graduates |
| Computers & Mathematics | 0 | 0.0% |
| Bio, Nature & Agricultural | 1 | 3.6% |
| Physical & Health Sciences | 1 | 3.6% |
| Psychology | 0 | 0.0% |
| Social Sciences | 0 | 0.0% |
| Engineering | 6 | 21.4% |
| Multidisciplinary Studies | 0 | 0.0% |
| Science & Technology | 7 | 25.0% |
| Business | 1 | 3.6% |
| Education | 7 | 25.0% |
| Literature & Languages | 5 | 17.9% |
| Liberal Arts & History | 0 | 0.0% |
| Visual & Performing Arts | 0 | 0.0% |
| Communications | 0 | 0.0% |
| Arts & Humanities | 0 | 0.0% |
| Total | 28 | 100.0% |
Transportation & Commute in Big Lake
Vehicle Availability by Sex in Big Lake
The most prevalent vehicle ownership categories in Big Lake are males with 2 vehicles (4, accounting for 40.0%) and females with 2 vehicles (3, making up 30.8%).
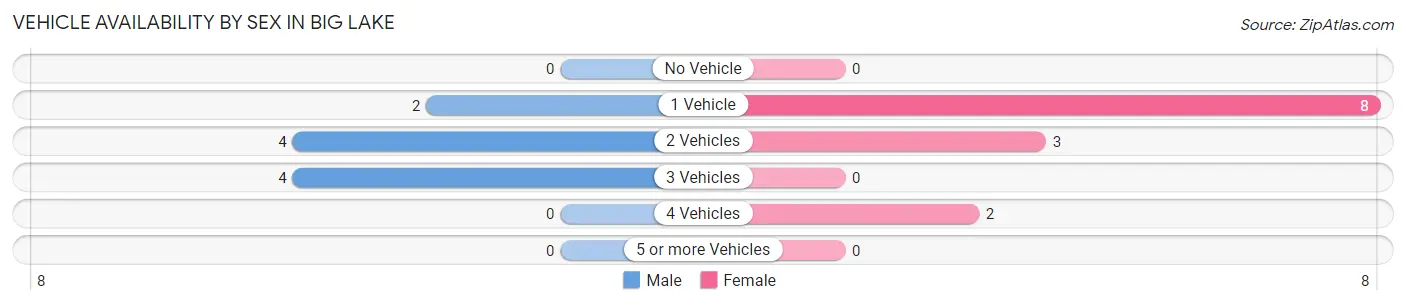
| Vehicles Available | Male | Female |
| No Vehicle | 0 (0.0%) | 0 (0.0%) |
| 1 Vehicle | 2 (20.0%) | 8 (61.5%) |
| 2 Vehicles | 4 (40.0%) | 3 (23.1%) |
| 3 Vehicles | 4 (40.0%) | 0 (0.0%) |
| 4 Vehicles | 0 (0.0%) | 2 (15.4%) |
| 5 or more Vehicles | 0 (0.0%) | 0 (0.0%) |
| Total | 10 (100.0%) | 13 (100.0%) |
Commute Time in Big Lake
The most frequently occuring commute durations in Big Lake are 40 to 44 minutes (5 commuters, 23.8%), 60 to 89 minutes (3 commuters, 14.3%), and less than 5 minutes (2 commuters, 9.5%).
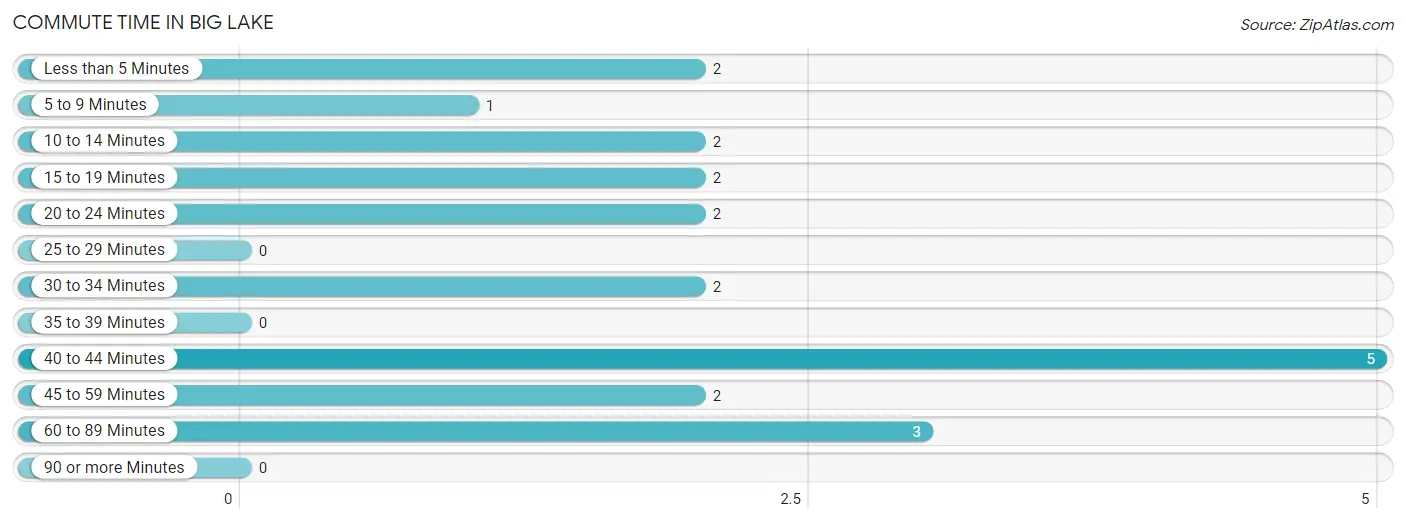
| Commute Time | # Commuters | % Commuters |
| Less than 5 Minutes | 2 | 9.5% |
| 5 to 9 Minutes | 1 | 4.8% |
| 10 to 14 Minutes | 2 | 9.5% |
| 15 to 19 Minutes | 2 | 9.5% |
| 20 to 24 Minutes | 2 | 9.5% |
| 25 to 29 Minutes | 0 | 0.0% |
| 30 to 34 Minutes | 2 | 9.5% |
| 35 to 39 Minutes | 0 | 0.0% |
| 40 to 44 Minutes | 5 | 23.8% |
| 45 to 59 Minutes | 2 | 9.5% |
| 60 to 89 Minutes | 3 | 14.3% |
| 90 or more Minutes | 0 | 0.0% |
Commute Time by Sex in Big Lake
The most common commute times in Big Lake are 60 to 89 minutes (3 commuters, 30.0%) for males and 40 to 44 minutes (5 commuters, 45.5%) for females.
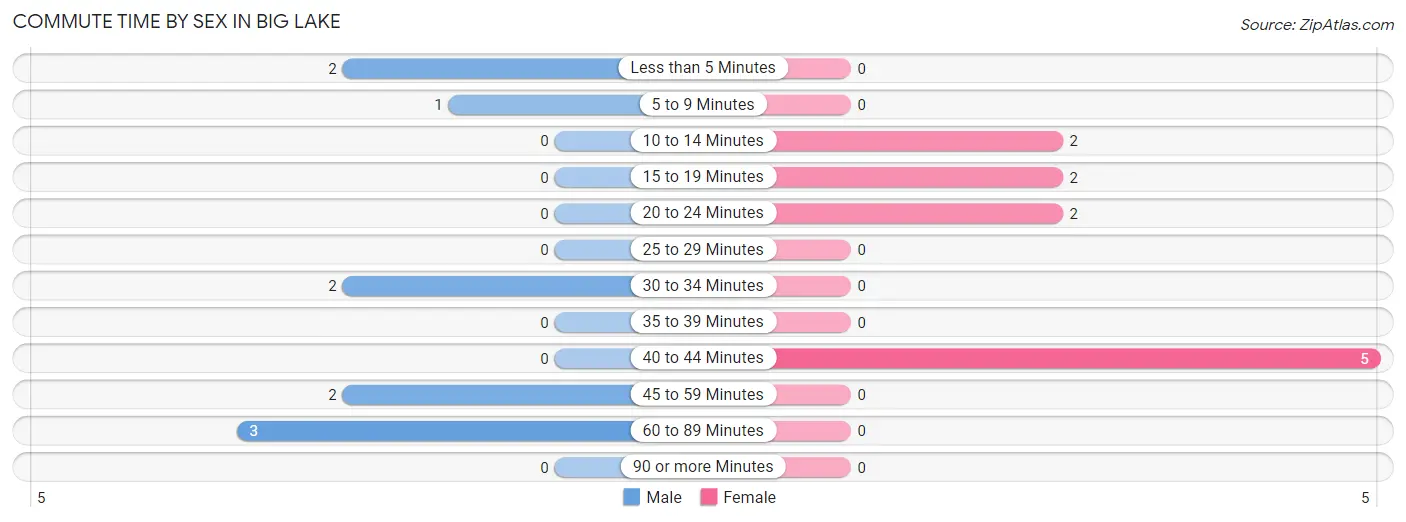
| Commute Time | Male | Female |
| Less than 5 Minutes | 2 (20.0%) | 0 (0.0%) |
| 5 to 9 Minutes | 1 (10.0%) | 0 (0.0%) |
| 10 to 14 Minutes | 0 (0.0%) | 2 (18.2%) |
| 15 to 19 Minutes | 0 (0.0%) | 2 (18.2%) |
| 20 to 24 Minutes | 0 (0.0%) | 2 (18.2%) |
| 25 to 29 Minutes | 0 (0.0%) | 0 (0.0%) |
| 30 to 34 Minutes | 2 (20.0%) | 0 (0.0%) |
| 35 to 39 Minutes | 0 (0.0%) | 0 (0.0%) |
| 40 to 44 Minutes | 0 (0.0%) | 5 (45.5%) |
| 45 to 59 Minutes | 2 (20.0%) | 0 (0.0%) |
| 60 to 89 Minutes | 3 (30.0%) | 0 (0.0%) |
| 90 or more Minutes | 0 (0.0%) | 0 (0.0%) |
Time of Departure to Work by Sex in Big Lake
The most frequent times of departure to work in Big Lake are 5:00 AM to 5:29 AM (3, 30.0%) for males and 6:30 AM to 6:59 AM (5, 45.5%) for females.
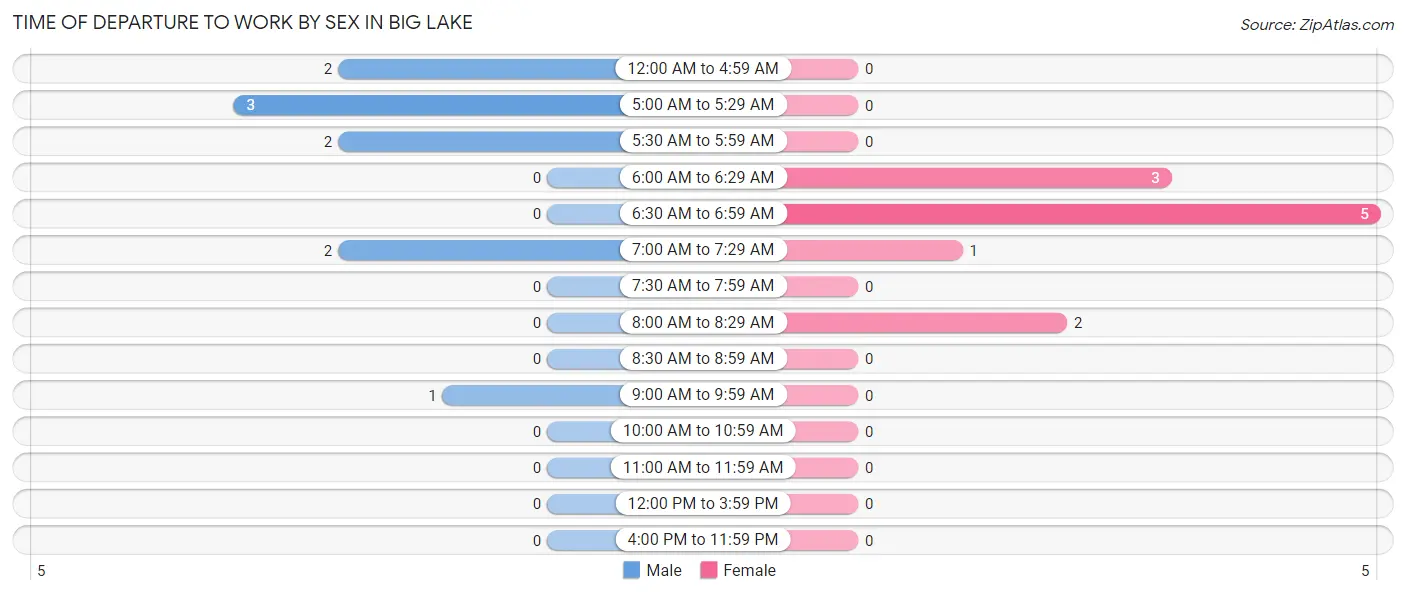
| Time of Departure | Male | Female |
| 12:00 AM to 4:59 AM | 2 (20.0%) | 0 (0.0%) |
| 5:00 AM to 5:29 AM | 3 (30.0%) | 0 (0.0%) |
| 5:30 AM to 5:59 AM | 2 (20.0%) | 0 (0.0%) |
| 6:00 AM to 6:29 AM | 0 (0.0%) | 3 (27.3%) |
| 6:30 AM to 6:59 AM | 0 (0.0%) | 5 (45.5%) |
| 7:00 AM to 7:29 AM | 2 (20.0%) | 1 (9.1%) |
| 7:30 AM to 7:59 AM | 0 (0.0%) | 0 (0.0%) |
| 8:00 AM to 8:29 AM | 0 (0.0%) | 2 (18.2%) |
| 8:30 AM to 8:59 AM | 0 (0.0%) | 0 (0.0%) |
| 9:00 AM to 9:59 AM | 1 (10.0%) | 0 (0.0%) |
| 10:00 AM to 10:59 AM | 0 (0.0%) | 0 (0.0%) |
| 11:00 AM to 11:59 AM | 0 (0.0%) | 0 (0.0%) |
| 12:00 PM to 3:59 PM | 0 (0.0%) | 0 (0.0%) |
| 4:00 PM to 11:59 PM | 0 (0.0%) | 0 (0.0%) |
| Total | 10 (100.0%) | 11 (100.0%) |
Housing Occupancy in Big Lake
Occupancy by Ownership in Big Lake
Of the total 42 dwellings in Big Lake, owner-occupied units account for 37 (88.1%), while renter-occupied units make up 5 (11.9%).
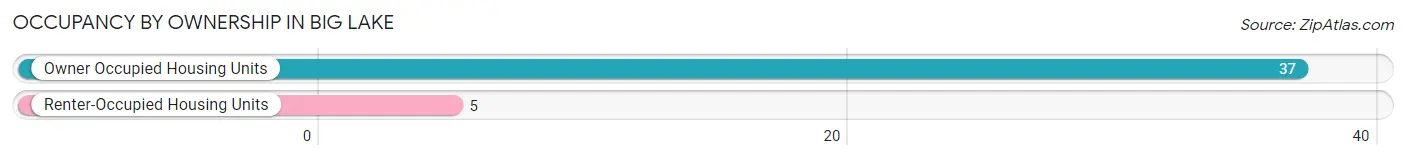
| Occupancy | # Housing Units | % Housing Units |
| Owner Occupied Housing Units | 37 | 88.1% |
| Renter-Occupied Housing Units | 5 | 11.9% |
| Total Occupied Housing Units | 42 | 100.0% |
Occupancy by Household Size in Big Lake
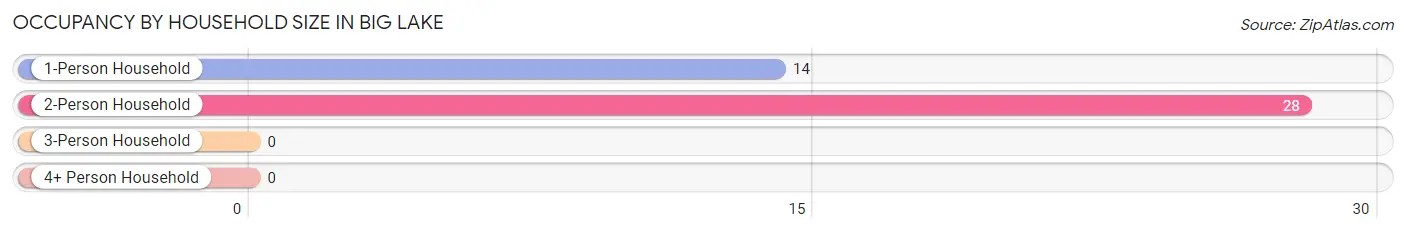
| Household Size | # Housing Units | % Housing Units |
| 1-Person Household | 14 | 33.3% |
| 2-Person Household | 28 | 66.7% |
| 3-Person Household | 0 | 0.0% |
| 4+ Person Household | 0 | 0.0% |
| Total Housing Units | 42 | 100.0% |
Occupancy by Ownership by Household Size in Big Lake
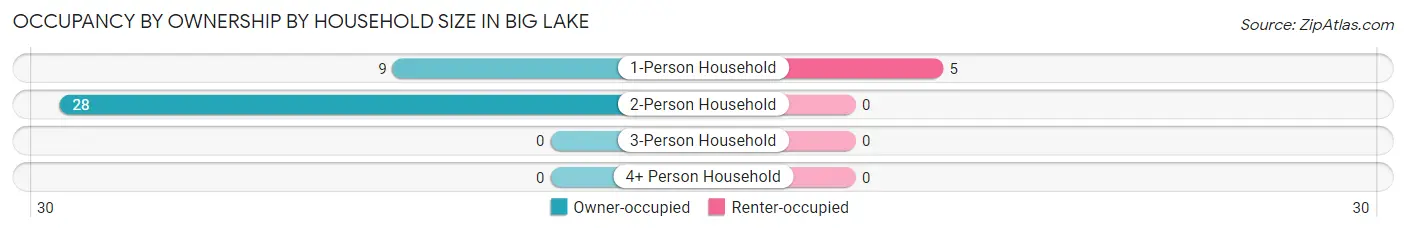
| Household Size | Owner-occupied | Renter-occupied |
| 1-Person Household | 9 (64.3%) | 5 (35.7%) |
| 2-Person Household | 28 (100.0%) | 0 (0.0%) |
| 3-Person Household | 0 (0.0%) | 0 (0.0%) |
| 4+ Person Household | 0 (0.0%) | 0 (0.0%) |
| Total Housing Units | 37 (88.1%) | 5 (11.9%) |
Occupancy by Educational Attainment in Big Lake
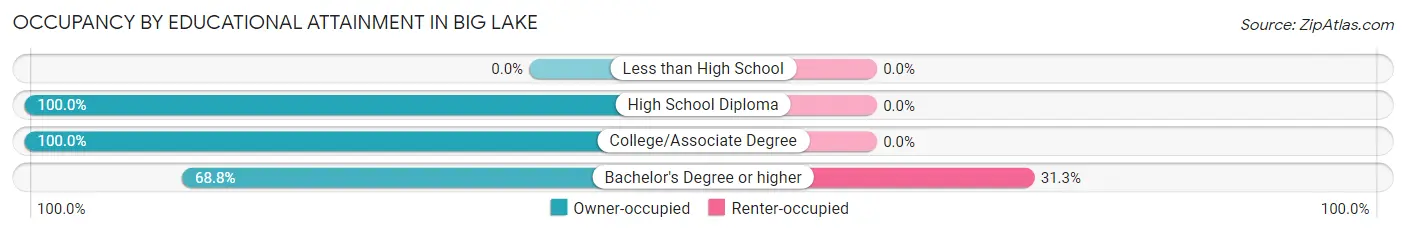
| Household Size | Owner-occupied | Renter-occupied |
| Less than High School | 0 (0.0%) | 0 (0.0%) |
| High School Diploma | 12 (100.0%) | 0 (0.0%) |
| College/Associate Degree | 14 (100.0%) | 0 (0.0%) |
| Bachelor's Degree or higher | 11 (68.8%) | 5 (31.2%) |
Occupancy by Age of Householder in Big Lake
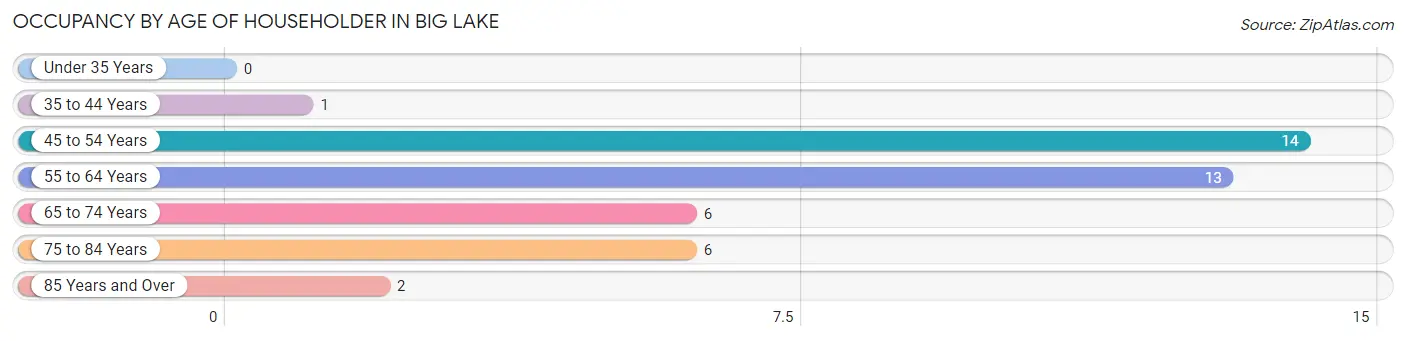
| Age Bracket | # Households | % Households |
| Under 35 Years | 0 | 0.0% |
| 35 to 44 Years | 1 | 2.4% |
| 45 to 54 Years | 14 | 33.3% |
| 55 to 64 Years | 13 | 30.9% |
| 65 to 74 Years | 6 | 14.3% |
| 75 to 84 Years | 6 | 14.3% |
| 85 Years and Over | 2 | 4.8% |
| Total | 42 | 100.0% |
Housing Finances in Big Lake
Median Income by Occupancy in Big Lake
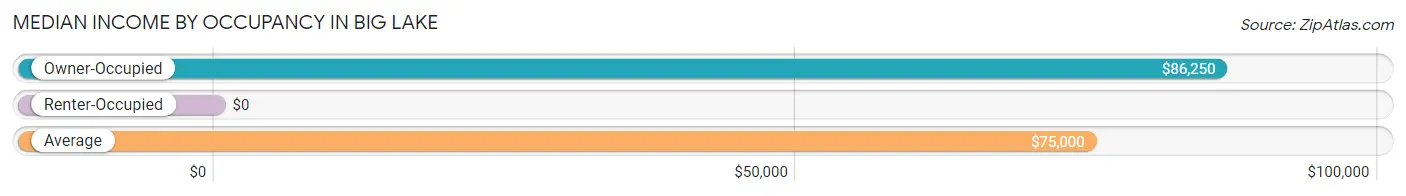
| Occupancy Type | # Households | Median Income |
| Owner-Occupied | 37 (88.1%) | $86,250 |
| Renter-Occupied | 5 (11.9%) | $0 |
| Average | 42 (100.0%) | $75,000 |
Occupancy by Householder Income Bracket in Big Lake
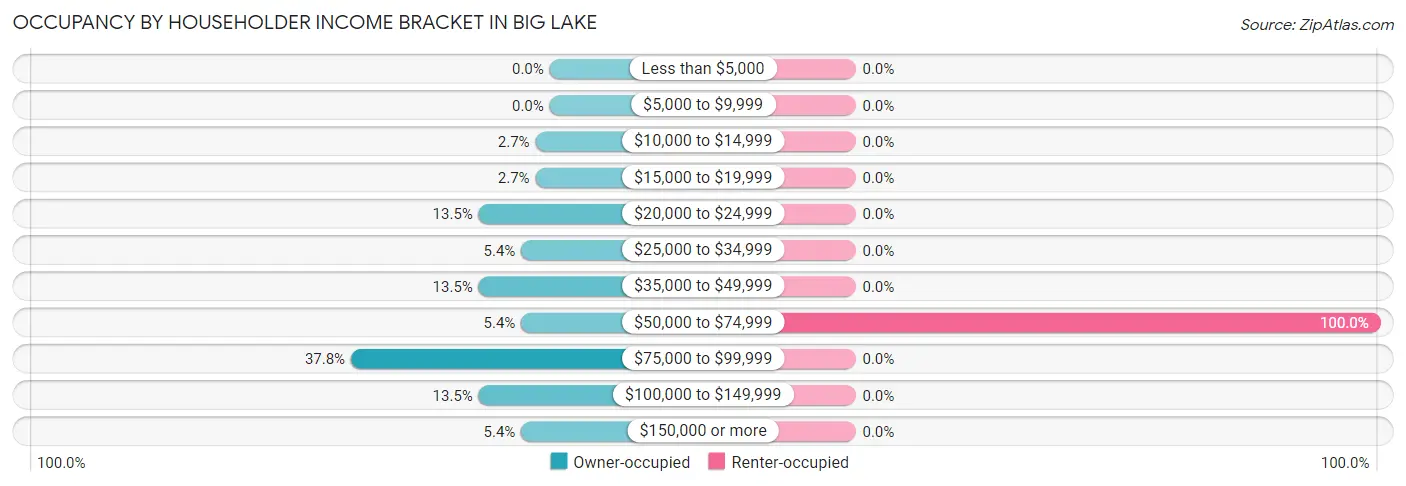
| Income Bracket | Owner-occupied | Renter-occupied |
| Less than $5,000 | 0 (0.0%) | 0 (0.0%) |
| $5,000 to $9,999 | 0 (0.0%) | 0 (0.0%) |
| $10,000 to $14,999 | 1 (2.7%) | 0 (0.0%) |
| $15,000 to $19,999 | 1 (2.7%) | 0 (0.0%) |
| $20,000 to $24,999 | 5 (13.5%) | 0 (0.0%) |
| $25,000 to $34,999 | 2 (5.4%) | 0 (0.0%) |
| $35,000 to $49,999 | 5 (13.5%) | 0 (0.0%) |
| $50,000 to $74,999 | 2 (5.4%) | 5 (100.0%) |
| $75,000 to $99,999 | 14 (37.8%) | 0 (0.0%) |
| $100,000 to $149,999 | 5 (13.5%) | 0 (0.0%) |
| $150,000 or more | 2 (5.4%) | 0 (0.0%) |
| Total | 37 (100.0%) | 5 (100.0%) |
Monthly Housing Cost Tiers in Big Lake
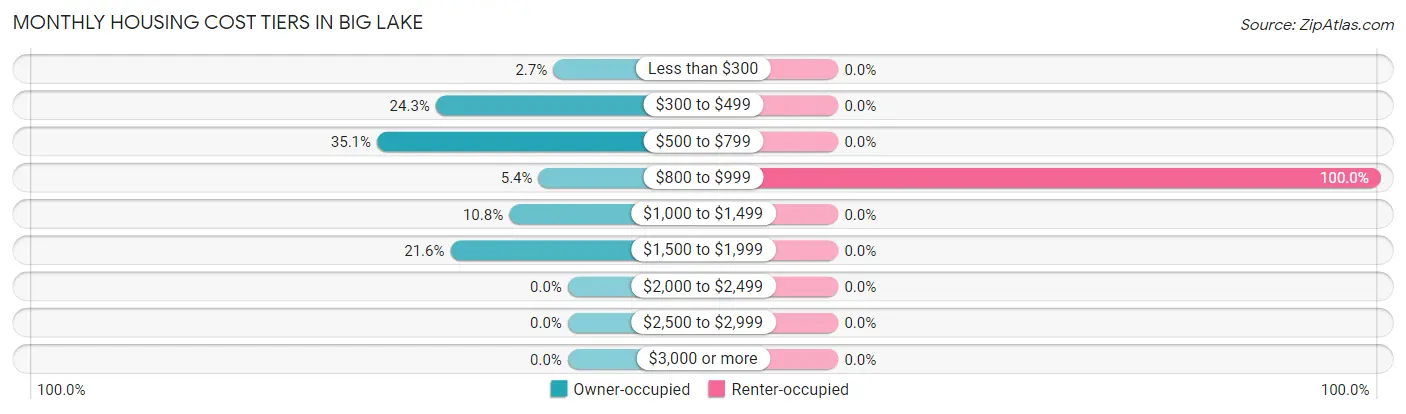
| Monthly Cost | Owner-occupied | Renter-occupied |
| Less than $300 | 1 (2.7%) | 0 (0.0%) |
| $300 to $499 | 9 (24.3%) | 0 (0.0%) |
| $500 to $799 | 13 (35.1%) | 0 (0.0%) |
| $800 to $999 | 2 (5.4%) | 5 (100.0%) |
| $1,000 to $1,499 | 4 (10.8%) | 0 (0.0%) |
| $1,500 to $1,999 | 8 (21.6%) | 0 (0.0%) |
| $2,000 to $2,499 | 0 (0.0%) | 0 (0.0%) |
| $2,500 to $2,999 | 0 (0.0%) | 0 (0.0%) |
| $3,000 or more | 0 (0.0%) | 0 (0.0%) |
| Total | 37 (100.0%) | 5 (100.0%) |
Physical Housing Characteristics in Big Lake
Housing Structures in Big Lake
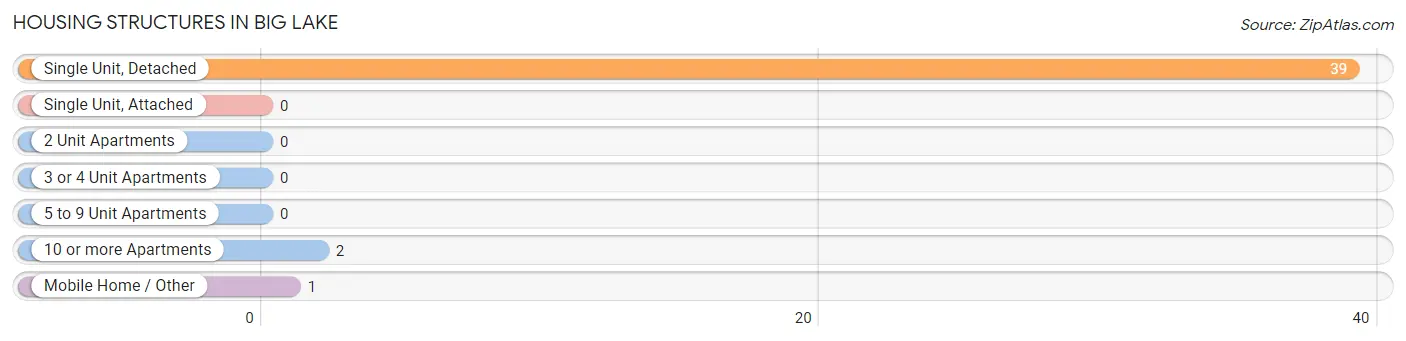
| Structure Type | # Housing Units | % Housing Units |
| Single Unit, Detached | 39 | 92.9% |
| Single Unit, Attached | 0 | 0.0% |
| 2 Unit Apartments | 0 | 0.0% |
| 3 or 4 Unit Apartments | 0 | 0.0% |
| 5 to 9 Unit Apartments | 0 | 0.0% |
| 10 or more Apartments | 2 | 4.8% |
| Mobile Home / Other | 1 | 2.4% |
| Total | 42 | 100.0% |
Housing Structures by Occupancy in Big Lake
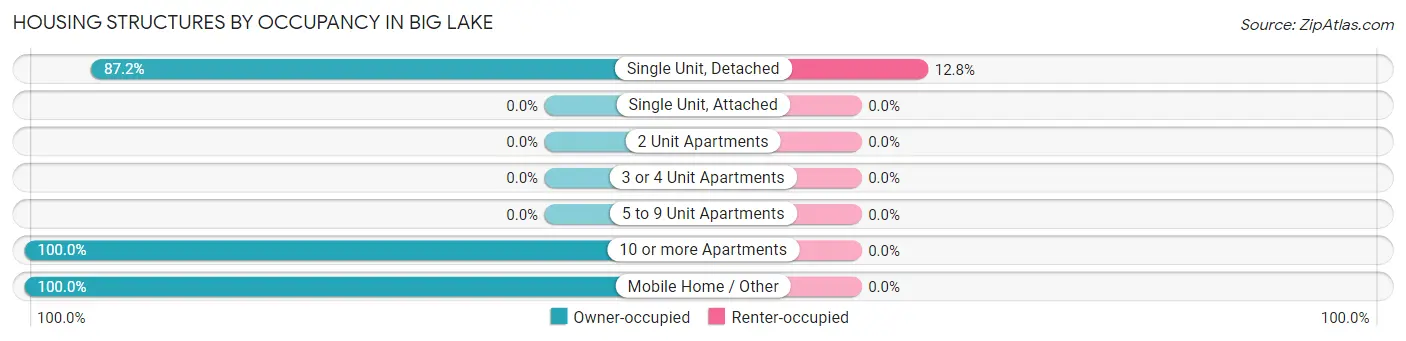
| Structure Type | Owner-occupied | Renter-occupied |
| Single Unit, Detached | 34 (87.2%) | 5 (12.8%) |
| Single Unit, Attached | 0 (0.0%) | 0 (0.0%) |
| 2 Unit Apartments | 0 (0.0%) | 0 (0.0%) |
| 3 or 4 Unit Apartments | 0 (0.0%) | 0 (0.0%) |
| 5 to 9 Unit Apartments | 0 (0.0%) | 0 (0.0%) |
| 10 or more Apartments | 2 (100.0%) | 0 (0.0%) |
| Mobile Home / Other | 1 (100.0%) | 0 (0.0%) |
| Total | 37 (88.1%) | 5 (11.9%) |
Housing Structures by Number of Rooms in Big Lake
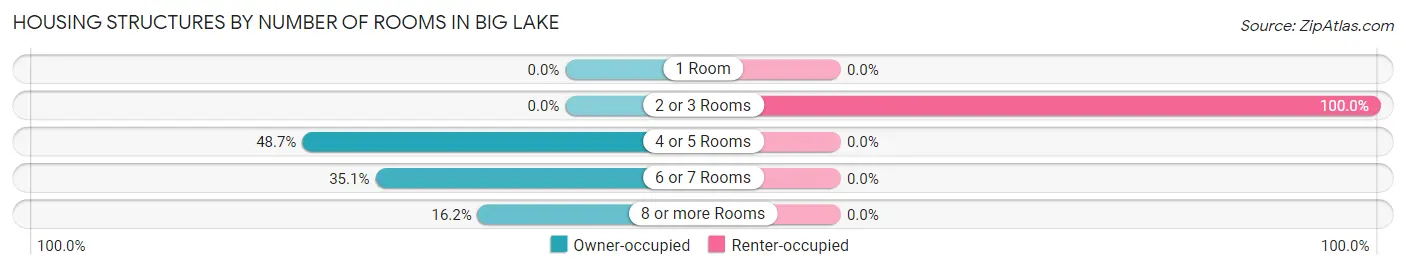
| Number of Rooms | Owner-occupied | Renter-occupied |
| 1 Room | 0 (0.0%) | 0 (0.0%) |
| 2 or 3 Rooms | 0 (0.0%) | 5 (100.0%) |
| 4 or 5 Rooms | 18 (48.6%) | 0 (0.0%) |
| 6 or 7 Rooms | 13 (35.1%) | 0 (0.0%) |
| 8 or more Rooms | 6 (16.2%) | 0 (0.0%) |
| Total | 37 (100.0%) | 5 (100.0%) |
Housing Structure by Heating Type in Big Lake
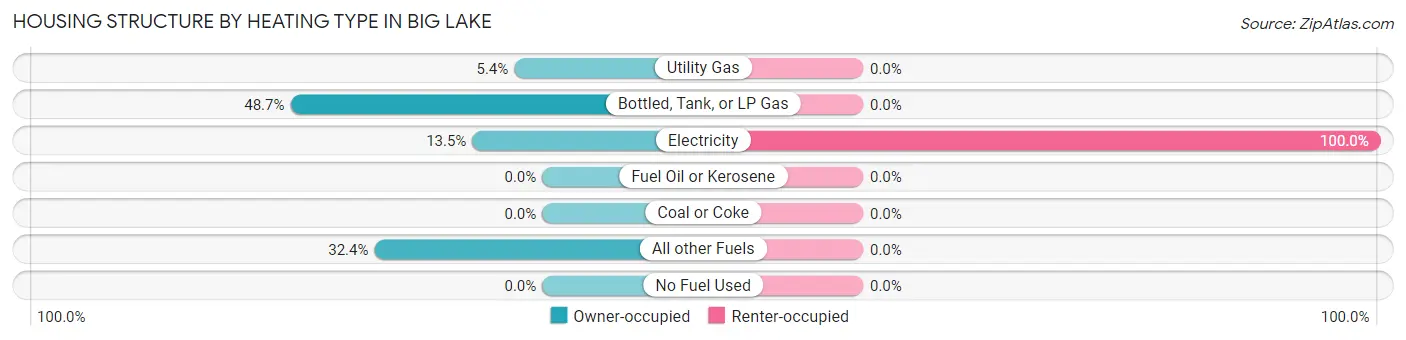
| Heating Type | Owner-occupied | Renter-occupied |
| Utility Gas | 2 (5.4%) | 0 (0.0%) |
| Bottled, Tank, or LP Gas | 18 (48.6%) | 0 (0.0%) |
| Electricity | 5 (13.5%) | 5 (100.0%) |
| Fuel Oil or Kerosene | 0 (0.0%) | 0 (0.0%) |
| Coal or Coke | 0 (0.0%) | 0 (0.0%) |
| All other Fuels | 12 (32.4%) | 0 (0.0%) |
| No Fuel Used | 0 (0.0%) | 0 (0.0%) |
| Total | 37 (100.0%) | 5 (100.0%) |
Household Vehicle Usage in Big Lake
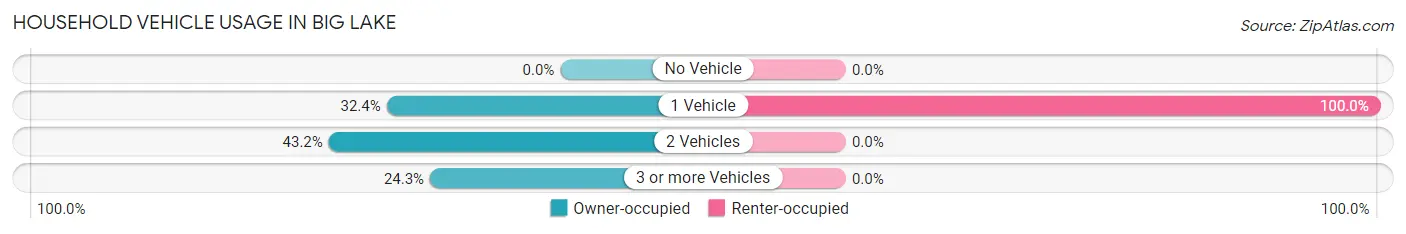
| Vehicles per Household | Owner-occupied | Renter-occupied |
| No Vehicle | 0 (0.0%) | 0 (0.0%) |
| 1 Vehicle | 12 (32.4%) | 5 (100.0%) |
| 2 Vehicles | 16 (43.2%) | 0 (0.0%) |
| 3 or more Vehicles | 9 (24.3%) | 0 (0.0%) |
| Total | 37 (100.0%) | 5 (100.0%) |
Real Estate & Mortgages in Big Lake
Real Estate and Mortgage Overview in Big Lake
| Characteristic | Without Mortgage | With Mortgage |
| Housing Units | 27 | 10 |
| Median Property Value | $186,300 | $275,000 |
| Median Household Income | $73,750 | $0 |
| Monthly Housing Costs | $544 | $0 |
| Real Estate Taxes | $1,344 | $0 |
Property Value by Mortgage Status in Big Lake
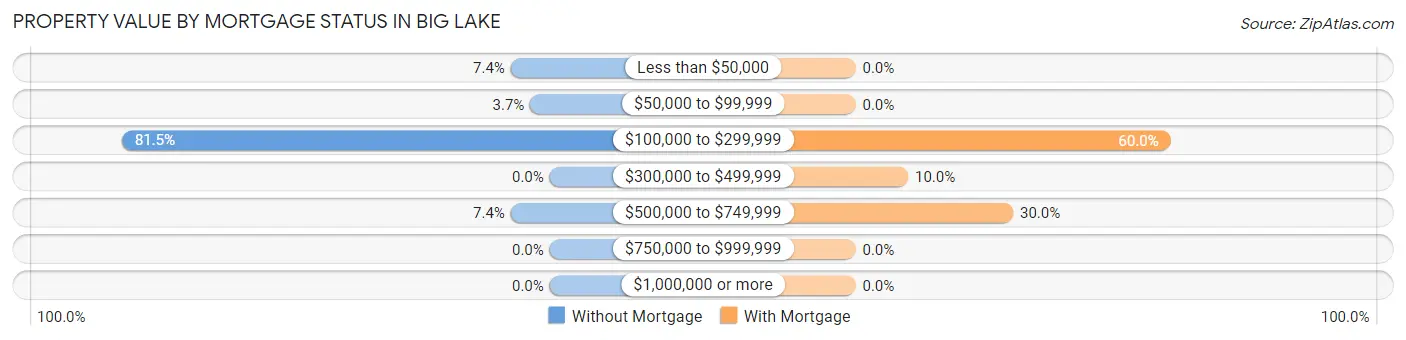
| Property Value | Without Mortgage | With Mortgage |
| Less than $50,000 | 2 (7.4%) | 0 (0.0%) |
| $50,000 to $99,999 | 1 (3.7%) | 0 (0.0%) |
| $100,000 to $299,999 | 22 (81.5%) | 6 (60.0%) |
| $300,000 to $499,999 | 0 (0.0%) | 1 (10.0%) |
| $500,000 to $749,999 | 2 (7.4%) | 3 (30.0%) |
| $750,000 to $999,999 | 0 (0.0%) | 0 (0.0%) |
| $1,000,000 or more | 0 (0.0%) | 0 (0.0%) |
| Total | 27 (100.0%) | 10 (100.0%) |
Household Income by Mortgage Status in Big Lake
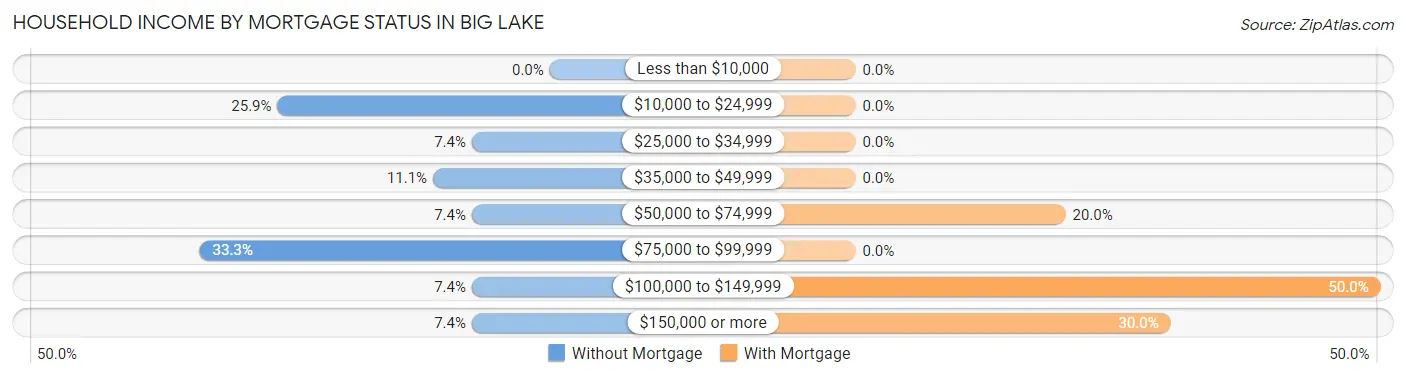
| Household Income | Without Mortgage | With Mortgage |
| Less than $10,000 | 0 (0.0%) | 0 (0.0%) |
| $10,000 to $24,999 | 7 (25.9%) | 0 (0.0%) |
| $25,000 to $34,999 | 2 (7.4%) | 0 (0.0%) |
| $35,000 to $49,999 | 3 (11.1%) | 0 (0.0%) |
| $50,000 to $74,999 | 2 (7.4%) | 2 (20.0%) |
| $75,000 to $99,999 | 9 (33.3%) | 0 (0.0%) |
| $100,000 to $149,999 | 2 (7.4%) | 5 (50.0%) |
| $150,000 or more | 2 (7.4%) | 3 (30.0%) |
| Total | 27 (100.0%) | 10 (100.0%) |
Property Value to Household Income Ratio in Big Lake
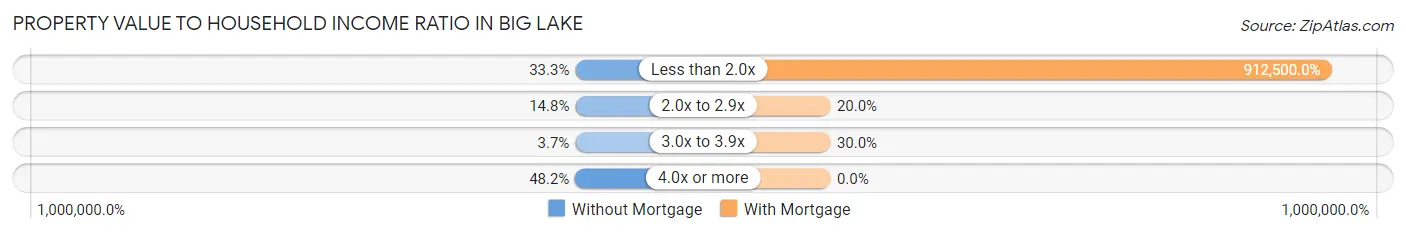
| Value-to-Income Ratio | Without Mortgage | With Mortgage |
| Less than 2.0x | 9 (33.3%) | 91,250 (912,500.0%) |
| 2.0x to 2.9x | 4 (14.8%) | 2 (20.0%) |
| 3.0x to 3.9x | 1 (3.7%) | 3 (30.0%) |
| 4.0x or more | 13 (48.1%) | 0 (0.0%) |
| Total | 27 (100.0%) | 10 (100.0%) |
Real Estate Taxes by Mortgage Status in Big Lake
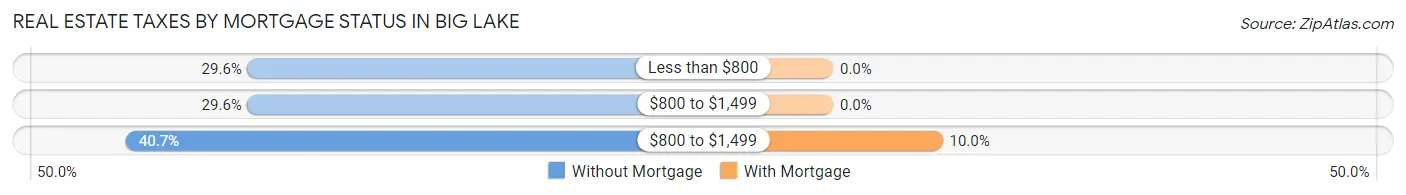
| Property Taxes | Without Mortgage | With Mortgage |
| Less than $800 | 8 (29.6%) | 0 (0.0%) |
| $800 to $1,499 | 8 (29.6%) | 0 (0.0%) |
| $800 to $1,499 | 11 (40.7%) | 1 (10.0%) |
| Total | 27 (100.0%) | 10 (100.0%) |
Health & Disability in Big Lake
Health Insurance Coverage by Age in Big Lake
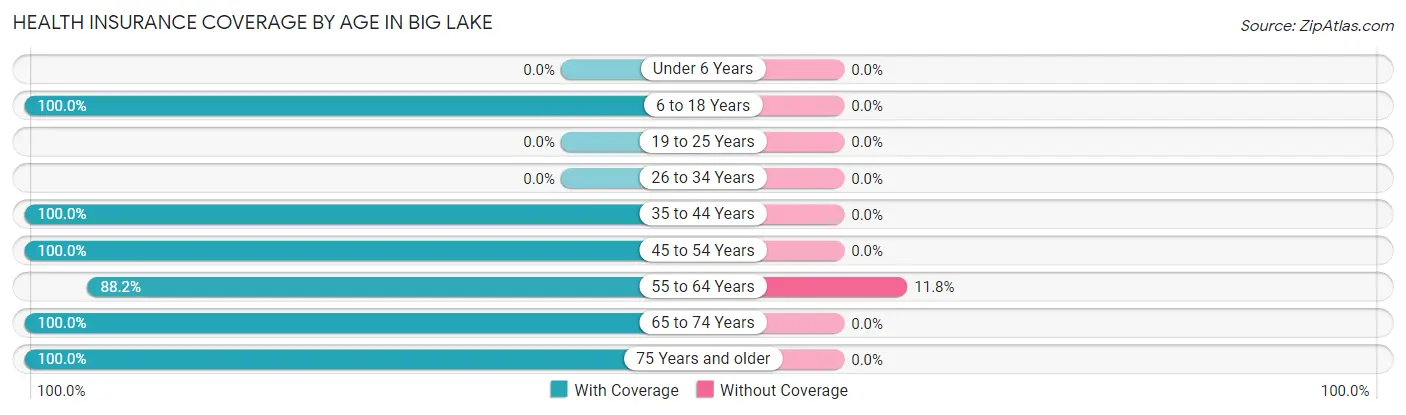
| Age Bracket | With Coverage | Without Coverage |
| Under 6 Years | 0 (0.0%) | 0 (0.0%) |
| 6 to 18 Years | 4 (100.0%) | 0 (0.0%) |
| 19 to 25 Years | 0 (0.0%) | 0 (0.0%) |
| 26 to 34 Years | 0 (0.0%) | 0 (0.0%) |
| 35 to 44 Years | 1 (100.0%) | 0 (0.0%) |
| 45 to 54 Years | 20 (100.0%) | 0 (0.0%) |
| 55 to 64 Years | 15 (88.2%) | 2 (11.8%) |
| 65 to 74 Years | 11 (100.0%) | 0 (0.0%) |
| 75 Years and older | 14 (100.0%) | 0 (0.0%) |
| Total | 65 (97.0%) | 2 (3.0%) |
Health Insurance Coverage by Citizenship Status in Big Lake
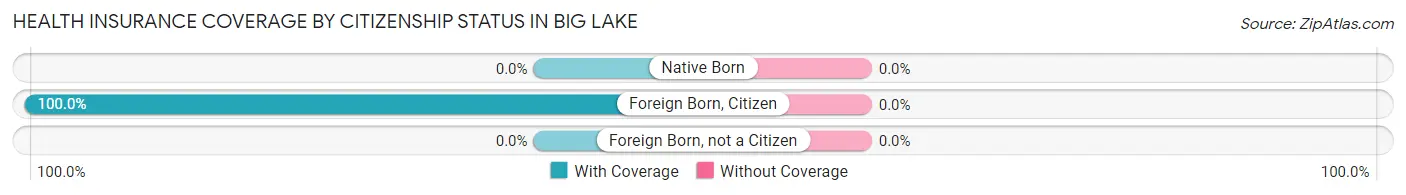
| Citizenship Status | With Coverage | Without Coverage |
| Native Born | 0 (0.0%) | 0 (0.0%) |
| Foreign Born, Citizen | 4 (100.0%) | 0 (0.0%) |
| Foreign Born, not a Citizen | 0 (0.0%) | 0 (0.0%) |
Health Insurance Coverage by Household Income in Big Lake
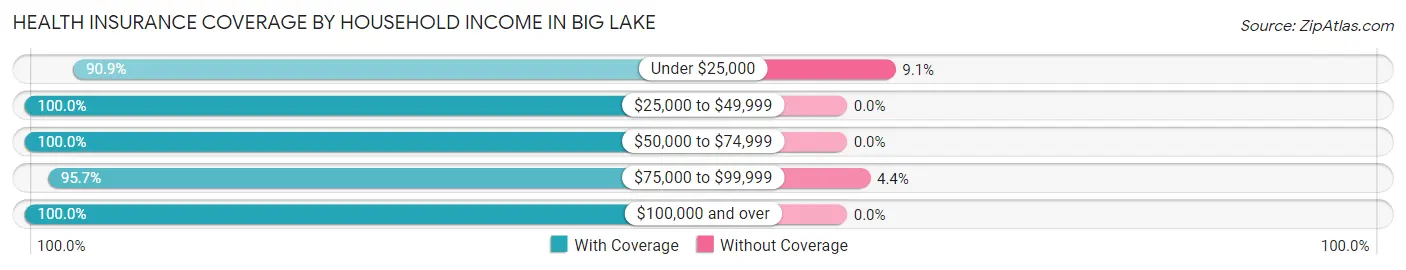
| Household Income | With Coverage | Without Coverage |
| Under $25,000 | 10 (90.9%) | 1 (9.1%) |
| $25,000 to $49,999 | 11 (100.0%) | 0 (0.0%) |
| $50,000 to $74,999 | 10 (100.0%) | 0 (0.0%) |
| $75,000 to $99,999 | 22 (95.7%) | 1 (4.3%) |
| $100,000 and over | 12 (100.0%) | 0 (0.0%) |
Public vs Private Health Insurance Coverage by Age in Big Lake
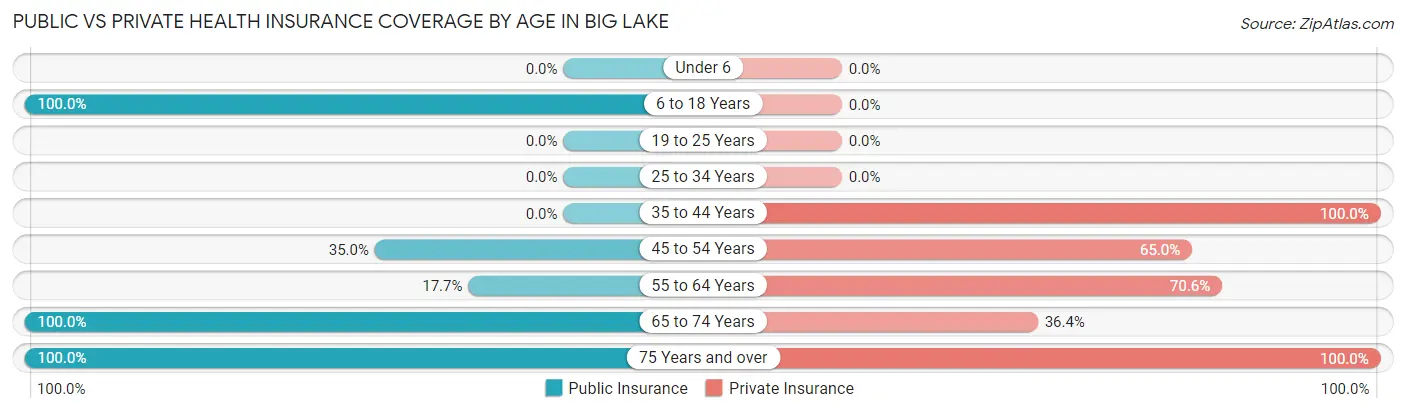
| Age Bracket | Public Insurance | Private Insurance |
| Under 6 | 0 (0.0%) | 0 (0.0%) |
| 6 to 18 Years | 4 (100.0%) | 0 (0.0%) |
| 19 to 25 Years | 0 (0.0%) | 0 (0.0%) |
| 25 to 34 Years | 0 (0.0%) | 0 (0.0%) |
| 35 to 44 Years | 0 (0.0%) | 1 (100.0%) |
| 45 to 54 Years | 7 (35.0%) | 13 (65.0%) |
| 55 to 64 Years | 3 (17.6%) | 12 (70.6%) |
| 65 to 74 Years | 11 (100.0%) | 4 (36.4%) |
| 75 Years and over | 14 (100.0%) | 14 (100.0%) |
| Total | 39 (58.2%) | 44 (65.7%) |
Disability Status by Sex by Age in Big Lake
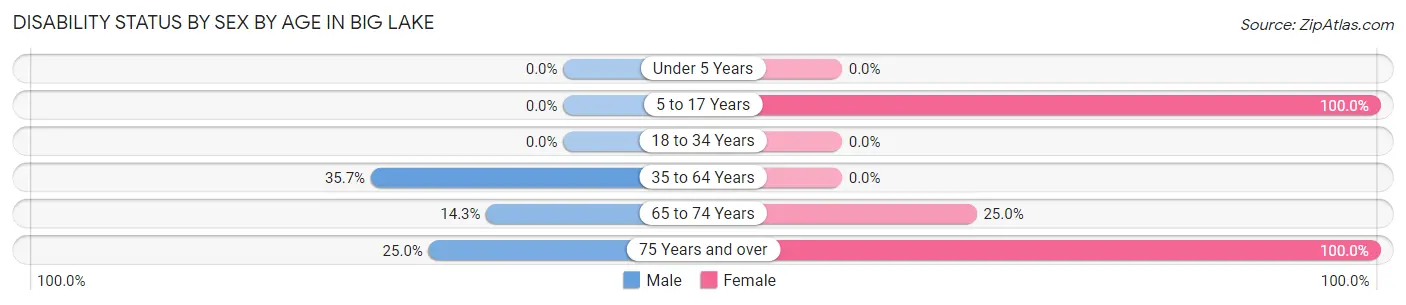
| Age Bracket | Male | Female |
| Under 5 Years | 0 (0.0%) | 0 (0.0%) |
| 5 to 17 Years | 0 (0.0%) | 4 (100.0%) |
| 18 to 34 Years | 0 (0.0%) | 0 (0.0%) |
| 35 to 64 Years | 5 (35.7%) | 0 (0.0%) |
| 65 to 74 Years | 1 (14.3%) | 1 (25.0%) |
| 75 Years and over | 2 (25.0%) | 6 (100.0%) |
Disability Class by Sex by Age in Big Lake
Disability Class: Hearing Difficulty
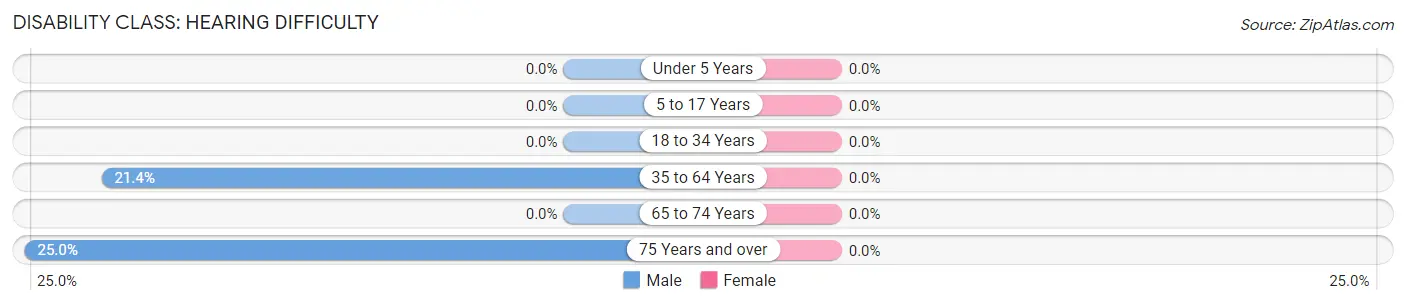
| Age Bracket | Male | Female |
| Under 5 Years | 0 (0.0%) | 0 (0.0%) |
| 5 to 17 Years | 0 (0.0%) | 0 (0.0%) |
| 18 to 34 Years | 0 (0.0%) | 0 (0.0%) |
| 35 to 64 Years | 3 (21.4%) | 0 (0.0%) |
| 65 to 74 Years | 0 (0.0%) | 0 (0.0%) |
| 75 Years and over | 2 (25.0%) | 0 (0.0%) |
Disability Class: Vision Difficulty
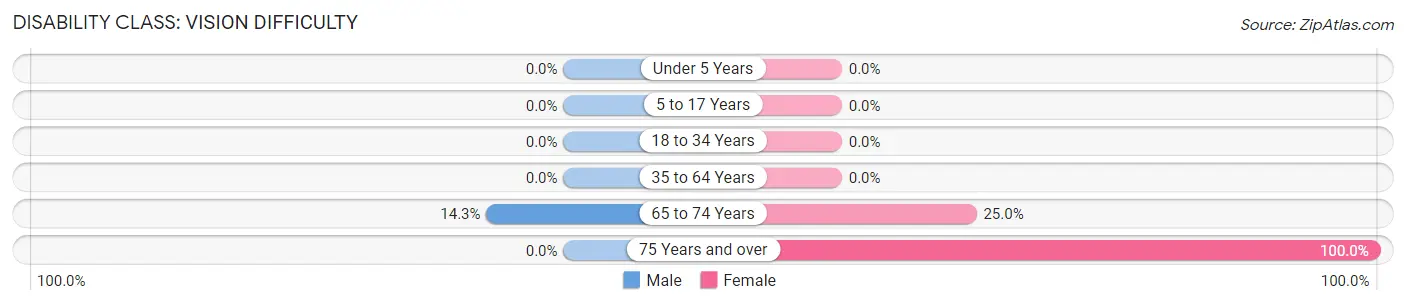
| Age Bracket | Male | Female |
| Under 5 Years | 0 (0.0%) | 0 (0.0%) |
| 5 to 17 Years | 0 (0.0%) | 0 (0.0%) |
| 18 to 34 Years | 0 (0.0%) | 0 (0.0%) |
| 35 to 64 Years | 0 (0.0%) | 0 (0.0%) |
| 65 to 74 Years | 1 (14.3%) | 1 (25.0%) |
| 75 Years and over | 0 (0.0%) | 6 (100.0%) |
Disability Class: Cognitive Difficulty
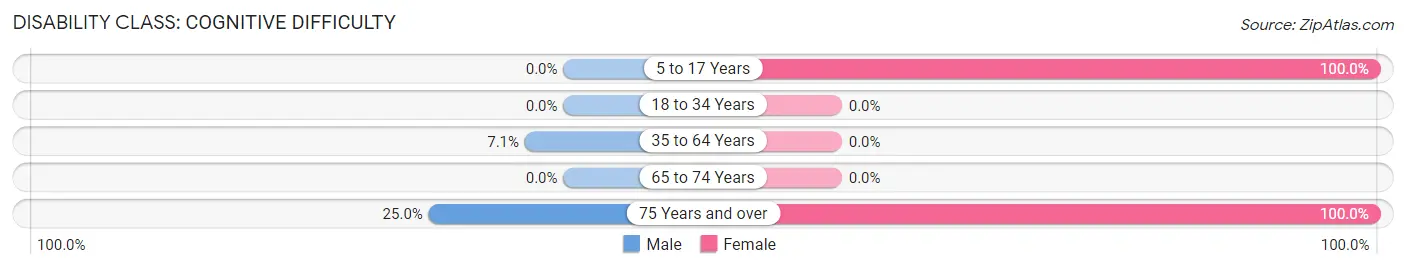
| Age Bracket | Male | Female |
| 5 to 17 Years | 0 (0.0%) | 4 (100.0%) |
| 18 to 34 Years | 0 (0.0%) | 0 (0.0%) |
| 35 to 64 Years | 1 (7.1%) | 0 (0.0%) |
| 65 to 74 Years | 0 (0.0%) | 0 (0.0%) |
| 75 Years and over | 2 (25.0%) | 6 (100.0%) |
Disability Class: Ambulatory Difficulty
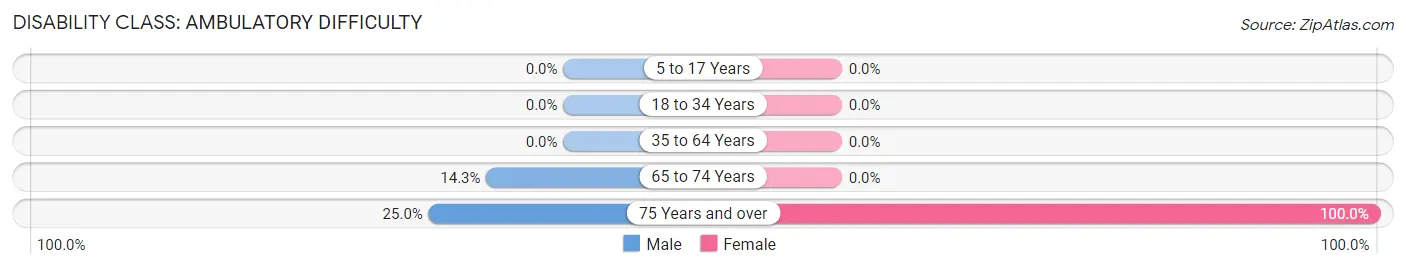
| Age Bracket | Male | Female |
| 5 to 17 Years | 0 (0.0%) | 0 (0.0%) |
| 18 to 34 Years | 0 (0.0%) | 0 (0.0%) |
| 35 to 64 Years | 0 (0.0%) | 0 (0.0%) |
| 65 to 74 Years | 1 (14.3%) | 0 (0.0%) |
| 75 Years and over | 2 (25.0%) | 6 (100.0%) |
Disability Class: Self-Care Difficulty
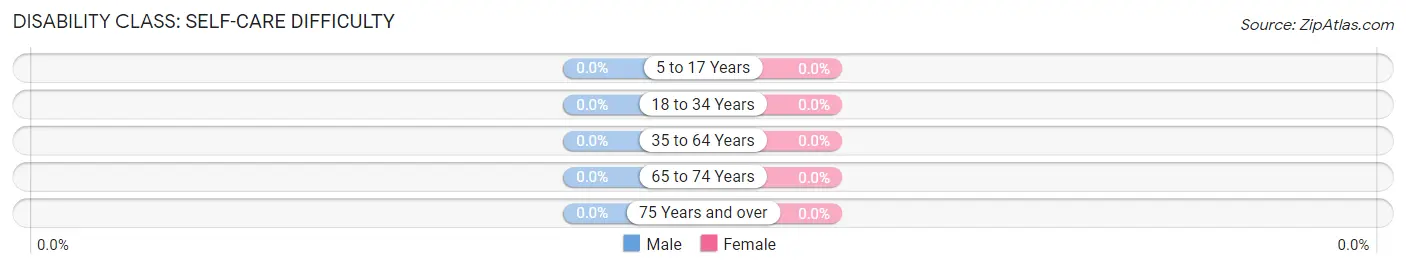
| Age Bracket | Male | Female |
| 5 to 17 Years | 0 (0.0%) | 0 (0.0%) |
| 18 to 34 Years | 0 (0.0%) | 0 (0.0%) |
| 35 to 64 Years | 0 (0.0%) | 0 (0.0%) |
| 65 to 74 Years | 0 (0.0%) | 0 (0.0%) |
| 75 Years and over | 0 (0.0%) | 0 (0.0%) |
Technology Access in Big Lake
Computing Device Access in Big Lake
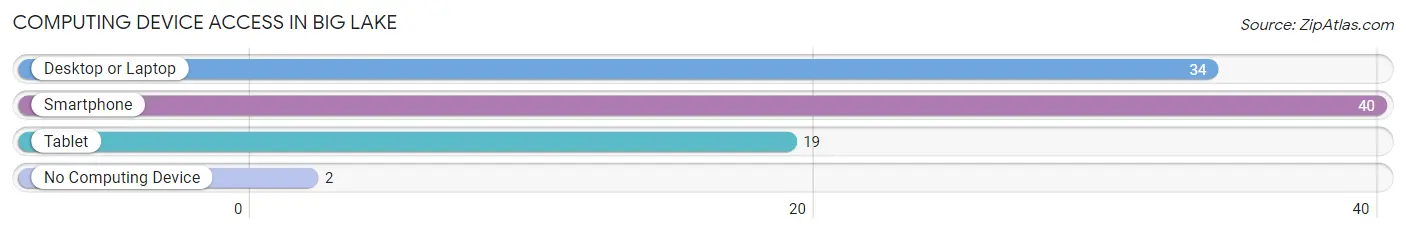
| Device Type | # Households | % Households |
| Desktop or Laptop | 34 | 80.9% |
| Smartphone | 40 | 95.2% |
| Tablet | 19 | 45.2% |
| No Computing Device | 2 | 4.8% |
| Total | 42 | 100.0% |
Internet Access in Big Lake
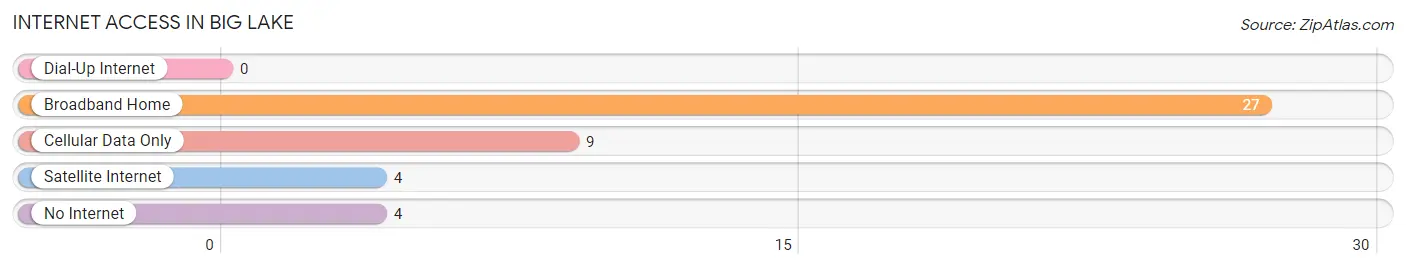
| Internet Type | # Households | % Households |
| Dial-Up Internet | 0 | 0.0% |
| Broadband Home | 27 | 64.3% |
| Cellular Data Only | 9 | 21.4% |
| Satellite Internet | 4 | 9.5% |
| No Internet | 4 | 9.5% |
| Total | 42 | 100.0% |
Big Lake Summary
Big Lake is a small town located in the Ozark Mountains of Missouri. It is situated in the southeastern corner of the state, near the Arkansas border. The town was founded in 1883 and has a population of just over 500 people.
Big Lake is located in the Ozark Mountains, which are part of the larger Ozark Plateau. The town is situated in a valley surrounded by rolling hills and forests. The area is known for its natural beauty and is home to a variety of wildlife, including deer, turkey, and other small game.
The economy of Big Lake is largely based on agriculture. The town is home to several farms, which produce a variety of crops, including corn, soybeans, and hay. The town also has a few small businesses, including a grocery store, a hardware store, and a few restaurants.
The demographics of Big Lake are largely rural. The majority of the population is white, with a small percentage of African Americans and Hispanics. The median household income is around $30,000, and the median age is around 40.
Big Lake is a small town with a rich history. It was founded in 1883 by a group of settlers who were looking for a place to call home. The town has seen its share of ups and downs over the years, but it has remained a close-knit community. The town is known for its friendly people and its beautiful scenery.
Big Lake is a great place to visit or live. It offers a peaceful atmosphere and a chance to get away from the hustle and bustle of city life. The town is also home to a variety of outdoor activities, including fishing, hunting, and camping. With its beautiful scenery and friendly people, Big Lake is a great place to call home.
Common Questions
What is the Total Population of Big Lake?
Total Population of Big Lake is 69.
What is the Total Male Population of Big Lake?
Total Male Population of Big Lake is 31.
What is the Total Female Population of Big Lake?
Total Female Population of Big Lake is 38.
What is the Ratio of Males per 100 Females in Big Lake?
There are 81.58 Males per 100 Females in Big Lake.
What is the Ratio of Females per 100 Males in Big Lake?
There are 122.58 Females per 100 Males in Big Lake.
What is the Median Population Age in Big Lake?
Median Population Age in Big Lake is 61.6 Years.
What is the Average Family Size in Big Lake
Average Family Size in Big Lake is 2.0 People.
What is the Average Household Size in Big Lake
Average Household Size in Big Lake is 1.6 People.
What is Per Capita Income in Big Lake?
Per Capita income in Big Lake is $60,293.
What is the Median Family Income in Big Lake?
Median Family Income in Big Lake is $85,833.
What is the Median Household income in Big Lake?
Median Household Income in Big Lake is $75,000.
What is Inequality or Gini Index in Big Lake?
Inequality or Gini Index in Big Lake is 0.48.
How Large is the Labor Force in Big Lake?
There are 23 People in the Labor Forcein in Big Lake.
What is the Percentage of People in the Labor Force in Big Lake?
35.4% of People are in the Labor Force in Big Lake.