Warsaw, MN
Warsaw Map
Warsaw Overview
774
TOTAL POPULATION
417
MALE POPULATION
357
FEMALE POPULATION
116.81
MALES / 100 FEMALES
85.61
FEMALES / 100 MALES
42.8
MEDIAN AGE
2.9
AVG FAMILY SIZE
2.7
AVG HOUSEHOLD SIZE
$47,082
PER CAPITA INCOME
$114,063
AVG FAMILY INCOME
$112,969
AVG HOUSEHOLD INCOME
30.2%
WAGE / INCOME GAP [ % ]
69.8¢/ $1
WAGE / INCOME GAP [ $ ]
0.33
INEQUALITY / GINI INDEX
463
LABOR FORCE [ PEOPLE ]
77.7%
PERCENT IN LABOR FORCE
4.5%
UNEMPLOYMENT RATE
Warsaw Zip Codes
Warsaw Area Codes
Race in Warsaw
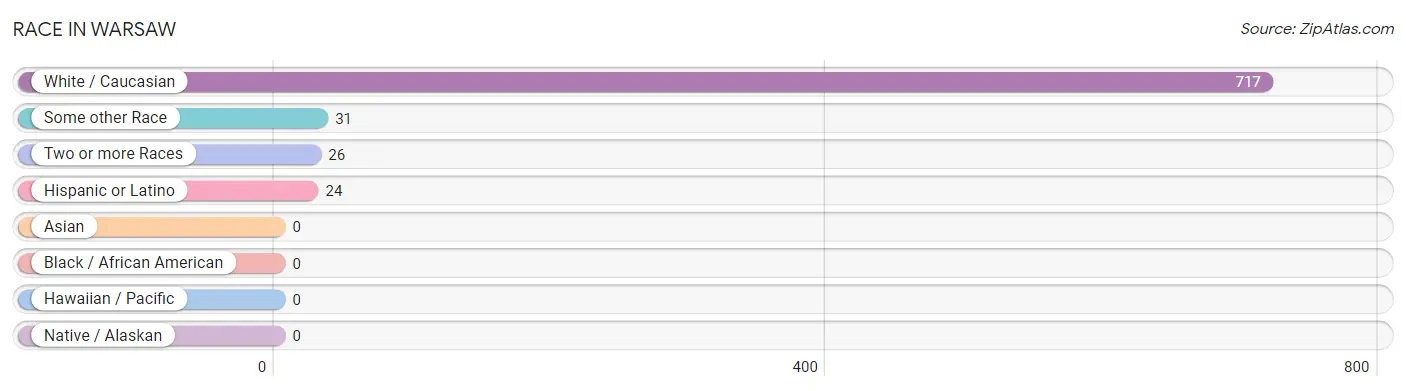
The most populous races in Warsaw are White / Caucasian (717 | 92.6%), Some other Race (31 | 4.0%), and Two or more Races (26 | 3.4%).
| Race | # Population | % Population |
| Asian | 0 | 0.0% |
| Black / African American | 0 | 0.0% |
| Hawaiian / Pacific | 0 | 0.0% |
| Hispanic or Latino | 24 | 3.1% |
| Native / Alaskan | 0 | 0.0% |
| White / Caucasian | 717 | 92.6% |
| Two or more Races | 26 | 3.4% |
| Some other Race | 31 | 4.0% |
| Total | 774 | 100.0% |
Ancestry in Warsaw
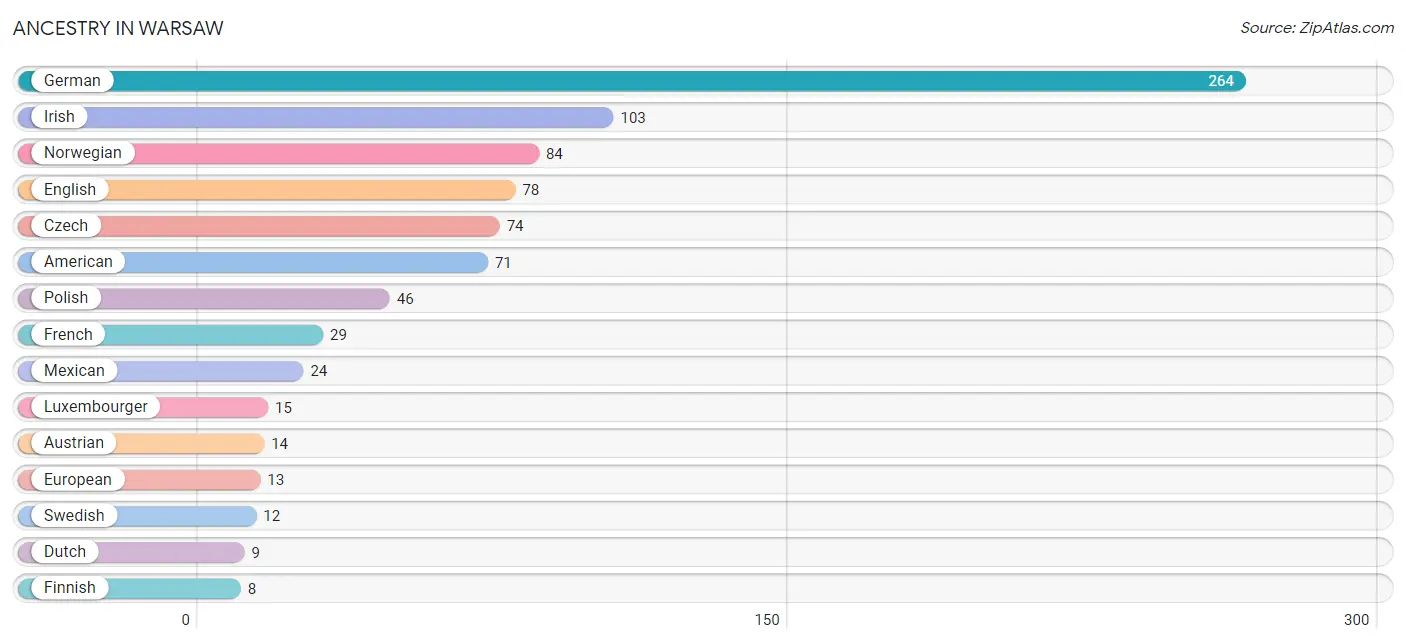
The most populous ancestries reported in Warsaw are German (264 | 34.1%), Irish (103 | 13.3%), Norwegian (84 | 10.8%), English (78 | 10.1%), and Czech (74 | 9.6%), together accounting for 77.9% of all Warsaw residents.
| Ancestry | # Population | % Population |
| American | 71 | 9.2% |
| Austrian | 14 | 1.8% |
| Belgian | 2 | 0.3% |
| British | 6 | 0.8% |
| Chippewa | 1 | 0.1% |
| Czech | 74 | 9.6% |
| Danish | 3 | 0.4% |
| Dutch | 9 | 1.2% |
| English | 78 | 10.1% |
| European | 13 | 1.7% |
| Finnish | 8 | 1.0% |
| French | 29 | 3.7% |
| French Canadian | 2 | 0.3% |
| German | 264 | 34.1% |
| Irish | 103 | 13.3% |
| Italian | 4 | 0.5% |
| Luxembourger | 15 | 1.9% |
| Mexican | 24 | 3.1% |
| Norwegian | 84 | 10.8% |
| Polish | 46 | 5.9% |
| Scottish | 6 | 0.8% |
| Sioux | 1 | 0.1% |
| Swedish | 12 | 1.5% |
| Swiss | 1 | 0.1% | View All 24 Rows |
Immigrants in Warsaw
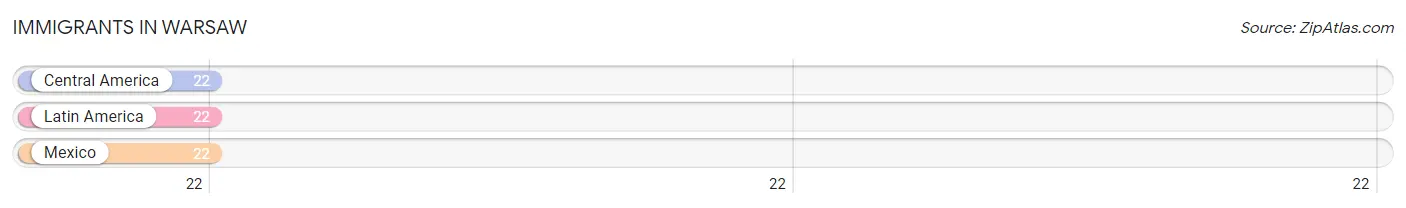
The most numerous immigrant groups reported in Warsaw came from Central America (22 | 2.8%), Latin America (22 | 2.8%), and Mexico (22 | 2.8%), together accounting for 8.5% of all Warsaw residents.
| Immigration Origin | # Population | % Population |
| Central America | 22 | 2.8% |
| Latin America | 22 | 2.8% |
| Mexico | 22 | 2.8% | View All 3 Rows |
Sex and Age in Warsaw
Sex and Age in Warsaw
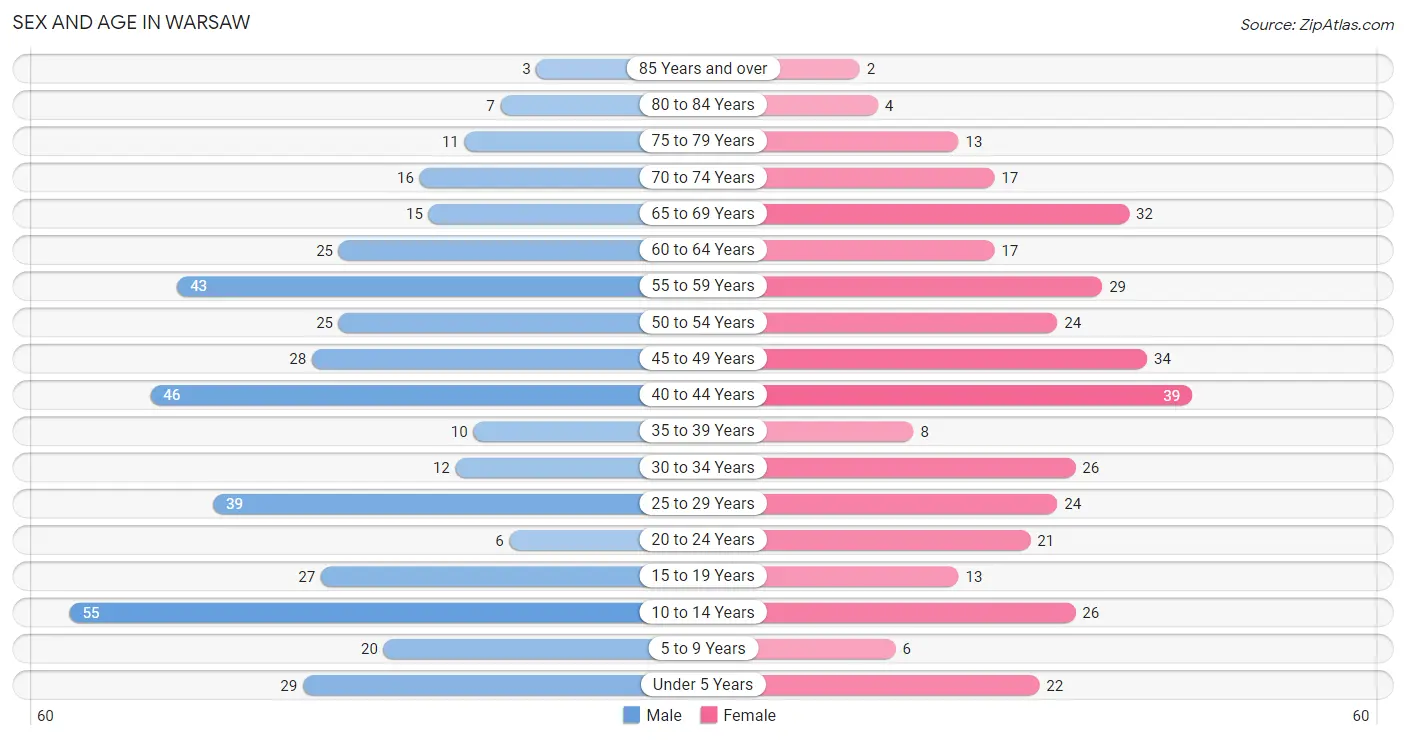
The most populous age groups in Warsaw are 10 to 14 Years (55 | 13.2%) for men and 40 to 44 Years (39 | 10.9%) for women.
| Age Bracket | Male | Female |
| Under 5 Years | 29 (7.0%) | 22 (6.2%) |
| 5 to 9 Years | 20 (4.8%) | 6 (1.7%) |
| 10 to 14 Years | 55 (13.2%) | 26 (7.3%) |
| 15 to 19 Years | 27 (6.5%) | 13 (3.6%) |
| 20 to 24 Years | 6 (1.4%) | 21 (5.9%) |
| 25 to 29 Years | 39 (9.3%) | 24 (6.7%) |
| 30 to 34 Years | 12 (2.9%) | 26 (7.3%) |
| 35 to 39 Years | 10 (2.4%) | 8 (2.2%) |
| 40 to 44 Years | 46 (11.0%) | 39 (10.9%) |
| 45 to 49 Years | 28 (6.7%) | 34 (9.5%) |
| 50 to 54 Years | 25 (6.0%) | 24 (6.7%) |
| 55 to 59 Years | 43 (10.3%) | 29 (8.1%) |
| 60 to 64 Years | 25 (6.0%) | 17 (4.8%) |
| 65 to 69 Years | 15 (3.6%) | 32 (9.0%) |
| 70 to 74 Years | 16 (3.8%) | 17 (4.8%) |
| 75 to 79 Years | 11 (2.6%) | 13 (3.6%) |
| 80 to 84 Years | 7 (1.7%) | 4 (1.1%) |
| 85 Years and over | 3 (0.7%) | 2 (0.6%) |
| Total | 417 (100.0%) | 357 (100.0%) |
Families and Households in Warsaw
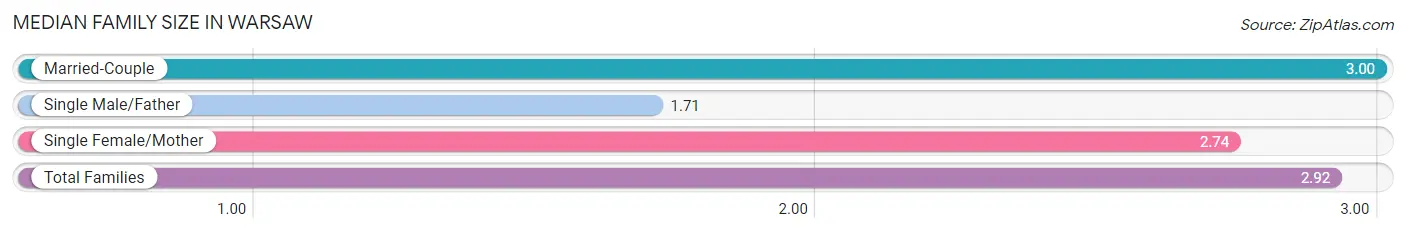
Median Family Size in Warsaw
The median family size in Warsaw is 2.92 persons per family, with married-couple families (188 | 83.2%) accounting for the largest median family size of 3 persons per family. On the other hand, single male/father families (7 | 3.1%) represent the smallest median family size with 1.71 persons per family.
| Family Type | # Families | Family Size |
| Married-Couple | 188 (83.2%) | 3.00 |
| Single Male/Father | 7 (3.1%) | 1.71 |
| Single Female/Mother | 31 (13.7%) | 2.74 |
| Total Families | 226 (100.0%) | 2.92 |
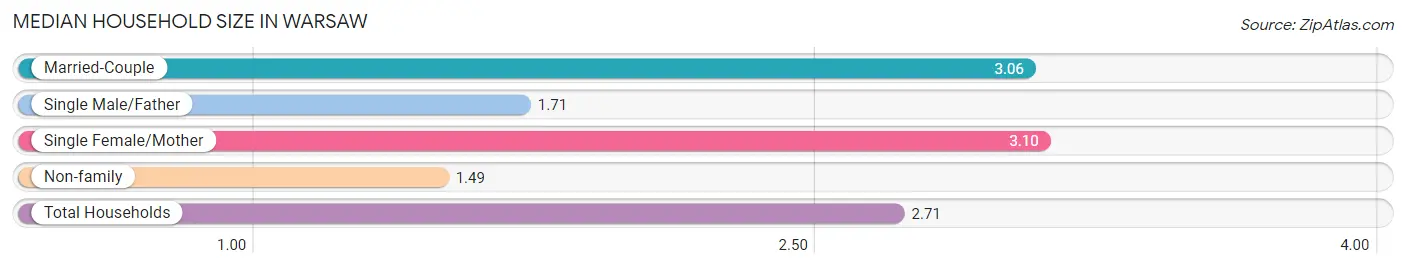
Median Household Size in Warsaw
The median household size in Warsaw is 2.71 persons per household, with single female/mother households (31 | 11.0%) accounting for the largest median household size of 3.1 persons per household. non-family households (57 | 20.1%) represent the smallest median household size with 1.49 persons per household.
| Household Type | # Households | Household Size |
| Married-Couple | 188 (66.4%) | 3.06 |
| Single Male/Father | 7 (2.5%) | 1.71 |
| Single Female/Mother | 31 (11.0%) | 3.10 |
| Non-family | 57 (20.1%) | 1.49 |
| Total Households | 283 (100.0%) | 2.71 |
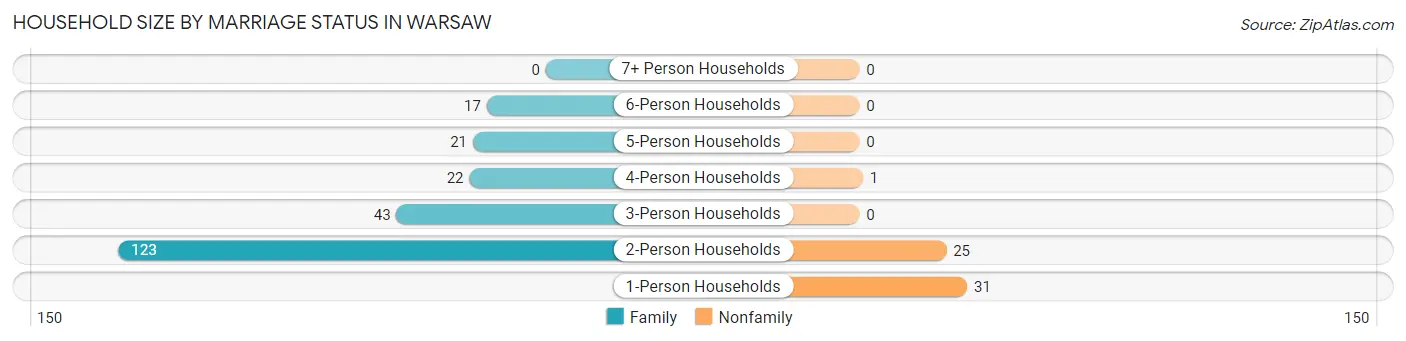
Household Size by Marriage Status in Warsaw
Out of a total of 283 households in Warsaw, 226 (79.9%) are family households, while 57 (20.1%) are nonfamily households. The most numerous type of family households are 2-person households, comprising 123, and the most common type of nonfamily households are 1-person households, comprising 31.
| Household Size | Family Households | Nonfamily Households |
| 1-Person Households | - | 31 (11.0%) |
| 2-Person Households | 123 (43.5%) | 25 (8.8%) |
| 3-Person Households | 43 (15.2%) | 0 (0.0%) |
| 4-Person Households | 22 (7.8%) | 1 (0.4%) |
| 5-Person Households | 21 (7.4%) | 0 (0.0%) |
| 6-Person Households | 17 (6.0%) | 0 (0.0%) |
| 7+ Person Households | 0 (0.0%) | 0 (0.0%) |
| Total | 226 (79.9%) | 57 (20.1%) |
Female Fertility in Warsaw
Fertility by Age in Warsaw
| Age Bracket | Women with Births | Births / 1,000 Women |
| 15 to 19 years | 0 (0.0%) | 0.0 |
| 20 to 34 years | 0 (0.0%) | 0.0 |
| 35 to 50 years | 0 (0.0%) | 0.0 |
| Total | 0 (0.0%) | 0.0 |
Fertility by Age by Marriage Status in Warsaw
| Age Bracket | Married | Unmarried |
| 15 to 19 years | 0 (0.0%) | 0 (0.0%) |
| 20 to 34 years | 0 (0.0%) | 0 (0.0%) |
| 35 to 50 years | 0 (0.0%) | 0 (0.0%) |
| Total | 0 (0.0%) | 0 (0.0%) |
Fertility by Education in Warsaw
| Educational Attainment | Women with Births | Births / 1,000 Women |
| Less than High School | 0 (0.0%) | 0.0 |
| High School Diploma | 0 (0.0%) | 0.0 |
| College or Associate's Degree | 0 (0.0%) | 0.0 |
| Bachelor's Degree | 0 (0.0%) | 0.0 |
| Graduate Degree | 0 (0.0%) | 0.0 |
| Total | 0 (0.0%) | 0.0 |
Fertility by Education by Marriage Status in Warsaw
| Educational Attainment | Married | Unmarried |
| Less than High School | 0 (0.0%) | 0 (0.0%) |
| High School Diploma | 0 (0.0%) | 0 (0.0%) |
| College or Associate's Degree | 0 (0.0%) | 0 (0.0%) |
| Bachelor's Degree | 0 (0.0%) | 0 (0.0%) |
| Graduate Degree | 0 (0.0%) | 0 (0.0%) |
| Total | 0 (0.0%) | 0 (0.0%) |
Income in Warsaw
Income Overview in Warsaw
Per Capita Income in Warsaw is $47,082, while median incomes of families and households are $114,063 and $112,969 respectively.
| Characteristic | Number | Measure |
| Per Capita Income | 774 | $47,082 |
| Median Family Income | 226 | $114,063 |
| Mean Family Income | 226 | $132,096 |
| Median Household Income | 283 | $112,969 |
| Mean Household Income | 283 | $127,622 |
| Income Deficit | 226 | $0 |
| Wage / Income Gap (%) | 774 | 30.23% |
| Wage / Income Gap ($) | 774 | 69.77¢ per $1 |
| Gini / Inequality Index | 774 | 0.33 |
Earnings by Sex in Warsaw
Average Earnings in Warsaw are $45,667, $56,563 for men and $39,464 for women, a difference of 30.2%.
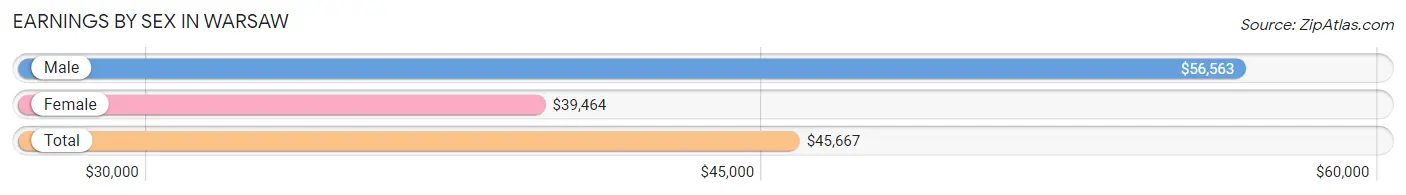
| Sex | Number | Average Earnings |
| Male | 251 (51.0%) | $56,563 |
| Female | 241 (49.0%) | $39,464 |
| Total | 492 (100.0%) | $45,667 |
Earnings by Sex by Income Bracket in Warsaw
The most common earnings brackets in Warsaw are $100,000+ for men (70 | 27.9%) and $40,000 to $44,999 for women (36 | 14.9%).
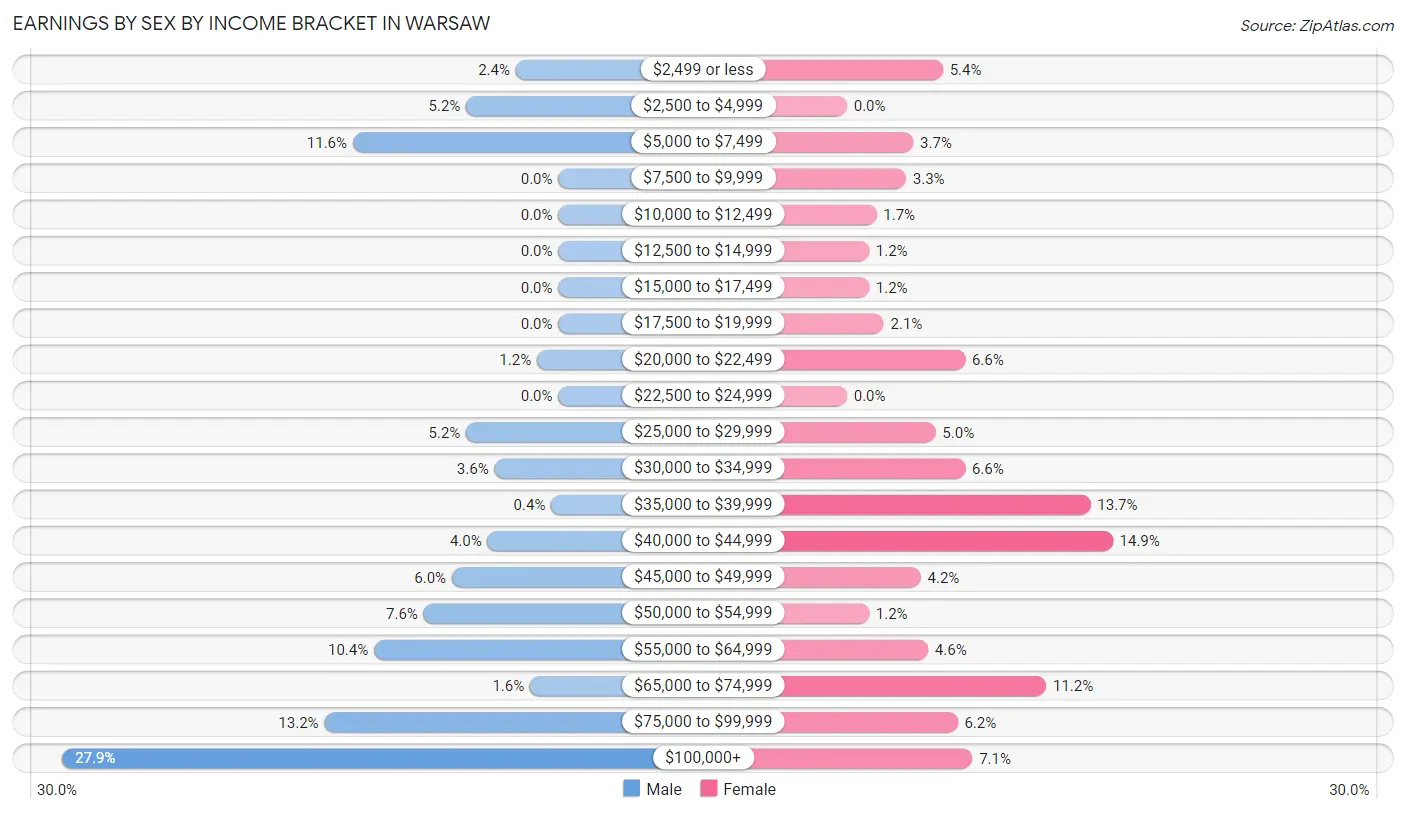
| Income | Male | Female |
| $2,499 or less | 6 (2.4%) | 13 (5.4%) |
| $2,500 to $4,999 | 13 (5.2%) | 0 (0.0%) |
| $5,000 to $7,499 | 29 (11.6%) | 9 (3.7%) |
| $7,500 to $9,999 | 0 (0.0%) | 8 (3.3%) |
| $10,000 to $12,499 | 0 (0.0%) | 4 (1.7%) |
| $12,500 to $14,999 | 0 (0.0%) | 3 (1.2%) |
| $15,000 to $17,499 | 0 (0.0%) | 3 (1.2%) |
| $17,500 to $19,999 | 0 (0.0%) | 5 (2.1%) |
| $20,000 to $22,499 | 3 (1.2%) | 16 (6.6%) |
| $22,500 to $24,999 | 0 (0.0%) | 0 (0.0%) |
| $25,000 to $29,999 | 13 (5.2%) | 12 (5.0%) |
| $30,000 to $34,999 | 9 (3.6%) | 16 (6.6%) |
| $35,000 to $39,999 | 1 (0.4%) | 33 (13.7%) |
| $40,000 to $44,999 | 10 (4.0%) | 36 (14.9%) |
| $45,000 to $49,999 | 15 (6.0%) | 10 (4.2%) |
| $50,000 to $54,999 | 19 (7.6%) | 3 (1.2%) |
| $55,000 to $64,999 | 26 (10.4%) | 11 (4.6%) |
| $65,000 to $74,999 | 4 (1.6%) | 27 (11.2%) |
| $75,000 to $99,999 | 33 (13.2%) | 15 (6.2%) |
| $100,000+ | 70 (27.9%) | 17 (7.0%) |
| Total | 251 (100.0%) | 241 (100.0%) |
Earnings by Sex by Educational Attainment in Warsaw
Average earnings in Warsaw are $60,750 for men and $40,208 for women, a difference of 33.8%. Men with an educational attainment of bachelor's degree enjoy the highest average annual earnings of $112,917, while those with high school diploma education earn the least with $54,375. Women with an educational attainment of graduate degree earn the most with the average annual earnings of $81,250, while those with high school diploma education have the smallest earnings of $30,313.
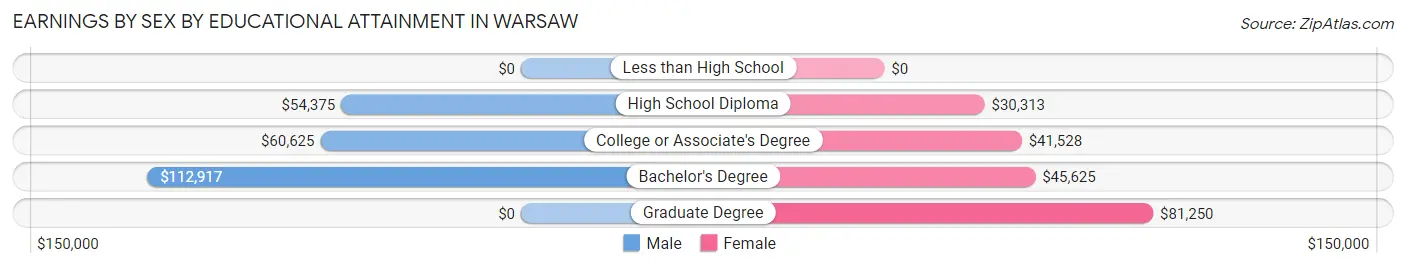
| Educational Attainment | Male Income | Female Income |
| Less than High School | - | - |
| High School Diploma | $54,375 | $30,313 |
| College or Associate's Degree | $60,625 | $41,528 |
| Bachelor's Degree | $112,917 | $45,625 |
| Graduate Degree | - | - |
| Total | $60,750 | $40,208 |
Family Income in Warsaw
Family Income Brackets in Warsaw
According to the Warsaw family income data, there are 57 families falling into the $100,000 to $149,999 income range, which is the most common income bracket and makes up 25.2% of all families.
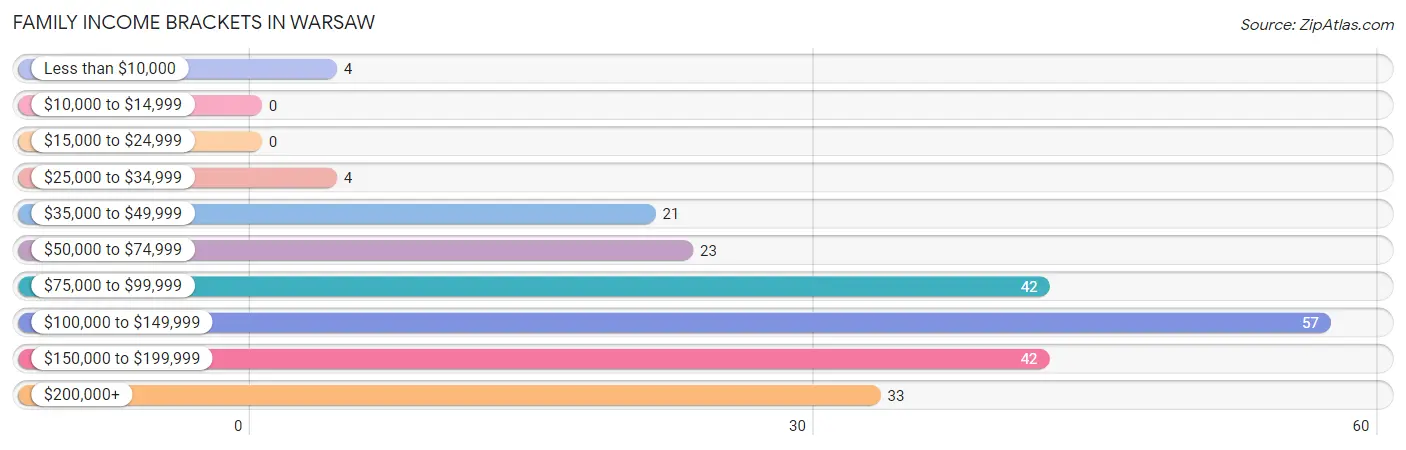
| Income Bracket | # Families | % Families |
| Less than $10,000 | 4 | 1.8% |
| $10,000 to $14,999 | 0 | 0.0% |
| $15,000 to $24,999 | 0 | 0.0% |
| $25,000 to $34,999 | 4 | 1.8% |
| $35,000 to $49,999 | 21 | 9.3% |
| $50,000 to $74,999 | 23 | 10.2% |
| $75,000 to $99,999 | 42 | 18.6% |
| $100,000 to $149,999 | 57 | 25.2% |
| $150,000 to $199,999 | 42 | 18.6% |
| $200,000+ | 33 | 14.6% |
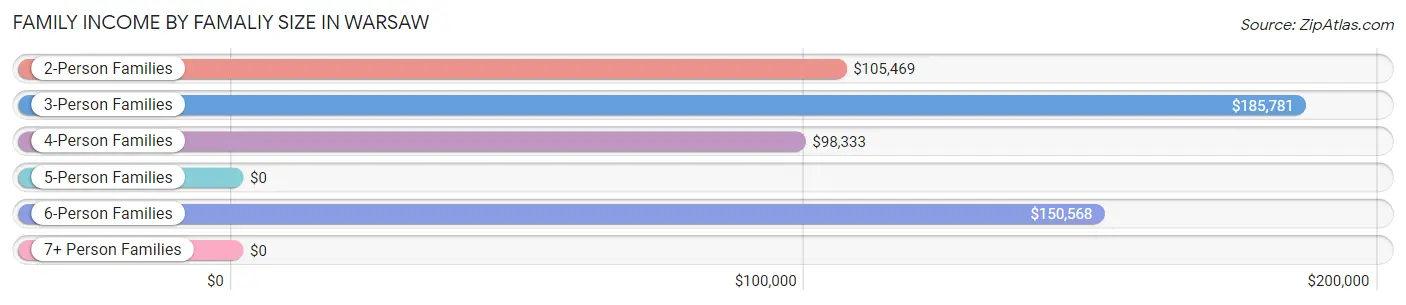
Family Income by Famaliy Size in Warsaw
3-person families (47 | 20.8%) account for the highest median family income in Warsaw with $185,781 per family, while 3-person families (47 | 20.8%) have the highest median income of $61,927 per family member.
| Income Bracket | # Families | Median Income |
| 2-Person Families | 123 (54.4%) | $105,469 |
| 3-Person Families | 47 (20.8%) | $185,781 |
| 4-Person Families | 36 (15.9%) | $98,333 |
| 5-Person Families | 3 (1.3%) | $0 |
| 6-Person Families | 17 (7.5%) | $150,568 |
| 7+ Person Families | 0 (0.0%) | $0 |
| Total | 226 (100.0%) | $114,063 |
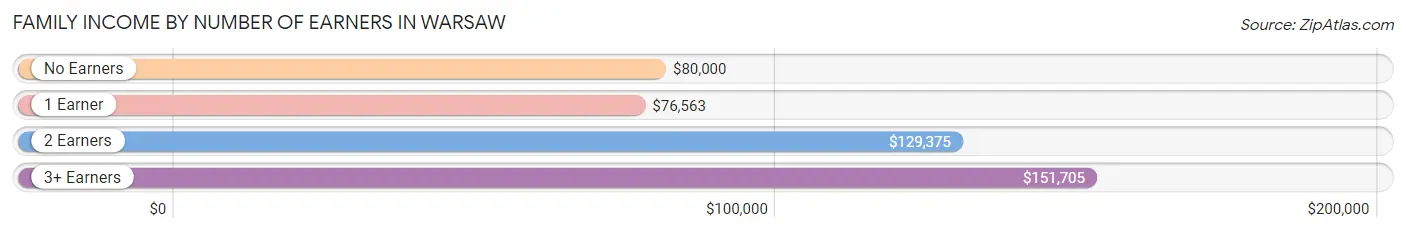
Family Income by Number of Earners in Warsaw
The median family income in Warsaw is $114,063, with families comprising 3+ earners (39) having the highest median family income of $151,705, while families with 1 earner (65) have the lowest median family income of $76,563, accounting for 17.3% and 28.8% of families, respectively.
| Number of Earners | # Families | Median Income |
| No Earners | 22 (9.7%) | $80,000 |
| 1 Earner | 65 (28.8%) | $76,563 |
| 2 Earners | 100 (44.3%) | $129,375 |
| 3+ Earners | 39 (17.3%) | $151,705 |
| Total | 226 (100.0%) | $114,063 |
Household Income in Warsaw
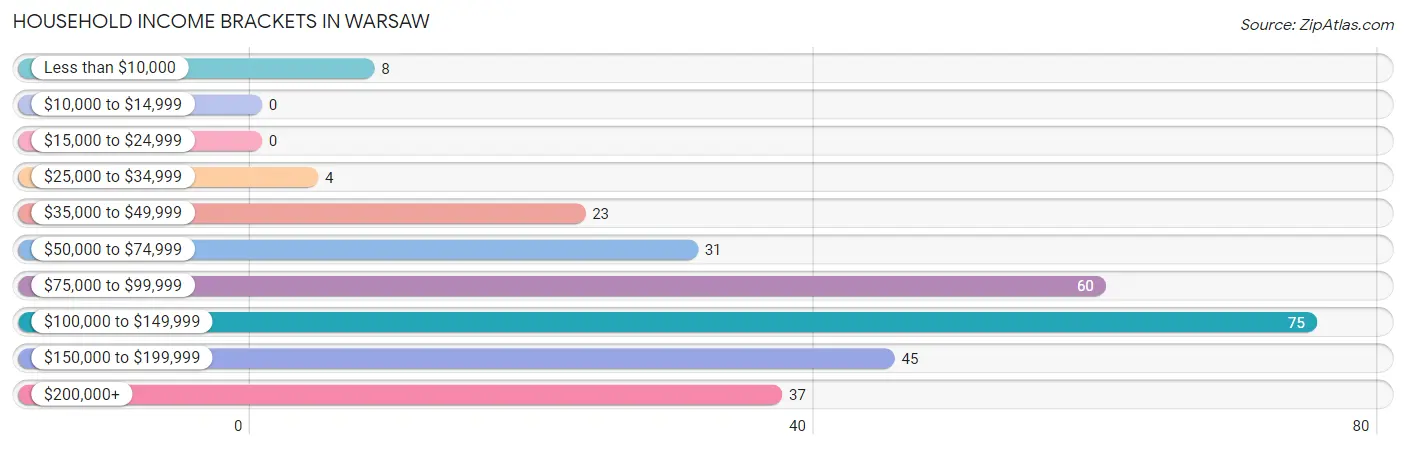
Household Income Brackets in Warsaw
With 75 households falling in the category, the $100,000 to $149,999 income range is the most frequent in Warsaw, accounting for 26.5% of all households.
| Income Bracket | # Households | % Households |
| Less than $10,000 | 8 | 2.8% |
| $10,000 to $14,999 | 0 | 0.0% |
| $15,000 to $24,999 | 0 | 0.0% |
| $25,000 to $34,999 | 4 | 1.4% |
| $35,000 to $49,999 | 23 | 8.1% |
| $50,000 to $74,999 | 31 | 11.0% |
| $75,000 to $99,999 | 60 | 21.2% |
| $100,000 to $149,999 | 75 | 26.5% |
| $150,000 to $199,999 | 45 | 15.9% |
| $200,000+ | 37 | 13.1% |
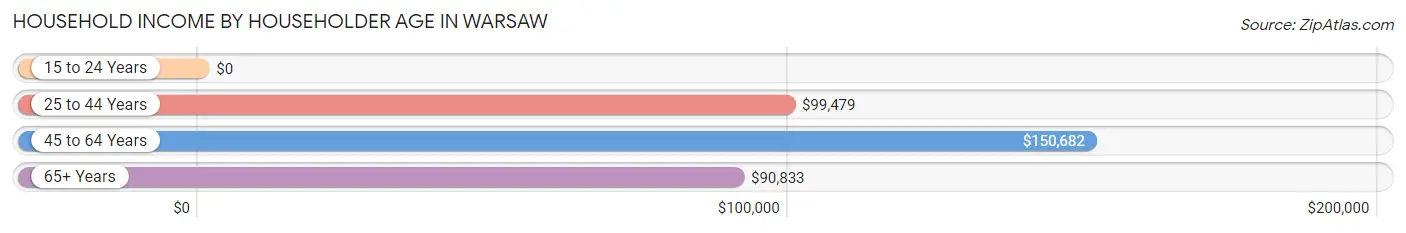
Household Income by Householder Age in Warsaw
The median household income in Warsaw is $112,969, with the highest median household income of $150,682 found in the 45 to 64 years age bracket for the primary householder. A total of 124 households (43.8%) fall into this category.
| Income Bracket | # Households | Median Income |
| 15 to 24 Years | 0 (0.0%) | $0 |
| 25 to 44 Years | 87 (30.7%) | $99,479 |
| 45 to 64 Years | 124 (43.8%) | $150,682 |
| 65+ Years | 72 (25.4%) | $90,833 |
| Total | 283 (100.0%) | $112,969 |
Poverty in Warsaw
Income Below Poverty by Sex and Age in Warsaw
With 5.3% poverty level for males and 2.5% for females among the residents of Warsaw, 18 to 24 year old males and 65 to 74 year old females are the most vulnerable to poverty, with 3 males (42.9%) and 9 females (18.4%) in their respective age groups living below the poverty level.
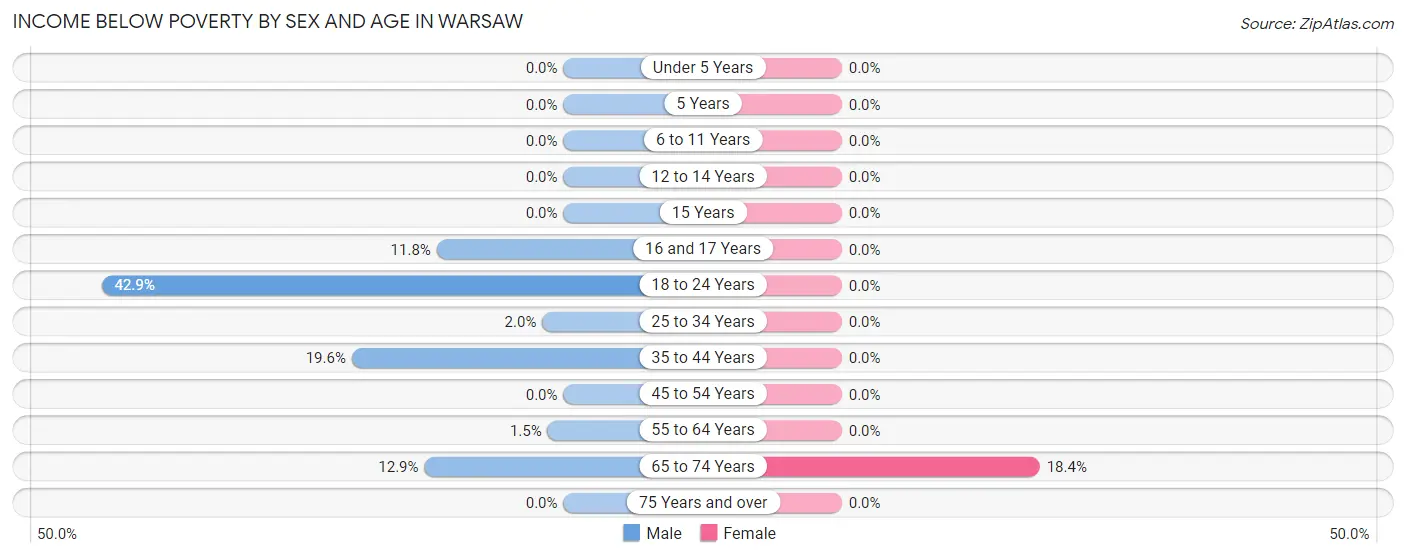
| Age Bracket | Male | Female |
| Under 5 Years | 0 (0.0%) | 0 (0.0%) |
| 5 Years | 0 (0.0%) | 0 (0.0%) |
| 6 to 11 Years | 0 (0.0%) | 0 (0.0%) |
| 12 to 14 Years | 0 (0.0%) | 0 (0.0%) |
| 15 Years | 0 (0.0%) | 0 (0.0%) |
| 16 and 17 Years | 2 (11.8%) | 0 (0.0%) |
| 18 to 24 Years | 3 (42.9%) | 0 (0.0%) |
| 25 to 34 Years | 1 (2.0%) | 0 (0.0%) |
| 35 to 44 Years | 11 (19.6%) | 0 (0.0%) |
| 45 to 54 Years | 0 (0.0%) | 0 (0.0%) |
| 55 to 64 Years | 1 (1.5%) | 0 (0.0%) |
| 65 to 74 Years | 4 (12.9%) | 9 (18.4%) |
| 75 Years and over | 0 (0.0%) | 0 (0.0%) |
| Total | 22 (5.3%) | 9 (2.5%) |
Income Above Poverty by Sex and Age in Warsaw
According to the poverty statistics in Warsaw, males aged under 5 years and females aged under 5 years are the age groups that are most secure financially, with 100.0% of males and 100.0% of females in these age groups living above the poverty line.
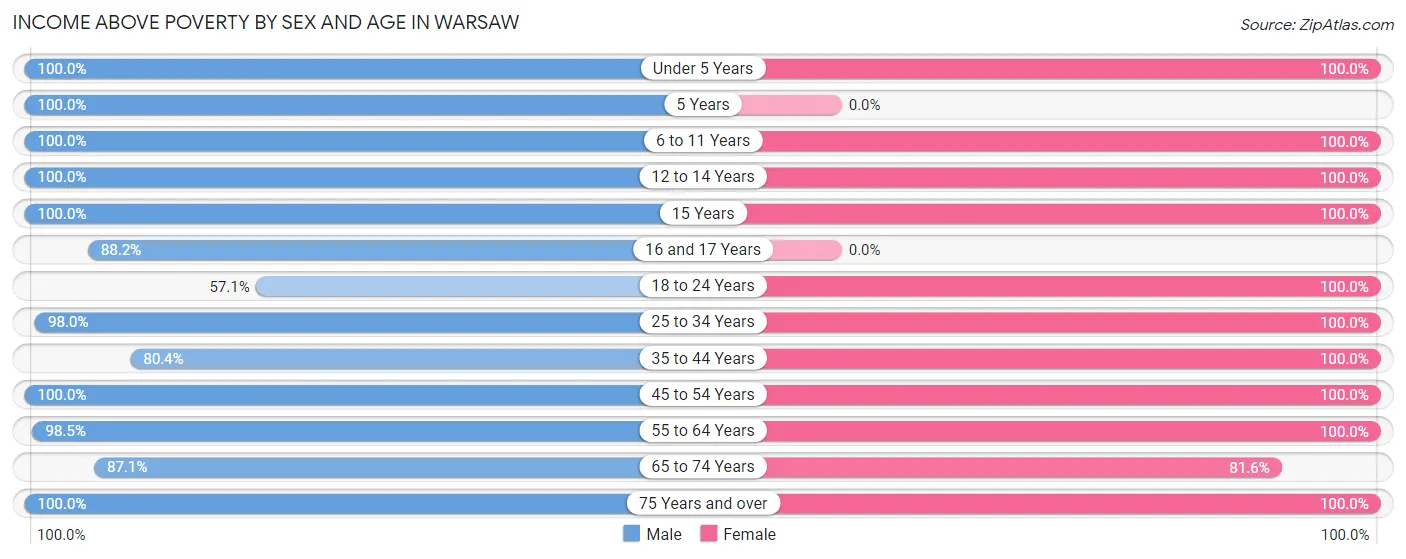
| Age Bracket | Male | Female |
| Under 5 Years | 25 (100.0%) | 19 (100.0%) |
| 5 Years | 3 (100.0%) | 0 (0.0%) |
| 6 to 11 Years | 35 (100.0%) | 6 (100.0%) |
| 12 to 14 Years | 37 (100.0%) | 26 (100.0%) |
| 15 Years | 9 (100.0%) | 11 (100.0%) |
| 16 and 17 Years | 15 (88.2%) | 0 (0.0%) |
| 18 to 24 Years | 4 (57.1%) | 23 (100.0%) |
| 25 to 34 Years | 50 (98.0%) | 50 (100.0%) |
| 35 to 44 Years | 45 (80.4%) | 47 (100.0%) |
| 45 to 54 Years | 53 (100.0%) | 58 (100.0%) |
| 55 to 64 Years | 67 (98.5%) | 46 (100.0%) |
| 65 to 74 Years | 27 (87.1%) | 40 (81.6%) |
| 75 Years and over | 21 (100.0%) | 19 (100.0%) |
| Total | 391 (94.7%) | 345 (97.5%) |
Income Below Poverty Among Married-Couple Families in Warsaw
The poverty statistics for married-couple families in Warsaw show that 2.1% or 4 of the total 188 families live below the poverty line. Families with no children have the highest poverty rate of 3.5%, comprising of 4 families. On the other hand, families with 1 or 2 children have the lowest poverty rate of 0.0%, which includes 0 families.
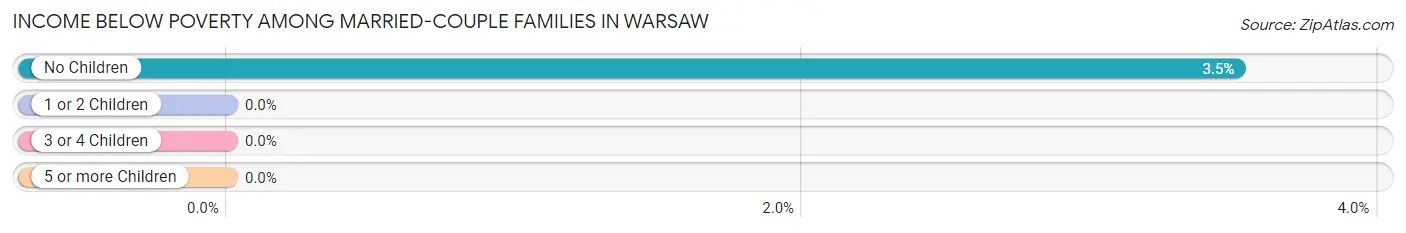
| Children | Above Poverty | Below Poverty |
| No Children | 110 (96.5%) | 4 (3.5%) |
| 1 or 2 Children | 57 (100.0%) | 0 (0.0%) |
| 3 or 4 Children | 17 (100.0%) | 0 (0.0%) |
| 5 or more Children | 0 (0.0%) | 0 (0.0%) |
| Total | 184 (97.9%) | 4 (2.1%) |
Income Below Poverty Among Single-Parent Households in Warsaw
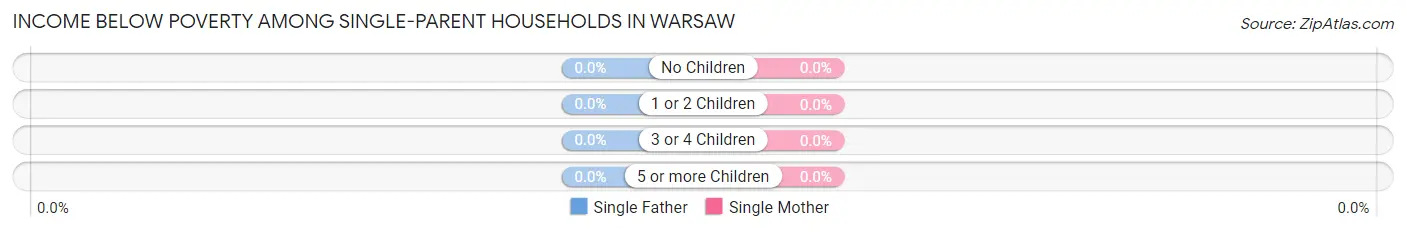
| Children | Single Father | Single Mother |
| No Children | 0 (0.0%) | 0 (0.0%) |
| 1 or 2 Children | 0 (0.0%) | 0 (0.0%) |
| 3 or 4 Children | 0 (0.0%) | 0 (0.0%) |
| 5 or more Children | 0 (0.0%) | 0 (0.0%) |
| Total | 0 (0.0%) | 0 (0.0%) |
Income Below Poverty Among Married-Couple vs Single-Parent Households in Warsaw
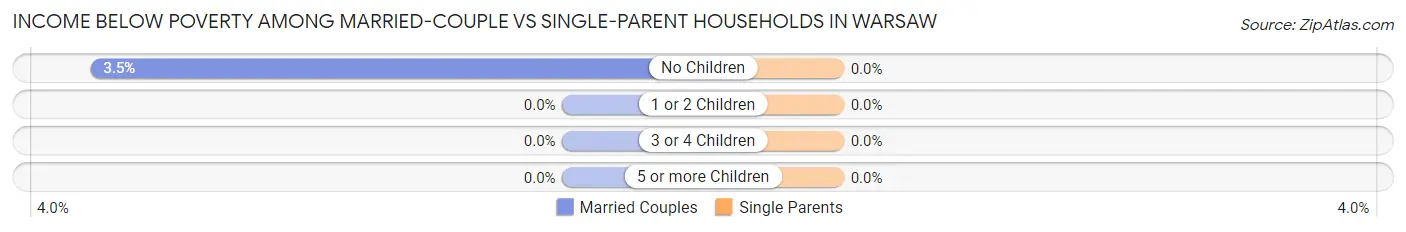
| Children | Married-Couple Families | Single-Parent Households |
| No Children | 4 (3.5%) | 0 (0.0%) |
| 1 or 2 Children | 0 (0.0%) | 0 (0.0%) |
| 3 or 4 Children | 0 (0.0%) | 0 (0.0%) |
| 5 or more Children | 0 (0.0%) | 0 (0.0%) |
| Total | 4 (2.1%) | 0 (0.0%) |
Employment Characteristics in Warsaw
Employment by Class of Employer in Warsaw
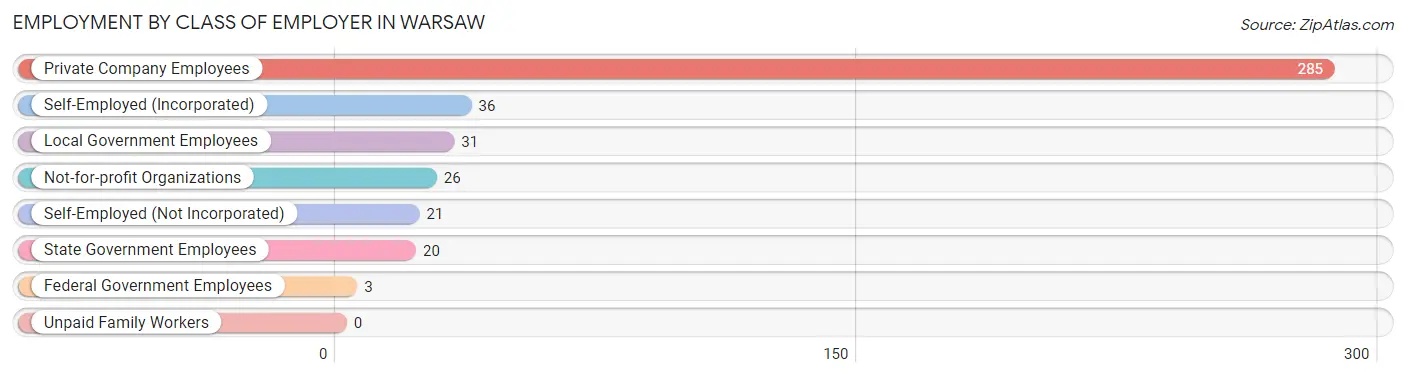
Among the 422 employed individuals in Warsaw, private company employees (285 | 67.5%), self-employed (incorporated) (36 | 8.5%), and local government employees (31 | 7.3%) make up the most common classes of employment.
| Employer Class | # Employees | % Employees |
| Private Company Employees | 285 | 67.5% |
| Self-Employed (Incorporated) | 36 | 8.5% |
| Self-Employed (Not Incorporated) | 21 | 5.0% |
| Not-for-profit Organizations | 26 | 6.2% |
| Local Government Employees | 31 | 7.3% |
| State Government Employees | 20 | 4.7% |
| Federal Government Employees | 3 | 0.7% |
| Unpaid Family Workers | 0 | 0.0% |
| Total | 422 | 100.0% |
Employment Status by Age in Warsaw
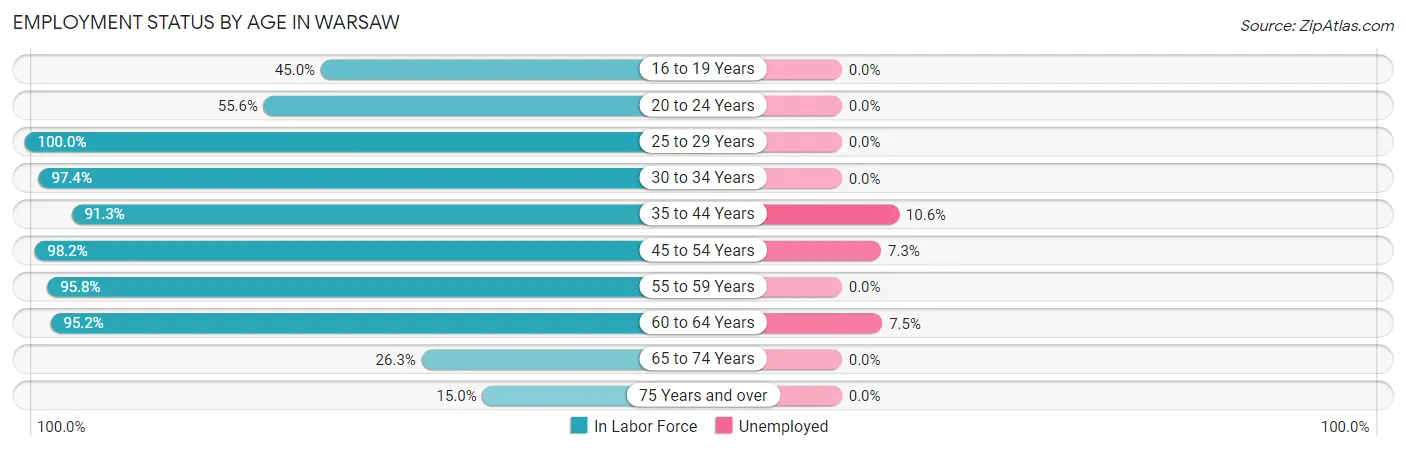
According to the labor force statistics for Warsaw, out of the total population over 16 years of age (596), 77.7% or 463 individuals are in the labor force, with 4.5% or 21 of them unemployed. The age group with the highest labor force participation rate is 25 to 29 years, with 100.0% or 63 individuals in the labor force. Within the labor force, the 35 to 44 years age range has the highest percentage of unemployed individuals, with 10.6% or 10 of them being unemployed.
| Age Bracket | In Labor Force | Unemployed |
| 16 to 19 Years | 9 (45.0%) | 0 (0.0%) |
| 20 to 24 Years | 15 (55.6%) | 0 (0.0%) |
| 25 to 29 Years | 63 (100.0%) | 0 (0.0%) |
| 30 to 34 Years | 37 (97.4%) | 0 (0.0%) |
| 35 to 44 Years | 94 (91.3%) | 10 (10.6%) |
| 45 to 54 Years | 109 (98.2%) | 8 (7.3%) |
| 55 to 59 Years | 69 (95.8%) | 0 (0.0%) |
| 60 to 64 Years | 40 (95.2%) | 3 (7.5%) |
| 65 to 74 Years | 21 (26.3%) | 0 (0.0%) |
| 75 Years and over | 6 (15.0%) | 0 (0.0%) |
| Total | 463 (77.7%) | 21 (4.5%) |
Employment Status by Educational Attainment in Warsaw
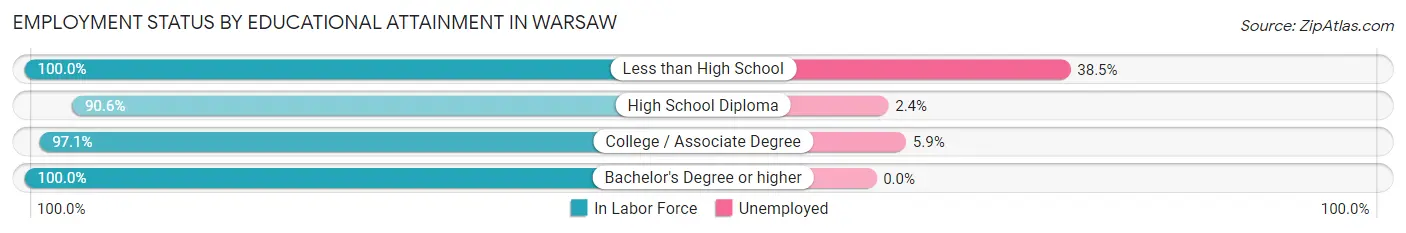
According to labor force statistics for Warsaw, 96.0% of individuals (412) out of the total population between 25 and 64 years of age (429) are in the labor force, with 5.1% or 21 of them being unemployed. The group with the highest labor force participation rate are those with the educational attainment of less than high school, with 100.0% or 26 individuals in the labor force. Within the labor force, individuals with less than high school education have the highest percentage of unemployment, with 38.5% or 10 of them being unemployed.
| Educational Attainment | In Labor Force | Unemployed |
| Less than High School | 26 (100.0%) | 10 (38.5%) |
| High School Diploma | 125 (90.6%) | 3 (2.4%) |
| College / Associate Degree | 135 (97.1%) | 8 (5.9%) |
| Bachelor's Degree or higher | 126 (100.0%) | 0 (0.0%) |
| Total | 412 (96.0%) | 22 (5.1%) |
Employment Occupations by Sex in Warsaw
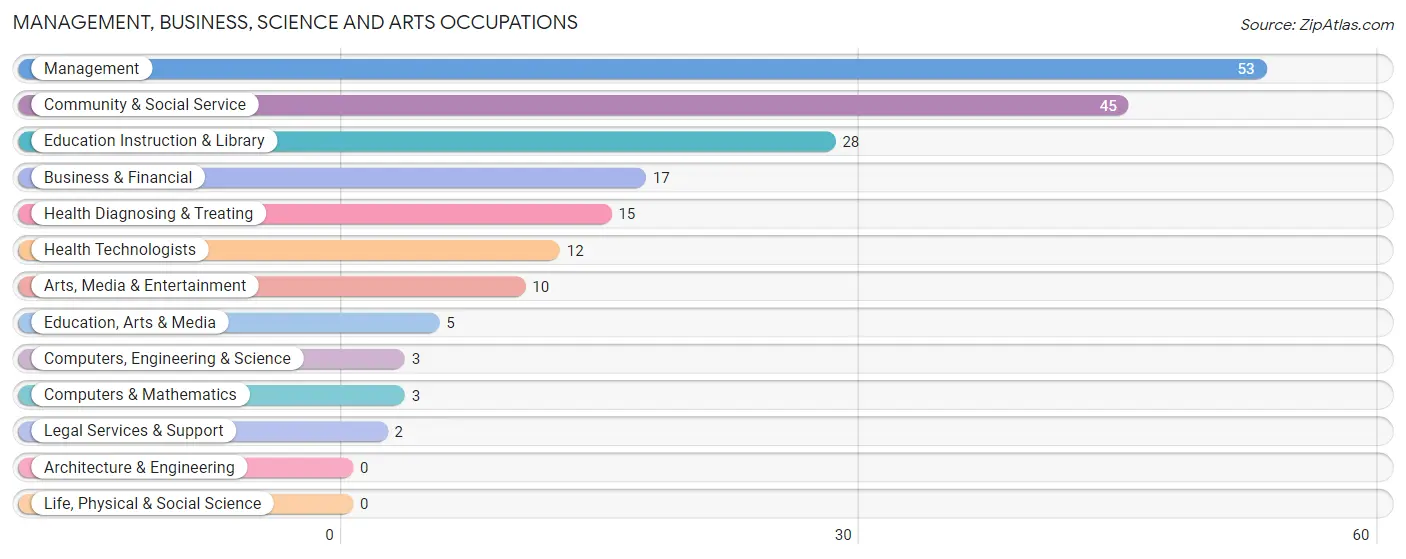
Management, Business, Science and Arts Occupations
The most common Management, Business, Science and Arts occupations in Warsaw are Management (53 | 12.0%), Community & Social Service (45 | 10.2%), Education Instruction & Library (28 | 6.3%), Business & Financial (17 | 3.8%), and Health Diagnosing & Treating (15 | 3.4%).
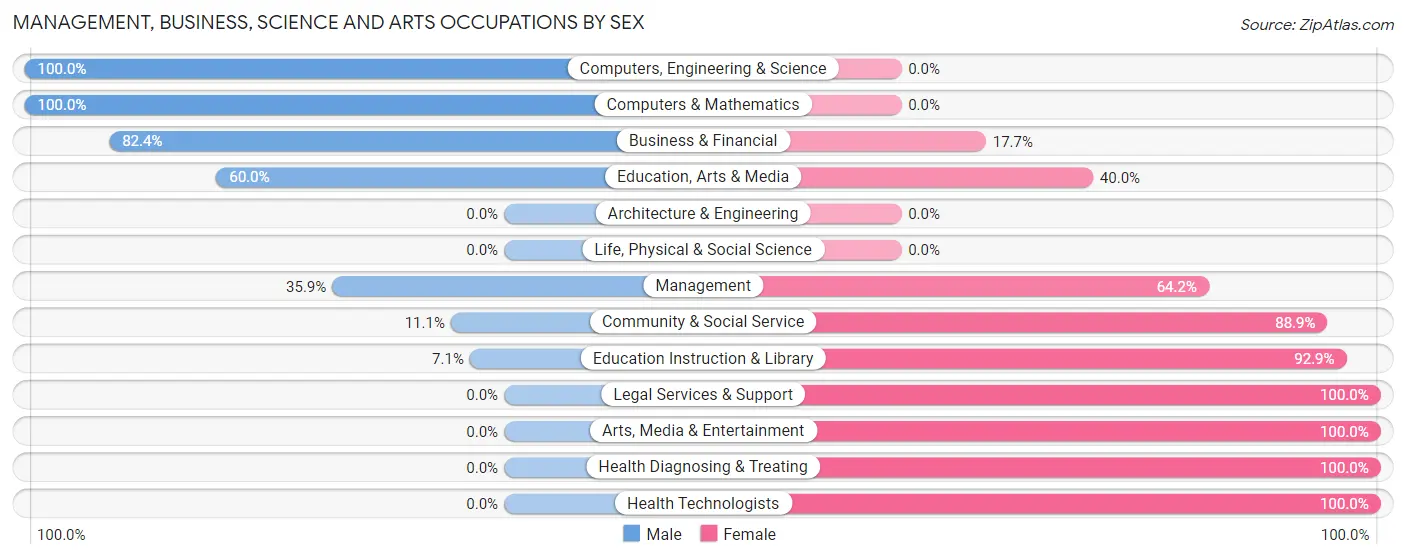
Management, Business, Science and Arts Occupations by Sex
Within the Management, Business, Science and Arts occupations in Warsaw, the most male-oriented occupations are Computers, Engineering & Science (100.0%), Computers & Mathematics (100.0%), and Business & Financial (82.4%), while the most female-oriented occupations are Legal Services & Support (100.0%), Arts, Media & Entertainment (100.0%), and Health Diagnosing & Treating (100.0%).
| Occupation | Male | Female |
| Management | 19 (35.8%) | 34 (64.1%) |
| Business & Financial | 14 (82.4%) | 3 (17.6%) |
| Computers, Engineering & Science | 3 (100.0%) | 0 (0.0%) |
| Computers & Mathematics | 3 (100.0%) | 0 (0.0%) |
| Architecture & Engineering | 0 (0.0%) | 0 (0.0%) |
| Life, Physical & Social Science | 0 (0.0%) | 0 (0.0%) |
| Community & Social Service | 5 (11.1%) | 40 (88.9%) |
| Education, Arts & Media | 3 (60.0%) | 2 (40.0%) |
| Legal Services & Support | 0 (0.0%) | 2 (100.0%) |
| Education Instruction & Library | 2 (7.1%) | 26 (92.9%) |
| Arts, Media & Entertainment | 0 (0.0%) | 10 (100.0%) |
| Health Diagnosing & Treating | 0 (0.0%) | 15 (100.0%) |
| Health Technologists | 0 (0.0%) | 12 (100.0%) |
| Total (Category) | 41 (30.8%) | 92 (69.2%) |
| Total (Overall) | 216 (48.9%) | 226 (51.1%) |
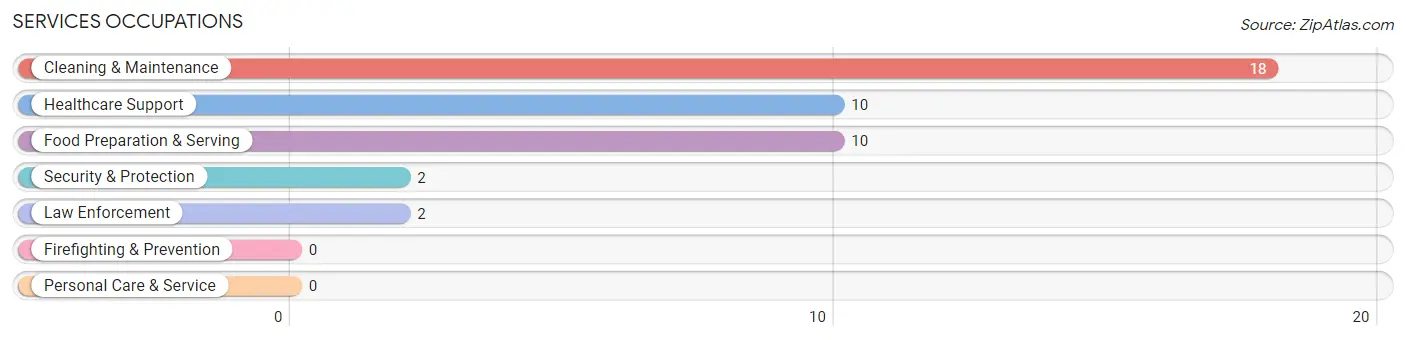
Services Occupations
The most common Services occupations in Warsaw are Cleaning & Maintenance (18 | 4.1%), Healthcare Support (10 | 2.3%), Food Preparation & Serving (10 | 2.3%), Security & Protection (2 | 0.4%), and Law Enforcement (2 | 0.4%).
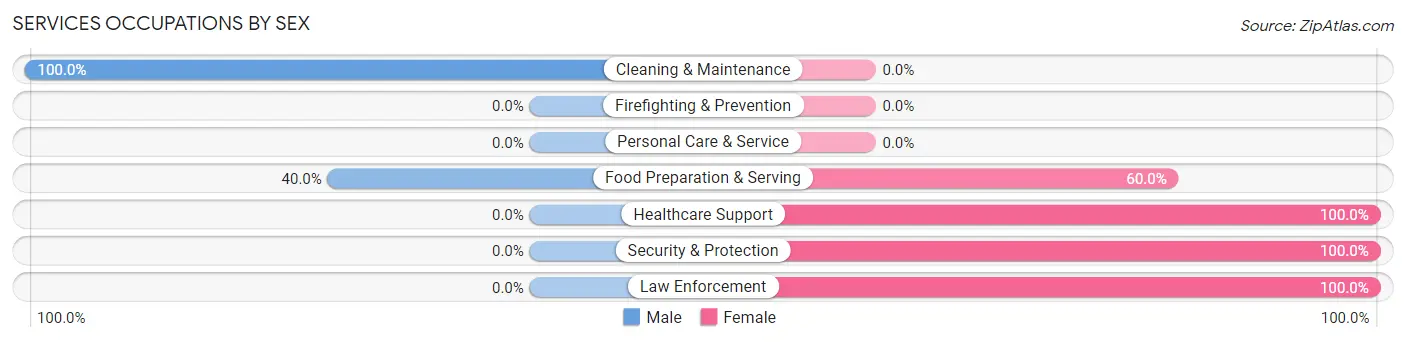
Services Occupations by Sex
Within the Services occupations in Warsaw, the most male-oriented occupations are Cleaning & Maintenance (100.0%), and Food Preparation & Serving (40.0%), while the most female-oriented occupations are Healthcare Support (100.0%), Security & Protection (100.0%), and Law Enforcement (100.0%).
| Occupation | Male | Female |
| Healthcare Support | 0 (0.0%) | 10 (100.0%) |
| Security & Protection | 0 (0.0%) | 2 (100.0%) |
| Firefighting & Prevention | 0 (0.0%) | 0 (0.0%) |
| Law Enforcement | 0 (0.0%) | 2 (100.0%) |
| Food Preparation & Serving | 4 (40.0%) | 6 (60.0%) |
| Cleaning & Maintenance | 18 (100.0%) | 0 (0.0%) |
| Personal Care & Service | 0 (0.0%) | 0 (0.0%) |
| Total (Category) | 22 (55.0%) | 18 (45.0%) |
| Total (Overall) | 216 (48.9%) | 226 (51.1%) |
Sales and Office Occupations
The most common Sales and Office occupations in Warsaw are Sales & Related (77 | 17.4%), and Office & Administration (24 | 5.4%).
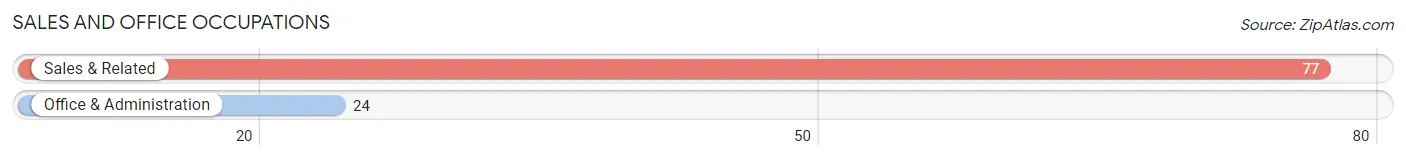
Sales and Office Occupations by Sex

| Occupation | Male | Female |
| Sales & Related | 36 (46.8%) | 41 (53.2%) |
| Office & Administration | 3 (12.5%) | 21 (87.5%) |
| Total (Category) | 39 (38.6%) | 62 (61.4%) |
| Total (Overall) | 216 (48.9%) | 226 (51.1%) |
Natural Resources, Construction and Maintenance Occupations
The most common Natural Resources, Construction and Maintenance occupations in Warsaw are Installation, Maintenance & Repair (34 | 7.7%), and Construction & Extraction (31 | 7.0%).
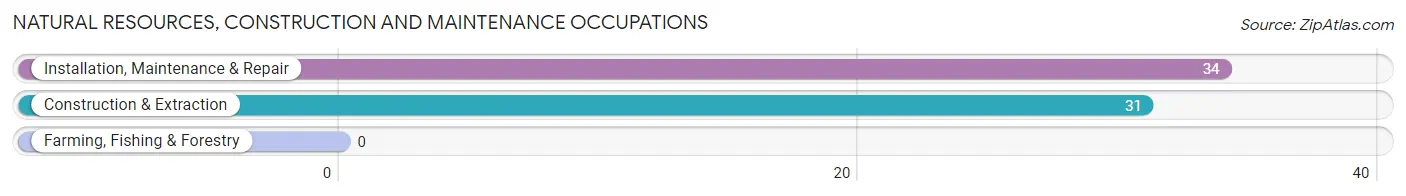
Natural Resources, Construction and Maintenance Occupations by Sex
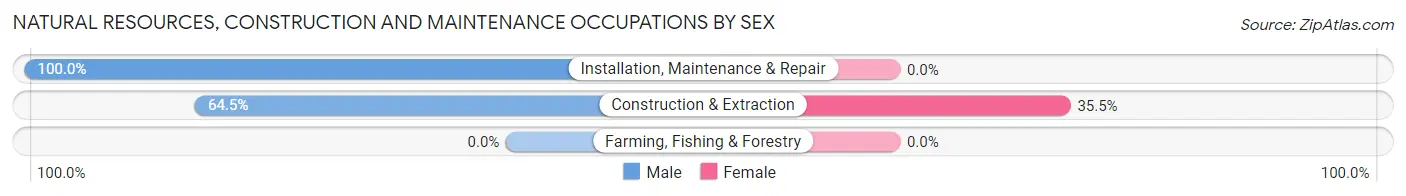
| Occupation | Male | Female |
| Farming, Fishing & Forestry | 0 (0.0%) | 0 (0.0%) |
| Construction & Extraction | 20 (64.5%) | 11 (35.5%) |
| Installation, Maintenance & Repair | 34 (100.0%) | 0 (0.0%) |
| Total (Category) | 54 (83.1%) | 11 (16.9%) |
| Total (Overall) | 216 (48.9%) | 226 (51.1%) |
Production, Transportation and Moving Occupations
The most common Production, Transportation and Moving occupations in Warsaw are Production (60 | 13.6%), Material Moving (26 | 5.9%), and Transportation (17 | 3.8%).
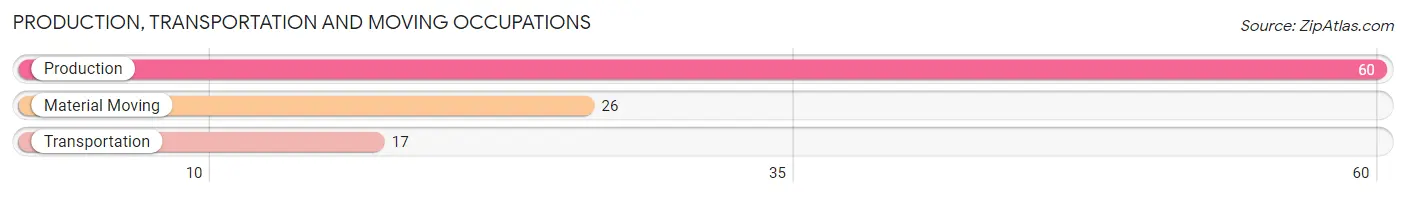
Production, Transportation and Moving Occupations by Sex
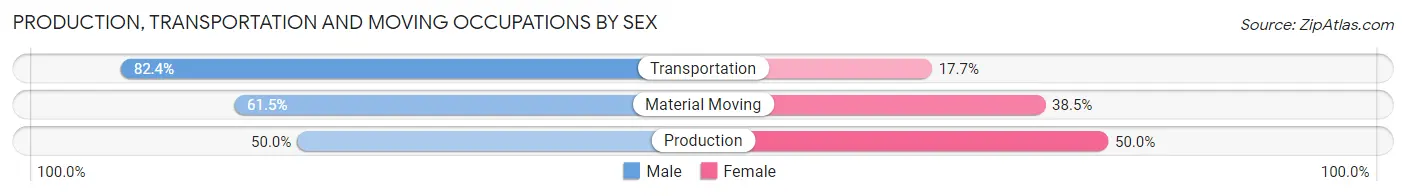
| Occupation | Male | Female |
| Production | 30 (50.0%) | 30 (50.0%) |
| Transportation | 14 (82.4%) | 3 (17.6%) |
| Material Moving | 16 (61.5%) | 10 (38.5%) |
| Total (Category) | 60 (58.3%) | 43 (41.7%) |
| Total (Overall) | 216 (48.9%) | 226 (51.1%) |
Employment Industries by Sex in Warsaw
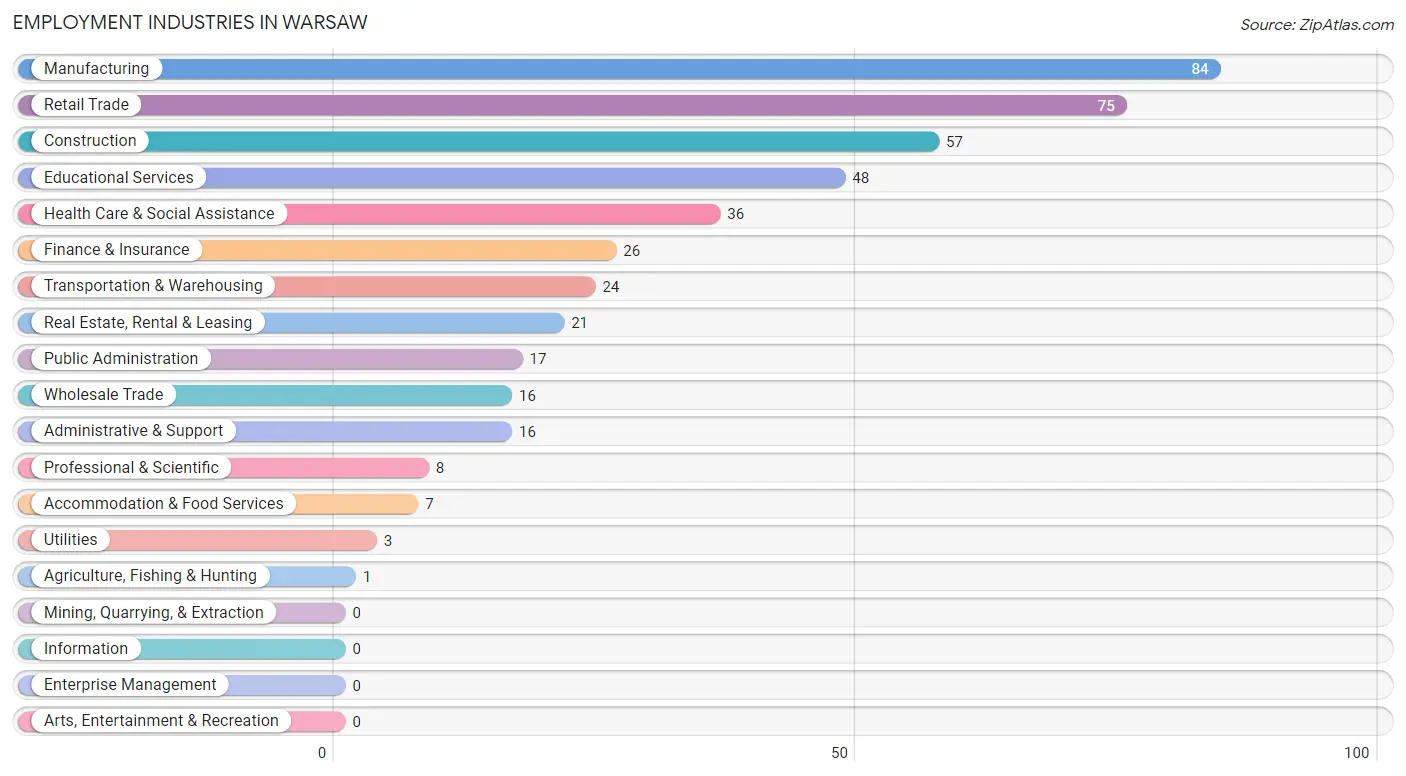
Employment Industries in Warsaw
The major employment industries in Warsaw include Manufacturing (84 | 19.0%), Retail Trade (75 | 17.0%), Construction (57 | 12.9%), Educational Services (48 | 10.9%), and Health Care & Social Assistance (36 | 8.1%).
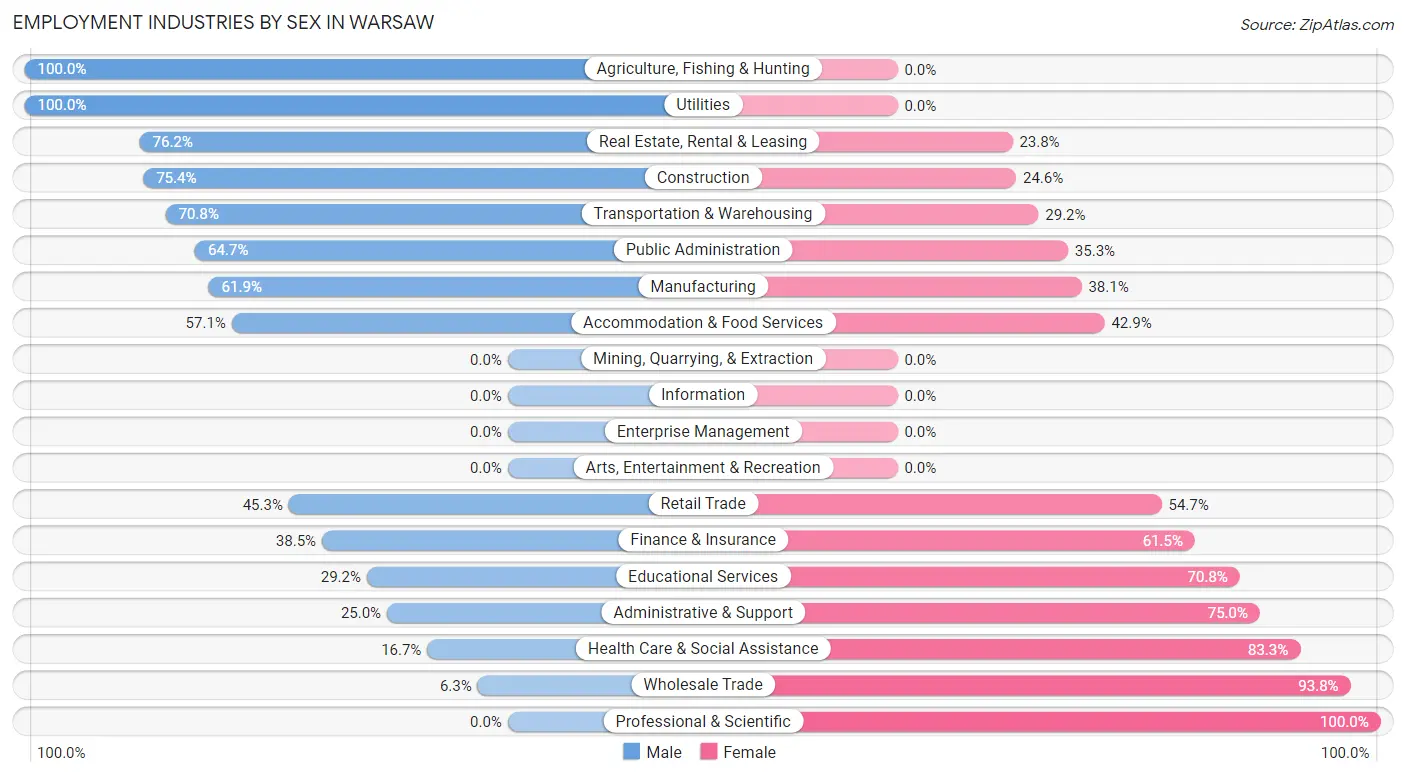
Employment Industries by Sex in Warsaw
The Warsaw industries that see more men than women are Agriculture, Fishing & Hunting (100.0%), Utilities (100.0%), and Real Estate, Rental & Leasing (76.2%), whereas the industries that tend to have a higher number of women are Professional & Scientific (100.0%), Wholesale Trade (93.8%), and Health Care & Social Assistance (83.3%).
| Industry | Male | Female |
| Agriculture, Fishing & Hunting | 1 (100.0%) | 0 (0.0%) |
| Mining, Quarrying, & Extraction | 0 (0.0%) | 0 (0.0%) |
| Construction | 43 (75.4%) | 14 (24.6%) |
| Manufacturing | 52 (61.9%) | 32 (38.1%) |
| Wholesale Trade | 1 (6.2%) | 15 (93.8%) |
| Retail Trade | 34 (45.3%) | 41 (54.7%) |
| Transportation & Warehousing | 17 (70.8%) | 7 (29.2%) |
| Utilities | 3 (100.0%) | 0 (0.0%) |
| Information | 0 (0.0%) | 0 (0.0%) |
| Finance & Insurance | 10 (38.5%) | 16 (61.5%) |
| Real Estate, Rental & Leasing | 16 (76.2%) | 5 (23.8%) |
| Professional & Scientific | 0 (0.0%) | 8 (100.0%) |
| Enterprise Management | 0 (0.0%) | 0 (0.0%) |
| Administrative & Support | 4 (25.0%) | 12 (75.0%) |
| Educational Services | 14 (29.2%) | 34 (70.8%) |
| Health Care & Social Assistance | 6 (16.7%) | 30 (83.3%) |
| Arts, Entertainment & Recreation | 0 (0.0%) | 0 (0.0%) |
| Accommodation & Food Services | 4 (57.1%) | 3 (42.9%) |
| Public Administration | 11 (64.7%) | 6 (35.3%) |
| Total | 216 (48.9%) | 226 (51.1%) |
Education in Warsaw
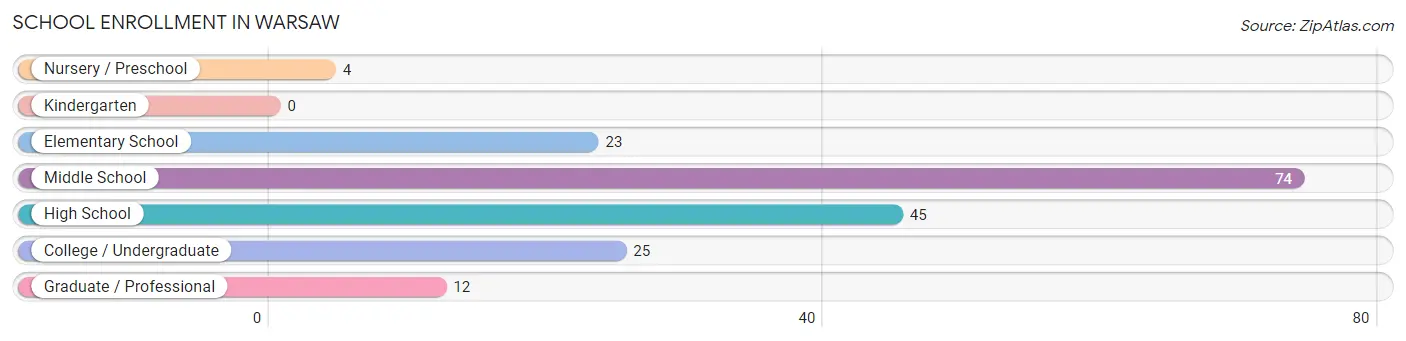
School Enrollment in Warsaw
The most common levels of schooling among the 183 students in Warsaw are middle school (74 | 40.4%), high school (45 | 24.6%), and college / undergraduate (25 | 13.7%).
| School Level | # Students | % Students |
| Nursery / Preschool | 4 | 2.2% |
| Kindergarten | 0 | 0.0% |
| Elementary School | 23 | 12.6% |
| Middle School | 74 | 40.4% |
| High School | 45 | 24.6% |
| College / Undergraduate | 25 | 13.7% |
| Graduate / Professional | 12 | 6.6% |
| Total | 183 | 100.0% |
School Enrollment by Age by Funding Source in Warsaw
Out of a total of 183 students who are enrolled in schools in Warsaw, 30 (16.4%) attend a private institution, while the remaining 153 (83.6%) are enrolled in public schools. The age group of 25 to 34 year olds has the highest likelihood of being enrolled in private schools, with 10 (76.9% in the age bracket) enrolled. Conversely, the age group of 3 to 4 year olds has the lowest likelihood of being enrolled in a private school, with 4 (100.0% in the age bracket) attending a public institution.
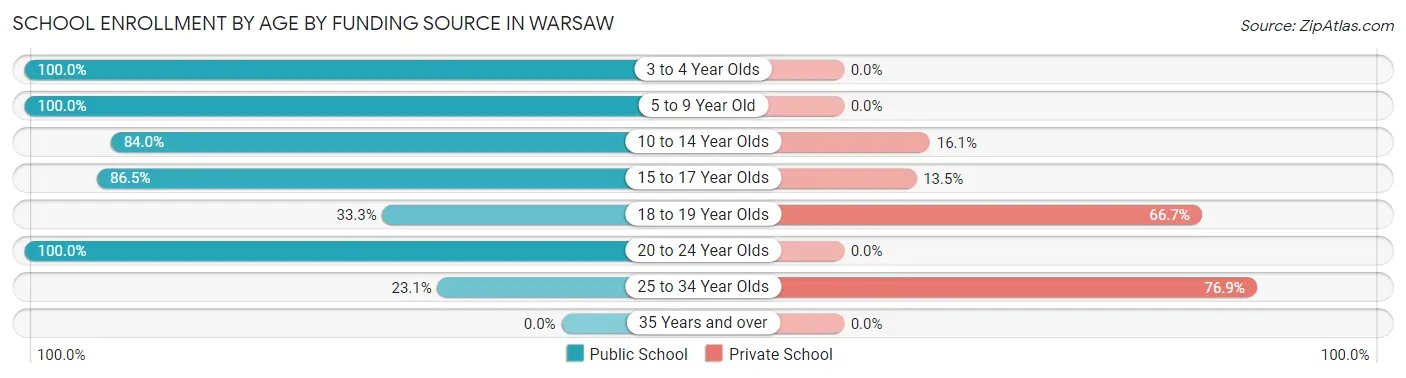
| Age Bracket | Public School | Private School |
| 3 to 4 Year Olds | 4 (100.0%) | 0 (0.0%) |
| 5 to 9 Year Old | 23 (100.0%) | 0 (0.0%) |
| 10 to 14 Year Olds | 68 (84.0%) | 13 (16.1%) |
| 15 to 17 Year Olds | 32 (86.5%) | 5 (13.5%) |
| 18 to 19 Year Olds | 1 (33.3%) | 2 (66.7%) |
| 20 to 24 Year Olds | 22 (100.0%) | 0 (0.0%) |
| 25 to 34 Year Olds | 3 (23.1%) | 10 (76.9%) |
| 35 Years and over | 0 (0.0%) | 0 (0.0%) |
| Total | 153 (83.6%) | 30 (16.4%) |
Educational Attainment by Field of Study in Warsaw
Business (40 | 22.2%), education (35 | 19.4%), science & technology (25 | 13.9%), communications (22 | 12.2%), and arts & humanities (16 | 8.9%) are the most common fields of study among 180 individuals in Warsaw who have obtained a bachelor's degree or higher.
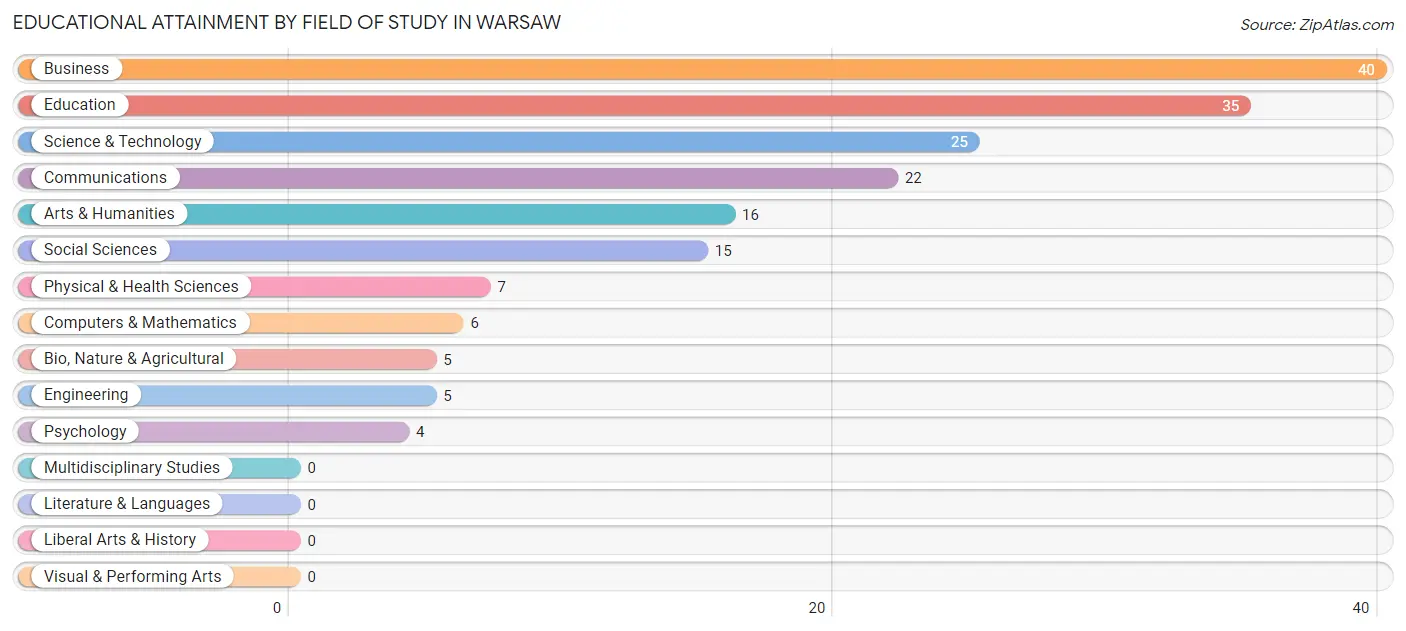
| Field of Study | # Graduates | % Graduates |
| Computers & Mathematics | 6 | 3.3% |
| Bio, Nature & Agricultural | 5 | 2.8% |
| Physical & Health Sciences | 7 | 3.9% |
| Psychology | 4 | 2.2% |
| Social Sciences | 15 | 8.3% |
| Engineering | 5 | 2.8% |
| Multidisciplinary Studies | 0 | 0.0% |
| Science & Technology | 25 | 13.9% |
| Business | 40 | 22.2% |
| Education | 35 | 19.4% |
| Literature & Languages | 0 | 0.0% |
| Liberal Arts & History | 0 | 0.0% |
| Visual & Performing Arts | 0 | 0.0% |
| Communications | 22 | 12.2% |
| Arts & Humanities | 16 | 8.9% |
| Total | 180 | 100.0% |
Transportation & Commute in Warsaw
Vehicle Availability by Sex in Warsaw
The most prevalent vehicle ownership categories in Warsaw are males with 3 vehicles (71, accounting for 33.3%) and females with 3 vehicles (72, making up 34.5%).
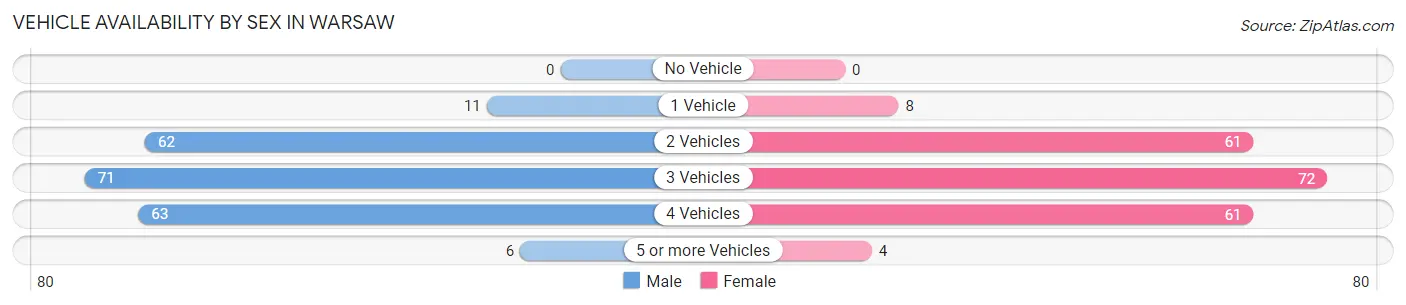
| Vehicles Available | Male | Female |
| No Vehicle | 0 (0.0%) | 0 (0.0%) |
| 1 Vehicle | 11 (5.2%) | 8 (3.9%) |
| 2 Vehicles | 62 (29.1%) | 61 (29.6%) |
| 3 Vehicles | 71 (33.3%) | 72 (34.9%) |
| 4 Vehicles | 63 (29.6%) | 61 (29.6%) |
| 5 or more Vehicles | 6 (2.8%) | 4 (1.9%) |
| Total | 213 (100.0%) | 206 (100.0%) |
Commute Time in Warsaw
The most frequently occuring commute durations in Warsaw are 10 to 14 minutes (77 commuters, 19.2%), 20 to 24 minutes (65 commuters, 16.2%), and 15 to 19 minutes (58 commuters, 14.5%).
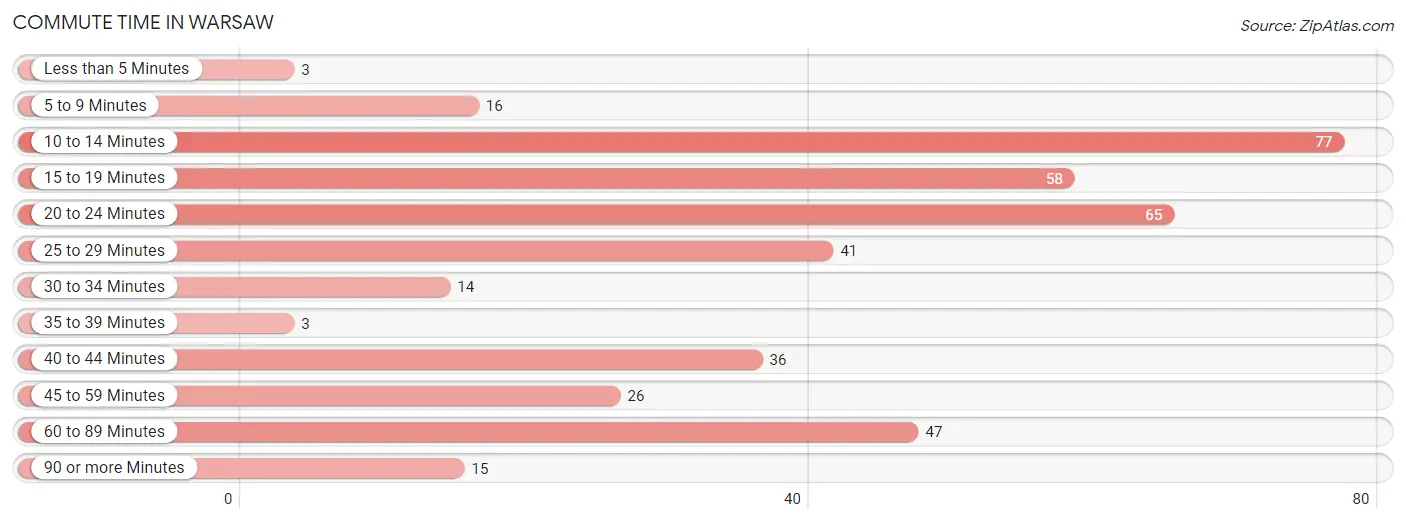
| Commute Time | # Commuters | % Commuters |
| Less than 5 Minutes | 3 | 0.7% |
| 5 to 9 Minutes | 16 | 4.0% |
| 10 to 14 Minutes | 77 | 19.2% |
| 15 to 19 Minutes | 58 | 14.5% |
| 20 to 24 Minutes | 65 | 16.2% |
| 25 to 29 Minutes | 41 | 10.2% |
| 30 to 34 Minutes | 14 | 3.5% |
| 35 to 39 Minutes | 3 | 0.7% |
| 40 to 44 Minutes | 36 | 9.0% |
| 45 to 59 Minutes | 26 | 6.5% |
| 60 to 89 Minutes | 47 | 11.7% |
| 90 or more Minutes | 15 | 3.7% |
Commute Time by Sex in Warsaw
The most common commute times in Warsaw are 20 to 24 minutes (38 commuters, 18.4%) for males and 10 to 14 minutes (50 commuters, 25.8%) for females.
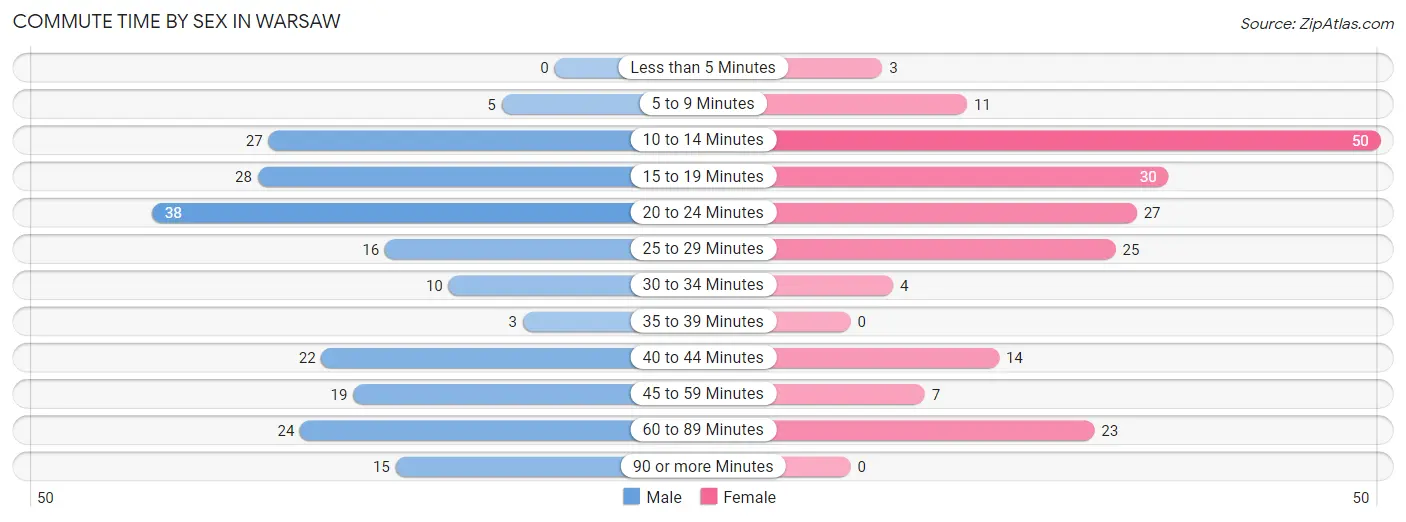
| Commute Time | Male | Female |
| Less than 5 Minutes | 0 (0.0%) | 3 (1.5%) |
| 5 to 9 Minutes | 5 (2.4%) | 11 (5.7%) |
| 10 to 14 Minutes | 27 (13.0%) | 50 (25.8%) |
| 15 to 19 Minutes | 28 (13.5%) | 30 (15.5%) |
| 20 to 24 Minutes | 38 (18.4%) | 27 (13.9%) |
| 25 to 29 Minutes | 16 (7.7%) | 25 (12.9%) |
| 30 to 34 Minutes | 10 (4.8%) | 4 (2.1%) |
| 35 to 39 Minutes | 3 (1.5%) | 0 (0.0%) |
| 40 to 44 Minutes | 22 (10.6%) | 14 (7.2%) |
| 45 to 59 Minutes | 19 (9.2%) | 7 (3.6%) |
| 60 to 89 Minutes | 24 (11.6%) | 23 (11.9%) |
| 90 or more Minutes | 15 (7.2%) | 0 (0.0%) |
Time of Departure to Work by Sex in Warsaw
The most frequent times of departure to work in Warsaw are 5:00 AM to 5:29 AM (51, 24.6%) for males and 7:30 AM to 7:59 AM (40, 20.6%) for females.
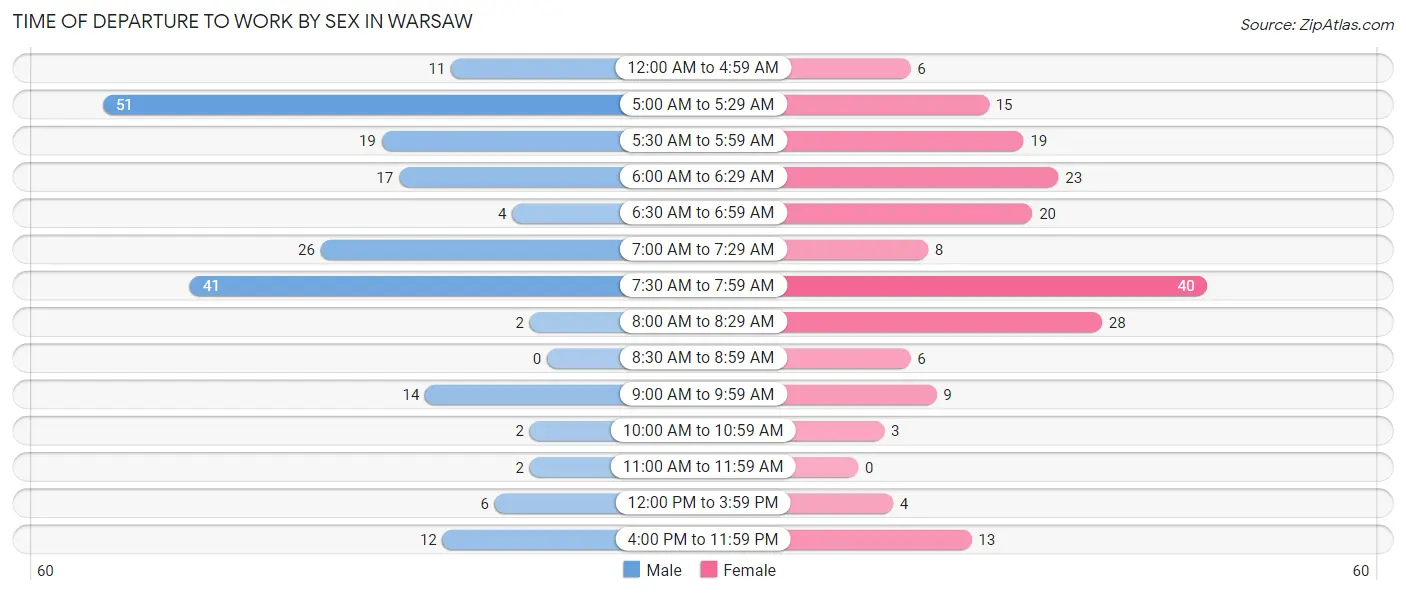
| Time of Departure | Male | Female |
| 12:00 AM to 4:59 AM | 11 (5.3%) | 6 (3.1%) |
| 5:00 AM to 5:29 AM | 51 (24.6%) | 15 (7.7%) |
| 5:30 AM to 5:59 AM | 19 (9.2%) | 19 (9.8%) |
| 6:00 AM to 6:29 AM | 17 (8.2%) | 23 (11.9%) |
| 6:30 AM to 6:59 AM | 4 (1.9%) | 20 (10.3%) |
| 7:00 AM to 7:29 AM | 26 (12.6%) | 8 (4.1%) |
| 7:30 AM to 7:59 AM | 41 (19.8%) | 40 (20.6%) |
| 8:00 AM to 8:29 AM | 2 (1.0%) | 28 (14.4%) |
| 8:30 AM to 8:59 AM | 0 (0.0%) | 6 (3.1%) |
| 9:00 AM to 9:59 AM | 14 (6.8%) | 9 (4.6%) |
| 10:00 AM to 10:59 AM | 2 (1.0%) | 3 (1.5%) |
| 11:00 AM to 11:59 AM | 2 (1.0%) | 0 (0.0%) |
| 12:00 PM to 3:59 PM | 6 (2.9%) | 4 (2.1%) |
| 4:00 PM to 11:59 PM | 12 (5.8%) | 13 (6.7%) |
| Total | 207 (100.0%) | 194 (100.0%) |
Housing Occupancy in Warsaw
Occupancy by Ownership in Warsaw
Of the total 283 dwellings in Warsaw, owner-occupied units account for 261 (92.2%), while renter-occupied units make up 22 (7.8%).
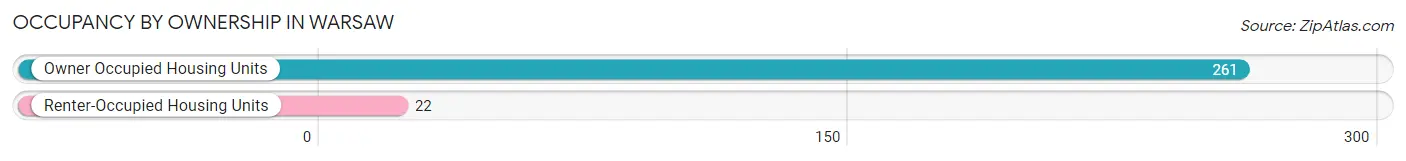
| Occupancy | # Housing Units | % Housing Units |
| Owner Occupied Housing Units | 261 | 92.2% |
| Renter-Occupied Housing Units | 22 | 7.8% |
| Total Occupied Housing Units | 283 | 100.0% |
Occupancy by Household Size in Warsaw
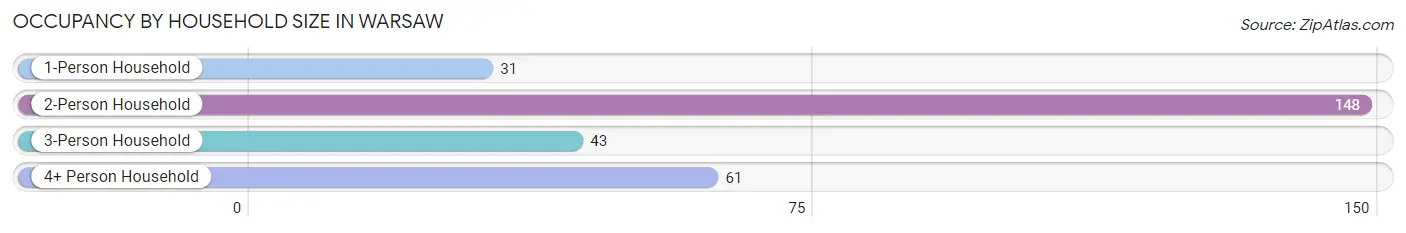
| Household Size | # Housing Units | % Housing Units |
| 1-Person Household | 31 | 11.0% |
| 2-Person Household | 148 | 52.3% |
| 3-Person Household | 43 | 15.2% |
| 4+ Person Household | 61 | 21.5% |
| Total Housing Units | 283 | 100.0% |
Occupancy by Ownership by Household Size in Warsaw
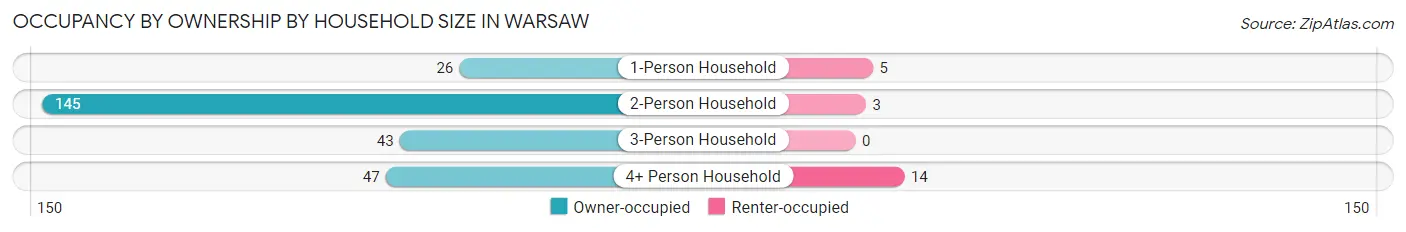
| Household Size | Owner-occupied | Renter-occupied |
| 1-Person Household | 26 (83.9%) | 5 (16.1%) |
| 2-Person Household | 145 (98.0%) | 3 (2.0%) |
| 3-Person Household | 43 (100.0%) | 0 (0.0%) |
| 4+ Person Household | 47 (77.0%) | 14 (23.0%) |
| Total Housing Units | 261 (92.2%) | 22 (7.8%) |
Occupancy by Educational Attainment in Warsaw
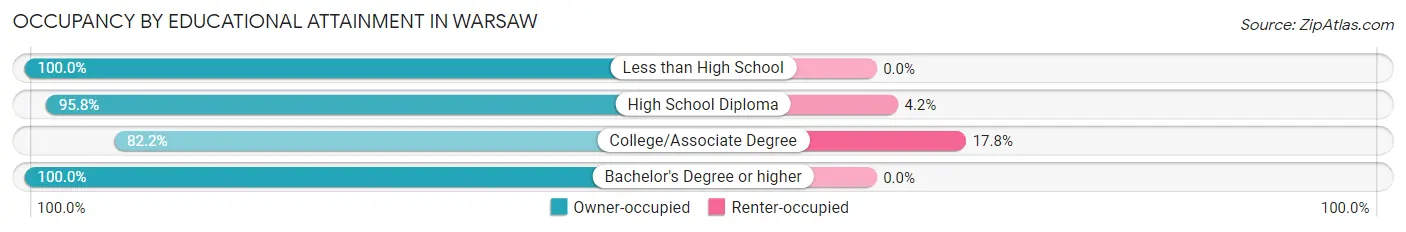
| Household Size | Owner-occupied | Renter-occupied |
| Less than High School | 20 (100.0%) | 0 (0.0%) |
| High School Diploma | 68 (95.8%) | 3 (4.2%) |
| College/Associate Degree | 88 (82.2%) | 19 (17.8%) |
| Bachelor's Degree or higher | 85 (100.0%) | 0 (0.0%) |
Occupancy by Age of Householder in Warsaw

| Age Bracket | # Households | % Households |
| Under 35 Years | 49 | 17.3% |
| 35 to 44 Years | 38 | 13.4% |
| 45 to 54 Years | 66 | 23.3% |
| 55 to 64 Years | 58 | 20.5% |
| 65 to 74 Years | 50 | 17.7% |
| 75 to 84 Years | 19 | 6.7% |
| 85 Years and Over | 3 | 1.1% |
| Total | 283 | 100.0% |
Housing Finances in Warsaw
Median Income by Occupancy in Warsaw
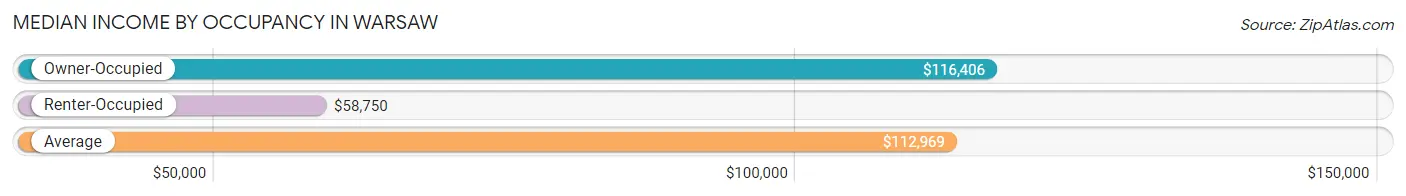
| Occupancy Type | # Households | Median Income |
| Owner-Occupied | 261 (92.2%) | $116,406 |
| Renter-Occupied | 22 (7.8%) | $58,750 |
| Average | 283 (100.0%) | $112,969 |
Occupancy by Householder Income Bracket in Warsaw
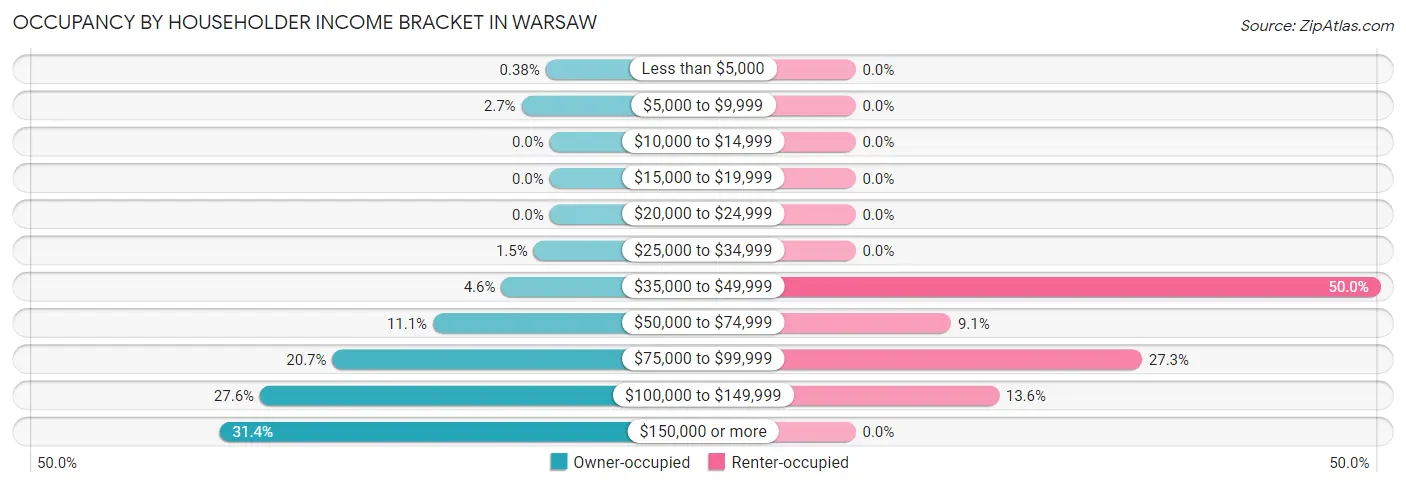
| Income Bracket | Owner-occupied | Renter-occupied |
| Less than $5,000 | 1 (0.4%) | 0 (0.0%) |
| $5,000 to $9,999 | 7 (2.7%) | 0 (0.0%) |
| $10,000 to $14,999 | 0 (0.0%) | 0 (0.0%) |
| $15,000 to $19,999 | 0 (0.0%) | 0 (0.0%) |
| $20,000 to $24,999 | 0 (0.0%) | 0 (0.0%) |
| $25,000 to $34,999 | 4 (1.5%) | 0 (0.0%) |
| $35,000 to $49,999 | 12 (4.6%) | 11 (50.0%) |
| $50,000 to $74,999 | 29 (11.1%) | 2 (9.1%) |
| $75,000 to $99,999 | 54 (20.7%) | 6 (27.3%) |
| $100,000 to $149,999 | 72 (27.6%) | 3 (13.6%) |
| $150,000 or more | 82 (31.4%) | 0 (0.0%) |
| Total | 261 (100.0%) | 22 (100.0%) |
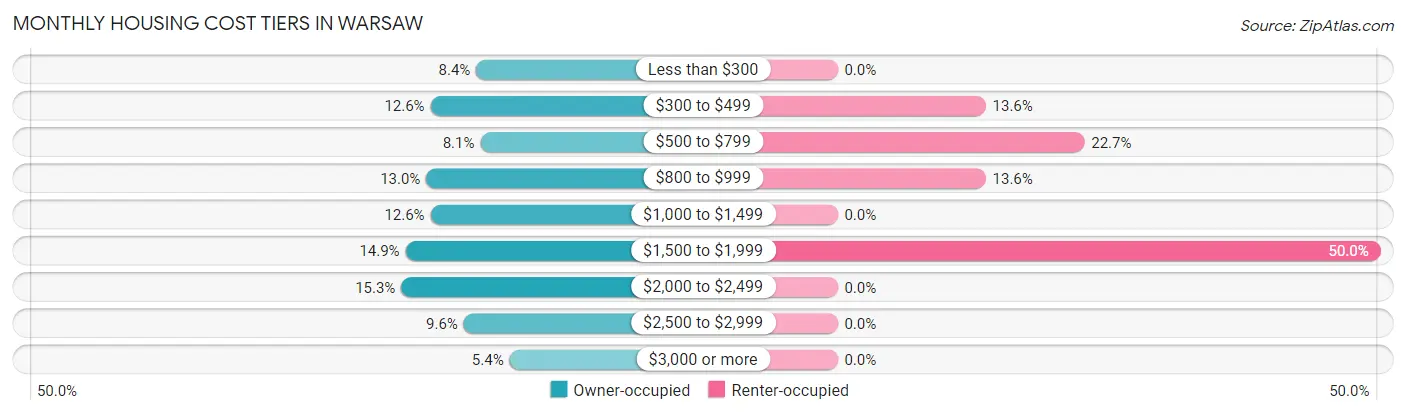
Monthly Housing Cost Tiers in Warsaw
| Monthly Cost | Owner-occupied | Renter-occupied |
| Less than $300 | 22 (8.4%) | 0 (0.0%) |
| $300 to $499 | 33 (12.6%) | 3 (13.6%) |
| $500 to $799 | 21 (8.1%) | 5 (22.7%) |
| $800 to $999 | 34 (13.0%) | 3 (13.6%) |
| $1,000 to $1,499 | 33 (12.6%) | 0 (0.0%) |
| $1,500 to $1,999 | 39 (14.9%) | 11 (50.0%) |
| $2,000 to $2,499 | 40 (15.3%) | 0 (0.0%) |
| $2,500 to $2,999 | 25 (9.6%) | 0 (0.0%) |
| $3,000 or more | 14 (5.4%) | 0 (0.0%) |
| Total | 261 (100.0%) | 22 (100.0%) |
Physical Housing Characteristics in Warsaw
Housing Structures in Warsaw
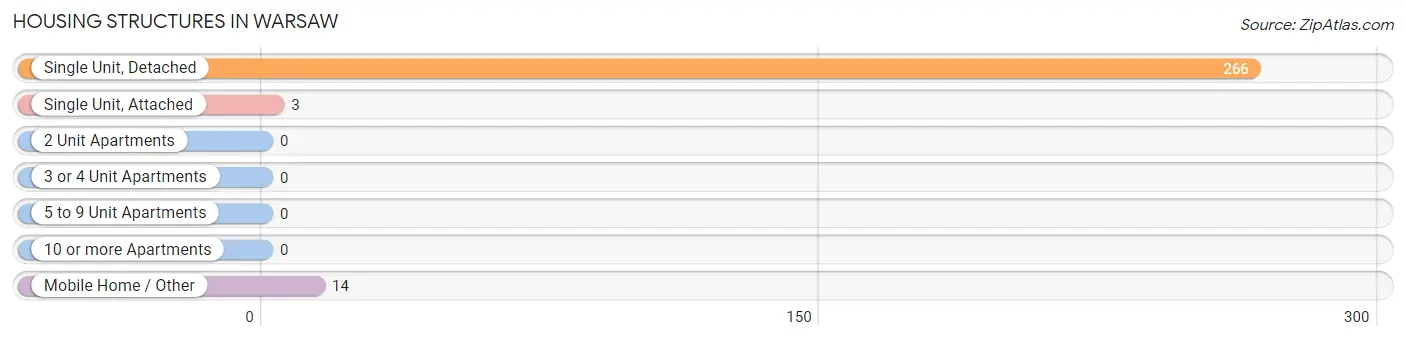
| Structure Type | # Housing Units | % Housing Units |
| Single Unit, Detached | 266 | 94.0% |
| Single Unit, Attached | 3 | 1.1% |
| 2 Unit Apartments | 0 | 0.0% |
| 3 or 4 Unit Apartments | 0 | 0.0% |
| 5 to 9 Unit Apartments | 0 | 0.0% |
| 10 or more Apartments | 0 | 0.0% |
| Mobile Home / Other | 14 | 5.0% |
| Total | 283 | 100.0% |
Housing Structures by Occupancy in Warsaw
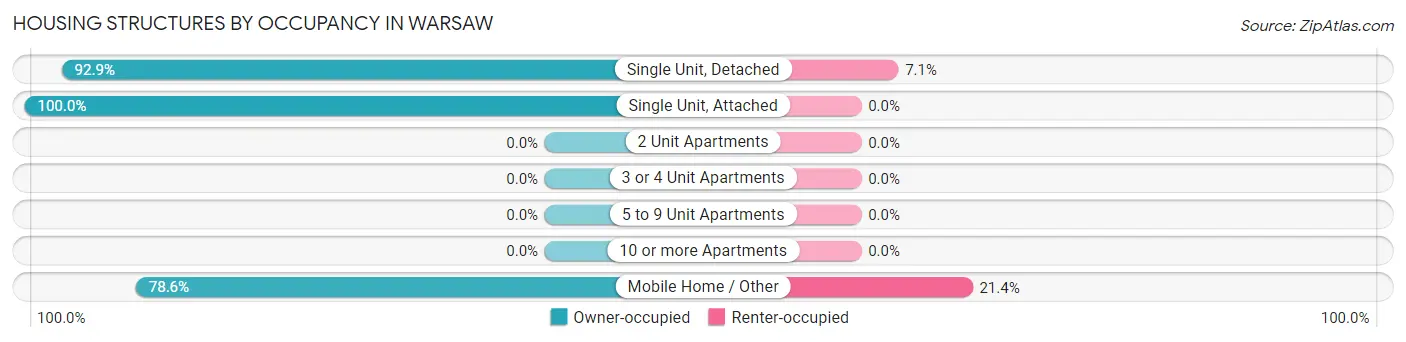
| Structure Type | Owner-occupied | Renter-occupied |
| Single Unit, Detached | 247 (92.9%) | 19 (7.1%) |
| Single Unit, Attached | 3 (100.0%) | 0 (0.0%) |
| 2 Unit Apartments | 0 (0.0%) | 0 (0.0%) |
| 3 or 4 Unit Apartments | 0 (0.0%) | 0 (0.0%) |
| 5 to 9 Unit Apartments | 0 (0.0%) | 0 (0.0%) |
| 10 or more Apartments | 0 (0.0%) | 0 (0.0%) |
| Mobile Home / Other | 11 (78.6%) | 3 (21.4%) |
| Total | 261 (92.2%) | 22 (7.8%) |
Housing Structures by Number of Rooms in Warsaw
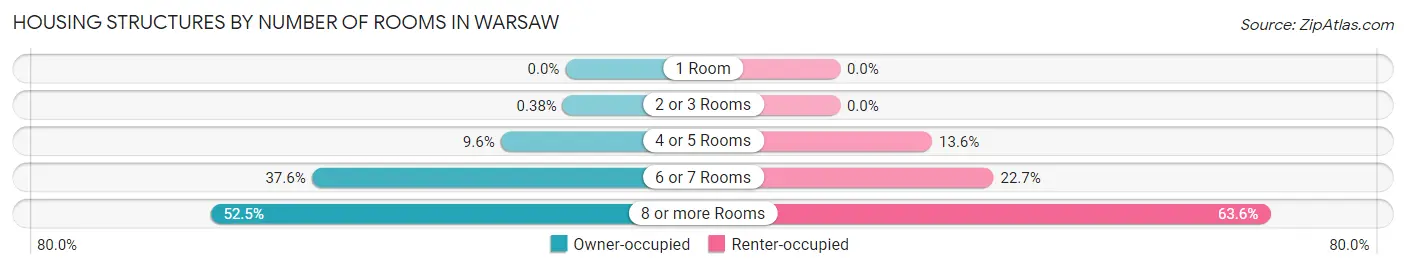
| Number of Rooms | Owner-occupied | Renter-occupied |
| 1 Room | 0 (0.0%) | 0 (0.0%) |
| 2 or 3 Rooms | 1 (0.4%) | 0 (0.0%) |
| 4 or 5 Rooms | 25 (9.6%) | 3 (13.6%) |
| 6 or 7 Rooms | 98 (37.6%) | 5 (22.7%) |
| 8 or more Rooms | 137 (52.5%) | 14 (63.6%) |
| Total | 261 (100.0%) | 22 (100.0%) |
Housing Structure by Heating Type in Warsaw
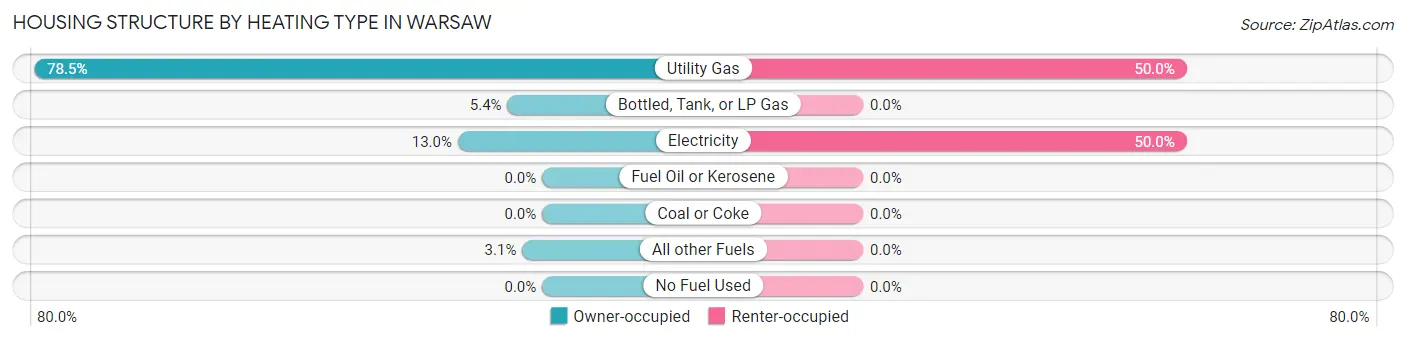
| Heating Type | Owner-occupied | Renter-occupied |
| Utility Gas | 205 (78.5%) | 11 (50.0%) |
| Bottled, Tank, or LP Gas | 14 (5.4%) | 0 (0.0%) |
| Electricity | 34 (13.0%) | 11 (50.0%) |
| Fuel Oil or Kerosene | 0 (0.0%) | 0 (0.0%) |
| Coal or Coke | 0 (0.0%) | 0 (0.0%) |
| All other Fuels | 8 (3.1%) | 0 (0.0%) |
| No Fuel Used | 0 (0.0%) | 0 (0.0%) |
| Total | 261 (100.0%) | 22 (100.0%) |
Household Vehicle Usage in Warsaw
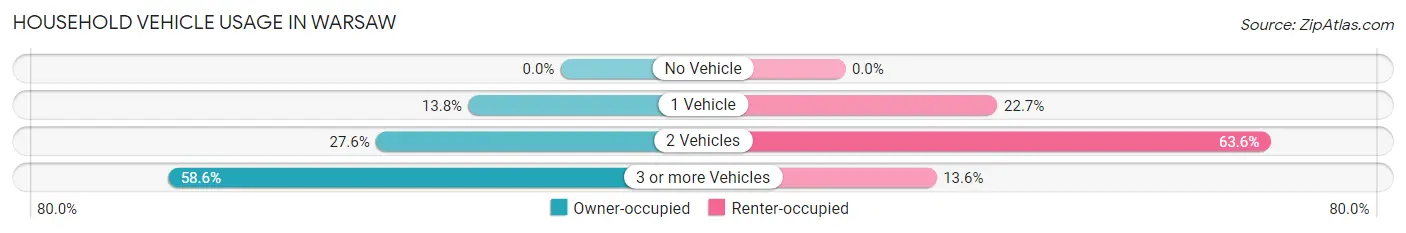
| Vehicles per Household | Owner-occupied | Renter-occupied |
| No Vehicle | 0 (0.0%) | 0 (0.0%) |
| 1 Vehicle | 36 (13.8%) | 5 (22.7%) |
| 2 Vehicles | 72 (27.6%) | 14 (63.6%) |
| 3 or more Vehicles | 153 (58.6%) | 3 (13.6%) |
| Total | 261 (100.0%) | 22 (100.0%) |
Real Estate & Mortgages in Warsaw
Real Estate and Mortgage Overview in Warsaw
| Characteristic | Without Mortgage | With Mortgage |
| Housing Units | 90 | 171 |
| Median Property Value | $193,200 | $313,000 |
| Median Household Income | $92,500 | $54 |
| Monthly Housing Costs | $463 | $14 |
| Real Estate Taxes | $1,375 | $0 |
Property Value by Mortgage Status in Warsaw
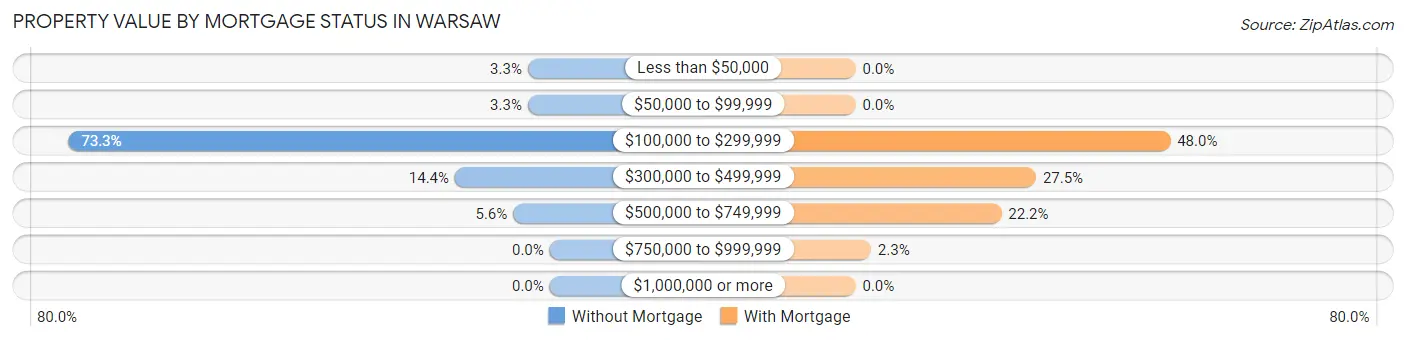
| Property Value | Without Mortgage | With Mortgage |
| Less than $50,000 | 3 (3.3%) | 0 (0.0%) |
| $50,000 to $99,999 | 3 (3.3%) | 0 (0.0%) |
| $100,000 to $299,999 | 66 (73.3%) | 82 (47.9%) |
| $300,000 to $499,999 | 13 (14.4%) | 47 (27.5%) |
| $500,000 to $749,999 | 5 (5.6%) | 38 (22.2%) |
| $750,000 to $999,999 | 0 (0.0%) | 4 (2.3%) |
| $1,000,000 or more | 0 (0.0%) | 0 (0.0%) |
| Total | 90 (100.0%) | 171 (100.0%) |
Household Income by Mortgage Status in Warsaw
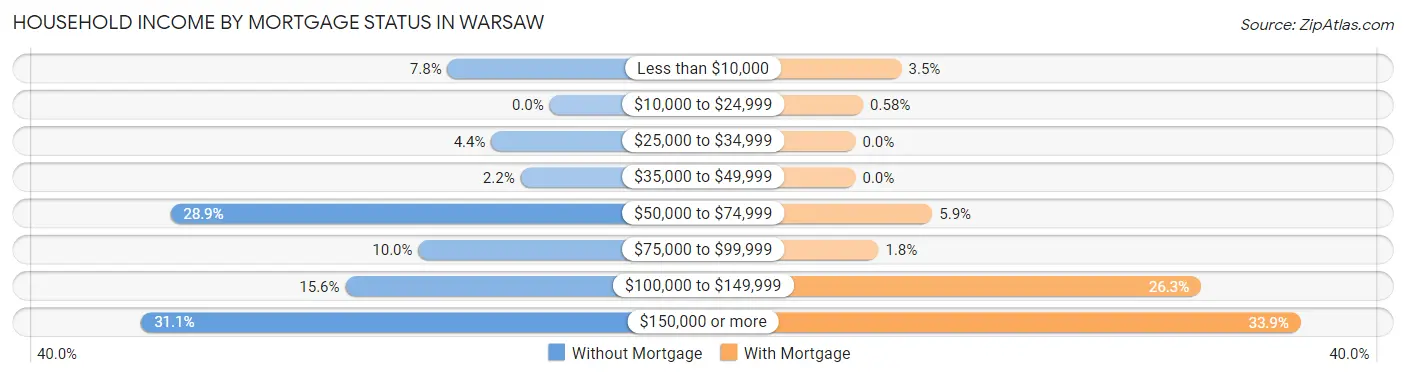
| Household Income | Without Mortgage | With Mortgage |
| Less than $10,000 | 7 (7.8%) | 6 (3.5%) |
| $10,000 to $24,999 | 0 (0.0%) | 1 (0.6%) |
| $25,000 to $34,999 | 4 (4.4%) | 0 (0.0%) |
| $35,000 to $49,999 | 2 (2.2%) | 0 (0.0%) |
| $50,000 to $74,999 | 26 (28.9%) | 10 (5.9%) |
| $75,000 to $99,999 | 9 (10.0%) | 3 (1.8%) |
| $100,000 to $149,999 | 14 (15.6%) | 45 (26.3%) |
| $150,000 or more | 28 (31.1%) | 58 (33.9%) |
| Total | 90 (100.0%) | 171 (100.0%) |
Property Value to Household Income Ratio in Warsaw
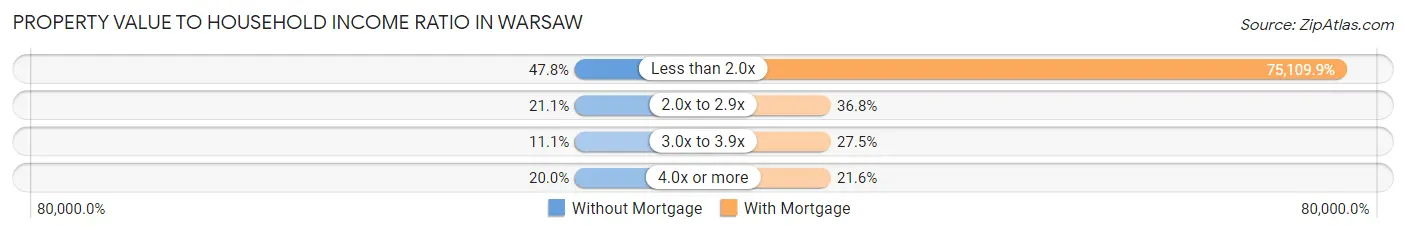
| Value-to-Income Ratio | Without Mortgage | With Mortgage |
| Less than 2.0x | 43 (47.8%) | 128,438 (75,109.9%) |
| 2.0x to 2.9x | 19 (21.1%) | 63 (36.8%) |
| 3.0x to 3.9x | 10 (11.1%) | 47 (27.5%) |
| 4.0x or more | 18 (20.0%) | 37 (21.6%) |
| Total | 90 (100.0%) | 171 (100.0%) |
Real Estate Taxes by Mortgage Status in Warsaw
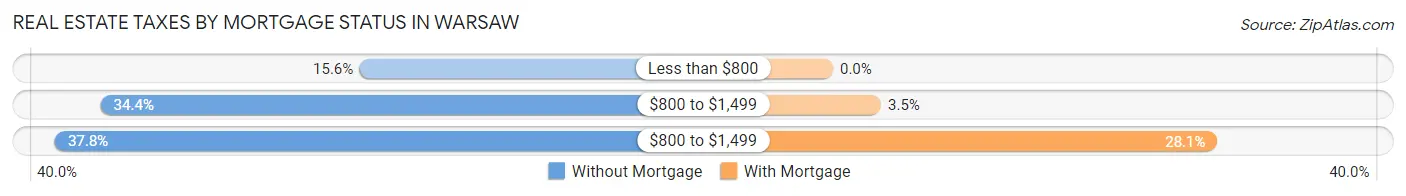
| Property Taxes | Without Mortgage | With Mortgage |
| Less than $800 | 14 (15.6%) | 0 (0.0%) |
| $800 to $1,499 | 31 (34.4%) | 6 (3.5%) |
| $800 to $1,499 | 34 (37.8%) | 48 (28.1%) |
| Total | 90 (100.0%) | 171 (100.0%) |
Health & Disability in Warsaw
Health Insurance Coverage by Age in Warsaw
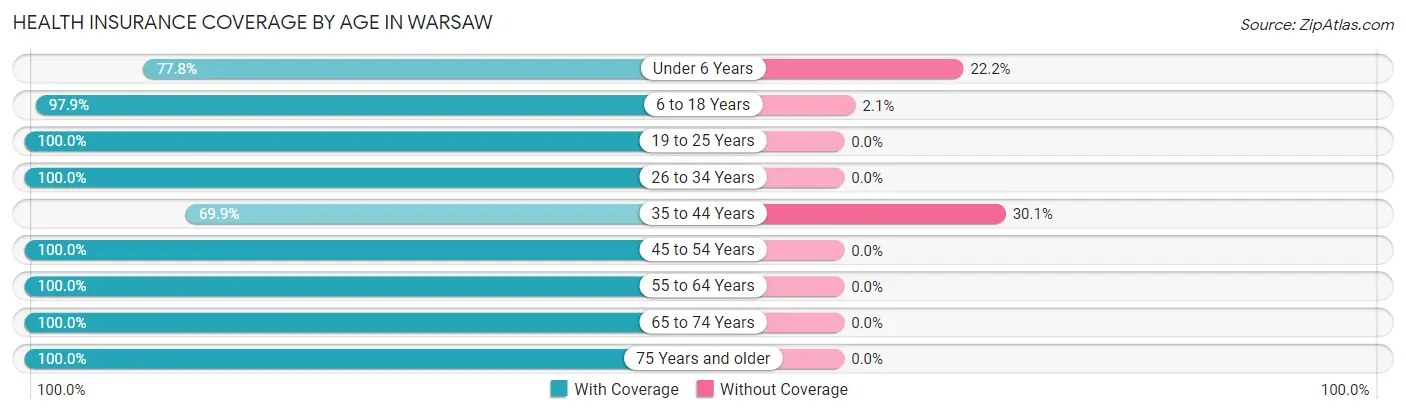
| Age Bracket | With Coverage | Without Coverage |
| Under 6 Years | 42 (77.8%) | 12 (22.2%) |
| 6 to 18 Years | 139 (97.9%) | 3 (2.1%) |
| 19 to 25 Years | 36 (100.0%) | 0 (0.0%) |
| 26 to 34 Years | 94 (100.0%) | 0 (0.0%) |
| 35 to 44 Years | 72 (69.9%) | 31 (30.1%) |
| 45 to 54 Years | 111 (100.0%) | 0 (0.0%) |
| 55 to 64 Years | 114 (100.0%) | 0 (0.0%) |
| 65 to 74 Years | 80 (100.0%) | 0 (0.0%) |
| 75 Years and older | 40 (100.0%) | 0 (0.0%) |
| Total | 728 (94.1%) | 46 (5.9%) |
Health Insurance Coverage by Citizenship Status in Warsaw
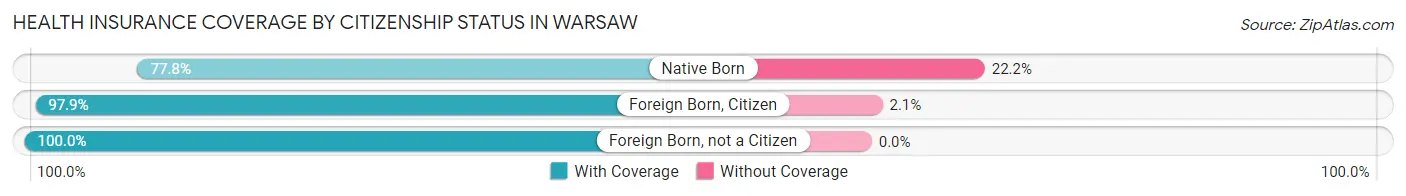
| Citizenship Status | With Coverage | Without Coverage |
| Native Born | 42 (77.8%) | 12 (22.2%) |
| Foreign Born, Citizen | 139 (97.9%) | 3 (2.1%) |
| Foreign Born, not a Citizen | 36 (100.0%) | 0 (0.0%) |
Health Insurance Coverage by Household Income in Warsaw
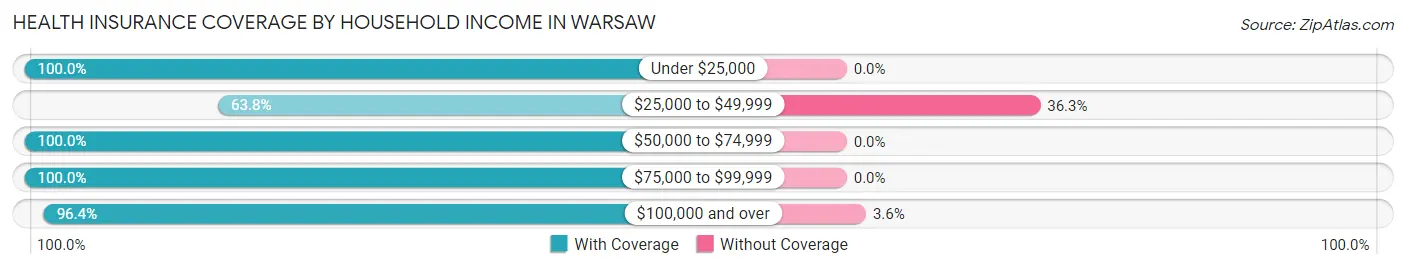
| Household Income | With Coverage | Without Coverage |
| Under $25,000 | 13 (100.0%) | 0 (0.0%) |
| $25,000 to $49,999 | 51 (63.7%) | 29 (36.2%) |
| $50,000 to $74,999 | 52 (100.0%) | 0 (0.0%) |
| $75,000 to $99,999 | 149 (100.0%) | 0 (0.0%) |
| $100,000 and over | 457 (96.4%) | 17 (3.6%) |
Public vs Private Health Insurance Coverage by Age in Warsaw
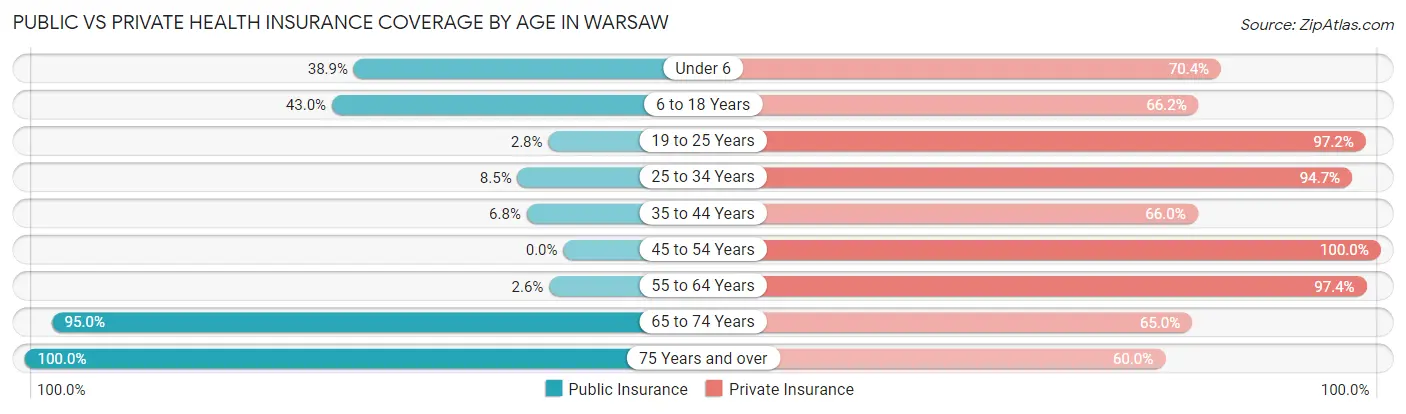
| Age Bracket | Public Insurance | Private Insurance |
| Under 6 | 21 (38.9%) | 38 (70.4%) |
| 6 to 18 Years | 61 (43.0%) | 94 (66.2%) |
| 19 to 25 Years | 1 (2.8%) | 35 (97.2%) |
| 25 to 34 Years | 8 (8.5%) | 89 (94.7%) |
| 35 to 44 Years | 7 (6.8%) | 68 (66.0%) |
| 45 to 54 Years | 0 (0.0%) | 111 (100.0%) |
| 55 to 64 Years | 3 (2.6%) | 111 (97.4%) |
| 65 to 74 Years | 76 (95.0%) | 52 (65.0%) |
| 75 Years and over | 40 (100.0%) | 24 (60.0%) |
| Total | 217 (28.0%) | 622 (80.4%) |
Disability Status by Sex by Age in Warsaw
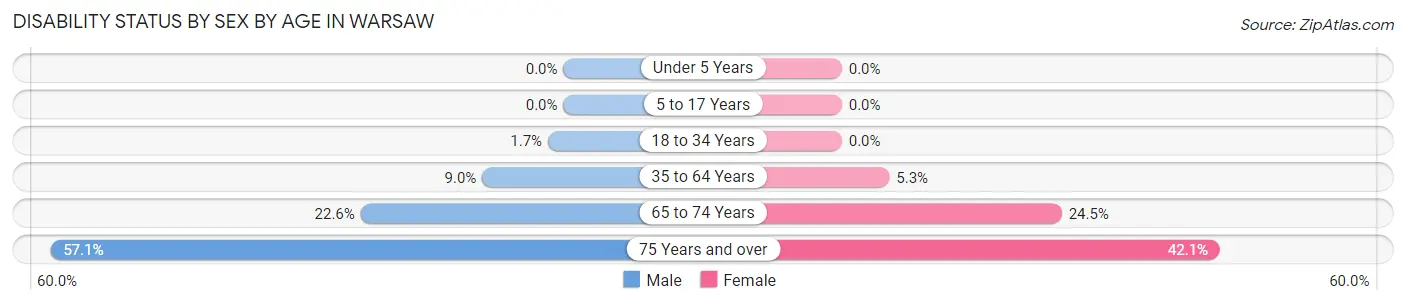
| Age Bracket | Male | Female |
| Under 5 Years | 0 (0.0%) | 0 (0.0%) |
| 5 to 17 Years | 0 (0.0%) | 0 (0.0%) |
| 18 to 34 Years | 1 (1.7%) | 0 (0.0%) |
| 35 to 64 Years | 16 (9.0%) | 8 (5.3%) |
| 65 to 74 Years | 7 (22.6%) | 12 (24.5%) |
| 75 Years and over | 12 (57.1%) | 8 (42.1%) |
Disability Class by Sex by Age in Warsaw
Disability Class: Hearing Difficulty
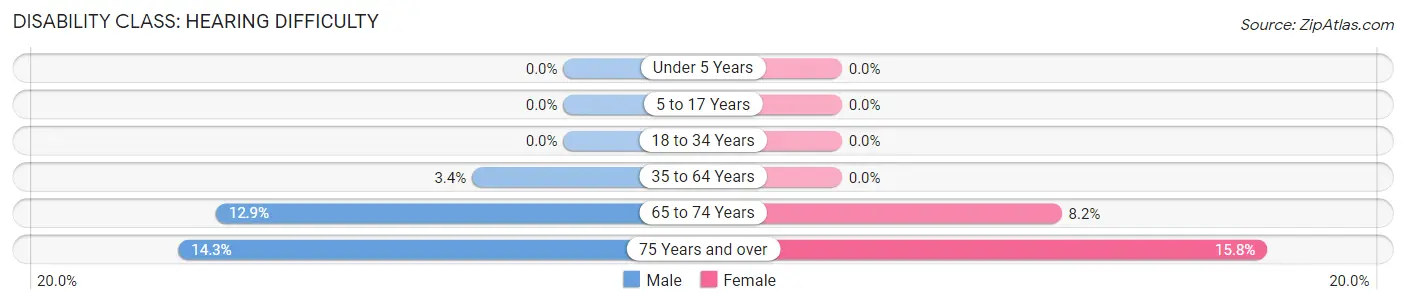
| Age Bracket | Male | Female |
| Under 5 Years | 0 (0.0%) | 0 (0.0%) |
| 5 to 17 Years | 0 (0.0%) | 0 (0.0%) |
| 18 to 34 Years | 0 (0.0%) | 0 (0.0%) |
| 35 to 64 Years | 6 (3.4%) | 0 (0.0%) |
| 65 to 74 Years | 4 (12.9%) | 4 (8.2%) |
| 75 Years and over | 3 (14.3%) | 3 (15.8%) |
Disability Class: Vision Difficulty
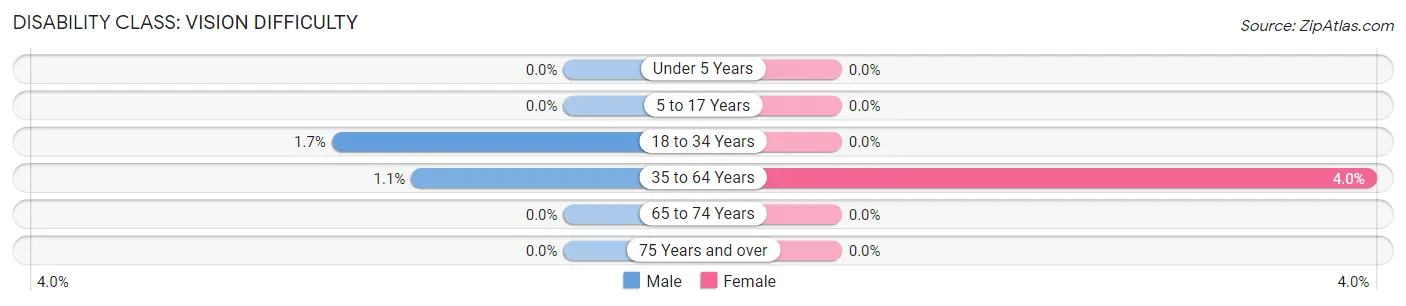
| Age Bracket | Male | Female |
| Under 5 Years | 0 (0.0%) | 0 (0.0%) |
| 5 to 17 Years | 0 (0.0%) | 0 (0.0%) |
| 18 to 34 Years | 1 (1.7%) | 0 (0.0%) |
| 35 to 64 Years | 2 (1.1%) | 6 (4.0%) |
| 65 to 74 Years | 0 (0.0%) | 0 (0.0%) |
| 75 Years and over | 0 (0.0%) | 0 (0.0%) |
Disability Class: Cognitive Difficulty
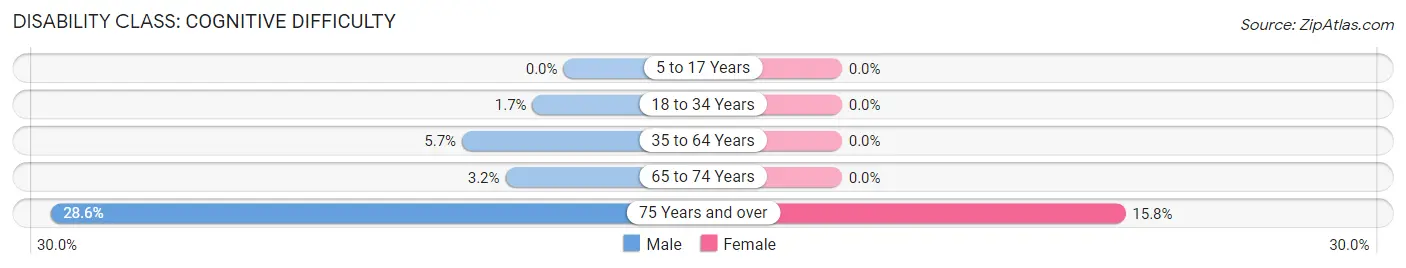
| Age Bracket | Male | Female |
| 5 to 17 Years | 0 (0.0%) | 0 (0.0%) |
| 18 to 34 Years | 1 (1.7%) | 0 (0.0%) |
| 35 to 64 Years | 10 (5.7%) | 0 (0.0%) |
| 65 to 74 Years | 1 (3.2%) | 0 (0.0%) |
| 75 Years and over | 6 (28.6%) | 3 (15.8%) |
Disability Class: Ambulatory Difficulty
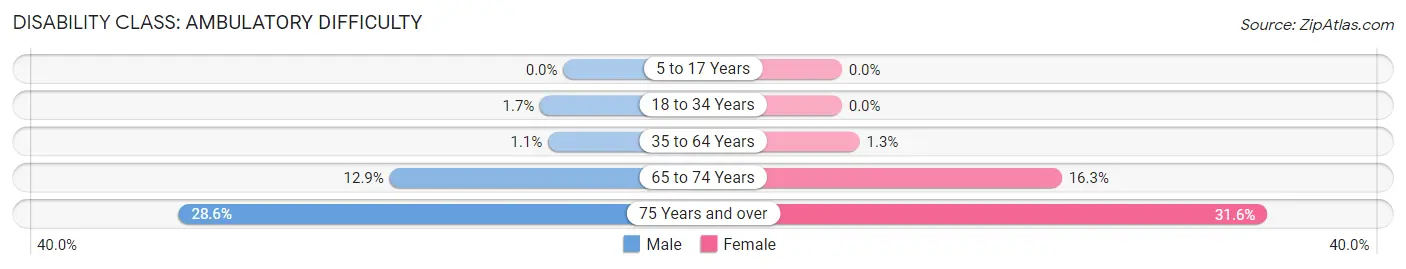
| Age Bracket | Male | Female |
| 5 to 17 Years | 0 (0.0%) | 0 (0.0%) |
| 18 to 34 Years | 1 (1.7%) | 0 (0.0%) |
| 35 to 64 Years | 2 (1.1%) | 2 (1.3%) |
| 65 to 74 Years | 4 (12.9%) | 8 (16.3%) |
| 75 Years and over | 6 (28.6%) | 6 (31.6%) |
Disability Class: Self-Care Difficulty
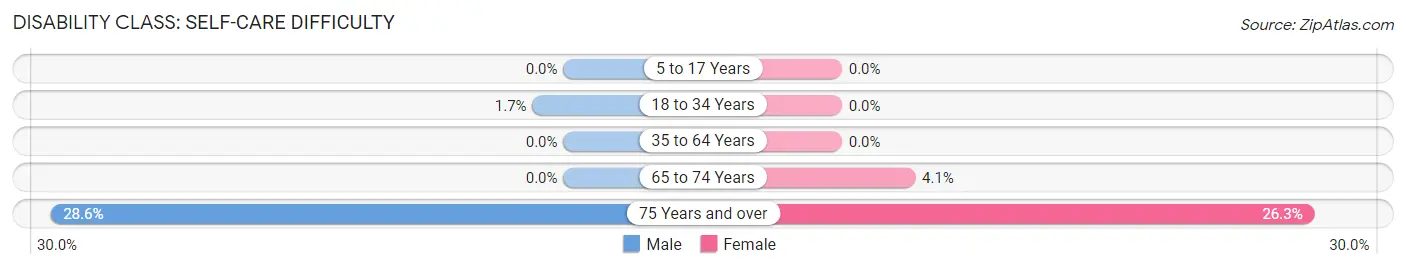
| Age Bracket | Male | Female |
| 5 to 17 Years | 0 (0.0%) | 0 (0.0%) |
| 18 to 34 Years | 1 (1.7%) | 0 (0.0%) |
| 35 to 64 Years | 0 (0.0%) | 0 (0.0%) |
| 65 to 74 Years | 0 (0.0%) | 2 (4.1%) |
| 75 Years and over | 6 (28.6%) | 5 (26.3%) |
Technology Access in Warsaw
Computing Device Access in Warsaw
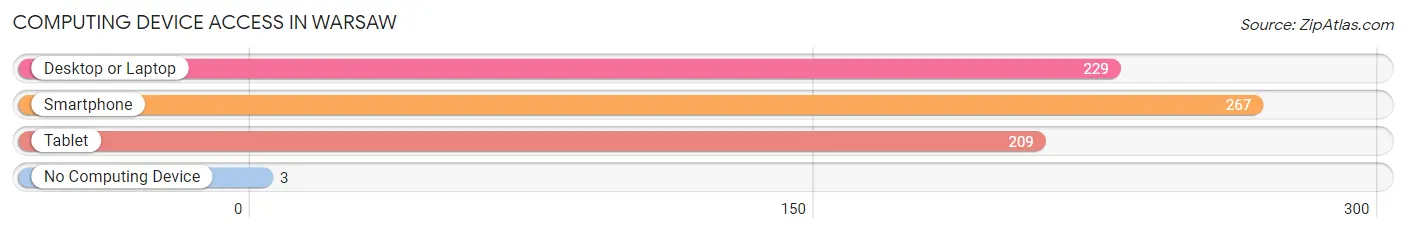
| Device Type | # Households | % Households |
| Desktop or Laptop | 229 | 80.9% |
| Smartphone | 267 | 94.4% |
| Tablet | 209 | 73.9% |
| No Computing Device | 3 | 1.1% |
| Total | 283 | 100.0% |
Internet Access in Warsaw
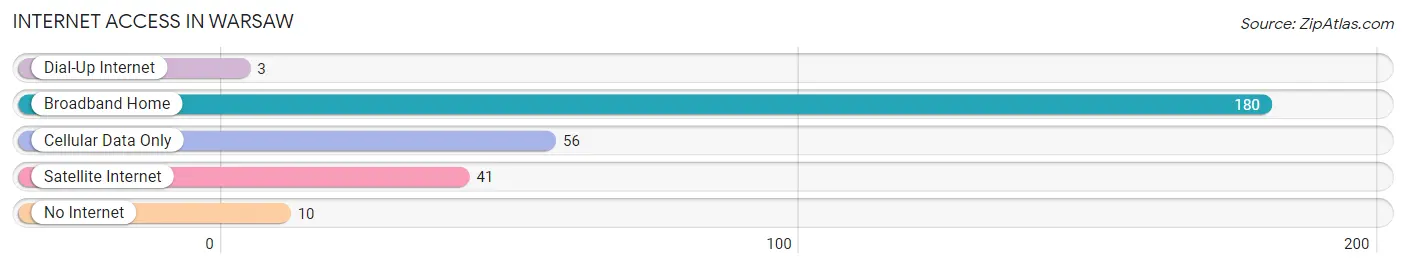
| Internet Type | # Households | % Households |
| Dial-Up Internet | 3 | 1.1% |
| Broadband Home | 180 | 63.6% |
| Cellular Data Only | 56 | 19.8% |
| Satellite Internet | 41 | 14.5% |
| No Internet | 10 | 3.5% |
| Total | 283 | 100.0% |
Warsaw Summary
Warsaw, Minnesota is a small city located in the southeastern corner of the state, in Wabasha County. It is situated on the banks of the Mississippi River, and is surrounded by rolling hills and woodlands. The city has a population of just over 1,000 people, and is known for its small-town charm and friendly atmosphere.
History
The area that is now Warsaw was first settled in 1854 by a group of German immigrants. The town was originally called “New Germany”, but was later renamed Warsaw in 1856. The name was chosen to honor the Polish city of Warsaw, which had recently been destroyed in the Crimean War.
The town grew slowly, but steadily, and by the late 19th century it had become a thriving agricultural center. The town was also home to a number of small businesses, including a flour mill, a sawmill, and a brickyard.
In the early 20th century, Warsaw began to experience a period of growth and prosperity. The town was connected to the rest of the state by the railroad, and the population began to increase. The town also became a popular tourist destination, as people from all over the country came to enjoy the scenic beauty of the area.
Geography
Warsaw is located in the southeastern corner of Minnesota, in Wabasha County. It is situated on the banks of the Mississippi River, and is surrounded by rolling hills and woodlands. The city is located about 25 miles south of Rochester, and about 50 miles west of La Crosse, Wisconsin.
The city has a total area of 1.2 square miles, all of which is land. The terrain is mostly flat, with some rolling hills in the surrounding area. The climate is humid continental, with hot summers and cold winters.
Economy
The economy of Warsaw is largely based on agriculture and tourism. The city is home to a number of small businesses, including a flour mill, a sawmill, and a brickyard. The city is also home to a number of tourist attractions, including the Wabasha County Historical Society Museum, the Wabasha County Fairgrounds, and the Wabasha County Park.
The city is also home to a number of manufacturing companies, including a plastics manufacturer, a metal fabricator, and a food processing plant. The city is also home to a number of retail stores, including a grocery store, a hardware store, and a variety of specialty shops.
Demographics
As of the 2010 census, the population of Warsaw was 1,072. The racial makeup of the city was 97.3% White, 0.3% African American, 0.2% Native American, 0.2% Asian, 0.1% Pacific Islander, 0.7% from other races, and 1.2% from two or more races. Hispanic or Latino of any race were 1.7% of the population.
The median income for a household in the city was $41,250, and the median income for a family was $50,000. The per capita income for the city was $20,845. About 8.3% of families and 10.2% of the population were below the poverty line, including 14.3% of those under age 18 and 8.2% of those age 65 or over.
Conclusion
Warsaw, Minnesota is a small city located in the southeastern corner of the state, in Wabasha County. It is situated on the banks of the Mississippi River, and is surrounded by rolling hills and woodlands. The city has a population of just over 1,000 people, and is known for its small-town charm and friendly atmosphere. The economy of Warsaw is largely based on agriculture and tourism, and the city is home to a number of small businesses, manufacturing companies, and retail stores. The population of the city is mostly white, with a small percentage of African Americans, Native Americans, Asians, and Pacific Islanders. The median income for a household in the city is $41,250, and the per capita income is $20,845.
Common Questions
What is the Total Population of Warsaw?
Total Population of Warsaw is 774.
What is the Total Male Population of Warsaw?
Total Male Population of Warsaw is 417.
What is the Total Female Population of Warsaw?
Total Female Population of Warsaw is 357.
What is the Ratio of Males per 100 Females in Warsaw?
There are 116.81 Males per 100 Females in Warsaw.
What is the Ratio of Females per 100 Males in Warsaw?
There are 85.61 Females per 100 Males in Warsaw.
What is the Median Population Age in Warsaw?
Median Population Age in Warsaw is 42.8 Years.
What is the Average Family Size in Warsaw
Average Family Size in Warsaw is 2.9 People.
What is the Average Household Size in Warsaw
Average Household Size in Warsaw is 2.7 People.
What is Per Capita Income in Warsaw?
Per Capita income in Warsaw is $47,082.
What is the Median Family Income in Warsaw?
Median Family Income in Warsaw is $114,063.
What is the Median Household income in Warsaw?
Median Household Income in Warsaw is $112,969.
What is Income or Wage Gap in Warsaw?
Income or Wage Gap in Warsaw is 30.2%.
Women in Warsaw earn 69.8 cents for every dollar earned by a man.
What is Inequality or Gini Index in Warsaw?
Inequality or Gini Index in Warsaw is 0.33.
How Large is the Labor Force in Warsaw?
There are 463 People in the Labor Forcein in Warsaw.
What is the Percentage of People in the Labor Force in Warsaw?
77.7% of People are in the Labor Force in Warsaw.
What is the Unemployment Rate in Warsaw?
Unemployment Rate in Warsaw is 4.5%.