Trommald, MN
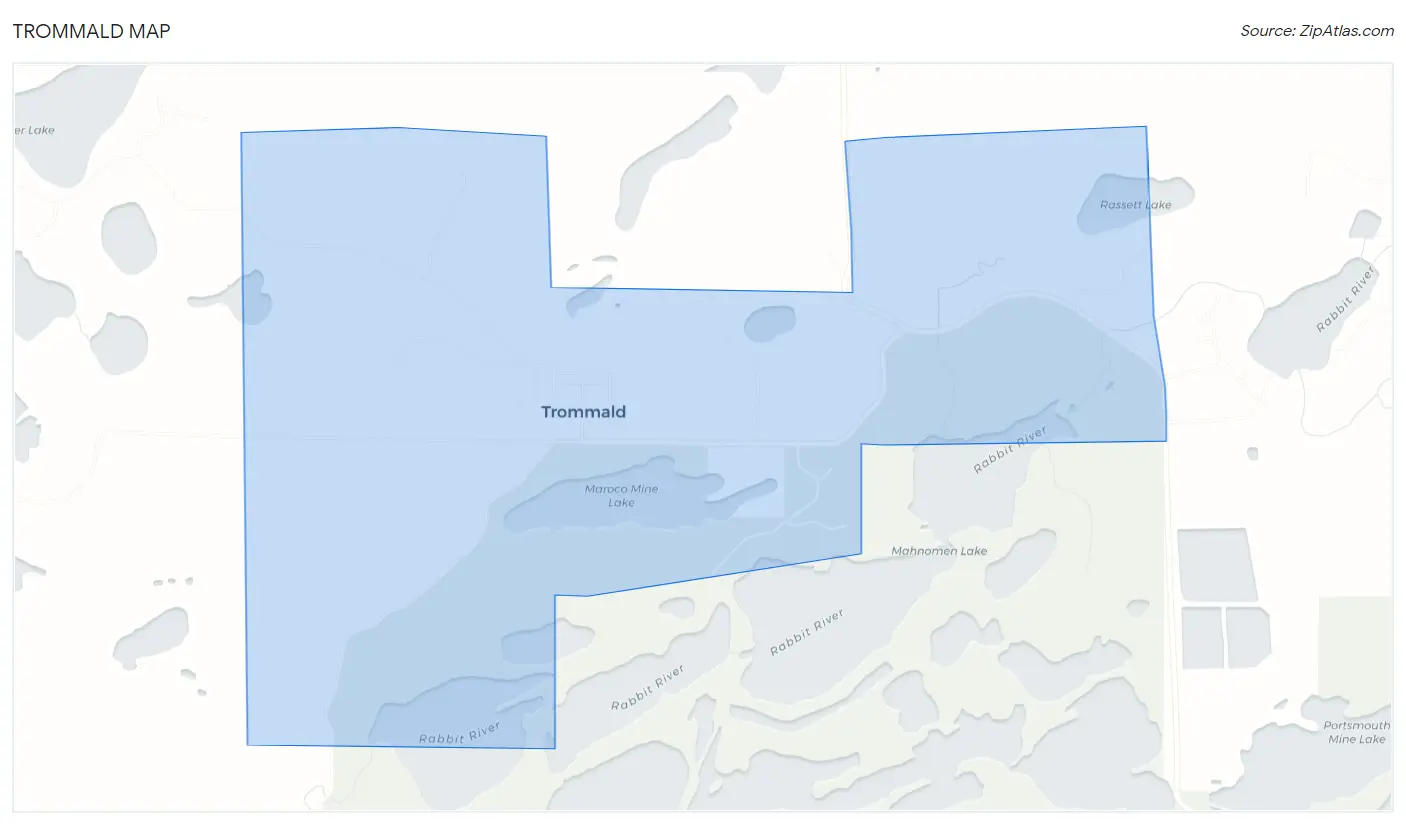
Trommald Map
Trommald Overview
106
TOTAL POPULATION
54
MALE POPULATION
52
FEMALE POPULATION
103.85
MALES / 100 FEMALES
96.30
FEMALES / 100 MALES
36.5
MEDIAN AGE
2.8
AVG FAMILY SIZE
2.6
AVG HOUSEHOLD SIZE
$20,366
PER CAPITA INCOME
$50,357
AVG FAMILY INCOME
$50,729
AVG HOUSEHOLD INCOME
0.20
INEQUALITY / GINI INDEX
61
LABOR FORCE [ PEOPLE ]
80.3%
PERCENT IN LABOR FORCE
26.2%
UNEMPLOYMENT RATE
Race in Trommald
The most populous races in Trommald are White / Caucasian (105 | 99.1%), and Native / Alaskan (1 | 0.9%).
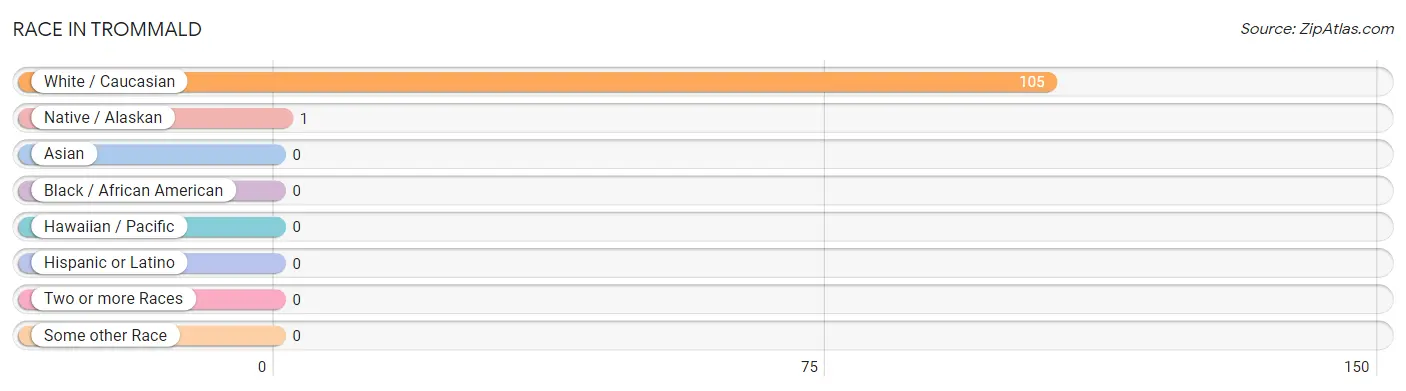
| Race | # Population | % Population |
| Asian | 0 | 0.0% |
| Black / African American | 0 | 0.0% |
| Hawaiian / Pacific | 0 | 0.0% |
| Hispanic or Latino | 0 | 0.0% |
| Native / Alaskan | 1 | 0.9% |
| White / Caucasian | 105 | 99.1% |
| Two or more Races | 0 | 0.0% |
| Some other Race | 0 | 0.0% |
| Total | 106 | 100.0% |
Ancestry in Trommald
The most populous ancestries reported in Trommald are French (29 | 27.4%), Norwegian (23 | 21.7%), English (22 | 20.7%), German (22 | 20.7%), and Italian (10 | 9.4%), together accounting for 100.0% of all Trommald residents.
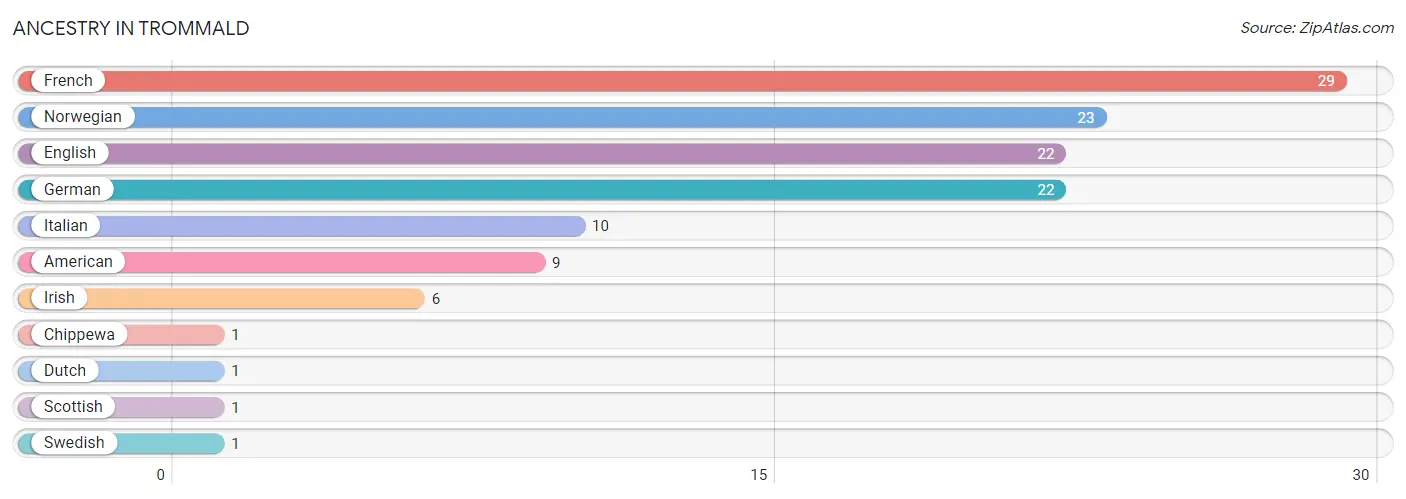
| Ancestry | # Population | % Population |
| American | 9 | 8.5% |
| Chippewa | 1 | 0.9% |
| Dutch | 1 | 0.9% |
| English | 22 | 20.7% |
| French | 29 | 27.4% |
| German | 22 | 20.7% |
| Irish | 6 | 5.7% |
| Italian | 10 | 9.4% |
| Norwegian | 23 | 21.7% |
| Scottish | 1 | 0.9% |
| Swedish | 1 | 0.9% | View All 11 Rows |
Immigrants in Trommald

| Immigration Origin | # Population | % Population | View All 0 Rows |
Sex and Age in Trommald
Sex and Age in Trommald
The most populous age groups in Trommald are 10 to 14 Years (12 | 22.2%) for men and 35 to 39 Years (11 | 21.1%) for women.
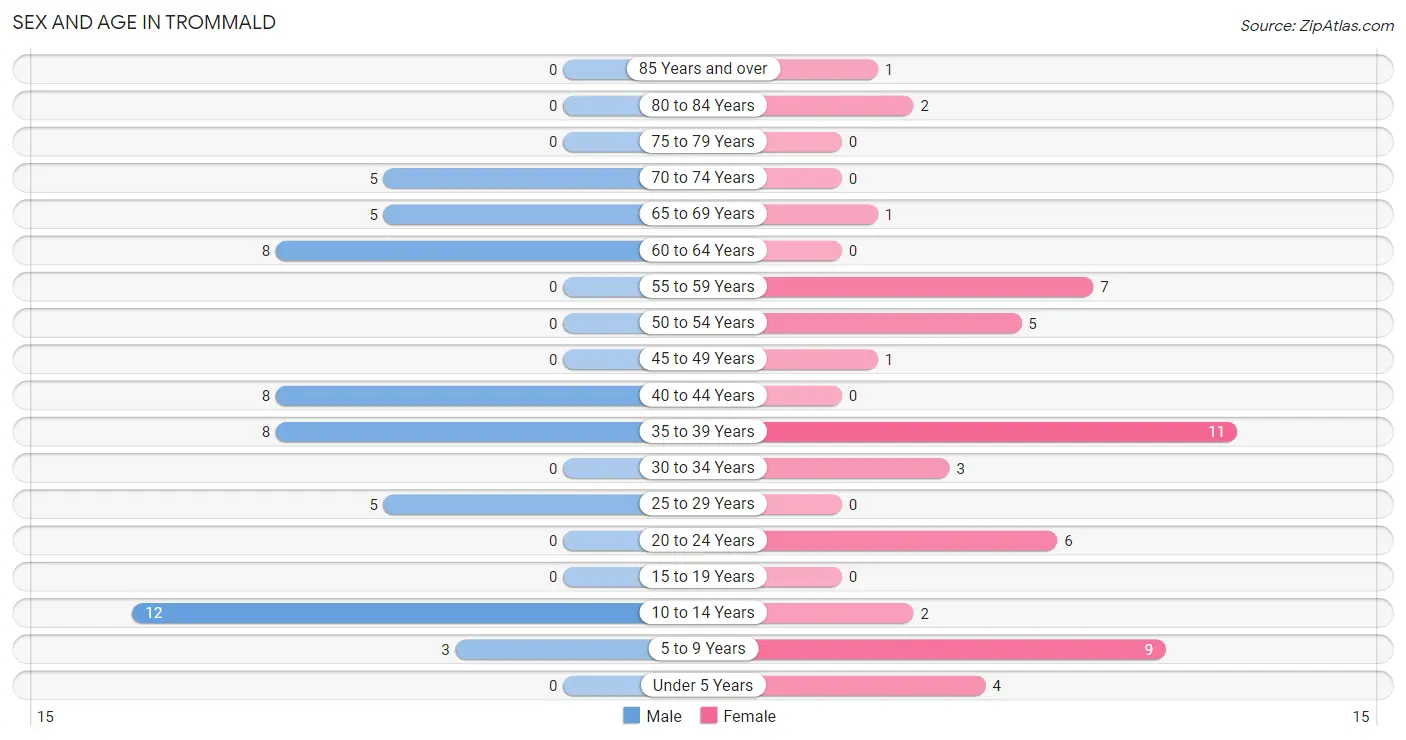
| Age Bracket | Male | Female |
| Under 5 Years | 0 (0.0%) | 4 (7.7%) |
| 5 to 9 Years | 3 (5.6%) | 9 (17.3%) |
| 10 to 14 Years | 12 (22.2%) | 2 (3.8%) |
| 15 to 19 Years | 0 (0.0%) | 0 (0.0%) |
| 20 to 24 Years | 0 (0.0%) | 6 (11.5%) |
| 25 to 29 Years | 5 (9.3%) | 0 (0.0%) |
| 30 to 34 Years | 0 (0.0%) | 3 (5.8%) |
| 35 to 39 Years | 8 (14.8%) | 11 (21.1%) |
| 40 to 44 Years | 8 (14.8%) | 0 (0.0%) |
| 45 to 49 Years | 0 (0.0%) | 1 (1.9%) |
| 50 to 54 Years | 0 (0.0%) | 5 (9.6%) |
| 55 to 59 Years | 0 (0.0%) | 7 (13.5%) |
| 60 to 64 Years | 8 (14.8%) | 0 (0.0%) |
| 65 to 69 Years | 5 (9.3%) | 1 (1.9%) |
| 70 to 74 Years | 5 (9.3%) | 0 (0.0%) |
| 75 to 79 Years | 0 (0.0%) | 0 (0.0%) |
| 80 to 84 Years | 0 (0.0%) | 2 (3.8%) |
| 85 Years and over | 0 (0.0%) | 1 (1.9%) |
| Total | 54 (100.0%) | 52 (100.0%) |
Families and Households in Trommald
Median Family Size in Trommald
The median family size in Trommald is 2.75 persons per family, with single male/father families (6 | 21.4%) accounting for the largest median family size of 4 persons per family. On the other hand, married-couple families (14 | 50.0%) represent the smallest median family size with 2.21 persons per family.
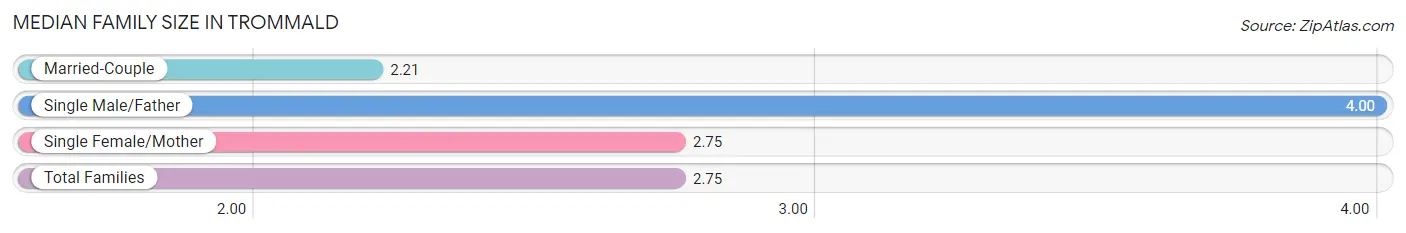
| Family Type | # Families | Family Size |
| Married-Couple | 14 (50.0%) | 2.21 |
| Single Male/Father | 6 (21.4%) | 4.00 |
| Single Female/Mother | 8 (28.6%) | 2.75 |
| Total Families | 28 (100.0%) | 2.75 |
Median Household Size in Trommald
The median household size in Trommald is 2.59 persons per household, with single male/father households (6 | 14.6%) accounting for the largest median household size of 5.33 persons per household. non-family households (13 | 31.7%) represent the smallest median household size with 1.08 persons per household.
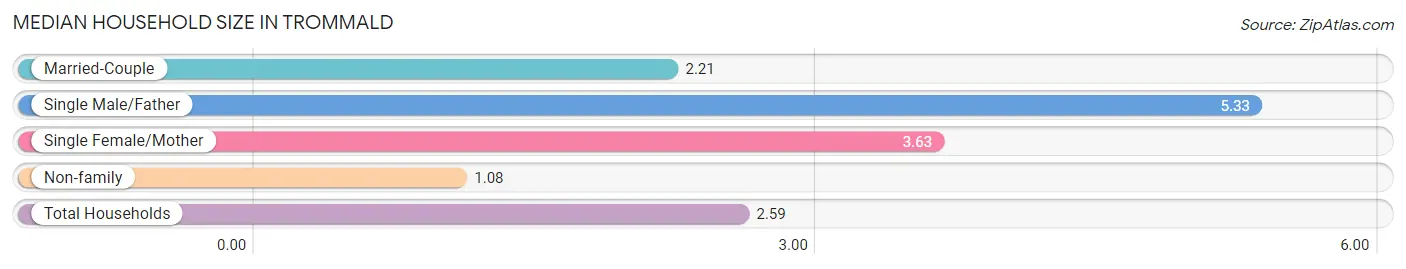
| Household Type | # Households | Household Size |
| Married-Couple | 14 (34.2%) | 2.21 |
| Single Male/Father | 6 (14.6%) | 5.33 |
| Single Female/Mother | 8 (19.5%) | 3.63 |
| Non-family | 13 (31.7%) | 1.08 |
| Total Households | 41 (100.0%) | 2.59 |
Household Size by Marriage Status in Trommald
Out of a total of 41 households in Trommald, 28 (68.3%) are family households, while 13 (31.7%) are nonfamily households. The most numerous type of family households are 2-person households, comprising 14, and the most common type of nonfamily households are 1-person households, comprising 12.
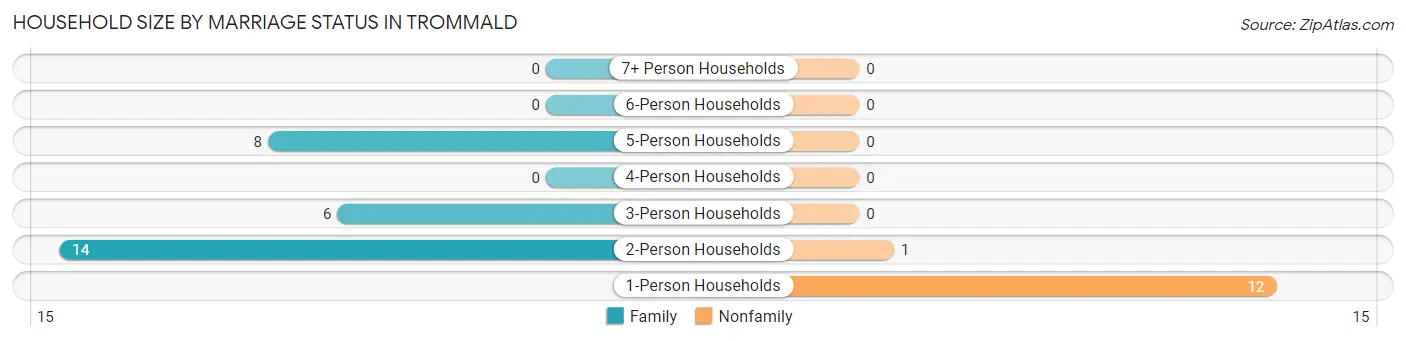
| Household Size | Family Households | Nonfamily Households |
| 1-Person Households | - | 12 (29.3%) |
| 2-Person Households | 14 (34.2%) | 1 (2.4%) |
| 3-Person Households | 6 (14.6%) | 0 (0.0%) |
| 4-Person Households | 0 (0.0%) | 0 (0.0%) |
| 5-Person Households | 8 (19.5%) | 0 (0.0%) |
| 6-Person Households | 0 (0.0%) | 0 (0.0%) |
| 7+ Person Households | 0 (0.0%) | 0 (0.0%) |
| Total | 28 (68.3%) | 13 (31.7%) |
Female Fertility in Trommald
Fertility by Age in Trommald
Average fertility rate in Trommald is 238.0 births per 1,000 women. Women in the age bracket of 20 to 34 years have the highest fertility rate with 556.0 births per 1,000 women. Women in the age bracket of 20 to 34 years acount for 100.0% of all women with births.
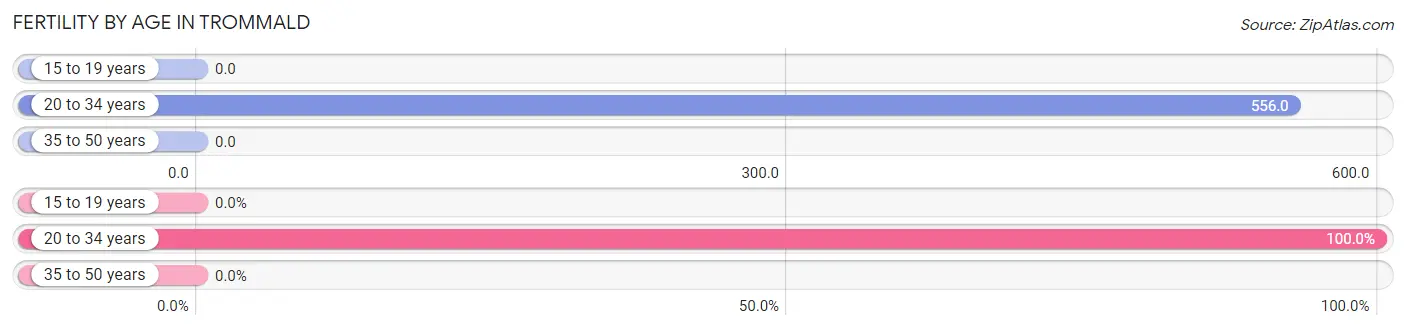
| Age Bracket | Women with Births | Births / 1,000 Women |
| 15 to 19 years | 0 (0.0%) | 0.0 |
| 20 to 34 years | 5 (100.0%) | 556.0 |
| 35 to 50 years | 0 (0.0%) | 0.0 |
| Total | 5 (100.0%) | 238.0 |
Fertility by Age by Marriage Status in Trommald
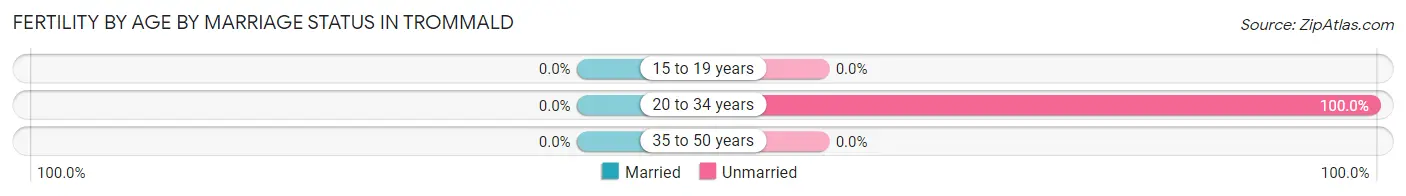
| Age Bracket | Married | Unmarried |
| 15 to 19 years | 0 (0.0%) | 0 (0.0%) |
| 20 to 34 years | 0 (0.0%) | 5 (100.0%) |
| 35 to 50 years | 0 (0.0%) | 0 (0.0%) |
| Total | 0 (0.0%) | 5 (100.0%) |
Fertility by Education in Trommald
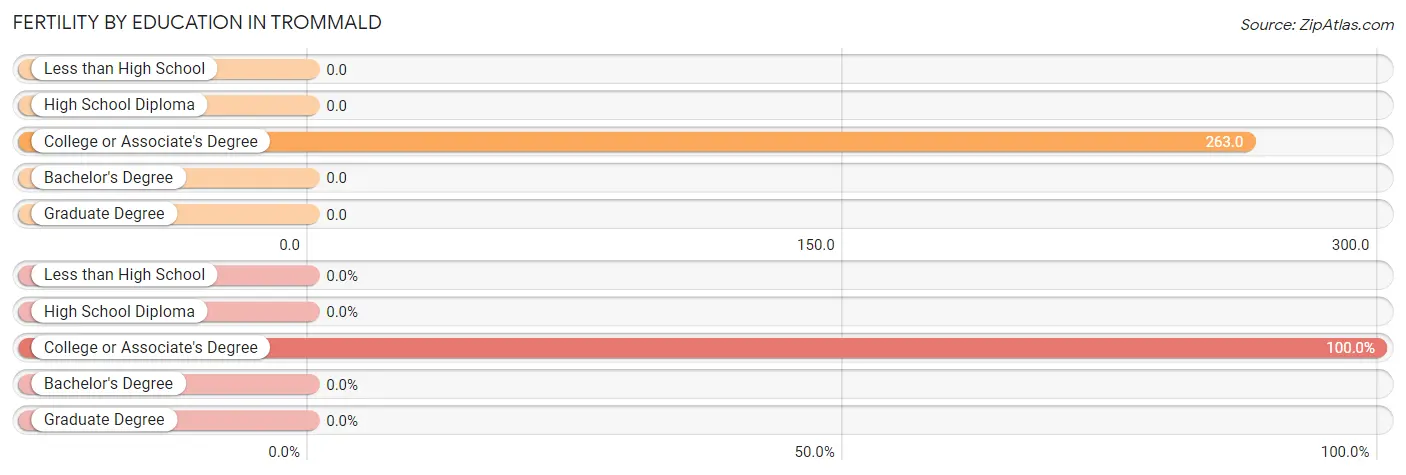
| Educational Attainment | Women with Births | Births / 1,000 Women |
| Less than High School | 0 (0.0%) | 0.0 |
| High School Diploma | 0 (0.0%) | 0.0 |
| College or Associate's Degree | 5 (100.0%) | 263.0 |
| Bachelor's Degree | 0 (0.0%) | 0.0 |
| Graduate Degree | 0 (0.0%) | 0.0 |
| Total | 5 (100.0%) | 238.0 |
Fertility by Education by Marriage Status in Trommald
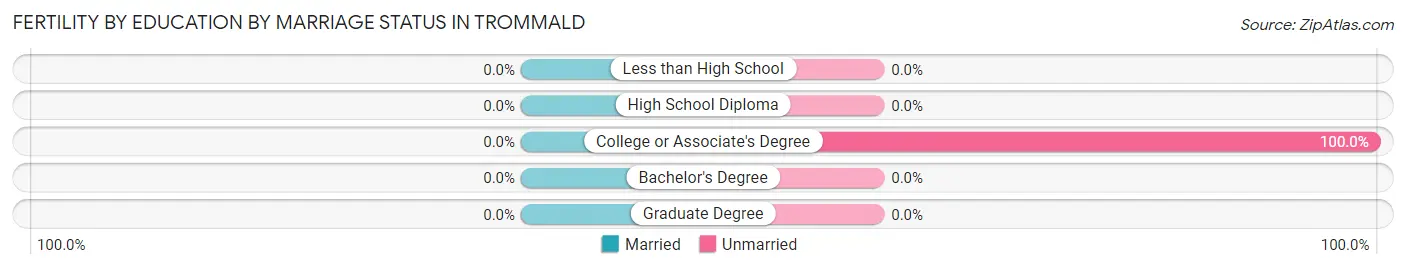
| Educational Attainment | Married | Unmarried |
| Less than High School | 0 (0.0%) | 0 (0.0%) |
| High School Diploma | 0 (0.0%) | 0 (0.0%) |
| College or Associate's Degree | 0 (0.0%) | 5 (100.0%) |
| Bachelor's Degree | 0 (0.0%) | 0 (0.0%) |
| Graduate Degree | 0 (0.0%) | 0 (0.0%) |
| Total | 0 (0.0%) | 5 (100.0%) |
Income in Trommald
Income Overview in Trommald
Per Capita Income in Trommald is $20,366, while median incomes of families and households are $50,357 and $50,729 respectively.
| Characteristic | Number | Measure |
| Per Capita Income | 106 | $20,366 |
| Median Family Income | 28 | $50,357 |
| Mean Family Income | 28 | $46,907 |
| Median Household Income | 41 | $50,729 |
| Mean Household Income | 41 | $49,978 |
| Income Deficit | 28 | $0 |
| Wage / Income Gap (%) | 106 | 0.00% |
| Wage / Income Gap ($) | 106 | 100.00¢ per $1 |
| Gini / Inequality Index | 106 | 0.20 |
Earnings by Sex in Trommald
| Sex | Number | Average Earnings |
| Male | 35 (57.4%) | $0 |
| Female | 26 (42.6%) | $0 |
| Total | 61 (100.0%) | $0 |
Earnings by Sex by Income Bracket in Trommald
The most common earnings brackets in Trommald are $5,000 to $7,499 for men (10 | 28.6%) and $5,000 to $7,499 for women (6 | 23.1%).
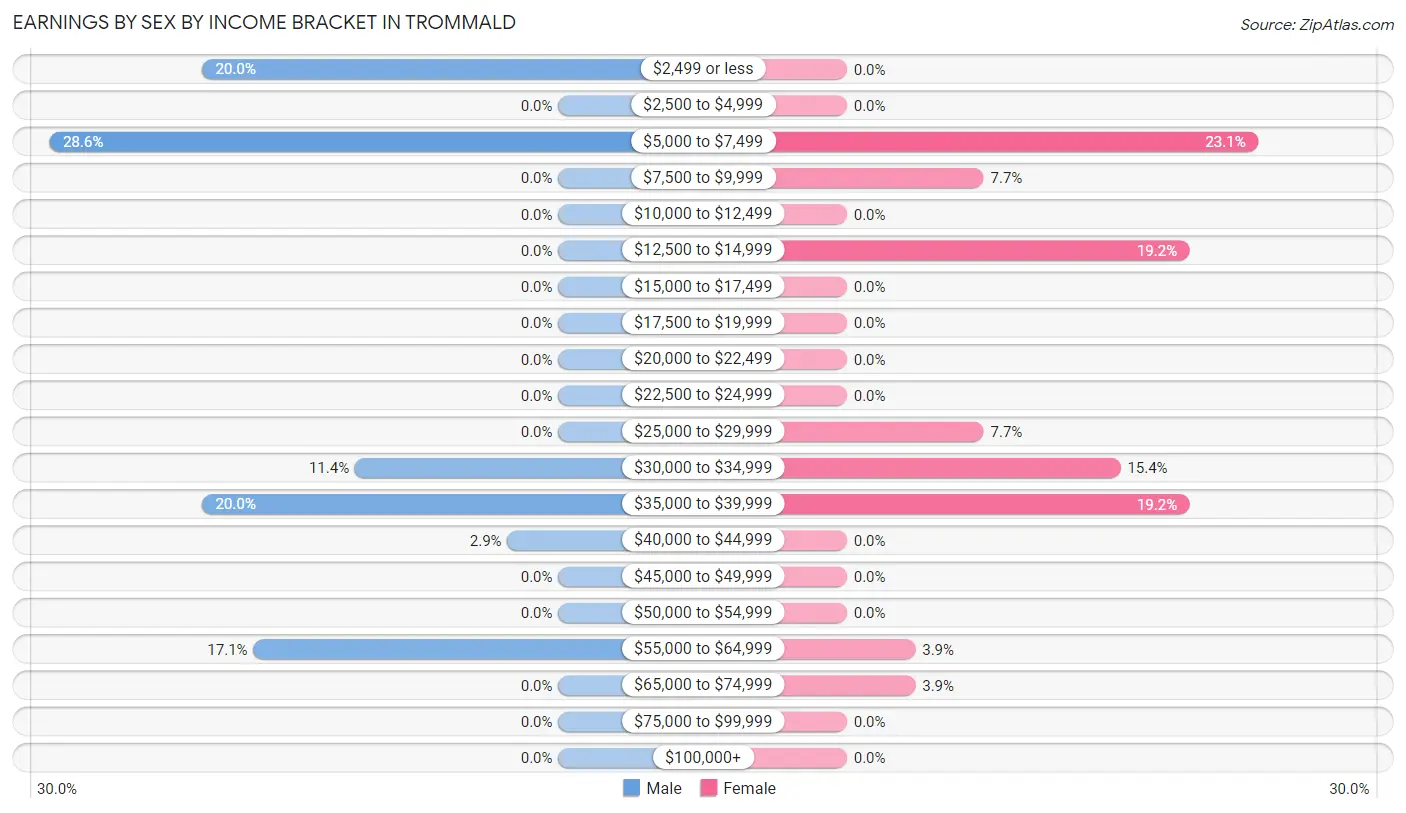
| Income | Male | Female |
| $2,499 or less | 7 (20.0%) | 0 (0.0%) |
| $2,500 to $4,999 | 0 (0.0%) | 0 (0.0%) |
| $5,000 to $7,499 | 10 (28.6%) | 6 (23.1%) |
| $7,500 to $9,999 | 0 (0.0%) | 2 (7.7%) |
| $10,000 to $12,499 | 0 (0.0%) | 0 (0.0%) |
| $12,500 to $14,999 | 0 (0.0%) | 5 (19.2%) |
| $15,000 to $17,499 | 0 (0.0%) | 0 (0.0%) |
| $17,500 to $19,999 | 0 (0.0%) | 0 (0.0%) |
| $20,000 to $22,499 | 0 (0.0%) | 0 (0.0%) |
| $22,500 to $24,999 | 0 (0.0%) | 0 (0.0%) |
| $25,000 to $29,999 | 0 (0.0%) | 2 (7.7%) |
| $30,000 to $34,999 | 4 (11.4%) | 4 (15.4%) |
| $35,000 to $39,999 | 7 (20.0%) | 5 (19.2%) |
| $40,000 to $44,999 | 1 (2.9%) | 0 (0.0%) |
| $45,000 to $49,999 | 0 (0.0%) | 0 (0.0%) |
| $50,000 to $54,999 | 0 (0.0%) | 0 (0.0%) |
| $55,000 to $64,999 | 6 (17.1%) | 1 (3.8%) |
| $65,000 to $74,999 | 0 (0.0%) | 1 (3.8%) |
| $75,000 to $99,999 | 0 (0.0%) | 0 (0.0%) |
| $100,000+ | 0 (0.0%) | 0 (0.0%) |
| Total | 35 (100.0%) | 26 (100.0%) |
Earnings by Sex by Educational Attainment in Trommald
| Educational Attainment | Male Income | Female Income |
| Less than High School | - | - |
| High School Diploma | - | - |
| College or Associate's Degree | - | - |
| Bachelor's Degree | - | - |
| Graduate Degree | - | - |
| Total | - | - |
Family Income in Trommald
Family Income Brackets in Trommald
According to the Trommald family income data, there are 15 families falling into the $50,000 to $74,999 income range, which is the most common income bracket and makes up 53.6% of all families.
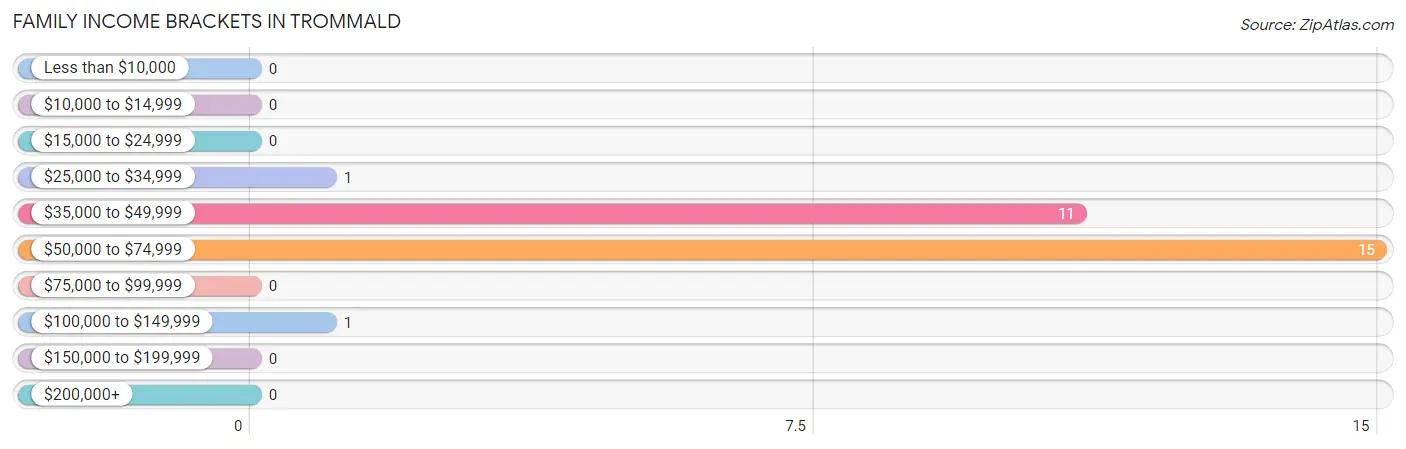
| Income Bracket | # Families | % Families |
| Less than $10,000 | 0 | 0.0% |
| $10,000 to $14,999 | 0 | 0.0% |
| $15,000 to $24,999 | 0 | 0.0% |
| $25,000 to $34,999 | 1 | 3.6% |
| $35,000 to $49,999 | 11 | 39.3% |
| $50,000 to $74,999 | 15 | 53.6% |
| $75,000 to $99,999 | 0 | 0.0% |
| $100,000 to $149,999 | 1 | 3.6% |
| $150,000 to $199,999 | 0 | 0.0% |
| $200,000+ | 0 | 0.0% |
Family Income by Famaliy Size in Trommald
2-person families (19 | 67.9%) account for the highest median family income in Trommald with $50,729 per family, while 2-person families (19 | 67.9%) have the highest median income of $25,364 per family member.
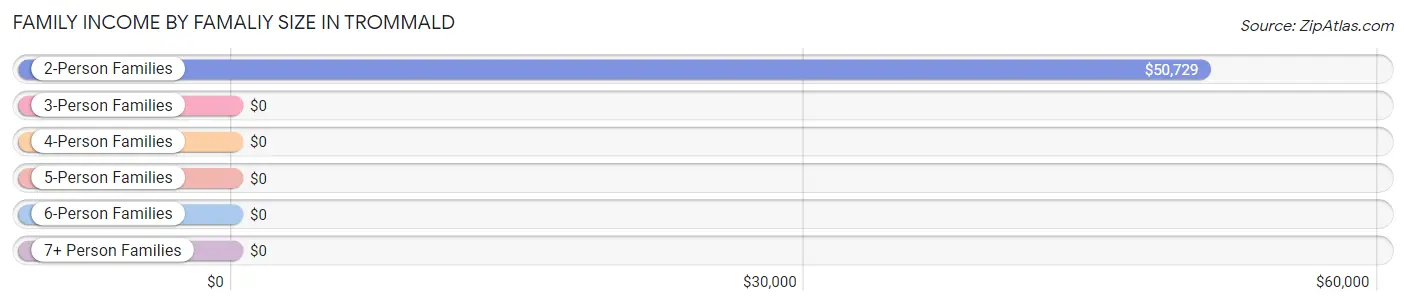
| Income Bracket | # Families | Median Income |
| 2-Person Families | 19 (67.9%) | $50,729 |
| 3-Person Families | 2 (7.1%) | $0 |
| 4-Person Families | 7 (25.0%) | $0 |
| 5-Person Families | 0 (0.0%) | $0 |
| 6-Person Families | 0 (0.0%) | $0 |
| 7+ Person Families | 0 (0.0%) | $0 |
| Total | 28 (100.0%) | $50,357 |
Family Income by Number of Earners in Trommald
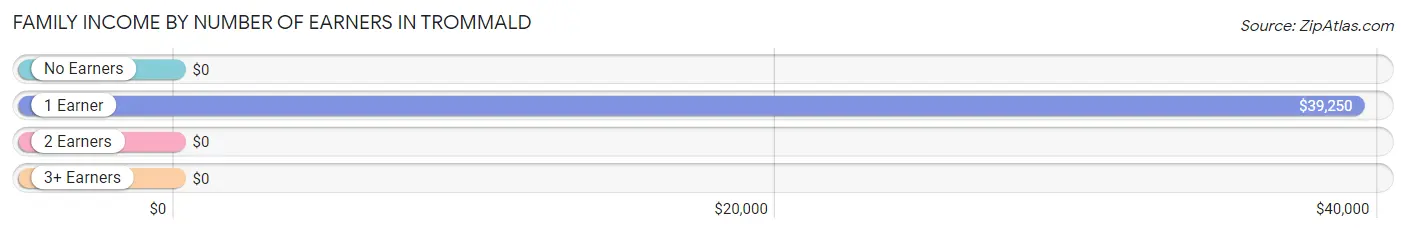
| Number of Earners | # Families | Median Income |
| No Earners | 3 (10.7%) | $0 |
| 1 Earner | 19 (67.9%) | $39,250 |
| 2 Earners | 6 (21.4%) | $0 |
| 3+ Earners | 0 (0.0%) | $0 |
| Total | 28 (100.0%) | $50,357 |
Household Income in Trommald
Household Income Brackets in Trommald
With 21 households falling in the category, the $50,000 to $74,999 income range is the most frequent in Trommald, accounting for 51.2% of all households.
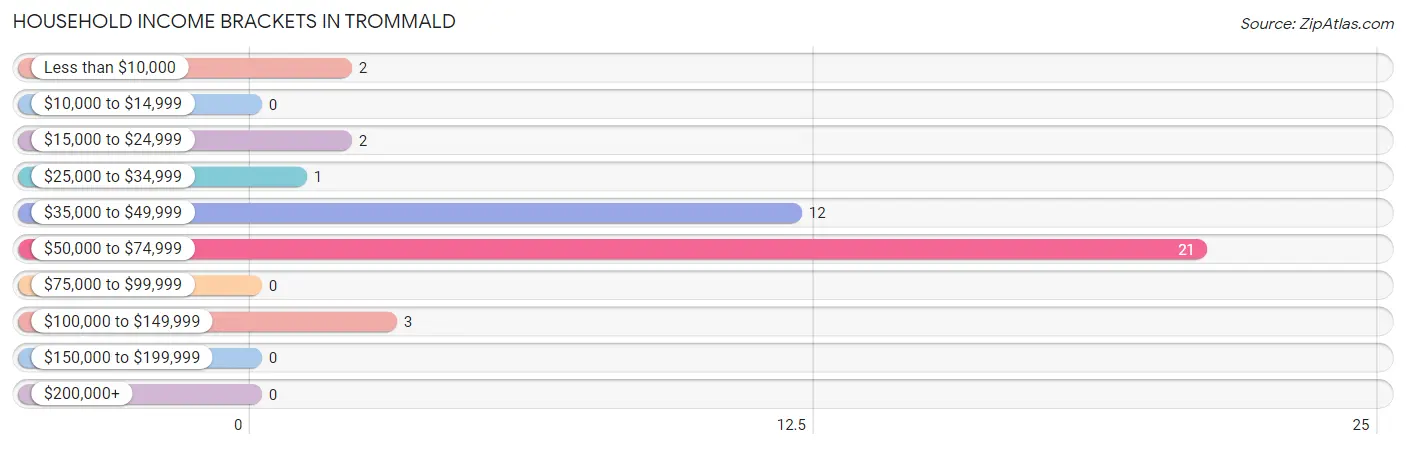
| Income Bracket | # Households | % Households |
| Less than $10,000 | 2 | 4.9% |
| $10,000 to $14,999 | 0 | 0.0% |
| $15,000 to $24,999 | 2 | 4.9% |
| $25,000 to $34,999 | 1 | 2.4% |
| $35,000 to $49,999 | 12 | 29.3% |
| $50,000 to $74,999 | 21 | 51.2% |
| $75,000 to $99,999 | 0 | 0.0% |
| $100,000 to $149,999 | 3 | 7.3% |
| $150,000 to $199,999 | 0 | 0.0% |
| $200,000+ | 0 | 0.0% |
Household Income by Householder Age in Trommald
The median household income in Trommald is $50,729, with the highest median household income of $51,875 found in the 65+ years age bracket for the primary householder. A total of 7 households (17.1%) fall into this category. Meanwhile, the 15 to 24 years age bracket for the primary householder has the lowest median household income of $0, with 6 households (14.6%) in this group.
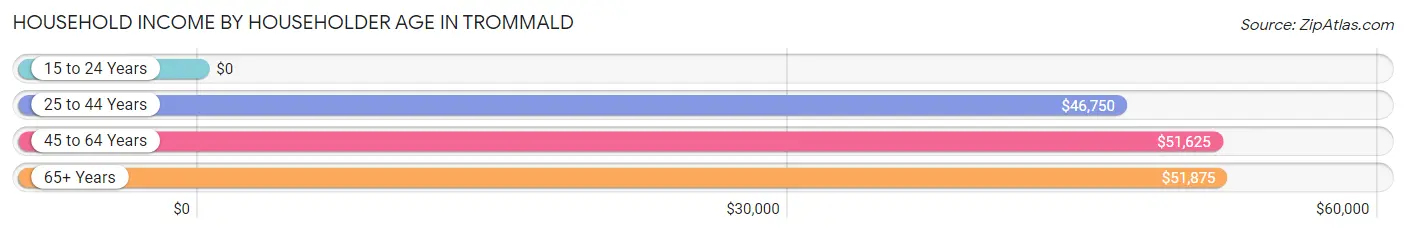
| Income Bracket | # Households | Median Income |
| 15 to 24 Years | 6 (14.6%) | $0 |
| 25 to 44 Years | 15 (36.6%) | $46,750 |
| 45 to 64 Years | 13 (31.7%) | $51,625 |
| 65+ Years | 7 (17.1%) | $51,875 |
| Total | 41 (100.0%) | $50,729 |
Poverty in Trommald
Income Below Poverty by Sex and Age in Trommald
With 13.2% poverty level for males and 15.4% for females among the residents of Trommald, 25 to 34 year old males and 35 to 44 year old females are the most vulnerable to poverty, with 5 males (100.0%) and 8 females (72.7%) in their respective age groups living below the poverty level.
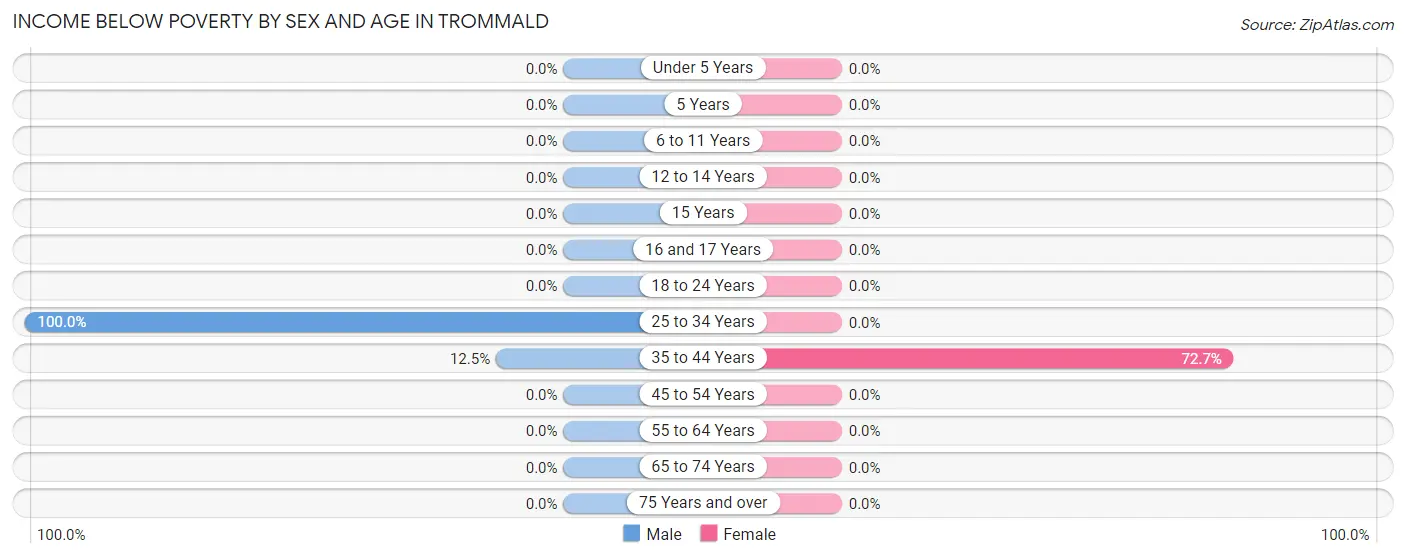
| Age Bracket | Male | Female |
| Under 5 Years | 0 (0.0%) | 0 (0.0%) |
| 5 Years | 0 (0.0%) | 0 (0.0%) |
| 6 to 11 Years | 0 (0.0%) | 0 (0.0%) |
| 12 to 14 Years | 0 (0.0%) | 0 (0.0%) |
| 15 Years | 0 (0.0%) | 0 (0.0%) |
| 16 and 17 Years | 0 (0.0%) | 0 (0.0%) |
| 18 to 24 Years | 0 (0.0%) | 0 (0.0%) |
| 25 to 34 Years | 5 (100.0%) | 0 (0.0%) |
| 35 to 44 Years | 2 (12.5%) | 8 (72.7%) |
| 45 to 54 Years | 0 (0.0%) | 0 (0.0%) |
| 55 to 64 Years | 0 (0.0%) | 0 (0.0%) |
| 65 to 74 Years | 0 (0.0%) | 0 (0.0%) |
| 75 Years and over | 0 (0.0%) | 0 (0.0%) |
| Total | 7 (13.2%) | 8 (15.4%) |
Income Above Poverty by Sex and Age in Trommald
According to the poverty statistics in Trommald, males aged 6 to 11 years and females aged under 5 years are the age groups that are most secure financially, with 100.0% of males and 100.0% of females in these age groups living above the poverty line.
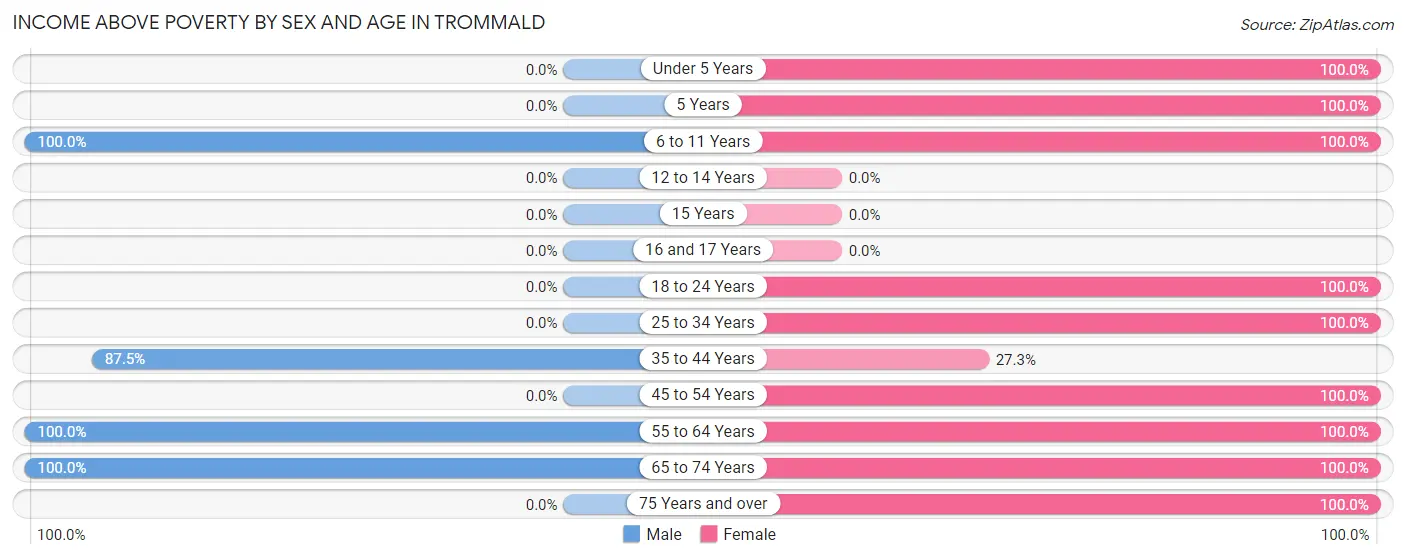
| Age Bracket | Male | Female |
| Under 5 Years | 0 (0.0%) | 4 (100.0%) |
| 5 Years | 0 (0.0%) | 3 (100.0%) |
| 6 to 11 Years | 14 (100.0%) | 8 (100.0%) |
| 12 to 14 Years | 0 (0.0%) | 0 (0.0%) |
| 15 Years | 0 (0.0%) | 0 (0.0%) |
| 16 and 17 Years | 0 (0.0%) | 0 (0.0%) |
| 18 to 24 Years | 0 (0.0%) | 6 (100.0%) |
| 25 to 34 Years | 0 (0.0%) | 3 (100.0%) |
| 35 to 44 Years | 14 (87.5%) | 3 (27.3%) |
| 45 to 54 Years | 0 (0.0%) | 6 (100.0%) |
| 55 to 64 Years | 8 (100.0%) | 7 (100.0%) |
| 65 to 74 Years | 10 (100.0%) | 1 (100.0%) |
| 75 Years and over | 0 (0.0%) | 3 (100.0%) |
| Total | 46 (86.8%) | 44 (84.6%) |
Income Below Poverty Among Married-Couple Families in Trommald

| Children | Above Poverty | Below Poverty |
| No Children | 14 (100.0%) | 0 (0.0%) |
| 1 or 2 Children | 0 (0.0%) | 0 (0.0%) |
| 3 or 4 Children | 0 (0.0%) | 0 (0.0%) |
| 5 or more Children | 0 (0.0%) | 0 (0.0%) |
| Total | 14 (100.0%) | 0 (0.0%) |
Income Below Poverty Among Single-Parent Households in Trommald
| Children | Single Father | Single Mother |
| No Children | 0 (0.0%) | 0 (0.0%) |
| 1 or 2 Children | 0 (0.0%) | 0 (0.0%) |
| 3 or 4 Children | 0 (0.0%) | 0 (0.0%) |
| 5 or more Children | 0 (0.0%) | 0 (0.0%) |
| Total | 0 (0.0%) | 0 (0.0%) |
Income Below Poverty Among Married-Couple vs Single-Parent Households in Trommald
| Children | Married-Couple Families | Single-Parent Households |
| No Children | 0 (0.0%) | 0 (0.0%) |
| 1 or 2 Children | 0 (0.0%) | 0 (0.0%) |
| 3 or 4 Children | 0 (0.0%) | 0 (0.0%) |
| 5 or more Children | 0 (0.0%) | 0 (0.0%) |
| Total | 0 (0.0%) | 0 (0.0%) |
Employment Characteristics in Trommald
Employment by Class of Employer in Trommald
Among the 44 employed individuals in Trommald, private company employees (28 | 63.6%), not-for-profit organizations (5 | 11.4%), and self-employed (not incorporated) (4 | 9.1%) make up the most common classes of employment.
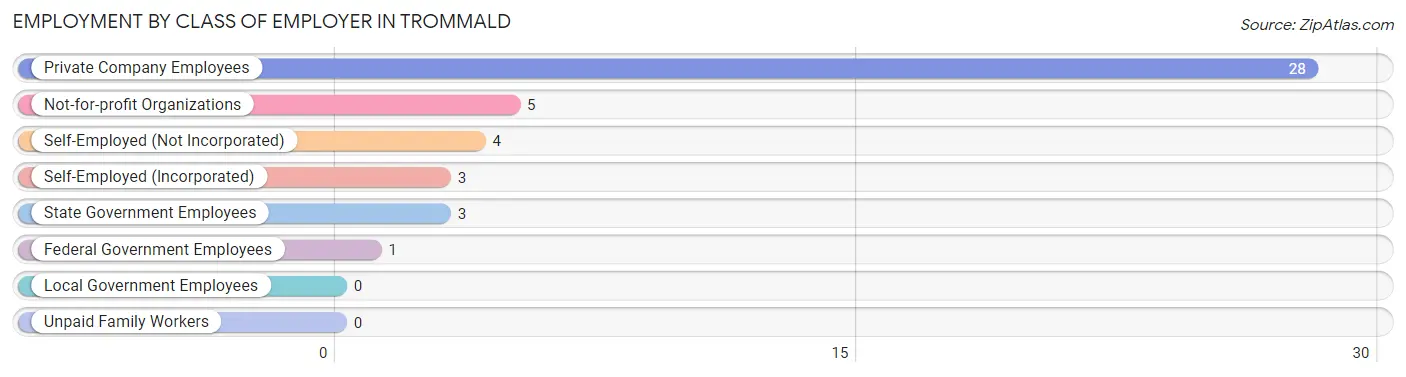
| Employer Class | # Employees | % Employees |
| Private Company Employees | 28 | 63.6% |
| Self-Employed (Incorporated) | 3 | 6.8% |
| Self-Employed (Not Incorporated) | 4 | 9.1% |
| Not-for-profit Organizations | 5 | 11.4% |
| Local Government Employees | 0 | 0.0% |
| State Government Employees | 3 | 6.8% |
| Federal Government Employees | 1 | 2.3% |
| Unpaid Family Workers | 0 | 0.0% |
| Total | 44 | 100.0% |
Employment Status by Age in Trommald
According to the labor force statistics for Trommald, out of the total population over 16 years of age (76), 80.3% or 61 individuals are in the labor force, with 26.2% or 16 of them unemployed. The age group with the highest labor force participation rate is 20 to 24 years, with 100.0% or 6 individuals in the labor force. Within the labor force, the 55 to 59 years age range has the highest percentage of unemployed individuals, with 100.0% or 5 of them being unemployed.
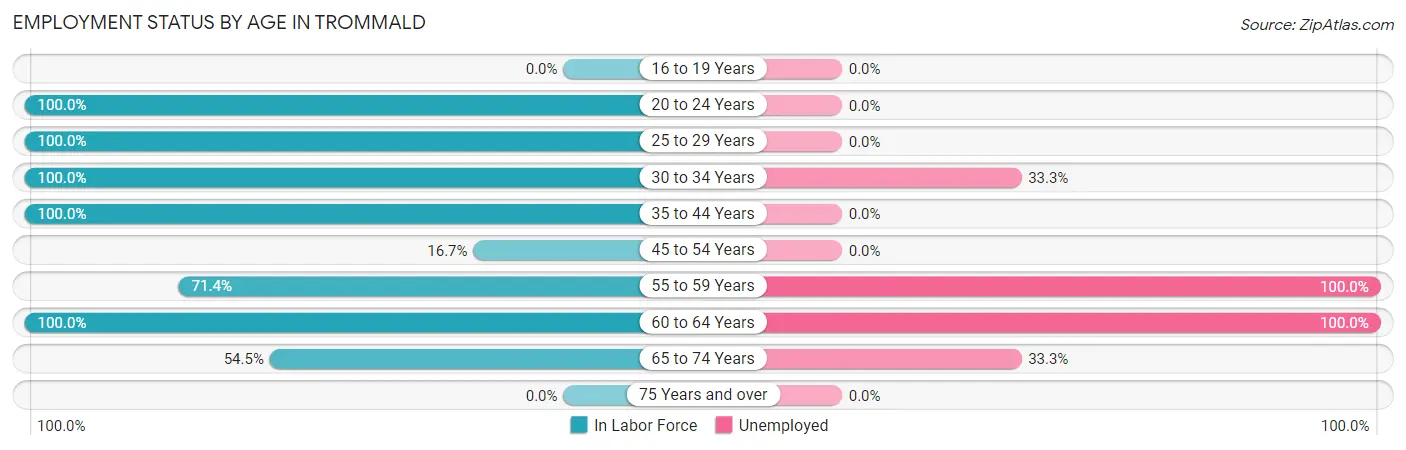
| Age Bracket | In Labor Force | Unemployed |
| 16 to 19 Years | 0 (0.0%) | 0 (0.0%) |
| 20 to 24 Years | 6 (100.0%) | 0 (0.0%) |
| 25 to 29 Years | 5 (100.0%) | 0 (0.0%) |
| 30 to 34 Years | 3 (100.0%) | 1 (33.3%) |
| 35 to 44 Years | 27 (100.0%) | 0 (0.0%) |
| 45 to 54 Years | 1 (16.7%) | 0 (0.0%) |
| 55 to 59 Years | 5 (71.4%) | 5 (100.0%) |
| 60 to 64 Years | 8 (100.0%) | 8 (100.0%) |
| 65 to 74 Years | 6 (54.5%) | 2 (33.3%) |
| 75 Years and over | 0 (0.0%) | 0 (0.0%) |
| Total | 61 (80.3%) | 16 (26.2%) |
Employment Status by Educational Attainment in Trommald
According to labor force statistics for Trommald, 87.5% of individuals (49) out of the total population between 25 and 64 years of age (56) are in the labor force, with 28.6% or 14 of them being unemployed. The group with the highest labor force participation rate are those with the educational attainment of college / associate degree, with 100.0% or 19 individuals in the labor force. Within the labor force, individuals with high school diploma education have the highest percentage of unemployment, with 50.0% or 13 of them being unemployed.
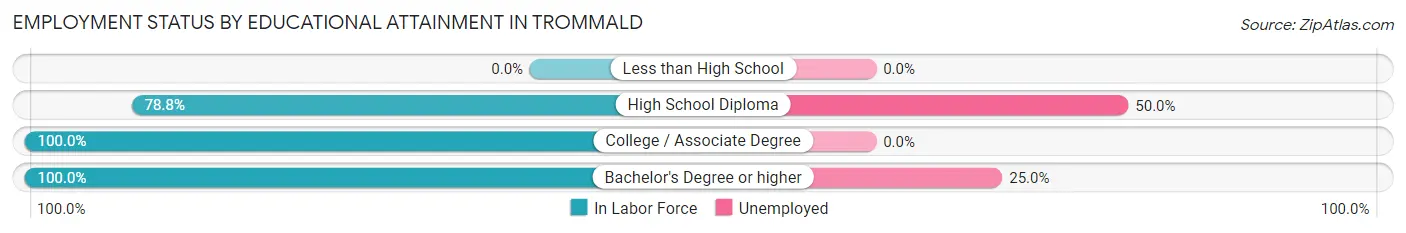
| Educational Attainment | In Labor Force | Unemployed |
| Less than High School | 0 (0.0%) | 0 (0.0%) |
| High School Diploma | 26 (78.8%) | 16 (50.0%) |
| College / Associate Degree | 19 (100.0%) | 0 (0.0%) |
| Bachelor's Degree or higher | 4 (100.0%) | 1 (25.0%) |
| Total | 49 (87.5%) | 16 (28.6%) |
Employment Occupations by Sex in Trommald
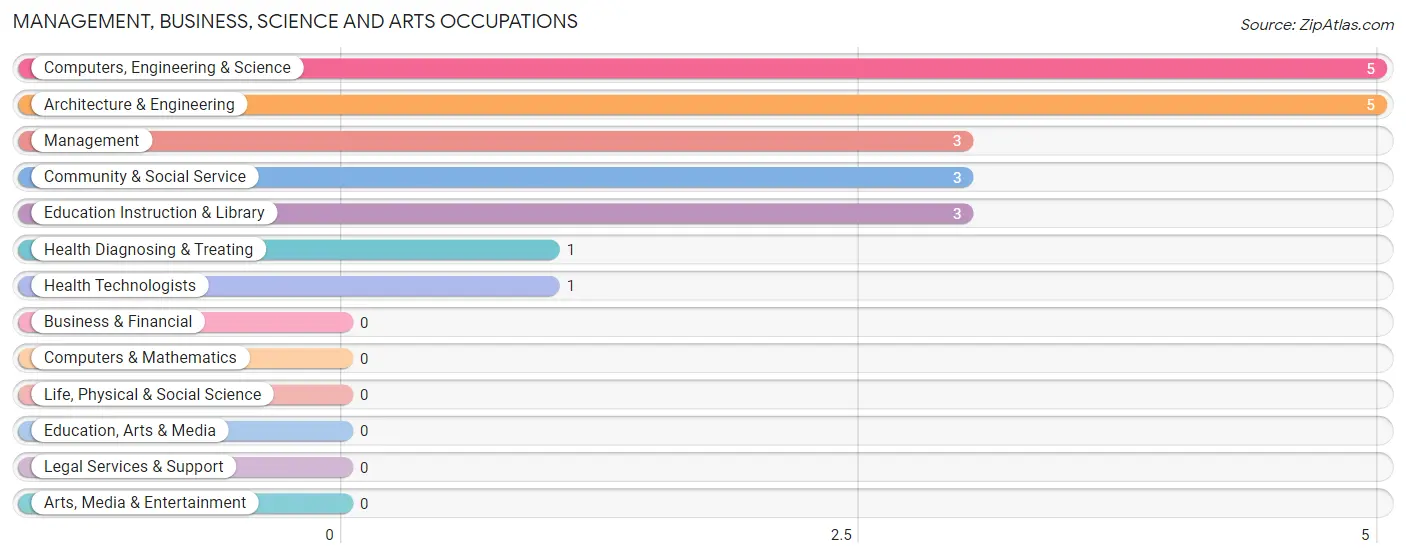
Management, Business, Science and Arts Occupations
The most common Management, Business, Science and Arts occupations in Trommald are Computers, Engineering & Science (5 | 11.1%), Architecture & Engineering (5 | 11.1%), Management (3 | 6.7%), Community & Social Service (3 | 6.7%), and Education Instruction & Library (3 | 6.7%).
Management, Business, Science and Arts Occupations by Sex
Within the Management, Business, Science and Arts occupations in Trommald, the most male-oriented occupations are Computers, Engineering & Science (100.0%), Architecture & Engineering (100.0%), and Management (33.3%), while the most female-oriented occupations are Community & Social Service (100.0%), Education Instruction & Library (100.0%), and Health Diagnosing & Treating (100.0%).
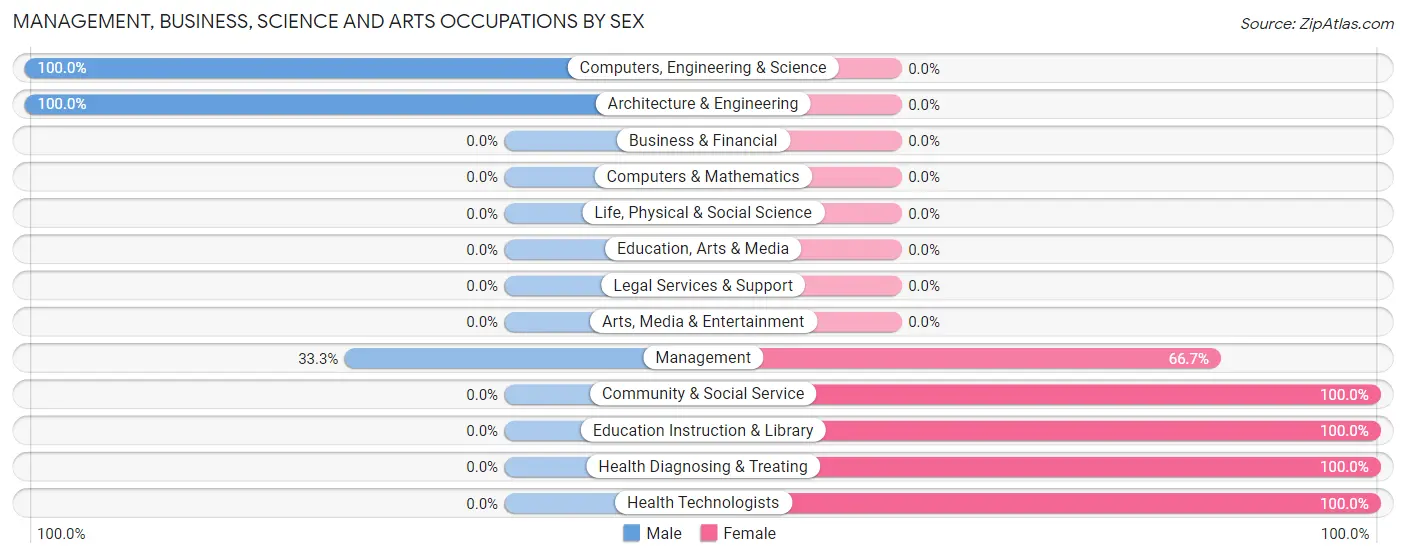
| Occupation | Male | Female |
| Management | 1 (33.3%) | 2 (66.7%) |
| Business & Financial | 0 (0.0%) | 0 (0.0%) |
| Computers, Engineering & Science | 5 (100.0%) | 0 (0.0%) |
| Computers & Mathematics | 0 (0.0%) | 0 (0.0%) |
| Architecture & Engineering | 5 (100.0%) | 0 (0.0%) |
| Life, Physical & Social Science | 0 (0.0%) | 0 (0.0%) |
| Community & Social Service | 0 (0.0%) | 3 (100.0%) |
| Education, Arts & Media | 0 (0.0%) | 0 (0.0%) |
| Legal Services & Support | 0 (0.0%) | 0 (0.0%) |
| Education Instruction & Library | 0 (0.0%) | 3 (100.0%) |
| Arts, Media & Entertainment | 0 (0.0%) | 0 (0.0%) |
| Health Diagnosing & Treating | 0 (0.0%) | 1 (100.0%) |
| Health Technologists | 0 (0.0%) | 1 (100.0%) |
| Total (Category) | 6 (50.0%) | 6 (50.0%) |
| Total (Overall) | 25 (55.6%) | 20 (44.4%) |
Services Occupations
The most common Services occupations in Trommald are Food Preparation & Serving (7 | 15.6%), and Cleaning & Maintenance (1 | 2.2%).
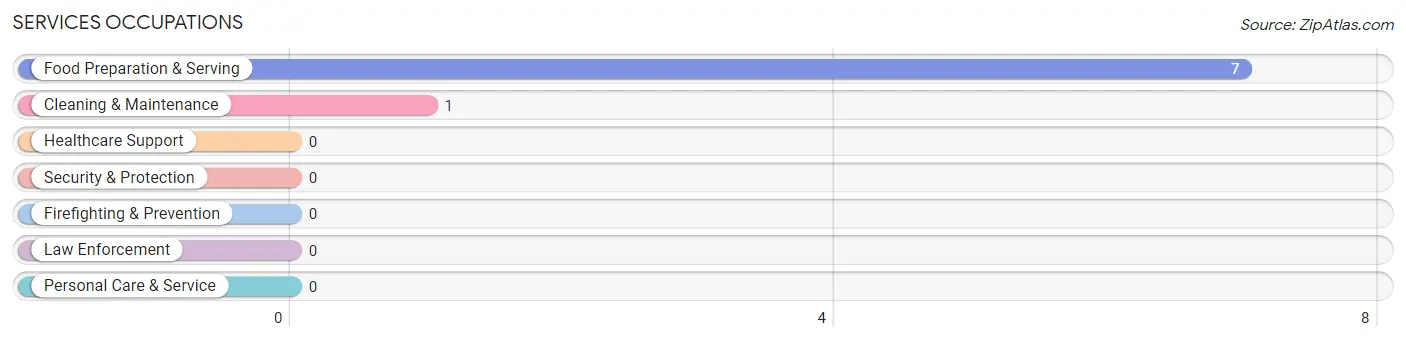
Services Occupations by Sex
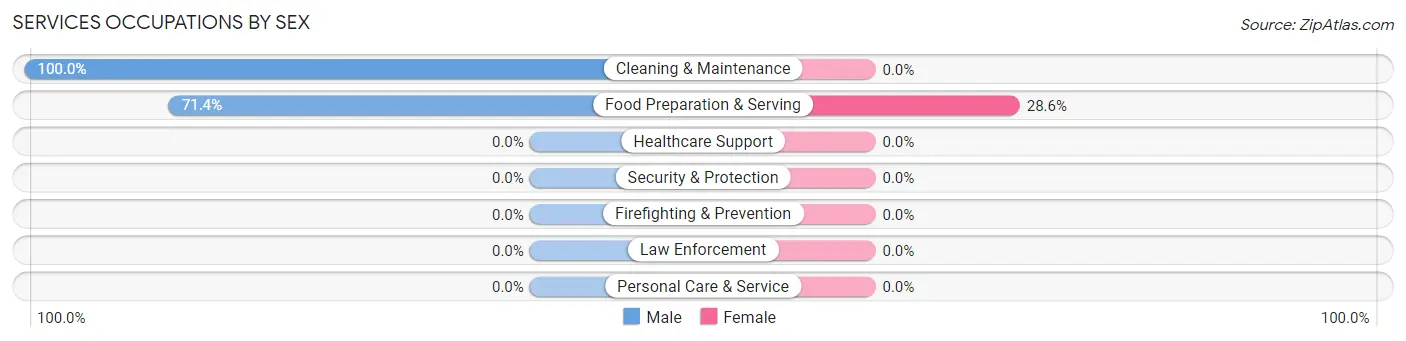
| Occupation | Male | Female |
| Healthcare Support | 0 (0.0%) | 0 (0.0%) |
| Security & Protection | 0 (0.0%) | 0 (0.0%) |
| Firefighting & Prevention | 0 (0.0%) | 0 (0.0%) |
| Law Enforcement | 0 (0.0%) | 0 (0.0%) |
| Food Preparation & Serving | 5 (71.4%) | 2 (28.6%) |
| Cleaning & Maintenance | 1 (100.0%) | 0 (0.0%) |
| Personal Care & Service | 0 (0.0%) | 0 (0.0%) |
| Total (Category) | 6 (75.0%) | 2 (25.0%) |
| Total (Overall) | 25 (55.6%) | 20 (44.4%) |
Sales and Office Occupations
The most common Sales and Office occupations in Trommald are , and Office & Administration (5 | 11.1%).
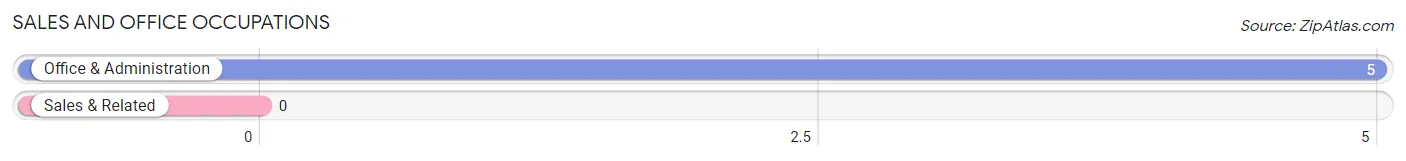
Sales and Office Occupations by Sex
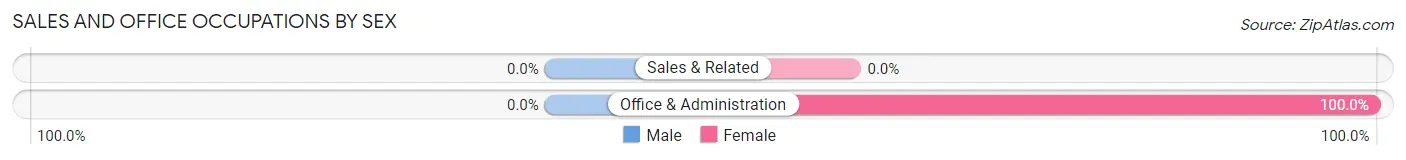
| Occupation | Male | Female |
| Sales & Related | 0 (0.0%) | 0 (0.0%) |
| Office & Administration | 0 (0.0%) | 5 (100.0%) |
| Total (Category) | 0 (0.0%) | 5 (100.0%) |
| Total (Overall) | 25 (55.6%) | 20 (44.4%) |
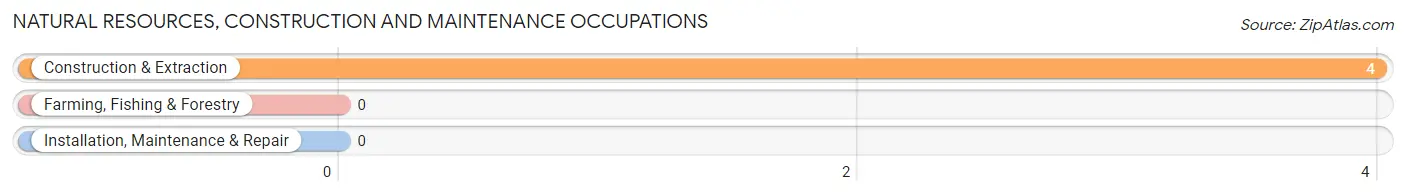
Natural Resources, Construction and Maintenance Occupations
The most common Natural Resources, Construction and Maintenance occupations in Trommald are , and Construction & Extraction (4 | 8.9%).
Natural Resources, Construction and Maintenance Occupations by Sex
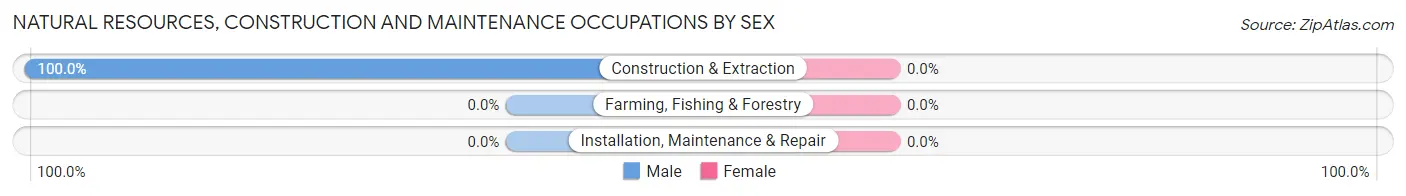
| Occupation | Male | Female |
| Farming, Fishing & Forestry | 0 (0.0%) | 0 (0.0%) |
| Construction & Extraction | 4 (100.0%) | 0 (0.0%) |
| Installation, Maintenance & Repair | 0 (0.0%) | 0 (0.0%) |
| Total (Category) | 4 (100.0%) | 0 (0.0%) |
| Total (Overall) | 25 (55.6%) | 20 (44.4%) |
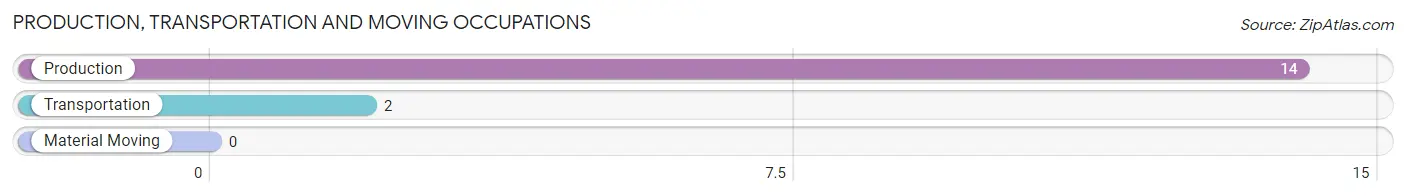
Production, Transportation and Moving Occupations
The most common Production, Transportation and Moving occupations in Trommald are Production (14 | 31.1%), and Transportation (2 | 4.4%).
Production, Transportation and Moving Occupations by Sex
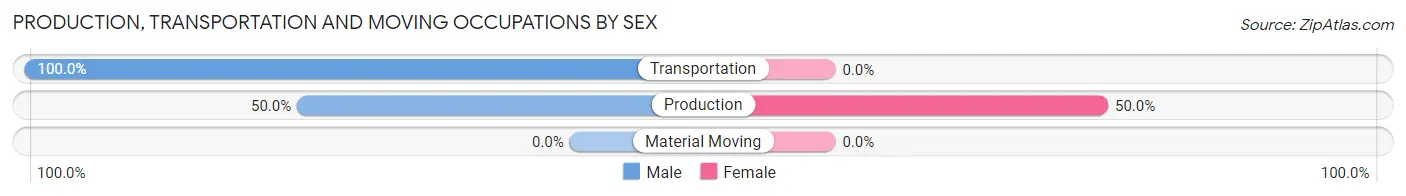
| Occupation | Male | Female |
| Production | 7 (50.0%) | 7 (50.0%) |
| Transportation | 2 (100.0%) | 0 (0.0%) |
| Material Moving | 0 (0.0%) | 0 (0.0%) |
| Total (Category) | 9 (56.2%) | 7 (43.8%) |
| Total (Overall) | 25 (55.6%) | 20 (44.4%) |
Employment Industries by Sex in Trommald
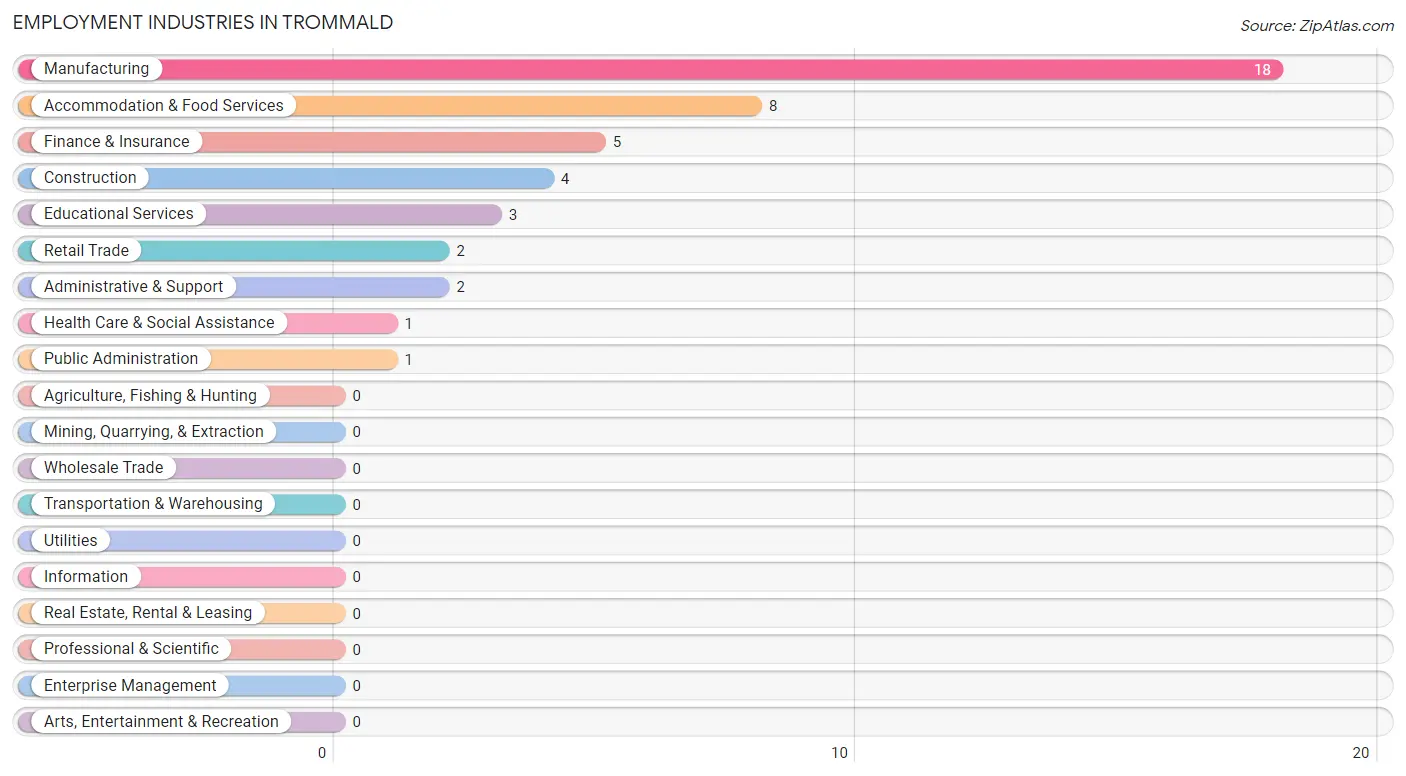
Employment Industries in Trommald
The major employment industries in Trommald include Manufacturing (18 | 40.0%), Accommodation & Food Services (8 | 17.8%), Finance & Insurance (5 | 11.1%), Construction (4 | 8.9%), and Educational Services (3 | 6.7%).
Employment Industries by Sex in Trommald
The Trommald industries that see more men than women are Construction (100.0%), Retail Trade (100.0%), and Public Administration (100.0%), whereas the industries that tend to have a higher number of women are Finance & Insurance (100.0%), Educational Services (100.0%), and Health Care & Social Assistance (100.0%).
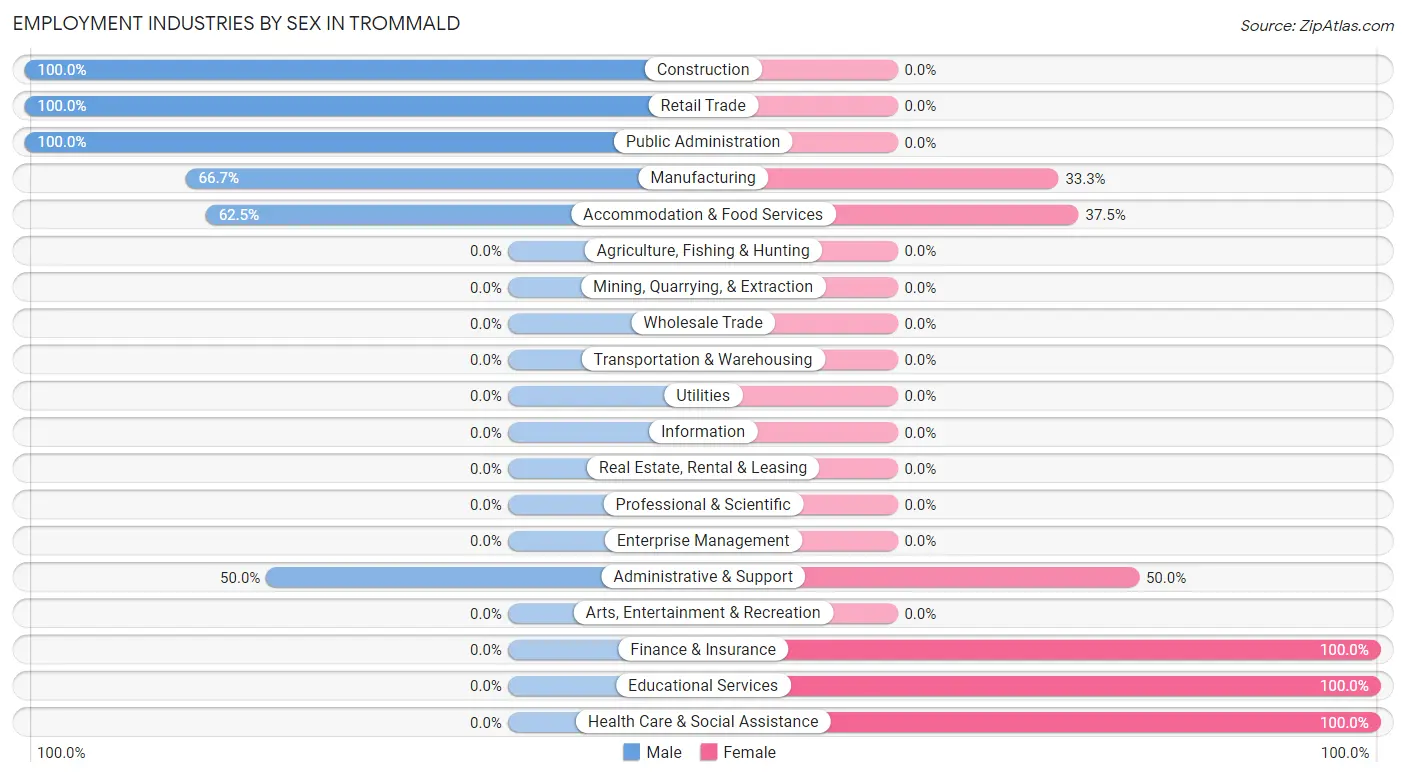
| Industry | Male | Female |
| Agriculture, Fishing & Hunting | 0 (0.0%) | 0 (0.0%) |
| Mining, Quarrying, & Extraction | 0 (0.0%) | 0 (0.0%) |
| Construction | 4 (100.0%) | 0 (0.0%) |
| Manufacturing | 12 (66.7%) | 6 (33.3%) |
| Wholesale Trade | 0 (0.0%) | 0 (0.0%) |
| Retail Trade | 2 (100.0%) | 0 (0.0%) |
| Transportation & Warehousing | 0 (0.0%) | 0 (0.0%) |
| Utilities | 0 (0.0%) | 0 (0.0%) |
| Information | 0 (0.0%) | 0 (0.0%) |
| Finance & Insurance | 0 (0.0%) | 5 (100.0%) |
| Real Estate, Rental & Leasing | 0 (0.0%) | 0 (0.0%) |
| Professional & Scientific | 0 (0.0%) | 0 (0.0%) |
| Enterprise Management | 0 (0.0%) | 0 (0.0%) |
| Administrative & Support | 1 (50.0%) | 1 (50.0%) |
| Educational Services | 0 (0.0%) | 3 (100.0%) |
| Health Care & Social Assistance | 0 (0.0%) | 1 (100.0%) |
| Arts, Entertainment & Recreation | 0 (0.0%) | 0 (0.0%) |
| Accommodation & Food Services | 5 (62.5%) | 3 (37.5%) |
| Public Administration | 1 (100.0%) | 0 (0.0%) |
| Total | 25 (55.6%) | 20 (44.4%) |
Education in Trommald
School Enrollment in Trommald
The most common levels of schooling among the 28 students in Trommald are elementary school (14 | 50.0%), middle school (8 | 28.6%), and nursery / preschool (3 | 10.7%).
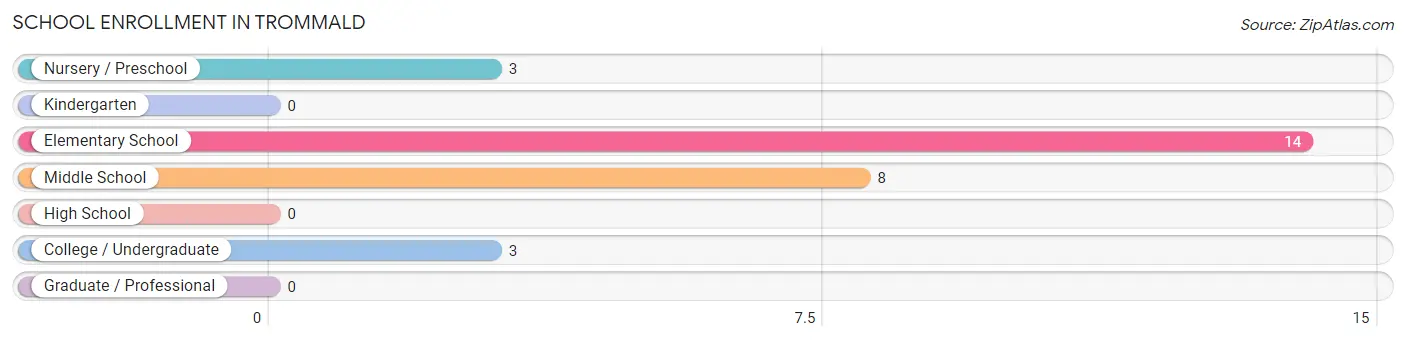
| School Level | # Students | % Students |
| Nursery / Preschool | 3 | 10.7% |
| Kindergarten | 0 | 0.0% |
| Elementary School | 14 | 50.0% |
| Middle School | 8 | 28.6% |
| High School | 0 | 0.0% |
| College / Undergraduate | 3 | 10.7% |
| Graduate / Professional | 0 | 0.0% |
| Total | 28 | 100.0% |
School Enrollment by Age by Funding Source in Trommald
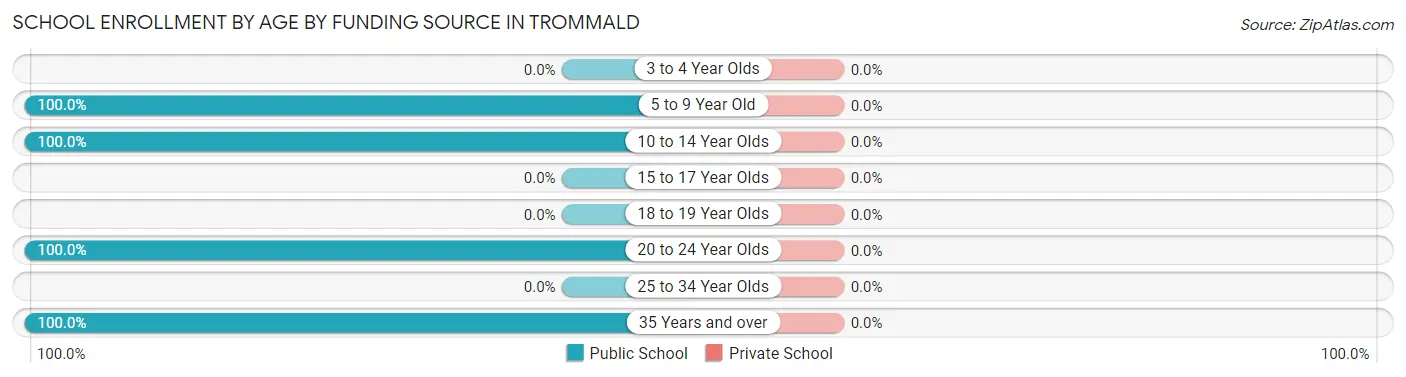
| Age Bracket | Public School | Private School |
| 3 to 4 Year Olds | 0 (0.0%) | 0 (0.0%) |
| 5 to 9 Year Old | 11 (100.0%) | 0 (0.0%) |
| 10 to 14 Year Olds | 14 (100.0%) | 0 (0.0%) |
| 15 to 17 Year Olds | 0 (0.0%) | 0 (0.0%) |
| 18 to 19 Year Olds | 0 (0.0%) | 0 (0.0%) |
| 20 to 24 Year Olds | 1 (100.0%) | 0 (0.0%) |
| 25 to 34 Year Olds | 0 (0.0%) | 0 (0.0%) |
| 35 Years and over | 2 (100.0%) | 0 (0.0%) |
| Total | 28 (100.0%) | 0 (0.0%) |
Educational Attainment by Field of Study in Trommald
Arts & humanities (3 | 75.0%), and science & technology (1 | 25.0%) are the most common fields of study among 4 individuals in Trommald who have obtained a bachelor's degree or higher.
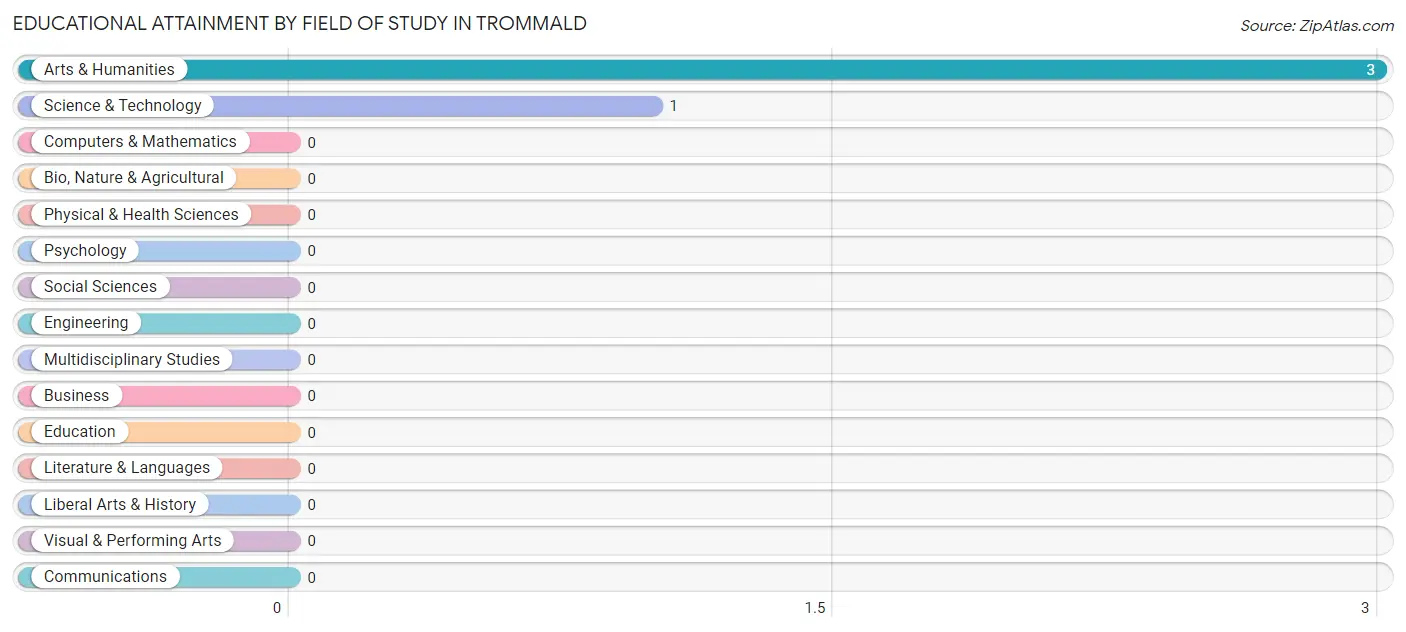
| Field of Study | # Graduates | % Graduates |
| Computers & Mathematics | 0 | 0.0% |
| Bio, Nature & Agricultural | 0 | 0.0% |
| Physical & Health Sciences | 0 | 0.0% |
| Psychology | 0 | 0.0% |
| Social Sciences | 0 | 0.0% |
| Engineering | 0 | 0.0% |
| Multidisciplinary Studies | 0 | 0.0% |
| Science & Technology | 1 | 25.0% |
| Business | 0 | 0.0% |
| Education | 0 | 0.0% |
| Literature & Languages | 0 | 0.0% |
| Liberal Arts & History | 0 | 0.0% |
| Visual & Performing Arts | 0 | 0.0% |
| Communications | 0 | 0.0% |
| Arts & Humanities | 3 | 75.0% |
| Total | 4 | 100.0% |
Transportation & Commute in Trommald
Vehicle Availability by Sex in Trommald
The most prevalent vehicle ownership categories in Trommald are males with 2 vehicles (13, accounting for 52.0%) and females with 2 vehicles (4, making up 68.4%).
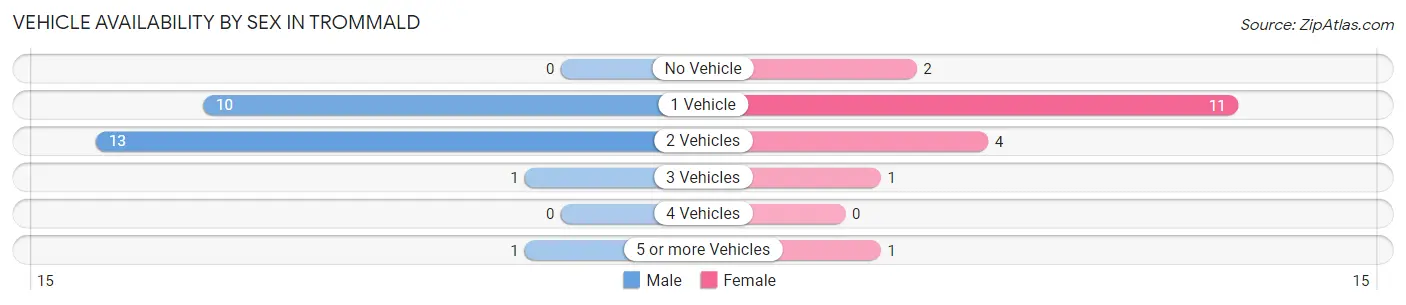
| Vehicles Available | Male | Female |
| No Vehicle | 0 (0.0%) | 2 (10.5%) |
| 1 Vehicle | 10 (40.0%) | 11 (57.9%) |
| 2 Vehicles | 13 (52.0%) | 4 (21.0%) |
| 3 Vehicles | 1 (4.0%) | 1 (5.3%) |
| 4 Vehicles | 0 (0.0%) | 0 (0.0%) |
| 5 or more Vehicles | 1 (4.0%) | 1 (5.3%) |
| Total | 25 (100.0%) | 19 (100.0%) |
Commute Time in Trommald
The most frequently occuring commute durations in Trommald are 10 to 14 minutes (16 commuters, 37.2%), 45 to 59 minutes (8 commuters, 18.6%), and 5 to 9 minutes (7 commuters, 16.3%).
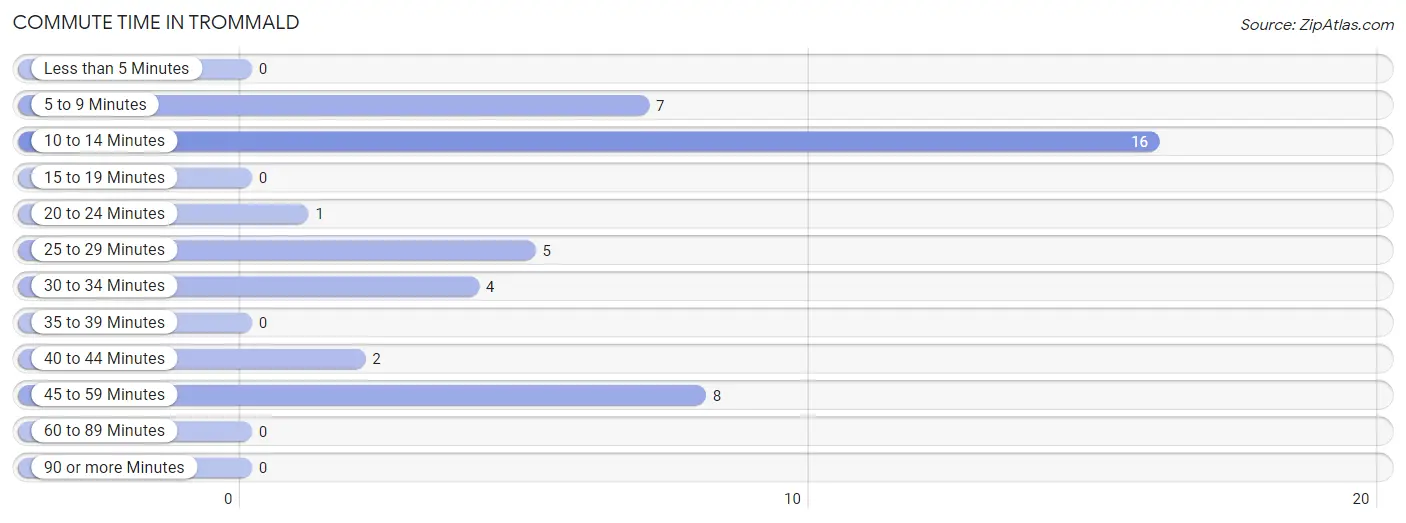
| Commute Time | # Commuters | % Commuters |
| Less than 5 Minutes | 0 | 0.0% |
| 5 to 9 Minutes | 7 | 16.3% |
| 10 to 14 Minutes | 16 | 37.2% |
| 15 to 19 Minutes | 0 | 0.0% |
| 20 to 24 Minutes | 1 | 2.3% |
| 25 to 29 Minutes | 5 | 11.6% |
| 30 to 34 Minutes | 4 | 9.3% |
| 35 to 39 Minutes | 0 | 0.0% |
| 40 to 44 Minutes | 2 | 4.6% |
| 45 to 59 Minutes | 8 | 18.6% |
| 60 to 89 Minutes | 0 | 0.0% |
| 90 or more Minutes | 0 | 0.0% |
Commute Time by Sex in Trommald
The most common commute times in Trommald are 10 to 14 minutes (16 commuters, 64.0%) for males and 5 to 9 minutes (7 commuters, 38.9%) for females.
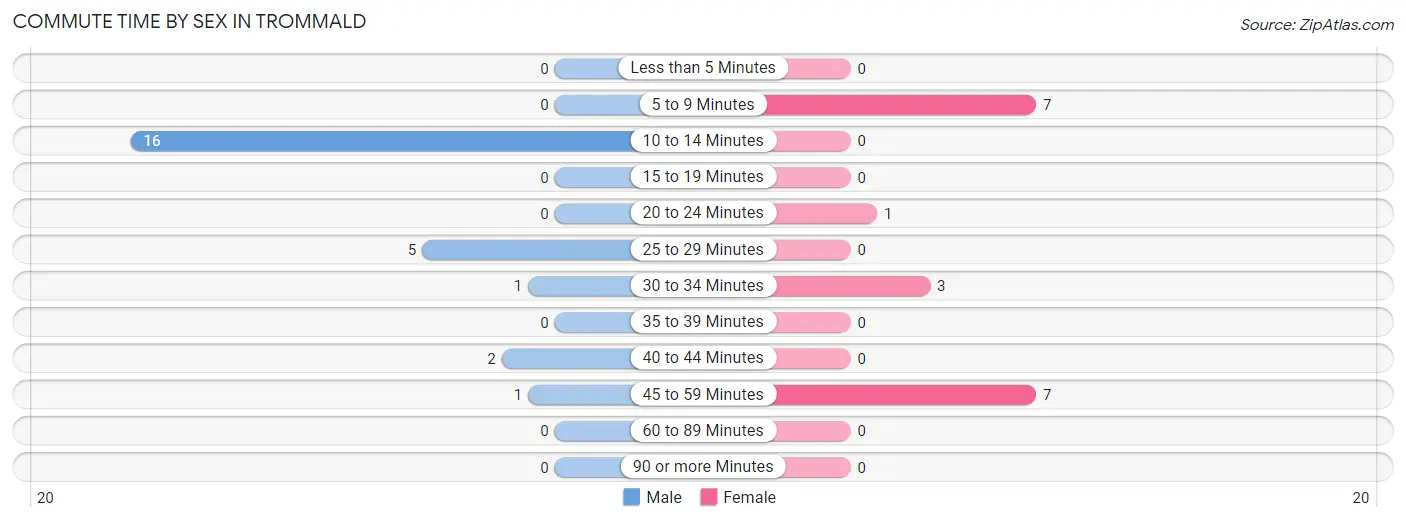
| Commute Time | Male | Female |
| Less than 5 Minutes | 0 (0.0%) | 0 (0.0%) |
| 5 to 9 Minutes | 0 (0.0%) | 7 (38.9%) |
| 10 to 14 Minutes | 16 (64.0%) | 0 (0.0%) |
| 15 to 19 Minutes | 0 (0.0%) | 0 (0.0%) |
| 20 to 24 Minutes | 0 (0.0%) | 1 (5.6%) |
| 25 to 29 Minutes | 5 (20.0%) | 0 (0.0%) |
| 30 to 34 Minutes | 1 (4.0%) | 3 (16.7%) |
| 35 to 39 Minutes | 0 (0.0%) | 0 (0.0%) |
| 40 to 44 Minutes | 2 (8.0%) | 0 (0.0%) |
| 45 to 59 Minutes | 1 (4.0%) | 7 (38.9%) |
| 60 to 89 Minutes | 0 (0.0%) | 0 (0.0%) |
| 90 or more Minutes | 0 (0.0%) | 0 (0.0%) |
Time of Departure to Work by Sex in Trommald
The most frequent times of departure to work in Trommald are 5:30 AM to 5:59 AM (7, 28.0%) for males and 7:30 AM to 7:59 AM (7, 38.9%) for females.
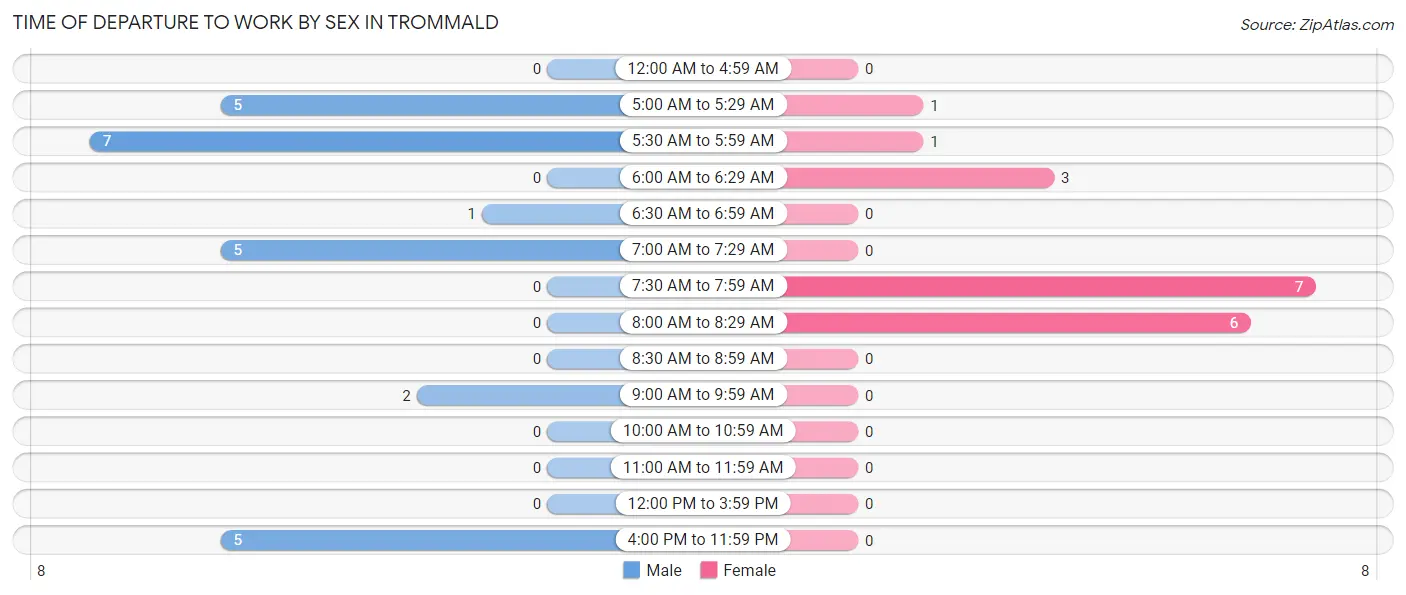
| Time of Departure | Male | Female |
| 12:00 AM to 4:59 AM | 0 (0.0%) | 0 (0.0%) |
| 5:00 AM to 5:29 AM | 5 (20.0%) | 1 (5.6%) |
| 5:30 AM to 5:59 AM | 7 (28.0%) | 1 (5.6%) |
| 6:00 AM to 6:29 AM | 0 (0.0%) | 3 (16.7%) |
| 6:30 AM to 6:59 AM | 1 (4.0%) | 0 (0.0%) |
| 7:00 AM to 7:29 AM | 5 (20.0%) | 0 (0.0%) |
| 7:30 AM to 7:59 AM | 0 (0.0%) | 7 (38.9%) |
| 8:00 AM to 8:29 AM | 0 (0.0%) | 6 (33.3%) |
| 8:30 AM to 8:59 AM | 0 (0.0%) | 0 (0.0%) |
| 9:00 AM to 9:59 AM | 2 (8.0%) | 0 (0.0%) |
| 10:00 AM to 10:59 AM | 0 (0.0%) | 0 (0.0%) |
| 11:00 AM to 11:59 AM | 0 (0.0%) | 0 (0.0%) |
| 12:00 PM to 3:59 PM | 0 (0.0%) | 0 (0.0%) |
| 4:00 PM to 11:59 PM | 5 (20.0%) | 0 (0.0%) |
| Total | 25 (100.0%) | 18 (100.0%) |
Housing Occupancy in Trommald
Occupancy by Ownership in Trommald
Of the total 41 dwellings in Trommald, owner-occupied units account for 35 (85.4%), while renter-occupied units make up 6 (14.6%).
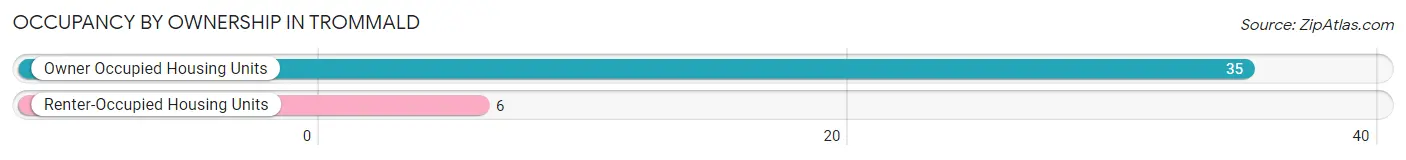
| Occupancy | # Housing Units | % Housing Units |
| Owner Occupied Housing Units | 35 | 85.4% |
| Renter-Occupied Housing Units | 6 | 14.6% |
| Total Occupied Housing Units | 41 | 100.0% |
Occupancy by Household Size in Trommald
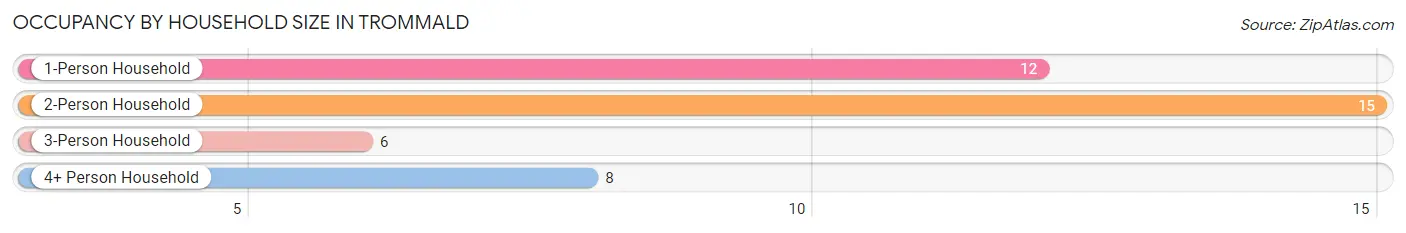
| Household Size | # Housing Units | % Housing Units |
| 1-Person Household | 12 | 29.3% |
| 2-Person Household | 15 | 36.6% |
| 3-Person Household | 6 | 14.6% |
| 4+ Person Household | 8 | 19.5% |
| Total Housing Units | 41 | 100.0% |
Occupancy by Ownership by Household Size in Trommald
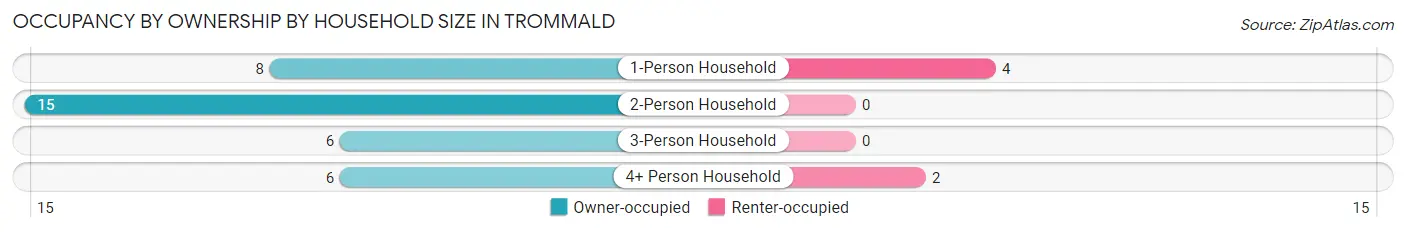
| Household Size | Owner-occupied | Renter-occupied |
| 1-Person Household | 8 (66.7%) | 4 (33.3%) |
| 2-Person Household | 15 (100.0%) | 0 (0.0%) |
| 3-Person Household | 6 (100.0%) | 0 (0.0%) |
| 4+ Person Household | 6 (75.0%) | 2 (25.0%) |
| Total Housing Units | 35 (85.4%) | 6 (14.6%) |
Occupancy by Educational Attainment in Trommald
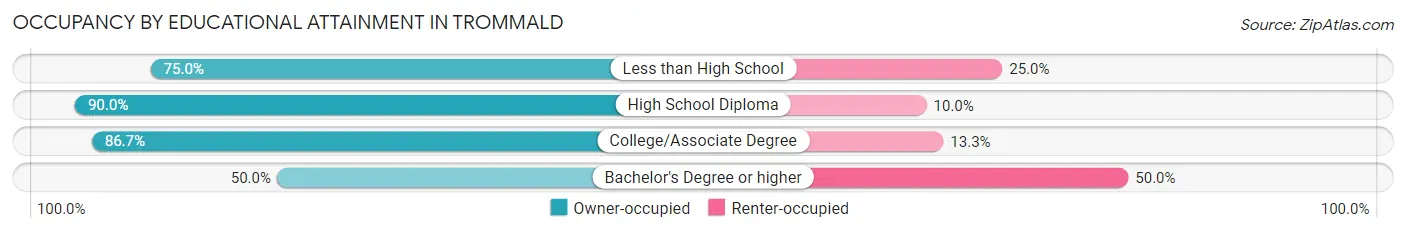
| Household Size | Owner-occupied | Renter-occupied |
| Less than High School | 3 (75.0%) | 1 (25.0%) |
| High School Diploma | 18 (90.0%) | 2 (10.0%) |
| College/Associate Degree | 13 (86.7%) | 2 (13.3%) |
| Bachelor's Degree or higher | 1 (50.0%) | 1 (50.0%) |
Occupancy by Age of Householder in Trommald
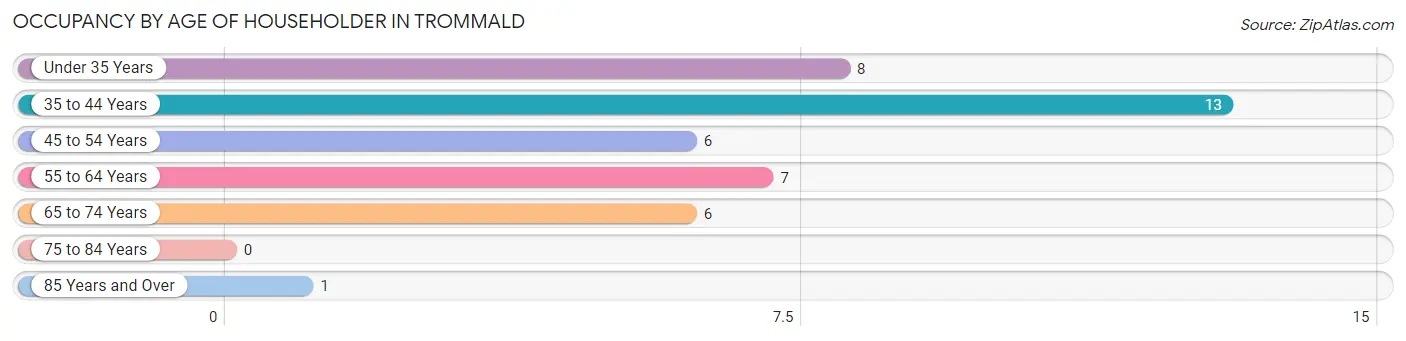
| Age Bracket | # Households | % Households |
| Under 35 Years | 8 | 19.5% |
| 35 to 44 Years | 13 | 31.7% |
| 45 to 54 Years | 6 | 14.6% |
| 55 to 64 Years | 7 | 17.1% |
| 65 to 74 Years | 6 | 14.6% |
| 75 to 84 Years | 0 | 0.0% |
| 85 Years and Over | 1 | 2.4% |
| Total | 41 | 100.0% |
Housing Finances in Trommald
Median Income by Occupancy in Trommald
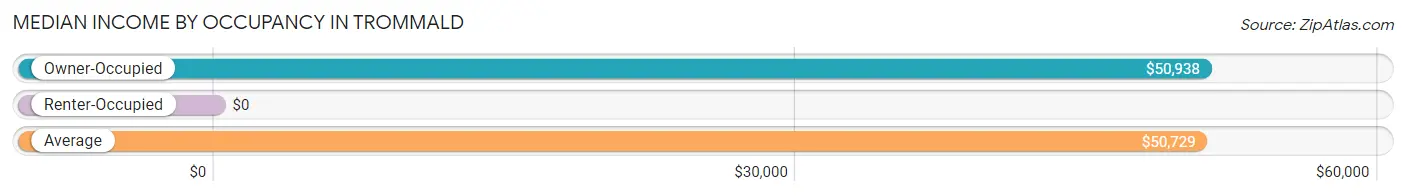
| Occupancy Type | # Households | Median Income |
| Owner-Occupied | 35 (85.4%) | $50,938 |
| Renter-Occupied | 6 (14.6%) | $0 |
| Average | 41 (100.0%) | $50,729 |
Occupancy by Householder Income Bracket in Trommald
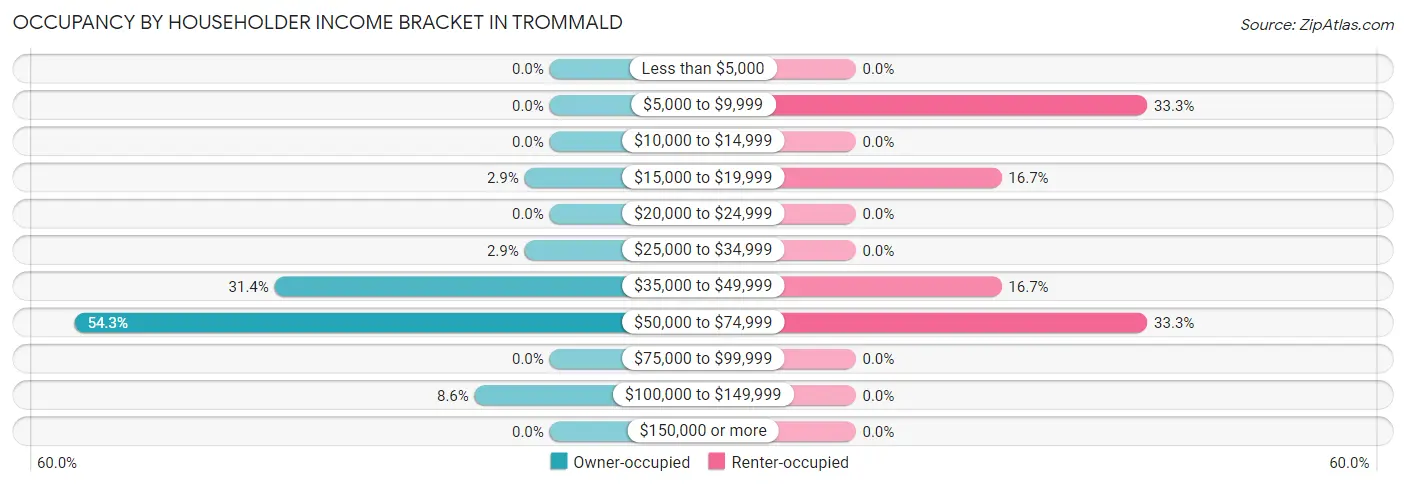
| Income Bracket | Owner-occupied | Renter-occupied |
| Less than $5,000 | 0 (0.0%) | 0 (0.0%) |
| $5,000 to $9,999 | 0 (0.0%) | 2 (33.3%) |
| $10,000 to $14,999 | 0 (0.0%) | 0 (0.0%) |
| $15,000 to $19,999 | 1 (2.9%) | 1 (16.7%) |
| $20,000 to $24,999 | 0 (0.0%) | 0 (0.0%) |
| $25,000 to $34,999 | 1 (2.9%) | 0 (0.0%) |
| $35,000 to $49,999 | 11 (31.4%) | 1 (16.7%) |
| $50,000 to $74,999 | 19 (54.3%) | 2 (33.3%) |
| $75,000 to $99,999 | 0 (0.0%) | 0 (0.0%) |
| $100,000 to $149,999 | 3 (8.6%) | 0 (0.0%) |
| $150,000 or more | 0 (0.0%) | 0 (0.0%) |
| Total | 35 (100.0%) | 6 (100.0%) |
Monthly Housing Cost Tiers in Trommald
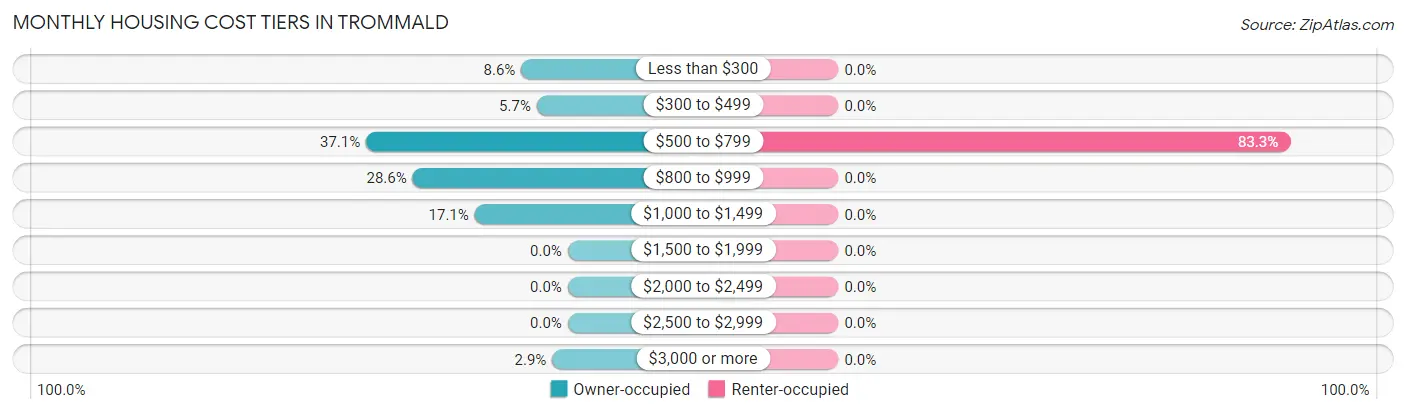
| Monthly Cost | Owner-occupied | Renter-occupied |
| Less than $300 | 3 (8.6%) | 0 (0.0%) |
| $300 to $499 | 2 (5.7%) | 0 (0.0%) |
| $500 to $799 | 13 (37.1%) | 5 (83.3%) |
| $800 to $999 | 10 (28.6%) | 0 (0.0%) |
| $1,000 to $1,499 | 6 (17.1%) | 0 (0.0%) |
| $1,500 to $1,999 | 0 (0.0%) | 0 (0.0%) |
| $2,000 to $2,499 | 0 (0.0%) | 0 (0.0%) |
| $2,500 to $2,999 | 0 (0.0%) | 0 (0.0%) |
| $3,000 or more | 1 (2.9%) | 0 (0.0%) |
| Total | 35 (100.0%) | 6 (100.0%) |
Physical Housing Characteristics in Trommald
Housing Structures in Trommald
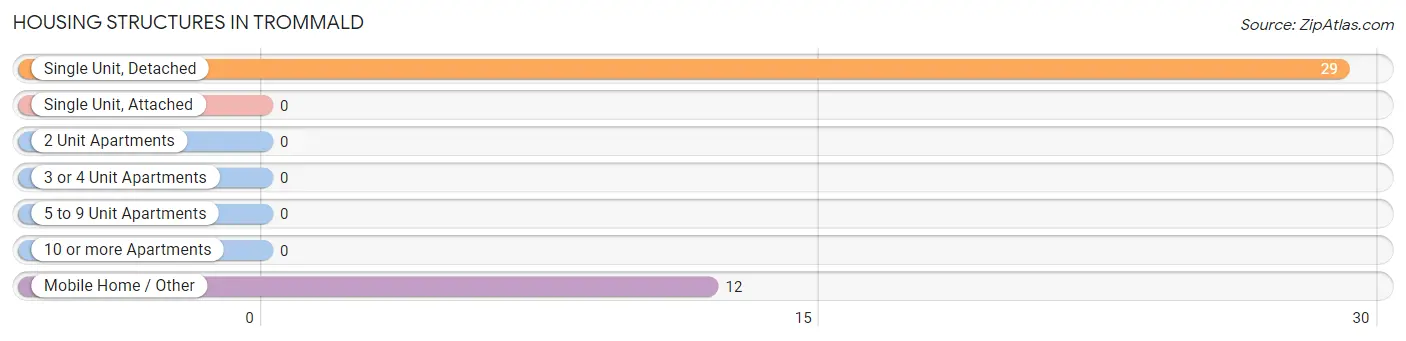
| Structure Type | # Housing Units | % Housing Units |
| Single Unit, Detached | 29 | 70.7% |
| Single Unit, Attached | 0 | 0.0% |
| 2 Unit Apartments | 0 | 0.0% |
| 3 or 4 Unit Apartments | 0 | 0.0% |
| 5 to 9 Unit Apartments | 0 | 0.0% |
| 10 or more Apartments | 0 | 0.0% |
| Mobile Home / Other | 12 | 29.3% |
| Total | 41 | 100.0% |
Housing Structures by Occupancy in Trommald
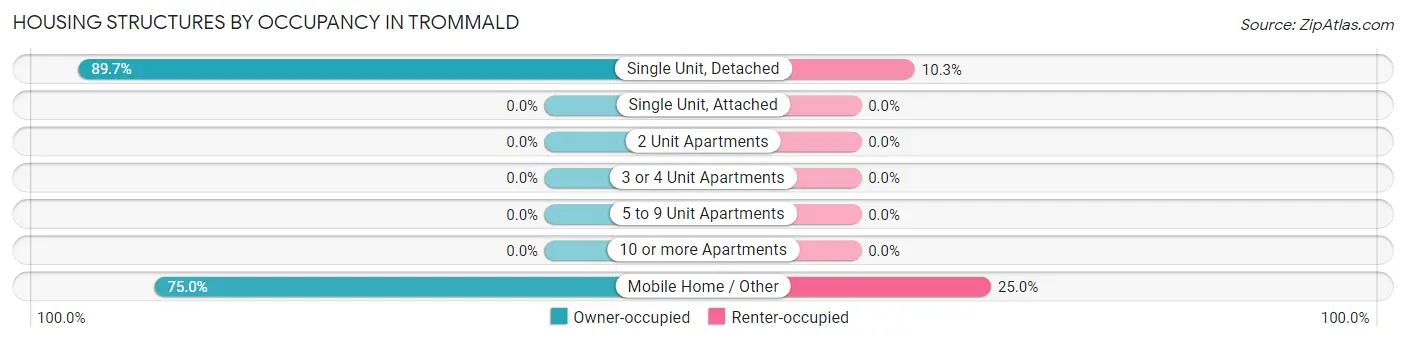
| Structure Type | Owner-occupied | Renter-occupied |
| Single Unit, Detached | 26 (89.7%) | 3 (10.3%) |
| Single Unit, Attached | 0 (0.0%) | 0 (0.0%) |
| 2 Unit Apartments | 0 (0.0%) | 0 (0.0%) |
| 3 or 4 Unit Apartments | 0 (0.0%) | 0 (0.0%) |
| 5 to 9 Unit Apartments | 0 (0.0%) | 0 (0.0%) |
| 10 or more Apartments | 0 (0.0%) | 0 (0.0%) |
| Mobile Home / Other | 9 (75.0%) | 3 (25.0%) |
| Total | 35 (85.4%) | 6 (14.6%) |
Housing Structures by Number of Rooms in Trommald
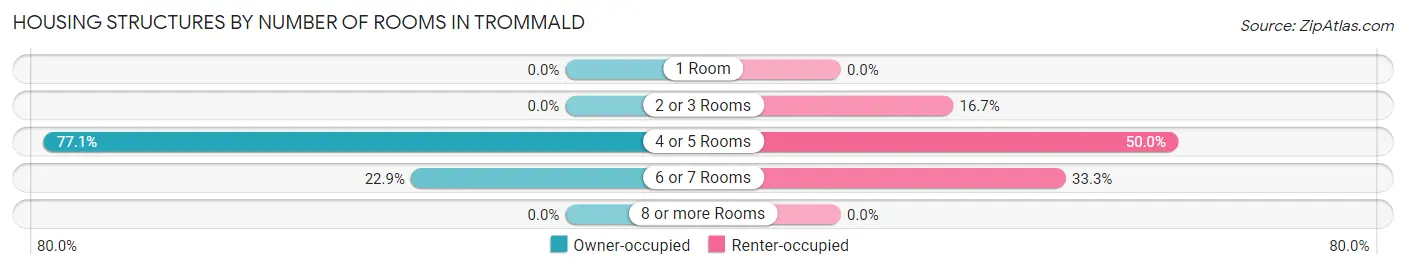
| Number of Rooms | Owner-occupied | Renter-occupied |
| 1 Room | 0 (0.0%) | 0 (0.0%) |
| 2 or 3 Rooms | 0 (0.0%) | 1 (16.7%) |
| 4 or 5 Rooms | 27 (77.1%) | 3 (50.0%) |
| 6 or 7 Rooms | 8 (22.9%) | 2 (33.3%) |
| 8 or more Rooms | 0 (0.0%) | 0 (0.0%) |
| Total | 35 (100.0%) | 6 (100.0%) |
Housing Structure by Heating Type in Trommald
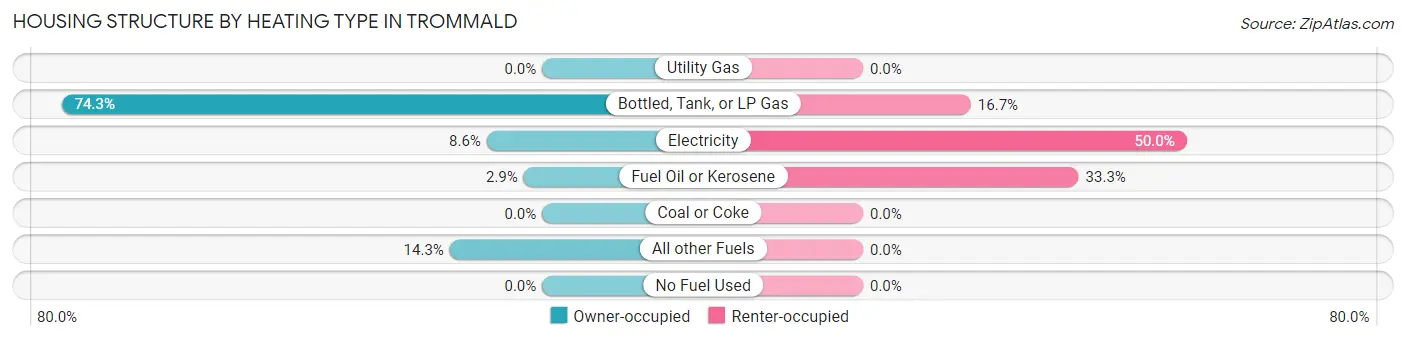
| Heating Type | Owner-occupied | Renter-occupied |
| Utility Gas | 0 (0.0%) | 0 (0.0%) |
| Bottled, Tank, or LP Gas | 26 (74.3%) | 1 (16.7%) |
| Electricity | 3 (8.6%) | 3 (50.0%) |
| Fuel Oil or Kerosene | 1 (2.9%) | 2 (33.3%) |
| Coal or Coke | 0 (0.0%) | 0 (0.0%) |
| All other Fuels | 5 (14.3%) | 0 (0.0%) |
| No Fuel Used | 0 (0.0%) | 0 (0.0%) |
| Total | 35 (100.0%) | 6 (100.0%) |
Household Vehicle Usage in Trommald
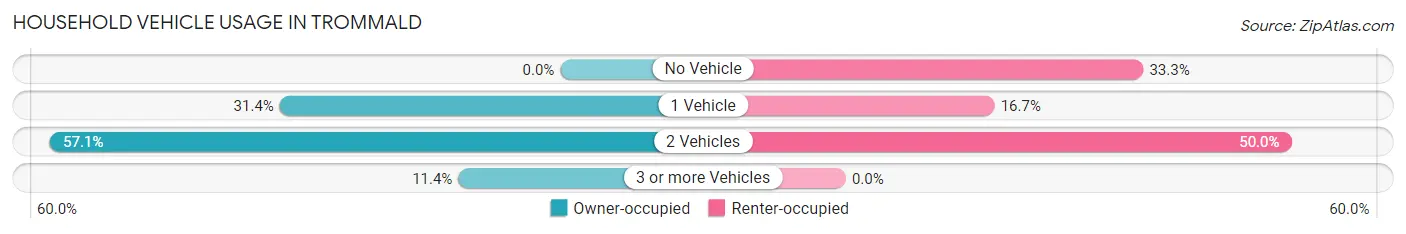
| Vehicles per Household | Owner-occupied | Renter-occupied |
| No Vehicle | 0 (0.0%) | 2 (33.3%) |
| 1 Vehicle | 11 (31.4%) | 1 (16.7%) |
| 2 Vehicles | 20 (57.1%) | 3 (50.0%) |
| 3 or more Vehicles | 4 (11.4%) | 0 (0.0%) |
| Total | 35 (100.0%) | 6 (100.0%) |
Real Estate & Mortgages in Trommald
Real Estate and Mortgage Overview in Trommald
| Characteristic | Without Mortgage | With Mortgage |
| Housing Units | 10 | 25 |
| Median Property Value | - | - |
| Median Household Income | $52,000 | $0 |
| Monthly Housing Costs | $550 | $1 |
| Real Estate Taxes | - | - |
Property Value by Mortgage Status in Trommald
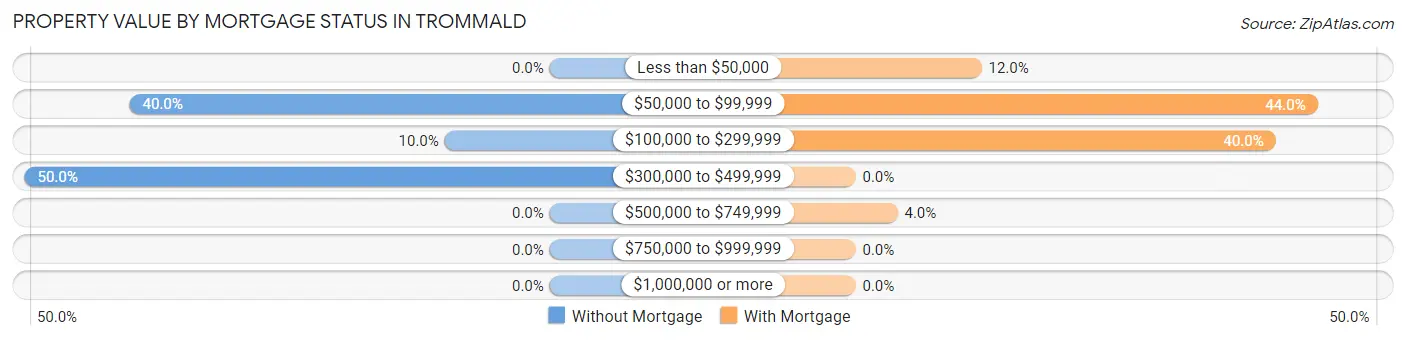
| Property Value | Without Mortgage | With Mortgage |
| Less than $50,000 | 0 (0.0%) | 3 (12.0%) |
| $50,000 to $99,999 | 4 (40.0%) | 11 (44.0%) |
| $100,000 to $299,999 | 1 (10.0%) | 10 (40.0%) |
| $300,000 to $499,999 | 5 (50.0%) | 0 (0.0%) |
| $500,000 to $749,999 | 0 (0.0%) | 1 (4.0%) |
| $750,000 to $999,999 | 0 (0.0%) | 0 (0.0%) |
| $1,000,000 or more | 0 (0.0%) | 0 (0.0%) |
| Total | 10 (100.0%) | 25 (100.0%) |
Household Income by Mortgage Status in Trommald
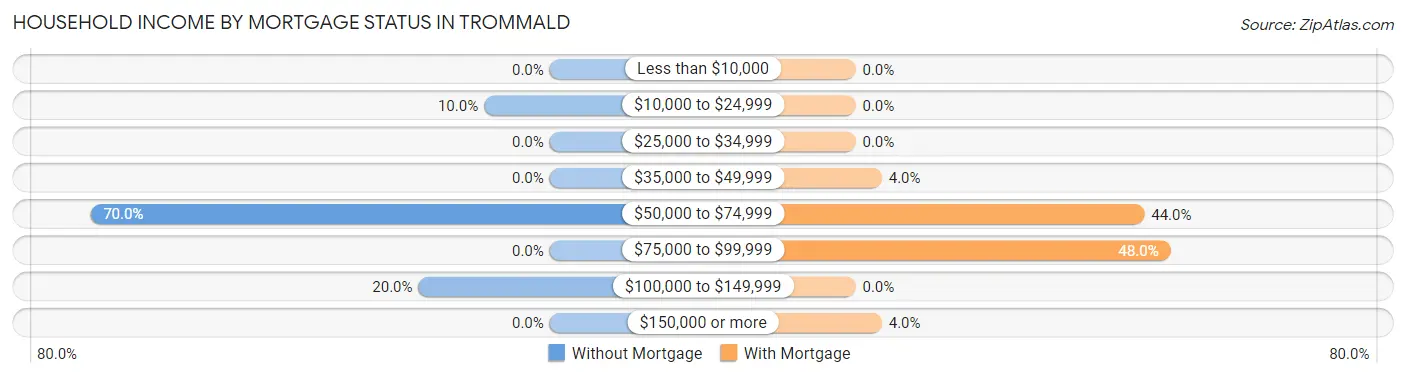
| Household Income | Without Mortgage | With Mortgage |
| Less than $10,000 | 0 (0.0%) | 0 (0.0%) |
| $10,000 to $24,999 | 1 (10.0%) | 0 (0.0%) |
| $25,000 to $34,999 | 0 (0.0%) | 0 (0.0%) |
| $35,000 to $49,999 | 0 (0.0%) | 1 (4.0%) |
| $50,000 to $74,999 | 7 (70.0%) | 11 (44.0%) |
| $75,000 to $99,999 | 0 (0.0%) | 12 (48.0%) |
| $100,000 to $149,999 | 2 (20.0%) | 0 (0.0%) |
| $150,000 or more | 0 (0.0%) | 1 (4.0%) |
| Total | 10 (100.0%) | 25 (100.0%) |
Property Value to Household Income Ratio in Trommald
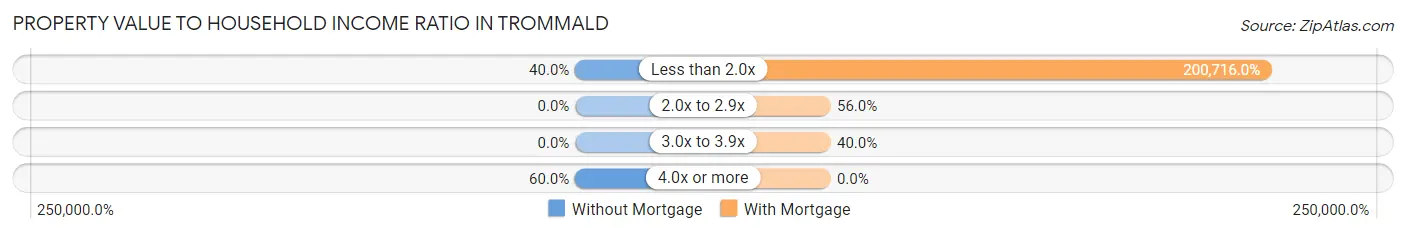
| Value-to-Income Ratio | Without Mortgage | With Mortgage |
| Less than 2.0x | 4 (40.0%) | 50,179 (200,716.0%) |
| 2.0x to 2.9x | 0 (0.0%) | 14 (56.0%) |
| 3.0x to 3.9x | 0 (0.0%) | 10 (40.0%) |
| 4.0x or more | 6 (60.0%) | 0 (0.0%) |
| Total | 10 (100.0%) | 25 (100.0%) |
Real Estate Taxes by Mortgage Status in Trommald
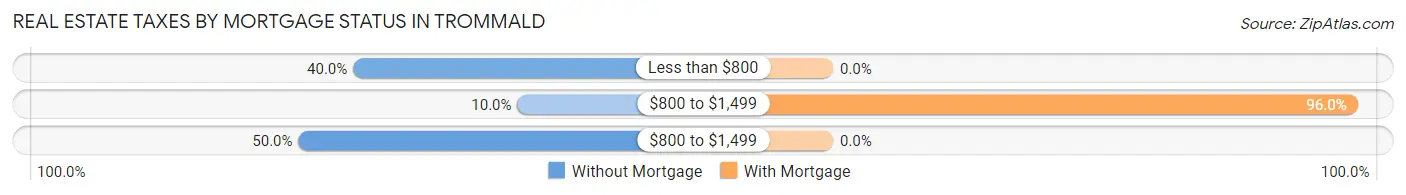
| Property Taxes | Without Mortgage | With Mortgage |
| Less than $800 | 4 (40.0%) | 0 (0.0%) |
| $800 to $1,499 | 1 (10.0%) | 24 (96.0%) |
| $800 to $1,499 | 5 (50.0%) | 0 (0.0%) |
| Total | 10 (100.0%) | 25 (100.0%) |
Health & Disability in Trommald
Health Insurance Coverage by Age in Trommald
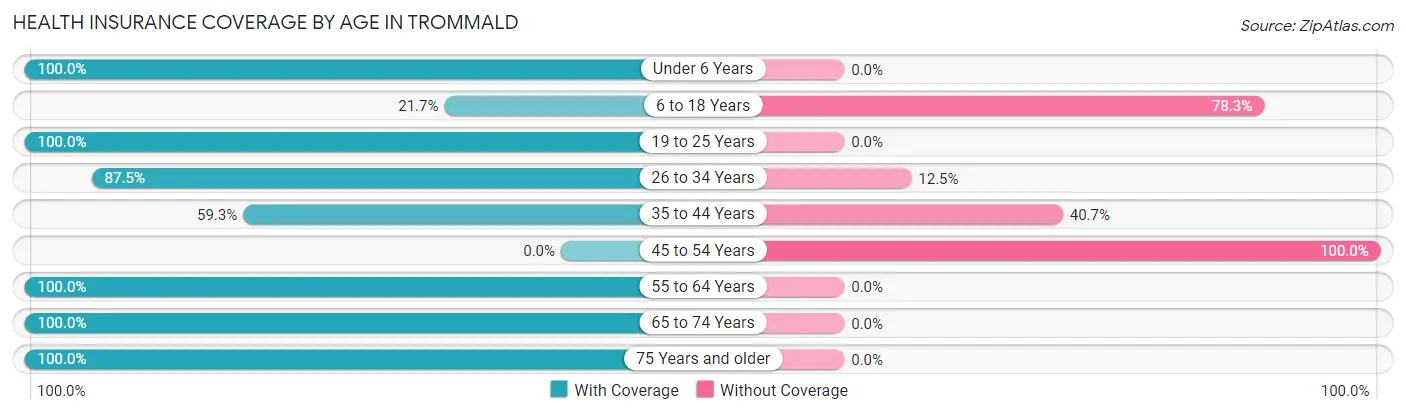
| Age Bracket | With Coverage | Without Coverage |
| Under 6 Years | 7 (100.0%) | 0 (0.0%) |
| 6 to 18 Years | 5 (21.7%) | 18 (78.3%) |
| 19 to 25 Years | 6 (100.0%) | 0 (0.0%) |
| 26 to 34 Years | 7 (87.5%) | 1 (12.5%) |
| 35 to 44 Years | 16 (59.3%) | 11 (40.7%) |
| 45 to 54 Years | 0 (0.0%) | 6 (100.0%) |
| 55 to 64 Years | 15 (100.0%) | 0 (0.0%) |
| 65 to 74 Years | 11 (100.0%) | 0 (0.0%) |
| 75 Years and older | 3 (100.0%) | 0 (0.0%) |
| Total | 70 (66.0%) | 36 (34.0%) |
Health Insurance Coverage by Citizenship Status in Trommald
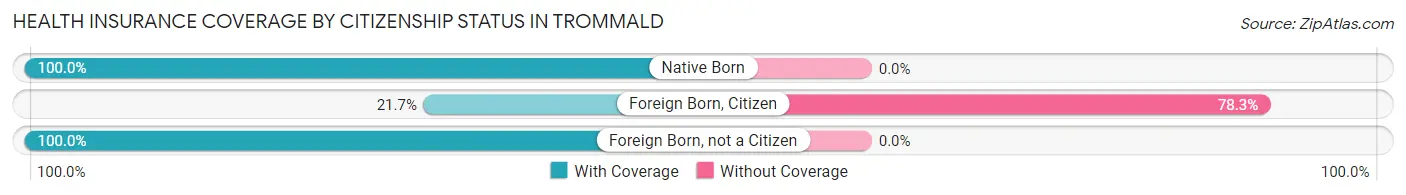
| Citizenship Status | With Coverage | Without Coverage |
| Native Born | 7 (100.0%) | 0 (0.0%) |
| Foreign Born, Citizen | 5 (21.7%) | 18 (78.3%) |
| Foreign Born, not a Citizen | 6 (100.0%) | 0 (0.0%) |
Health Insurance Coverage by Household Income in Trommald
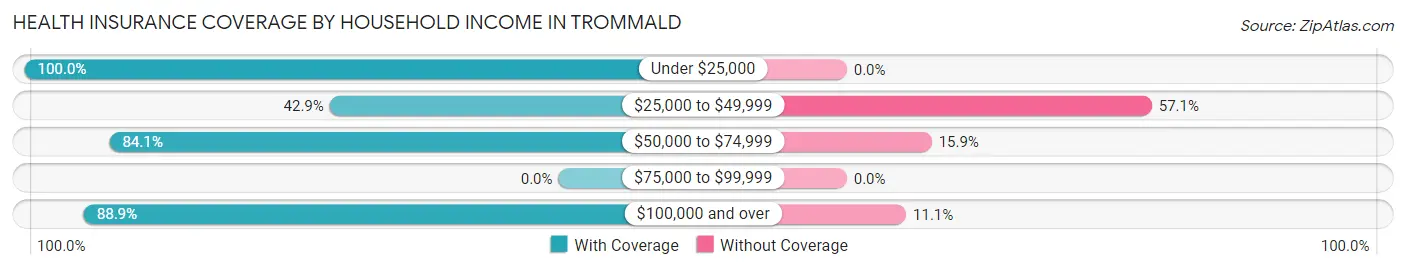
| Household Income | With Coverage | Without Coverage |
| Under $25,000 | 4 (100.0%) | 0 (0.0%) |
| $25,000 to $49,999 | 21 (42.9%) | 28 (57.1%) |
| $50,000 to $74,999 | 37 (84.1%) | 7 (15.9%) |
| $75,000 to $99,999 | 0 (0.0%) | 0 (0.0%) |
| $100,000 and over | 8 (88.9%) | 1 (11.1%) |
Public vs Private Health Insurance Coverage by Age in Trommald
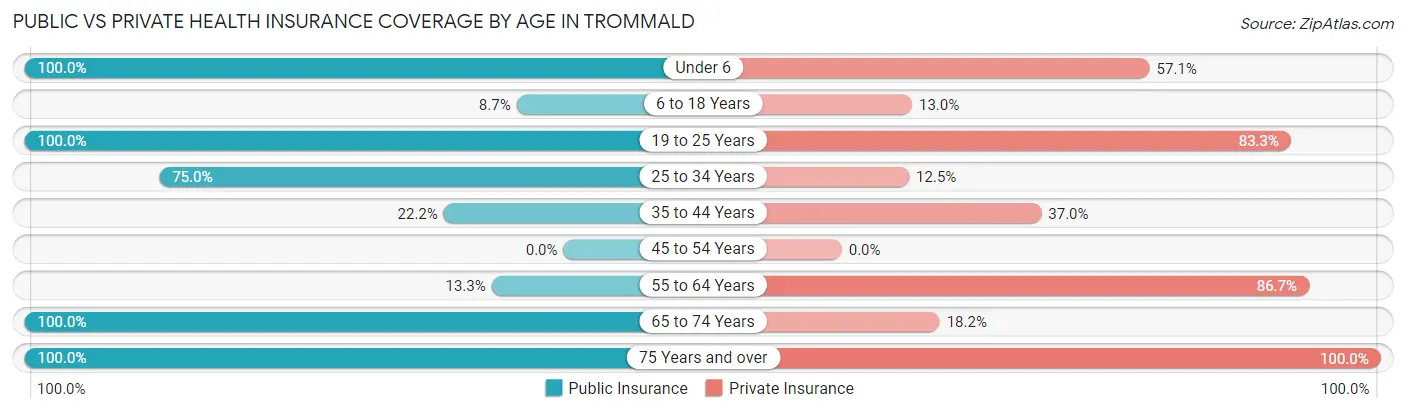
| Age Bracket | Public Insurance | Private Insurance |
| Under 6 | 7 (100.0%) | 4 (57.1%) |
| 6 to 18 Years | 2 (8.7%) | 3 (13.0%) |
| 19 to 25 Years | 6 (100.0%) | 5 (83.3%) |
| 25 to 34 Years | 6 (75.0%) | 1 (12.5%) |
| 35 to 44 Years | 6 (22.2%) | 10 (37.0%) |
| 45 to 54 Years | 0 (0.0%) | 0 (0.0%) |
| 55 to 64 Years | 2 (13.3%) | 13 (86.7%) |
| 65 to 74 Years | 11 (100.0%) | 2 (18.2%) |
| 75 Years and over | 3 (100.0%) | 3 (100.0%) |
| Total | 43 (40.6%) | 41 (38.7%) |
Disability Status by Sex by Age in Trommald
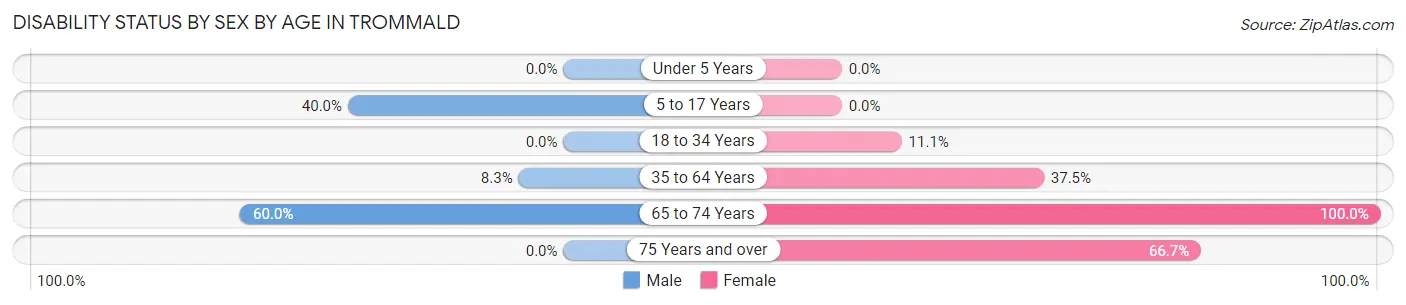
| Age Bracket | Male | Female |
| Under 5 Years | 0 (0.0%) | 0 (0.0%) |
| 5 to 17 Years | 6 (40.0%) | 0 (0.0%) |
| 18 to 34 Years | 0 (0.0%) | 1 (11.1%) |
| 35 to 64 Years | 2 (8.3%) | 9 (37.5%) |
| 65 to 74 Years | 6 (60.0%) | 1 (100.0%) |
| 75 Years and over | 0 (0.0%) | 2 (66.7%) |
Disability Class by Sex by Age in Trommald
Disability Class: Hearing Difficulty
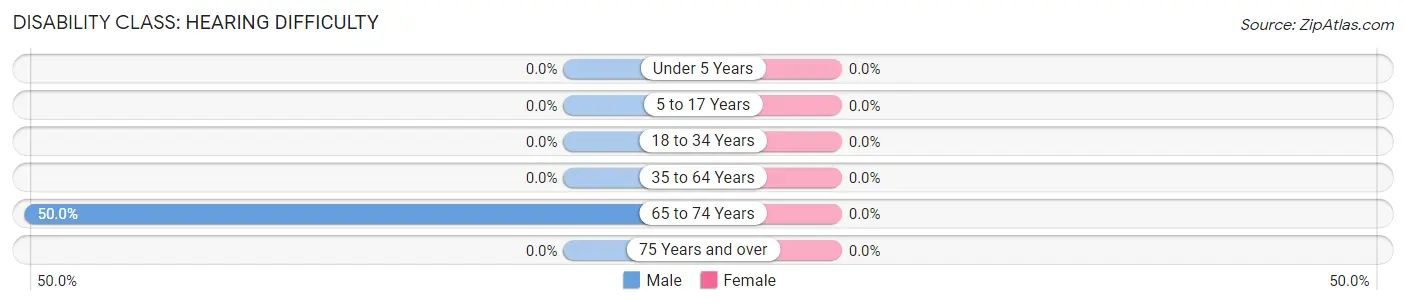
| Age Bracket | Male | Female |
| Under 5 Years | 0 (0.0%) | 0 (0.0%) |
| 5 to 17 Years | 0 (0.0%) | 0 (0.0%) |
| 18 to 34 Years | 0 (0.0%) | 0 (0.0%) |
| 35 to 64 Years | 0 (0.0%) | 0 (0.0%) |
| 65 to 74 Years | 5 (50.0%) | 0 (0.0%) |
| 75 Years and over | 0 (0.0%) | 0 (0.0%) |
Disability Class: Vision Difficulty
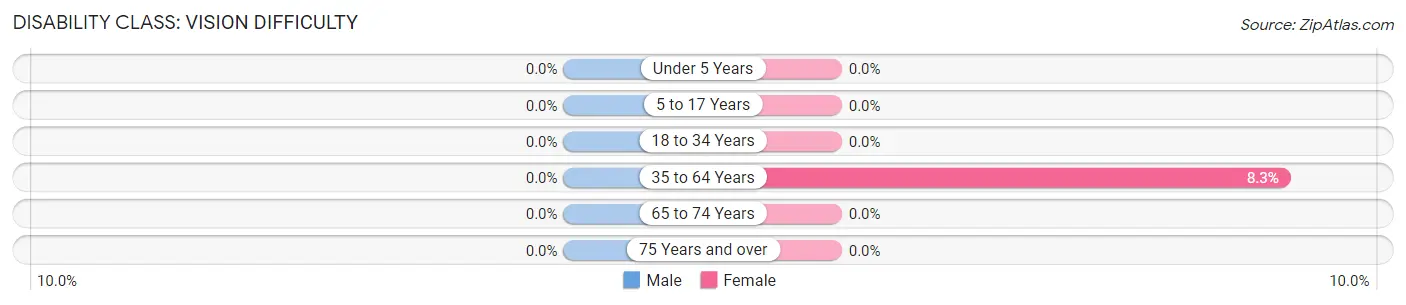
| Age Bracket | Male | Female |
| Under 5 Years | 0 (0.0%) | 0 (0.0%) |
| 5 to 17 Years | 0 (0.0%) | 0 (0.0%) |
| 18 to 34 Years | 0 (0.0%) | 0 (0.0%) |
| 35 to 64 Years | 0 (0.0%) | 2 (8.3%) |
| 65 to 74 Years | 0 (0.0%) | 0 (0.0%) |
| 75 Years and over | 0 (0.0%) | 0 (0.0%) |
Disability Class: Cognitive Difficulty
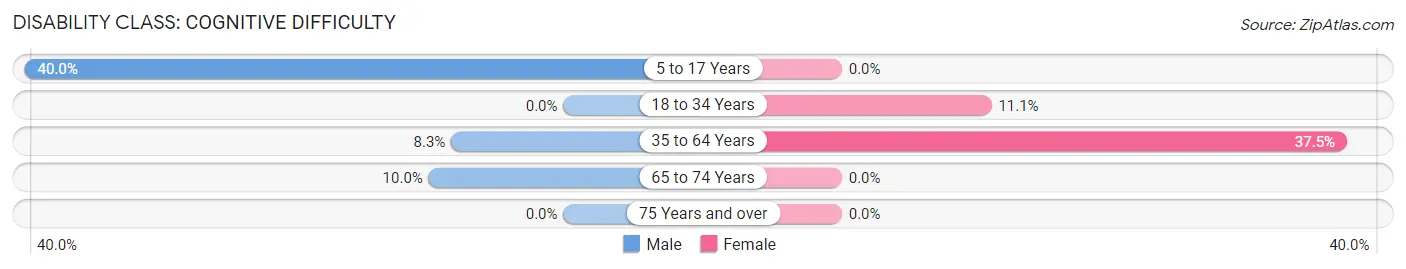
| Age Bracket | Male | Female |
| 5 to 17 Years | 6 (40.0%) | 0 (0.0%) |
| 18 to 34 Years | 0 (0.0%) | 1 (11.1%) |
| 35 to 64 Years | 2 (8.3%) | 9 (37.5%) |
| 65 to 74 Years | 1 (10.0%) | 0 (0.0%) |
| 75 Years and over | 0 (0.0%) | 0 (0.0%) |
Disability Class: Ambulatory Difficulty
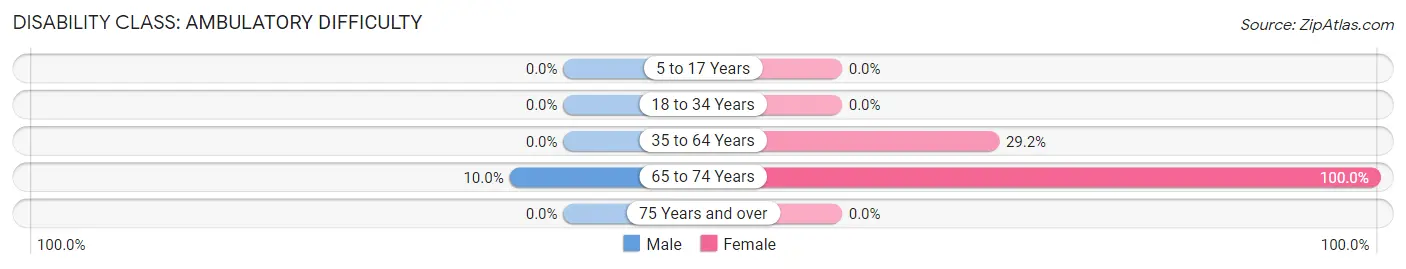
| Age Bracket | Male | Female |
| 5 to 17 Years | 0 (0.0%) | 0 (0.0%) |
| 18 to 34 Years | 0 (0.0%) | 0 (0.0%) |
| 35 to 64 Years | 0 (0.0%) | 7 (29.2%) |
| 65 to 74 Years | 1 (10.0%) | 1 (100.0%) |
| 75 Years and over | 0 (0.0%) | 0 (0.0%) |
Disability Class: Self-Care Difficulty
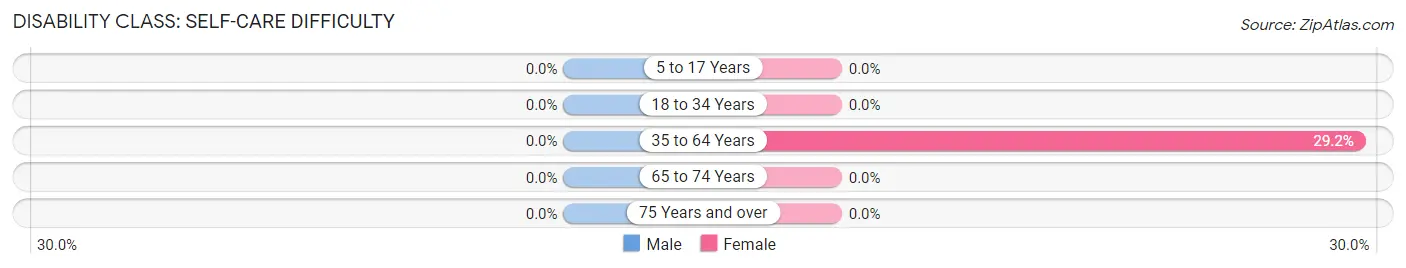
| Age Bracket | Male | Female |
| 5 to 17 Years | 0 (0.0%) | 0 (0.0%) |
| 18 to 34 Years | 0 (0.0%) | 0 (0.0%) |
| 35 to 64 Years | 0 (0.0%) | 7 (29.2%) |
| 65 to 74 Years | 0 (0.0%) | 0 (0.0%) |
| 75 Years and over | 0 (0.0%) | 0 (0.0%) |
Technology Access in Trommald
Computing Device Access in Trommald
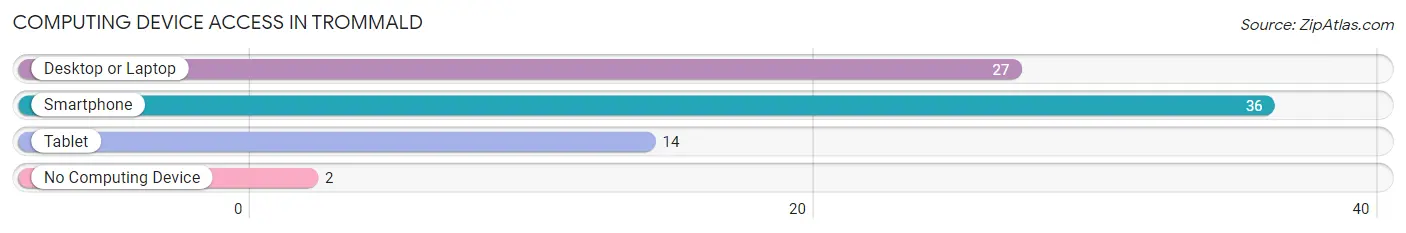
| Device Type | # Households | % Households |
| Desktop or Laptop | 27 | 65.8% |
| Smartphone | 36 | 87.8% |
| Tablet | 14 | 34.2% |
| No Computing Device | 2 | 4.9% |
| Total | 41 | 100.0% |
Internet Access in Trommald
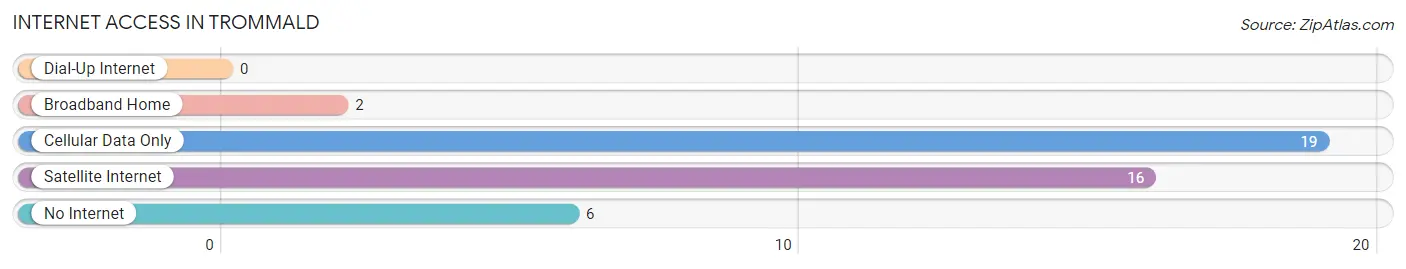
| Internet Type | # Households | % Households |
| Dial-Up Internet | 0 | 0.0% |
| Broadband Home | 2 | 4.9% |
| Cellular Data Only | 19 | 46.3% |
| Satellite Internet | 16 | 39.0% |
| No Internet | 6 | 14.6% |
| Total | 41 | 100.0% |
Trommald Summary
Trommald is a small city located in Goodhue County, Minnesota. It is situated on the banks of the Mississippi River, approximately 25 miles south of the Twin Cities. The city has a population of approximately 1,000 people and is part of the Red Wing Metropolitan Statistical Area.
History
Trommald was founded in 1856 by Norwegian immigrants who had settled in the area. The city was named after the Trommald family, who were among the first settlers. The city was originally a farming community, but it soon developed into a small industrial center. The city was home to several factories, including a flour mill, a sawmill, and a brickyard.
In the late 19th century, Trommald was a popular destination for tourists. The city was known for its scenic views of the Mississippi River and its many parks and gardens. The city also had a thriving music scene, with several bands playing in the local taverns.
Geography
Trommald is located in the southeastern corner of Goodhue County, Minnesota. It is situated on the banks of the Mississippi River, approximately 25 miles south of the Twin Cities. The city has a total area of 1.2 square miles, all of which is land.
The city is located in a hilly region, with the highest point being the summit of Trommald Hill, which is located at an elevation of 845 feet. The city is surrounded by several small lakes, including Lake Trommald, Lake Goodhue, and Lake Zumbro.
Economy
Trommald’s economy is largely based on agriculture and tourism. The city is home to several farms, which produce a variety of crops, including corn, soybeans, and wheat. The city is also home to several wineries, which produce a variety of wines.
The city is also home to several small businesses, including restaurants, shops, and a variety of services. The city is also home to several manufacturing companies, which produce a variety of products, including furniture, clothing, and electronics.
Demographics
As of the 2010 census, Trommald had a population of 1,000 people. The racial makeup of the city was 97.2% White, 0.7% African American, 0.2% Native American, 0.2% Asian, 0.2% from other races, and 1.7% from two or more races. Hispanic or Latino of any race were 0.7% of the population.
The median income for a household in the city was $45,000, and the median income for a family was $50,000. The per capita income for the city was $20,000. About 8.3% of families and 10.3% of the population were below the poverty line, including 14.3% of those under age 18 and 5.3% of those age 65 or over.
Common Questions
What is the Total Population of Trommald?
Total Population of Trommald is 106.
What is the Total Male Population of Trommald?
Total Male Population of Trommald is 54.
What is the Total Female Population of Trommald?
Total Female Population of Trommald is 52.
What is the Ratio of Males per 100 Females in Trommald?
There are 103.85 Males per 100 Females in Trommald.
What is the Ratio of Females per 100 Males in Trommald?
There are 96.30 Females per 100 Males in Trommald.
What is the Median Population Age in Trommald?
Median Population Age in Trommald is 36.5 Years.
What is the Average Family Size in Trommald
Average Family Size in Trommald is 2.8 People.
What is the Average Household Size in Trommald
Average Household Size in Trommald is 2.6 People.
What is Per Capita Income in Trommald?
Per Capita income in Trommald is $20,366.
What is the Median Family Income in Trommald?
Median Family Income in Trommald is $50,357.
What is the Median Household income in Trommald?
Median Household Income in Trommald is $50,729.
What is Inequality or Gini Index in Trommald?
Inequality or Gini Index in Trommald is 0.20.
How Large is the Labor Force in Trommald?
There are 61 People in the Labor Forcein in Trommald.
What is the Percentage of People in the Labor Force in Trommald?
80.3% of People are in the Labor Force in Trommald.
What is the Unemployment Rate in Trommald?
Unemployment Rate in Trommald is 26.2%.