St Rosa, MN
St Rosa Map
St Rosa Overview
50
TOTAL POPULATION
32
MALE POPULATION
18
FEMALE POPULATION
177.78
MALES / 100 FEMALES
56.25
FEMALES / 100 MALES
37.7
MEDIAN AGE
3.6
AVG FAMILY SIZE
2.1
AVG HOUSEHOLD SIZE
$48,898
PER CAPITA INCOME
$121,250
AVG FAMILY INCOME
$75,833
AVG HOUSEHOLD INCOME
53.4%
WAGE / INCOME GAP [ % ]
46.6¢/ $1
WAGE / INCOME GAP [ $ ]
0.47
INEQUALITY / GINI INDEX
27
LABOR FORCE [ PEOPLE ]
77.1%
PERCENT IN LABOR FORCE
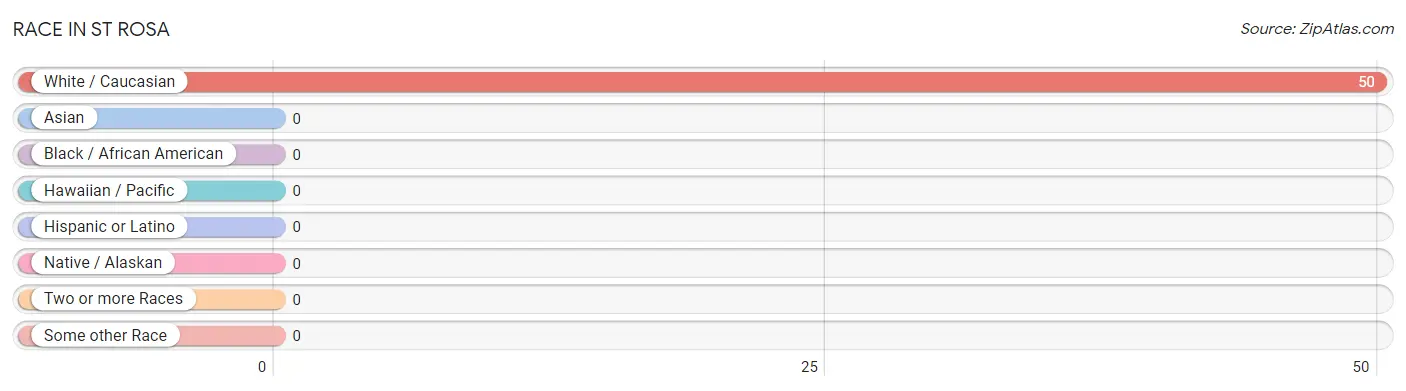
Race in St Rosa
The most populous races in St Rosa are , and White / Caucasian (50 | 100.0%).
| Race | # Population | % Population |
| Asian | 0 | 0.0% |
| Black / African American | 0 | 0.0% |
| Hawaiian / Pacific | 0 | 0.0% |
| Hispanic or Latino | 0 | 0.0% |
| Native / Alaskan | 0 | 0.0% |
| White / Caucasian | 50 | 100.0% |
| Two or more Races | 0 | 0.0% |
| Some other Race | 0 | 0.0% |
| Total | 50 | 100.0% |
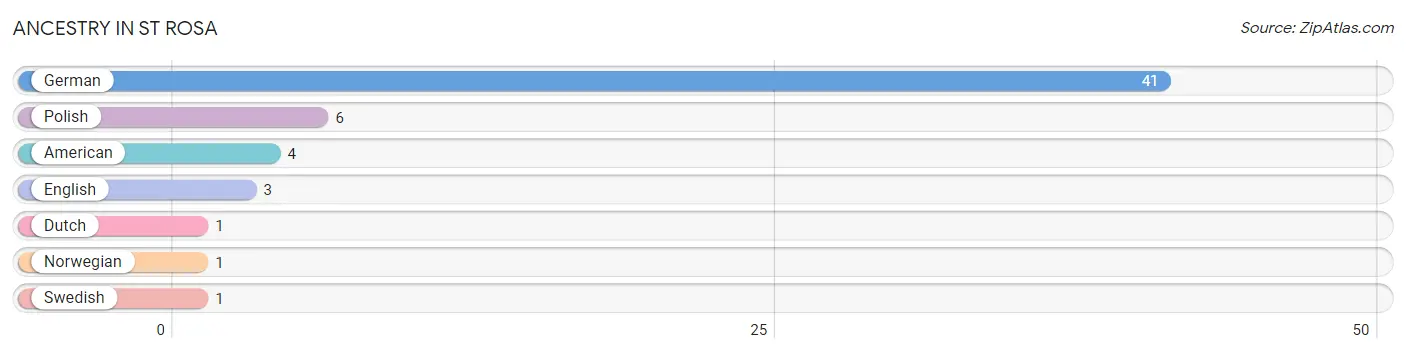
Ancestry in St Rosa
The most populous ancestries reported in St Rosa are German (41 | 82.0%), Polish (6 | 12.0%), American (4 | 8.0%), English (3 | 6.0%), and Dutch (1 | 2.0%), together accounting for 110.0% of all St Rosa residents.
| Ancestry | # Population | % Population |
| American | 4 | 8.0% |
| Dutch | 1 | 2.0% |
| English | 3 | 6.0% |
| German | 41 | 82.0% |
| Norwegian | 1 | 2.0% |
| Polish | 6 | 12.0% |
| Swedish | 1 | 2.0% | View All 7 Rows |
Immigrants in St Rosa

| Immigration Origin | # Population | % Population | View All 0 Rows |
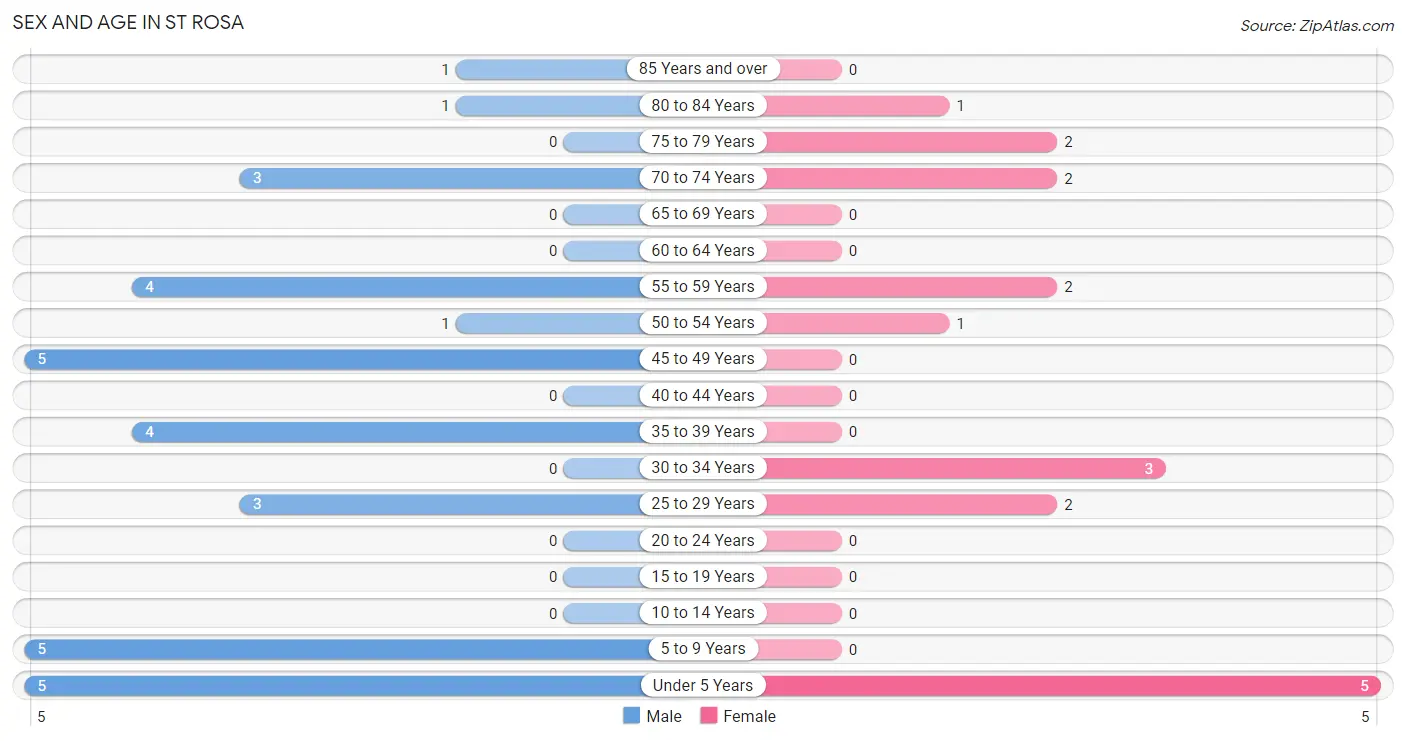
Sex and Age in St Rosa
Sex and Age in St Rosa
The most populous age groups in St Rosa are Under 5 Years (5 | 15.6%) for men and Under 5 Years (5 | 27.8%) for women.
| Age Bracket | Male | Female |
| Under 5 Years | 5 (15.6%) | 5 (27.8%) |
| 5 to 9 Years | 5 (15.6%) | 0 (0.0%) |
| 10 to 14 Years | 0 (0.0%) | 0 (0.0%) |
| 15 to 19 Years | 0 (0.0%) | 0 (0.0%) |
| 20 to 24 Years | 0 (0.0%) | 0 (0.0%) |
| 25 to 29 Years | 3 (9.4%) | 2 (11.1%) |
| 30 to 34 Years | 0 (0.0%) | 3 (16.7%) |
| 35 to 39 Years | 4 (12.5%) | 0 (0.0%) |
| 40 to 44 Years | 0 (0.0%) | 0 (0.0%) |
| 45 to 49 Years | 5 (15.6%) | 0 (0.0%) |
| 50 to 54 Years | 1 (3.1%) | 1 (5.6%) |
| 55 to 59 Years | 4 (12.5%) | 2 (11.1%) |
| 60 to 64 Years | 0 (0.0%) | 0 (0.0%) |
| 65 to 69 Years | 0 (0.0%) | 0 (0.0%) |
| 70 to 74 Years | 3 (9.4%) | 2 (11.1%) |
| 75 to 79 Years | 0 (0.0%) | 2 (11.1%) |
| 80 to 84 Years | 1 (3.1%) | 1 (5.6%) |
| 85 Years and over | 1 (3.1%) | 0 (0.0%) |
| Total | 32 (100.0%) | 18 (100.0%) |
Families and Households in St Rosa
Median Family Size in St Rosa
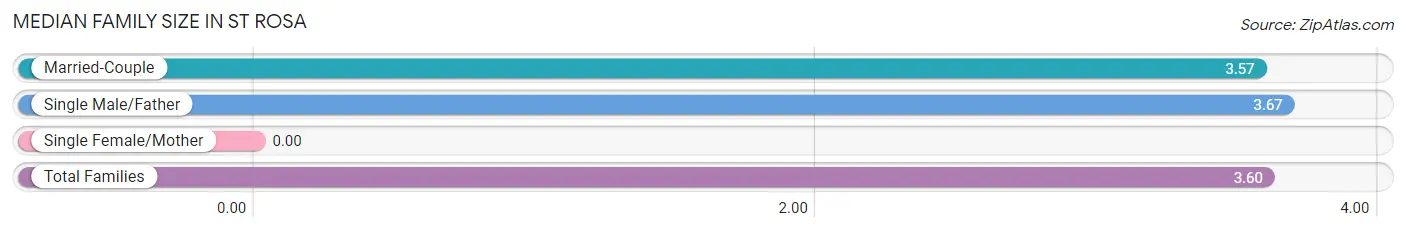
| Family Type | # Families | Family Size |
| Married-Couple | 7 (70.0%) | 3.57 |
| Single Male/Father | 3 (30.0%) | 3.67 |
| Single Female/Mother | 0 (0.0%) | - |
| Total Families | 10 (100.0%) | 3.60 |
Median Household Size in St Rosa
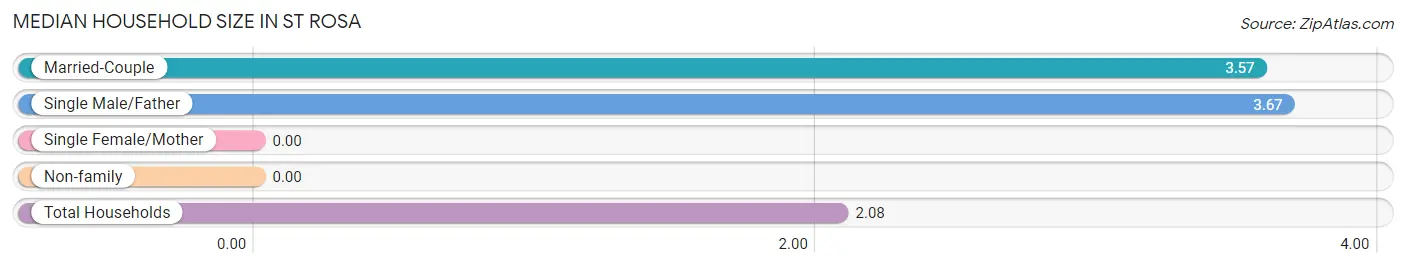
| Household Type | # Households | Household Size |
| Married-Couple | 7 (29.2%) | 3.57 |
| Single Male/Father | 3 (12.5%) | 3.67 |
| Single Female/Mother | 0 (0.0%) | - |
| Non-family | 14 (58.3%) | - |
| Total Households | 24 (100.0%) | 2.08 |
Household Size by Marriage Status in St Rosa
Out of a total of 24 households in St Rosa, 10 (41.7%) are family households, while 14 (58.3%) are nonfamily households. The most numerous type of family households are 3-person households, comprising 6, and the most common type of nonfamily households are 1-person households, comprising 14.
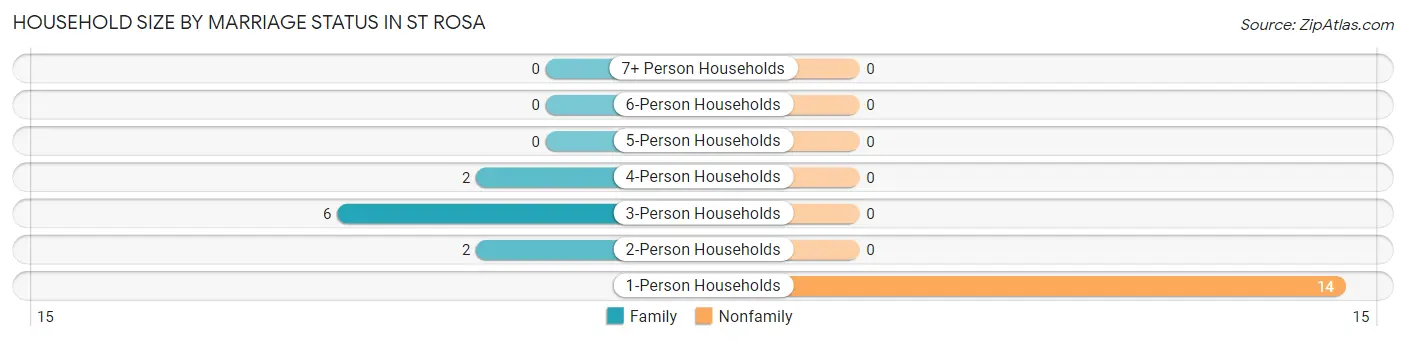
| Household Size | Family Households | Nonfamily Households |
| 1-Person Households | - | 14 (58.3%) |
| 2-Person Households | 2 (8.3%) | 0 (0.0%) |
| 3-Person Households | 6 (25.0%) | 0 (0.0%) |
| 4-Person Households | 2 (8.3%) | 0 (0.0%) |
| 5-Person Households | 0 (0.0%) | 0 (0.0%) |
| 6-Person Households | 0 (0.0%) | 0 (0.0%) |
| 7+ Person Households | 0 (0.0%) | 0 (0.0%) |
| Total | 10 (41.7%) | 14 (58.3%) |
Female Fertility in St Rosa
Fertility by Age in St Rosa
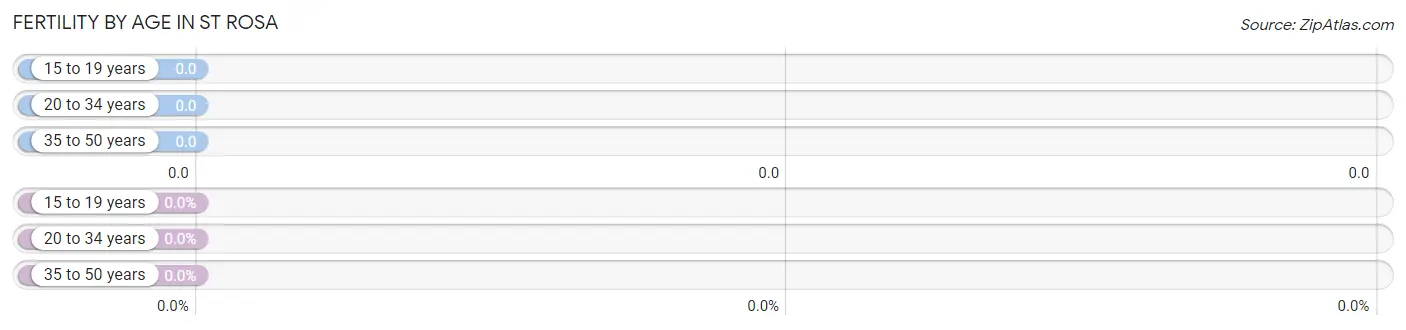
| Age Bracket | Women with Births | Births / 1,000 Women |
| 15 to 19 years | 0 (0.0%) | 0.0 |
| 20 to 34 years | 0 (0.0%) | 0.0 |
| 35 to 50 years | 0 (0.0%) | 0.0 |
| Total | 0 (0.0%) | 0.0 |
Fertility by Age by Marriage Status in St Rosa
| Age Bracket | Married | Unmarried |
| 15 to 19 years | 0 (0.0%) | 0 (0.0%) |
| 20 to 34 years | 0 (0.0%) | 0 (0.0%) |
| 35 to 50 years | 0 (0.0%) | 0 (0.0%) |
| Total | 0 (0.0%) | 0 (0.0%) |
Fertility by Education in St Rosa
| Educational Attainment | Women with Births | Births / 1,000 Women |
| Less than High School | 0 (0.0%) | 0.0 |
| High School Diploma | 0 (0.0%) | 0.0 |
| College or Associate's Degree | 0 (0.0%) | 0.0 |
| Bachelor's Degree | 0 (0.0%) | 0.0 |
| Graduate Degree | 0 (0.0%) | 0.0 |
| Total | 0 (0.0%) | 0.0 |
Fertility by Education by Marriage Status in St Rosa
| Educational Attainment | Married | Unmarried |
| Less than High School | 0 (0.0%) | 0 (0.0%) |
| High School Diploma | 0 (0.0%) | 0 (0.0%) |
| College or Associate's Degree | 0 (0.0%) | 0 (0.0%) |
| Bachelor's Degree | 0 (0.0%) | 0 (0.0%) |
| Graduate Degree | 0 (0.0%) | 0 (0.0%) |
| Total | 0 (0.0%) | 0 (0.0%) |
Income in St Rosa
Income Overview in St Rosa
Per Capita Income in St Rosa is $48,898, while median incomes of families and households are $121,250 and $75,833 respectively.
| Characteristic | Number | Measure |
| Per Capita Income | 50 | $48,898 |
| Median Family Income | 10 | $121,250 |
| Mean Family Income | 10 | $149,470 |
| Median Household Income | 24 | $75,833 |
| Mean Household Income | 24 | $90,771 |
| Income Deficit | 10 | $0 |
| Wage / Income Gap (%) | 50 | 53.42% |
| Wage / Income Gap ($) | 50 | 46.58¢ per $1 |
| Gini / Inequality Index | 50 | 0.47 |
Earnings by Sex in St Rosa
Average Earnings in St Rosa are $75,313, $91,250 for men and $42,500 for women, a difference of 53.4%.
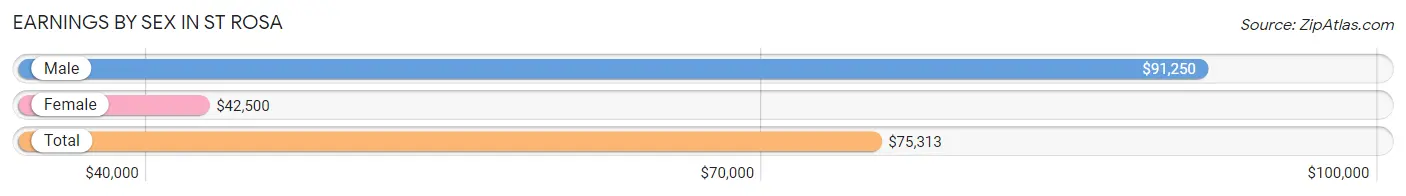
| Sex | Number | Average Earnings |
| Male | 17 (63.0%) | $91,250 |
| Female | 10 (37.0%) | $42,500 |
| Total | 27 (100.0%) | $75,313 |
Earnings by Sex by Income Bracket in St Rosa
The most common earnings brackets in St Rosa are $100,000+ for men (7 | 41.2%) and $40,000 to $44,999 for women (3 | 30.0%).
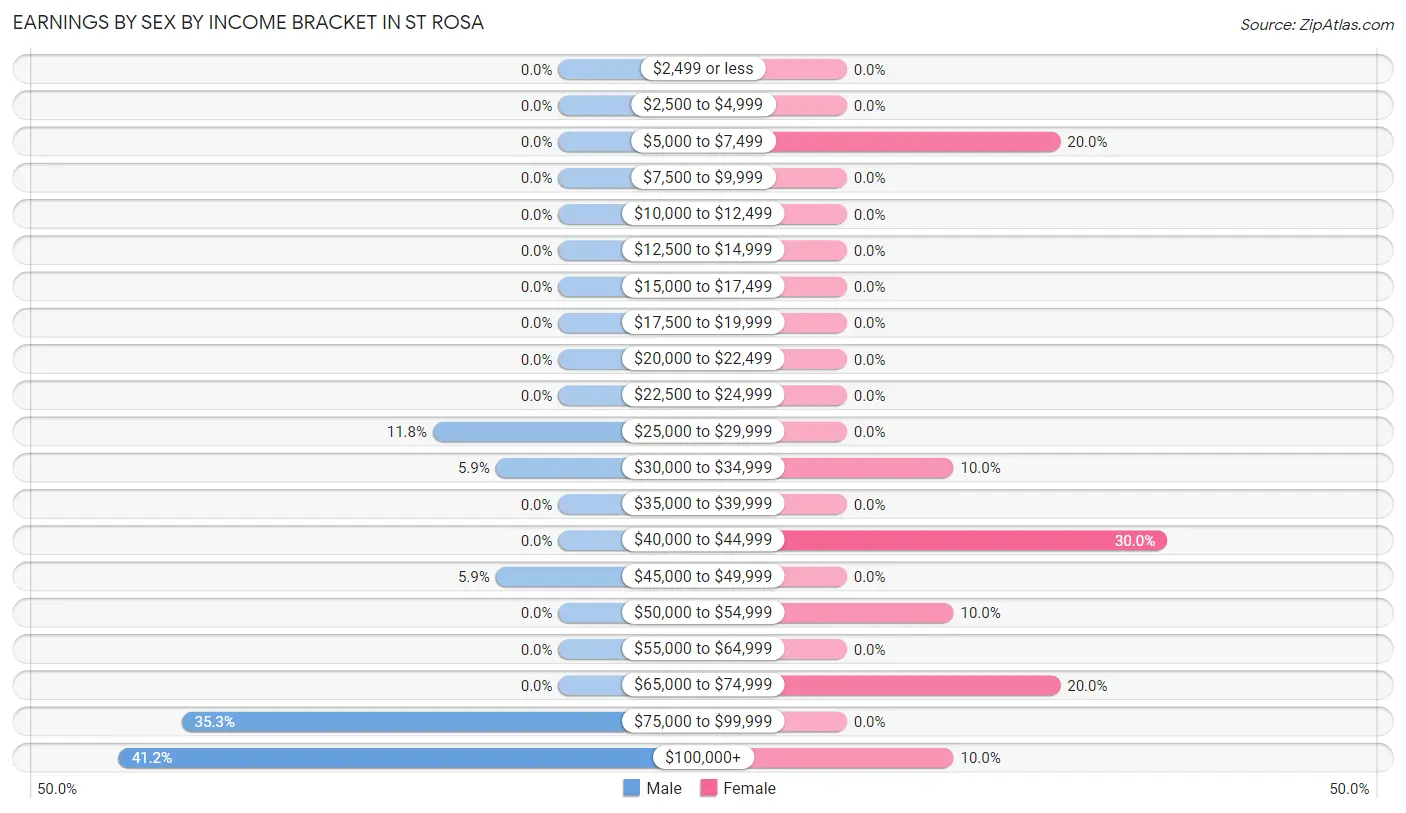
| Income | Male | Female |
| $2,499 or less | 0 (0.0%) | 0 (0.0%) |
| $2,500 to $4,999 | 0 (0.0%) | 0 (0.0%) |
| $5,000 to $7,499 | 0 (0.0%) | 2 (20.0%) |
| $7,500 to $9,999 | 0 (0.0%) | 0 (0.0%) |
| $10,000 to $12,499 | 0 (0.0%) | 0 (0.0%) |
| $12,500 to $14,999 | 0 (0.0%) | 0 (0.0%) |
| $15,000 to $17,499 | 0 (0.0%) | 0 (0.0%) |
| $17,500 to $19,999 | 0 (0.0%) | 0 (0.0%) |
| $20,000 to $22,499 | 0 (0.0%) | 0 (0.0%) |
| $22,500 to $24,999 | 0 (0.0%) | 0 (0.0%) |
| $25,000 to $29,999 | 2 (11.8%) | 0 (0.0%) |
| $30,000 to $34,999 | 1 (5.9%) | 1 (10.0%) |
| $35,000 to $39,999 | 0 (0.0%) | 0 (0.0%) |
| $40,000 to $44,999 | 0 (0.0%) | 3 (30.0%) |
| $45,000 to $49,999 | 1 (5.9%) | 0 (0.0%) |
| $50,000 to $54,999 | 0 (0.0%) | 1 (10.0%) |
| $55,000 to $64,999 | 0 (0.0%) | 0 (0.0%) |
| $65,000 to $74,999 | 0 (0.0%) | 2 (20.0%) |
| $75,000 to $99,999 | 6 (35.3%) | 0 (0.0%) |
| $100,000+ | 7 (41.2%) | 1 (10.0%) |
| Total | 17 (100.0%) | 10 (100.0%) |
Earnings by Sex by Educational Attainment in St Rosa
Average earnings in St Rosa are $91,250 for men and $42,500 for women, a difference of 53.4%. Men with an educational attainment of bachelor's degree enjoy the highest average annual earnings of $117,917, while those with college or associate's degree education earn the least with $75,417. Women with an educational attainment of college or associate's degree earn the most with the average annual earnings of $41,250, while those with college or associate's degree education have the smallest earnings of $41,250.
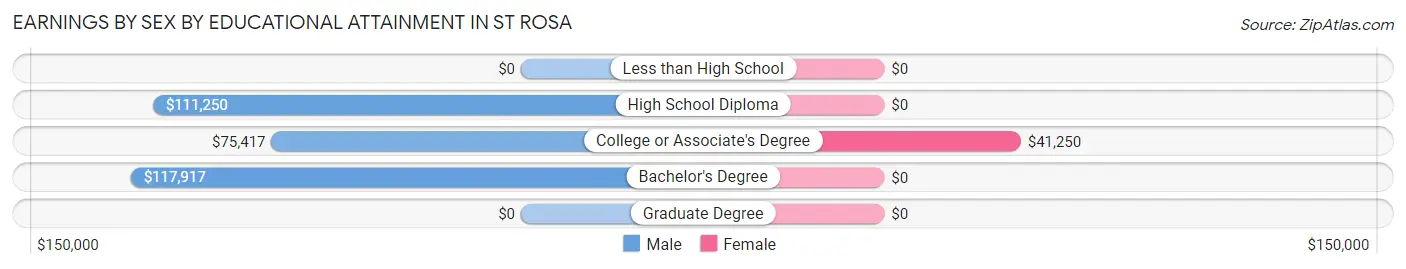
| Educational Attainment | Male Income | Female Income |
| Less than High School | - | - |
| High School Diploma | $111,250 | $0 |
| College or Associate's Degree | $75,417 | $41,250 |
| Bachelor's Degree | $117,917 | $0 |
| Graduate Degree | - | - |
| Total | $91,250 | $42,500 |
Family Income in St Rosa
Family Income Brackets in St Rosa
According to the St Rosa family income data, there are 4 families falling into the $75,000 to $99,999 income range, which is the most common income bracket and makes up 40.0% of all families.
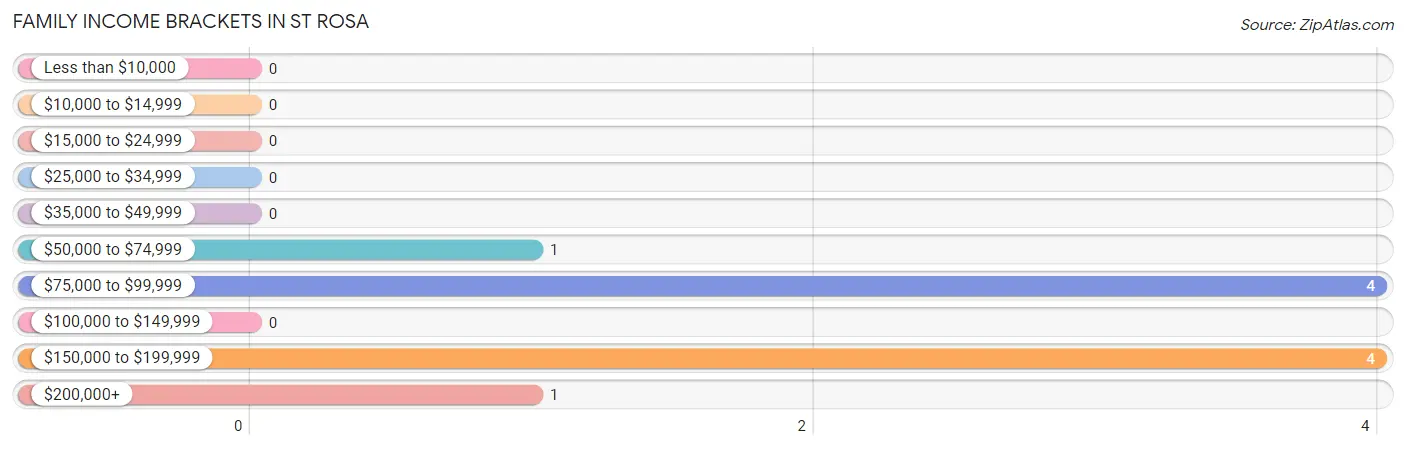
| Income Bracket | # Families | % Families |
| Less than $10,000 | 0 | 0.0% |
| $10,000 to $14,999 | 0 | 0.0% |
| $15,000 to $24,999 | 0 | 0.0% |
| $25,000 to $34,999 | 0 | 0.0% |
| $35,000 to $49,999 | 0 | 0.0% |
| $50,000 to $74,999 | 1 | 10.0% |
| $75,000 to $99,999 | 4 | 40.0% |
| $100,000 to $149,999 | 0 | 0.0% |
| $150,000 to $199,999 | 4 | 40.0% |
| $200,000+ | 1 | 10.0% |
Family Income by Famaliy Size in St Rosa
| Income Bracket | # Families | Median Income |
| 2-Person Families | 2 (20.0%) | $0 |
| 3-Person Families | 6 (60.0%) | $0 |
| 4-Person Families | 2 (20.0%) | $0 |
| 5-Person Families | 0 (0.0%) | $0 |
| 6-Person Families | 0 (0.0%) | $0 |
| 7+ Person Families | 0 (0.0%) | $0 |
| Total | 10 (100.0%) | $121,250 |
Family Income by Number of Earners in St Rosa
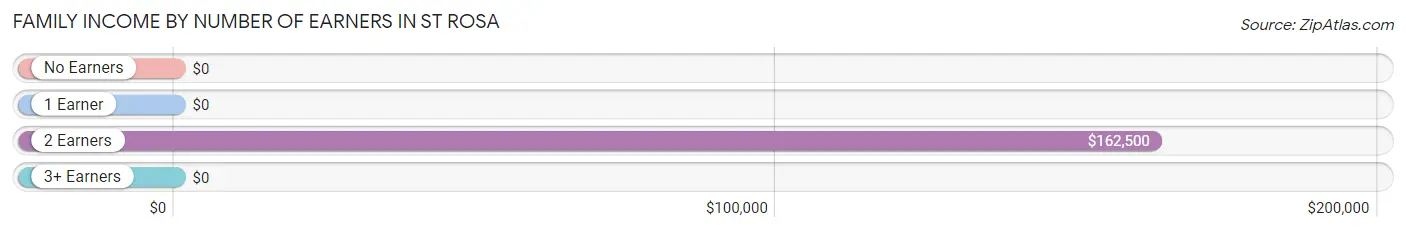
| Number of Earners | # Families | Median Income |
| No Earners | 1 (10.0%) | $0 |
| 1 Earner | 3 (30.0%) | $0 |
| 2 Earners | 4 (40.0%) | $162,500 |
| 3+ Earners | 2 (20.0%) | $0 |
| Total | 10 (100.0%) | $121,250 |
Household Income in St Rosa
Household Income Brackets in St Rosa
With 8 households falling in the category, the $15,000 to $24,999 income range is the most frequent in St Rosa, accounting for 33.3% of all households.
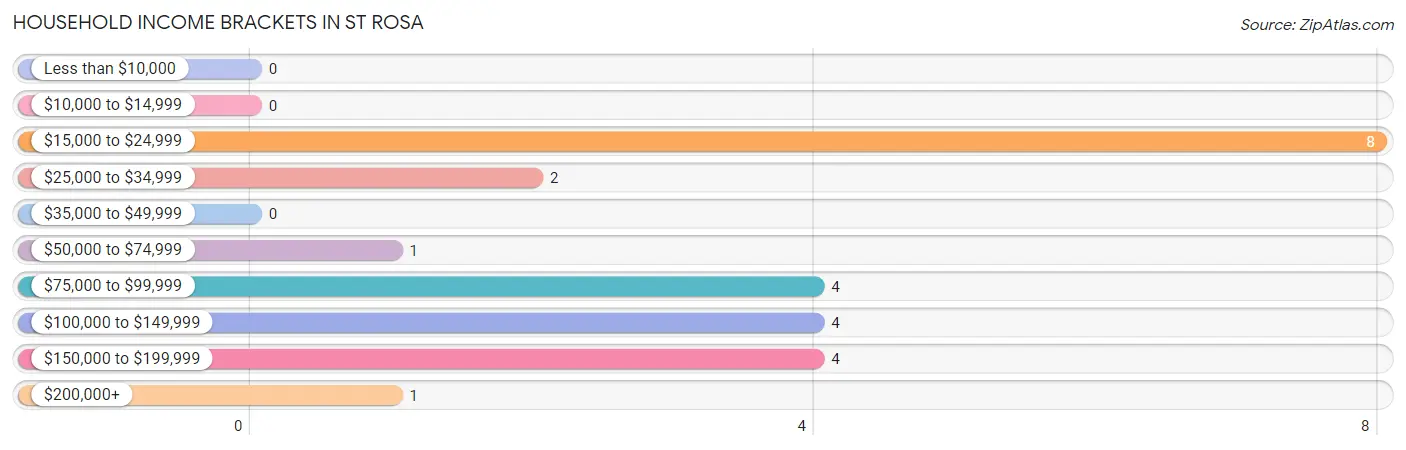
| Income Bracket | # Households | % Households |
| Less than $10,000 | 0 | 0.0% |
| $10,000 to $14,999 | 0 | 0.0% |
| $15,000 to $24,999 | 8 | 33.3% |
| $25,000 to $34,999 | 2 | 8.3% |
| $35,000 to $49,999 | 0 | 0.0% |
| $50,000 to $74,999 | 1 | 4.2% |
| $75,000 to $99,999 | 4 | 16.7% |
| $100,000 to $149,999 | 4 | 16.7% |
| $150,000 to $199,999 | 4 | 16.7% |
| $200,000+ | 1 | 4.2% |
Household Income by Householder Age in St Rosa
The median household income in St Rosa is $75,833, with the highest median household income of $119,167 found in the 25 to 44 years age bracket for the primary householder. A total of 6 households (25.0%) fall into this category.
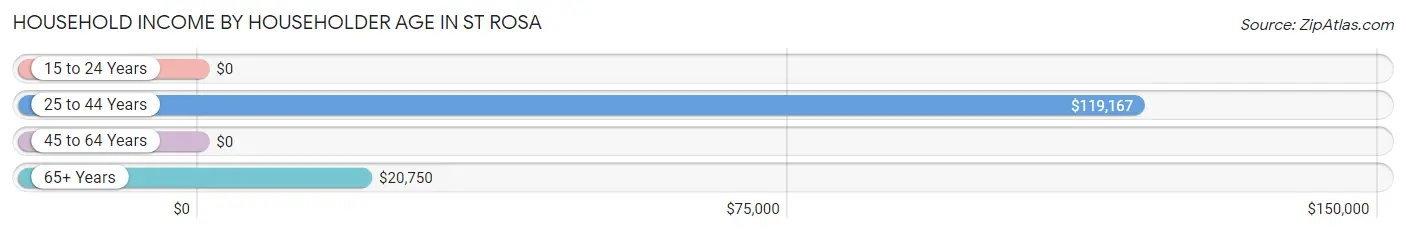
| Income Bracket | # Households | Median Income |
| 15 to 24 Years | 0 (0.0%) | $0 |
| 25 to 44 Years | 6 (25.0%) | $119,167 |
| 45 to 64 Years | 9 (37.5%) | $0 |
| 65+ Years | 9 (37.5%) | $20,750 |
| Total | 24 (100.0%) | $75,833 |
Poverty in St Rosa
Income Below Poverty by Sex and Age in St Rosa
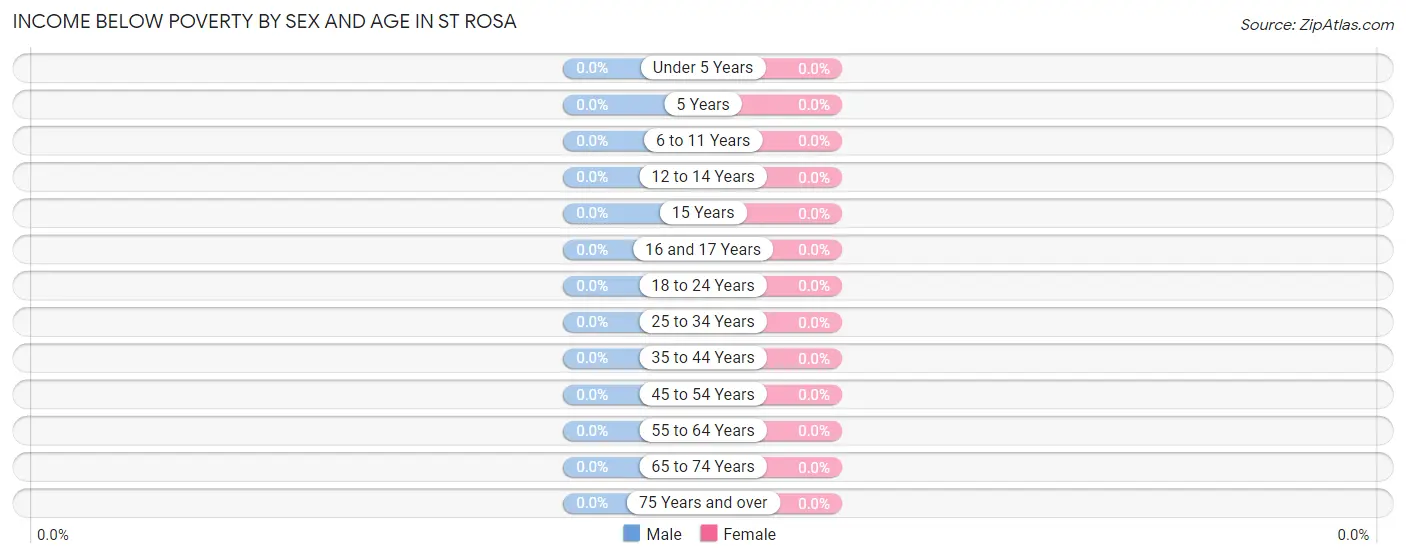
| Age Bracket | Male | Female |
| Under 5 Years | 0 (0.0%) | 0 (0.0%) |
| 5 Years | 0 (0.0%) | 0 (0.0%) |
| 6 to 11 Years | 0 (0.0%) | 0 (0.0%) |
| 12 to 14 Years | 0 (0.0%) | 0 (0.0%) |
| 15 Years | 0 (0.0%) | 0 (0.0%) |
| 16 and 17 Years | 0 (0.0%) | 0 (0.0%) |
| 18 to 24 Years | 0 (0.0%) | 0 (0.0%) |
| 25 to 34 Years | 0 (0.0%) | 0 (0.0%) |
| 35 to 44 Years | 0 (0.0%) | 0 (0.0%) |
| 45 to 54 Years | 0 (0.0%) | 0 (0.0%) |
| 55 to 64 Years | 0 (0.0%) | 0 (0.0%) |
| 65 to 74 Years | 0 (0.0%) | 0 (0.0%) |
| 75 Years and over | 0 (0.0%) | 0 (0.0%) |
| Total | 0 (0.0%) | 0 (0.0%) |
Income Above Poverty by Sex and Age in St Rosa
According to the poverty statistics in St Rosa, males aged under 5 years and females aged under 5 years are the age groups that are most secure financially, with 100.0% of males and 100.0% of females in these age groups living above the poverty line.
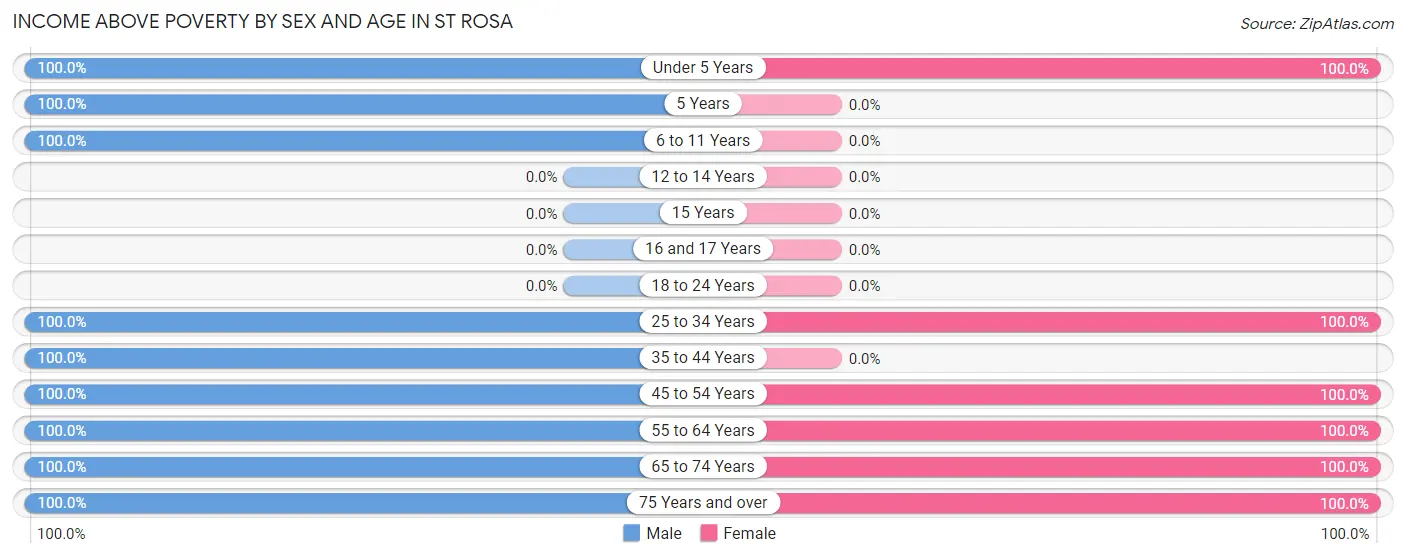
| Age Bracket | Male | Female |
| Under 5 Years | 5 (100.0%) | 5 (100.0%) |
| 5 Years | 1 (100.0%) | 0 (0.0%) |
| 6 to 11 Years | 4 (100.0%) | 0 (0.0%) |
| 12 to 14 Years | 0 (0.0%) | 0 (0.0%) |
| 15 Years | 0 (0.0%) | 0 (0.0%) |
| 16 and 17 Years | 0 (0.0%) | 0 (0.0%) |
| 18 to 24 Years | 0 (0.0%) | 0 (0.0%) |
| 25 to 34 Years | 3 (100.0%) | 5 (100.0%) |
| 35 to 44 Years | 4 (100.0%) | 0 (0.0%) |
| 45 to 54 Years | 6 (100.0%) | 1 (100.0%) |
| 55 to 64 Years | 4 (100.0%) | 2 (100.0%) |
| 65 to 74 Years | 3 (100.0%) | 2 (100.0%) |
| 75 Years and over | 2 (100.0%) | 3 (100.0%) |
| Total | 32 (100.0%) | 18 (100.0%) |
Income Below Poverty Among Married-Couple Families in St Rosa
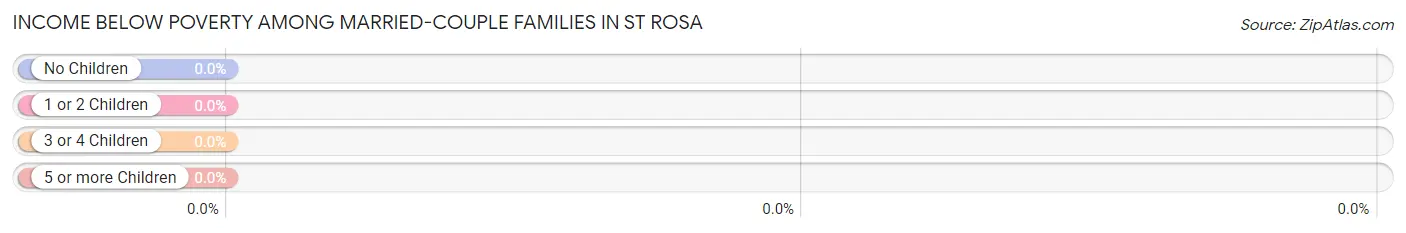
| Children | Above Poverty | Below Poverty |
| No Children | 4 (100.0%) | 0 (0.0%) |
| 1 or 2 Children | 3 (100.0%) | 0 (0.0%) |
| 3 or 4 Children | 0 (0.0%) | 0 (0.0%) |
| 5 or more Children | 0 (0.0%) | 0 (0.0%) |
| Total | 7 (100.0%) | 0 (0.0%) |
Income Below Poverty Among Single-Parent Households in St Rosa
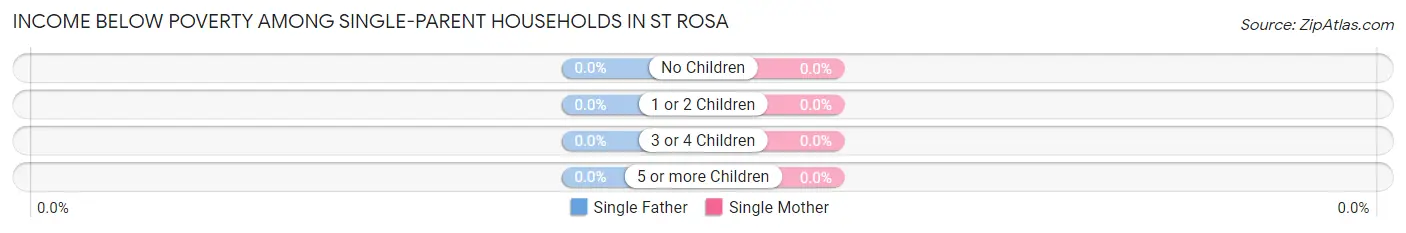
| Children | Single Father | Single Mother |
| No Children | 0 (0.0%) | 0 (0.0%) |
| 1 or 2 Children | 0 (0.0%) | 0 (0.0%) |
| 3 or 4 Children | 0 (0.0%) | 0 (0.0%) |
| 5 or more Children | 0 (0.0%) | 0 (0.0%) |
| Total | 0 (0.0%) | 0 (0.0%) |
Income Below Poverty Among Married-Couple vs Single-Parent Households in St Rosa
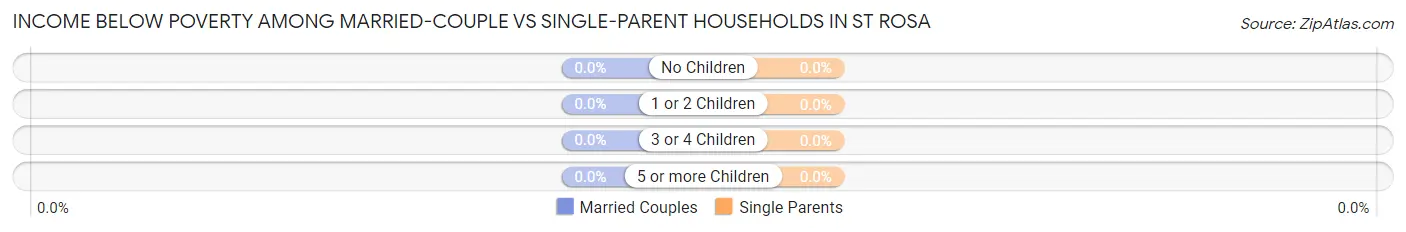
| Children | Married-Couple Families | Single-Parent Households |
| No Children | 0 (0.0%) | 0 (0.0%) |
| 1 or 2 Children | 0 (0.0%) | 0 (0.0%) |
| 3 or 4 Children | 0 (0.0%) | 0 (0.0%) |
| 5 or more Children | 0 (0.0%) | 0 (0.0%) |
| Total | 0 (0.0%) | 0 (0.0%) |
Employment Characteristics in St Rosa
Employment by Class of Employer in St Rosa
Among the 27 employed individuals in St Rosa, private company employees (12 | 44.4%), self-employed (not incorporated) (7 | 25.9%), and self-employed (incorporated) (5 | 18.5%) make up the most common classes of employment.
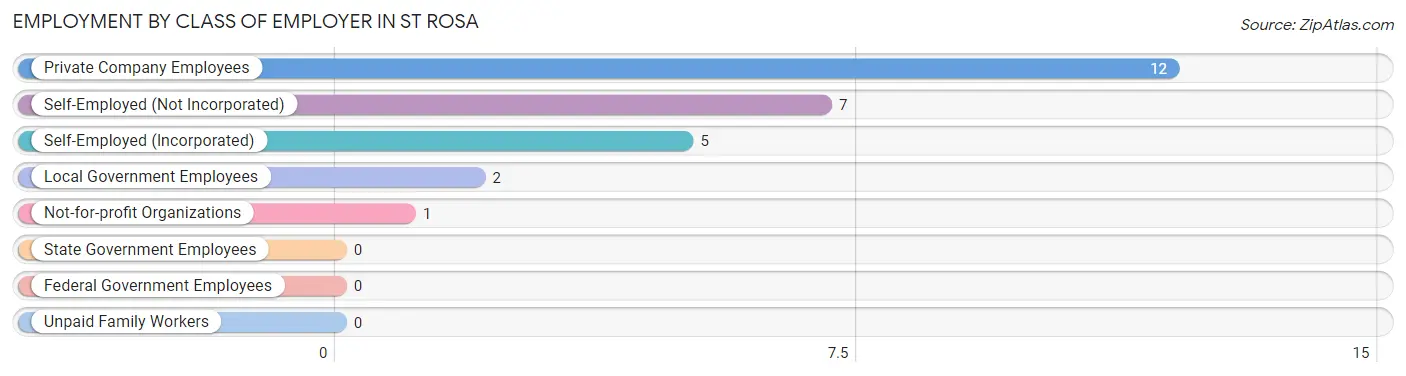
| Employer Class | # Employees | % Employees |
| Private Company Employees | 12 | 44.4% |
| Self-Employed (Incorporated) | 5 | 18.5% |
| Self-Employed (Not Incorporated) | 7 | 25.9% |
| Not-for-profit Organizations | 1 | 3.7% |
| Local Government Employees | 2 | 7.4% |
| State Government Employees | 0 | 0.0% |
| Federal Government Employees | 0 | 0.0% |
| Unpaid Family Workers | 0 | 0.0% |
| Total | 27 | 100.0% |
Employment Status by Age in St Rosa
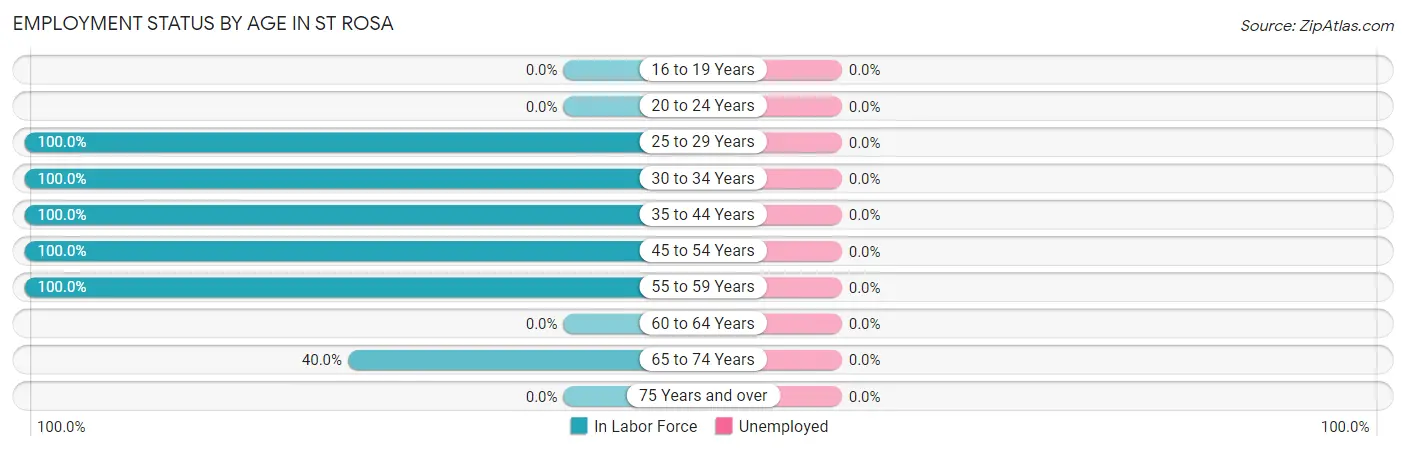
| Age Bracket | In Labor Force | Unemployed |
| 16 to 19 Years | 0 (0.0%) | 0 (0.0%) |
| 20 to 24 Years | 0 (0.0%) | 0 (0.0%) |
| 25 to 29 Years | 5 (100.0%) | 0 (0.0%) |
| 30 to 34 Years | 3 (100.0%) | 0 (0.0%) |
| 35 to 44 Years | 4 (100.0%) | 0 (0.0%) |
| 45 to 54 Years | 7 (100.0%) | 0 (0.0%) |
| 55 to 59 Years | 6 (100.0%) | 0 (0.0%) |
| 60 to 64 Years | 0 (0.0%) | 0 (0.0%) |
| 65 to 74 Years | 2 (40.0%) | 0 (0.0%) |
| 75 Years and over | 0 (0.0%) | 0 (0.0%) |
| Total | 27 (77.1%) | 0 (0.0%) |
Employment Status by Educational Attainment in St Rosa
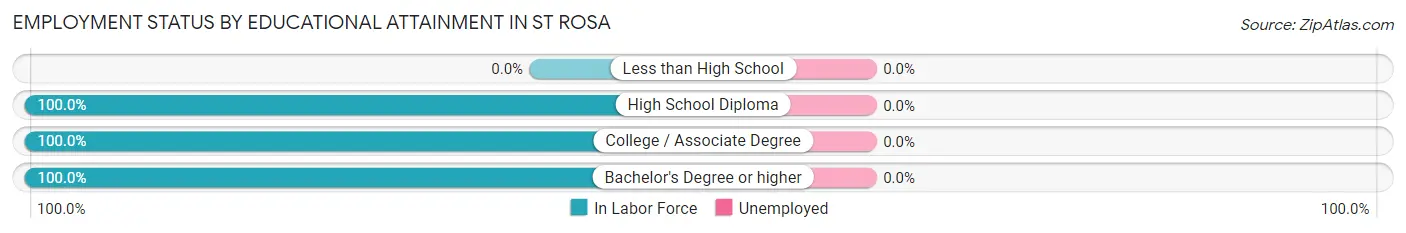
| Educational Attainment | In Labor Force | Unemployed |
| Less than High School | 0 (0.0%) | 0 (0.0%) |
| High School Diploma | 6 (100.0%) | 0 (0.0%) |
| College / Associate Degree | 11 (100.0%) | 0 (0.0%) |
| Bachelor's Degree or higher | 8 (100.0%) | 0 (0.0%) |
| Total | 25 (100.0%) | 0 (0.0%) |
Employment Occupations by Sex in St Rosa
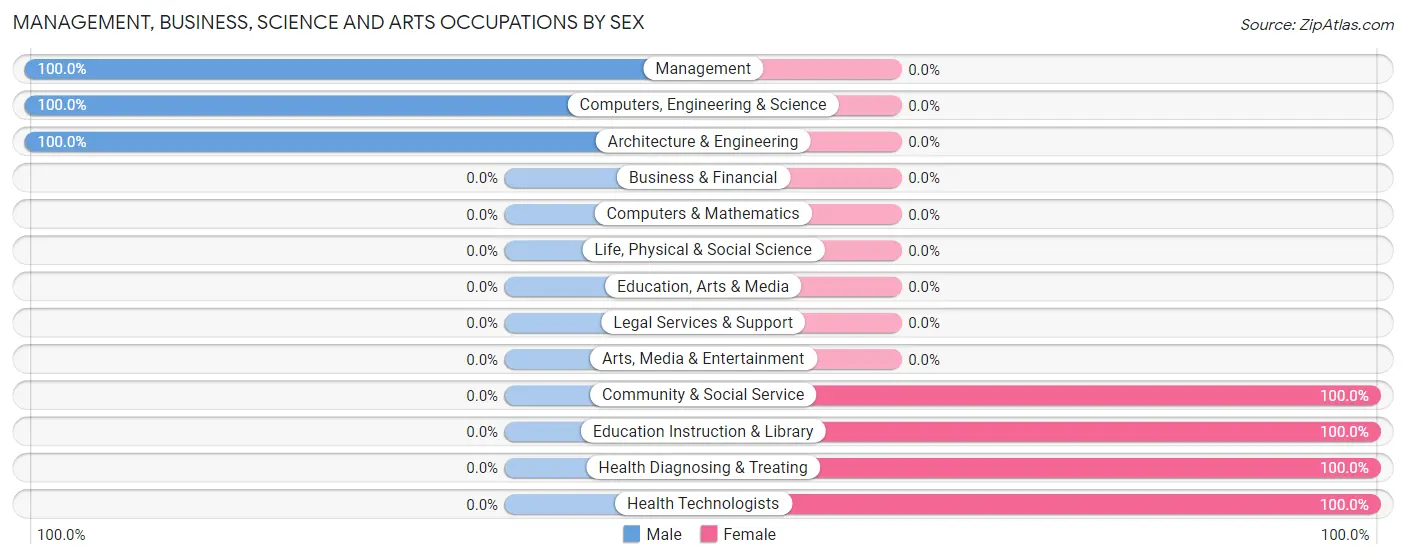
Management, Business, Science and Arts Occupations
The most common Management, Business, Science and Arts occupations in St Rosa are Computers, Engineering & Science (6 | 22.2%), Architecture & Engineering (6 | 22.2%), Management (2 | 7.4%), Community & Social Service (2 | 7.4%), and Education Instruction & Library (2 | 7.4%).
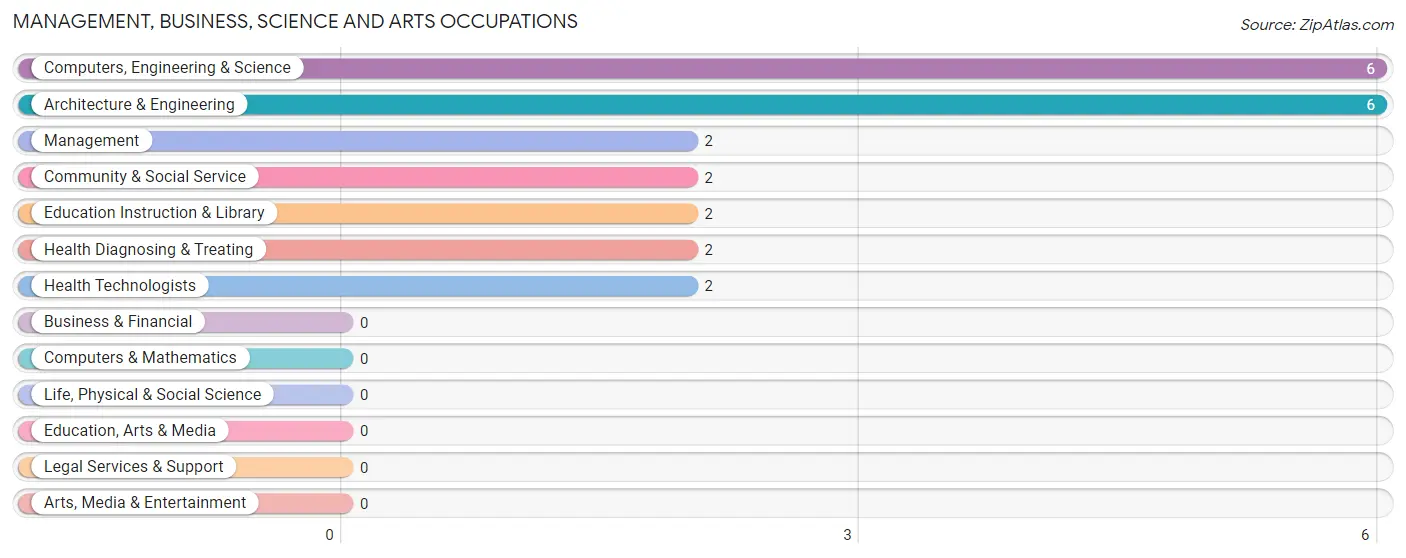
Management, Business, Science and Arts Occupations by Sex
Within the Management, Business, Science and Arts occupations in St Rosa, the most male-oriented occupations are Management (100.0%), Computers, Engineering & Science (100.0%), and Architecture & Engineering (100.0%), while the most female-oriented occupations are Community & Social Service (100.0%), Education Instruction & Library (100.0%), and Health Diagnosing & Treating (100.0%).
| Occupation | Male | Female |
| Management | 2 (100.0%) | 0 (0.0%) |
| Business & Financial | 0 (0.0%) | 0 (0.0%) |
| Computers, Engineering & Science | 6 (100.0%) | 0 (0.0%) |
| Computers & Mathematics | 0 (0.0%) | 0 (0.0%) |
| Architecture & Engineering | 6 (100.0%) | 0 (0.0%) |
| Life, Physical & Social Science | 0 (0.0%) | 0 (0.0%) |
| Community & Social Service | 0 (0.0%) | 2 (100.0%) |
| Education, Arts & Media | 0 (0.0%) | 0 (0.0%) |
| Legal Services & Support | 0 (0.0%) | 0 (0.0%) |
| Education Instruction & Library | 0 (0.0%) | 2 (100.0%) |
| Arts, Media & Entertainment | 0 (0.0%) | 0 (0.0%) |
| Health Diagnosing & Treating | 0 (0.0%) | 2 (100.0%) |
| Health Technologists | 0 (0.0%) | 2 (100.0%) |
| Total (Category) | 8 (66.7%) | 4 (33.3%) |
| Total (Overall) | 17 (63.0%) | 10 (37.0%) |
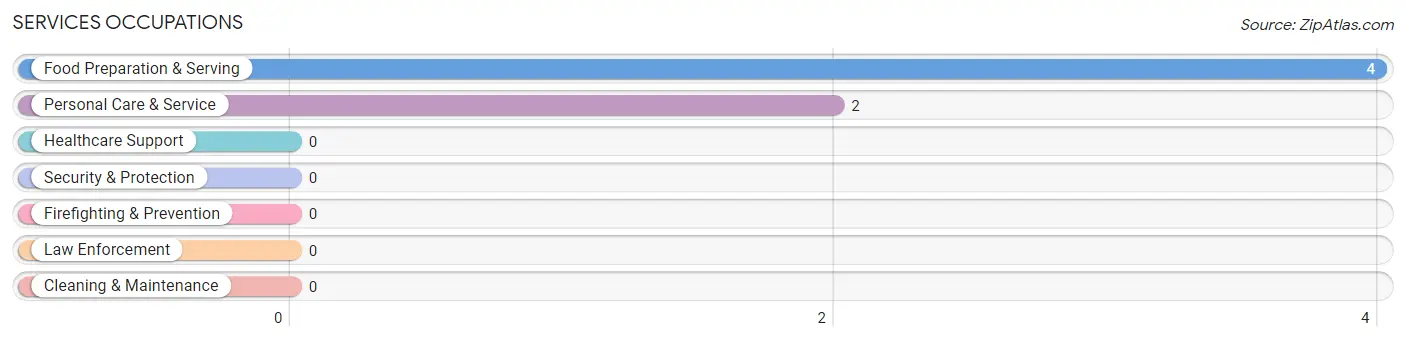
Services Occupations
The most common Services occupations in St Rosa are Food Preparation & Serving (4 | 14.8%), and Personal Care & Service (2 | 7.4%).
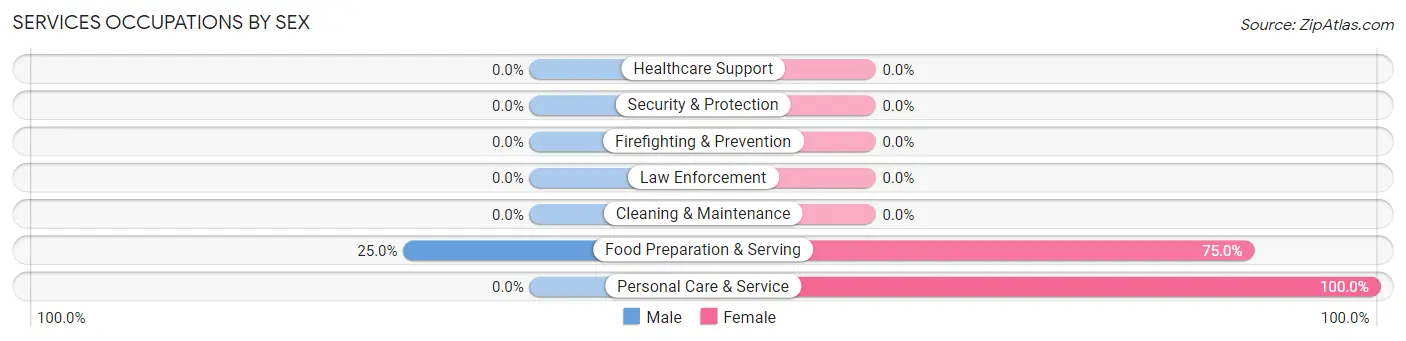
Services Occupations by Sex
| Occupation | Male | Female |
| Healthcare Support | 0 (0.0%) | 0 (0.0%) |
| Security & Protection | 0 (0.0%) | 0 (0.0%) |
| Firefighting & Prevention | 0 (0.0%) | 0 (0.0%) |
| Law Enforcement | 0 (0.0%) | 0 (0.0%) |
| Food Preparation & Serving | 1 (25.0%) | 3 (75.0%) |
| Cleaning & Maintenance | 0 (0.0%) | 0 (0.0%) |
| Personal Care & Service | 0 (0.0%) | 2 (100.0%) |
| Total (Category) | 1 (16.7%) | 5 (83.3%) |
| Total (Overall) | 17 (63.0%) | 10 (37.0%) |
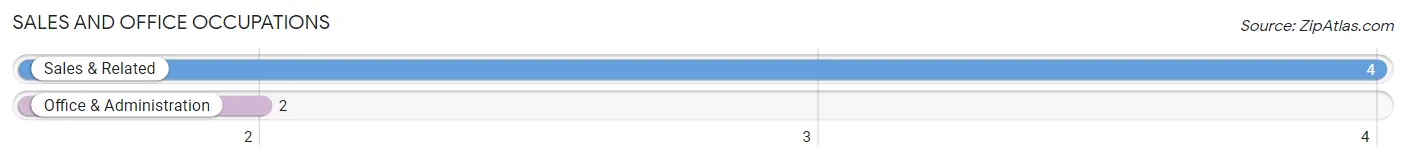
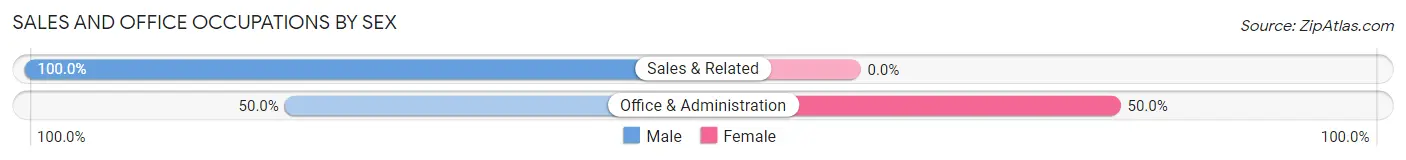
Sales and Office Occupations
The most common Sales and Office occupations in St Rosa are Sales & Related (4 | 14.8%), and Office & Administration (2 | 7.4%).
Sales and Office Occupations by Sex
| Occupation | Male | Female |
| Sales & Related | 4 (100.0%) | 0 (0.0%) |
| Office & Administration | 1 (50.0%) | 1 (50.0%) |
| Total (Category) | 5 (83.3%) | 1 (16.7%) |
| Total (Overall) | 17 (63.0%) | 10 (37.0%) |
Natural Resources, Construction and Maintenance Occupations
The most common Natural Resources, Construction and Maintenance occupations in St Rosa are Farming, Fishing & Forestry (1 | 3.7%), and Construction & Extraction (1 | 3.7%).
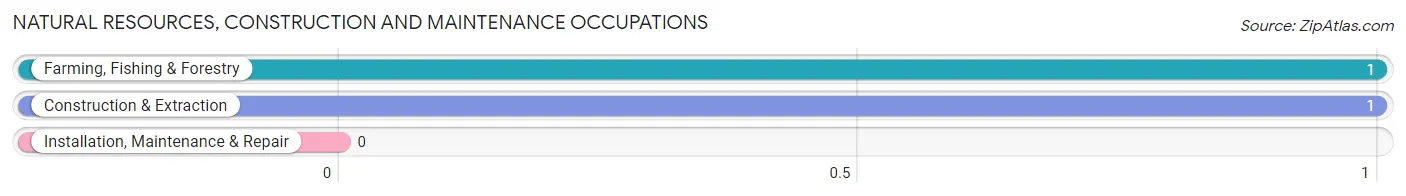
Natural Resources, Construction and Maintenance Occupations by Sex
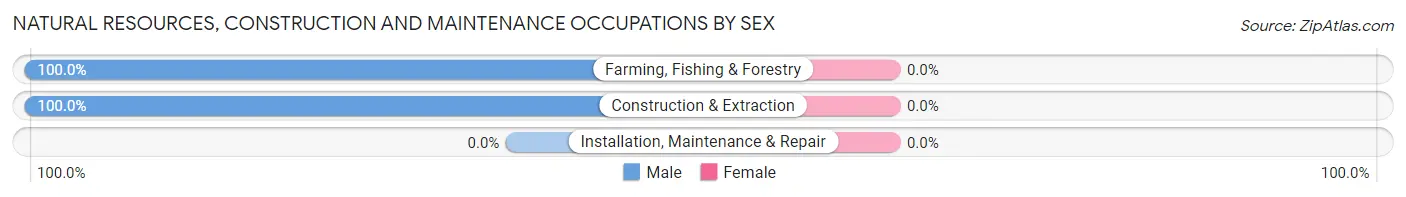
| Occupation | Male | Female |
| Farming, Fishing & Forestry | 1 (100.0%) | 0 (0.0%) |
| Construction & Extraction | 1 (100.0%) | 0 (0.0%) |
| Installation, Maintenance & Repair | 0 (0.0%) | 0 (0.0%) |
| Total (Category) | 2 (100.0%) | 0 (0.0%) |
| Total (Overall) | 17 (63.0%) | 10 (37.0%) |
Production, Transportation and Moving Occupations
The most common Production, Transportation and Moving occupations in St Rosa are , and Production (1 | 3.7%).
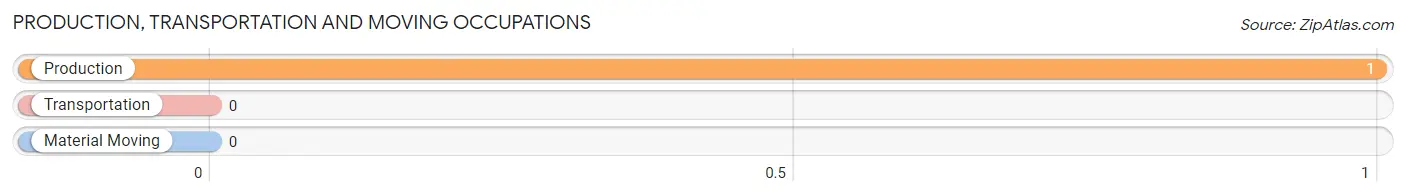
Production, Transportation and Moving Occupations by Sex
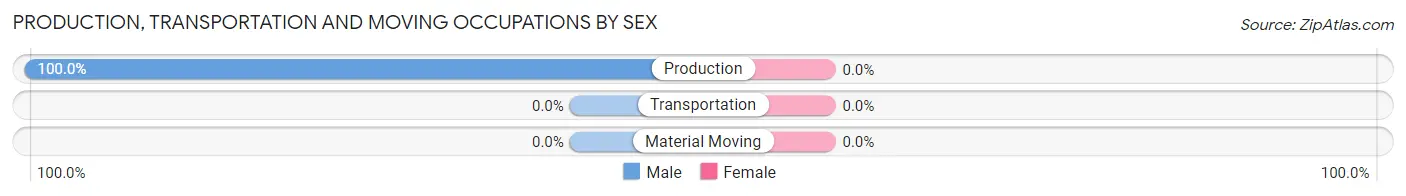
| Occupation | Male | Female |
| Production | 1 (100.0%) | 0 (0.0%) |
| Transportation | 0 (0.0%) | 0 (0.0%) |
| Material Moving | 0 (0.0%) | 0 (0.0%) |
| Total (Category) | 1 (100.0%) | 0 (0.0%) |
| Total (Overall) | 17 (63.0%) | 10 (37.0%) |
Employment Industries by Sex in St Rosa
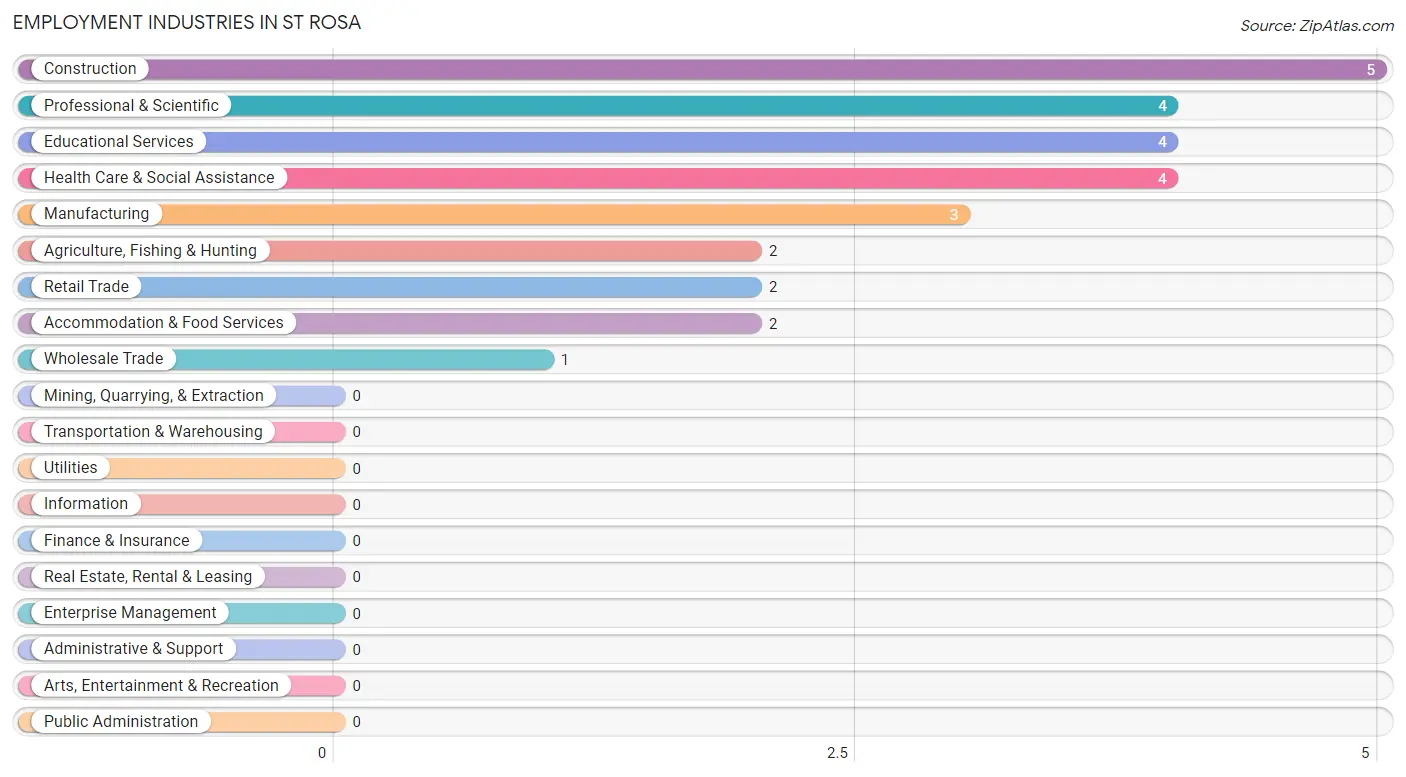
Employment Industries in St Rosa
The major employment industries in St Rosa include Construction (5 | 18.5%), Professional & Scientific (4 | 14.8%), Educational Services (4 | 14.8%), Health Care & Social Assistance (4 | 14.8%), and Manufacturing (3 | 11.1%).
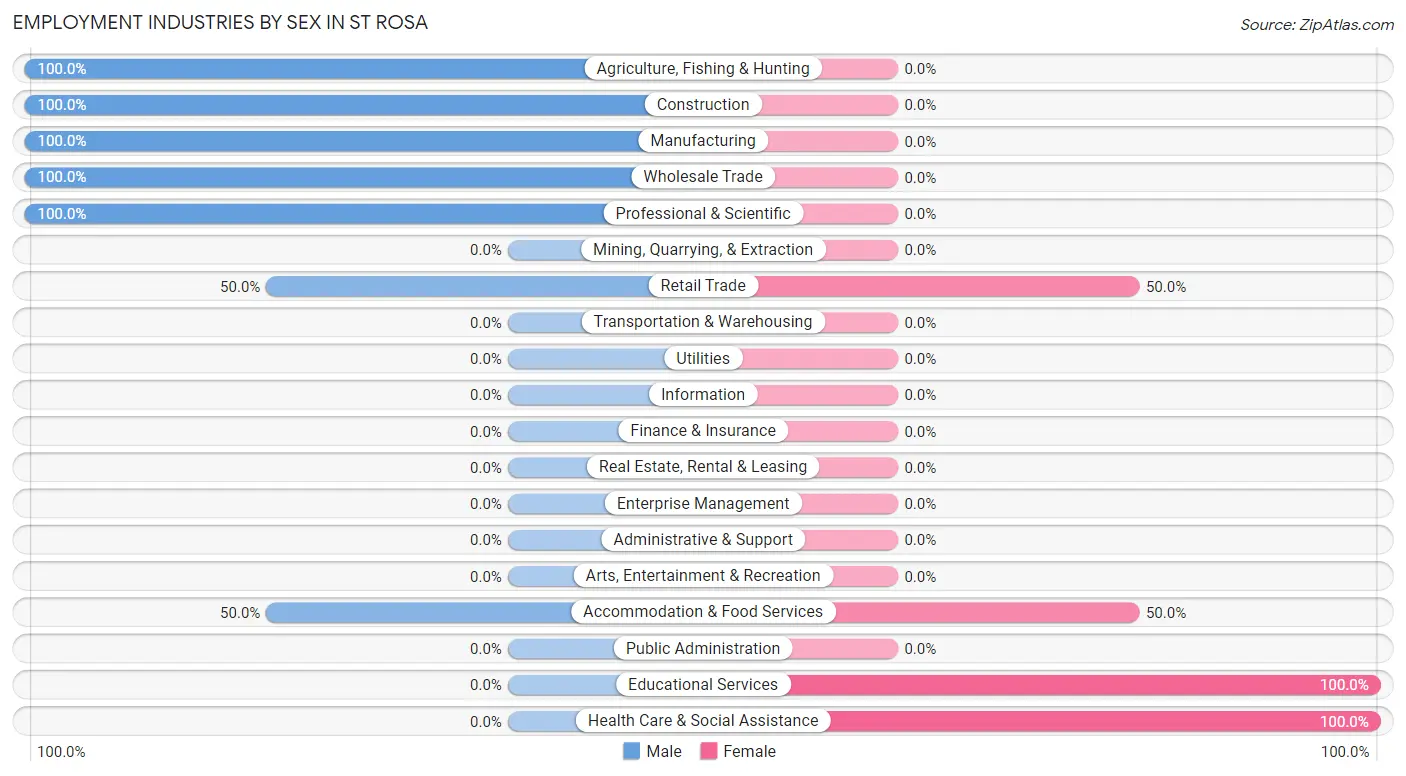
Employment Industries by Sex in St Rosa
The St Rosa industries that see more men than women are Agriculture, Fishing & Hunting (100.0%), Construction (100.0%), and Manufacturing (100.0%), whereas the industries that tend to have a higher number of women are Educational Services (100.0%), Health Care & Social Assistance (100.0%), and Retail Trade (50.0%).
| Industry | Male | Female |
| Agriculture, Fishing & Hunting | 2 (100.0%) | 0 (0.0%) |
| Mining, Quarrying, & Extraction | 0 (0.0%) | 0 (0.0%) |
| Construction | 5 (100.0%) | 0 (0.0%) |
| Manufacturing | 3 (100.0%) | 0 (0.0%) |
| Wholesale Trade | 1 (100.0%) | 0 (0.0%) |
| Retail Trade | 1 (50.0%) | 1 (50.0%) |
| Transportation & Warehousing | 0 (0.0%) | 0 (0.0%) |
| Utilities | 0 (0.0%) | 0 (0.0%) |
| Information | 0 (0.0%) | 0 (0.0%) |
| Finance & Insurance | 0 (0.0%) | 0 (0.0%) |
| Real Estate, Rental & Leasing | 0 (0.0%) | 0 (0.0%) |
| Professional & Scientific | 4 (100.0%) | 0 (0.0%) |
| Enterprise Management | 0 (0.0%) | 0 (0.0%) |
| Administrative & Support | 0 (0.0%) | 0 (0.0%) |
| Educational Services | 0 (0.0%) | 4 (100.0%) |
| Health Care & Social Assistance | 0 (0.0%) | 4 (100.0%) |
| Arts, Entertainment & Recreation | 0 (0.0%) | 0 (0.0%) |
| Accommodation & Food Services | 1 (50.0%) | 1 (50.0%) |
| Public Administration | 0 (0.0%) | 0 (0.0%) |
| Total | 17 (63.0%) | 10 (37.0%) |
Education in St Rosa
School Enrollment in St Rosa
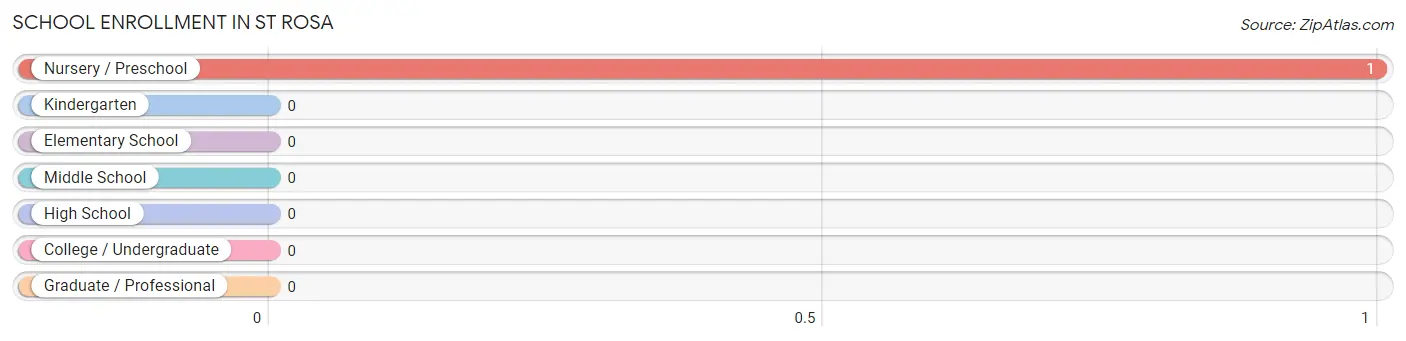
| School Level | # Students | % Students |
| Nursery / Preschool | 1 | 100.0% |
| Kindergarten | 0 | 0.0% |
| Elementary School | 0 | 0.0% |
| Middle School | 0 | 0.0% |
| High School | 0 | 0.0% |
| College / Undergraduate | 0 | 0.0% |
| Graduate / Professional | 0 | 0.0% |
| Total | 1 | 100.0% |
School Enrollment by Age by Funding Source in St Rosa
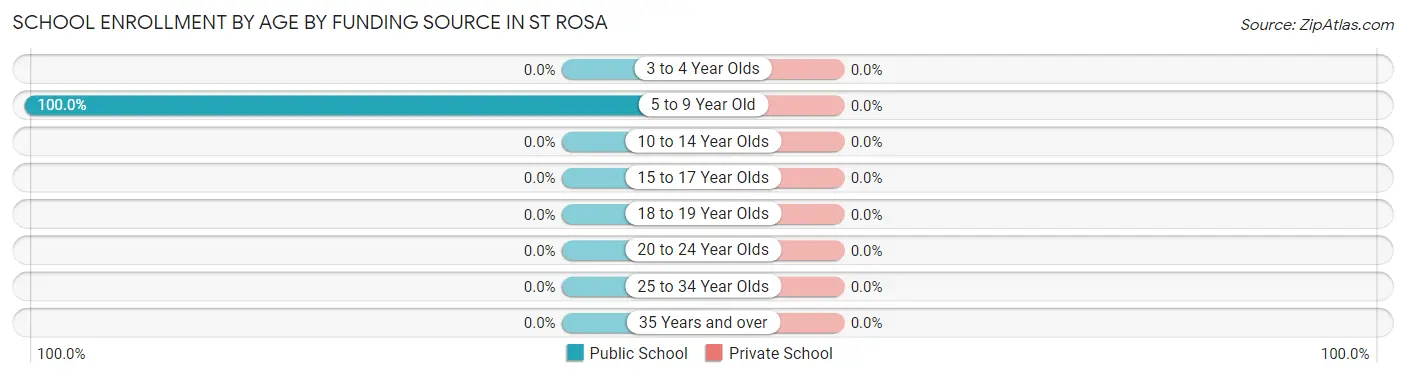
| Age Bracket | Public School | Private School |
| 3 to 4 Year Olds | 0 (0.0%) | 0 (0.0%) |
| 5 to 9 Year Old | 1 (100.0%) | 0 (0.0%) |
| 10 to 14 Year Olds | 0 (0.0%) | 0 (0.0%) |
| 15 to 17 Year Olds | 0 (0.0%) | 0 (0.0%) |
| 18 to 19 Year Olds | 0 (0.0%) | 0 (0.0%) |
| 20 to 24 Year Olds | 0 (0.0%) | 0 (0.0%) |
| 25 to 34 Year Olds | 0 (0.0%) | 0 (0.0%) |
| 35 Years and over | 0 (0.0%) | 0 (0.0%) |
| Total | 1 (100.0%) | 0 (0.0%) |
Educational Attainment by Field of Study in St Rosa
Bio, nature & agricultural (4 | 44.4%), education (2 | 22.2%), social sciences (1 | 11.1%), science & technology (1 | 11.1%), and communications (1 | 11.1%) are the most common fields of study among 9 individuals in St Rosa who have obtained a bachelor's degree or higher.
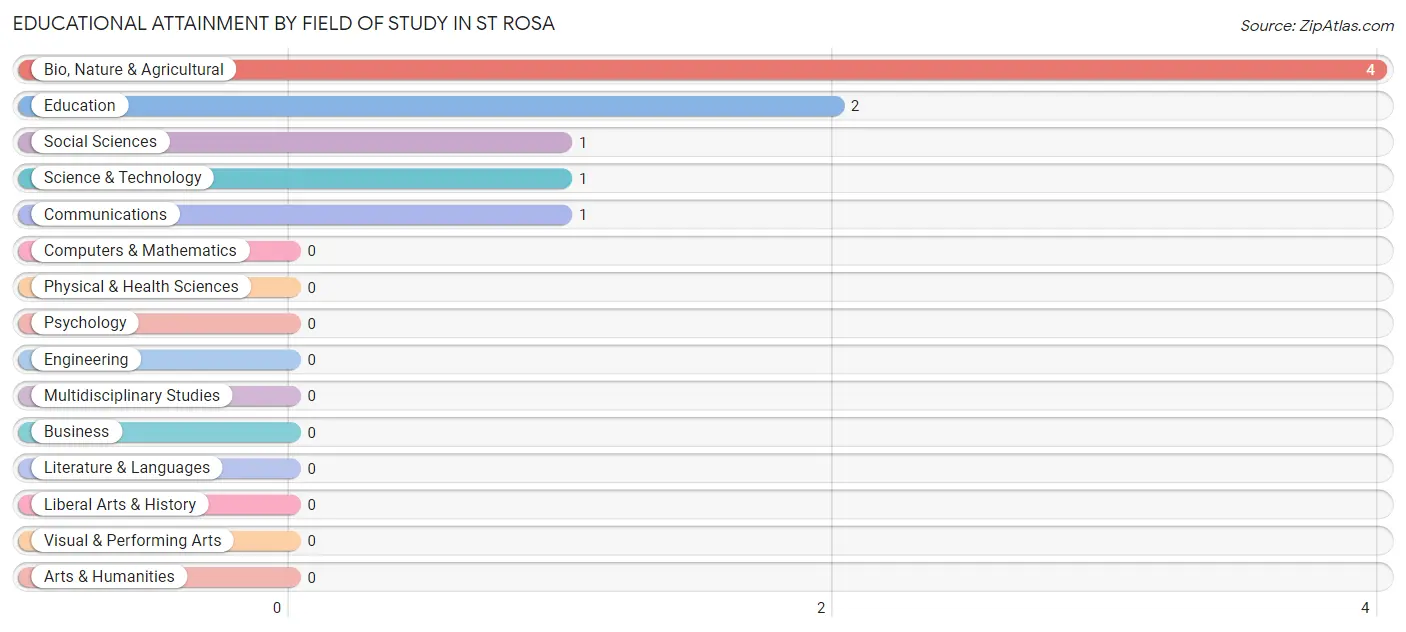
| Field of Study | # Graduates | % Graduates |
| Computers & Mathematics | 0 | 0.0% |
| Bio, Nature & Agricultural | 4 | 44.4% |
| Physical & Health Sciences | 0 | 0.0% |
| Psychology | 0 | 0.0% |
| Social Sciences | 1 | 11.1% |
| Engineering | 0 | 0.0% |
| Multidisciplinary Studies | 0 | 0.0% |
| Science & Technology | 1 | 11.1% |
| Business | 0 | 0.0% |
| Education | 2 | 22.2% |
| Literature & Languages | 0 | 0.0% |
| Liberal Arts & History | 0 | 0.0% |
| Visual & Performing Arts | 0 | 0.0% |
| Communications | 1 | 11.1% |
| Arts & Humanities | 0 | 0.0% |
| Total | 9 | 100.0% |
Transportation & Commute in St Rosa
Vehicle Availability by Sex in St Rosa
The most prevalent vehicle ownership categories in St Rosa are males with 3 vehicles (6, accounting for 35.3%) and females with 3 vehicles (3, making up 60.0%).
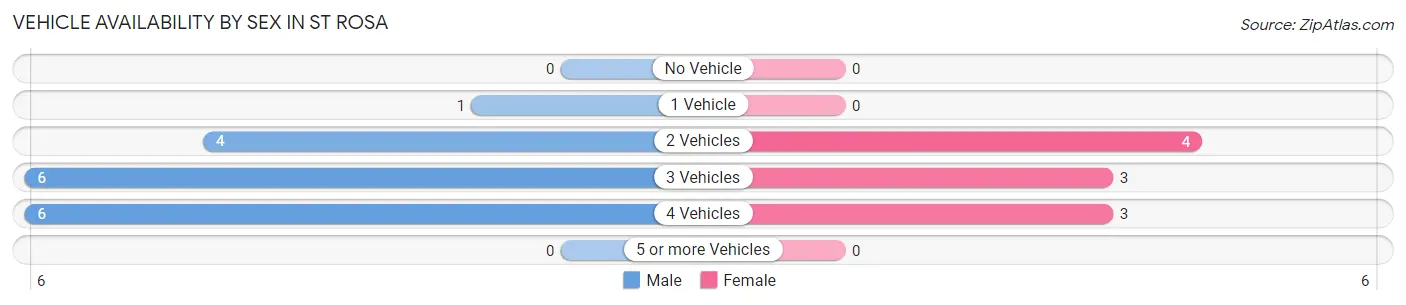
| Vehicles Available | Male | Female |
| No Vehicle | 0 (0.0%) | 0 (0.0%) |
| 1 Vehicle | 1 (5.9%) | 0 (0.0%) |
| 2 Vehicles | 4 (23.5%) | 4 (40.0%) |
| 3 Vehicles | 6 (35.3%) | 3 (30.0%) |
| 4 Vehicles | 6 (35.3%) | 3 (30.0%) |
| 5 or more Vehicles | 0 (0.0%) | 0 (0.0%) |
| Total | 17 (100.0%) | 10 (100.0%) |
Commute Time in St Rosa
The most frequently occuring commute durations in St Rosa are 5 to 9 minutes (8 commuters, 32.0%), less than 5 minutes (6 commuters, 24.0%), and 20 to 24 minutes (4 commuters, 16.0%).
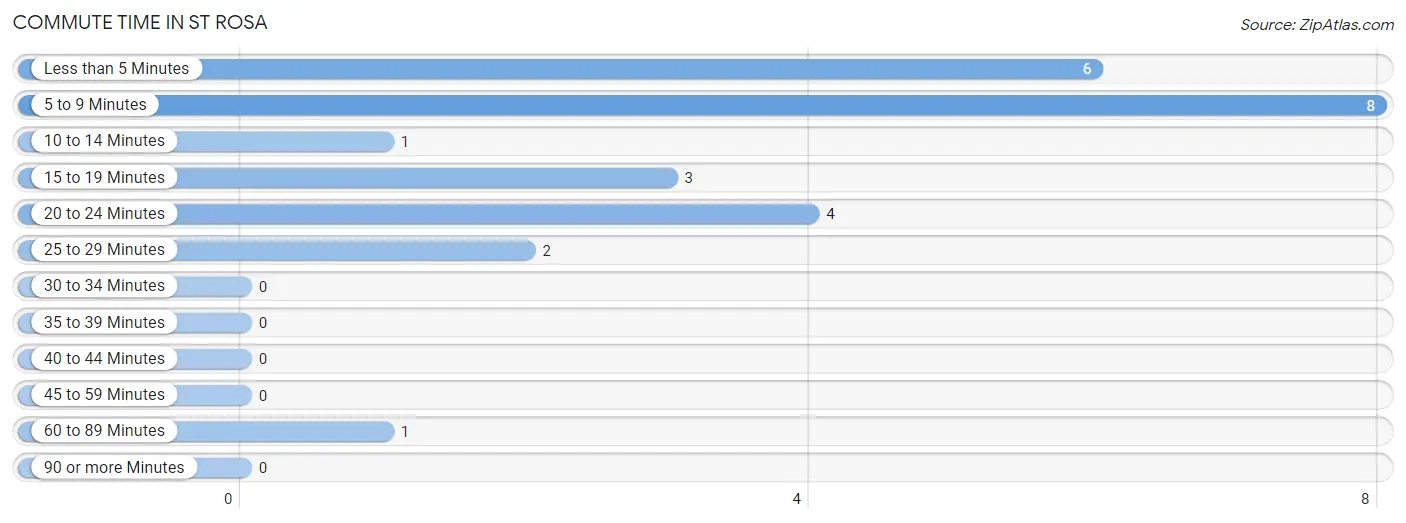
| Commute Time | # Commuters | % Commuters |
| Less than 5 Minutes | 6 | 24.0% |
| 5 to 9 Minutes | 8 | 32.0% |
| 10 to 14 Minutes | 1 | 4.0% |
| 15 to 19 Minutes | 3 | 12.0% |
| 20 to 24 Minutes | 4 | 16.0% |
| 25 to 29 Minutes | 2 | 8.0% |
| 30 to 34 Minutes | 0 | 0.0% |
| 35 to 39 Minutes | 0 | 0.0% |
| 40 to 44 Minutes | 0 | 0.0% |
| 45 to 59 Minutes | 0 | 0.0% |
| 60 to 89 Minutes | 1 | 4.0% |
| 90 or more Minutes | 0 | 0.0% |
Commute Time by Sex in St Rosa
The most common commute times in St Rosa are 5 to 9 minutes (7 commuters, 41.2%) for males and 15 to 19 minutes (2 commuters, 25.0%) for females.
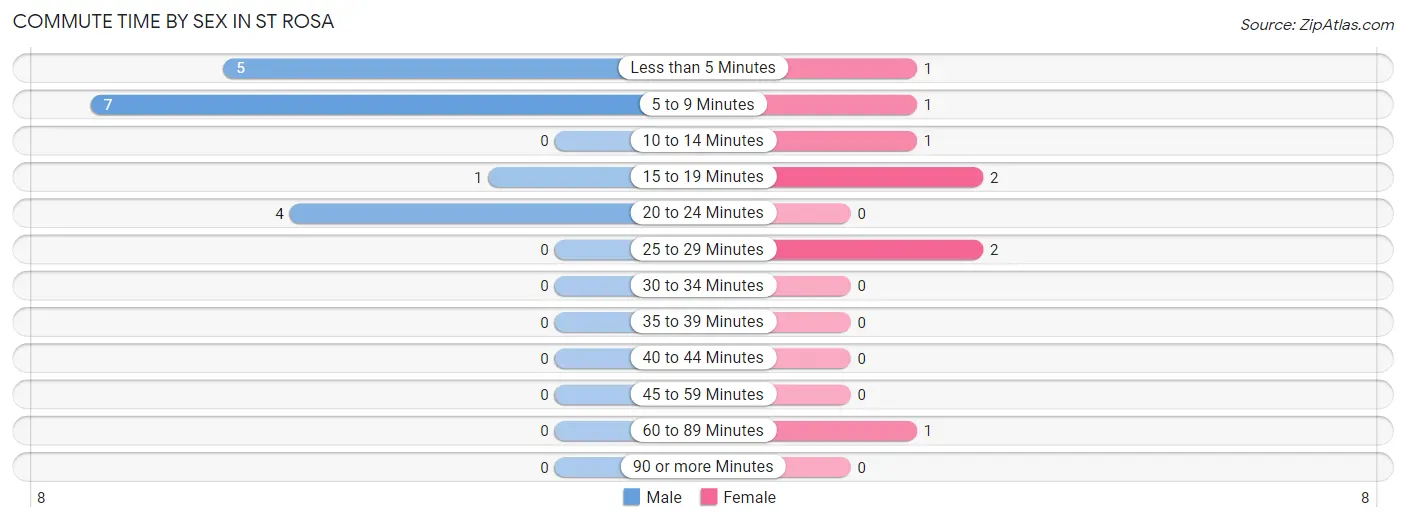
| Commute Time | Male | Female |
| Less than 5 Minutes | 5 (29.4%) | 1 (12.5%) |
| 5 to 9 Minutes | 7 (41.2%) | 1 (12.5%) |
| 10 to 14 Minutes | 0 (0.0%) | 1 (12.5%) |
| 15 to 19 Minutes | 1 (5.9%) | 2 (25.0%) |
| 20 to 24 Minutes | 4 (23.5%) | 0 (0.0%) |
| 25 to 29 Minutes | 0 (0.0%) | 2 (25.0%) |
| 30 to 34 Minutes | 0 (0.0%) | 0 (0.0%) |
| 35 to 39 Minutes | 0 (0.0%) | 0 (0.0%) |
| 40 to 44 Minutes | 0 (0.0%) | 0 (0.0%) |
| 45 to 59 Minutes | 0 (0.0%) | 0 (0.0%) |
| 60 to 89 Minutes | 0 (0.0%) | 1 (12.5%) |
| 90 or more Minutes | 0 (0.0%) | 0 (0.0%) |
Time of Departure to Work by Sex in St Rosa
The most frequent times of departure to work in St Rosa are 5:00 AM to 5:29 AM (5, 29.4%) for males and 7:00 AM to 7:29 AM (2, 25.0%) for females.
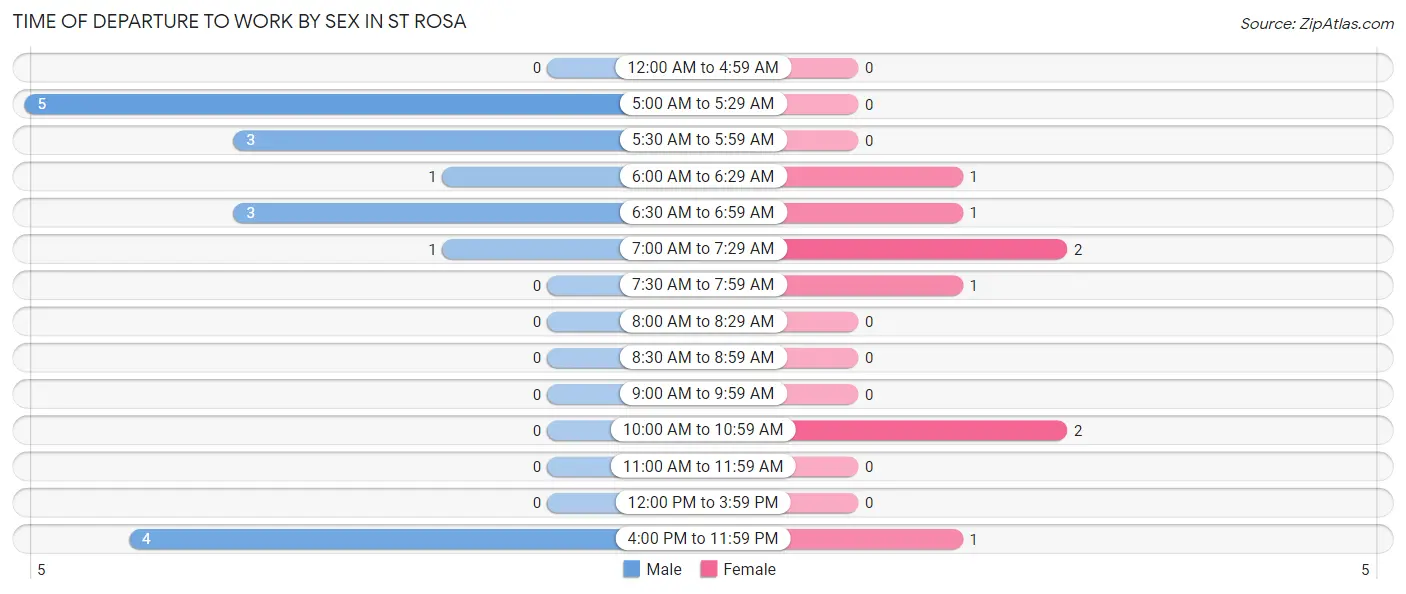
| Time of Departure | Male | Female |
| 12:00 AM to 4:59 AM | 0 (0.0%) | 0 (0.0%) |
| 5:00 AM to 5:29 AM | 5 (29.4%) | 0 (0.0%) |
| 5:30 AM to 5:59 AM | 3 (17.6%) | 0 (0.0%) |
| 6:00 AM to 6:29 AM | 1 (5.9%) | 1 (12.5%) |
| 6:30 AM to 6:59 AM | 3 (17.6%) | 1 (12.5%) |
| 7:00 AM to 7:29 AM | 1 (5.9%) | 2 (25.0%) |
| 7:30 AM to 7:59 AM | 0 (0.0%) | 1 (12.5%) |
| 8:00 AM to 8:29 AM | 0 (0.0%) | 0 (0.0%) |
| 8:30 AM to 8:59 AM | 0 (0.0%) | 0 (0.0%) |
| 9:00 AM to 9:59 AM | 0 (0.0%) | 0 (0.0%) |
| 10:00 AM to 10:59 AM | 0 (0.0%) | 2 (25.0%) |
| 11:00 AM to 11:59 AM | 0 (0.0%) | 0 (0.0%) |
| 12:00 PM to 3:59 PM | 0 (0.0%) | 0 (0.0%) |
| 4:00 PM to 11:59 PM | 4 (23.5%) | 1 (12.5%) |
| Total | 17 (100.0%) | 8 (100.0%) |
Housing Occupancy in St Rosa
Occupancy by Ownership in St Rosa
Of the total 24 dwellings in St Rosa, owner-occupied units account for 22 (91.7%), while renter-occupied units make up 2 (8.3%).
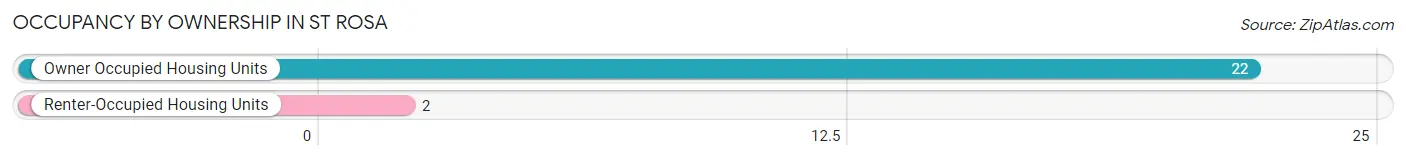
| Occupancy | # Housing Units | % Housing Units |
| Owner Occupied Housing Units | 22 | 91.7% |
| Renter-Occupied Housing Units | 2 | 8.3% |
| Total Occupied Housing Units | 24 | 100.0% |
Occupancy by Household Size in St Rosa
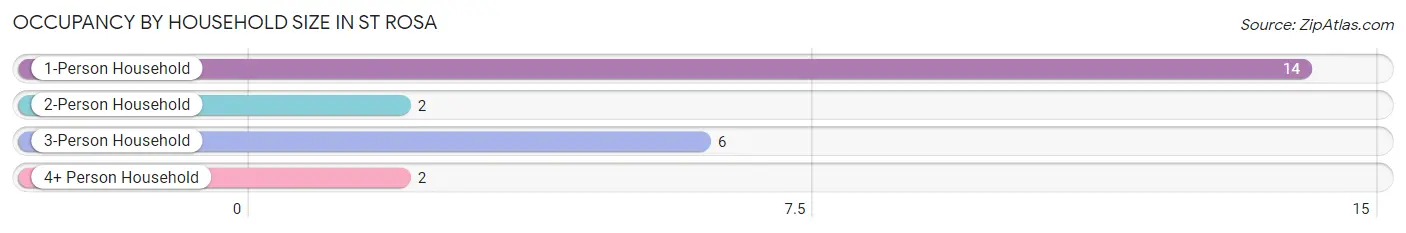
| Household Size | # Housing Units | % Housing Units |
| 1-Person Household | 14 | 58.3% |
| 2-Person Household | 2 | 8.3% |
| 3-Person Household | 6 | 25.0% |
| 4+ Person Household | 2 | 8.3% |
| Total Housing Units | 24 | 100.0% |
Occupancy by Ownership by Household Size in St Rosa
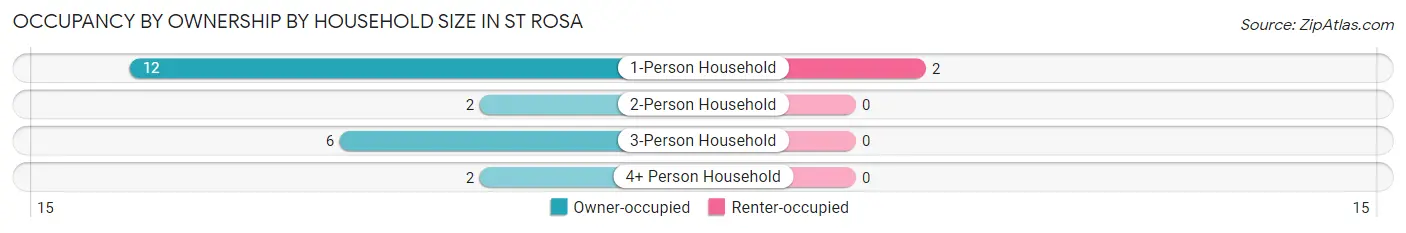
| Household Size | Owner-occupied | Renter-occupied |
| 1-Person Household | 12 (85.7%) | 2 (14.3%) |
| 2-Person Household | 2 (100.0%) | 0 (0.0%) |
| 3-Person Household | 6 (100.0%) | 0 (0.0%) |
| 4+ Person Household | 2 (100.0%) | 0 (0.0%) |
| Total Housing Units | 22 (91.7%) | 2 (8.3%) |
Occupancy by Educational Attainment in St Rosa
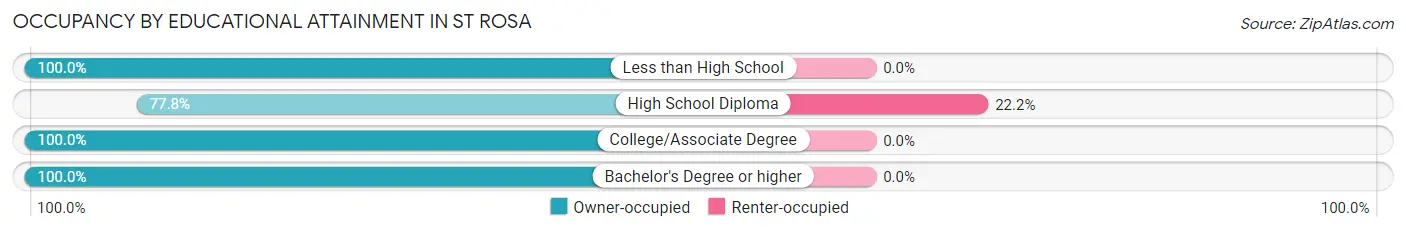
| Household Size | Owner-occupied | Renter-occupied |
| Less than High School | 2 (100.0%) | 0 (0.0%) |
| High School Diploma | 7 (77.8%) | 2 (22.2%) |
| College/Associate Degree | 8 (100.0%) | 0 (0.0%) |
| Bachelor's Degree or higher | 5 (100.0%) | 0 (0.0%) |
Occupancy by Age of Householder in St Rosa
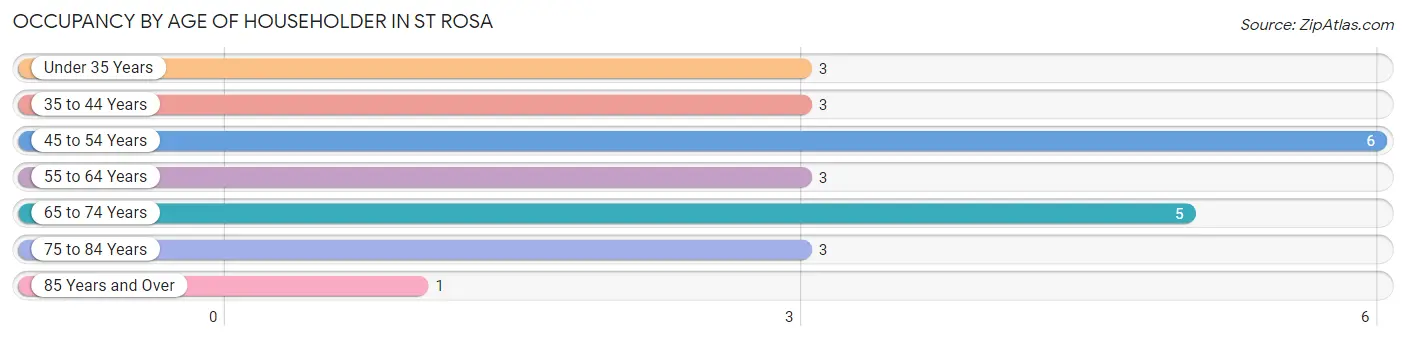
| Age Bracket | # Households | % Households |
| Under 35 Years | 3 | 12.5% |
| 35 to 44 Years | 3 | 12.5% |
| 45 to 54 Years | 6 | 25.0% |
| 55 to 64 Years | 3 | 12.5% |
| 65 to 74 Years | 5 | 20.8% |
| 75 to 84 Years | 3 | 12.5% |
| 85 Years and Over | 1 | 4.2% |
| Total | 24 | 100.0% |
Housing Finances in St Rosa
Median Income by Occupancy in St Rosa
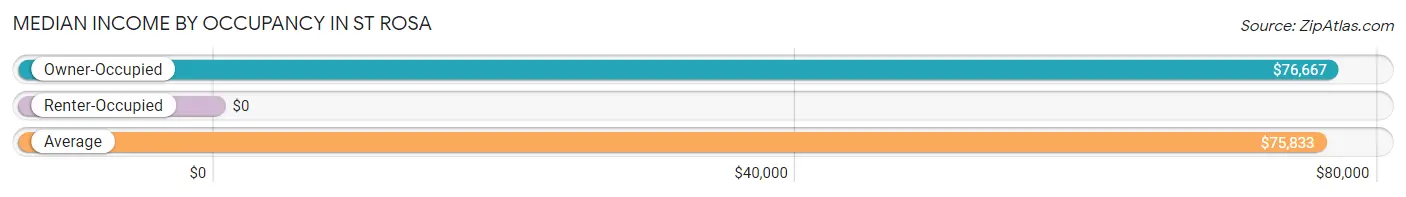
| Occupancy Type | # Households | Median Income |
| Owner-Occupied | 22 (91.7%) | $76,667 |
| Renter-Occupied | 2 (8.3%) | $0 |
| Average | 24 (100.0%) | $75,833 |
Occupancy by Householder Income Bracket in St Rosa
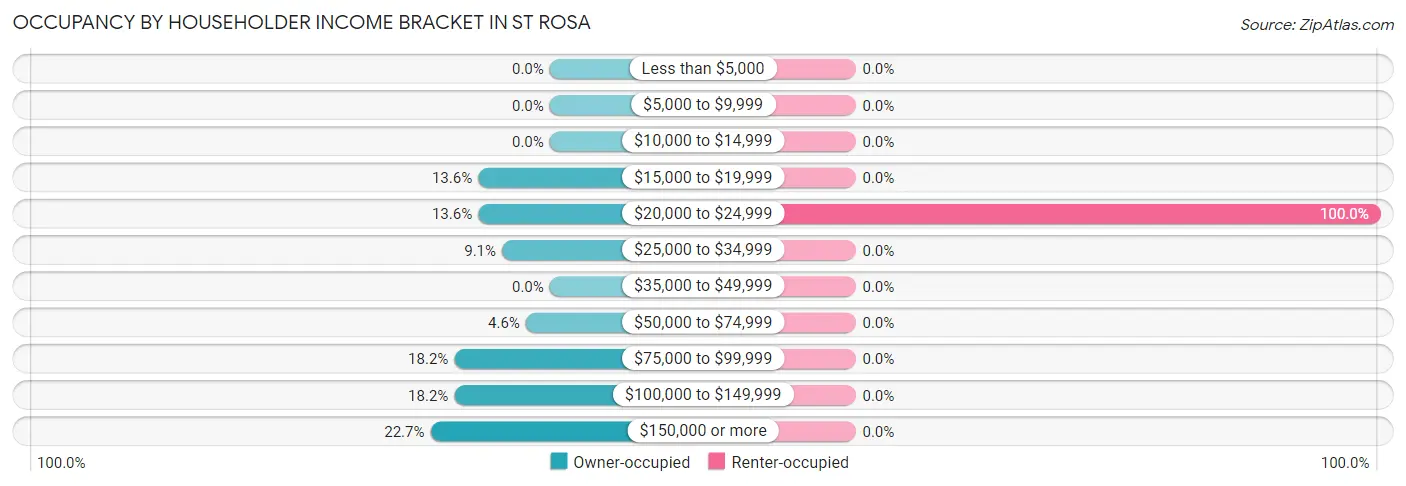
| Income Bracket | Owner-occupied | Renter-occupied |
| Less than $5,000 | 0 (0.0%) | 0 (0.0%) |
| $5,000 to $9,999 | 0 (0.0%) | 0 (0.0%) |
| $10,000 to $14,999 | 0 (0.0%) | 0 (0.0%) |
| $15,000 to $19,999 | 3 (13.6%) | 0 (0.0%) |
| $20,000 to $24,999 | 3 (13.6%) | 2 (100.0%) |
| $25,000 to $34,999 | 2 (9.1%) | 0 (0.0%) |
| $35,000 to $49,999 | 0 (0.0%) | 0 (0.0%) |
| $50,000 to $74,999 | 1 (4.5%) | 0 (0.0%) |
| $75,000 to $99,999 | 4 (18.2%) | 0 (0.0%) |
| $100,000 to $149,999 | 4 (18.2%) | 0 (0.0%) |
| $150,000 or more | 5 (22.7%) | 0 (0.0%) |
| Total | 22 (100.0%) | 2 (100.0%) |
Monthly Housing Cost Tiers in St Rosa
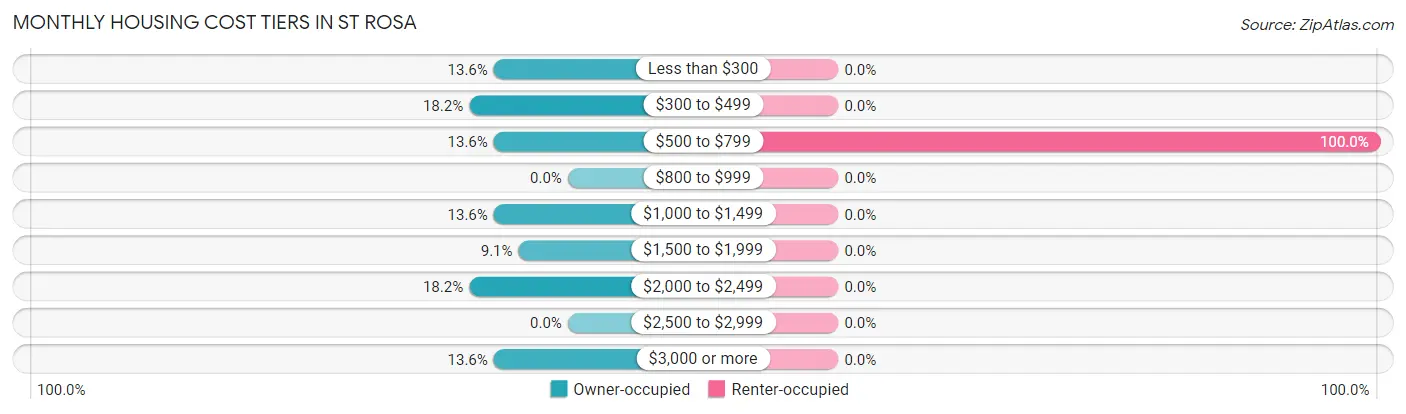
| Monthly Cost | Owner-occupied | Renter-occupied |
| Less than $300 | 3 (13.6%) | 0 (0.0%) |
| $300 to $499 | 4 (18.2%) | 0 (0.0%) |
| $500 to $799 | 3 (13.6%) | 2 (100.0%) |
| $800 to $999 | 0 (0.0%) | 0 (0.0%) |
| $1,000 to $1,499 | 3 (13.6%) | 0 (0.0%) |
| $1,500 to $1,999 | 2 (9.1%) | 0 (0.0%) |
| $2,000 to $2,499 | 4 (18.2%) | 0 (0.0%) |
| $2,500 to $2,999 | 0 (0.0%) | 0 (0.0%) |
| $3,000 or more | 3 (13.6%) | 0 (0.0%) |
| Total | 22 (100.0%) | 2 (100.0%) |
Physical Housing Characteristics in St Rosa
Housing Structures in St Rosa
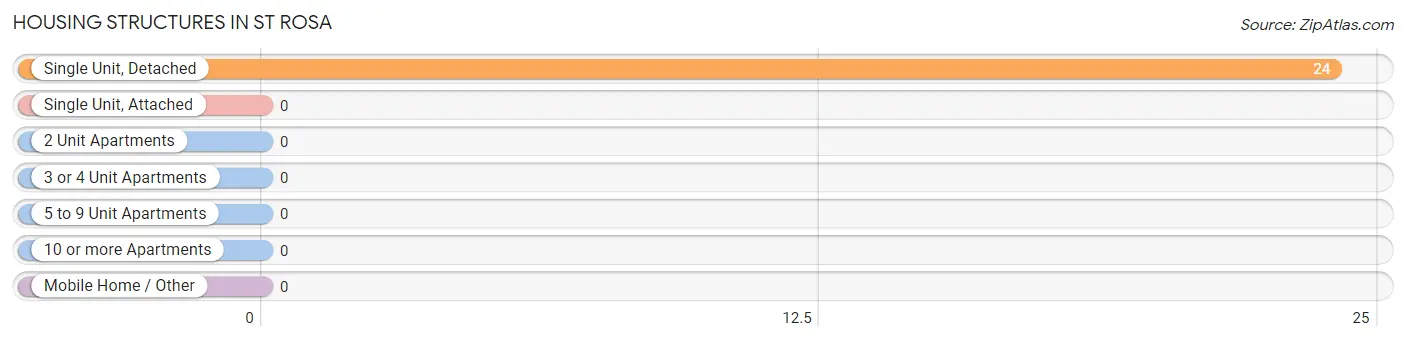
| Structure Type | # Housing Units | % Housing Units |
| Single Unit, Detached | 24 | 100.0% |
| Single Unit, Attached | 0 | 0.0% |
| 2 Unit Apartments | 0 | 0.0% |
| 3 or 4 Unit Apartments | 0 | 0.0% |
| 5 to 9 Unit Apartments | 0 | 0.0% |
| 10 or more Apartments | 0 | 0.0% |
| Mobile Home / Other | 0 | 0.0% |
| Total | 24 | 100.0% |
Housing Structures by Occupancy in St Rosa
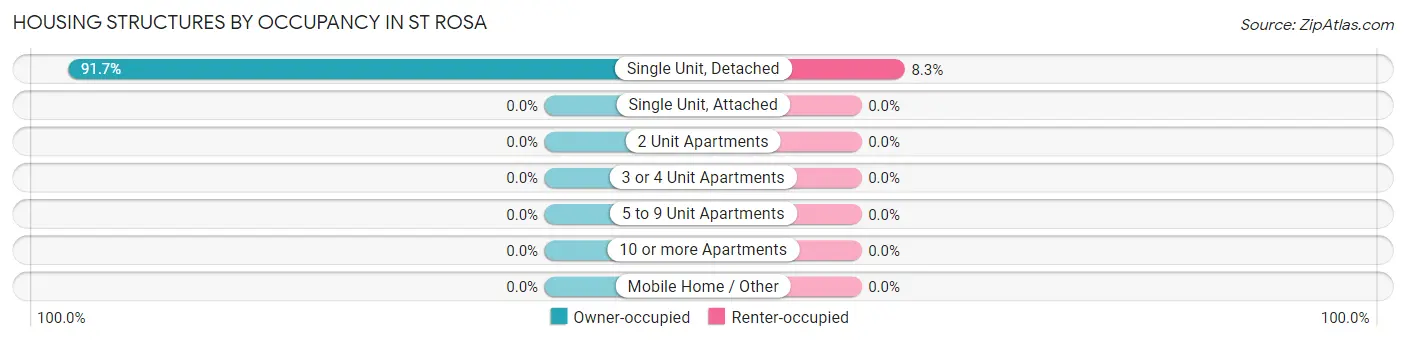
| Structure Type | Owner-occupied | Renter-occupied |
| Single Unit, Detached | 22 (91.7%) | 2 (8.3%) |
| Single Unit, Attached | 0 (0.0%) | 0 (0.0%) |
| 2 Unit Apartments | 0 (0.0%) | 0 (0.0%) |
| 3 or 4 Unit Apartments | 0 (0.0%) | 0 (0.0%) |
| 5 to 9 Unit Apartments | 0 (0.0%) | 0 (0.0%) |
| 10 or more Apartments | 0 (0.0%) | 0 (0.0%) |
| Mobile Home / Other | 0 (0.0%) | 0 (0.0%) |
| Total | 22 (91.7%) | 2 (8.3%) |
Housing Structures by Number of Rooms in St Rosa
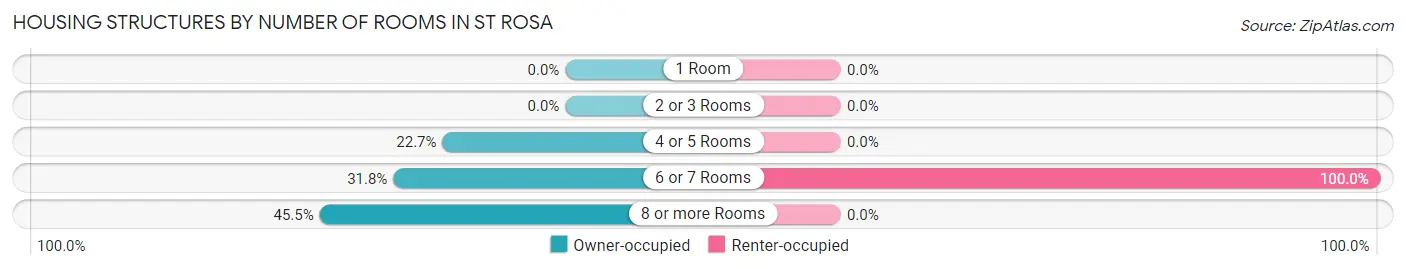
| Number of Rooms | Owner-occupied | Renter-occupied |
| 1 Room | 0 (0.0%) | 0 (0.0%) |
| 2 or 3 Rooms | 0 (0.0%) | 0 (0.0%) |
| 4 or 5 Rooms | 5 (22.7%) | 0 (0.0%) |
| 6 or 7 Rooms | 7 (31.8%) | 2 (100.0%) |
| 8 or more Rooms | 10 (45.5%) | 0 (0.0%) |
| Total | 22 (100.0%) | 2 (100.0%) |
Housing Structure by Heating Type in St Rosa
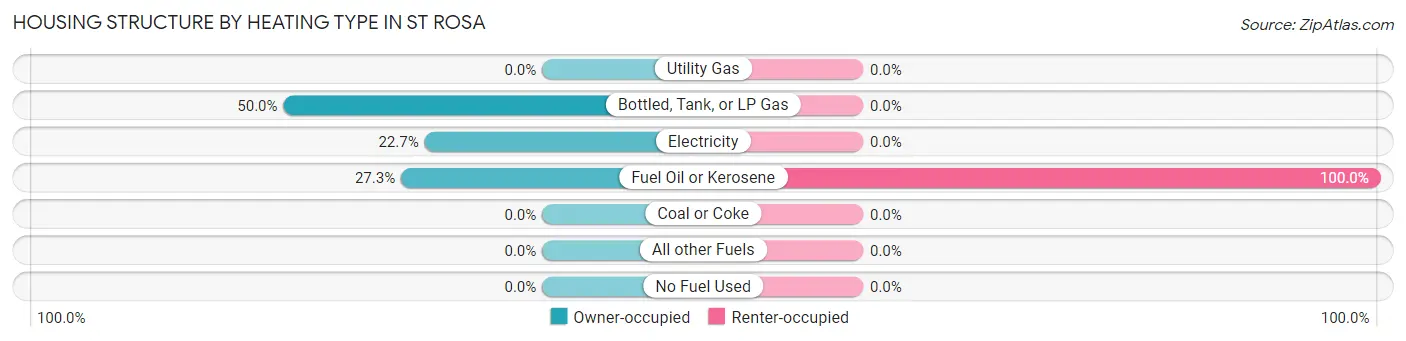
| Heating Type | Owner-occupied | Renter-occupied |
| Utility Gas | 0 (0.0%) | 0 (0.0%) |
| Bottled, Tank, or LP Gas | 11 (50.0%) | 0 (0.0%) |
| Electricity | 5 (22.7%) | 0 (0.0%) |
| Fuel Oil or Kerosene | 6 (27.3%) | 2 (100.0%) |
| Coal or Coke | 0 (0.0%) | 0 (0.0%) |
| All other Fuels | 0 (0.0%) | 0 (0.0%) |
| No Fuel Used | 0 (0.0%) | 0 (0.0%) |
| Total | 22 (100.0%) | 2 (100.0%) |
Household Vehicle Usage in St Rosa
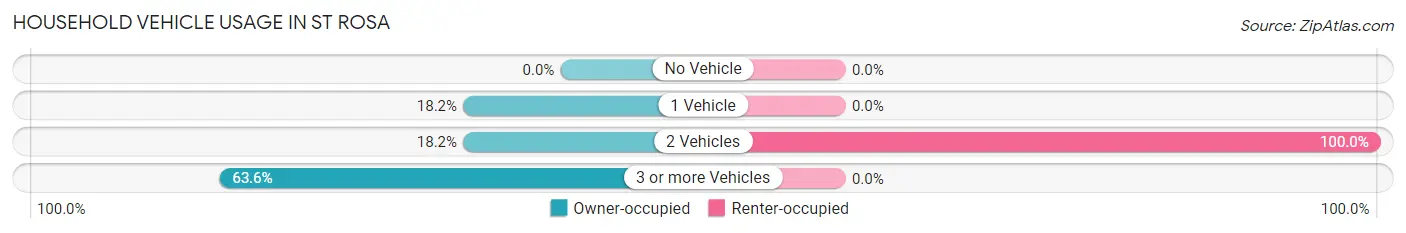
| Vehicles per Household | Owner-occupied | Renter-occupied |
| No Vehicle | 0 (0.0%) | 0 (0.0%) |
| 1 Vehicle | 4 (18.2%) | 0 (0.0%) |
| 2 Vehicles | 4 (18.2%) | 2 (100.0%) |
| 3 or more Vehicles | 14 (63.6%) | 0 (0.0%) |
| Total | 22 (100.0%) | 2 (100.0%) |
Real Estate & Mortgages in St Rosa
Real Estate and Mortgage Overview in St Rosa
| Characteristic | Without Mortgage | With Mortgage |
| Housing Units | 11 | 11 |
| Median Property Value | $168,800 | $262,500 |
| Median Household Income | - | - |
| Monthly Housing Costs | $463 | $3 |
| Real Estate Taxes | $1,781 | $0 |
Property Value by Mortgage Status in St Rosa
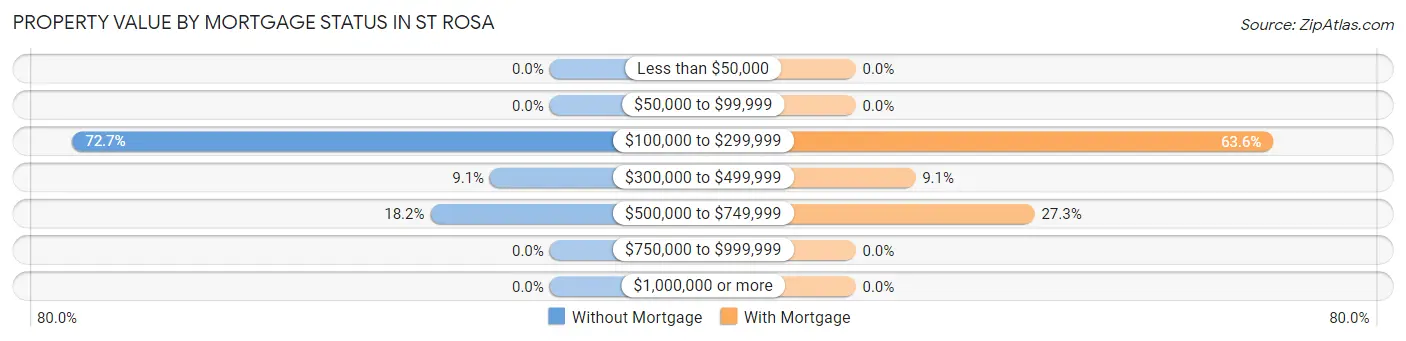
| Property Value | Without Mortgage | With Mortgage |
| Less than $50,000 | 0 (0.0%) | 0 (0.0%) |
| $50,000 to $99,999 | 0 (0.0%) | 0 (0.0%) |
| $100,000 to $299,999 | 8 (72.7%) | 7 (63.6%) |
| $300,000 to $499,999 | 1 (9.1%) | 1 (9.1%) |
| $500,000 to $749,999 | 2 (18.2%) | 3 (27.3%) |
| $750,000 to $999,999 | 0 (0.0%) | 0 (0.0%) |
| $1,000,000 or more | 0 (0.0%) | 0 (0.0%) |
| Total | 11 (100.0%) | 11 (100.0%) |
Household Income by Mortgage Status in St Rosa
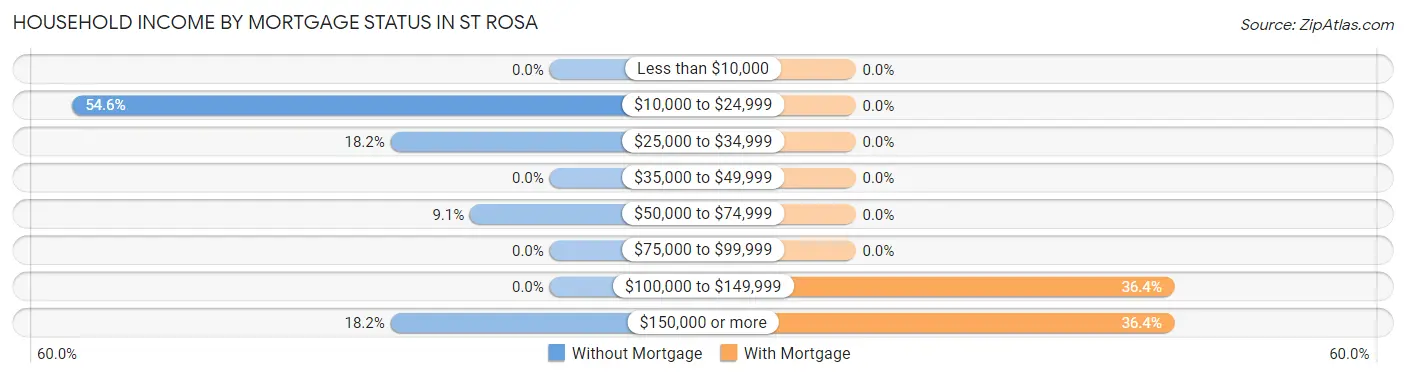
| Household Income | Without Mortgage | With Mortgage |
| Less than $10,000 | 0 (0.0%) | 0 (0.0%) |
| $10,000 to $24,999 | 6 (54.5%) | 0 (0.0%) |
| $25,000 to $34,999 | 2 (18.2%) | 0 (0.0%) |
| $35,000 to $49,999 | 0 (0.0%) | 0 (0.0%) |
| $50,000 to $74,999 | 1 (9.1%) | 0 (0.0%) |
| $75,000 to $99,999 | 0 (0.0%) | 0 (0.0%) |
| $100,000 to $149,999 | 0 (0.0%) | 4 (36.4%) |
| $150,000 or more | 2 (18.2%) | 4 (36.4%) |
| Total | 11 (100.0%) | 11 (100.0%) |
Property Value to Household Income Ratio in St Rosa
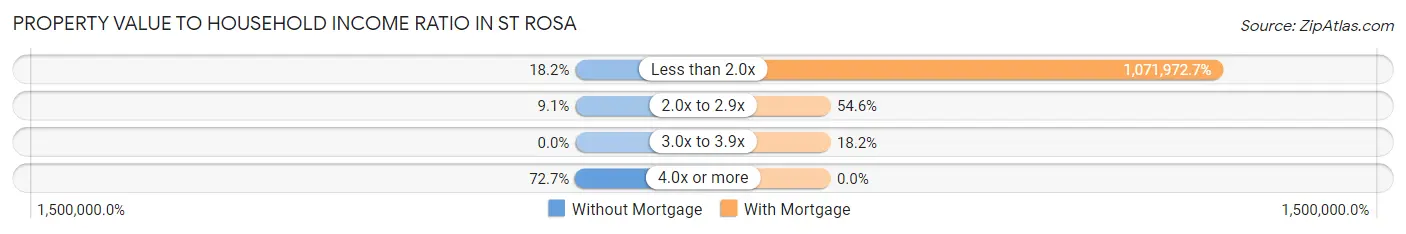
| Value-to-Income Ratio | Without Mortgage | With Mortgage |
| Less than 2.0x | 2 (18.2%) | 117,917 (1,071,972.7%) |
| 2.0x to 2.9x | 1 (9.1%) | 6 (54.5%) |
| 3.0x to 3.9x | 0 (0.0%) | 2 (18.2%) |
| 4.0x or more | 8 (72.7%) | 0 (0.0%) |
| Total | 11 (100.0%) | 11 (100.0%) |
Real Estate Taxes by Mortgage Status in St Rosa
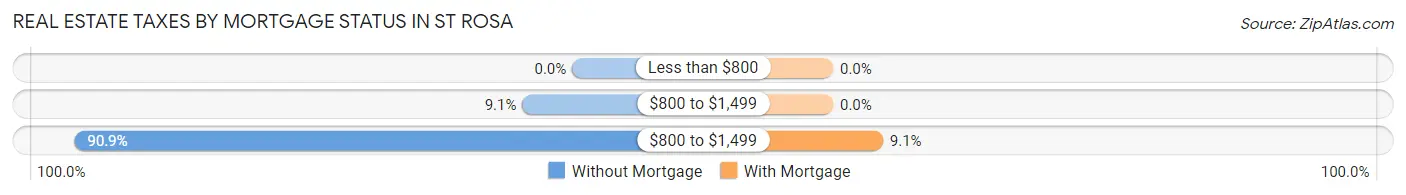
| Property Taxes | Without Mortgage | With Mortgage |
| Less than $800 | 0 (0.0%) | 0 (0.0%) |
| $800 to $1,499 | 1 (9.1%) | 0 (0.0%) |
| $800 to $1,499 | 10 (90.9%) | 1 (9.1%) |
| Total | 11 (100.0%) | 11 (100.0%) |
Health & Disability in St Rosa
Health Insurance Coverage by Age in St Rosa
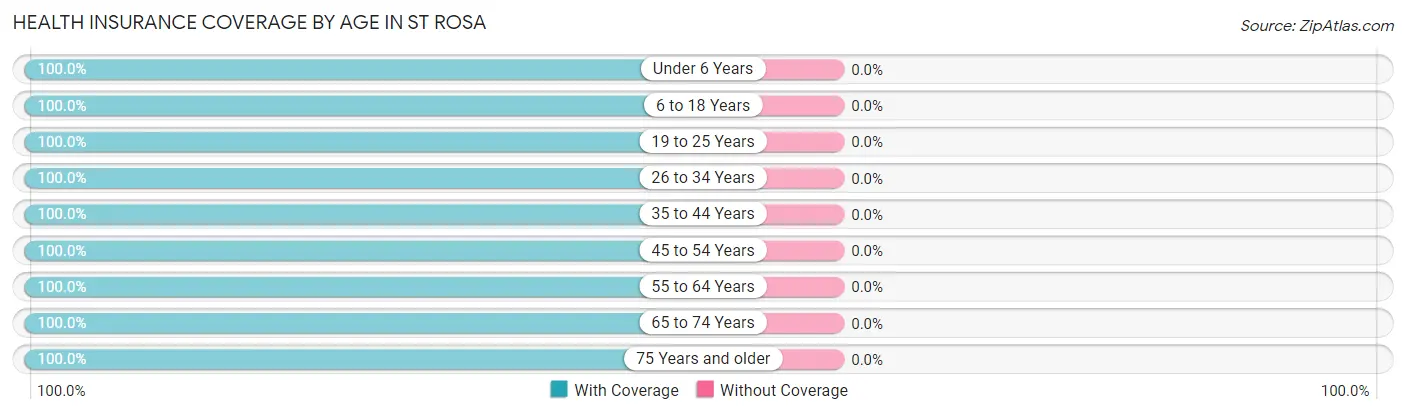
| Age Bracket | With Coverage | Without Coverage |
| Under 6 Years | 11 (100.0%) | 0 (0.0%) |
| 6 to 18 Years | 4 (100.0%) | 0 (0.0%) |
| 19 to 25 Years | 1 (100.0%) | 0 (0.0%) |
| 26 to 34 Years | 7 (100.0%) | 0 (0.0%) |
| 35 to 44 Years | 4 (100.0%) | 0 (0.0%) |
| 45 to 54 Years | 7 (100.0%) | 0 (0.0%) |
| 55 to 64 Years | 6 (100.0%) | 0 (0.0%) |
| 65 to 74 Years | 5 (100.0%) | 0 (0.0%) |
| 75 Years and older | 5 (100.0%) | 0 (0.0%) |
| Total | 50 (100.0%) | 0 (0.0%) |
Health Insurance Coverage by Citizenship Status in St Rosa
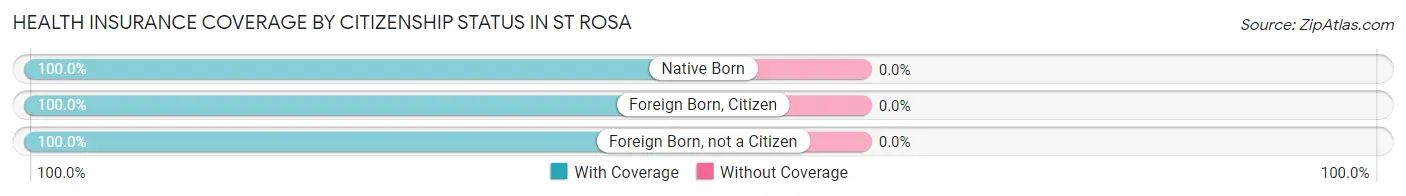
| Citizenship Status | With Coverage | Without Coverage |
| Native Born | 11 (100.0%) | 0 (0.0%) |
| Foreign Born, Citizen | 4 (100.0%) | 0 (0.0%) |
| Foreign Born, not a Citizen | 1 (100.0%) | 0 (0.0%) |
Health Insurance Coverage by Household Income in St Rosa
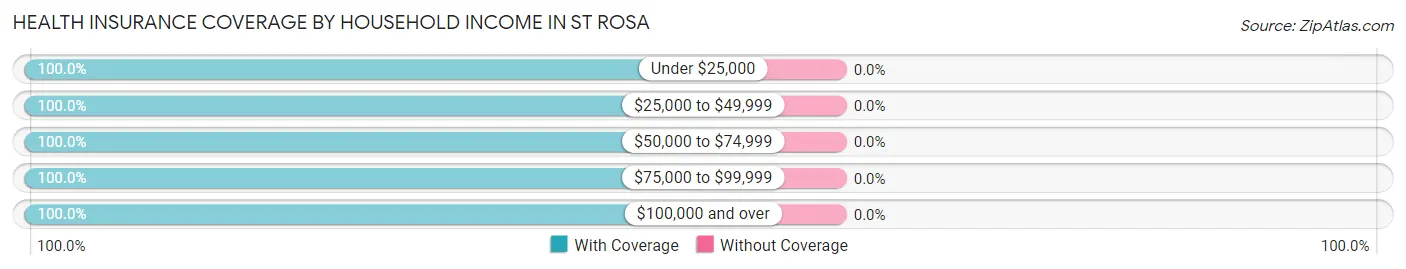
| Household Income | With Coverage | Without Coverage |
| Under $25,000 | 8 (100.0%) | 0 (0.0%) |
| $25,000 to $49,999 | 2 (100.0%) | 0 (0.0%) |
| $50,000 to $74,999 | 2 (100.0%) | 0 (0.0%) |
| $75,000 to $99,999 | 17 (100.0%) | 0 (0.0%) |
| $100,000 and over | 21 (100.0%) | 0 (0.0%) |
Public vs Private Health Insurance Coverage by Age in St Rosa
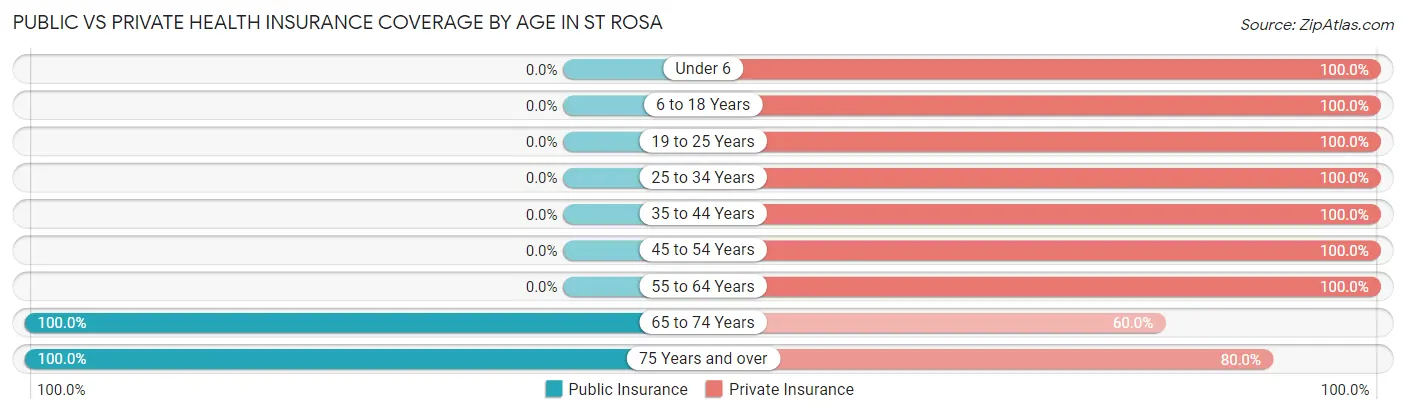
| Age Bracket | Public Insurance | Private Insurance |
| Under 6 | 0 (0.0%) | 11 (100.0%) |
| 6 to 18 Years | 0 (0.0%) | 4 (100.0%) |
| 19 to 25 Years | 0 (0.0%) | 1 (100.0%) |
| 25 to 34 Years | 0 (0.0%) | 7 (100.0%) |
| 35 to 44 Years | 0 (0.0%) | 4 (100.0%) |
| 45 to 54 Years | 0 (0.0%) | 7 (100.0%) |
| 55 to 64 Years | 0 (0.0%) | 6 (100.0%) |
| 65 to 74 Years | 5 (100.0%) | 3 (60.0%) |
| 75 Years and over | 5 (100.0%) | 4 (80.0%) |
| Total | 10 (20.0%) | 47 (94.0%) |
Disability Status by Sex by Age in St Rosa
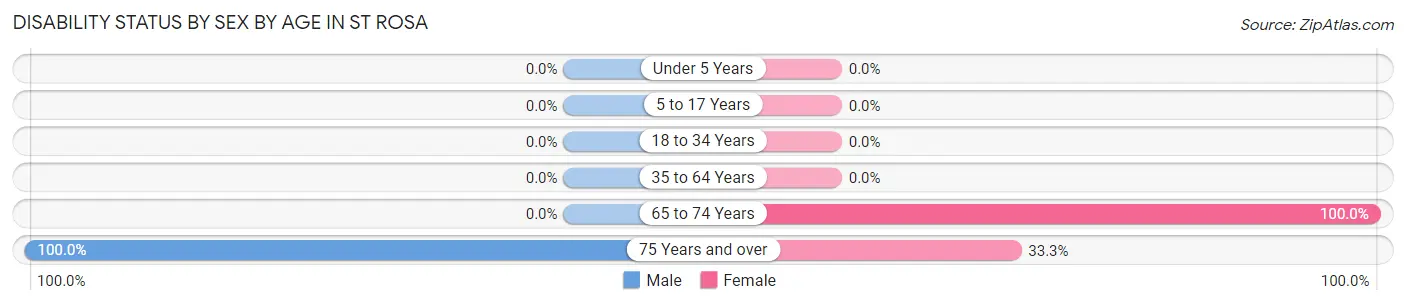
| Age Bracket | Male | Female |
| Under 5 Years | 0 (0.0%) | 0 (0.0%) |
| 5 to 17 Years | 0 (0.0%) | 0 (0.0%) |
| 18 to 34 Years | 0 (0.0%) | 0 (0.0%) |
| 35 to 64 Years | 0 (0.0%) | 0 (0.0%) |
| 65 to 74 Years | 0 (0.0%) | 2 (100.0%) |
| 75 Years and over | 2 (100.0%) | 1 (33.3%) |
Disability Class by Sex by Age in St Rosa
Disability Class: Hearing Difficulty
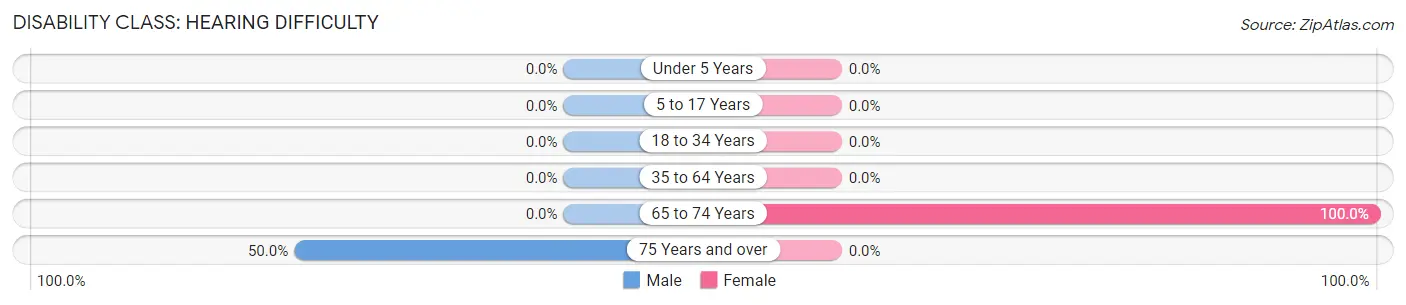
| Age Bracket | Male | Female |
| Under 5 Years | 0 (0.0%) | 0 (0.0%) |
| 5 to 17 Years | 0 (0.0%) | 0 (0.0%) |
| 18 to 34 Years | 0 (0.0%) | 0 (0.0%) |
| 35 to 64 Years | 0 (0.0%) | 0 (0.0%) |
| 65 to 74 Years | 0 (0.0%) | 2 (100.0%) |
| 75 Years and over | 1 (50.0%) | 0 (0.0%) |
Disability Class: Vision Difficulty
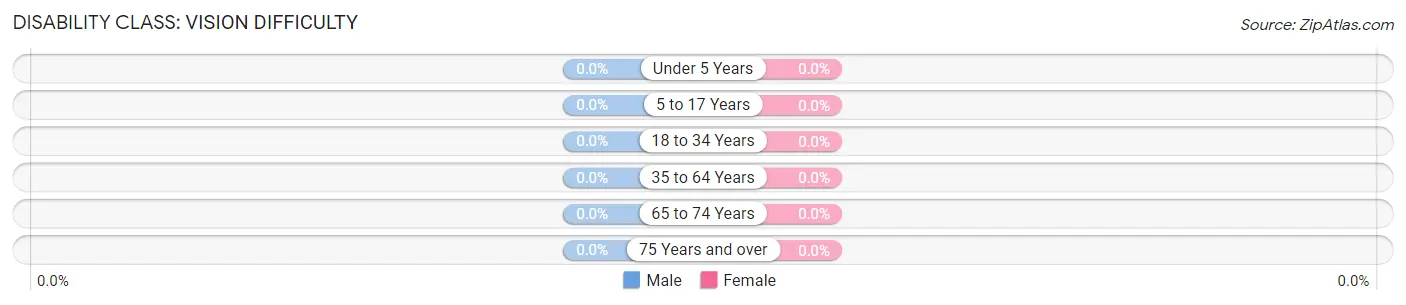
| Age Bracket | Male | Female |
| Under 5 Years | 0 (0.0%) | 0 (0.0%) |
| 5 to 17 Years | 0 (0.0%) | 0 (0.0%) |
| 18 to 34 Years | 0 (0.0%) | 0 (0.0%) |
| 35 to 64 Years | 0 (0.0%) | 0 (0.0%) |
| 65 to 74 Years | 0 (0.0%) | 0 (0.0%) |
| 75 Years and over | 0 (0.0%) | 0 (0.0%) |
Disability Class: Cognitive Difficulty
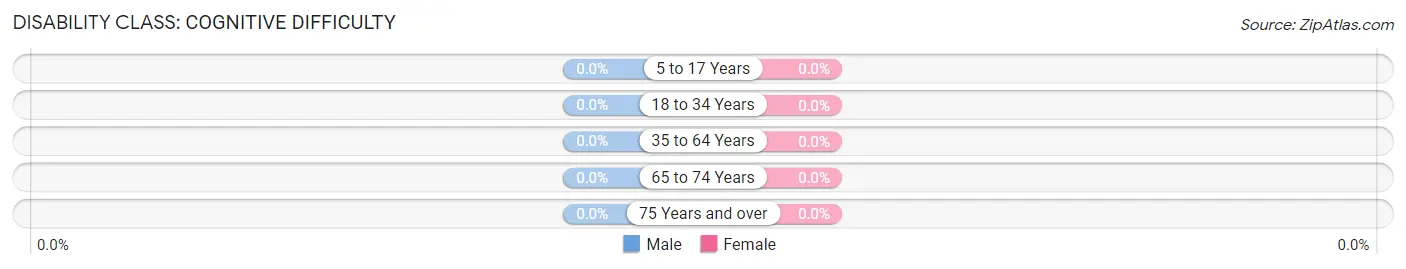
| Age Bracket | Male | Female |
| 5 to 17 Years | 0 (0.0%) | 0 (0.0%) |
| 18 to 34 Years | 0 (0.0%) | 0 (0.0%) |
| 35 to 64 Years | 0 (0.0%) | 0 (0.0%) |
| 65 to 74 Years | 0 (0.0%) | 0 (0.0%) |
| 75 Years and over | 0 (0.0%) | 0 (0.0%) |
Disability Class: Ambulatory Difficulty
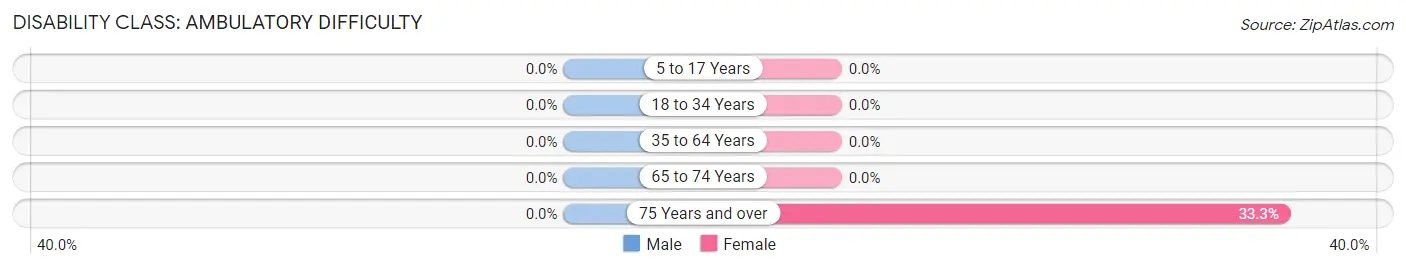
| Age Bracket | Male | Female |
| 5 to 17 Years | 0 (0.0%) | 0 (0.0%) |
| 18 to 34 Years | 0 (0.0%) | 0 (0.0%) |
| 35 to 64 Years | 0 (0.0%) | 0 (0.0%) |
| 65 to 74 Years | 0 (0.0%) | 0 (0.0%) |
| 75 Years and over | 0 (0.0%) | 1 (33.3%) |
Disability Class: Self-Care Difficulty
| Age Bracket | Male | Female |
| 5 to 17 Years | 0 (0.0%) | 0 (0.0%) |
| 18 to 34 Years | 0 (0.0%) | 0 (0.0%) |
| 35 to 64 Years | 0 (0.0%) | 0 (0.0%) |
| 65 to 74 Years | 0 (0.0%) | 0 (0.0%) |
| 75 Years and over | 0 (0.0%) | 0 (0.0%) |
Technology Access in St Rosa
Computing Device Access in St Rosa
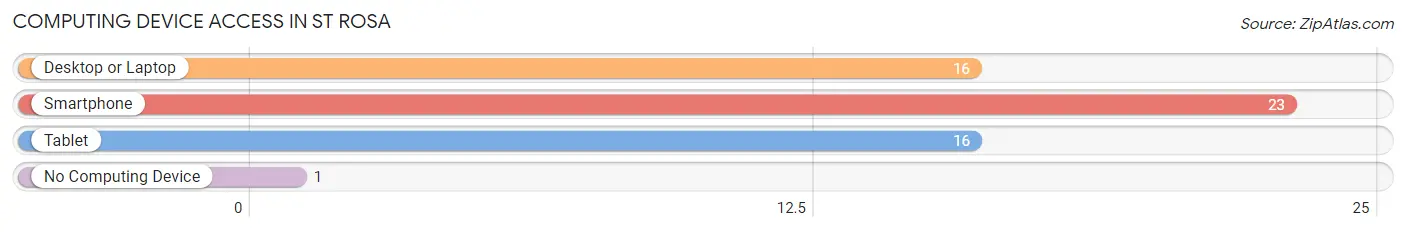
| Device Type | # Households | % Households |
| Desktop or Laptop | 16 | 66.7% |
| Smartphone | 23 | 95.8% |
| Tablet | 16 | 66.7% |
| No Computing Device | 1 | 4.2% |
| Total | 24 | 100.0% |
Internet Access in St Rosa
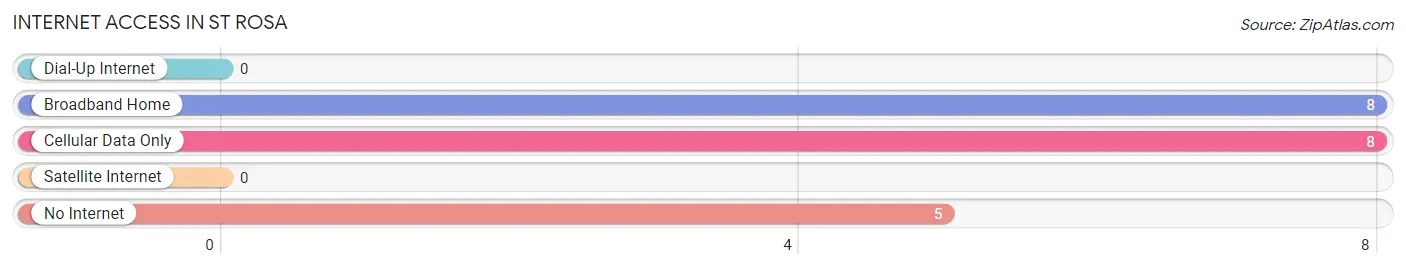
| Internet Type | # Households | % Households |
| Dial-Up Internet | 0 | 0.0% |
| Broadband Home | 8 | 33.3% |
| Cellular Data Only | 8 | 33.3% |
| Satellite Internet | 0 | 0.0% |
| No Internet | 5 | 20.8% |
| Total | 24 | 100.0% |
St Rosa Summary
St. Rosa is a small city located in central Minnesota, in the United States. It is located in Stearns County, and is part of the St. Cloud Metropolitan Statistical Area. The city has a population of approximately 1,500 people, and is located on the banks of the Sauk River.
History
St. Rosa was founded in 1856 by German immigrants who were looking for a place to settle and start a new life. The city was named after the patron saint of the Catholic Church, St. Rosa of Lima. The city was originally a farming community, and the main crops grown were wheat, oats, and barley. The city was also known for its dairy farms, and the local cheese factory was a major employer in the area.
In the late 19th century, the city began to grow and develop. The railroad came to St. Rosa in 1887, and the city was connected to the rest of the state. This allowed for the growth of the city, and it soon became a popular destination for tourists. The city was also home to a number of businesses, including a brewery, a flour mill, and a sawmill.
Geography
St. Rosa is located in central Minnesota, in Stearns County. The city is situated on the banks of the Sauk River, and is surrounded by rolling hills and farmland. The city is located about 30 miles north of St. Cloud, and about 50 miles south of Minneapolis. The city is also located close to the Mississippi River, and is about 20 miles from the Minnesota-Wisconsin border.
The climate in St. Rosa is typical of the Midwest, with cold winters and hot summers. The average temperature in the winter is around 20 degrees Fahrenheit, and the average temperature in the summer is around 75 degrees Fahrenheit. The city receives an average of 30 inches of precipitation each year, and the area is known for its snowfall in the winter months.
Economy
The economy of St. Rosa is largely based on agriculture and tourism. The city is home to a number of farms, and the main crops grown are wheat, oats, and barley. The city is also home to a number of businesses, including a brewery, a flour mill, and a sawmill.
The city is also a popular tourist destination, and the city is home to a number of attractions, including the St. Rosa Historical Museum, the St. Rosa State Park, and the St. Rosa National Wildlife Refuge. The city is also home to a number of festivals and events, including the St. Rosa County Fair and the St. Rosa Music Festival.
Demographics
As of the 2010 census, the population of St. Rosa was 1,500 people. The racial makeup of the city was 97.3% White, 0.7% African American, 0.3% Native American, 0.3% Asian, and 1.3% from other races. The median household income in the city was $45,000, and the median age was 37 years.
Conclusion
St. Rosa is a small city located in central Minnesota, in the United States. It is located in Stearns County, and is part of the St. Cloud Metropolitan Statistical Area. The city has a population of approximately 1,500 people, and is located on the banks of the Sauk River. The economy of St. Rosa is largely based on agriculture and tourism, and the city is home to a number of businesses, including a brewery, a flour mill, and a sawmill. The city is also a popular tourist destination, and the city is home to a number of attractions, including the St. Rosa Historical Museum, the St. Rosa State Park, and the St. Rosa National Wildlife Refuge. As of the 2010 census, the population of St. Rosa was 1,500 people, and the racial makeup of the city was 97.3% White, 0.7% African American, 0.3% Native American, 0.3% Asian, and 1.3% from other races.
Common Questions
What is the Total Population of St Rosa?
Total Population of St Rosa is 50.
What is the Total Male Population of St Rosa?
Total Male Population of St Rosa is 32.
What is the Total Female Population of St Rosa?
Total Female Population of St Rosa is 18.
What is the Ratio of Males per 100 Females in St Rosa?
There are 177.78 Males per 100 Females in St Rosa.
What is the Ratio of Females per 100 Males in St Rosa?
There are 56.25 Females per 100 Males in St Rosa.
What is the Median Population Age in St Rosa?
Median Population Age in St Rosa is 37.7 Years.
What is the Average Family Size in St Rosa
Average Family Size in St Rosa is 3.6 People.
What is the Average Household Size in St Rosa
Average Household Size in St Rosa is 2.1 People.
What is Per Capita Income in St Rosa?
Per Capita income in St Rosa is $48,898.
What is the Median Family Income in St Rosa?
Median Family Income in St Rosa is $121,250.
What is the Median Household income in St Rosa?
Median Household Income in St Rosa is $75,833.
What is Income or Wage Gap in St Rosa?
Income or Wage Gap in St Rosa is 53.4%.
Women in St Rosa earn 46.6 cents for every dollar earned by a man.
What is Inequality or Gini Index in St Rosa?
Inequality or Gini Index in St Rosa is 0.47.
How Large is the Labor Force in St Rosa?
There are 27 People in the Labor Forcein in St Rosa.
What is the Percentage of People in the Labor Force in St Rosa?
77.1% of People are in the Labor Force in St Rosa.