Searles, MN
Searles Map
Searles Overview
285
TOTAL POPULATION
145
MALE POPULATION
140
FEMALE POPULATION
103.57
MALES / 100 FEMALES
96.55
FEMALES / 100 MALES
55.5
MEDIAN AGE
3.2
AVG FAMILY SIZE
2.4
AVG HOUSEHOLD SIZE
$45,826
PER CAPITA INCOME
$91,250
AVG FAMILY INCOME
$108,333
AVG HOUSEHOLD INCOME
39.0%
WAGE / INCOME GAP [ % ]
61.0¢/ $1
WAGE / INCOME GAP [ $ ]
0.23
INEQUALITY / GINI INDEX
118
LABOR FORCE [ PEOPLE ]
49.6%
PERCENT IN LABOR FORCE
0.8%
UNEMPLOYMENT RATE
Searles Area Codes
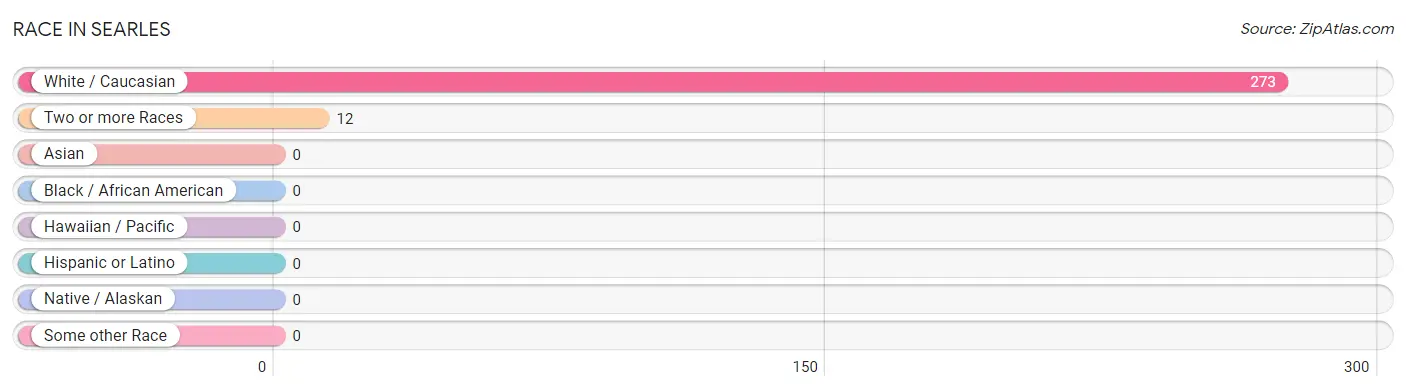
Race in Searles
The most populous races in Searles are White / Caucasian (273 | 95.8%), and Two or more Races (12 | 4.2%).
| Race | # Population | % Population |
| Asian | 0 | 0.0% |
| Black / African American | 0 | 0.0% |
| Hawaiian / Pacific | 0 | 0.0% |
| Hispanic or Latino | 0 | 0.0% |
| Native / Alaskan | 0 | 0.0% |
| White / Caucasian | 273 | 95.8% |
| Two or more Races | 12 | 4.2% |
| Some other Race | 0 | 0.0% |
| Total | 285 | 100.0% |
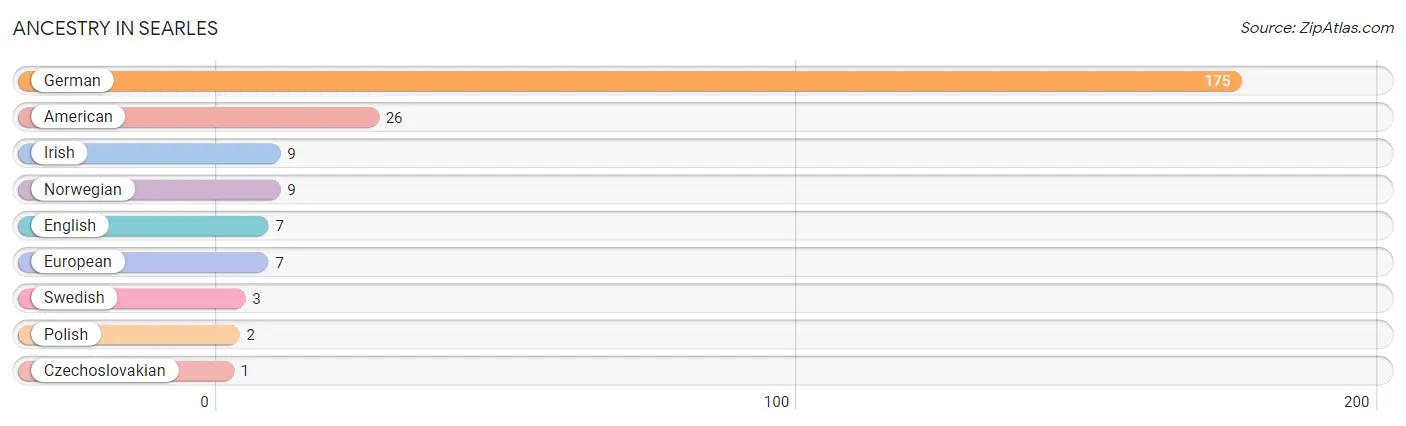
Ancestry in Searles
The most populous ancestries reported in Searles are German (175 | 61.4%), American (26 | 9.1%), Irish (9 | 3.2%), Norwegian (9 | 3.2%), and English (7 | 2.5%), together accounting for 79.3% of all Searles residents.
| Ancestry | # Population | % Population |
| American | 26 | 9.1% |
| Czechoslovakian | 1 | 0.4% |
| English | 7 | 2.5% |
| European | 7 | 2.5% |
| German | 175 | 61.4% |
| Irish | 9 | 3.2% |
| Norwegian | 9 | 3.2% |
| Polish | 2 | 0.7% |
| Swedish | 3 | 1.1% | View All 9 Rows |
Immigrants in Searles

| Immigration Origin | # Population | % Population | View All 0 Rows |
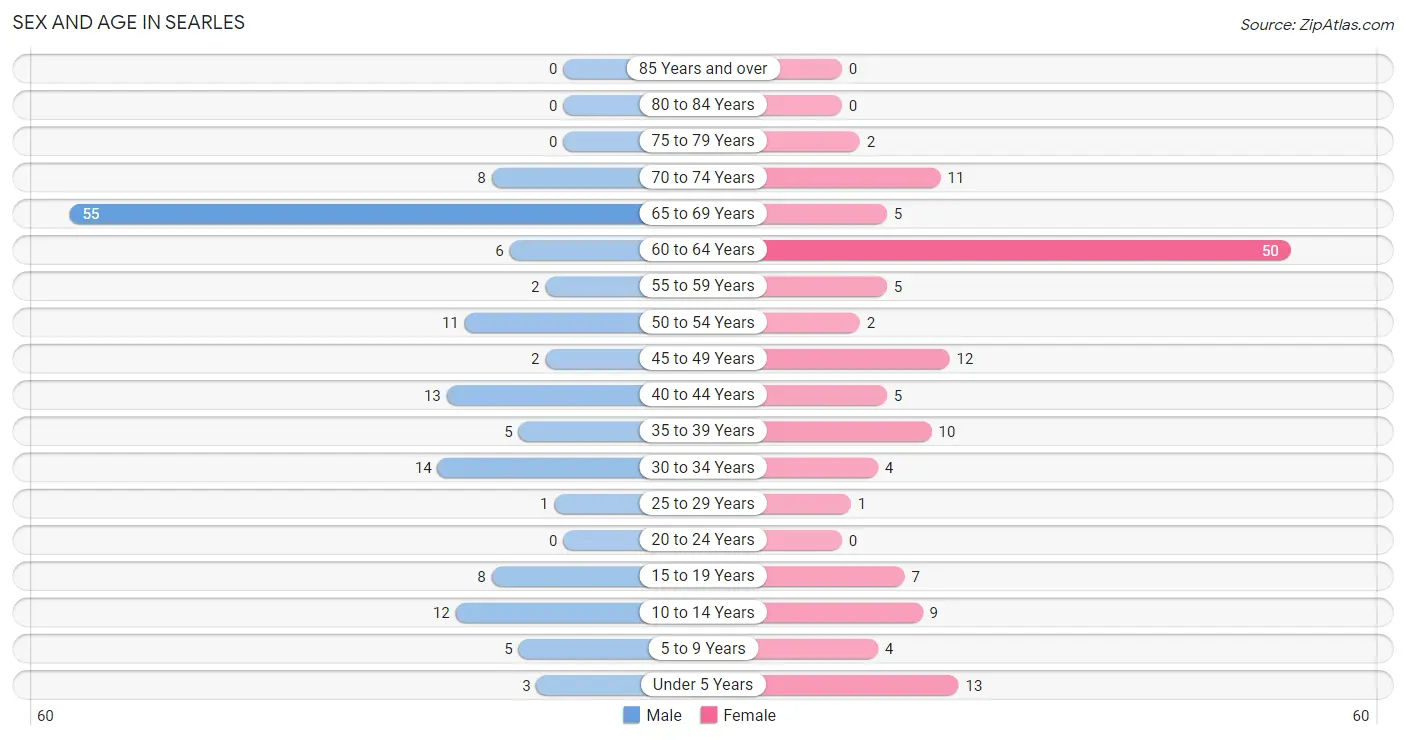
Sex and Age in Searles
Sex and Age in Searles
The most populous age groups in Searles are 65 to 69 Years (55 | 37.9%) for men and 60 to 64 Years (50 | 35.7%) for women.
| Age Bracket | Male | Female |
| Under 5 Years | 3 (2.1%) | 13 (9.3%) |
| 5 to 9 Years | 5 (3.5%) | 4 (2.9%) |
| 10 to 14 Years | 12 (8.3%) | 9 (6.4%) |
| 15 to 19 Years | 8 (5.5%) | 7 (5.0%) |
| 20 to 24 Years | 0 (0.0%) | 0 (0.0%) |
| 25 to 29 Years | 1 (0.7%) | 1 (0.7%) |
| 30 to 34 Years | 14 (9.7%) | 4 (2.9%) |
| 35 to 39 Years | 5 (3.5%) | 10 (7.1%) |
| 40 to 44 Years | 13 (9.0%) | 5 (3.6%) |
| 45 to 49 Years | 2 (1.4%) | 12 (8.6%) |
| 50 to 54 Years | 11 (7.6%) | 2 (1.4%) |
| 55 to 59 Years | 2 (1.4%) | 5 (3.6%) |
| 60 to 64 Years | 6 (4.1%) | 50 (35.7%) |
| 65 to 69 Years | 55 (37.9%) | 5 (3.6%) |
| 70 to 74 Years | 8 (5.5%) | 11 (7.9%) |
| 75 to 79 Years | 0 (0.0%) | 2 (1.4%) |
| 80 to 84 Years | 0 (0.0%) | 0 (0.0%) |
| 85 Years and over | 0 (0.0%) | 0 (0.0%) |
| Total | 145 (100.0%) | 140 (100.0%) |
Families and Households in Searles
Median Family Size in Searles
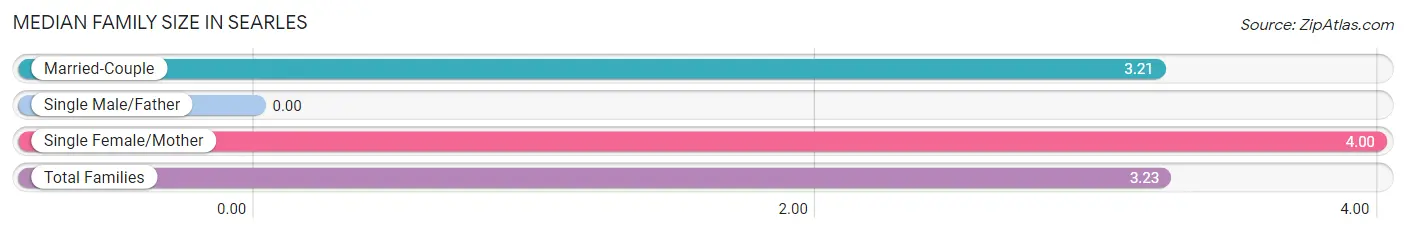
| Family Type | # Families | Family Size |
| Married-Couple | 56 (98.3%) | 3.21 |
| Single Male/Father | 0 (0.0%) | - |
| Single Female/Mother | 1 (1.8%) | 4.00 |
| Total Families | 57 (100.0%) | 3.23 |
Median Household Size in Searles
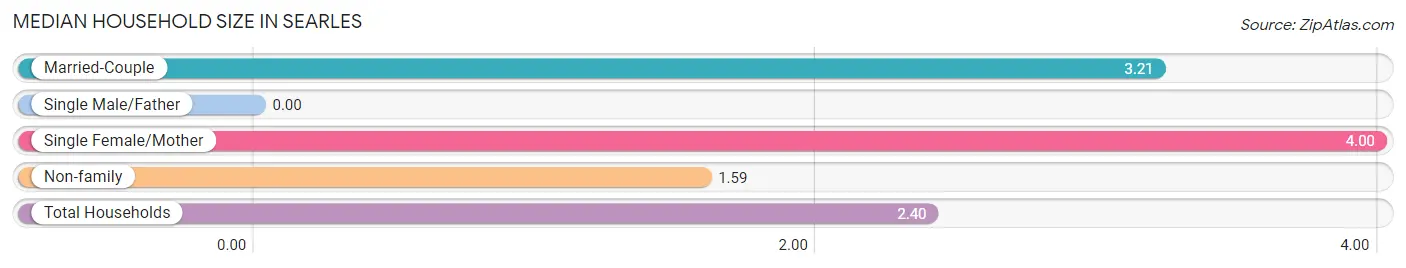
| Household Type | # Households | Household Size |
| Married-Couple | 56 (48.3%) | 3.21 |
| Single Male/Father | 0 (0.0%) | - |
| Single Female/Mother | 1 (0.9%) | 4.00 |
| Non-family | 59 (50.9%) | 1.59 |
| Total Households | 116 (100.0%) | 2.40 |
Household Size by Marriage Status in Searles
Out of a total of 116 households in Searles, 57 (49.1%) are family households, while 59 (50.9%) are nonfamily households. The most numerous type of family households are 2-person households, comprising 31, and the most common type of nonfamily households are 2-person households, comprising 35.
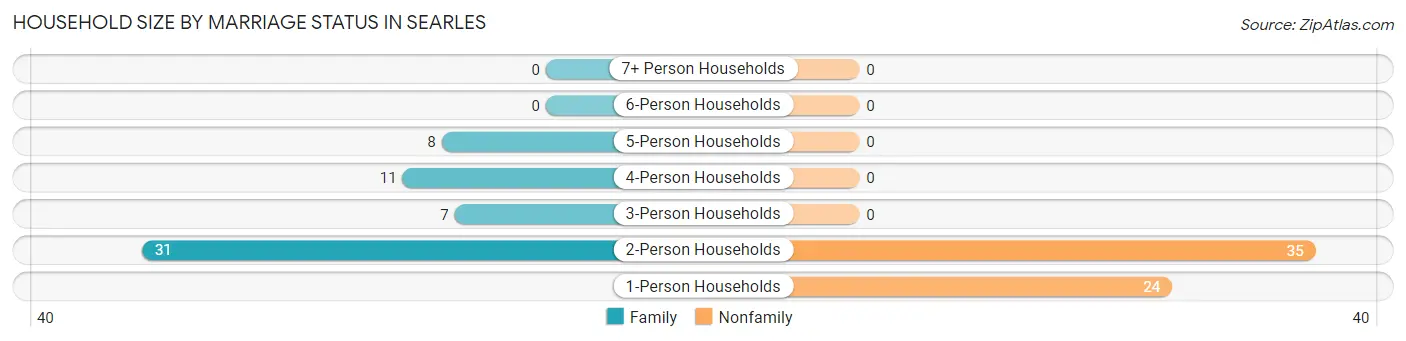
| Household Size | Family Households | Nonfamily Households |
| 1-Person Households | - | 24 (20.7%) |
| 2-Person Households | 31 (26.7%) | 35 (30.2%) |
| 3-Person Households | 7 (6.0%) | 0 (0.0%) |
| 4-Person Households | 11 (9.5%) | 0 (0.0%) |
| 5-Person Households | 8 (6.9%) | 0 (0.0%) |
| 6-Person Households | 0 (0.0%) | 0 (0.0%) |
| 7+ Person Households | 0 (0.0%) | 0 (0.0%) |
| Total | 57 (49.1%) | 59 (50.9%) |
Female Fertility in Searles
Fertility by Age in Searles
Average fertility rate in Searles is 154.0 births per 1,000 women. Women in the age bracket of 35 to 50 years have the highest fertility rate with 222.0 births per 1,000 women. Women in the age bracket of 35 to 50 years acount for 100.0% of all women with births.
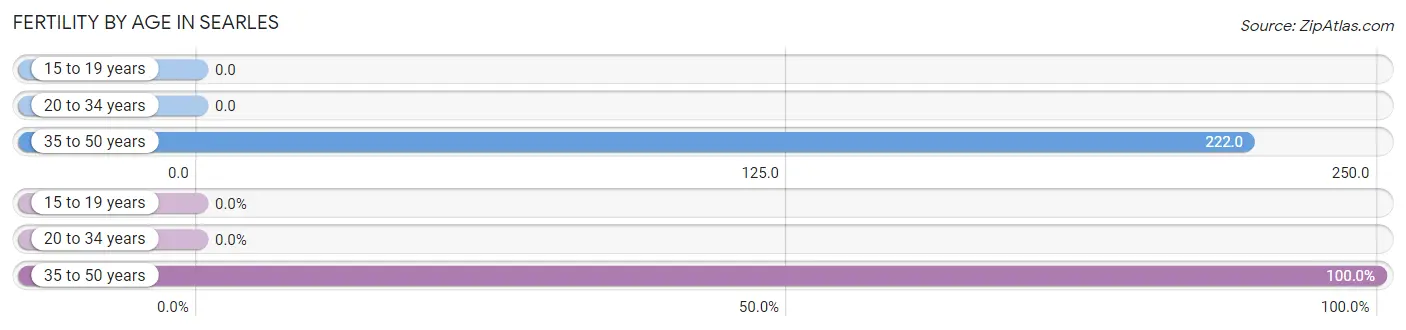
| Age Bracket | Women with Births | Births / 1,000 Women |
| 15 to 19 years | 0 (0.0%) | 0.0 |
| 20 to 34 years | 0 (0.0%) | 0.0 |
| 35 to 50 years | 6 (100.0%) | 222.0 |
| Total | 6 (100.0%) | 154.0 |
Fertility by Age by Marriage Status in Searles
83.3% of women with births (6) in Searles are married. The highest percentage of unmarried women with births falls into 35 to 50 years age bracket with 16.7% of them unmarried at the time of birth, while the lowest percentage of unmarried women with births belong to 35 to 50 years age bracket with 16.7% of them unmarried.
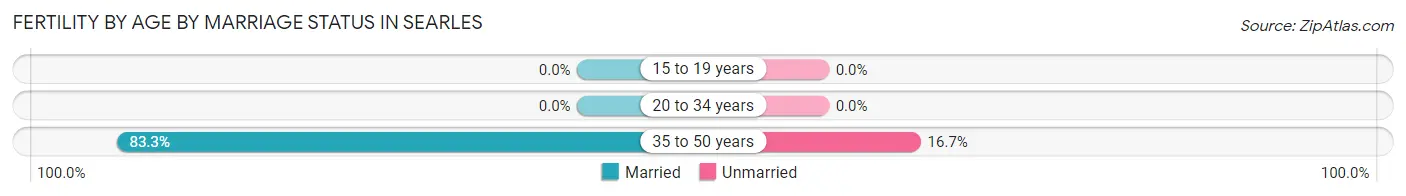
| Age Bracket | Married | Unmarried |
| 15 to 19 years | 0 (0.0%) | 0 (0.0%) |
| 20 to 34 years | 0 (0.0%) | 0 (0.0%) |
| 35 to 50 years | 5 (83.3%) | 1 (16.7%) |
| Total | 5 (83.3%) | 1 (16.7%) |
Fertility by Education in Searles
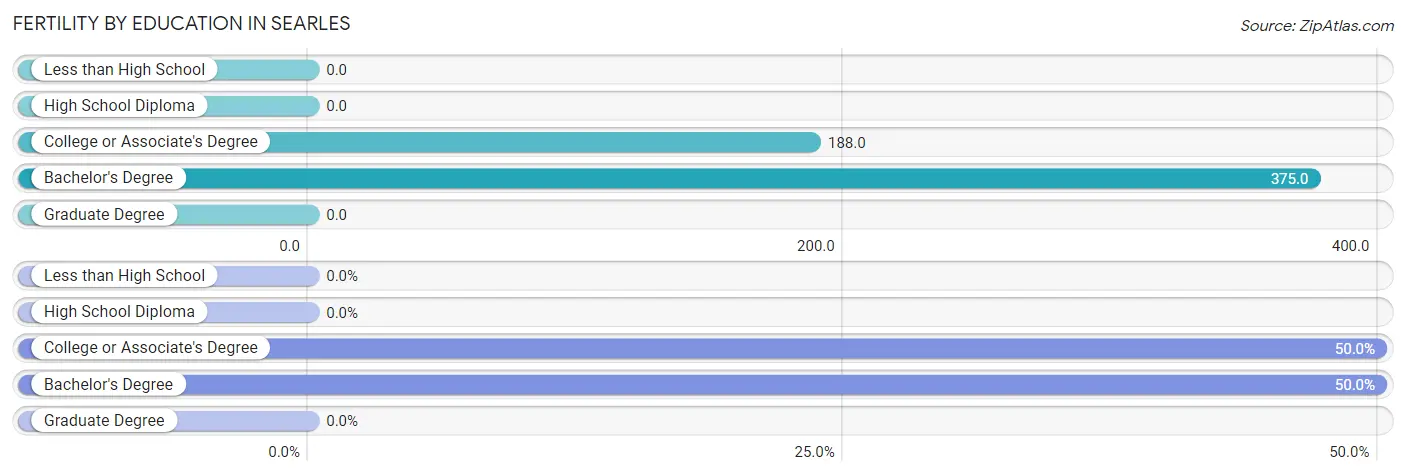
| Educational Attainment | Women with Births | Births / 1,000 Women |
| Less than High School | 0 (0.0%) | 0.0 |
| High School Diploma | 0 (0.0%) | 0.0 |
| College or Associate's Degree | 3 (50.0%) | 188.0 |
| Bachelor's Degree | 3 (50.0%) | 375.0 |
| Graduate Degree | 0 (0.0%) | 0.0 |
| Total | 6 (100.0%) | 154.0 |
Fertility by Education by Marriage Status in Searles
16.7% of women with births in Searles are unmarried. Women with the educational attainment of bachelor's degree are most likely to be married with 100.0% of them married at childbirth, while women with the educational attainment of college or associate's degree are least likely to be married with 33.3% of them unmarried at childbirth.
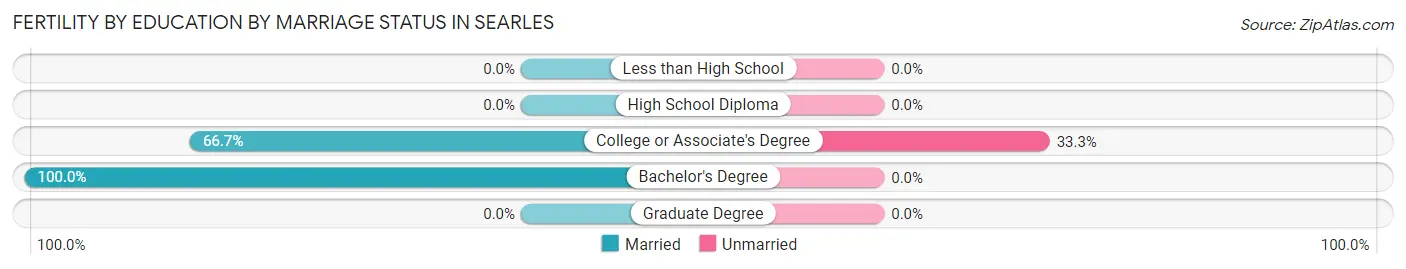
| Educational Attainment | Married | Unmarried |
| Less than High School | 0 (0.0%) | 0 (0.0%) |
| High School Diploma | 0 (0.0%) | 0 (0.0%) |
| College or Associate's Degree | 2 (66.7%) | 1 (33.3%) |
| Bachelor's Degree | 3 (100.0%) | 0 (0.0%) |
| Graduate Degree | 0 (0.0%) | 0 (0.0%) |
| Total | 5 (83.3%) | 1 (16.7%) |
Income in Searles
Income Overview in Searles
Per Capita Income in Searles is $45,826, while median incomes of families and households are $91,250 and $108,333 respectively.
| Characteristic | Number | Measure |
| Per Capita Income | 285 | $45,826 |
| Median Family Income | 57 | $91,250 |
| Mean Family Income | 57 | $100,644 |
| Median Household Income | 116 | $108,333 |
| Mean Household Income | 116 | $106,685 |
| Income Deficit | 57 | $0 |
| Wage / Income Gap (%) | 285 | 39.00% |
| Wage / Income Gap ($) | 285 | 61.00¢ per $1 |
| Gini / Inequality Index | 285 | 0.23 |
Earnings by Sex in Searles
Average Earnings in Searles are $56,786, $68,646 for men and $41,875 for women, a difference of 39.0%.
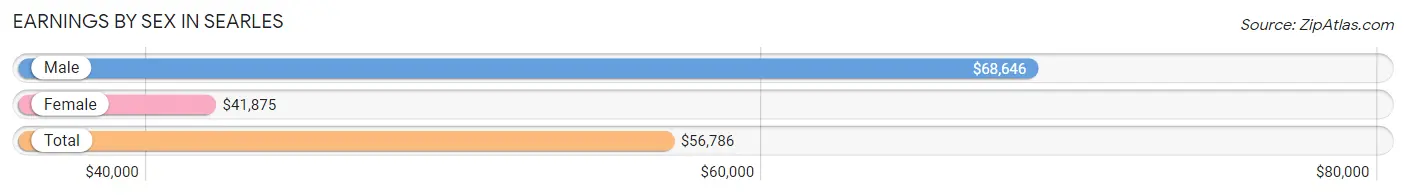
| Sex | Number | Average Earnings |
| Male | 63 (51.6%) | $68,646 |
| Female | 59 (48.4%) | $41,875 |
| Total | 122 (100.0%) | $56,786 |
Earnings by Sex by Income Bracket in Searles
The most common earnings brackets in Searles are $65,000 to $74,999 for men (16 | 25.4%) and $55,000 to $64,999 for women (19 | 32.2%).
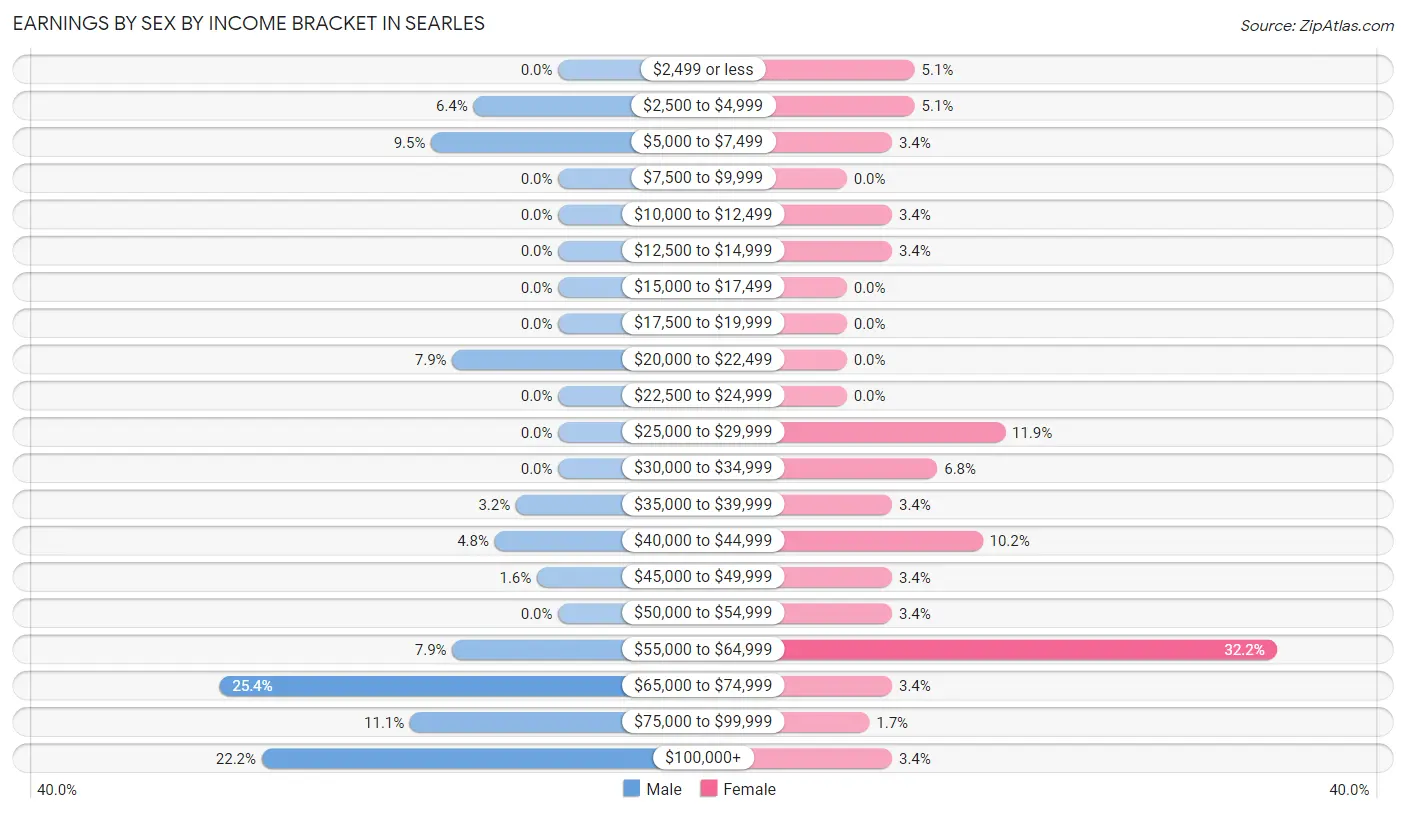
| Income | Male | Female |
| $2,499 or less | 0 (0.0%) | 3 (5.1%) |
| $2,500 to $4,999 | 4 (6.4%) | 3 (5.1%) |
| $5,000 to $7,499 | 6 (9.5%) | 2 (3.4%) |
| $7,500 to $9,999 | 0 (0.0%) | 0 (0.0%) |
| $10,000 to $12,499 | 0 (0.0%) | 2 (3.4%) |
| $12,500 to $14,999 | 0 (0.0%) | 2 (3.4%) |
| $15,000 to $17,499 | 0 (0.0%) | 0 (0.0%) |
| $17,500 to $19,999 | 0 (0.0%) | 0 (0.0%) |
| $20,000 to $22,499 | 5 (7.9%) | 0 (0.0%) |
| $22,500 to $24,999 | 0 (0.0%) | 0 (0.0%) |
| $25,000 to $29,999 | 0 (0.0%) | 7 (11.9%) |
| $30,000 to $34,999 | 0 (0.0%) | 4 (6.8%) |
| $35,000 to $39,999 | 2 (3.2%) | 2 (3.4%) |
| $40,000 to $44,999 | 3 (4.8%) | 6 (10.2%) |
| $45,000 to $49,999 | 1 (1.6%) | 2 (3.4%) |
| $50,000 to $54,999 | 0 (0.0%) | 2 (3.4%) |
| $55,000 to $64,999 | 5 (7.9%) | 19 (32.2%) |
| $65,000 to $74,999 | 16 (25.4%) | 2 (3.4%) |
| $75,000 to $99,999 | 7 (11.1%) | 1 (1.7%) |
| $100,000+ | 14 (22.2%) | 2 (3.4%) |
| Total | 63 (100.0%) | 59 (100.0%) |
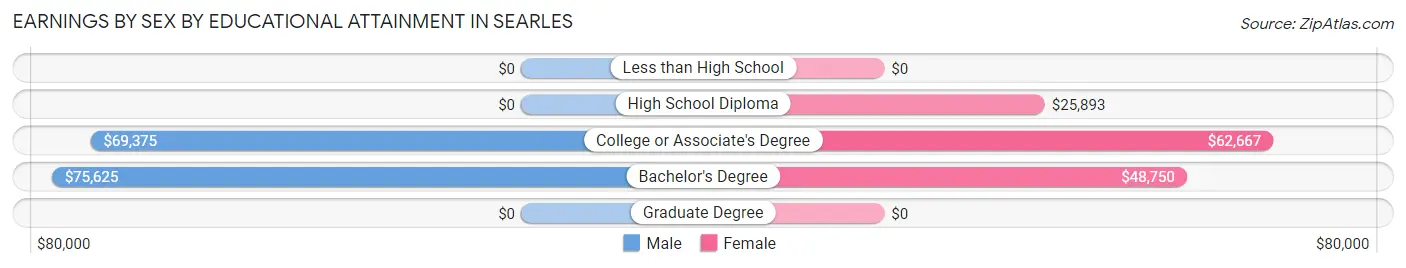
Earnings by Sex by Educational Attainment in Searles
Average earnings in Searles are $69,479 for men and $48,125 for women, a difference of 30.7%. Men with an educational attainment of bachelor's degree enjoy the highest average annual earnings of $75,625, while those with college or associate's degree education earn the least with $69,375. Women with an educational attainment of college or associate's degree earn the most with the average annual earnings of $62,667, while those with high school diploma education have the smallest earnings of $25,893.
| Educational Attainment | Male Income | Female Income |
| Less than High School | - | - |
| High School Diploma | - | - |
| College or Associate's Degree | $69,375 | $62,667 |
| Bachelor's Degree | $75,625 | $48,750 |
| Graduate Degree | - | - |
| Total | $69,479 | $48,125 |
Family Income in Searles
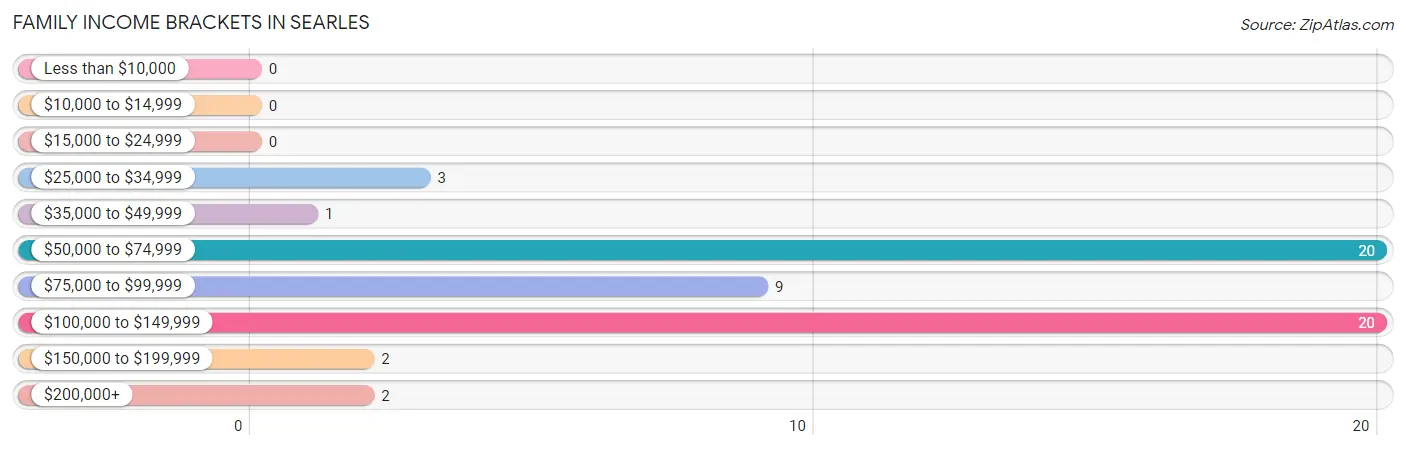
Family Income Brackets in Searles
According to the Searles family income data, there are 20 families falling into the $50,000 to $74,999 income range, which is the most common income bracket and makes up 35.1% of all families.
| Income Bracket | # Families | % Families |
| Less than $10,000 | 0 | 0.0% |
| $10,000 to $14,999 | 0 | 0.0% |
| $15,000 to $24,999 | 0 | 0.0% |
| $25,000 to $34,999 | 3 | 5.3% |
| $35,000 to $49,999 | 1 | 1.8% |
| $50,000 to $74,999 | 20 | 35.1% |
| $75,000 to $99,999 | 9 | 15.8% |
| $100,000 to $149,999 | 20 | 35.1% |
| $150,000 to $199,999 | 2 | 3.5% |
| $200,000+ | 2 | 3.5% |
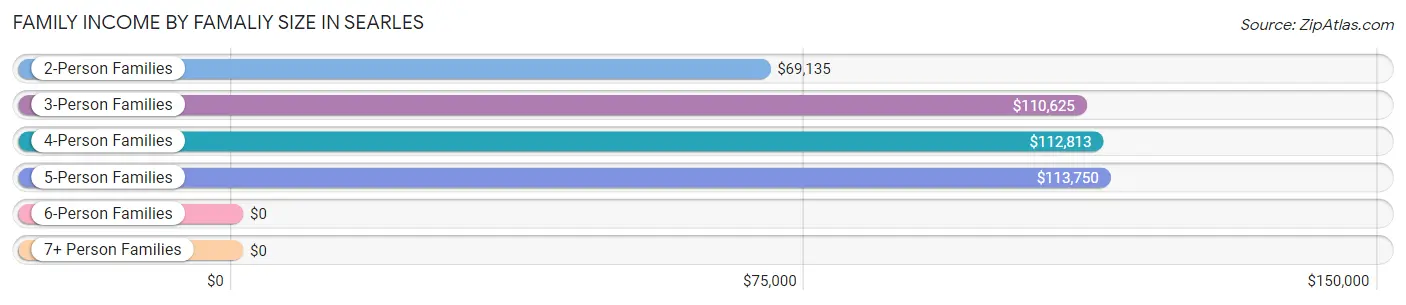
Family Income by Famaliy Size in Searles
5-person families (8 | 14.0%) account for the highest median family income in Searles with $113,750 per family, while 3-person families (7 | 12.3%) have the highest median income of $36,875 per family member.
| Income Bracket | # Families | Median Income |
| 2-Person Families | 31 (54.4%) | $69,135 |
| 3-Person Families | 7 (12.3%) | $110,625 |
| 4-Person Families | 11 (19.3%) | $112,813 |
| 5-Person Families | 8 (14.0%) | $113,750 |
| 6-Person Families | 0 (0.0%) | $0 |
| 7+ Person Families | 0 (0.0%) | $0 |
| Total | 57 (100.0%) | $91,250 |
Family Income by Number of Earners in Searles
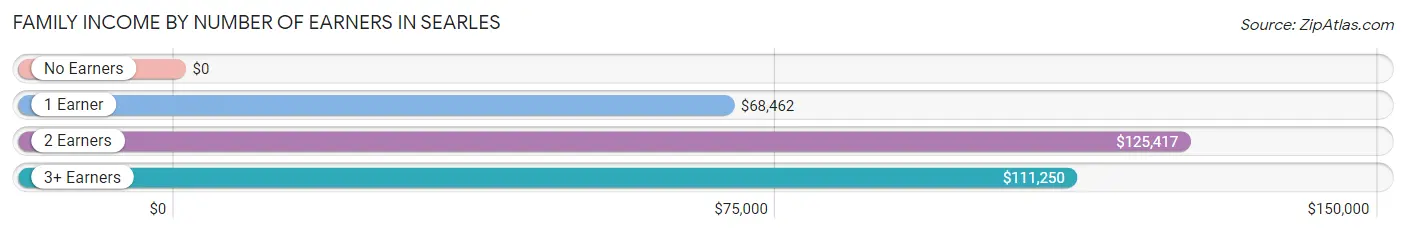
| Number of Earners | # Families | Median Income |
| No Earners | 4 (7.0%) | $0 |
| 1 Earner | 24 (42.1%) | $68,462 |
| 2 Earners | 21 (36.8%) | $125,417 |
| 3+ Earners | 8 (14.0%) | $111,250 |
| Total | 57 (100.0%) | $91,250 |
Household Income in Searles
Household Income Brackets in Searles
With 62 households falling in the category, the $100,000 to $149,999 income range is the most frequent in Searles, accounting for 53.4% of all households.
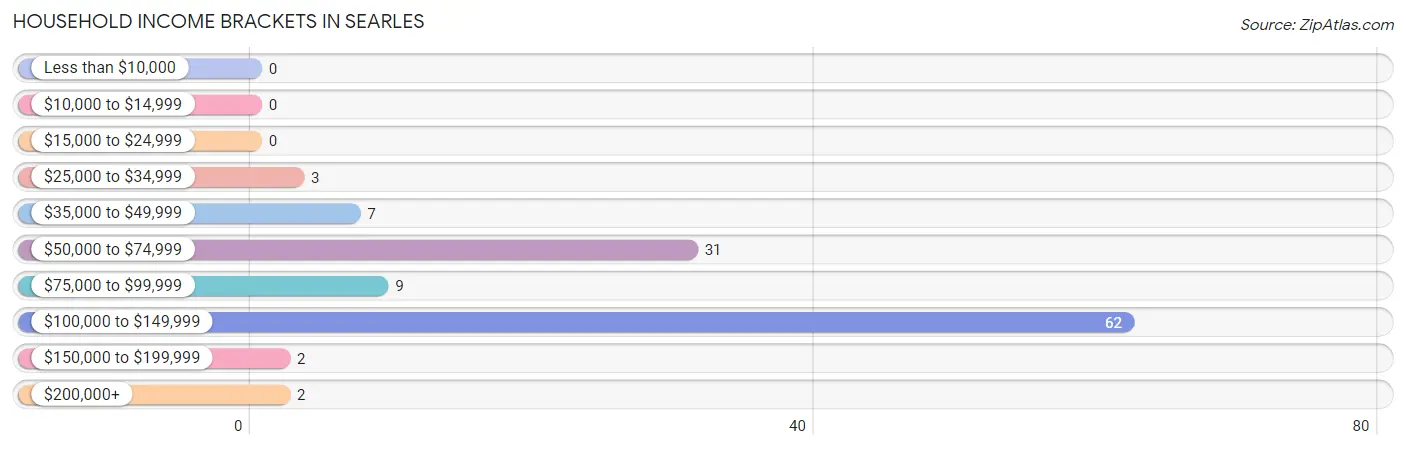
| Income Bracket | # Households | % Households |
| Less than $10,000 | 0 | 0.0% |
| $10,000 to $14,999 | 0 | 0.0% |
| $15,000 to $24,999 | 0 | 0.0% |
| $25,000 to $34,999 | 3 | 2.6% |
| $35,000 to $49,999 | 7 | 6.0% |
| $50,000 to $74,999 | 31 | 26.7% |
| $75,000 to $99,999 | 9 | 7.8% |
| $100,000 to $149,999 | 62 | 53.4% |
| $150,000 to $199,999 | 2 | 1.7% |
| $200,000+ | 2 | 1.7% |
Household Income by Householder Age in Searles
The median household income in Searles is $108,333, with the highest median household income of $137,714 found in the 65+ years age bracket for the primary householder. A total of 64 households (55.2%) fall into this category.
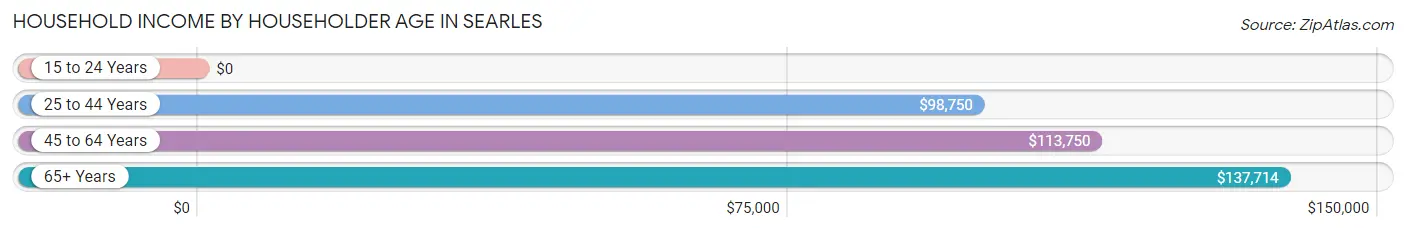
| Income Bracket | # Households | Median Income |
| 15 to 24 Years | 0 (0.0%) | $0 |
| 25 to 44 Years | 30 (25.9%) | $98,750 |
| 45 to 64 Years | 22 (19.0%) | $113,750 |
| 65+ Years | 64 (55.2%) | $137,714 |
| Total | 116 (100.0%) | $108,333 |
Poverty in Searles
Income Below Poverty by Sex and Age in Searles
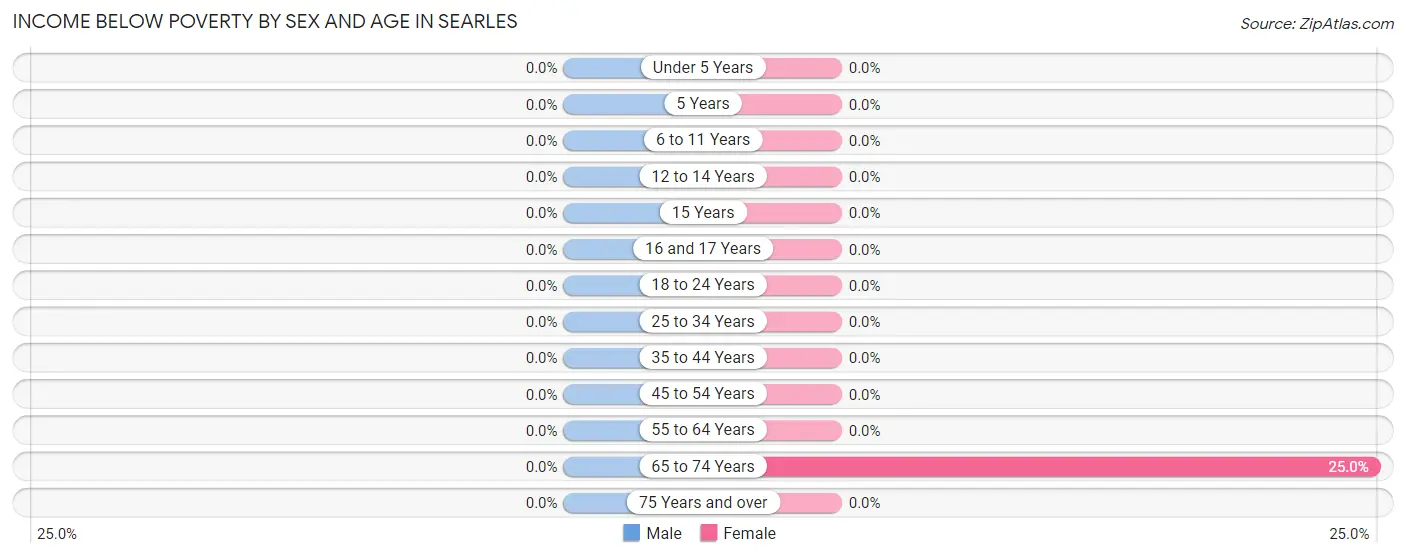
| Age Bracket | Male | Female |
| Under 5 Years | 0 (0.0%) | 0 (0.0%) |
| 5 Years | 0 (0.0%) | 0 (0.0%) |
| 6 to 11 Years | 0 (0.0%) | 0 (0.0%) |
| 12 to 14 Years | 0 (0.0%) | 0 (0.0%) |
| 15 Years | 0 (0.0%) | 0 (0.0%) |
| 16 and 17 Years | 0 (0.0%) | 0 (0.0%) |
| 18 to 24 Years | 0 (0.0%) | 0 (0.0%) |
| 25 to 34 Years | 0 (0.0%) | 0 (0.0%) |
| 35 to 44 Years | 0 (0.0%) | 0 (0.0%) |
| 45 to 54 Years | 0 (0.0%) | 0 (0.0%) |
| 55 to 64 Years | 0 (0.0%) | 0 (0.0%) |
| 65 to 74 Years | 0 (0.0%) | 4 (25.0%) |
| 75 Years and over | 0 (0.0%) | 0 (0.0%) |
| Total | 0 (0.0%) | 4 (2.9%) |
Income Above Poverty by Sex and Age in Searles
According to the poverty statistics in Searles, males aged under 5 years and females aged under 5 years are the age groups that are most secure financially, with 100.0% of males and 100.0% of females in these age groups living above the poverty line.
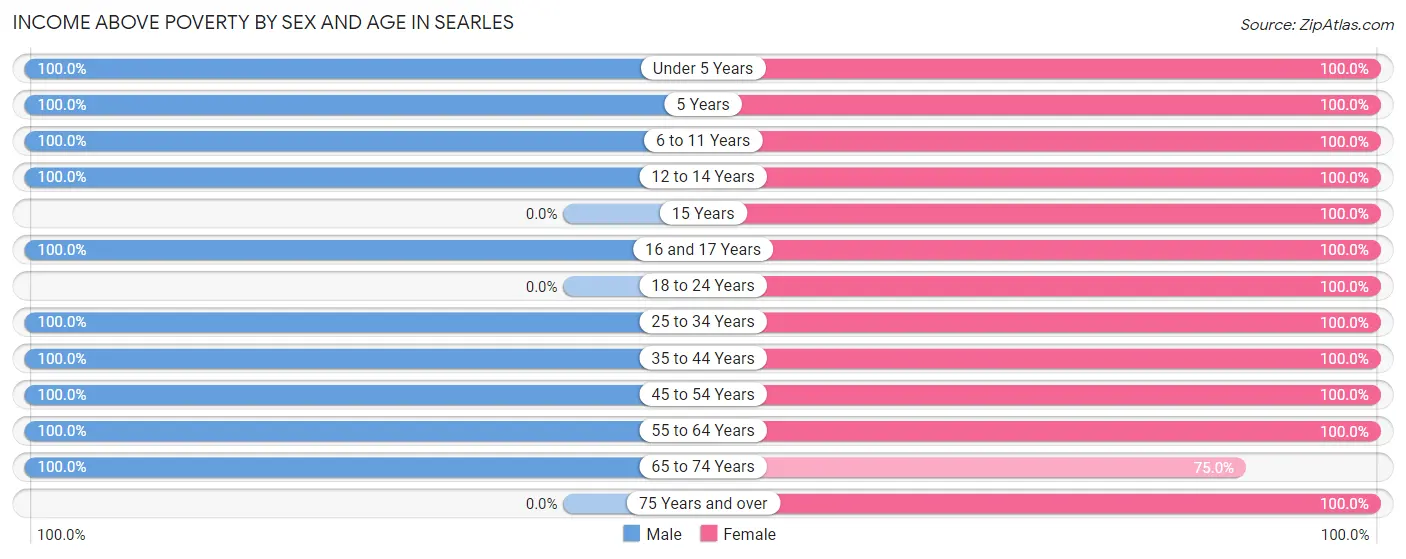
| Age Bracket | Male | Female |
| Under 5 Years | 3 (100.0%) | 13 (100.0%) |
| 5 Years | 3 (100.0%) | 2 (100.0%) |
| 6 to 11 Years | 5 (100.0%) | 6 (100.0%) |
| 12 to 14 Years | 9 (100.0%) | 5 (100.0%) |
| 15 Years | 0 (0.0%) | 1 (100.0%) |
| 16 and 17 Years | 8 (100.0%) | 4 (100.0%) |
| 18 to 24 Years | 0 (0.0%) | 2 (100.0%) |
| 25 to 34 Years | 15 (100.0%) | 5 (100.0%) |
| 35 to 44 Years | 18 (100.0%) | 15 (100.0%) |
| 45 to 54 Years | 13 (100.0%) | 14 (100.0%) |
| 55 to 64 Years | 8 (100.0%) | 55 (100.0%) |
| 65 to 74 Years | 63 (100.0%) | 12 (75.0%) |
| 75 Years and over | 0 (0.0%) | 2 (100.0%) |
| Total | 145 (100.0%) | 136 (97.1%) |
Income Below Poverty Among Married-Couple Families in Searles
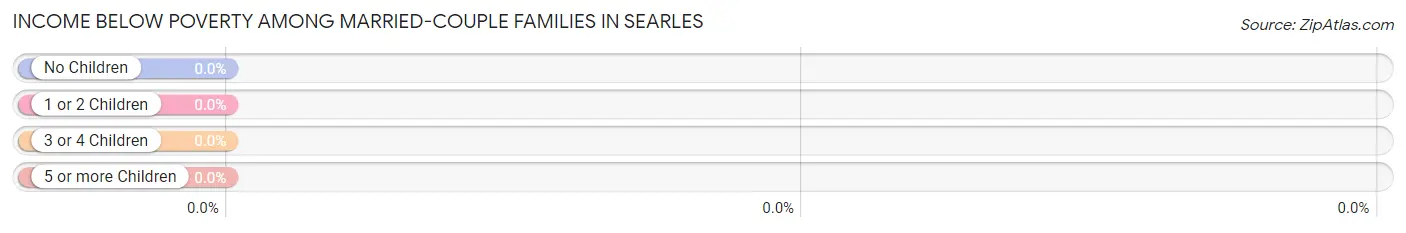
| Children | Above Poverty | Below Poverty |
| No Children | 32 (100.0%) | 0 (0.0%) |
| 1 or 2 Children | 16 (100.0%) | 0 (0.0%) |
| 3 or 4 Children | 8 (100.0%) | 0 (0.0%) |
| 5 or more Children | 0 (0.0%) | 0 (0.0%) |
| Total | 56 (100.0%) | 0 (0.0%) |
Income Below Poverty Among Single-Parent Households in Searles
| Children | Single Father | Single Mother |
| No Children | 0 (0.0%) | 0 (0.0%) |
| 1 or 2 Children | 0 (0.0%) | 0 (0.0%) |
| 3 or 4 Children | 0 (0.0%) | 0 (0.0%) |
| 5 or more Children | 0 (0.0%) | 0 (0.0%) |
| Total | 0 (0.0%) | 0 (0.0%) |
Income Below Poverty Among Married-Couple vs Single-Parent Households in Searles
| Children | Married-Couple Families | Single-Parent Households |
| No Children | 0 (0.0%) | 0 (0.0%) |
| 1 or 2 Children | 0 (0.0%) | 0 (0.0%) |
| 3 or 4 Children | 0 (0.0%) | 0 (0.0%) |
| 5 or more Children | 0 (0.0%) | 0 (0.0%) |
| Total | 0 (0.0%) | 0 (0.0%) |
Employment Characteristics in Searles
Employment by Class of Employer in Searles
Among the 117 employed individuals in Searles, private company employees (95 | 81.2%), local government employees (8 | 6.8%), and not-for-profit organizations (7 | 6.0%) make up the most common classes of employment.
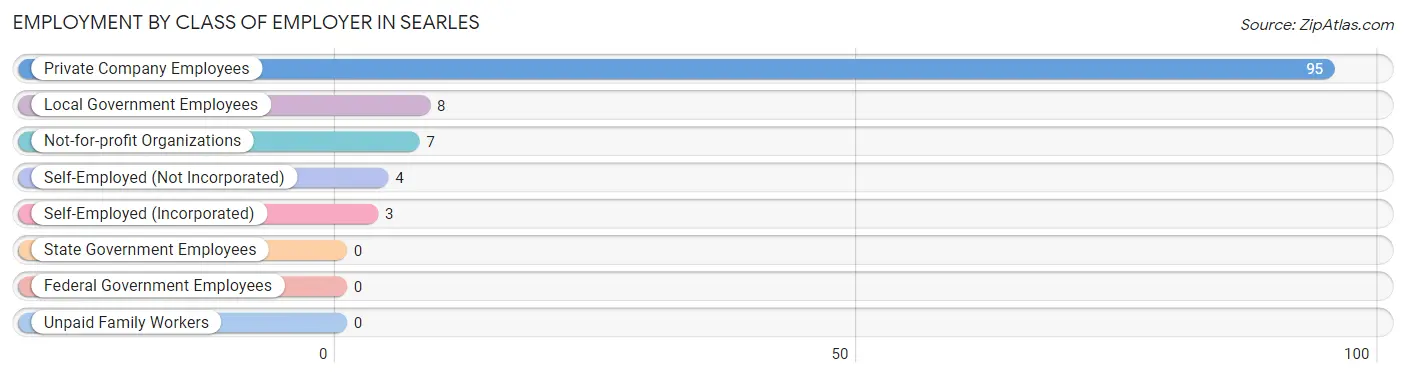
| Employer Class | # Employees | % Employees |
| Private Company Employees | 95 | 81.2% |
| Self-Employed (Incorporated) | 3 | 2.6% |
| Self-Employed (Not Incorporated) | 4 | 3.4% |
| Not-for-profit Organizations | 7 | 6.0% |
| Local Government Employees | 8 | 6.8% |
| State Government Employees | 0 | 0.0% |
| Federal Government Employees | 0 | 0.0% |
| Unpaid Family Workers | 0 | 0.0% |
| Total | 117 | 100.0% |
Employment Status by Age in Searles
According to the labor force statistics for Searles, out of the total population over 16 years of age (238), 49.6% or 118 individuals are in the labor force, with 0.8% or 1 of them unemployed. The age group with the highest labor force participation rate is 25 to 29 years, with 100.0% or 2 individuals in the labor force. Within the labor force, the 25 to 29 years age range has the highest percentage of unemployed individuals, with 50.0% or 1 of them being unemployed.
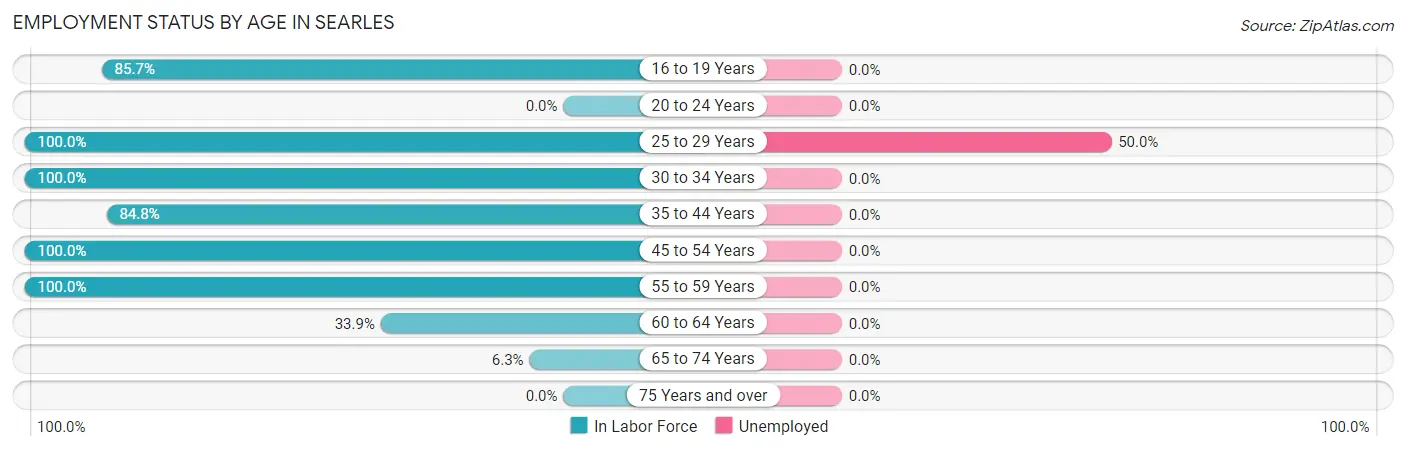
| Age Bracket | In Labor Force | Unemployed |
| 16 to 19 Years | 12 (85.7%) | 0 (0.0%) |
| 20 to 24 Years | 0 (0.0%) | 0 (0.0%) |
| 25 to 29 Years | 2 (100.0%) | 1 (50.0%) |
| 30 to 34 Years | 18 (100.0%) | 0 (0.0%) |
| 35 to 44 Years | 28 (84.8%) | 0 (0.0%) |
| 45 to 54 Years | 27 (100.0%) | 0 (0.0%) |
| 55 to 59 Years | 7 (100.0%) | 0 (0.0%) |
| 60 to 64 Years | 19 (33.9%) | 0 (0.0%) |
| 65 to 74 Years | 5 (6.3%) | 0 (0.0%) |
| 75 Years and over | 0 (0.0%) | 0 (0.0%) |
| Total | 118 (49.6%) | 1 (0.8%) |
Employment Status by Educational Attainment in Searles
According to labor force statistics for Searles, 70.6% of individuals (101) out of the total population between 25 and 64 years of age (143) are in the labor force, with 1.0% or 1 of them being unemployed. The group with the highest labor force participation rate are those with the educational attainment of bachelor's degree or higher, with 100.0% or 19 individuals in the labor force. Within the labor force, individuals with high school diploma education have the highest percentage of unemployment, with 4.3% or 1 of them being unemployed.
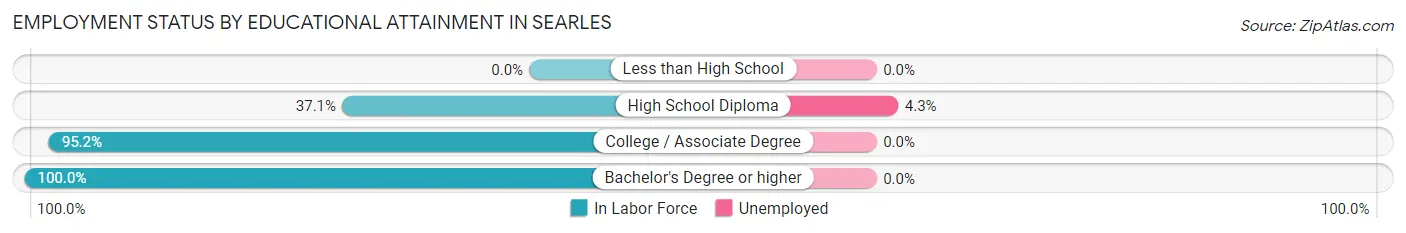
| Educational Attainment | In Labor Force | Unemployed |
| Less than High School | 0 (0.0%) | 0 (0.0%) |
| High School Diploma | 23 (37.1%) | 3 (4.3%) |
| College / Associate Degree | 59 (95.2%) | 0 (0.0%) |
| Bachelor's Degree or higher | 19 (100.0%) | 0 (0.0%) |
| Total | 101 (70.6%) | 1 (1.0%) |
Employment Occupations by Sex in Searles
Management, Business, Science and Arts Occupations
The most common Management, Business, Science and Arts occupations in Searles are Health Diagnosing & Treating (7 | 6.0%), Management (6 | 5.1%), Community & Social Service (6 | 5.1%), Health Technologists (6 | 5.1%), and Business & Financial (5 | 4.3%).
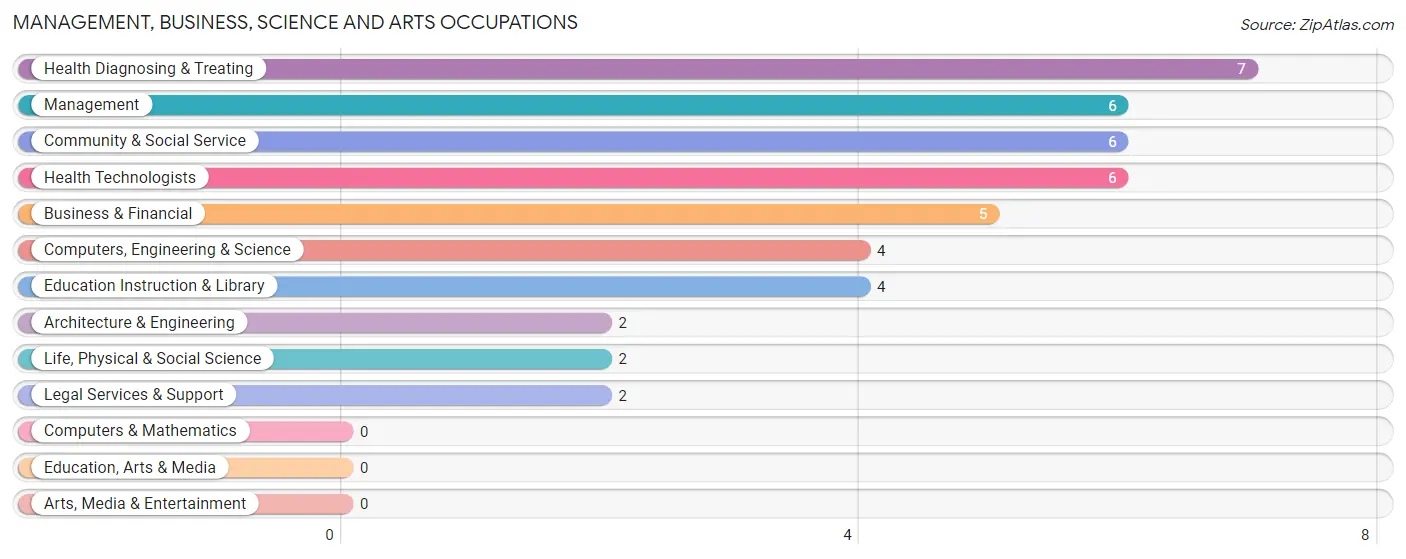
Management, Business, Science and Arts Occupations by Sex
Within the Management, Business, Science and Arts occupations in Searles, the most male-oriented occupations are Architecture & Engineering (100.0%), Management (50.0%), and Computers, Engineering & Science (50.0%), while the most female-oriented occupations are Business & Financial (100.0%), Life, Physical & Social Science (100.0%), and Legal Services & Support (100.0%).
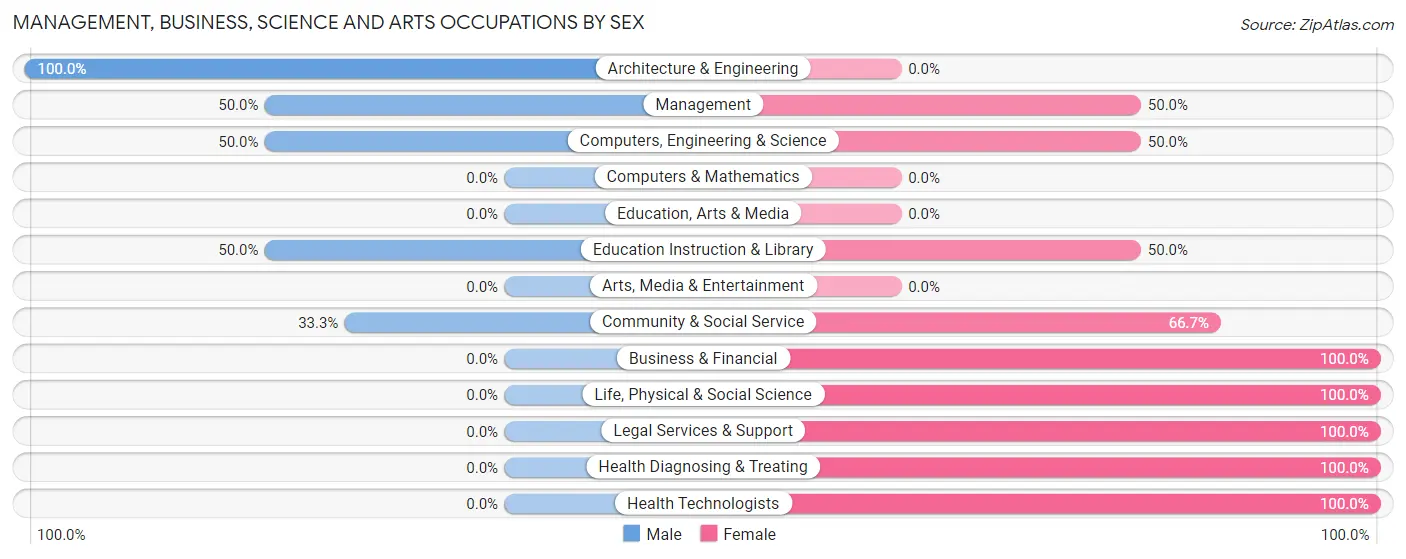
| Occupation | Male | Female |
| Management | 3 (50.0%) | 3 (50.0%) |
| Business & Financial | 0 (0.0%) | 5 (100.0%) |
| Computers, Engineering & Science | 2 (50.0%) | 2 (50.0%) |
| Computers & Mathematics | 0 (0.0%) | 0 (0.0%) |
| Architecture & Engineering | 2 (100.0%) | 0 (0.0%) |
| Life, Physical & Social Science | 0 (0.0%) | 2 (100.0%) |
| Community & Social Service | 2 (33.3%) | 4 (66.7%) |
| Education, Arts & Media | 0 (0.0%) | 0 (0.0%) |
| Legal Services & Support | 0 (0.0%) | 2 (100.0%) |
| Education Instruction & Library | 2 (50.0%) | 2 (50.0%) |
| Arts, Media & Entertainment | 0 (0.0%) | 0 (0.0%) |
| Health Diagnosing & Treating | 0 (0.0%) | 7 (100.0%) |
| Health Technologists | 0 (0.0%) | 6 (100.0%) |
| Total (Category) | 7 (25.0%) | 21 (75.0%) |
| Total (Overall) | 62 (53.0%) | 55 (47.0%) |
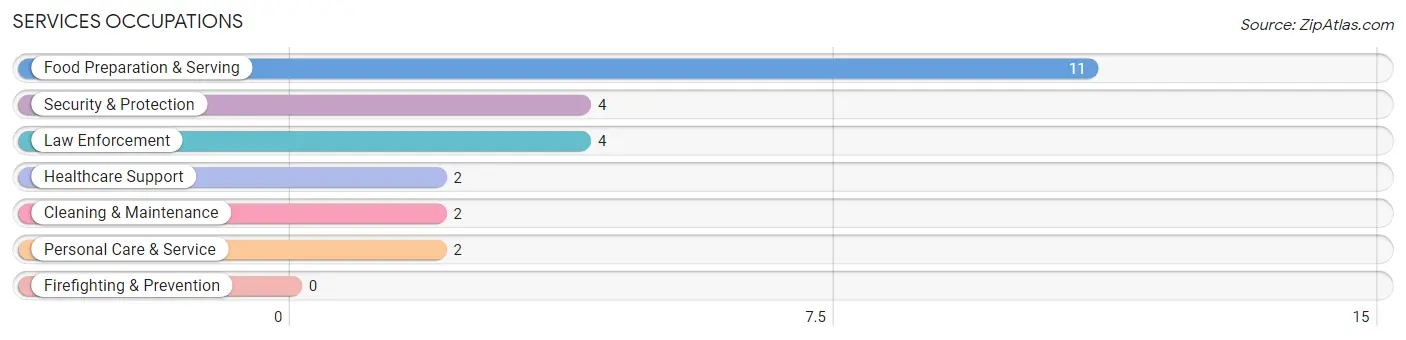
Services Occupations
The most common Services occupations in Searles are Food Preparation & Serving (11 | 9.4%), Security & Protection (4 | 3.4%), Law Enforcement (4 | 3.4%), Healthcare Support (2 | 1.7%), and Cleaning & Maintenance (2 | 1.7%).
Services Occupations by Sex
Within the Services occupations in Searles, the most male-oriented occupations are Security & Protection (100.0%), Law Enforcement (100.0%), and Food Preparation & Serving (72.7%), while the most female-oriented occupations are Healthcare Support (100.0%), Personal Care & Service (100.0%), and Cleaning & Maintenance (50.0%).
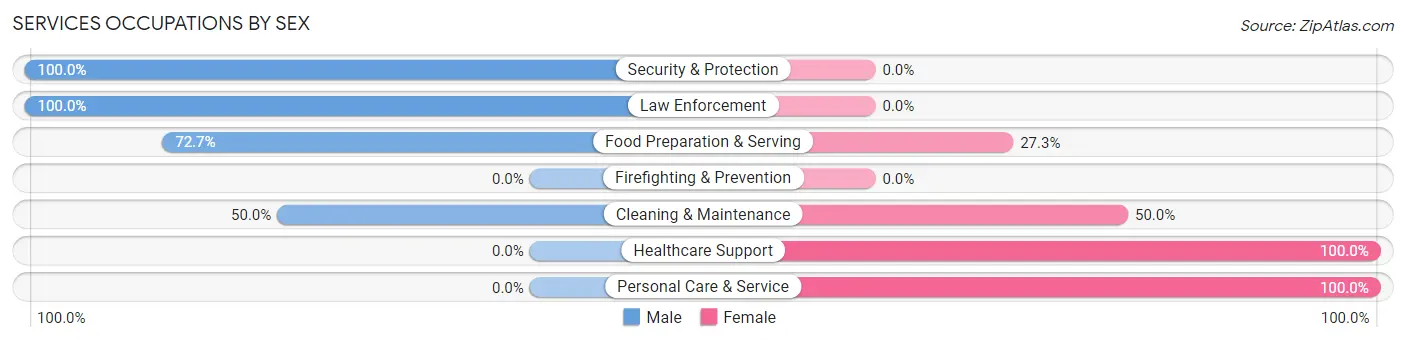
| Occupation | Male | Female |
| Healthcare Support | 0 (0.0%) | 2 (100.0%) |
| Security & Protection | 4 (100.0%) | 0 (0.0%) |
| Firefighting & Prevention | 0 (0.0%) | 0 (0.0%) |
| Law Enforcement | 4 (100.0%) | 0 (0.0%) |
| Food Preparation & Serving | 8 (72.7%) | 3 (27.3%) |
| Cleaning & Maintenance | 1 (50.0%) | 1 (50.0%) |
| Personal Care & Service | 0 (0.0%) | 2 (100.0%) |
| Total (Category) | 13 (61.9%) | 8 (38.1%) |
| Total (Overall) | 62 (53.0%) | 55 (47.0%) |
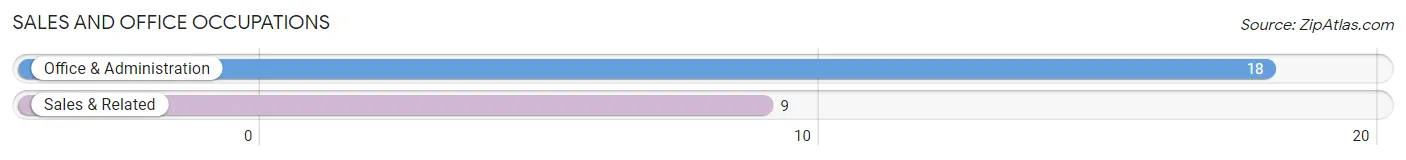
Sales and Office Occupations
The most common Sales and Office occupations in Searles are Office & Administration (18 | 15.4%), and Sales & Related (9 | 7.7%).
Sales and Office Occupations by Sex
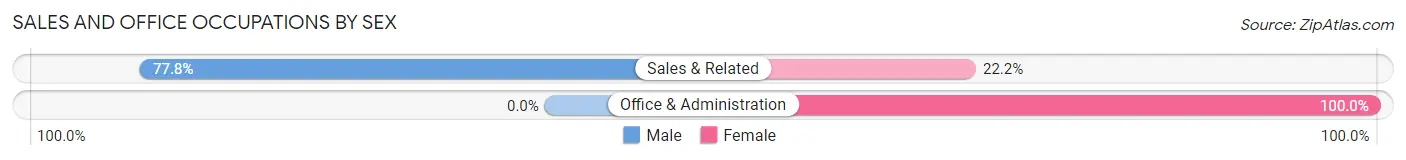
| Occupation | Male | Female |
| Sales & Related | 7 (77.8%) | 2 (22.2%) |
| Office & Administration | 0 (0.0%) | 18 (100.0%) |
| Total (Category) | 7 (25.9%) | 20 (74.1%) |
| Total (Overall) | 62 (53.0%) | 55 (47.0%) |
Natural Resources, Construction and Maintenance Occupations
The most common Natural Resources, Construction and Maintenance occupations in Searles are Installation, Maintenance & Repair (15 | 12.8%), and Construction & Extraction (6 | 5.1%).
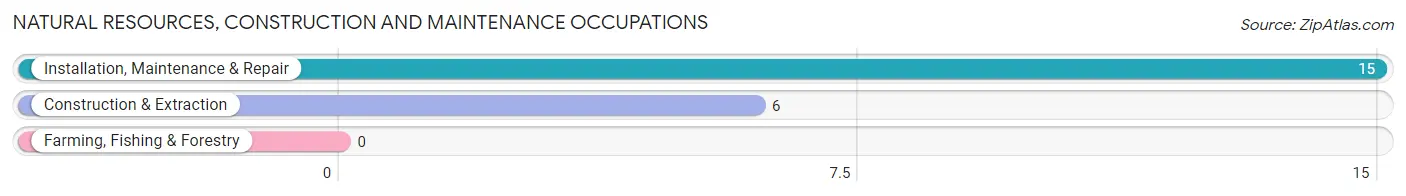
Natural Resources, Construction and Maintenance Occupations by Sex
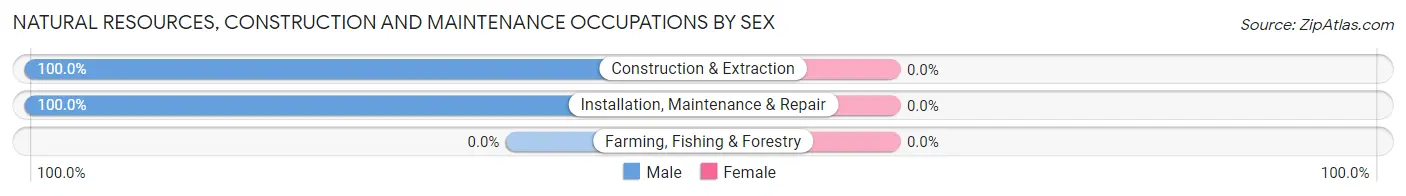
| Occupation | Male | Female |
| Farming, Fishing & Forestry | 0 (0.0%) | 0 (0.0%) |
| Construction & Extraction | 6 (100.0%) | 0 (0.0%) |
| Installation, Maintenance & Repair | 15 (100.0%) | 0 (0.0%) |
| Total (Category) | 21 (100.0%) | 0 (0.0%) |
| Total (Overall) | 62 (53.0%) | 55 (47.0%) |
Production, Transportation and Moving Occupations
The most common Production, Transportation and Moving occupations in Searles are Production (16 | 13.7%), and Material Moving (4 | 3.4%).
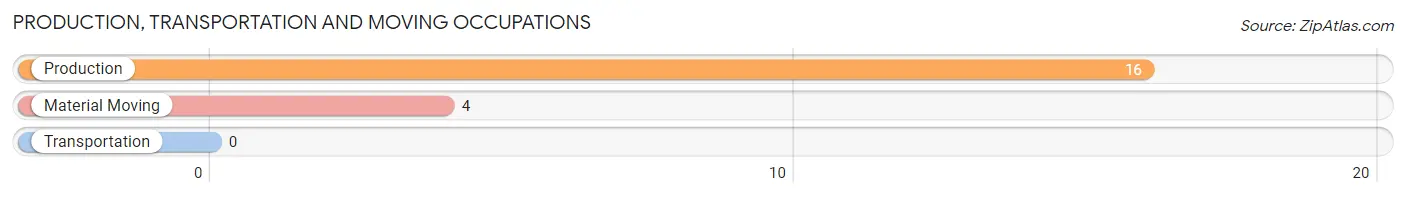
Production, Transportation and Moving Occupations by Sex
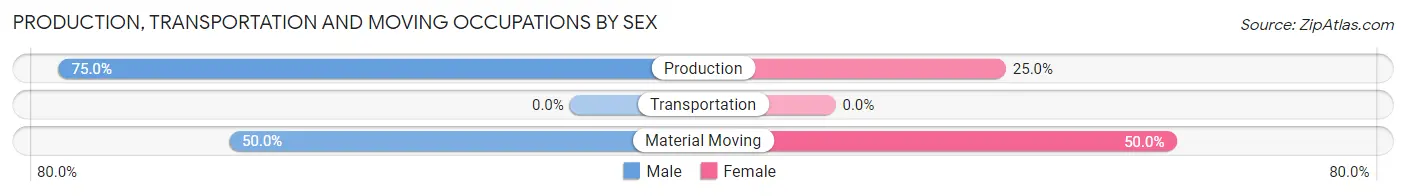
| Occupation | Male | Female |
| Production | 12 (75.0%) | 4 (25.0%) |
| Transportation | 0 (0.0%) | 0 (0.0%) |
| Material Moving | 2 (50.0%) | 2 (50.0%) |
| Total (Category) | 14 (70.0%) | 6 (30.0%) |
| Total (Overall) | 62 (53.0%) | 55 (47.0%) |
Employment Industries by Sex in Searles
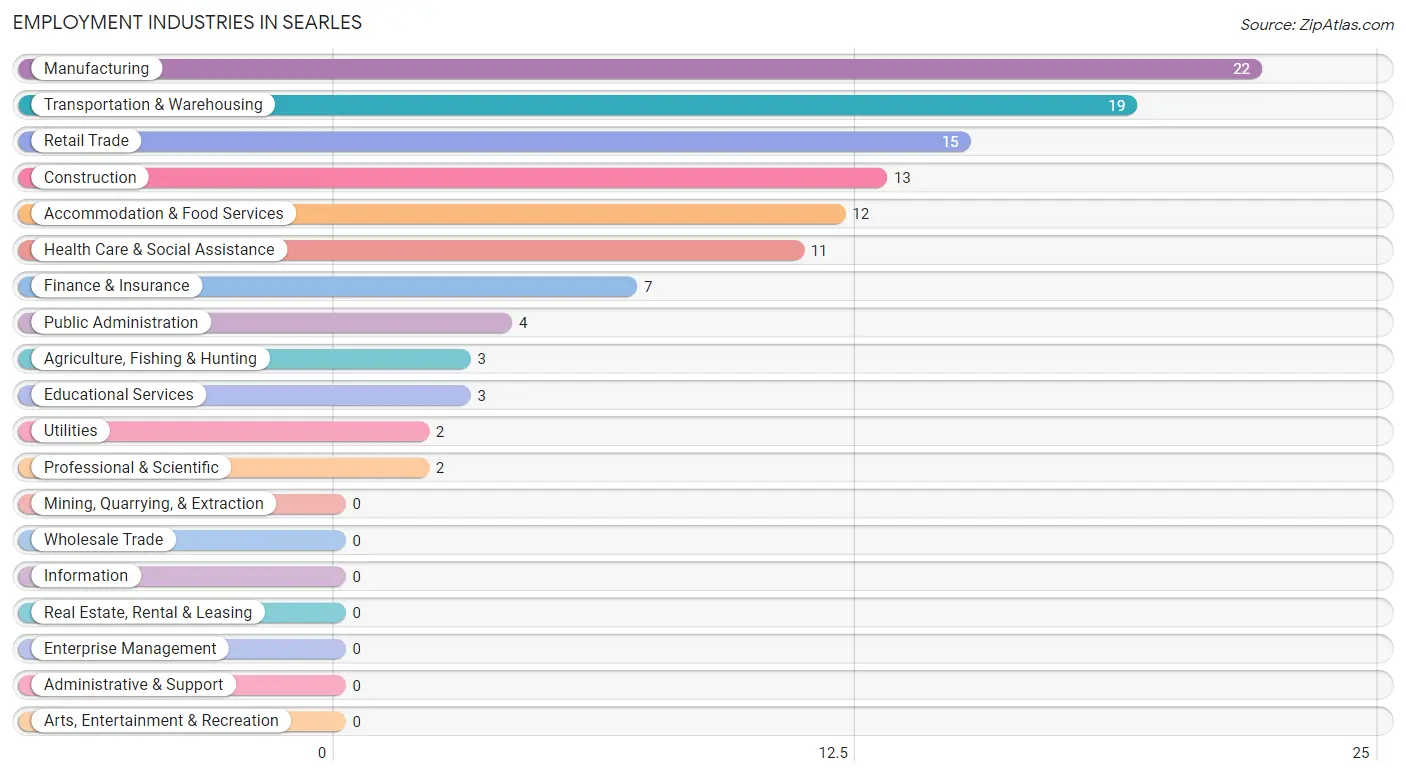
Employment Industries in Searles
The major employment industries in Searles include Manufacturing (22 | 18.8%), Transportation & Warehousing (19 | 16.2%), Retail Trade (15 | 12.8%), Construction (13 | 11.1%), and Accommodation & Food Services (12 | 10.3%).
Employment Industries by Sex in Searles
The Searles industries that see more men than women are Agriculture, Fishing & Hunting (100.0%), Utilities (100.0%), and Public Administration (100.0%), whereas the industries that tend to have a higher number of women are Finance & Insurance (100.0%), Professional & Scientific (100.0%), and Health Care & Social Assistance (100.0%).
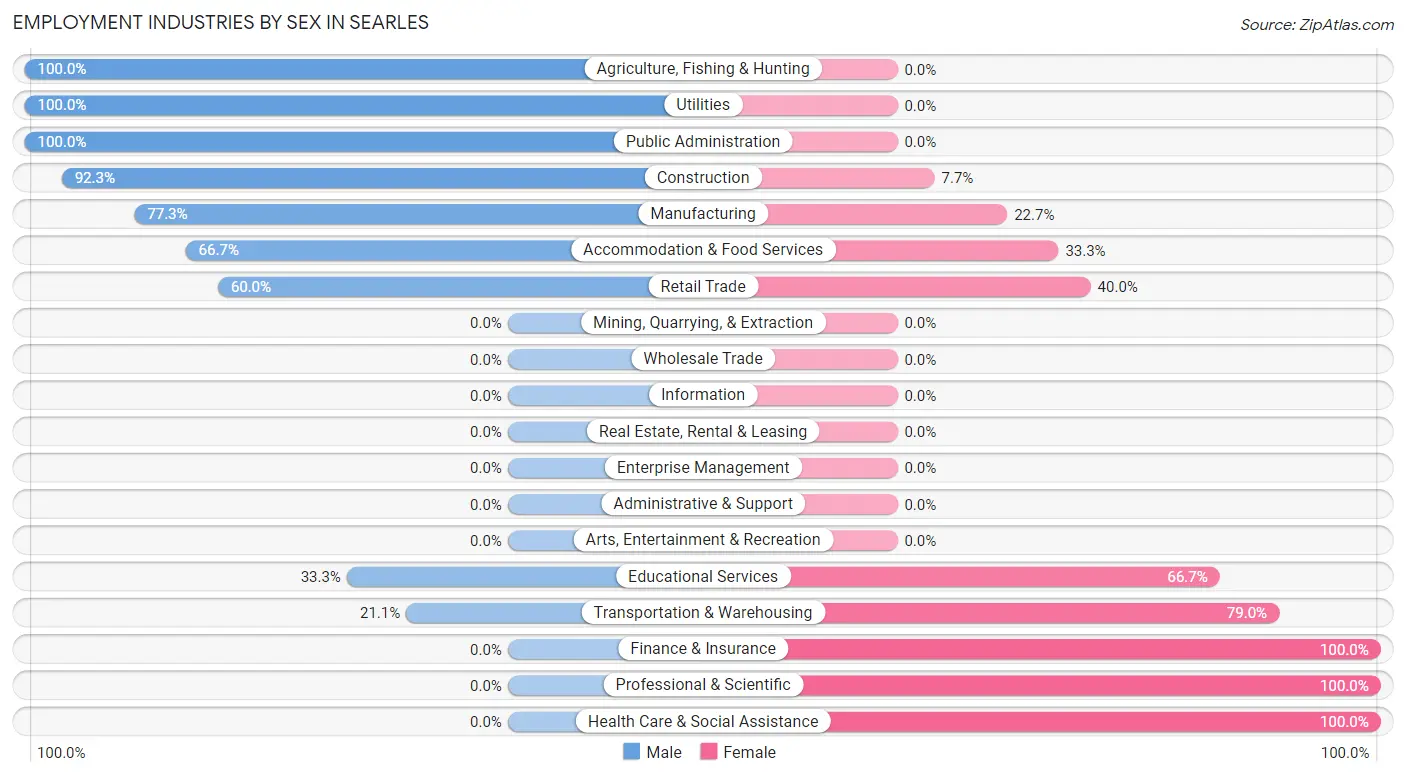
| Industry | Male | Female |
| Agriculture, Fishing & Hunting | 3 (100.0%) | 0 (0.0%) |
| Mining, Quarrying, & Extraction | 0 (0.0%) | 0 (0.0%) |
| Construction | 12 (92.3%) | 1 (7.7%) |
| Manufacturing | 17 (77.3%) | 5 (22.7%) |
| Wholesale Trade | 0 (0.0%) | 0 (0.0%) |
| Retail Trade | 9 (60.0%) | 6 (40.0%) |
| Transportation & Warehousing | 4 (21.0%) | 15 (78.9%) |
| Utilities | 2 (100.0%) | 0 (0.0%) |
| Information | 0 (0.0%) | 0 (0.0%) |
| Finance & Insurance | 0 (0.0%) | 7 (100.0%) |
| Real Estate, Rental & Leasing | 0 (0.0%) | 0 (0.0%) |
| Professional & Scientific | 0 (0.0%) | 2 (100.0%) |
| Enterprise Management | 0 (0.0%) | 0 (0.0%) |
| Administrative & Support | 0 (0.0%) | 0 (0.0%) |
| Educational Services | 1 (33.3%) | 2 (66.7%) |
| Health Care & Social Assistance | 0 (0.0%) | 11 (100.0%) |
| Arts, Entertainment & Recreation | 0 (0.0%) | 0 (0.0%) |
| Accommodation & Food Services | 8 (66.7%) | 4 (33.3%) |
| Public Administration | 4 (100.0%) | 0 (0.0%) |
| Total | 62 (53.0%) | 55 (47.0%) |
Education in Searles
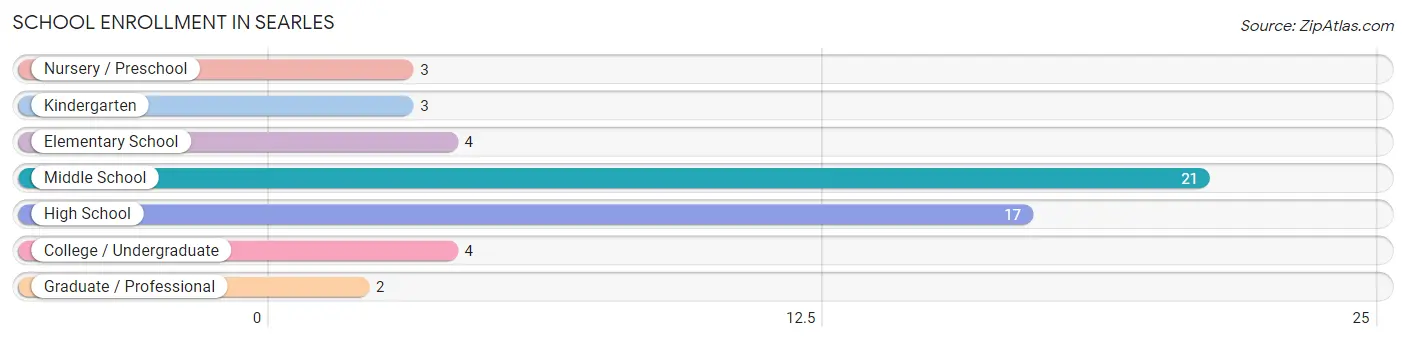
School Enrollment in Searles
The most common levels of schooling among the 54 students in Searles are middle school (21 | 38.9%), high school (17 | 31.5%), and elementary school (4 | 7.4%).
| School Level | # Students | % Students |
| Nursery / Preschool | 3 | 5.6% |
| Kindergarten | 3 | 5.6% |
| Elementary School | 4 | 7.4% |
| Middle School | 21 | 38.9% |
| High School | 17 | 31.5% |
| College / Undergraduate | 4 | 7.4% |
| Graduate / Professional | 2 | 3.7% |
| Total | 54 | 100.0% |
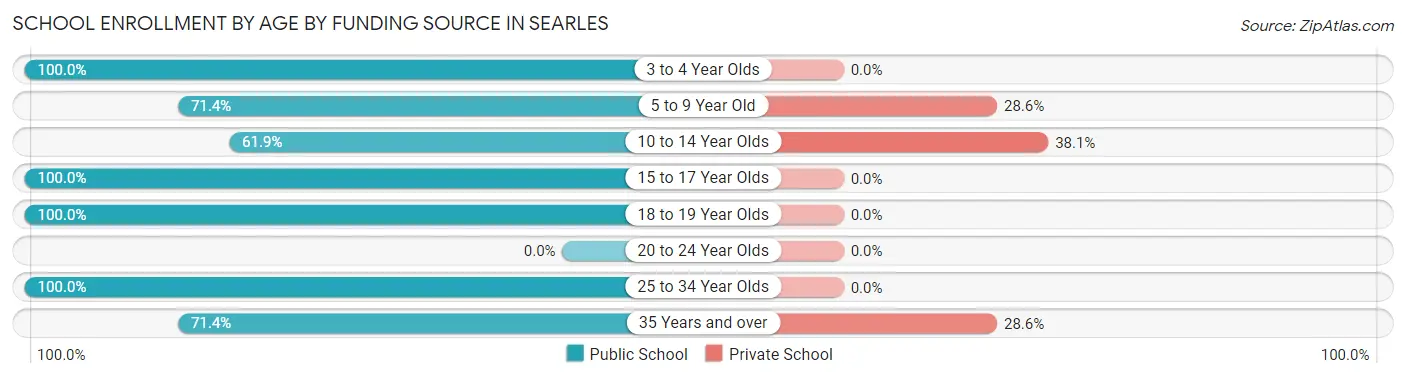
School Enrollment by Age by Funding Source in Searles
Out of a total of 54 students who are enrolled in schools in Searles, 12 (22.2%) attend a private institution, while the remaining 42 (77.8%) are enrolled in public schools. The age group of 10 to 14 year olds has the highest likelihood of being enrolled in private schools, with 8 (38.1% in the age bracket) enrolled. Conversely, the age group of 3 to 4 year olds has the lowest likelihood of being enrolled in a private school, with 3 (100.0% in the age bracket) attending a public institution.
| Age Bracket | Public School | Private School |
| 3 to 4 Year Olds | 3 (100.0%) | 0 (0.0%) |
| 5 to 9 Year Old | 5 (71.4%) | 2 (28.6%) |
| 10 to 14 Year Olds | 13 (61.9%) | 8 (38.1%) |
| 15 to 17 Year Olds | 13 (100.0%) | 0 (0.0%) |
| 18 to 19 Year Olds | 2 (100.0%) | 0 (0.0%) |
| 20 to 24 Year Olds | 0 (0.0%) | 0 (0.0%) |
| 25 to 34 Year Olds | 1 (100.0%) | 0 (0.0%) |
| 35 Years and over | 5 (71.4%) | 2 (28.6%) |
| Total | 42 (77.8%) | 12 (22.2%) |
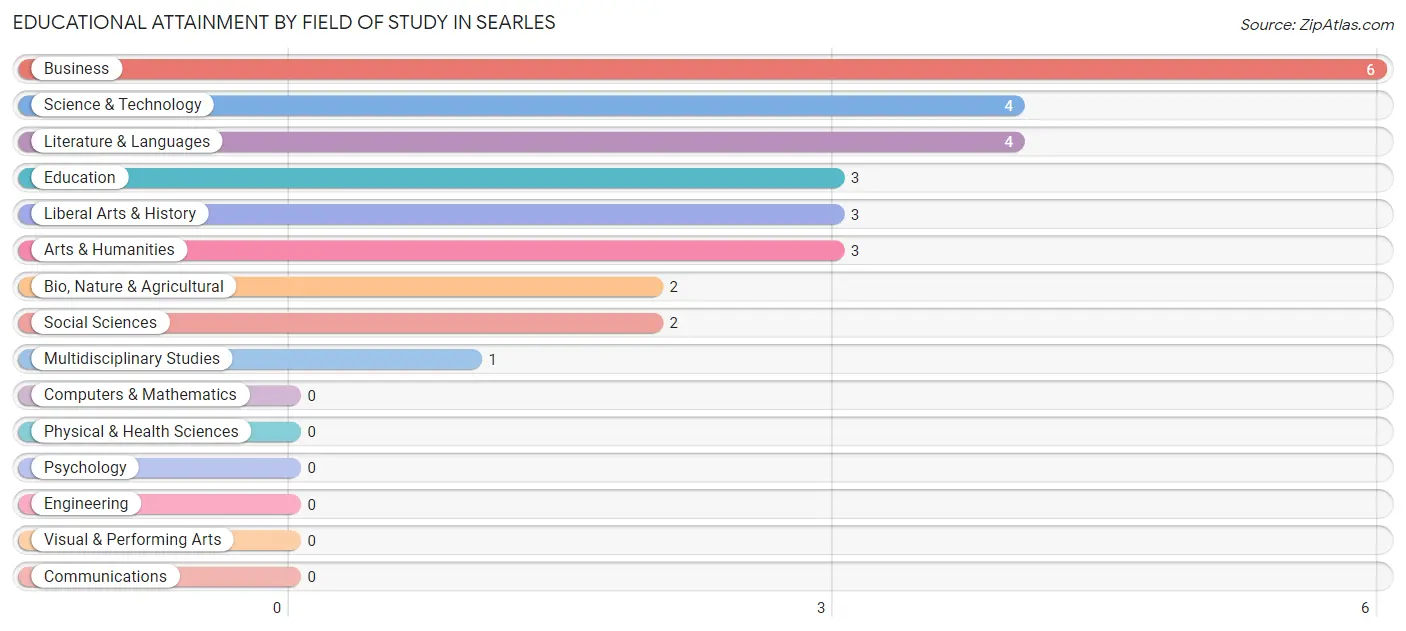
Educational Attainment by Field of Study in Searles
Business (6 | 21.4%), science & technology (4 | 14.3%), literature & languages (4 | 14.3%), education (3 | 10.7%), and liberal arts & history (3 | 10.7%) are the most common fields of study among 28 individuals in Searles who have obtained a bachelor's degree or higher.
| Field of Study | # Graduates | % Graduates |
| Computers & Mathematics | 0 | 0.0% |
| Bio, Nature & Agricultural | 2 | 7.1% |
| Physical & Health Sciences | 0 | 0.0% |
| Psychology | 0 | 0.0% |
| Social Sciences | 2 | 7.1% |
| Engineering | 0 | 0.0% |
| Multidisciplinary Studies | 1 | 3.6% |
| Science & Technology | 4 | 14.3% |
| Business | 6 | 21.4% |
| Education | 3 | 10.7% |
| Literature & Languages | 4 | 14.3% |
| Liberal Arts & History | 3 | 10.7% |
| Visual & Performing Arts | 0 | 0.0% |
| Communications | 0 | 0.0% |
| Arts & Humanities | 3 | 10.7% |
| Total | 28 | 100.0% |
Transportation & Commute in Searles
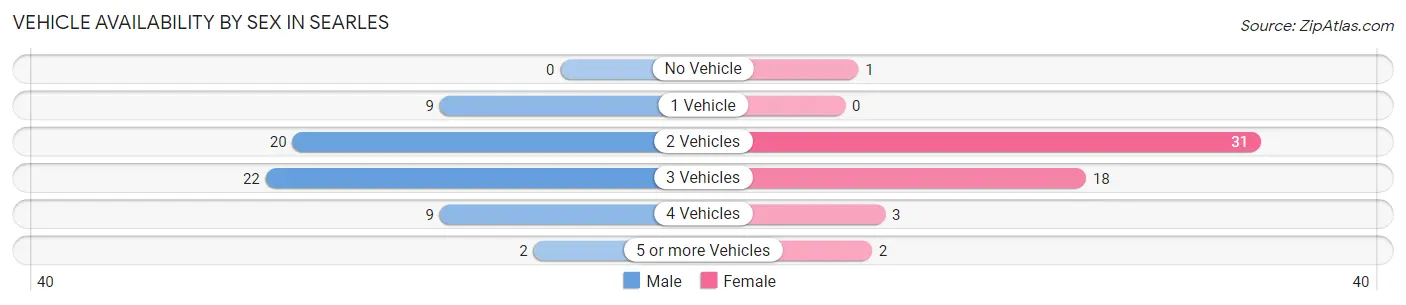
Vehicle Availability by Sex in Searles
The most prevalent vehicle ownership categories in Searles are males with 3 vehicles (22, accounting for 35.5%) and females with 3 vehicles (18, making up 40.0%).
| Vehicles Available | Male | Female |
| No Vehicle | 0 (0.0%) | 1 (1.8%) |
| 1 Vehicle | 9 (14.5%) | 0 (0.0%) |
| 2 Vehicles | 20 (32.3%) | 31 (56.4%) |
| 3 Vehicles | 22 (35.5%) | 18 (32.7%) |
| 4 Vehicles | 9 (14.5%) | 3 (5.4%) |
| 5 or more Vehicles | 2 (3.2%) | 2 (3.6%) |
| Total | 62 (100.0%) | 55 (100.0%) |
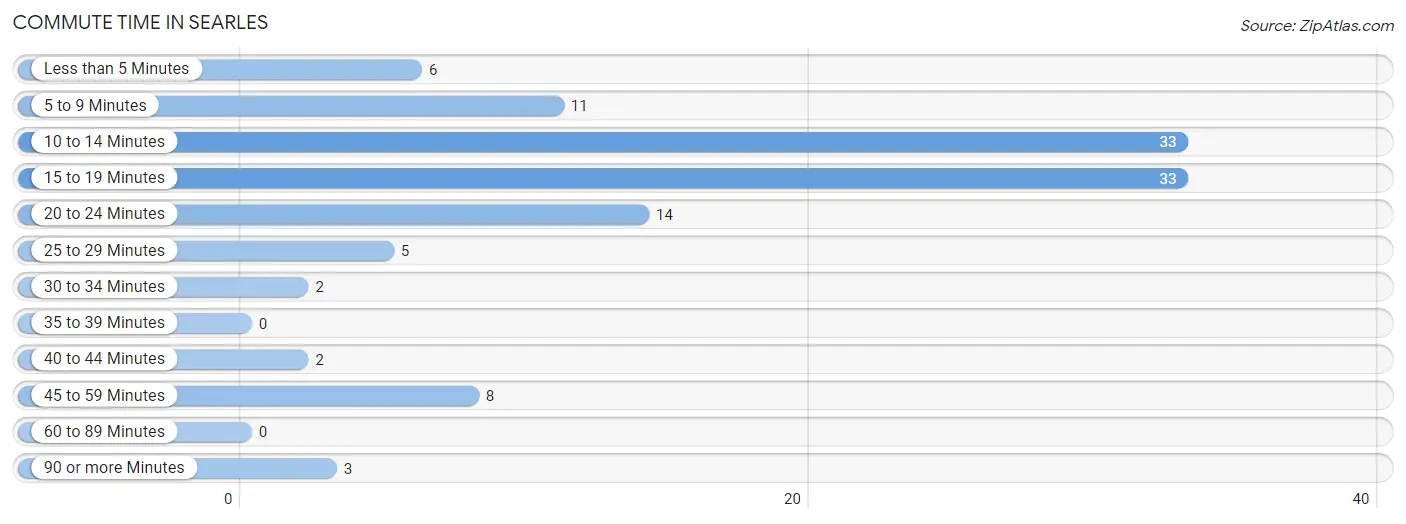
Commute Time in Searles
The most frequently occuring commute durations in Searles are 10 to 14 minutes (33 commuters, 28.2%), 15 to 19 minutes (33 commuters, 28.2%), and 20 to 24 minutes (14 commuters, 12.0%).
| Commute Time | # Commuters | % Commuters |
| Less than 5 Minutes | 6 | 5.1% |
| 5 to 9 Minutes | 11 | 9.4% |
| 10 to 14 Minutes | 33 | 28.2% |
| 15 to 19 Minutes | 33 | 28.2% |
| 20 to 24 Minutes | 14 | 12.0% |
| 25 to 29 Minutes | 5 | 4.3% |
| 30 to 34 Minutes | 2 | 1.7% |
| 35 to 39 Minutes | 0 | 0.0% |
| 40 to 44 Minutes | 2 | 1.7% |
| 45 to 59 Minutes | 8 | 6.8% |
| 60 to 89 Minutes | 0 | 0.0% |
| 90 or more Minutes | 3 | 2.6% |
Commute Time by Sex in Searles
The most common commute times in Searles are 15 to 19 minutes (22 commuters, 35.5%) for males and 10 to 14 minutes (23 commuters, 41.8%) for females.
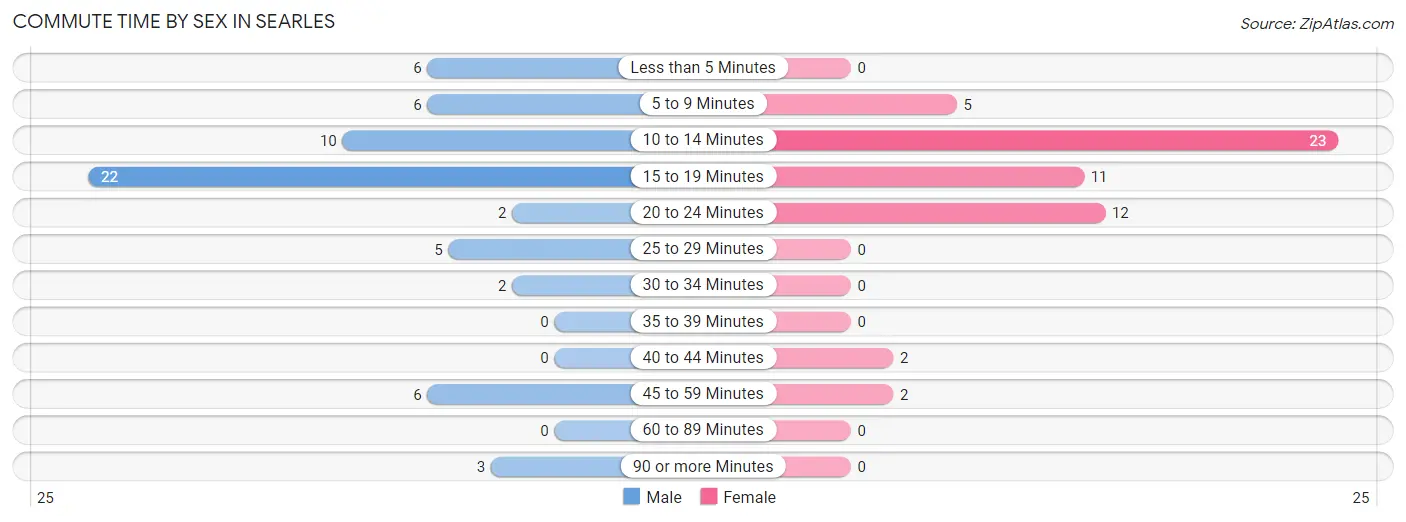
| Commute Time | Male | Female |
| Less than 5 Minutes | 6 (9.7%) | 0 (0.0%) |
| 5 to 9 Minutes | 6 (9.7%) | 5 (9.1%) |
| 10 to 14 Minutes | 10 (16.1%) | 23 (41.8%) |
| 15 to 19 Minutes | 22 (35.5%) | 11 (20.0%) |
| 20 to 24 Minutes | 2 (3.2%) | 12 (21.8%) |
| 25 to 29 Minutes | 5 (8.1%) | 0 (0.0%) |
| 30 to 34 Minutes | 2 (3.2%) | 0 (0.0%) |
| 35 to 39 Minutes | 0 (0.0%) | 0 (0.0%) |
| 40 to 44 Minutes | 0 (0.0%) | 2 (3.6%) |
| 45 to 59 Minutes | 6 (9.7%) | 2 (3.6%) |
| 60 to 89 Minutes | 0 (0.0%) | 0 (0.0%) |
| 90 or more Minutes | 3 (4.8%) | 0 (0.0%) |
Time of Departure to Work by Sex in Searles
The most frequent times of departure to work in Searles are 6:00 AM to 6:29 AM (16, 25.8%) for males and 7:00 AM to 7:29 AM (30, 54.5%) for females.
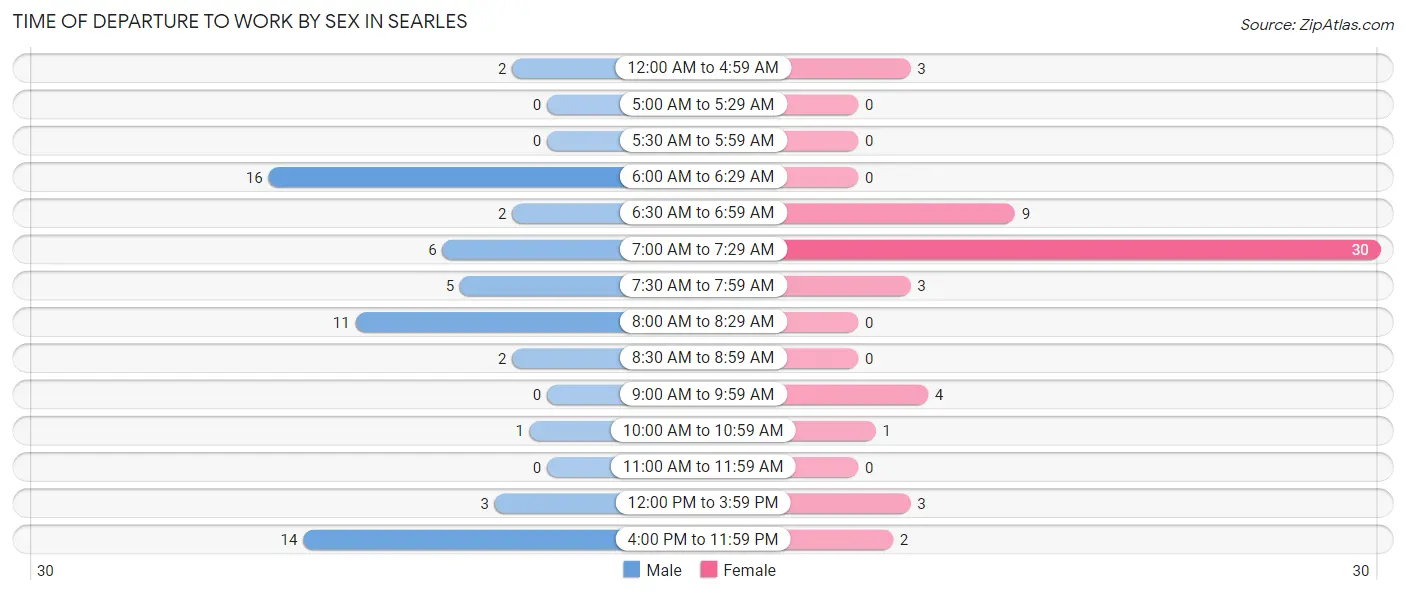
| Time of Departure | Male | Female |
| 12:00 AM to 4:59 AM | 2 (3.2%) | 3 (5.4%) |
| 5:00 AM to 5:29 AM | 0 (0.0%) | 0 (0.0%) |
| 5:30 AM to 5:59 AM | 0 (0.0%) | 0 (0.0%) |
| 6:00 AM to 6:29 AM | 16 (25.8%) | 0 (0.0%) |
| 6:30 AM to 6:59 AM | 2 (3.2%) | 9 (16.4%) |
| 7:00 AM to 7:29 AM | 6 (9.7%) | 30 (54.5%) |
| 7:30 AM to 7:59 AM | 5 (8.1%) | 3 (5.4%) |
| 8:00 AM to 8:29 AM | 11 (17.7%) | 0 (0.0%) |
| 8:30 AM to 8:59 AM | 2 (3.2%) | 0 (0.0%) |
| 9:00 AM to 9:59 AM | 0 (0.0%) | 4 (7.3%) |
| 10:00 AM to 10:59 AM | 1 (1.6%) | 1 (1.8%) |
| 11:00 AM to 11:59 AM | 0 (0.0%) | 0 (0.0%) |
| 12:00 PM to 3:59 PM | 3 (4.8%) | 3 (5.4%) |
| 4:00 PM to 11:59 PM | 14 (22.6%) | 2 (3.6%) |
| Total | 62 (100.0%) | 55 (100.0%) |
Housing Occupancy in Searles
Occupancy by Ownership in Searles
Of the total 116 dwellings in Searles, owner-occupied units account for 116 (100.0%), while renter-occupied units make up 0 (0.0%).
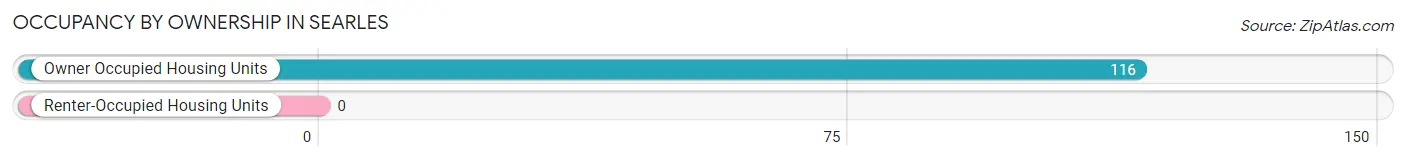
| Occupancy | # Housing Units | % Housing Units |
| Owner Occupied Housing Units | 116 | 100.0% |
| Renter-Occupied Housing Units | 0 | 0.0% |
| Total Occupied Housing Units | 116 | 100.0% |
Occupancy by Household Size in Searles
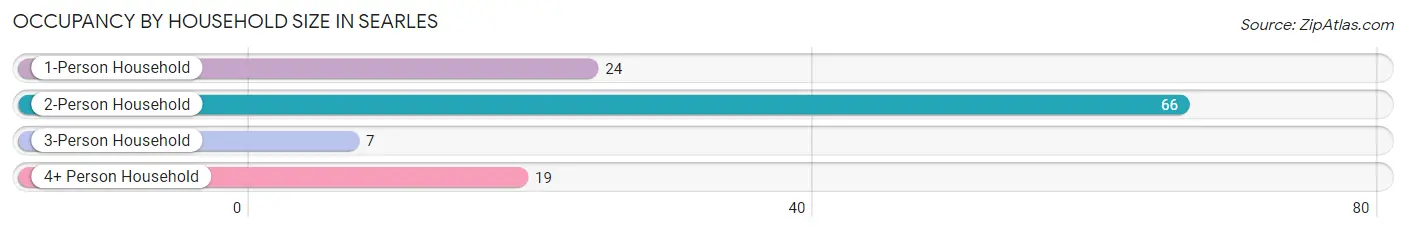
| Household Size | # Housing Units | % Housing Units |
| 1-Person Household | 24 | 20.7% |
| 2-Person Household | 66 | 56.9% |
| 3-Person Household | 7 | 6.0% |
| 4+ Person Household | 19 | 16.4% |
| Total Housing Units | 116 | 100.0% |
Occupancy by Ownership by Household Size in Searles
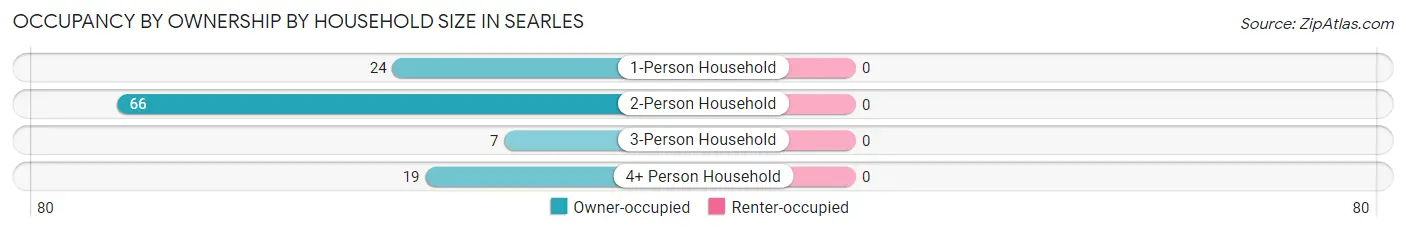
| Household Size | Owner-occupied | Renter-occupied |
| 1-Person Household | 24 (100.0%) | 0 (0.0%) |
| 2-Person Household | 66 (100.0%) | 0 (0.0%) |
| 3-Person Household | 7 (100.0%) | 0 (0.0%) |
| 4+ Person Household | 19 (100.0%) | 0 (0.0%) |
| Total Housing Units | 116 (100.0%) | 0 (0.0%) |
Occupancy by Educational Attainment in Searles
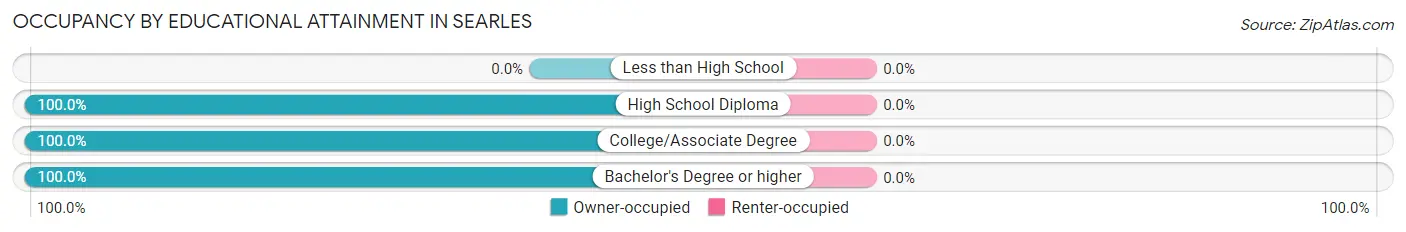
| Household Size | Owner-occupied | Renter-occupied |
| Less than High School | 0 (0.0%) | 0 (0.0%) |
| High School Diploma | 66 (100.0%) | 0 (0.0%) |
| College/Associate Degree | 39 (100.0%) | 0 (0.0%) |
| Bachelor's Degree or higher | 11 (100.0%) | 0 (0.0%) |
Occupancy by Age of Householder in Searles
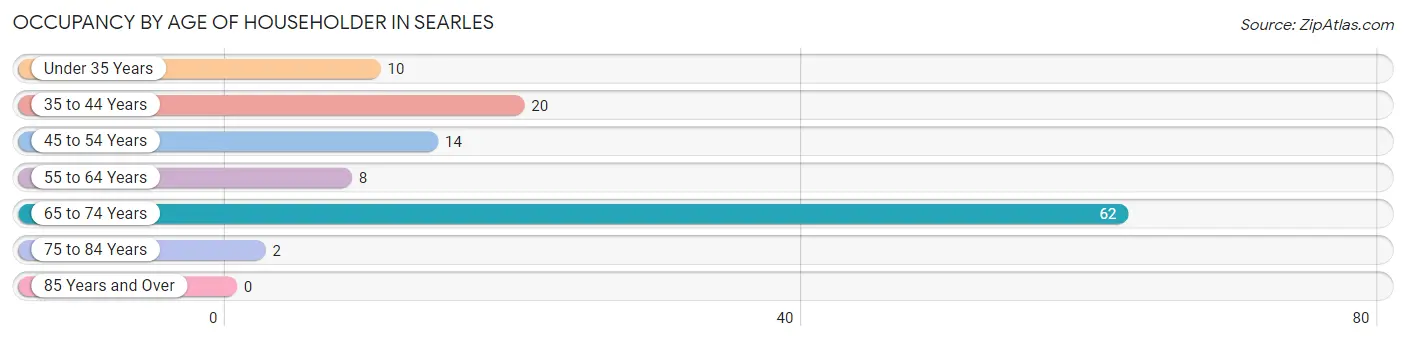
| Age Bracket | # Households | % Households |
| Under 35 Years | 10 | 8.6% |
| 35 to 44 Years | 20 | 17.2% |
| 45 to 54 Years | 14 | 12.1% |
| 55 to 64 Years | 8 | 6.9% |
| 65 to 74 Years | 62 | 53.4% |
| 75 to 84 Years | 2 | 1.7% |
| 85 Years and Over | 0 | 0.0% |
| Total | 116 | 100.0% |
Housing Finances in Searles
Median Income by Occupancy in Searles
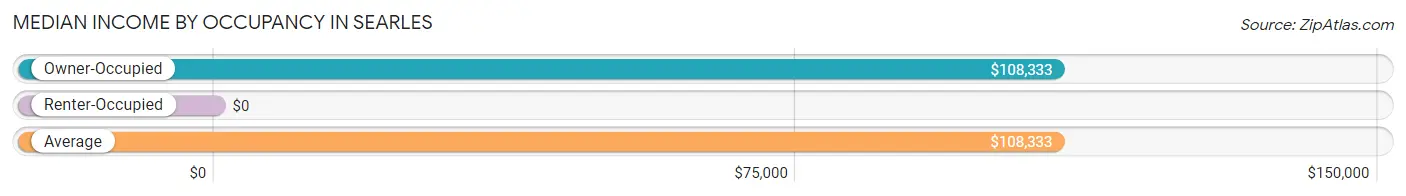
| Occupancy Type | # Households | Median Income |
| Owner-Occupied | 116 (100.0%) | $108,333 |
| Renter-Occupied | 0 (0.0%) | $0 |
| Average | 116 (100.0%) | $108,333 |
Occupancy by Householder Income Bracket in Searles
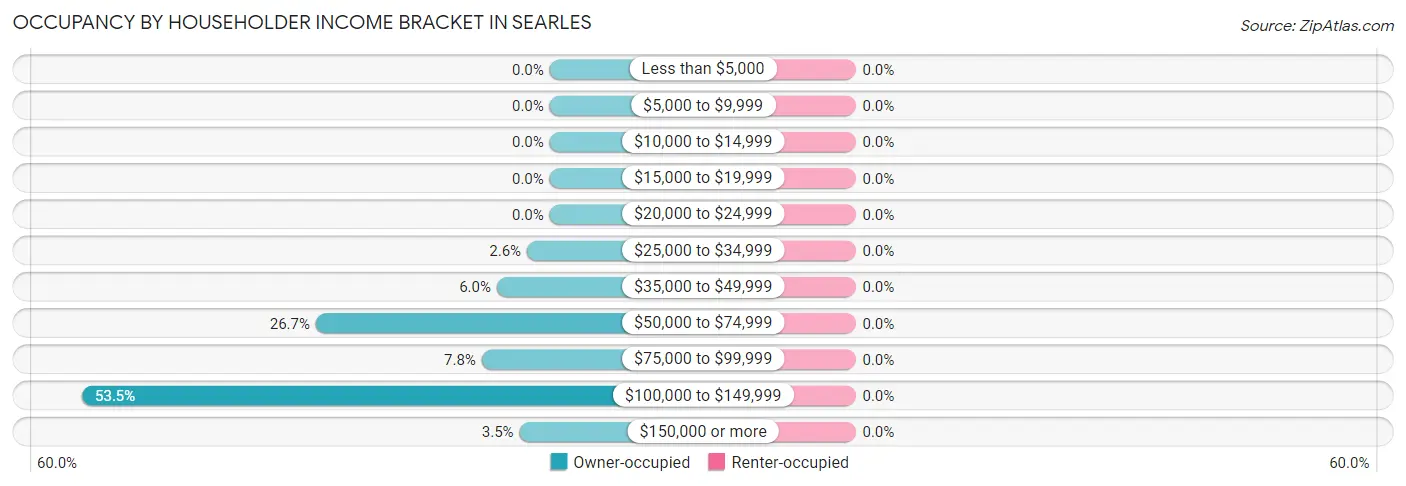
| Income Bracket | Owner-occupied | Renter-occupied |
| Less than $5,000 | 0 (0.0%) | 0 (0.0%) |
| $5,000 to $9,999 | 0 (0.0%) | 0 (0.0%) |
| $10,000 to $14,999 | 0 (0.0%) | 0 (0.0%) |
| $15,000 to $19,999 | 0 (0.0%) | 0 (0.0%) |
| $20,000 to $24,999 | 0 (0.0%) | 0 (0.0%) |
| $25,000 to $34,999 | 3 (2.6%) | 0 (0.0%) |
| $35,000 to $49,999 | 7 (6.0%) | 0 (0.0%) |
| $50,000 to $74,999 | 31 (26.7%) | 0 (0.0%) |
| $75,000 to $99,999 | 9 (7.8%) | 0 (0.0%) |
| $100,000 to $149,999 | 62 (53.4%) | 0 (0.0%) |
| $150,000 or more | 4 (3.5%) | 0 (0.0%) |
| Total | 116 (100.0%) | 0 (0.0%) |
Monthly Housing Cost Tiers in Searles
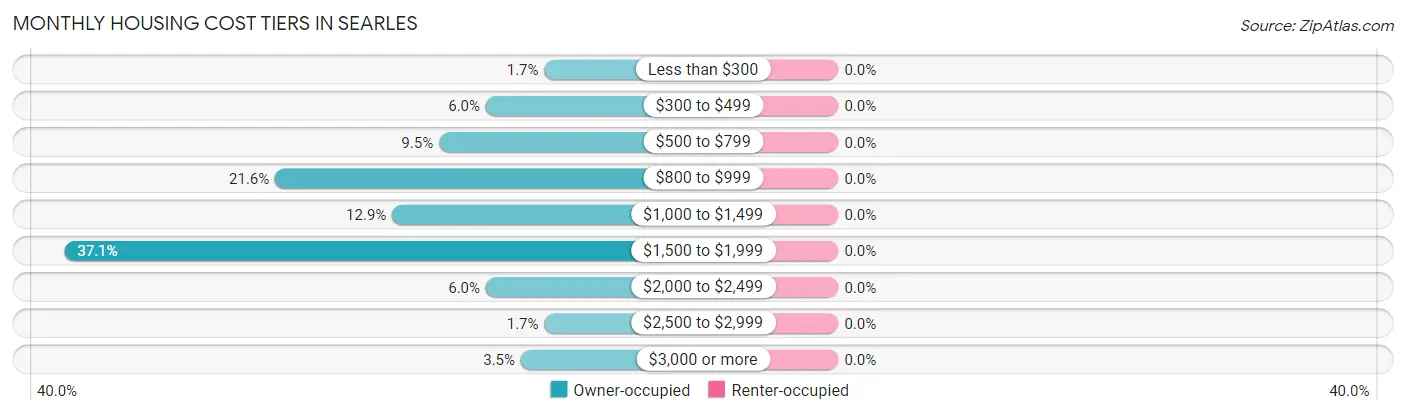
| Monthly Cost | Owner-occupied | Renter-occupied |
| Less than $300 | 2 (1.7%) | 0 (0.0%) |
| $300 to $499 | 7 (6.0%) | 0 (0.0%) |
| $500 to $799 | 11 (9.5%) | 0 (0.0%) |
| $800 to $999 | 25 (21.5%) | 0 (0.0%) |
| $1,000 to $1,499 | 15 (12.9%) | 0 (0.0%) |
| $1,500 to $1,999 | 43 (37.1%) | 0 (0.0%) |
| $2,000 to $2,499 | 7 (6.0%) | 0 (0.0%) |
| $2,500 to $2,999 | 2 (1.7%) | 0 (0.0%) |
| $3,000 or more | 4 (3.5%) | 0 (0.0%) |
| Total | 116 (100.0%) | 0 (0.0%) |
Physical Housing Characteristics in Searles
Housing Structures in Searles
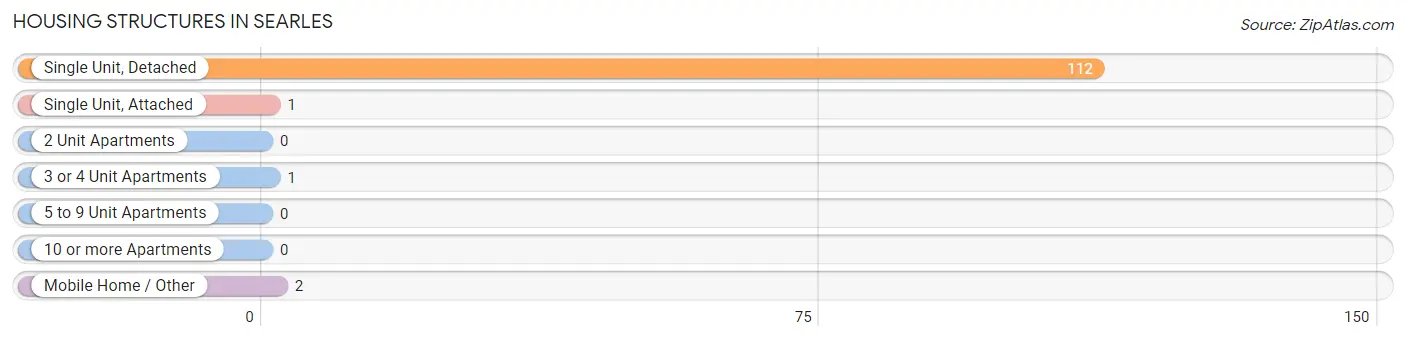
| Structure Type | # Housing Units | % Housing Units |
| Single Unit, Detached | 112 | 96.6% |
| Single Unit, Attached | 1 | 0.9% |
| 2 Unit Apartments | 0 | 0.0% |
| 3 or 4 Unit Apartments | 1 | 0.9% |
| 5 to 9 Unit Apartments | 0 | 0.0% |
| 10 or more Apartments | 0 | 0.0% |
| Mobile Home / Other | 2 | 1.7% |
| Total | 116 | 100.0% |
Housing Structures by Occupancy in Searles
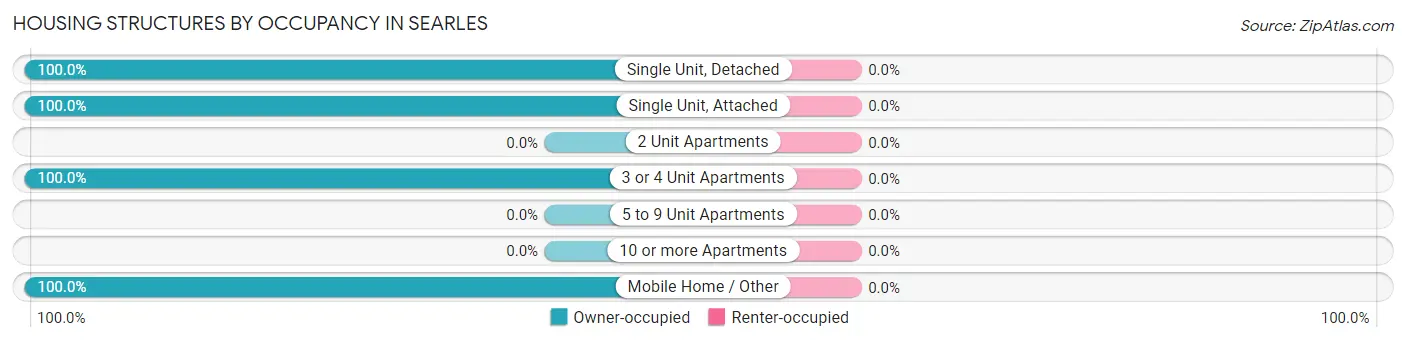
| Structure Type | Owner-occupied | Renter-occupied |
| Single Unit, Detached | 112 (100.0%) | 0 (0.0%) |
| Single Unit, Attached | 1 (100.0%) | 0 (0.0%) |
| 2 Unit Apartments | 0 (0.0%) | 0 (0.0%) |
| 3 or 4 Unit Apartments | 1 (100.0%) | 0 (0.0%) |
| 5 to 9 Unit Apartments | 0 (0.0%) | 0 (0.0%) |
| 10 or more Apartments | 0 (0.0%) | 0 (0.0%) |
| Mobile Home / Other | 2 (100.0%) | 0 (0.0%) |
| Total | 116 (100.0%) | 0 (0.0%) |
Housing Structures by Number of Rooms in Searles
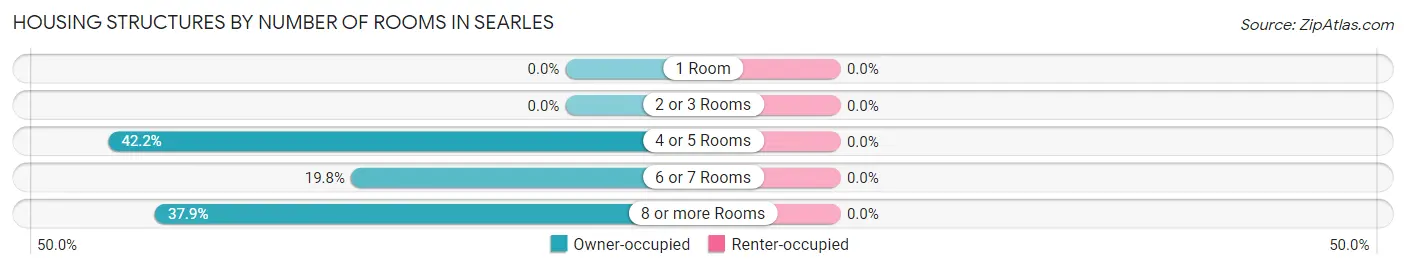
| Number of Rooms | Owner-occupied | Renter-occupied |
| 1 Room | 0 (0.0%) | 0 (0.0%) |
| 2 or 3 Rooms | 0 (0.0%) | 0 (0.0%) |
| 4 or 5 Rooms | 49 (42.2%) | 0 (0.0%) |
| 6 or 7 Rooms | 23 (19.8%) | 0 (0.0%) |
| 8 or more Rooms | 44 (37.9%) | 0 (0.0%) |
| Total | 116 (100.0%) | 0 (0.0%) |
Housing Structure by Heating Type in Searles
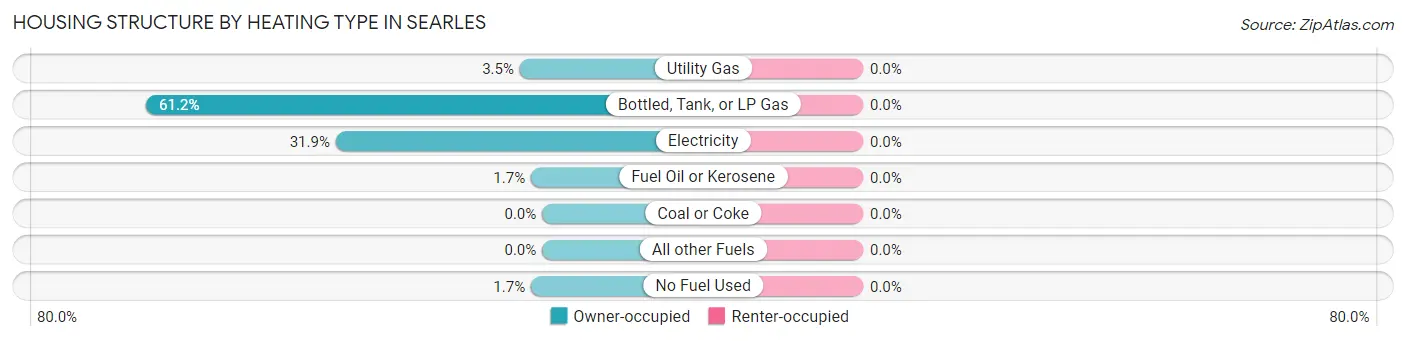
| Heating Type | Owner-occupied | Renter-occupied |
| Utility Gas | 4 (3.5%) | 0 (0.0%) |
| Bottled, Tank, or LP Gas | 71 (61.2%) | 0 (0.0%) |
| Electricity | 37 (31.9%) | 0 (0.0%) |
| Fuel Oil or Kerosene | 2 (1.7%) | 0 (0.0%) |
| Coal or Coke | 0 (0.0%) | 0 (0.0%) |
| All other Fuels | 0 (0.0%) | 0 (0.0%) |
| No Fuel Used | 2 (1.7%) | 0 (0.0%) |
| Total | 116 (100.0%) | 0 (0.0%) |
Household Vehicle Usage in Searles
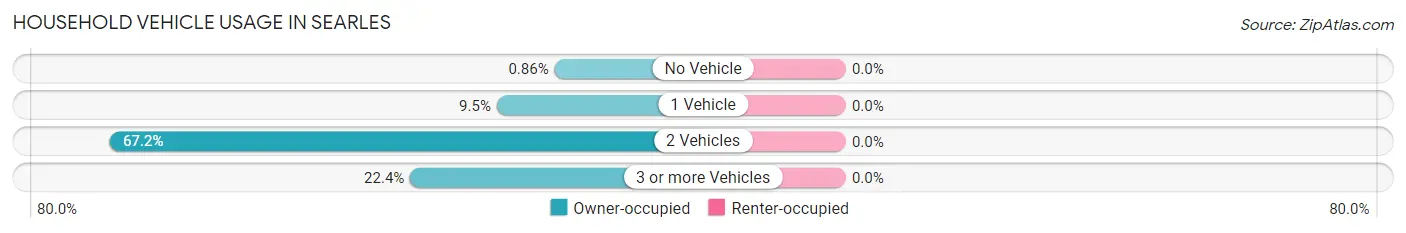
| Vehicles per Household | Owner-occupied | Renter-occupied |
| No Vehicle | 1 (0.9%) | 0 (0.0%) |
| 1 Vehicle | 11 (9.5%) | 0 (0.0%) |
| 2 Vehicles | 78 (67.2%) | 0 (0.0%) |
| 3 or more Vehicles | 26 (22.4%) | 0 (0.0%) |
| Total | 116 (100.0%) | 0 (0.0%) |
Real Estate & Mortgages in Searles
Real Estate and Mortgage Overview in Searles
| Characteristic | Without Mortgage | With Mortgage |
| Housing Units | 17 | 99 |
| Median Property Value | $120,800 | $189,600 |
| Median Household Income | $96,875 | $2 |
| Monthly Housing Costs | $450 | $4 |
| Real Estate Taxes | - | - |
Property Value by Mortgage Status in Searles
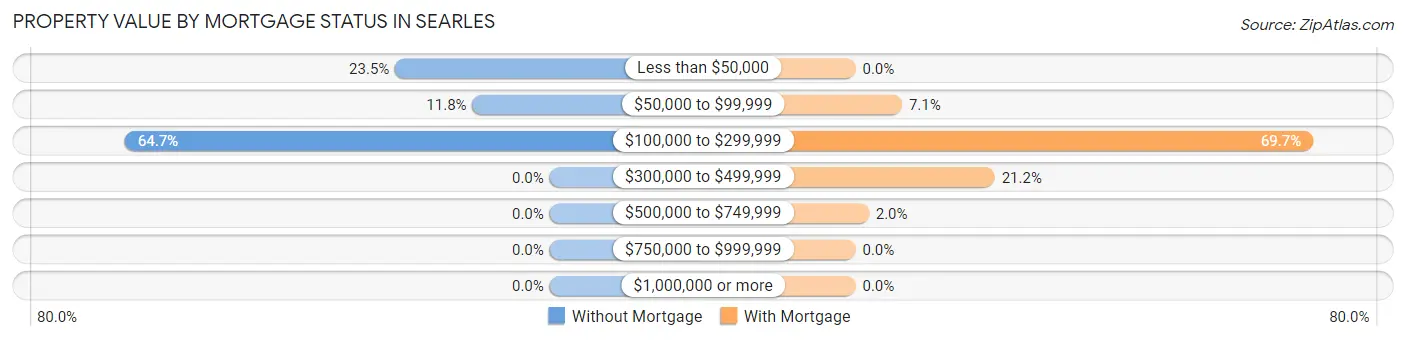
| Property Value | Without Mortgage | With Mortgage |
| Less than $50,000 | 4 (23.5%) | 0 (0.0%) |
| $50,000 to $99,999 | 2 (11.8%) | 7 (7.1%) |
| $100,000 to $299,999 | 11 (64.7%) | 69 (69.7%) |
| $300,000 to $499,999 | 0 (0.0%) | 21 (21.2%) |
| $500,000 to $749,999 | 0 (0.0%) | 2 (2.0%) |
| $750,000 to $999,999 | 0 (0.0%) | 0 (0.0%) |
| $1,000,000 or more | 0 (0.0%) | 0 (0.0%) |
| Total | 17 (100.0%) | 99 (100.0%) |
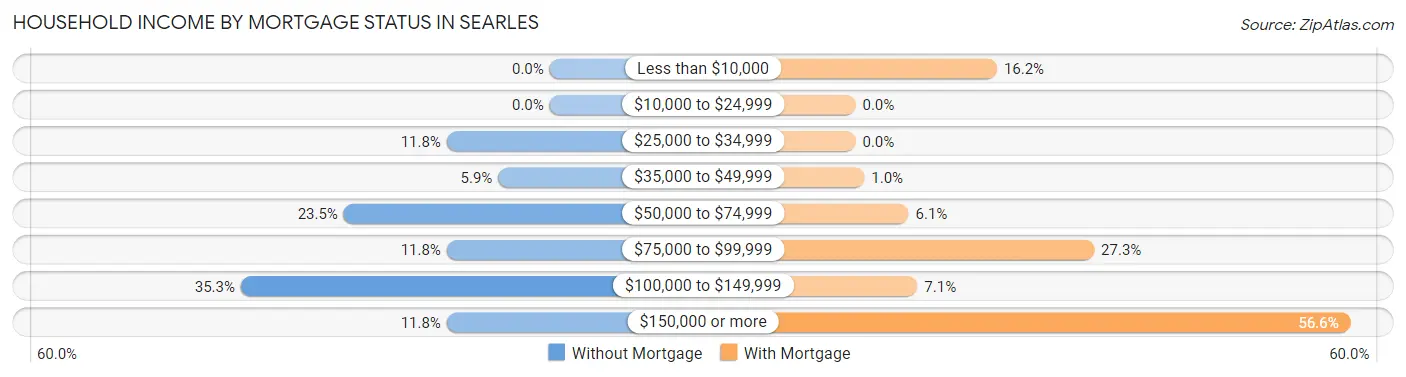
Household Income by Mortgage Status in Searles
| Household Income | Without Mortgage | With Mortgage |
| Less than $10,000 | 0 (0.0%) | 16 (16.2%) |
| $10,000 to $24,999 | 0 (0.0%) | 0 (0.0%) |
| $25,000 to $34,999 | 2 (11.8%) | 0 (0.0%) |
| $35,000 to $49,999 | 1 (5.9%) | 1 (1.0%) |
| $50,000 to $74,999 | 4 (23.5%) | 6 (6.1%) |
| $75,000 to $99,999 | 2 (11.8%) | 27 (27.3%) |
| $100,000 to $149,999 | 6 (35.3%) | 7 (7.1%) |
| $150,000 or more | 2 (11.8%) | 56 (56.6%) |
| Total | 17 (100.0%) | 99 (100.0%) |
Property Value to Household Income Ratio in Searles
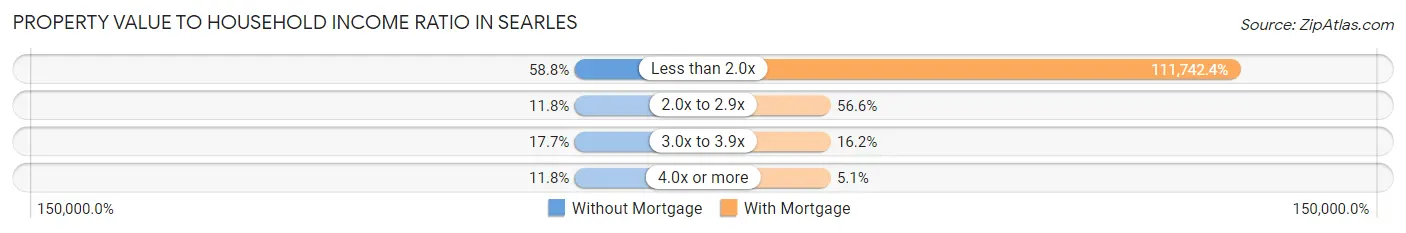
| Value-to-Income Ratio | Without Mortgage | With Mortgage |
| Less than 2.0x | 10 (58.8%) | 110,625 (111,742.4%) |
| 2.0x to 2.9x | 2 (11.8%) | 56 (56.6%) |
| 3.0x to 3.9x | 3 (17.6%) | 16 (16.2%) |
| 4.0x or more | 2 (11.8%) | 5 (5.1%) |
| Total | 17 (100.0%) | 99 (100.0%) |
Real Estate Taxes by Mortgage Status in Searles
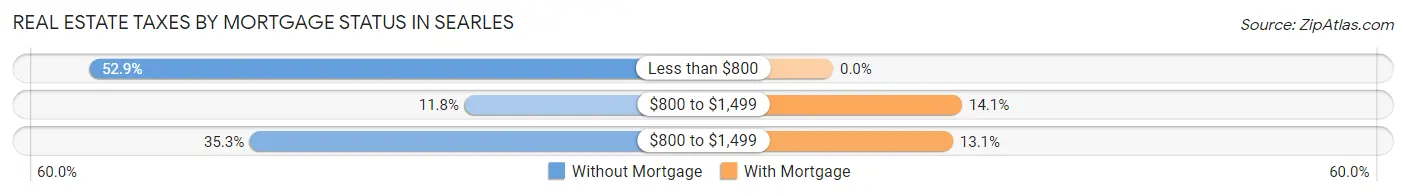
| Property Taxes | Without Mortgage | With Mortgage |
| Less than $800 | 9 (52.9%) | 0 (0.0%) |
| $800 to $1,499 | 2 (11.8%) | 14 (14.1%) |
| $800 to $1,499 | 6 (35.3%) | 13 (13.1%) |
| Total | 17 (100.0%) | 99 (100.0%) |
Health & Disability in Searles
Health Insurance Coverage by Age in Searles
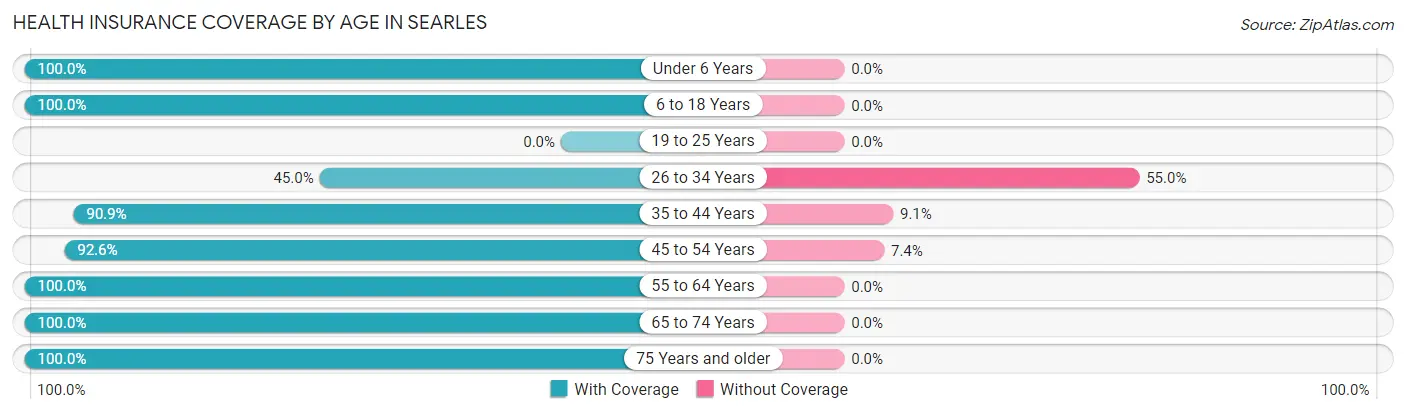
| Age Bracket | With Coverage | Without Coverage |
| Under 6 Years | 21 (100.0%) | 0 (0.0%) |
| 6 to 18 Years | 40 (100.0%) | 0 (0.0%) |
| 19 to 25 Years | 0 (0.0%) | 0 (0.0%) |
| 26 to 34 Years | 9 (45.0%) | 11 (55.0%) |
| 35 to 44 Years | 30 (90.9%) | 3 (9.1%) |
| 45 to 54 Years | 25 (92.6%) | 2 (7.4%) |
| 55 to 64 Years | 63 (100.0%) | 0 (0.0%) |
| 65 to 74 Years | 79 (100.0%) | 0 (0.0%) |
| 75 Years and older | 2 (100.0%) | 0 (0.0%) |
| Total | 269 (94.4%) | 16 (5.6%) |
Health Insurance Coverage by Citizenship Status in Searles
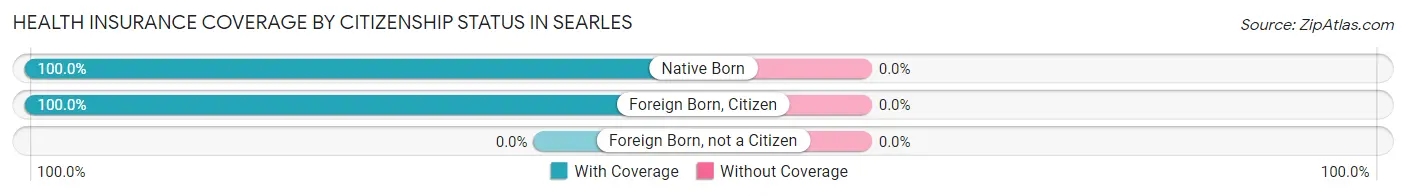
| Citizenship Status | With Coverage | Without Coverage |
| Native Born | 21 (100.0%) | 0 (0.0%) |
| Foreign Born, Citizen | 40 (100.0%) | 0 (0.0%) |
| Foreign Born, not a Citizen | 0 (0.0%) | 0 (0.0%) |
Health Insurance Coverage by Household Income in Searles
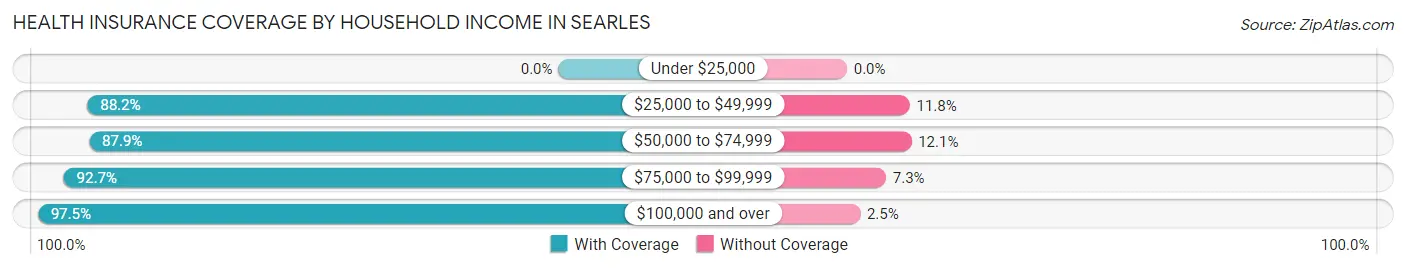
| Household Income | With Coverage | Without Coverage |
| Under $25,000 | 0 (0.0%) | 0 (0.0%) |
| $25,000 to $49,999 | 15 (88.2%) | 2 (11.8%) |
| $50,000 to $74,999 | 51 (87.9%) | 7 (12.1%) |
| $75,000 to $99,999 | 38 (92.7%) | 3 (7.3%) |
| $100,000 and over | 158 (97.5%) | 4 (2.5%) |
Public vs Private Health Insurance Coverage by Age in Searles
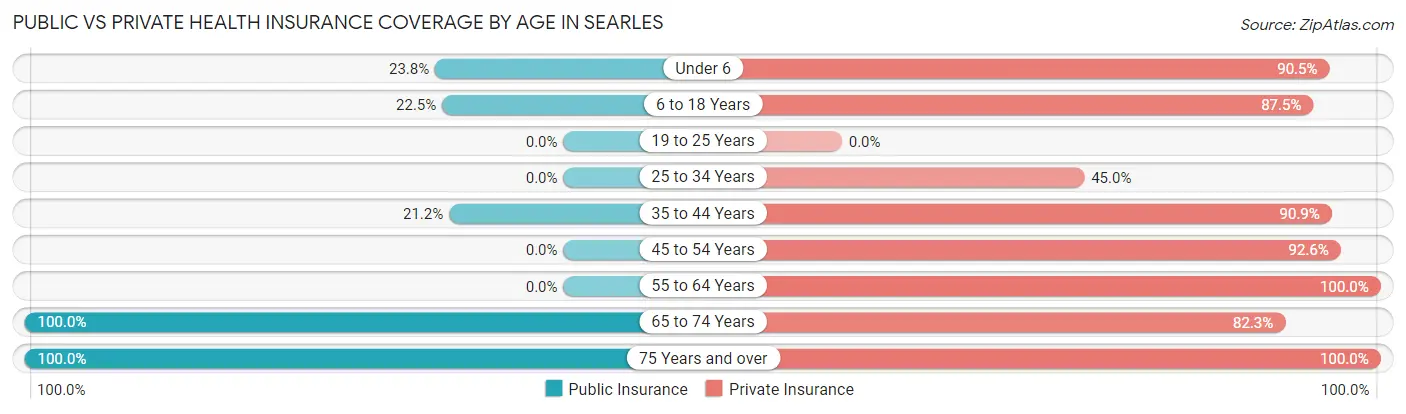
| Age Bracket | Public Insurance | Private Insurance |
| Under 6 | 5 (23.8%) | 19 (90.5%) |
| 6 to 18 Years | 9 (22.5%) | 35 (87.5%) |
| 19 to 25 Years | 0 (0.0%) | 0 (0.0%) |
| 25 to 34 Years | 0 (0.0%) | 9 (45.0%) |
| 35 to 44 Years | 7 (21.2%) | 30 (90.9%) |
| 45 to 54 Years | 0 (0.0%) | 25 (92.6%) |
| 55 to 64 Years | 0 (0.0%) | 63 (100.0%) |
| 65 to 74 Years | 79 (100.0%) | 65 (82.3%) |
| 75 Years and over | 2 (100.0%) | 2 (100.0%) |
| Total | 102 (35.8%) | 248 (87.0%) |
Disability Status by Sex by Age in Searles
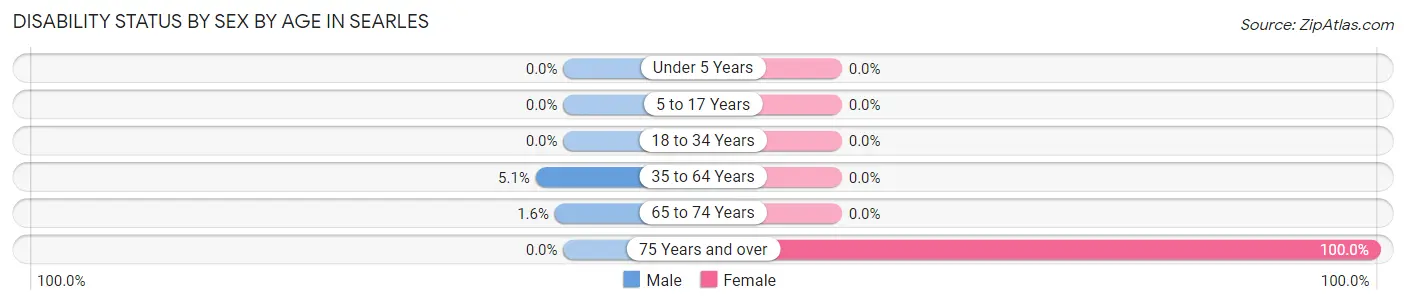
| Age Bracket | Male | Female |
| Under 5 Years | 0 (0.0%) | 0 (0.0%) |
| 5 to 17 Years | 0 (0.0%) | 0 (0.0%) |
| 18 to 34 Years | 0 (0.0%) | 0 (0.0%) |
| 35 to 64 Years | 2 (5.1%) | 0 (0.0%) |
| 65 to 74 Years | 1 (1.6%) | 0 (0.0%) |
| 75 Years and over | 0 (0.0%) | 2 (100.0%) |
Disability Class by Sex by Age in Searles
Disability Class: Hearing Difficulty
| Age Bracket | Male | Female |
| Under 5 Years | 0 (0.0%) | 0 (0.0%) |
| 5 to 17 Years | 0 (0.0%) | 0 (0.0%) |
| 18 to 34 Years | 0 (0.0%) | 0 (0.0%) |
| 35 to 64 Years | 0 (0.0%) | 0 (0.0%) |
| 65 to 74 Years | 0 (0.0%) | 0 (0.0%) |
| 75 Years and over | 0 (0.0%) | 0 (0.0%) |
Disability Class: Vision Difficulty
| Age Bracket | Male | Female |
| Under 5 Years | 0 (0.0%) | 0 (0.0%) |
| 5 to 17 Years | 0 (0.0%) | 0 (0.0%) |
| 18 to 34 Years | 0 (0.0%) | 0 (0.0%) |
| 35 to 64 Years | 0 (0.0%) | 0 (0.0%) |
| 65 to 74 Years | 0 (0.0%) | 0 (0.0%) |
| 75 Years and over | 0 (0.0%) | 0 (0.0%) |
Disability Class: Cognitive Difficulty
| Age Bracket | Male | Female |
| 5 to 17 Years | 0 (0.0%) | 0 (0.0%) |
| 18 to 34 Years | 0 (0.0%) | 0 (0.0%) |
| 35 to 64 Years | 2 (5.1%) | 0 (0.0%) |
| 65 to 74 Years | 0 (0.0%) | 0 (0.0%) |
| 75 Years and over | 0 (0.0%) | 0 (0.0%) |
Disability Class: Ambulatory Difficulty
| Age Bracket | Male | Female |
| 5 to 17 Years | 0 (0.0%) | 0 (0.0%) |
| 18 to 34 Years | 0 (0.0%) | 0 (0.0%) |
| 35 to 64 Years | 2 (5.1%) | 0 (0.0%) |
| 65 to 74 Years | 1 (1.6%) | 0 (0.0%) |
| 75 Years and over | 0 (0.0%) | 2 (100.0%) |
Disability Class: Self-Care Difficulty
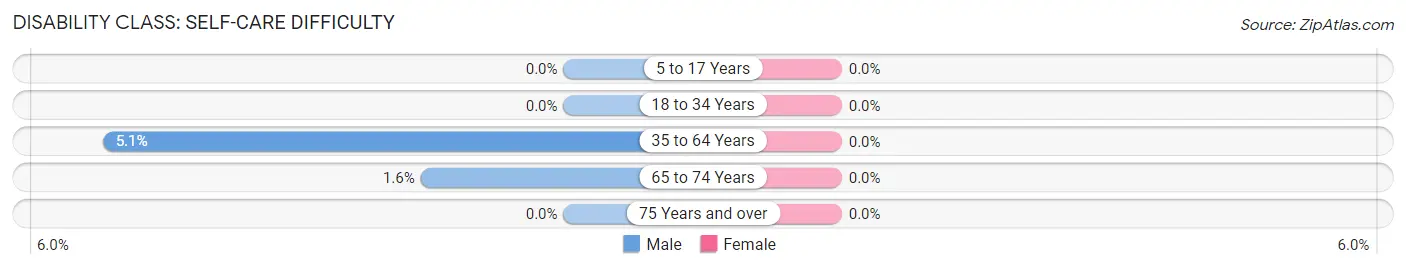
| Age Bracket | Male | Female |
| 5 to 17 Years | 0 (0.0%) | 0 (0.0%) |
| 18 to 34 Years | 0 (0.0%) | 0 (0.0%) |
| 35 to 64 Years | 2 (5.1%) | 0 (0.0%) |
| 65 to 74 Years | 1 (1.6%) | 0 (0.0%) |
| 75 Years and over | 0 (0.0%) | 0 (0.0%) |
Technology Access in Searles
Computing Device Access in Searles
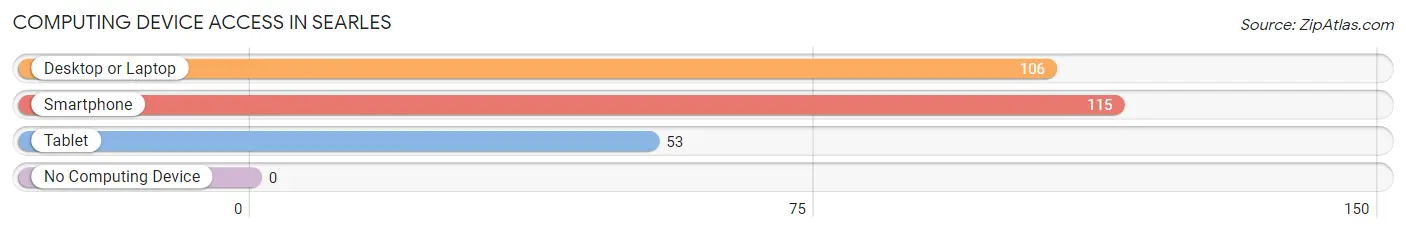
| Device Type | # Households | % Households |
| Desktop or Laptop | 106 | 91.4% |
| Smartphone | 115 | 99.1% |
| Tablet | 53 | 45.7% |
| No Computing Device | 0 | 0.0% |
| Total | 116 | 100.0% |
Internet Access in Searles
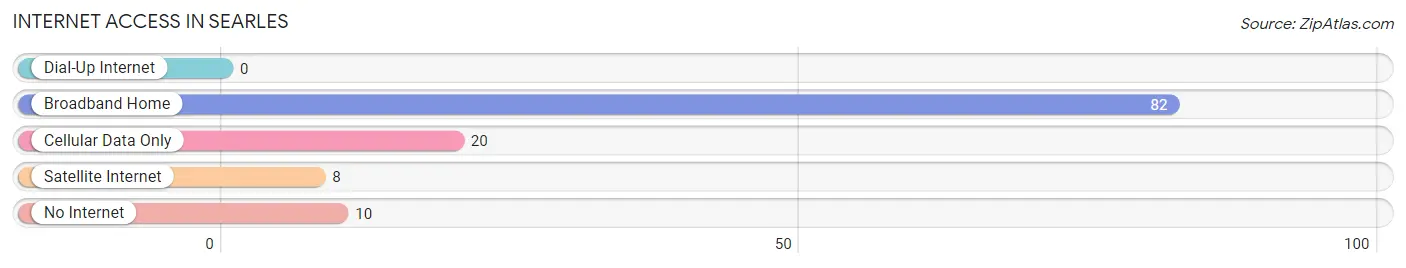
| Internet Type | # Households | % Households |
| Dial-Up Internet | 0 | 0.0% |
| Broadband Home | 82 | 70.7% |
| Cellular Data Only | 20 | 17.2% |
| Satellite Internet | 8 | 6.9% |
| No Internet | 10 | 8.6% |
| Total | 116 | 100.0% |
Searles Summary
Searles is a small city located in Brown County, Minnesota. It is situated on the banks of the Cottonwood River, about 20 miles south of New Ulm. The city has a population of just over 500 people, and is part of the Mankato-North Mankato Metropolitan Statistical Area.
History
Searles was founded in 1872 by a group of settlers from Wisconsin. The city was named after the Searles family, who were among the first settlers in the area. The city was incorporated in 1887.
In the early 1900s, Searles was a thriving agricultural community. The city was home to several grain elevators, a creamery, and a flour mill. The city also had a number of businesses, including a hotel, a bank, a hardware store, and a lumber yard.
In the 1950s, Searles began to decline as the agricultural industry shifted away from the area. The city’s population began to decline, and many of the businesses closed.
In the late 1970s, the city began to experience a resurgence. The city was revitalized by the construction of a new school, a new library, and a new city hall. The city also began to attract new businesses, including a grocery store, a restaurant, and a gas station.
Geography
Searles is located in the southwestern corner of Brown County, Minnesota. The city is situated on the banks of the Cottonwood River, about 20 miles south of New Ulm. The city is surrounded by rolling hills and farmland.
The climate in Searles is typical of the Midwest. Summers are hot and humid, with temperatures reaching into the 90s. Winters are cold and snowy, with temperatures often dropping below zero.
Economy
Searles’ economy is largely based on agriculture. The city is home to several grain elevators, a creamery, and a flour mill. The city also has a number of businesses, including a grocery store, a restaurant, and a gas station.
The city is also home to a number of manufacturing companies, including a furniture manufacturer and a plastics manufacturer.
Demographics
As of the 2010 census, the population of Searles was 514. The racial makeup of the city was 97.3% White, 0.6% African American, 0.2% Native American, 0.2% Asian, 0.4% from other races, and 1.3% from two or more races. Hispanic or Latino of any race were 1.2% of the population.
The median household income in Searles was $45,000, and the median family income was $50,000. The per capita income was $20,000. About 8.3% of families and 10.2% of the population were below the poverty line, including 11.3% of those under age 18 and 8.3% of those age 65 or over.
Searles is a small city with a rich history and a bright future. The city has a strong agricultural base, and is home to a number of businesses. The city is also home to a diverse population, with a variety of racial and ethnic backgrounds. Searles is a great place to live, work, and raise a family.
Common Questions
What is the Total Population of Searles?
Total Population of Searles is 285.
What is the Total Male Population of Searles?
Total Male Population of Searles is 145.
What is the Total Female Population of Searles?
Total Female Population of Searles is 140.
What is the Ratio of Males per 100 Females in Searles?
There are 103.57 Males per 100 Females in Searles.
What is the Ratio of Females per 100 Males in Searles?
There are 96.55 Females per 100 Males in Searles.
What is the Median Population Age in Searles?
Median Population Age in Searles is 55.5 Years.
What is the Average Family Size in Searles
Average Family Size in Searles is 3.2 People.
What is the Average Household Size in Searles
Average Household Size in Searles is 2.4 People.
What is Per Capita Income in Searles?
Per Capita income in Searles is $45,826.
What is the Median Family Income in Searles?
Median Family Income in Searles is $91,250.
What is the Median Household income in Searles?
Median Household Income in Searles is $108,333.
What is Income or Wage Gap in Searles?
Income or Wage Gap in Searles is 39.0%.
Women in Searles earn 61.0 cents for every dollar earned by a man.
What is Inequality or Gini Index in Searles?
Inequality or Gini Index in Searles is 0.23.
How Large is the Labor Force in Searles?
There are 118 People in the Labor Forcein in Searles.
What is the Percentage of People in the Labor Force in Searles?
49.6% of People are in the Labor Force in Searles.
What is the Unemployment Rate in Searles?
Unemployment Rate in Searles is 0.8%.