Rock Creek, MN
Rock Creek Map
Rock Creek Overview
1,694
TOTAL POPULATION
867
MALE POPULATION
827
FEMALE POPULATION
104.84
MALES / 100 FEMALES
95.39
FEMALES / 100 MALES
36.7
MEDIAN AGE
3.4
AVG FAMILY SIZE
3.0
AVG HOUSEHOLD SIZE
$33,591
PER CAPITA INCOME
$99,500
AVG FAMILY INCOME
$92,344
AVG HOUSEHOLD INCOME
7.9%
WAGE / INCOME GAP [ % ]
92.1¢/ $1
WAGE / INCOME GAP [ $ ]
0.33
INEQUALITY / GINI INDEX
924
LABOR FORCE [ PEOPLE ]
74.5%
PERCENT IN LABOR FORCE
2.9%
UNEMPLOYMENT RATE
Rock Creek Area Codes
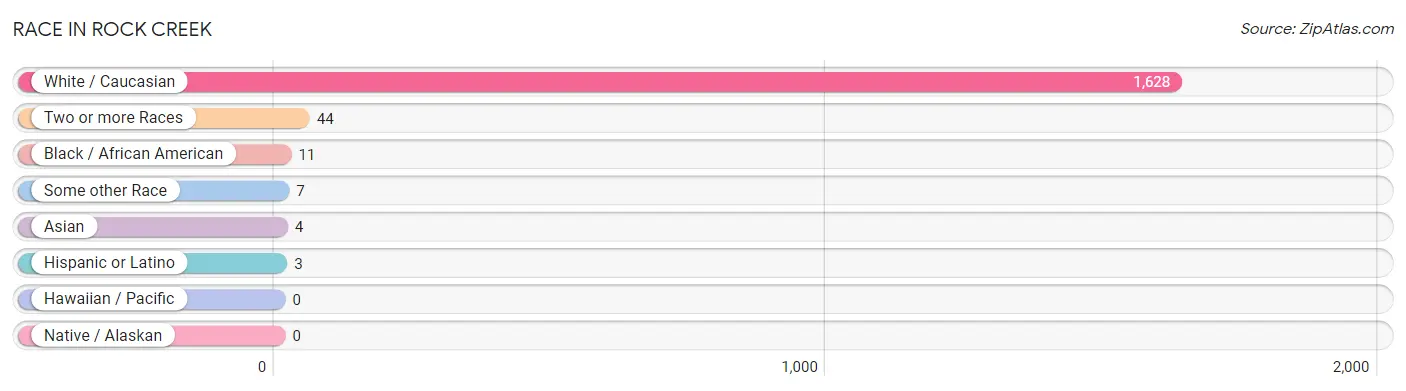
Race in Rock Creek
The most populous races in Rock Creek are White / Caucasian (1,628 | 96.1%), Two or more Races (44 | 2.6%), and Black / African American (11 | 0.6%).
| Race | # Population | % Population |
| Asian | 4 | 0.2% |
| Black / African American | 11 | 0.6% |
| Hawaiian / Pacific | 0 | 0.0% |
| Hispanic or Latino | 3 | 0.2% |
| Native / Alaskan | 0 | 0.0% |
| White / Caucasian | 1,628 | 96.1% |
| Two or more Races | 44 | 2.6% |
| Some other Race | 7 | 0.4% |
| Total | 1,694 | 100.0% |
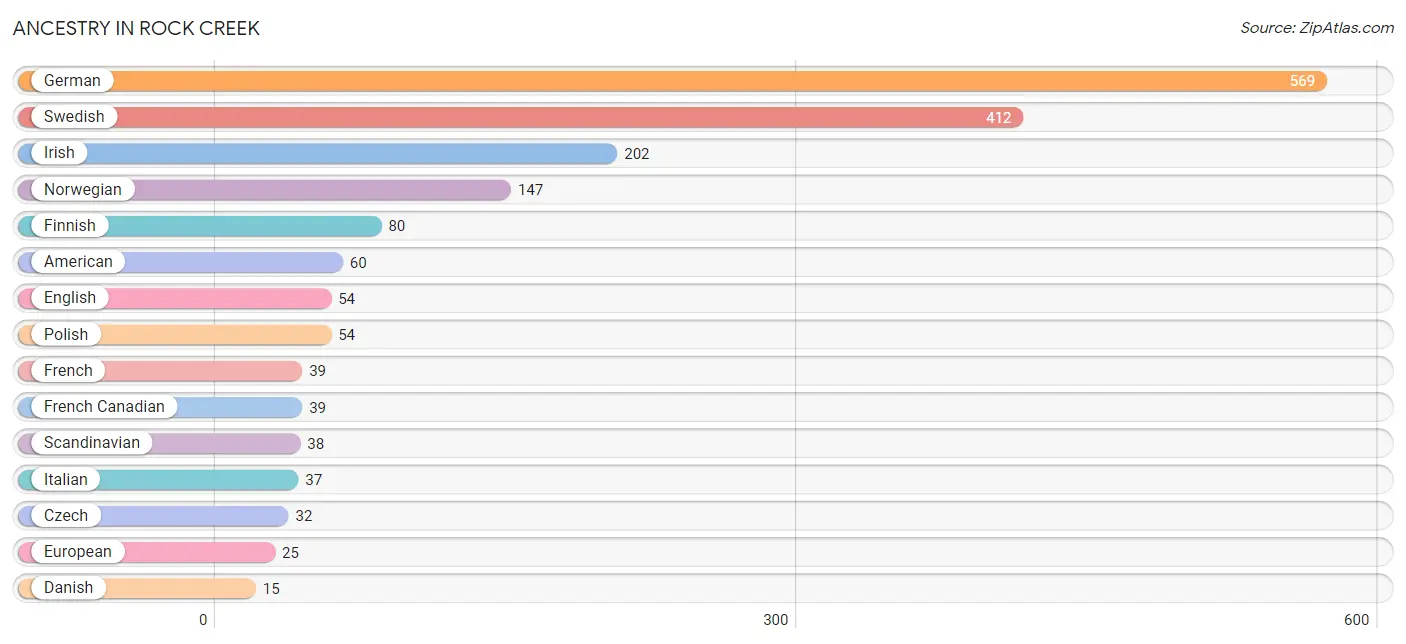
Ancestry in Rock Creek
The most populous ancestries reported in Rock Creek are German (569 | 33.6%), Swedish (412 | 24.3%), Irish (202 | 11.9%), Norwegian (147 | 8.7%), and Finnish (80 | 4.7%), together accounting for 83.2% of all Rock Creek residents.
| Ancestry | # Population | % Population |
| American | 60 | 3.5% |
| Austrian | 5 | 0.3% |
| Belgian | 3 | 0.2% |
| British | 3 | 0.2% |
| Chippewa | 12 | 0.7% |
| Czech | 32 | 1.9% |
| Danish | 15 | 0.9% |
| Dutch | 9 | 0.5% |
| English | 54 | 3.2% |
| European | 25 | 1.5% |
| Finnish | 80 | 4.7% |
| French | 39 | 2.3% |
| French Canadian | 39 | 2.3% |
| German | 569 | 33.6% |
| Hungarian | 8 | 0.5% |
| Irish | 202 | 11.9% |
| Italian | 37 | 2.2% |
| Korean | 4 | 0.2% |
| Mexican | 3 | 0.2% |
| Northern European | 3 | 0.2% |
| Norwegian | 147 | 8.7% |
| Polish | 54 | 3.2% |
| Portuguese | 3 | 0.2% |
| Scandinavian | 38 | 2.2% |
| Scotch-Irish | 3 | 0.2% |
| Scottish | 3 | 0.2% |
| Serbian | 3 | 0.2% |
| Slovak | 3 | 0.2% |
| Swedish | 412 | 24.3% |
| Welsh | 3 | 0.2% | View All 30 Rows |
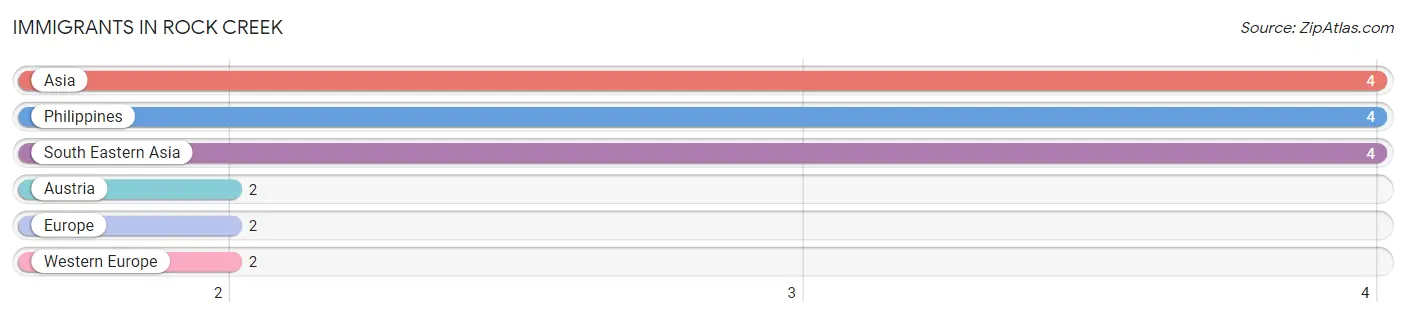
Immigrants in Rock Creek
The most numerous immigrant groups reported in Rock Creek came from Asia (4 | 0.2%), Philippines (4 | 0.2%), South Eastern Asia (4 | 0.2%), Austria (2 | 0.1%), and Europe (2 | 0.1%), together accounting for 1.0% of all Rock Creek residents.
| Immigration Origin | # Population | % Population |
| Asia | 4 | 0.2% |
| Austria | 2 | 0.1% |
| Europe | 2 | 0.1% |
| Philippines | 4 | 0.2% |
| South Eastern Asia | 4 | 0.2% |
| Western Europe | 2 | 0.1% | View All 6 Rows |
Sex and Age in Rock Creek
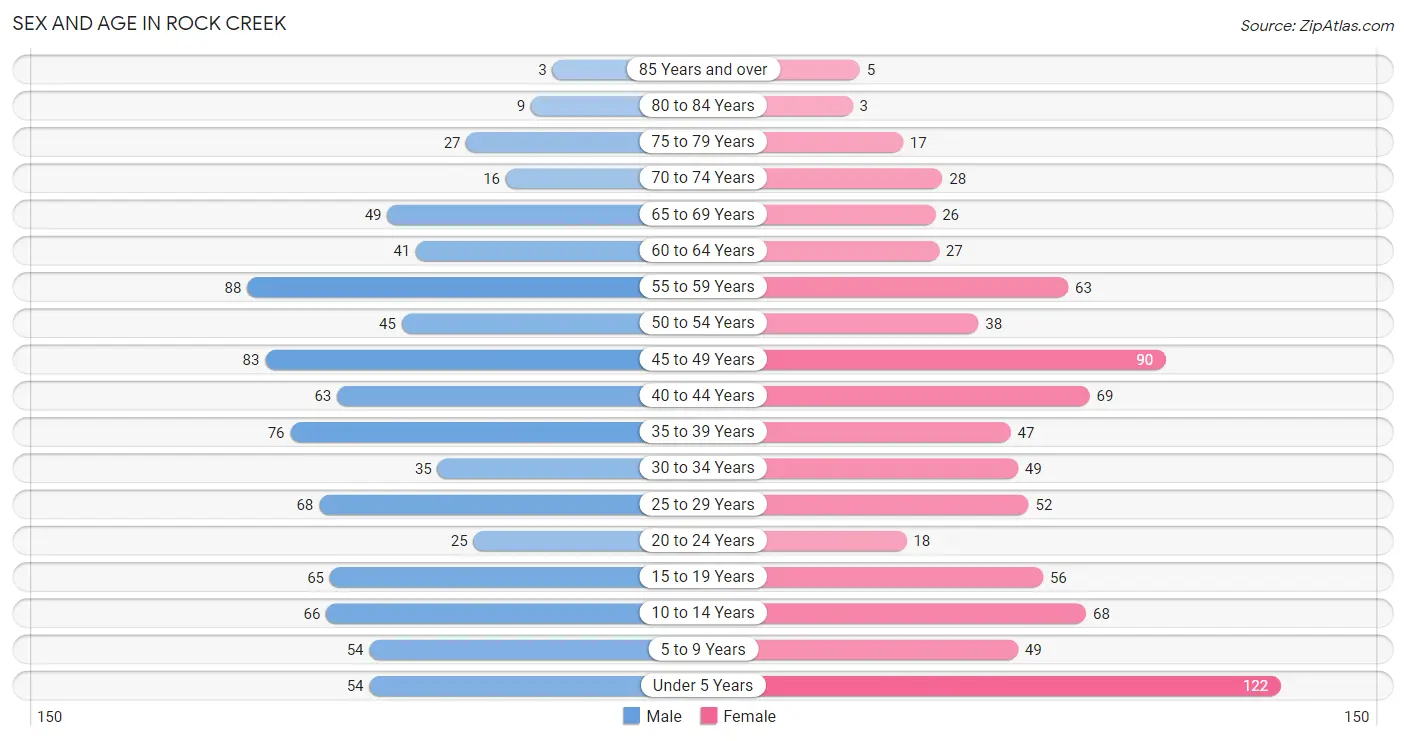
Sex and Age in Rock Creek
The most populous age groups in Rock Creek are 55 to 59 Years (88 | 10.2%) for men and Under 5 Years (122 | 14.7%) for women.
| Age Bracket | Male | Female |
| Under 5 Years | 54 (6.2%) | 122 (14.7%) |
| 5 to 9 Years | 54 (6.2%) | 49 (5.9%) |
| 10 to 14 Years | 66 (7.6%) | 68 (8.2%) |
| 15 to 19 Years | 65 (7.5%) | 56 (6.8%) |
| 20 to 24 Years | 25 (2.9%) | 18 (2.2%) |
| 25 to 29 Years | 68 (7.8%) | 52 (6.3%) |
| 30 to 34 Years | 35 (4.0%) | 49 (5.9%) |
| 35 to 39 Years | 76 (8.8%) | 47 (5.7%) |
| 40 to 44 Years | 63 (7.3%) | 69 (8.3%) |
| 45 to 49 Years | 83 (9.6%) | 90 (10.9%) |
| 50 to 54 Years | 45 (5.2%) | 38 (4.6%) |
| 55 to 59 Years | 88 (10.2%) | 63 (7.6%) |
| 60 to 64 Years | 41 (4.7%) | 27 (3.3%) |
| 65 to 69 Years | 49 (5.7%) | 26 (3.1%) |
| 70 to 74 Years | 16 (1.8%) | 28 (3.4%) |
| 75 to 79 Years | 27 (3.1%) | 17 (2.1%) |
| 80 to 84 Years | 9 (1.0%) | 3 (0.4%) |
| 85 Years and over | 3 (0.4%) | 5 (0.6%) |
| Total | 867 (100.0%) | 827 (100.0%) |
Families and Households in Rock Creek
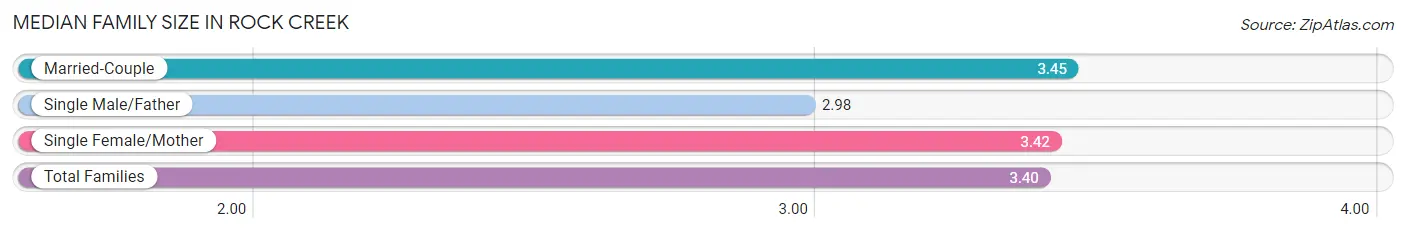
Median Family Size in Rock Creek
The median family size in Rock Creek is 3.40 persons per family, with married-couple families (326 | 76.5%) accounting for the largest median family size of 3.45 persons per family. On the other hand, single male/father families (40 | 9.4%) represent the smallest median family size with 2.98 persons per family.
| Family Type | # Families | Family Size |
| Married-Couple | 326 (76.5%) | 3.45 |
| Single Male/Father | 40 (9.4%) | 2.98 |
| Single Female/Mother | 60 (14.1%) | 3.42 |
| Total Families | 426 (100.0%) | 3.40 |
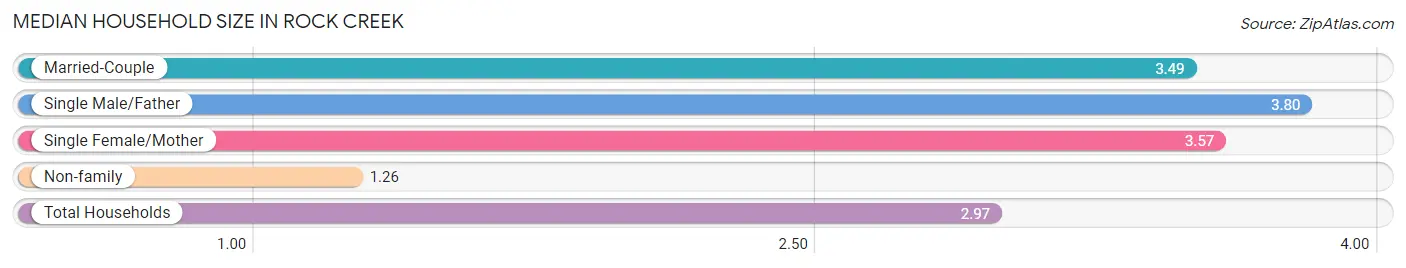
Median Household Size in Rock Creek
The median household size in Rock Creek is 2.97 persons per household, with single male/father households (40 | 7.0%) accounting for the largest median household size of 3.8 persons per household. non-family households (141 | 24.9%) represent the smallest median household size with 1.26 persons per household.
| Household Type | # Households | Household Size |
| Married-Couple | 326 (57.5%) | 3.49 |
| Single Male/Father | 40 (7.0%) | 3.80 |
| Single Female/Mother | 60 (10.6%) | 3.57 |
| Non-family | 141 (24.9%) | 1.26 |
| Total Households | 567 (100.0%) | 2.97 |
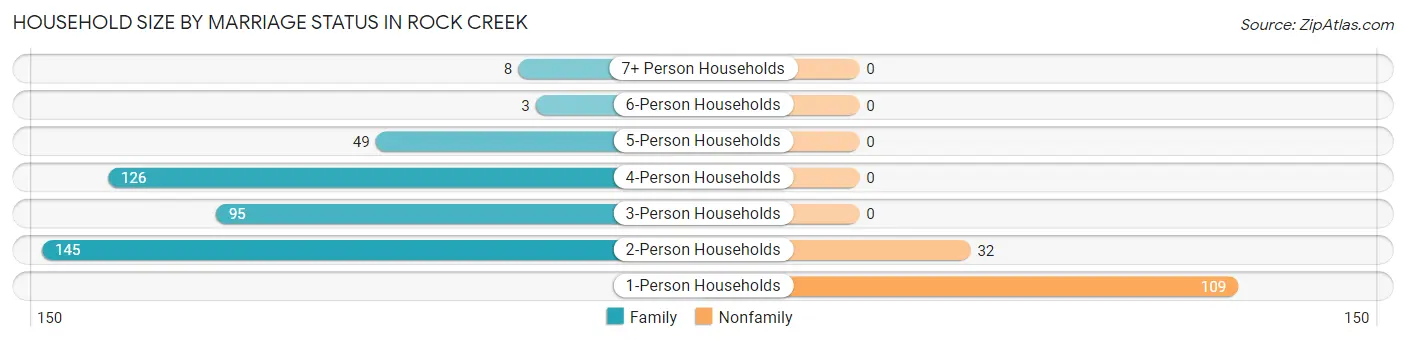
Household Size by Marriage Status in Rock Creek
Out of a total of 567 households in Rock Creek, 426 (75.1%) are family households, while 141 (24.9%) are nonfamily households. The most numerous type of family households are 2-person households, comprising 145, and the most common type of nonfamily households are 1-person households, comprising 109.
| Household Size | Family Households | Nonfamily Households |
| 1-Person Households | - | 109 (19.2%) |
| 2-Person Households | 145 (25.6%) | 32 (5.6%) |
| 3-Person Households | 95 (16.8%) | 0 (0.0%) |
| 4-Person Households | 126 (22.2%) | 0 (0.0%) |
| 5-Person Households | 49 (8.6%) | 0 (0.0%) |
| 6-Person Households | 3 (0.5%) | 0 (0.0%) |
| 7+ Person Households | 8 (1.4%) | 0 (0.0%) |
| Total | 426 (75.1%) | 141 (24.9%) |
Female Fertility in Rock Creek
Fertility by Age in Rock Creek
Average fertility rate in Rock Creek is 104.0 births per 1,000 women. Women in the age bracket of 20 to 34 years have the highest fertility rate with 311.0 births per 1,000 women. Women in the age bracket of 20 to 34 years acount for 92.5% of all women with births.
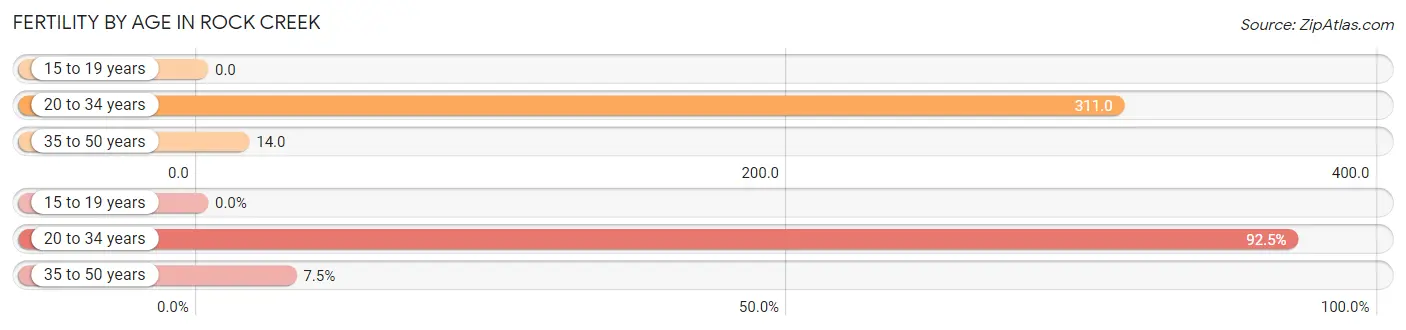
| Age Bracket | Women with Births | Births / 1,000 Women |
| 15 to 19 years | 0 (0.0%) | 0.0 |
| 20 to 34 years | 37 (92.5%) | 311.0 |
| 35 to 50 years | 3 (7.5%) | 14.0 |
| Total | 40 (100.0%) | 104.0 |
Fertility by Age by Marriage Status in Rock Creek
60.0% of women with births (40) in Rock Creek are married. The highest percentage of unmarried women with births falls into 20 to 34 years age bracket with 43.2% of them unmarried at the time of birth, while the lowest percentage of unmarried women with births belong to 35 to 50 years age bracket with 0.0% of them unmarried.
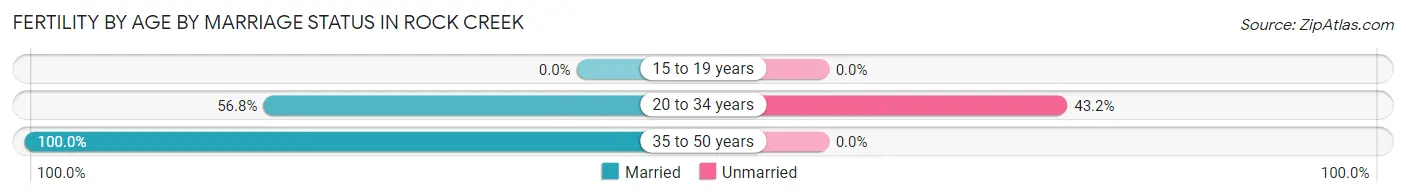
| Age Bracket | Married | Unmarried |
| 15 to 19 years | 0 (0.0%) | 0 (0.0%) |
| 20 to 34 years | 21 (56.8%) | 16 (43.2%) |
| 35 to 50 years | 3 (100.0%) | 0 (0.0%) |
| Total | 24 (60.0%) | 16 (40.0%) |
Fertility by Education in Rock Creek
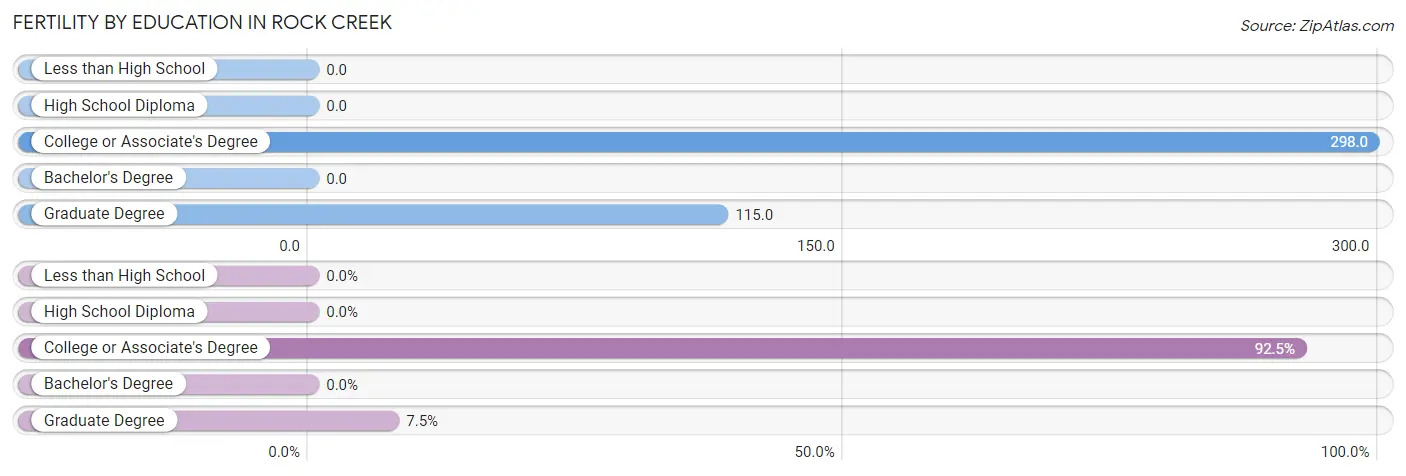
| Educational Attainment | Women with Births | Births / 1,000 Women |
| Less than High School | 0 (0.0%) | 0.0 |
| High School Diploma | 0 (0.0%) | 0.0 |
| College or Associate's Degree | 37 (92.5%) | 298.0 |
| Bachelor's Degree | 0 (0.0%) | 0.0 |
| Graduate Degree | 3 (7.5%) | 115.0 |
| Total | 40 (100.0%) | 104.0 |
Fertility by Education by Marriage Status in Rock Creek
40.0% of women with births in Rock Creek are unmarried. Women with the educational attainment of graduate degree are most likely to be married with 100.0% of them married at childbirth, while women with the educational attainment of college or associate's degree are least likely to be married with 43.2% of them unmarried at childbirth.
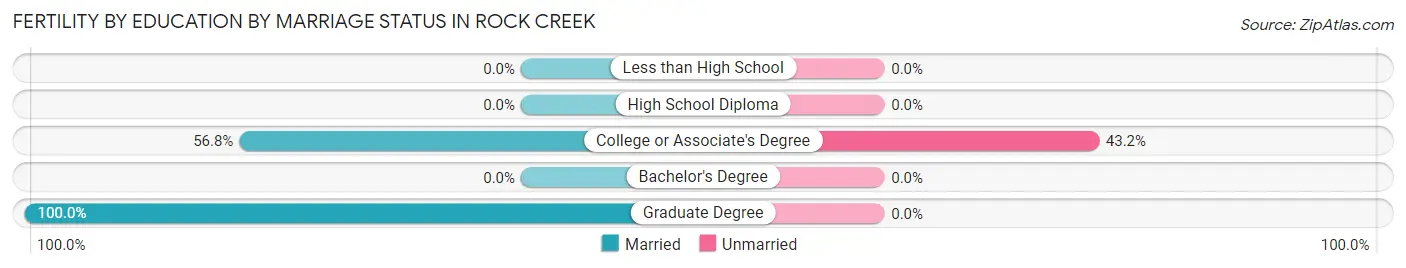
| Educational Attainment | Married | Unmarried |
| Less than High School | 0 (0.0%) | 0 (0.0%) |
| High School Diploma | 0 (0.0%) | 0 (0.0%) |
| College or Associate's Degree | 21 (56.8%) | 16 (43.2%) |
| Bachelor's Degree | 0 (0.0%) | 0 (0.0%) |
| Graduate Degree | 3 (100.0%) | 0 (0.0%) |
| Total | 24 (60.0%) | 16 (40.0%) |
Income in Rock Creek
Income Overview in Rock Creek
Per Capita Income in Rock Creek is $33,591, while median incomes of families and households are $99,500 and $92,344 respectively.
| Characteristic | Number | Measure |
| Per Capita Income | 1,694 | $33,591 |
| Median Family Income | 426 | $99,500 |
| Mean Family Income | 426 | $100,289 |
| Median Household Income | 567 | $92,344 |
| Mean Household Income | 567 | $96,105 |
| Income Deficit | 426 | $0 |
| Wage / Income Gap (%) | 1,694 | 7.88% |
| Wage / Income Gap ($) | 1,694 | 92.12¢ per $1 |
| Gini / Inequality Index | 1,694 | 0.33 |
Earnings by Sex in Rock Creek
Average Earnings in Rock Creek are $46,908, $49,034 for men and $45,172 for women, a difference of 7.9%.
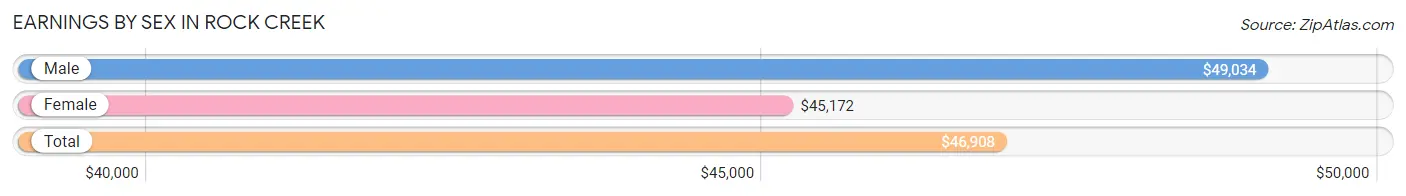
| Sex | Number | Average Earnings |
| Male | 513 (54.9%) | $49,034 |
| Female | 422 (45.1%) | $45,172 |
| Total | 935 (100.0%) | $46,908 |
Earnings by Sex by Income Bracket in Rock Creek
The most common earnings brackets in Rock Creek are $75,000 to $99,999 for men (69 | 13.5%) and $65,000 to $74,999 for women (54 | 12.8%).
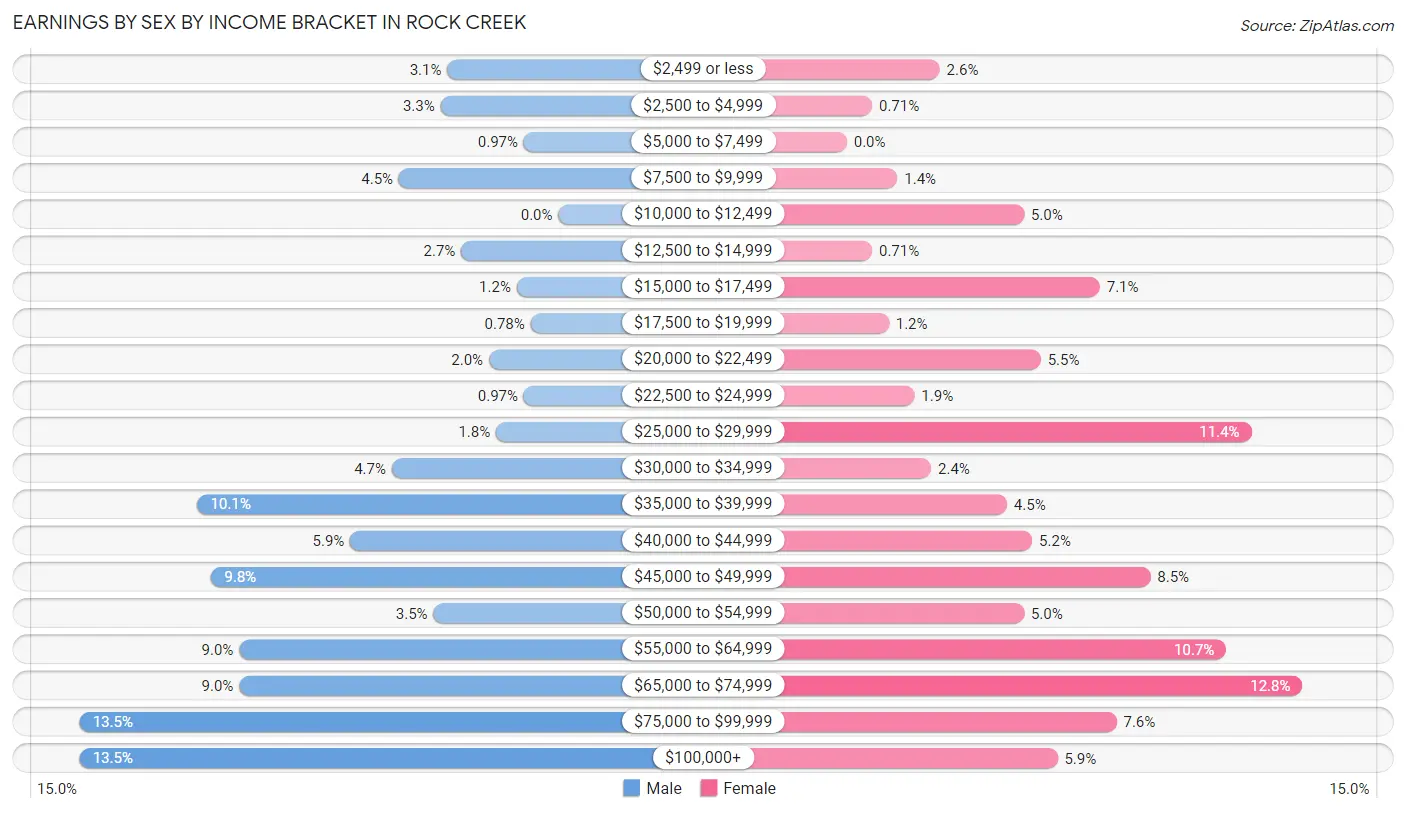
| Income | Male | Female |
| $2,499 or less | 16 (3.1%) | 11 (2.6%) |
| $2,500 to $4,999 | 17 (3.3%) | 3 (0.7%) |
| $5,000 to $7,499 | 5 (1.0%) | 0 (0.0%) |
| $7,500 to $9,999 | 23 (4.5%) | 6 (1.4%) |
| $10,000 to $12,499 | 0 (0.0%) | 21 (5.0%) |
| $12,500 to $14,999 | 14 (2.7%) | 3 (0.7%) |
| $15,000 to $17,499 | 6 (1.2%) | 30 (7.1%) |
| $17,500 to $19,999 | 4 (0.8%) | 5 (1.2%) |
| $20,000 to $22,499 | 10 (1.9%) | 23 (5.4%) |
| $22,500 to $24,999 | 5 (1.0%) | 8 (1.9%) |
| $25,000 to $29,999 | 9 (1.8%) | 48 (11.4%) |
| $30,000 to $34,999 | 24 (4.7%) | 10 (2.4%) |
| $35,000 to $39,999 | 52 (10.1%) | 19 (4.5%) |
| $40,000 to $44,999 | 30 (5.9%) | 22 (5.2%) |
| $45,000 to $49,999 | 50 (9.8%) | 36 (8.5%) |
| $50,000 to $54,999 | 18 (3.5%) | 21 (5.0%) |
| $55,000 to $64,999 | 46 (9.0%) | 45 (10.7%) |
| $65,000 to $74,999 | 46 (9.0%) | 54 (12.8%) |
| $75,000 to $99,999 | 69 (13.5%) | 32 (7.6%) |
| $100,000+ | 69 (13.5%) | 25 (5.9%) |
| Total | 513 (100.0%) | 422 (100.0%) |
Earnings by Sex by Educational Attainment in Rock Creek
Average earnings in Rock Creek are $52,045 for men and $46,146 for women, a difference of 11.3%. Men with an educational attainment of bachelor's degree enjoy the highest average annual earnings of $83,523, while those with high school diploma education earn the least with $47,708. Women with an educational attainment of graduate degree earn the most with the average annual earnings of $71,667, while those with high school diploma education have the smallest earnings of $28,047.
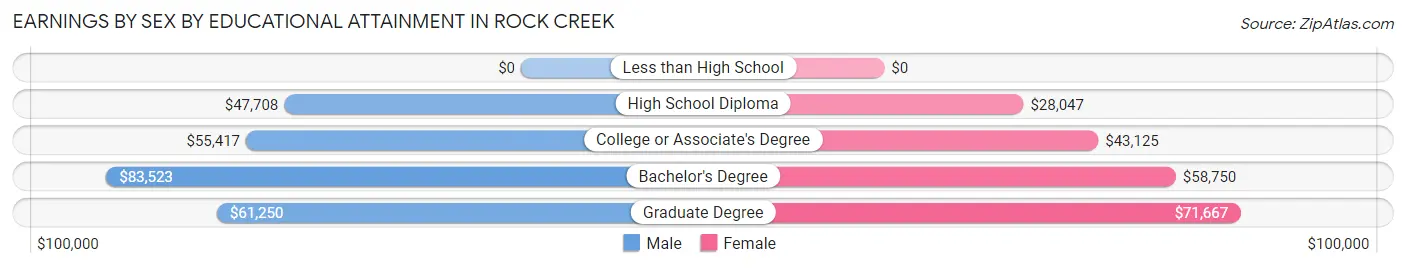
| Educational Attainment | Male Income | Female Income |
| Less than High School | - | - |
| High School Diploma | $47,708 | $28,047 |
| College or Associate's Degree | $55,417 | $43,125 |
| Bachelor's Degree | $83,523 | $58,750 |
| Graduate Degree | $61,250 | $71,667 |
| Total | $52,045 | $46,146 |
Family Income in Rock Creek
Family Income Brackets in Rock Creek
According to the Rock Creek family income data, there are 148 families falling into the $100,000 to $149,999 income range, which is the most common income bracket and makes up 34.7% of all families.
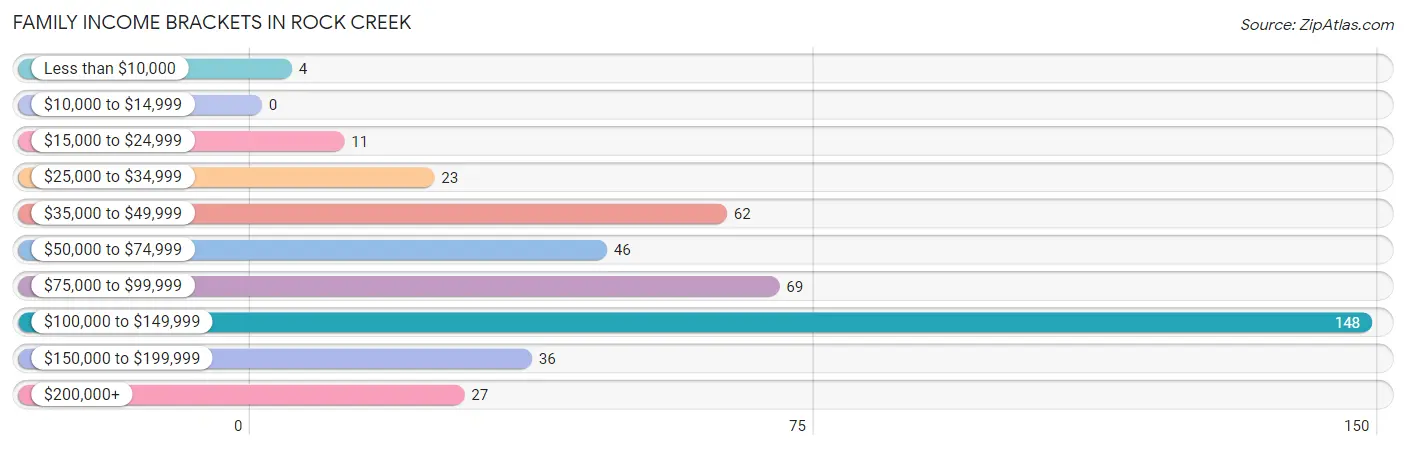
| Income Bracket | # Families | % Families |
| Less than $10,000 | 4 | 0.9% |
| $10,000 to $14,999 | 0 | 0.0% |
| $15,000 to $24,999 | 11 | 2.6% |
| $25,000 to $34,999 | 23 | 5.4% |
| $35,000 to $49,999 | 62 | 14.6% |
| $50,000 to $74,999 | 46 | 10.8% |
| $75,000 to $99,999 | 69 | 16.2% |
| $100,000 to $149,999 | 148 | 34.7% |
| $150,000 to $199,999 | 36 | 8.5% |
| $200,000+ | 27 | 6.3% |
Family Income by Famaliy Size in Rock Creek
4-person families (97 | 22.8%) account for the highest median family income in Rock Creek with $122,917 per family, while 2-person families (163 | 38.3%) have the highest median income of $42,054 per family member.
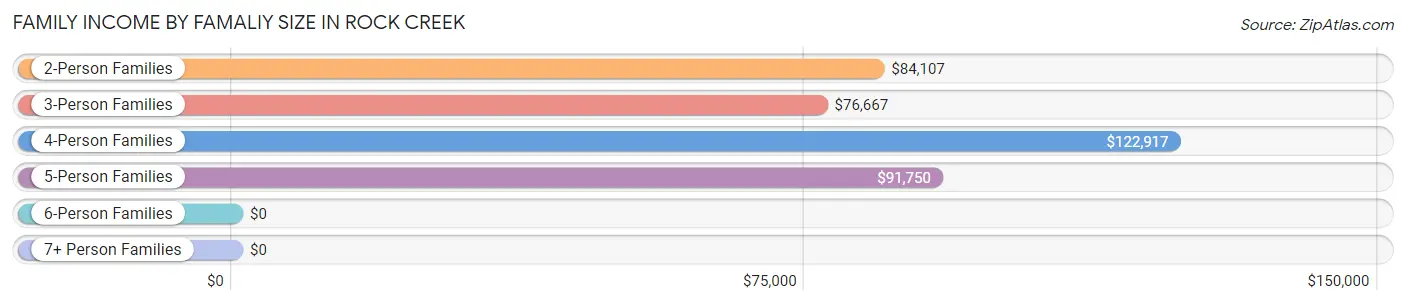
| Income Bracket | # Families | Median Income |
| 2-Person Families | 163 (38.3%) | $84,107 |
| 3-Person Families | 106 (24.9%) | $76,667 |
| 4-Person Families | 97 (22.8%) | $122,917 |
| 5-Person Families | 49 (11.5%) | $91,750 |
| 6-Person Families | 8 (1.9%) | $0 |
| 7+ Person Families | 3 (0.7%) | $0 |
| Total | 426 (100.0%) | $99,500 |
Family Income by Number of Earners in Rock Creek
The median family income in Rock Creek is $99,500, with families comprising 3+ earners (53) having the highest median family income of $141,563, while families with no earners (22) have the lowest median family income of $52,500, accounting for 12.4% and 5.2% of families, respectively.
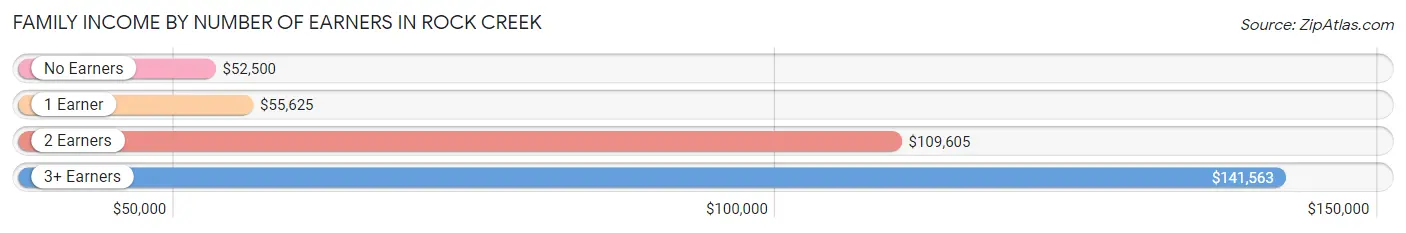
| Number of Earners | # Families | Median Income |
| No Earners | 22 (5.2%) | $52,500 |
| 1 Earner | 153 (35.9%) | $55,625 |
| 2 Earners | 198 (46.5%) | $109,605 |
| 3+ Earners | 53 (12.4%) | $141,563 |
| Total | 426 (100.0%) | $99,500 |
Household Income in Rock Creek
Household Income Brackets in Rock Creek
With 182 households falling in the category, the $100,000 to $149,999 income range is the most frequent in Rock Creek, accounting for 32.1% of all households. In contrast, only 3 households (0.5%) fall into the $10,000 to $14,999 income bracket, making it the least populous group.
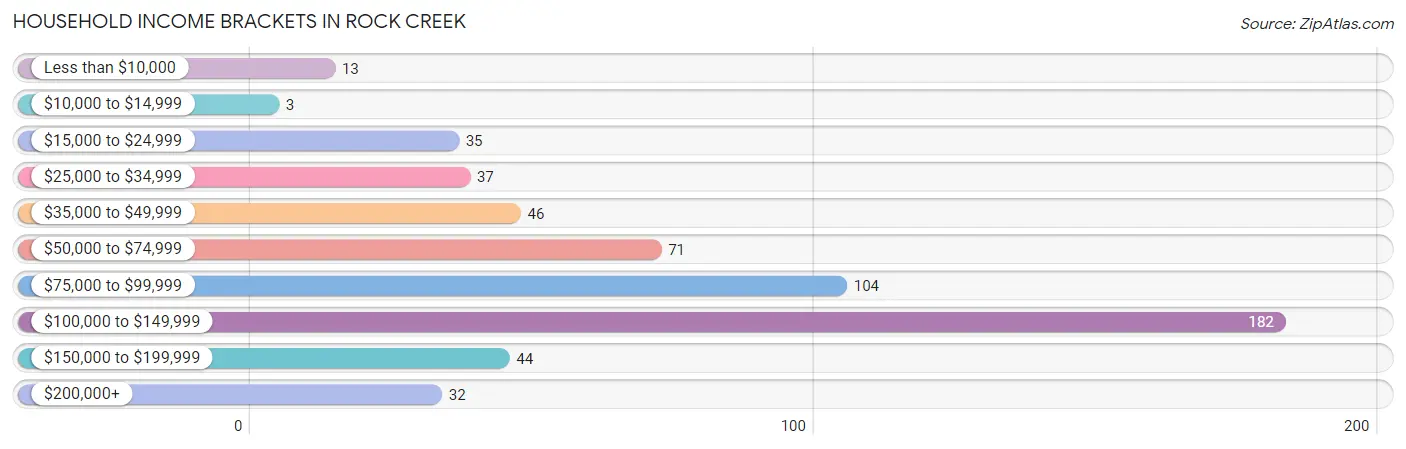
| Income Bracket | # Households | % Households |
| Less than $10,000 | 13 | 2.3% |
| $10,000 to $14,999 | 3 | 0.5% |
| $15,000 to $24,999 | 35 | 6.2% |
| $25,000 to $34,999 | 37 | 6.5% |
| $35,000 to $49,999 | 46 | 8.1% |
| $50,000 to $74,999 | 71 | 12.5% |
| $75,000 to $99,999 | 104 | 18.3% |
| $100,000 to $149,999 | 182 | 32.1% |
| $150,000 to $199,999 | 44 | 7.8% |
| $200,000+ | 32 | 5.6% |
Household Income by Householder Age in Rock Creek
The median household income in Rock Creek is $92,344, with the highest median household income of $103,333 found in the 25 to 44 years age bracket for the primary householder. A total of 202 households (35.6%) fall into this category. Meanwhile, the 15 to 24 years age bracket for the primary householder has the lowest median household income of $0, with 4 households (0.7%) in this group.
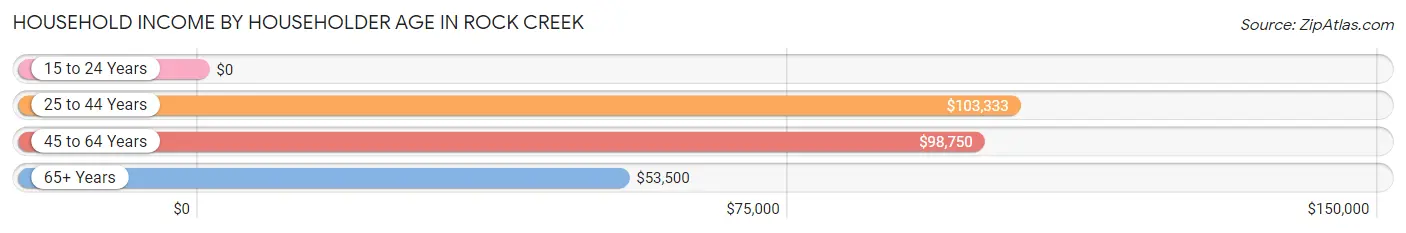
| Income Bracket | # Households | Median Income |
| 15 to 24 Years | 4 (0.7%) | $0 |
| 25 to 44 Years | 202 (35.6%) | $103,333 |
| 45 to 64 Years | 245 (43.2%) | $98,750 |
| 65+ Years | 116 (20.5%) | $53,500 |
| Total | 567 (100.0%) | $92,344 |
Poverty in Rock Creek
Income Below Poverty by Sex and Age in Rock Creek
With 6.1% poverty level for males and 4.5% for females among the residents of Rock Creek, 15 year old males and 12 to 14 year old females are the most vulnerable to poverty, with 4 males (33.3%) and 3 females (13.6%) in their respective age groups living below the poverty level.
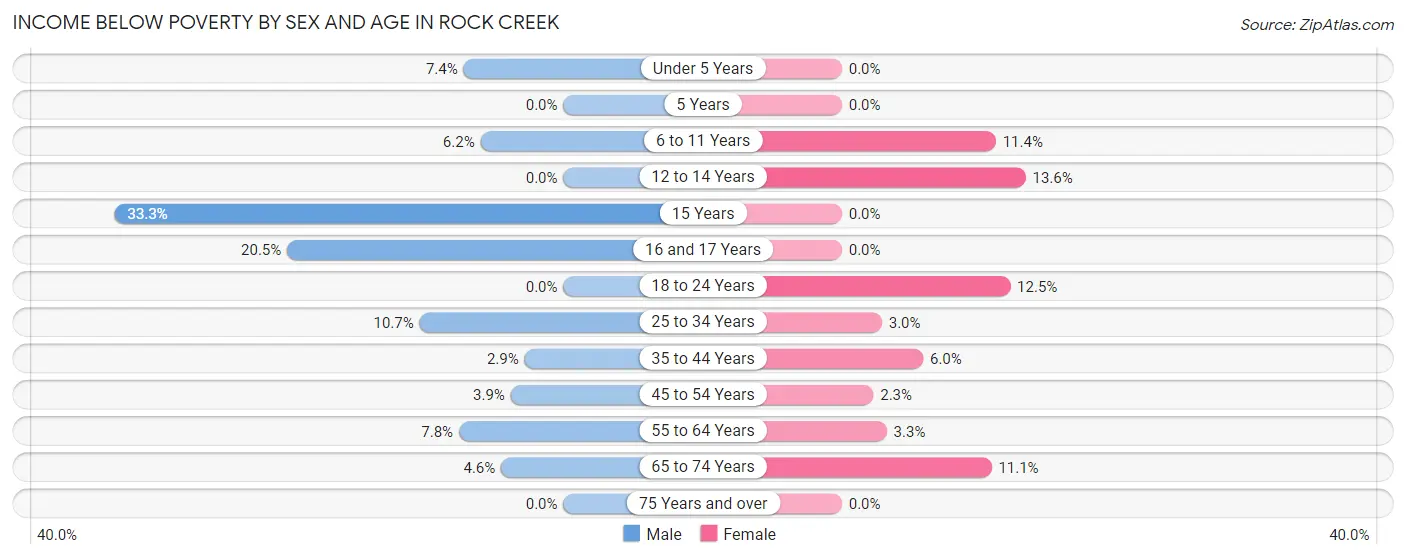
| Age Bracket | Male | Female |
| Under 5 Years | 4 (7.4%) | 0 (0.0%) |
| 5 Years | 0 (0.0%) | 0 (0.0%) |
| 6 to 11 Years | 4 (6.1%) | 8 (11.4%) |
| 12 to 14 Years | 0 (0.0%) | 3 (13.6%) |
| 15 Years | 4 (33.3%) | 0 (0.0%) |
| 16 and 17 Years | 8 (20.5%) | 0 (0.0%) |
| 18 to 24 Years | 0 (0.0%) | 4 (12.5%) |
| 25 to 34 Years | 11 (10.7%) | 3 (3.0%) |
| 35 to 44 Years | 4 (2.9%) | 7 (6.0%) |
| 45 to 54 Years | 5 (3.9%) | 3 (2.3%) |
| 55 to 64 Years | 10 (7.7%) | 3 (3.3%) |
| 65 to 74 Years | 3 (4.6%) | 6 (11.1%) |
| 75 Years and over | 0 (0.0%) | 0 (0.0%) |
| Total | 53 (6.1%) | 37 (4.5%) |
Income Above Poverty by Sex and Age in Rock Creek
According to the poverty statistics in Rock Creek, males aged 5 years and females aged under 5 years are the age groups that are most secure financially, with 100.0% of males and 100.0% of females in these age groups living above the poverty line.
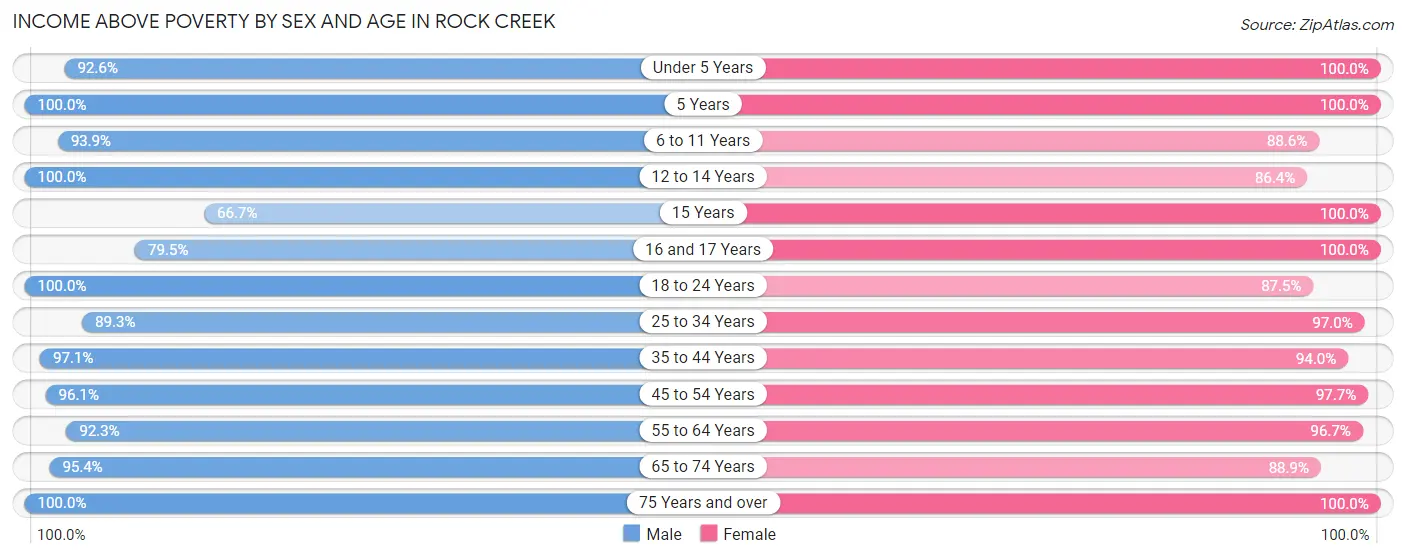
| Age Bracket | Male | Female |
| Under 5 Years | 50 (92.6%) | 122 (100.0%) |
| 5 Years | 15 (100.0%) | 25 (100.0%) |
| 6 to 11 Years | 61 (93.9%) | 62 (88.6%) |
| 12 to 14 Years | 40 (100.0%) | 19 (86.4%) |
| 15 Years | 8 (66.7%) | 29 (100.0%) |
| 16 and 17 Years | 31 (79.5%) | 13 (100.0%) |
| 18 to 24 Years | 39 (100.0%) | 28 (87.5%) |
| 25 to 34 Years | 92 (89.3%) | 98 (97.0%) |
| 35 to 44 Years | 135 (97.1%) | 109 (94.0%) |
| 45 to 54 Years | 123 (96.1%) | 125 (97.7%) |
| 55 to 64 Years | 119 (92.2%) | 87 (96.7%) |
| 65 to 74 Years | 62 (95.4%) | 48 (88.9%) |
| 75 Years and over | 39 (100.0%) | 25 (100.0%) |
| Total | 814 (93.9%) | 790 (95.5%) |
Income Below Poverty Among Married-Couple Families in Rock Creek
The poverty statistics for married-couple families in Rock Creek show that 2.5% or 8 of the total 326 families live below the poverty line. Families with 3 or 4 children have the highest poverty rate of 11.9%, comprising of 5 families. On the other hand, families with 1 or 2 children have the lowest poverty rate of 0.0%, which includes 0 families.
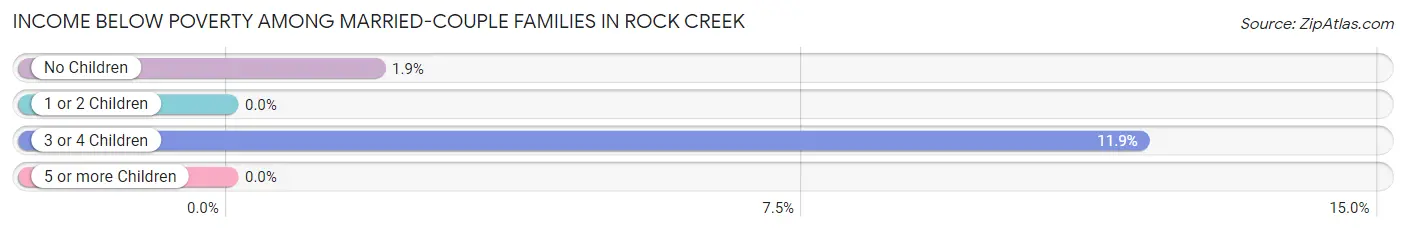
| Children | Above Poverty | Below Poverty |
| No Children | 153 (98.1%) | 3 (1.9%) |
| 1 or 2 Children | 128 (100.0%) | 0 (0.0%) |
| 3 or 4 Children | 37 (88.1%) | 5 (11.9%) |
| 5 or more Children | 0 (0.0%) | 0 (0.0%) |
| Total | 318 (97.6%) | 8 (2.5%) |
Income Below Poverty Among Single-Parent Households in Rock Creek
According to the poverty data in Rock Creek, 10.0% or 4 single-father households and 10.0% or 6 single-mother households are living below the poverty line. Among single-father households, those with 1 or 2 children have the highest poverty rate, with 4 households (11.8%) experiencing poverty. Likewise, among single-mother households, those with 1 or 2 children have the highest poverty rate, with 6 households (24.0%) falling below the poverty line.
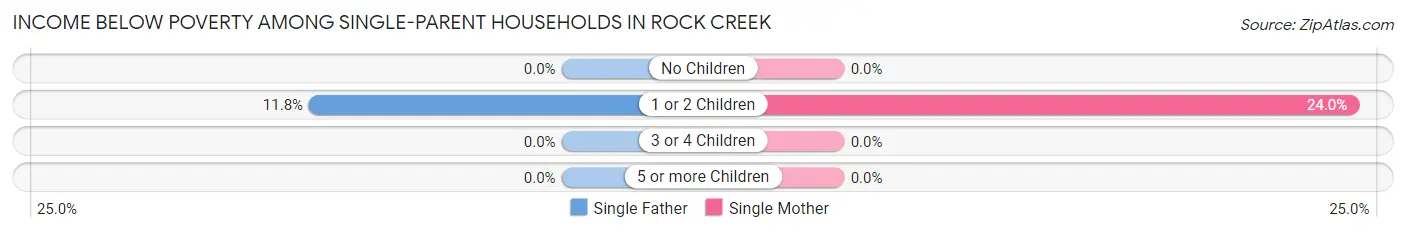
| Children | Single Father | Single Mother |
| No Children | 0 (0.0%) | 0 (0.0%) |
| 1 or 2 Children | 4 (11.8%) | 6 (24.0%) |
| 3 or 4 Children | 0 (0.0%) | 0 (0.0%) |
| 5 or more Children | 0 (0.0%) | 0 (0.0%) |
| Total | 4 (10.0%) | 6 (10.0%) |
Income Below Poverty Among Married-Couple vs Single-Parent Households in Rock Creek
The poverty data for Rock Creek shows that 8 of the married-couple family households (2.5%) and 10 of the single-parent households (10.0%) are living below the poverty level. Within the married-couple family households, those with 3 or 4 children have the highest poverty rate, with 5 households (11.9%) falling below the poverty line. Among the single-parent households, those with 1 or 2 children have the highest poverty rate, with 10 household (17.0%) living below poverty.
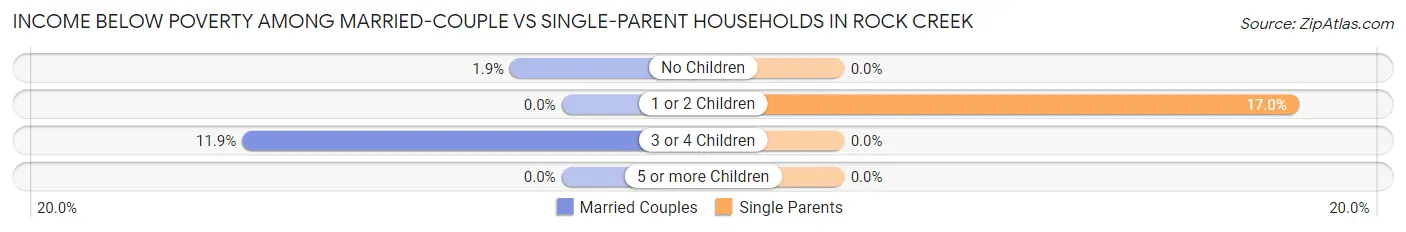
| Children | Married-Couple Families | Single-Parent Households |
| No Children | 3 (1.9%) | 0 (0.0%) |
| 1 or 2 Children | 0 (0.0%) | 10 (17.0%) |
| 3 or 4 Children | 5 (11.9%) | 0 (0.0%) |
| 5 or more Children | 0 (0.0%) | 0 (0.0%) |
| Total | 8 (2.5%) | 10 (10.0%) |
Employment Characteristics in Rock Creek
Employment by Class of Employer in Rock Creek
Among the 870 employed individuals in Rock Creek, private company employees (527 | 60.6%), local government employees (100 | 11.5%), and self-employed (not incorporated) (73 | 8.4%) make up the most common classes of employment.
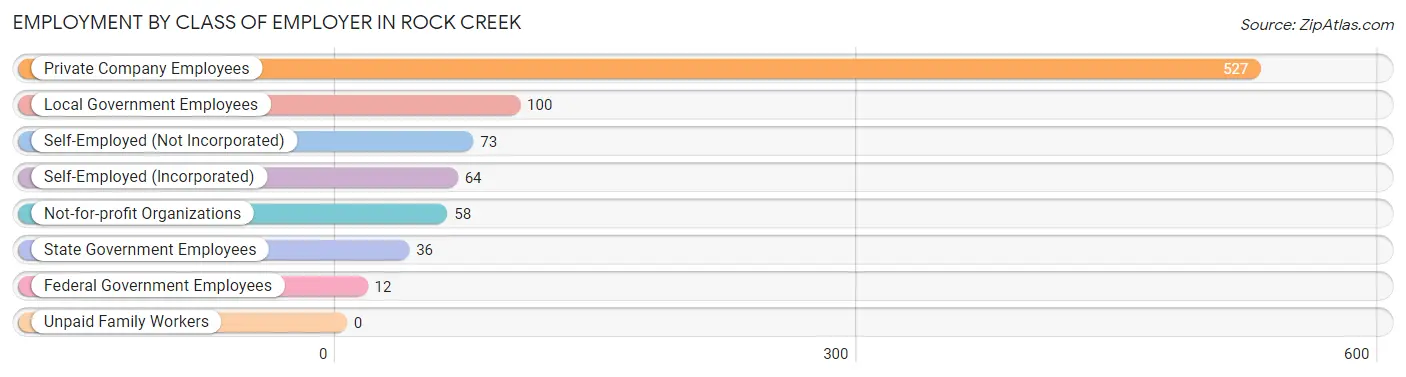
| Employer Class | # Employees | % Employees |
| Private Company Employees | 527 | 60.6% |
| Self-Employed (Incorporated) | 64 | 7.4% |
| Self-Employed (Not Incorporated) | 73 | 8.4% |
| Not-for-profit Organizations | 58 | 6.7% |
| Local Government Employees | 100 | 11.5% |
| State Government Employees | 36 | 4.1% |
| Federal Government Employees | 12 | 1.4% |
| Unpaid Family Workers | 0 | 0.0% |
| Total | 870 | 100.0% |
Employment Status by Age in Rock Creek
According to the labor force statistics for Rock Creek, out of the total population over 16 years of age (1,240), 74.5% or 924 individuals are in the labor force, with 2.9% or 27 of them unemployed. The age group with the highest labor force participation rate is 30 to 34 years, with 100.0% or 84 individuals in the labor force. Within the labor force, the 65 to 74 years age range has the highest percentage of unemployed individuals, with 11.1% or 3 of them being unemployed.
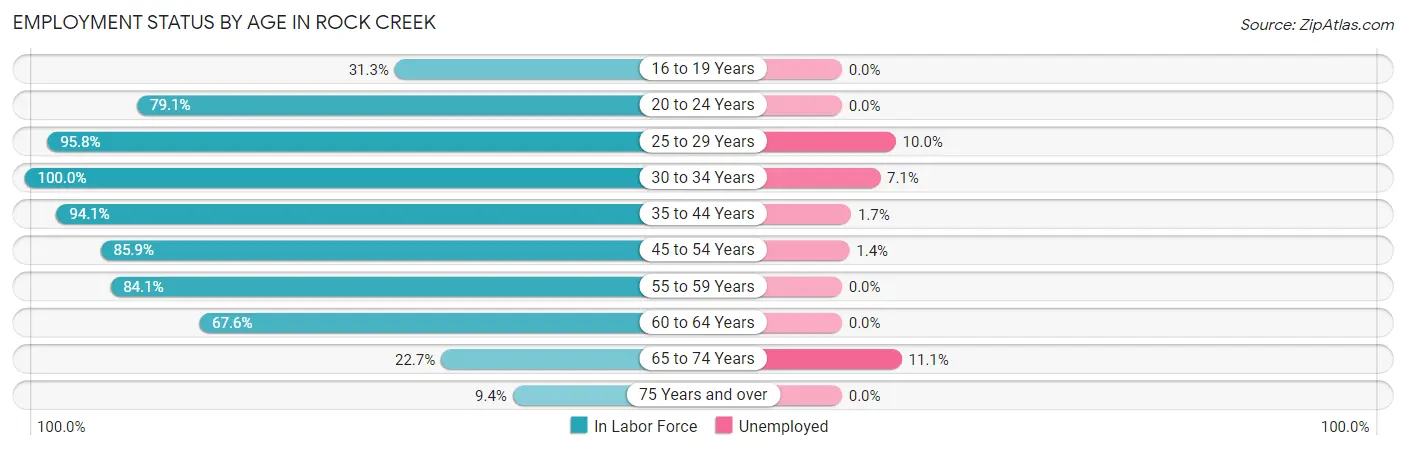
| Age Bracket | In Labor Force | Unemployed |
| 16 to 19 Years | 25 (31.3%) | 0 (0.0%) |
| 20 to 24 Years | 34 (79.1%) | 0 (0.0%) |
| 25 to 29 Years | 115 (95.8%) | 12 (10.0%) |
| 30 to 34 Years | 84 (100.0%) | 6 (7.1%) |
| 35 to 44 Years | 240 (94.1%) | 4 (1.7%) |
| 45 to 54 Years | 220 (85.9%) | 3 (1.4%) |
| 55 to 59 Years | 127 (84.1%) | 0 (0.0%) |
| 60 to 64 Years | 46 (67.6%) | 0 (0.0%) |
| 65 to 74 Years | 27 (22.7%) | 3 (11.1%) |
| 75 Years and over | 6 (9.4%) | 0 (0.0%) |
| Total | 924 (74.5%) | 27 (2.9%) |
Employment Status by Educational Attainment in Rock Creek
According to labor force statistics for Rock Creek, 89.1% of individuals (832) out of the total population between 25 and 64 years of age (934) are in the labor force, with 2.9% or 24 of them being unemployed. The group with the highest labor force participation rate are those with the educational attainment of bachelor's degree or higher, with 98.4% or 181 individuals in the labor force. Within the labor force, individuals with high school diploma education have the highest percentage of unemployment, with 5.3% or 18 of them being unemployed.
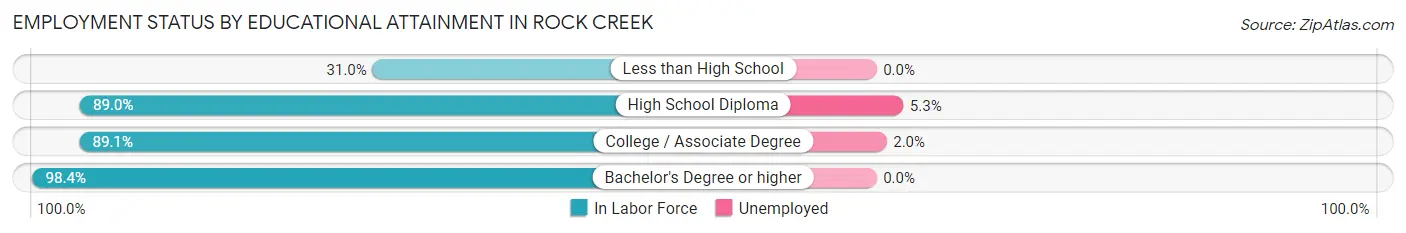
| Educational Attainment | In Labor Force | Unemployed |
| Less than High School | 9 (31.0%) | 0 (0.0%) |
| High School Diploma | 347 (89.0%) | 21 (5.3%) |
| College / Associate Degree | 295 (89.1%) | 7 (2.0%) |
| Bachelor's Degree or higher | 181 (98.4%) | 0 (0.0%) |
| Total | 832 (89.1%) | 27 (2.9%) |
Employment Occupations by Sex in Rock Creek
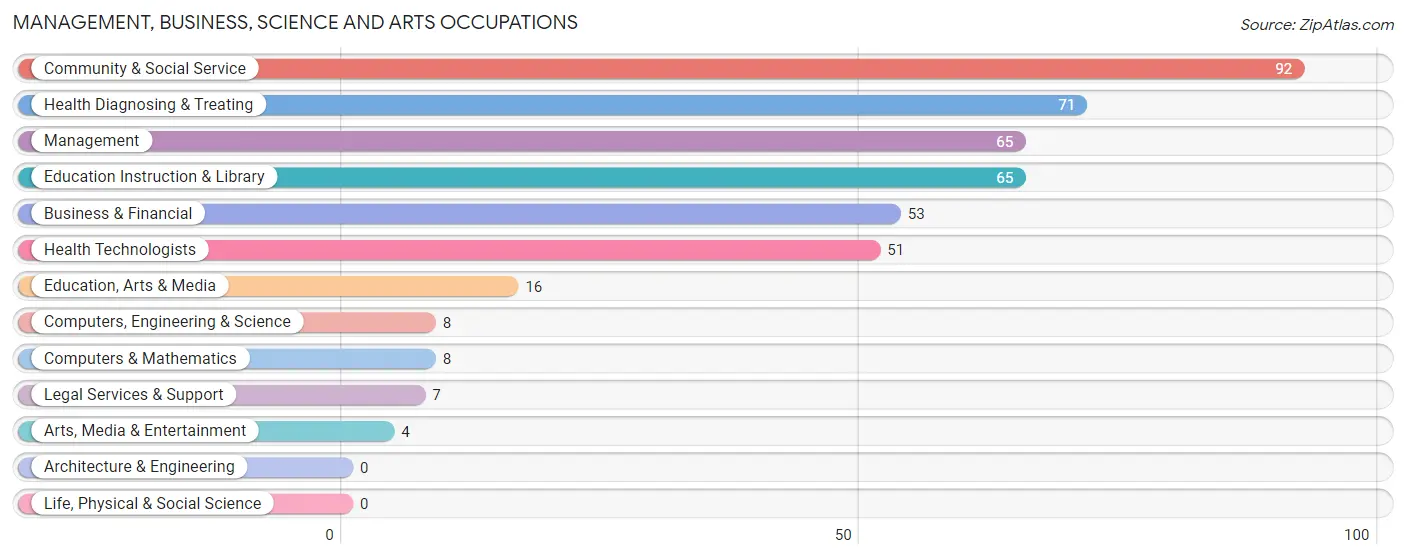
Management, Business, Science and Arts Occupations
The most common Management, Business, Science and Arts occupations in Rock Creek are Community & Social Service (92 | 10.3%), Health Diagnosing & Treating (71 | 8.0%), Management (65 | 7.3%), Education Instruction & Library (65 | 7.3%), and Business & Financial (53 | 5.9%).
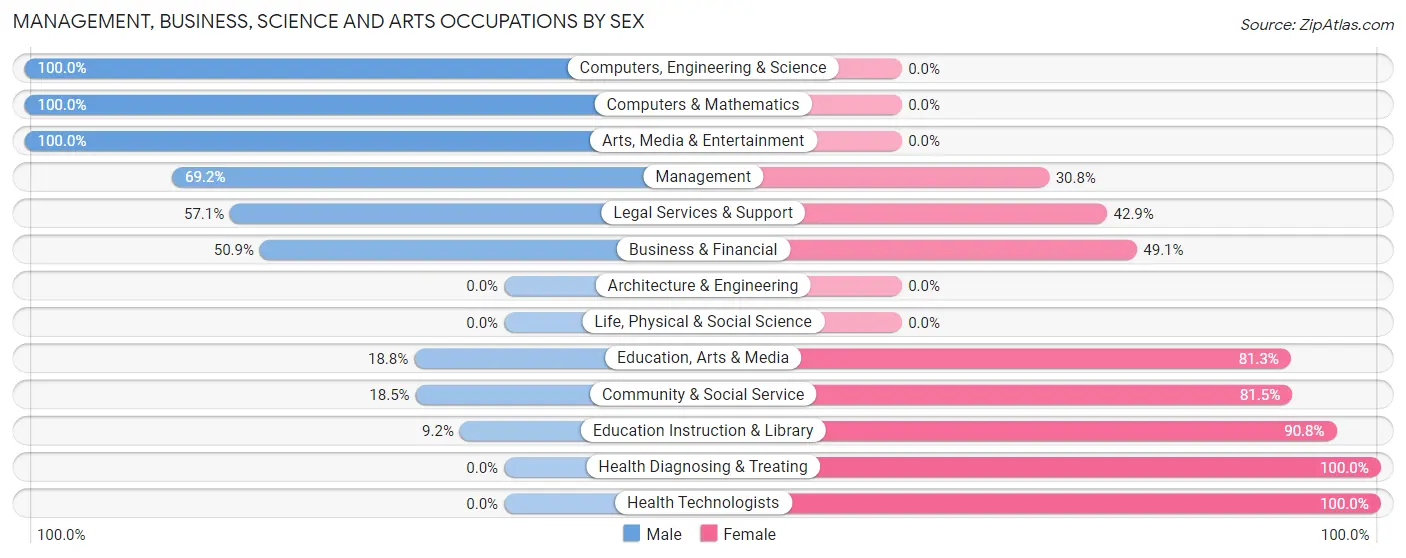
Management, Business, Science and Arts Occupations by Sex
Within the Management, Business, Science and Arts occupations in Rock Creek, the most male-oriented occupations are Computers, Engineering & Science (100.0%), Computers & Mathematics (100.0%), and Arts, Media & Entertainment (100.0%), while the most female-oriented occupations are Health Diagnosing & Treating (100.0%), Health Technologists (100.0%), and Education Instruction & Library (90.8%).
| Occupation | Male | Female |
| Management | 45 (69.2%) | 20 (30.8%) |
| Business & Financial | 27 (50.9%) | 26 (49.1%) |
| Computers, Engineering & Science | 8 (100.0%) | 0 (0.0%) |
| Computers & Mathematics | 8 (100.0%) | 0 (0.0%) |
| Architecture & Engineering | 0 (0.0%) | 0 (0.0%) |
| Life, Physical & Social Science | 0 (0.0%) | 0 (0.0%) |
| Community & Social Service | 17 (18.5%) | 75 (81.5%) |
| Education, Arts & Media | 3 (18.8%) | 13 (81.2%) |
| Legal Services & Support | 4 (57.1%) | 3 (42.9%) |
| Education Instruction & Library | 6 (9.2%) | 59 (90.8%) |
| Arts, Media & Entertainment | 4 (100.0%) | 0 (0.0%) |
| Health Diagnosing & Treating | 0 (0.0%) | 71 (100.0%) |
| Health Technologists | 0 (0.0%) | 51 (100.0%) |
| Total (Category) | 97 (33.6%) | 192 (66.4%) |
| Total (Overall) | 478 (53.6%) | 414 (46.4%) |
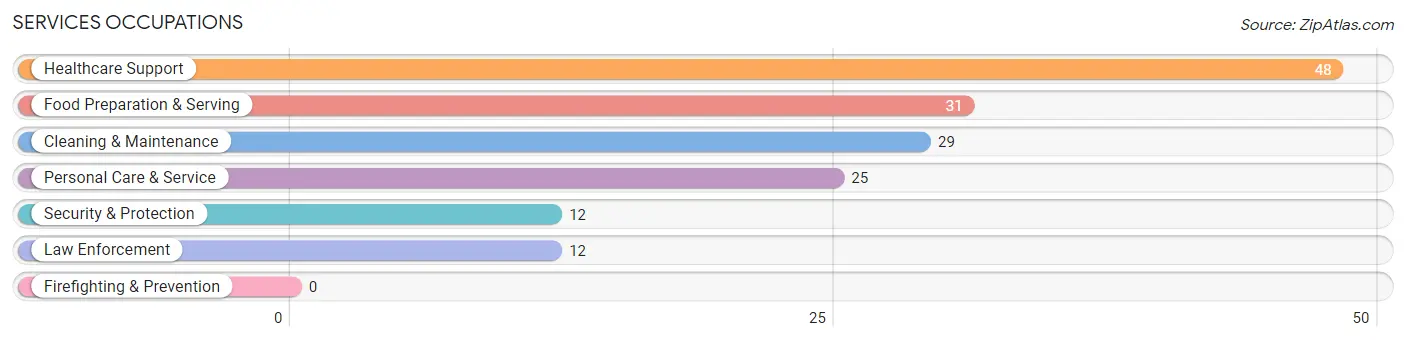
Services Occupations
The most common Services occupations in Rock Creek are Healthcare Support (48 | 5.4%), Food Preparation & Serving (31 | 3.5%), Cleaning & Maintenance (29 | 3.3%), Personal Care & Service (25 | 2.8%), and Security & Protection (12 | 1.3%).
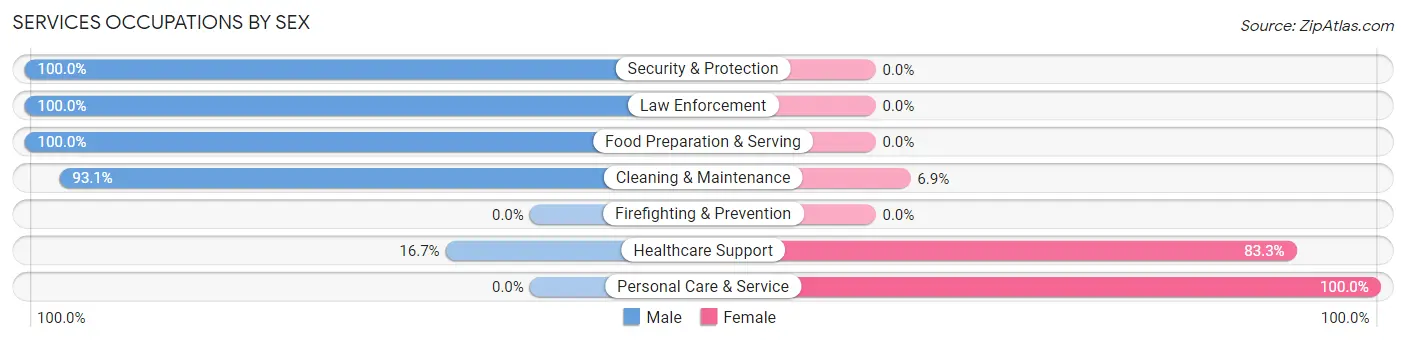
Services Occupations by Sex
Within the Services occupations in Rock Creek, the most male-oriented occupations are Security & Protection (100.0%), Law Enforcement (100.0%), and Food Preparation & Serving (100.0%), while the most female-oriented occupations are Personal Care & Service (100.0%), Healthcare Support (83.3%), and Cleaning & Maintenance (6.9%).
| Occupation | Male | Female |
| Healthcare Support | 8 (16.7%) | 40 (83.3%) |
| Security & Protection | 12 (100.0%) | 0 (0.0%) |
| Firefighting & Prevention | 0 (0.0%) | 0 (0.0%) |
| Law Enforcement | 12 (100.0%) | 0 (0.0%) |
| Food Preparation & Serving | 31 (100.0%) | 0 (0.0%) |
| Cleaning & Maintenance | 27 (93.1%) | 2 (6.9%) |
| Personal Care & Service | 0 (0.0%) | 25 (100.0%) |
| Total (Category) | 78 (53.8%) | 67 (46.2%) |
| Total (Overall) | 478 (53.6%) | 414 (46.4%) |
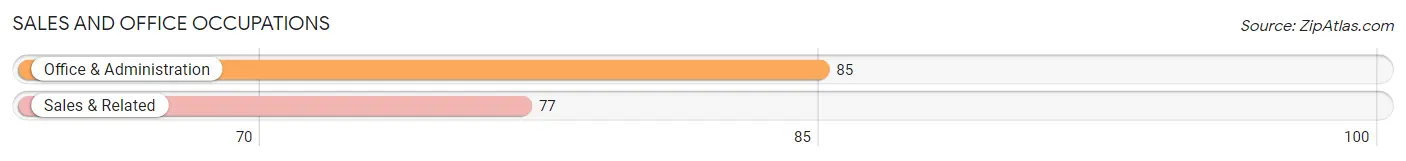
Sales and Office Occupations
The most common Sales and Office occupations in Rock Creek are Office & Administration (85 | 9.5%), and Sales & Related (77 | 8.6%).
Sales and Office Occupations by Sex
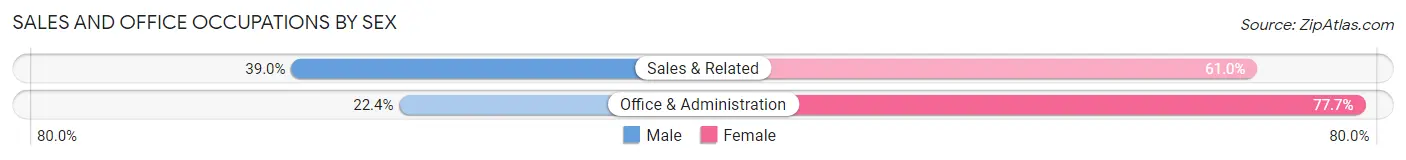
| Occupation | Male | Female |
| Sales & Related | 30 (39.0%) | 47 (61.0%) |
| Office & Administration | 19 (22.4%) | 66 (77.6%) |
| Total (Category) | 49 (30.2%) | 113 (69.8%) |
| Total (Overall) | 478 (53.6%) | 414 (46.4%) |
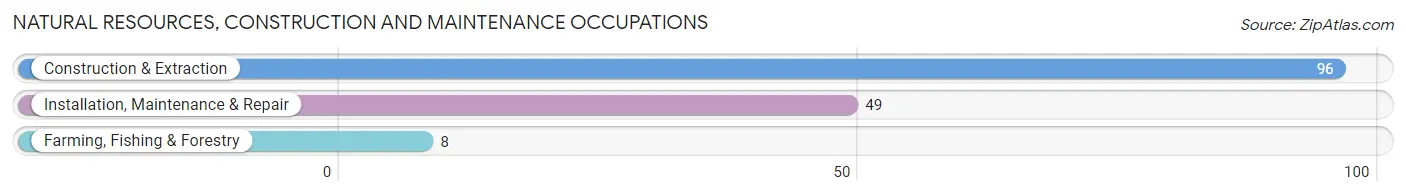
Natural Resources, Construction and Maintenance Occupations
The most common Natural Resources, Construction and Maintenance occupations in Rock Creek are Construction & Extraction (96 | 10.8%), Installation, Maintenance & Repair (49 | 5.5%), and Farming, Fishing & Forestry (8 | 0.9%).
Natural Resources, Construction and Maintenance Occupations by Sex
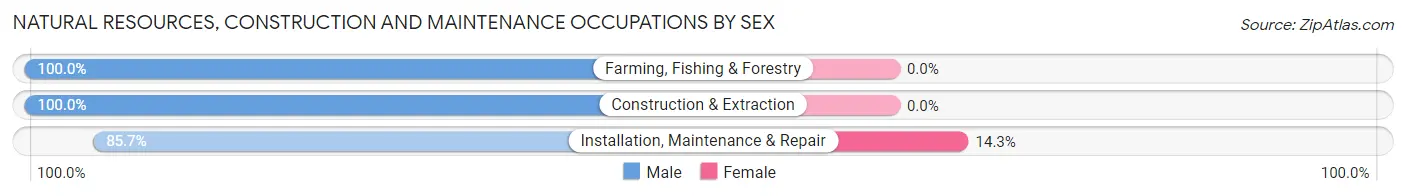
| Occupation | Male | Female |
| Farming, Fishing & Forestry | 8 (100.0%) | 0 (0.0%) |
| Construction & Extraction | 96 (100.0%) | 0 (0.0%) |
| Installation, Maintenance & Repair | 42 (85.7%) | 7 (14.3%) |
| Total (Category) | 146 (95.4%) | 7 (4.6%) |
| Total (Overall) | 478 (53.6%) | 414 (46.4%) |
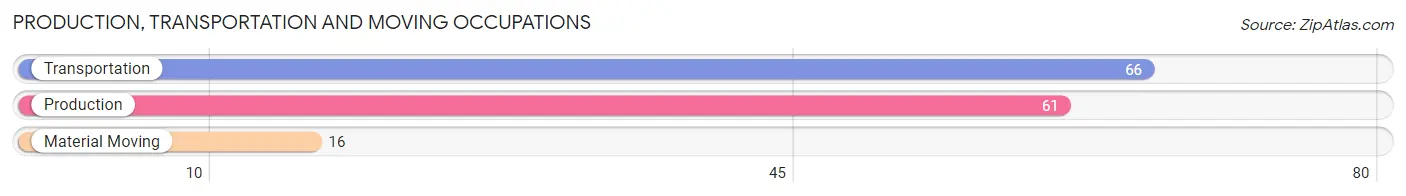
Production, Transportation and Moving Occupations
The most common Production, Transportation and Moving occupations in Rock Creek are Transportation (66 | 7.4%), Production (61 | 6.8%), and Material Moving (16 | 1.8%).
Production, Transportation and Moving Occupations by Sex
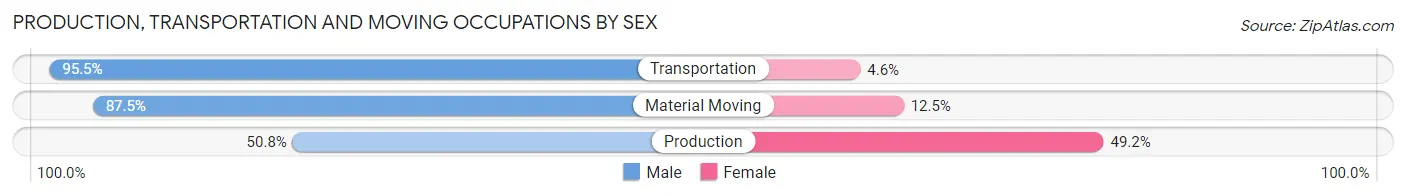
| Occupation | Male | Female |
| Production | 31 (50.8%) | 30 (49.2%) |
| Transportation | 63 (95.5%) | 3 (4.5%) |
| Material Moving | 14 (87.5%) | 2 (12.5%) |
| Total (Category) | 108 (75.5%) | 35 (24.5%) |
| Total (Overall) | 478 (53.6%) | 414 (46.4%) |
Employment Industries by Sex in Rock Creek
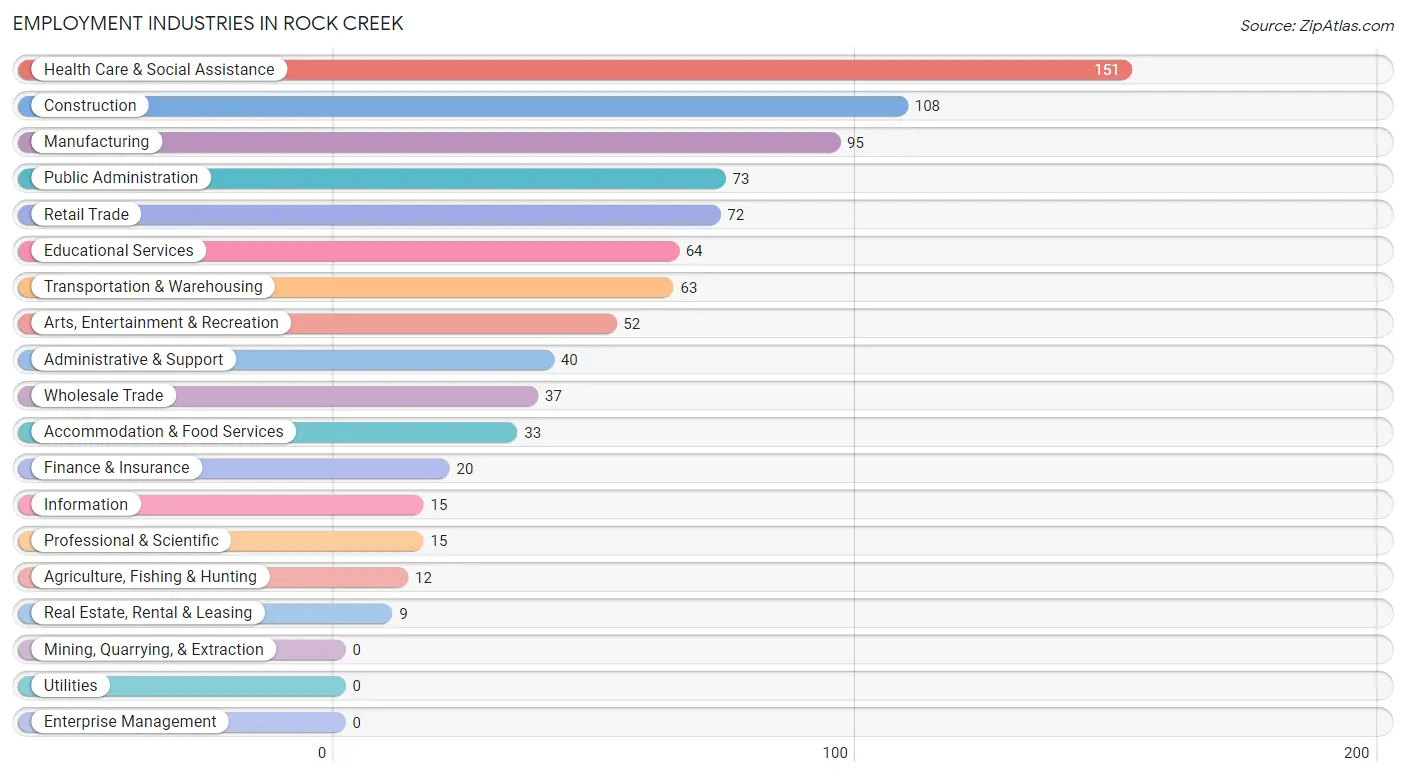
Employment Industries in Rock Creek
The major employment industries in Rock Creek include Health Care & Social Assistance (151 | 16.9%), Construction (108 | 12.1%), Manufacturing (95 | 10.6%), Public Administration (73 | 8.2%), and Retail Trade (72 | 8.1%).
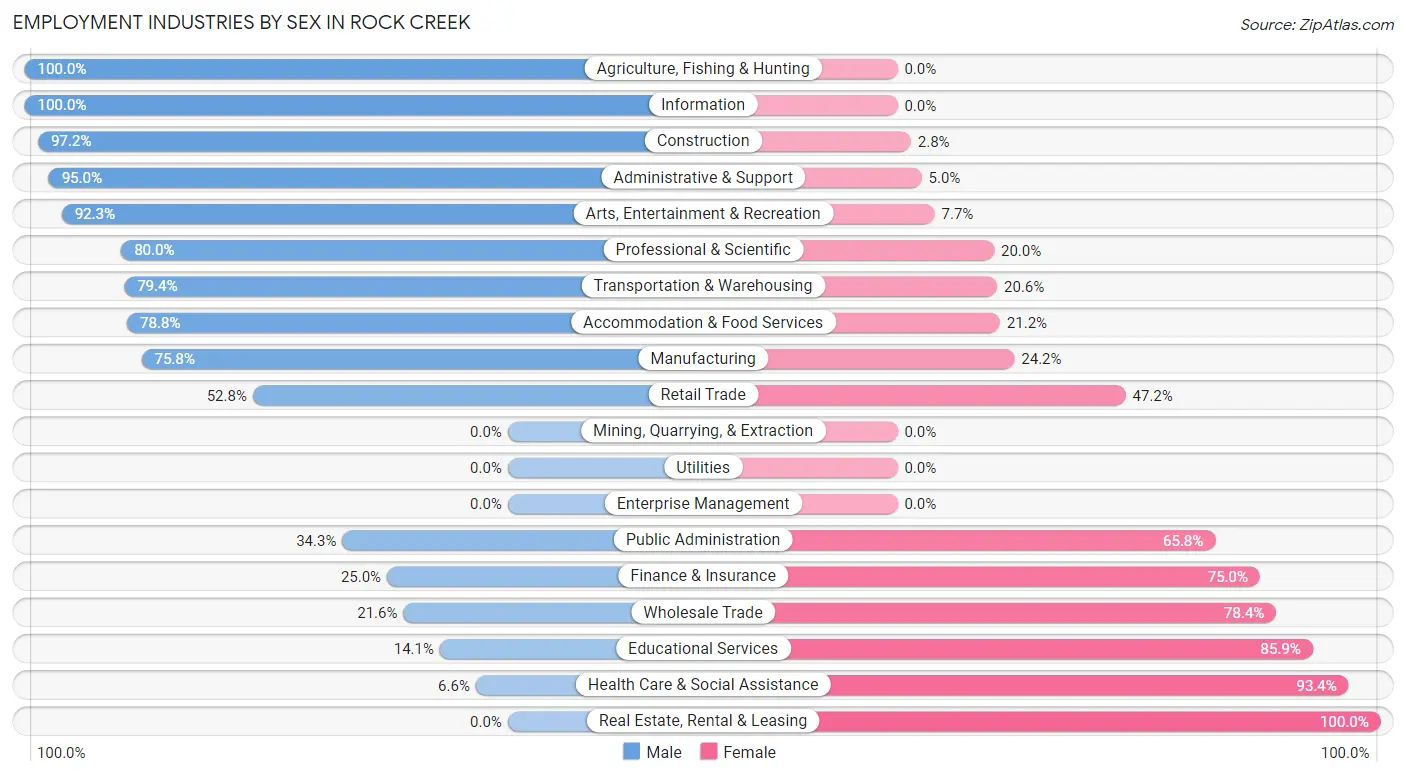
Employment Industries by Sex in Rock Creek
The Rock Creek industries that see more men than women are Agriculture, Fishing & Hunting (100.0%), Information (100.0%), and Construction (97.2%), whereas the industries that tend to have a higher number of women are Real Estate, Rental & Leasing (100.0%), Health Care & Social Assistance (93.4%), and Educational Services (85.9%).
| Industry | Male | Female |
| Agriculture, Fishing & Hunting | 12 (100.0%) | 0 (0.0%) |
| Mining, Quarrying, & Extraction | 0 (0.0%) | 0 (0.0%) |
| Construction | 105 (97.2%) | 3 (2.8%) |
| Manufacturing | 72 (75.8%) | 23 (24.2%) |
| Wholesale Trade | 8 (21.6%) | 29 (78.4%) |
| Retail Trade | 38 (52.8%) | 34 (47.2%) |
| Transportation & Warehousing | 50 (79.4%) | 13 (20.6%) |
| Utilities | 0 (0.0%) | 0 (0.0%) |
| Information | 15 (100.0%) | 0 (0.0%) |
| Finance & Insurance | 5 (25.0%) | 15 (75.0%) |
| Real Estate, Rental & Leasing | 0 (0.0%) | 9 (100.0%) |
| Professional & Scientific | 12 (80.0%) | 3 (20.0%) |
| Enterprise Management | 0 (0.0%) | 0 (0.0%) |
| Administrative & Support | 38 (95.0%) | 2 (5.0%) |
| Educational Services | 9 (14.1%) | 55 (85.9%) |
| Health Care & Social Assistance | 10 (6.6%) | 141 (93.4%) |
| Arts, Entertainment & Recreation | 48 (92.3%) | 4 (7.7%) |
| Accommodation & Food Services | 26 (78.8%) | 7 (21.2%) |
| Public Administration | 25 (34.3%) | 48 (65.7%) |
| Total | 478 (53.6%) | 414 (46.4%) |
Education in Rock Creek
School Enrollment in Rock Creek
The most common levels of schooling among the 389 students in Rock Creek are middle school (124 | 31.9%), high school (114 | 29.3%), and elementary school (58 | 14.9%).
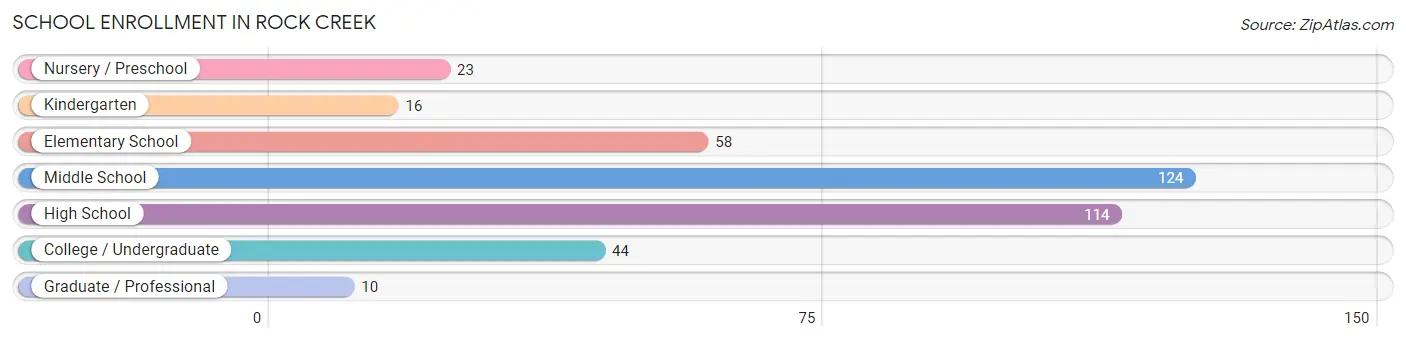
| School Level | # Students | % Students |
| Nursery / Preschool | 23 | 5.9% |
| Kindergarten | 16 | 4.1% |
| Elementary School | 58 | 14.9% |
| Middle School | 124 | 31.9% |
| High School | 114 | 29.3% |
| College / Undergraduate | 44 | 11.3% |
| Graduate / Professional | 10 | 2.6% |
| Total | 389 | 100.0% |
School Enrollment by Age by Funding Source in Rock Creek
Out of a total of 389 students who are enrolled in schools in Rock Creek, 49 (12.6%) attend a private institution, while the remaining 340 (87.4%) are enrolled in public schools. The age group of 35 years and over has the highest likelihood of being enrolled in private schools, with 13 (100.0% in the age bracket) enrolled. Conversely, the age group of 18 to 19 year olds has the lowest likelihood of being enrolled in a private school, with 19 (100.0% in the age bracket) attending a public institution.
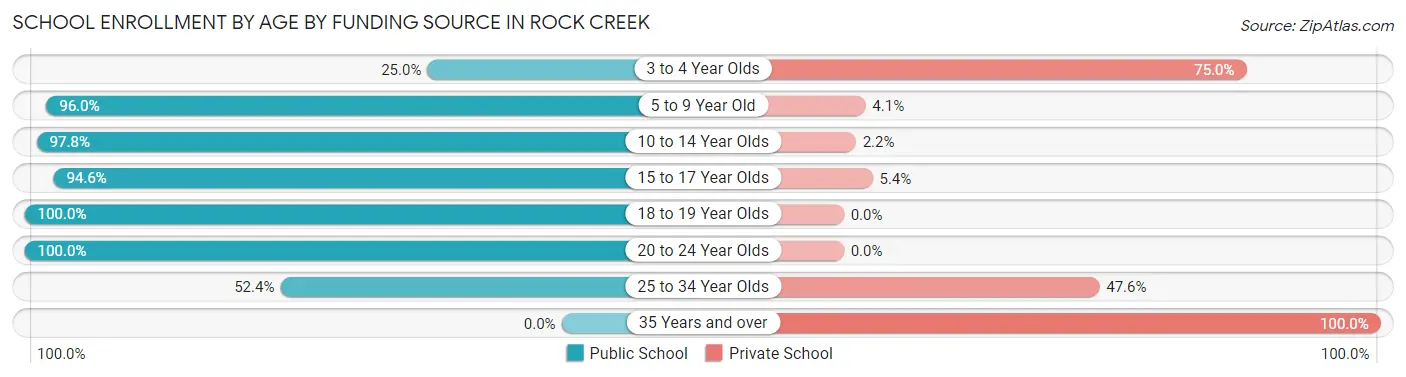
| Age Bracket | Public School | Private School |
| 3 to 4 Year Olds | 5 (25.0%) | 15 (75.0%) |
| 5 to 9 Year Old | 71 (96.0%) | 3 (4.1%) |
| 10 to 14 Year Olds | 131 (97.8%) | 3 (2.2%) |
| 15 to 17 Year Olds | 88 (94.6%) | 5 (5.4%) |
| 18 to 19 Year Olds | 19 (100.0%) | 0 (0.0%) |
| 20 to 24 Year Olds | 15 (100.0%) | 0 (0.0%) |
| 25 to 34 Year Olds | 11 (52.4%) | 10 (47.6%) |
| 35 Years and over | 0 (0.0%) | 13 (100.0%) |
| Total | 340 (87.4%) | 49 (12.6%) |
Educational Attainment by Field of Study in Rock Creek
Education (46 | 22.0%), business (35 | 16.8%), bio, nature & agricultural (34 | 16.3%), science & technology (31 | 14.8%), and arts & humanities (18 | 8.6%) are the most common fields of study among 209 individuals in Rock Creek who have obtained a bachelor's degree or higher.
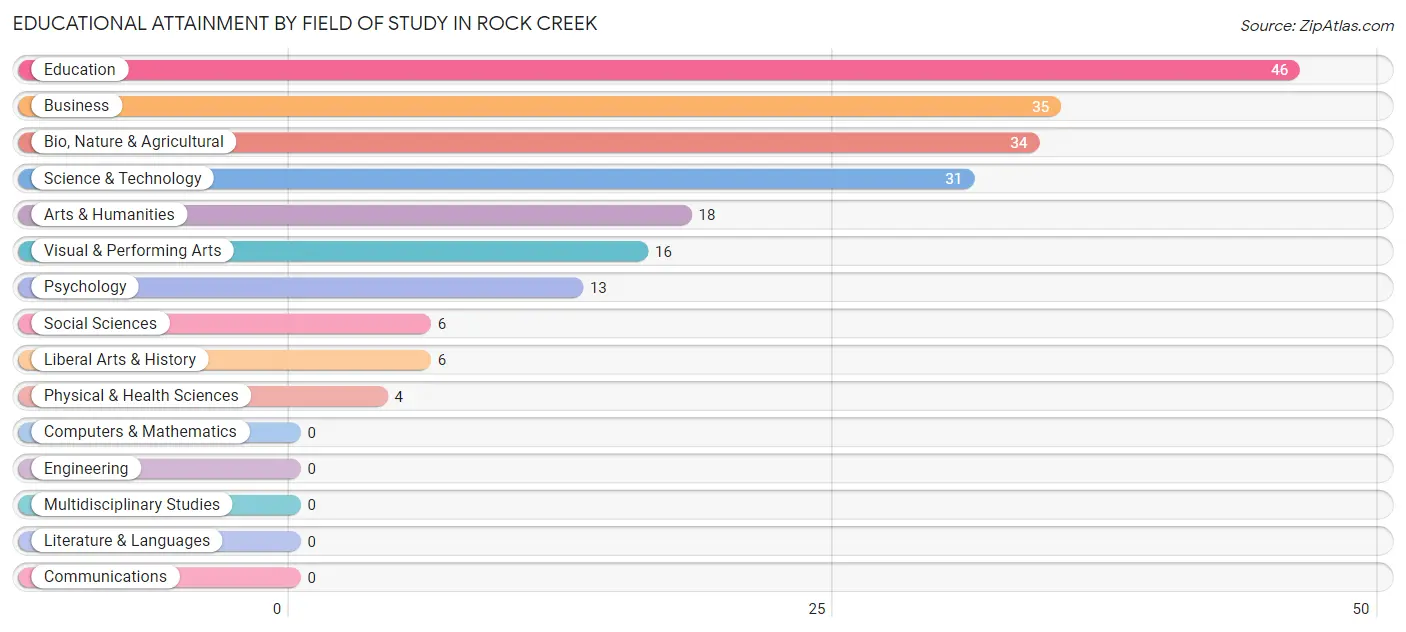
| Field of Study | # Graduates | % Graduates |
| Computers & Mathematics | 0 | 0.0% |
| Bio, Nature & Agricultural | 34 | 16.3% |
| Physical & Health Sciences | 4 | 1.9% |
| Psychology | 13 | 6.2% |
| Social Sciences | 6 | 2.9% |
| Engineering | 0 | 0.0% |
| Multidisciplinary Studies | 0 | 0.0% |
| Science & Technology | 31 | 14.8% |
| Business | 35 | 16.8% |
| Education | 46 | 22.0% |
| Literature & Languages | 0 | 0.0% |
| Liberal Arts & History | 6 | 2.9% |
| Visual & Performing Arts | 16 | 7.7% |
| Communications | 0 | 0.0% |
| Arts & Humanities | 18 | 8.6% |
| Total | 209 | 100.0% |
Transportation & Commute in Rock Creek
Vehicle Availability by Sex in Rock Creek
The most prevalent vehicle ownership categories in Rock Creek are males with 2 vehicles (157, accounting for 33.8%) and females with 2 vehicles (129, making up 38.8%).
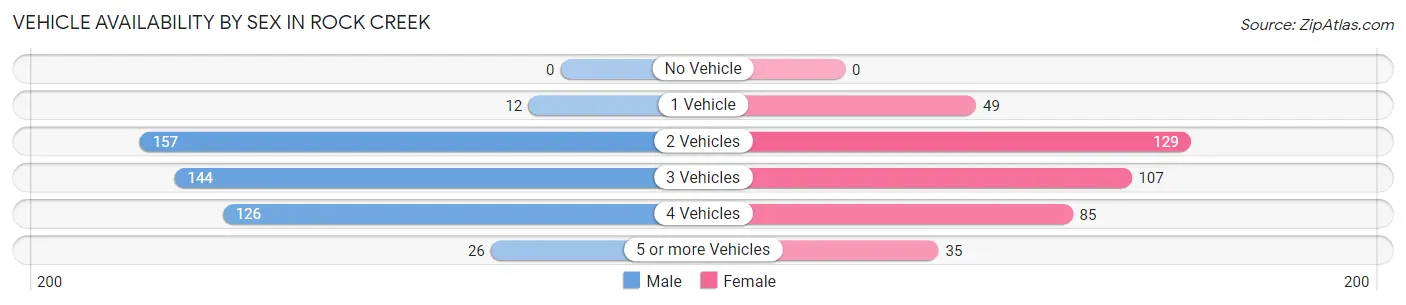
| Vehicles Available | Male | Female |
| No Vehicle | 0 (0.0%) | 0 (0.0%) |
| 1 Vehicle | 12 (2.6%) | 49 (12.1%) |
| 2 Vehicles | 157 (33.8%) | 129 (31.9%) |
| 3 Vehicles | 144 (31.0%) | 107 (26.4%) |
| 4 Vehicles | 126 (27.1%) | 85 (21.0%) |
| 5 or more Vehicles | 26 (5.6%) | 35 (8.6%) |
| Total | 465 (100.0%) | 405 (100.0%) |
Commute Time in Rock Creek
The most frequently occuring commute durations in Rock Creek are 15 to 19 minutes (160 commuters, 20.7%), 60 to 89 minutes (137 commuters, 17.7%), and 10 to 14 minutes (99 commuters, 12.8%).
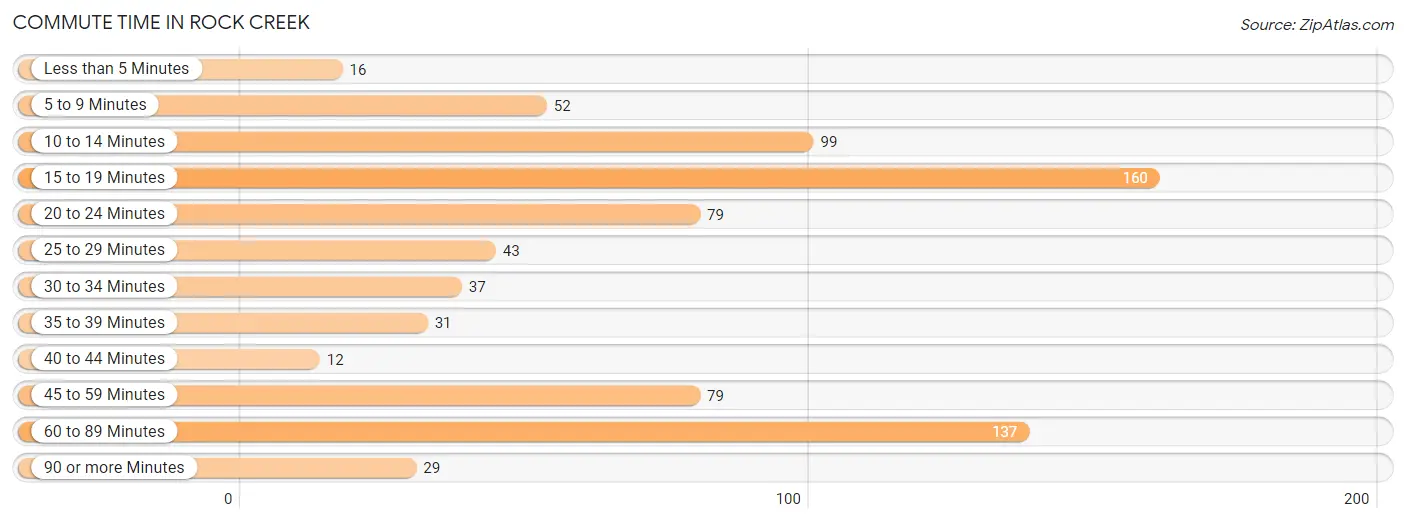
| Commute Time | # Commuters | % Commuters |
| Less than 5 Minutes | 16 | 2.1% |
| 5 to 9 Minutes | 52 | 6.7% |
| 10 to 14 Minutes | 99 | 12.8% |
| 15 to 19 Minutes | 160 | 20.7% |
| 20 to 24 Minutes | 79 | 10.2% |
| 25 to 29 Minutes | 43 | 5.6% |
| 30 to 34 Minutes | 37 | 4.8% |
| 35 to 39 Minutes | 31 | 4.0% |
| 40 to 44 Minutes | 12 | 1.5% |
| 45 to 59 Minutes | 79 | 10.2% |
| 60 to 89 Minutes | 137 | 17.7% |
| 90 or more Minutes | 29 | 3.7% |
Commute Time by Sex in Rock Creek
The most common commute times in Rock Creek are 15 to 19 minutes (101 commuters, 23.8%) for males and 20 to 24 minutes (64 commuters, 18.3%) for females.
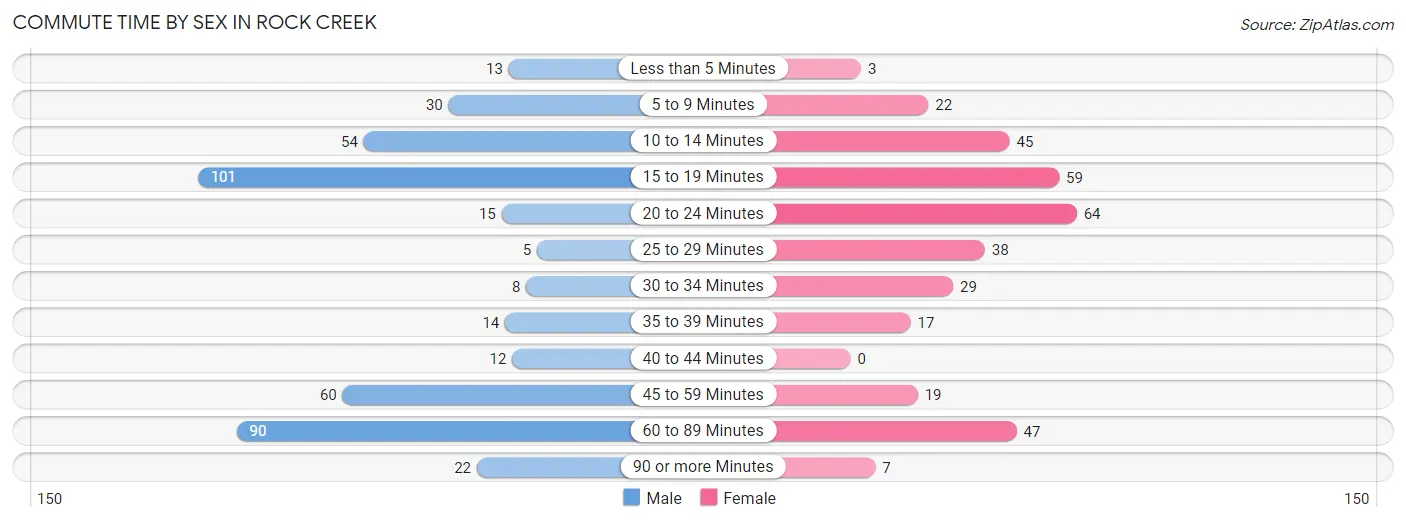
| Commute Time | Male | Female |
| Less than 5 Minutes | 13 (3.1%) | 3 (0.9%) |
| 5 to 9 Minutes | 30 (7.1%) | 22 (6.3%) |
| 10 to 14 Minutes | 54 (12.7%) | 45 (12.9%) |
| 15 to 19 Minutes | 101 (23.8%) | 59 (16.9%) |
| 20 to 24 Minutes | 15 (3.5%) | 64 (18.3%) |
| 25 to 29 Minutes | 5 (1.2%) | 38 (10.9%) |
| 30 to 34 Minutes | 8 (1.9%) | 29 (8.3%) |
| 35 to 39 Minutes | 14 (3.3%) | 17 (4.9%) |
| 40 to 44 Minutes | 12 (2.8%) | 0 (0.0%) |
| 45 to 59 Minutes | 60 (14.1%) | 19 (5.4%) |
| 60 to 89 Minutes | 90 (21.2%) | 47 (13.4%) |
| 90 or more Minutes | 22 (5.2%) | 7 (2.0%) |
Time of Departure to Work by Sex in Rock Creek
The most frequent times of departure to work in Rock Creek are 12:00 AM to 4:59 AM (64, 15.1%) for males and 7:30 AM to 7:59 AM (89, 25.4%) for females.
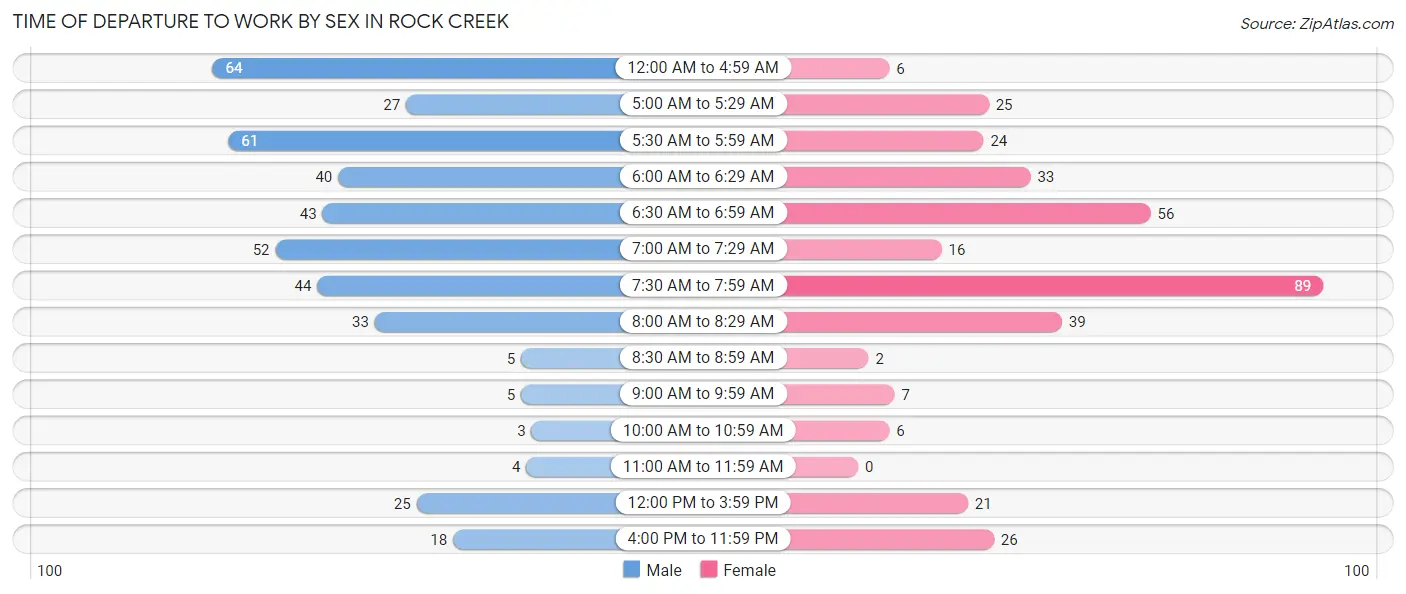
| Time of Departure | Male | Female |
| 12:00 AM to 4:59 AM | 64 (15.1%) | 6 (1.7%) |
| 5:00 AM to 5:29 AM | 27 (6.4%) | 25 (7.1%) |
| 5:30 AM to 5:59 AM | 61 (14.4%) | 24 (6.9%) |
| 6:00 AM to 6:29 AM | 40 (9.4%) | 33 (9.4%) |
| 6:30 AM to 6:59 AM | 43 (10.1%) | 56 (16.0%) |
| 7:00 AM to 7:29 AM | 52 (12.3%) | 16 (4.6%) |
| 7:30 AM to 7:59 AM | 44 (10.4%) | 89 (25.4%) |
| 8:00 AM to 8:29 AM | 33 (7.8%) | 39 (11.1%) |
| 8:30 AM to 8:59 AM | 5 (1.2%) | 2 (0.6%) |
| 9:00 AM to 9:59 AM | 5 (1.2%) | 7 (2.0%) |
| 10:00 AM to 10:59 AM | 3 (0.7%) | 6 (1.7%) |
| 11:00 AM to 11:59 AM | 4 (0.9%) | 0 (0.0%) |
| 12:00 PM to 3:59 PM | 25 (5.9%) | 21 (6.0%) |
| 4:00 PM to 11:59 PM | 18 (4.3%) | 26 (7.4%) |
| Total | 424 (100.0%) | 350 (100.0%) |
Housing Occupancy in Rock Creek
Occupancy by Ownership in Rock Creek
Of the total 567 dwellings in Rock Creek, owner-occupied units account for 512 (90.3%), while renter-occupied units make up 55 (9.7%).
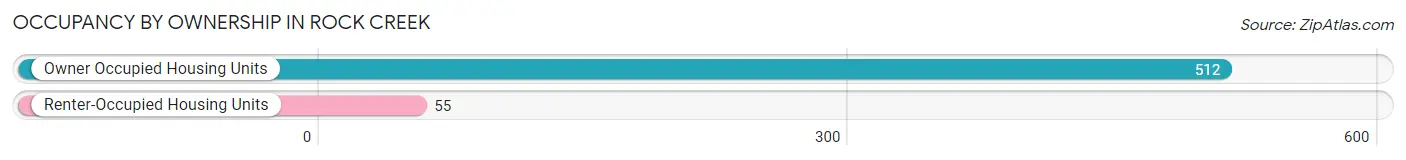
| Occupancy | # Housing Units | % Housing Units |
| Owner Occupied Housing Units | 512 | 90.3% |
| Renter-Occupied Housing Units | 55 | 9.7% |
| Total Occupied Housing Units | 567 | 100.0% |
Occupancy by Household Size in Rock Creek
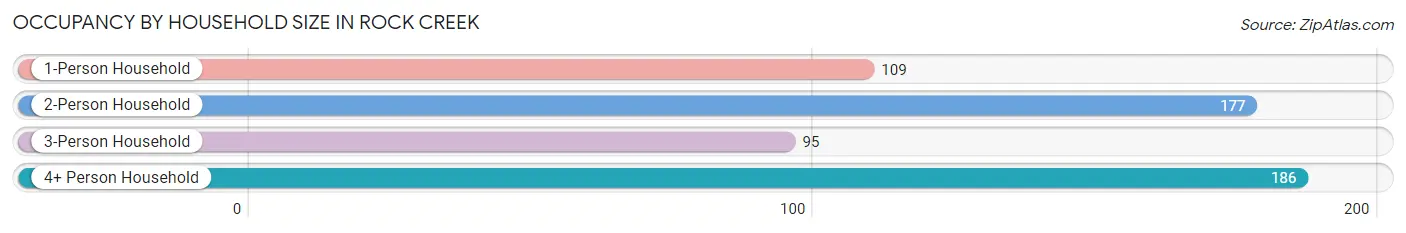
| Household Size | # Housing Units | % Housing Units |
| 1-Person Household | 109 | 19.2% |
| 2-Person Household | 177 | 31.2% |
| 3-Person Household | 95 | 16.8% |
| 4+ Person Household | 186 | 32.8% |
| Total Housing Units | 567 | 100.0% |
Occupancy by Ownership by Household Size in Rock Creek
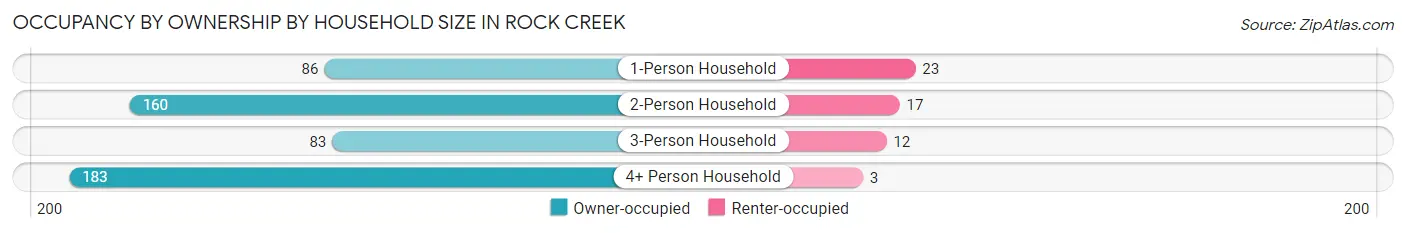
| Household Size | Owner-occupied | Renter-occupied |
| 1-Person Household | 86 (78.9%) | 23 (21.1%) |
| 2-Person Household | 160 (90.4%) | 17 (9.6%) |
| 3-Person Household | 83 (87.4%) | 12 (12.6%) |
| 4+ Person Household | 183 (98.4%) | 3 (1.6%) |
| Total Housing Units | 512 (90.3%) | 55 (9.7%) |
Occupancy by Educational Attainment in Rock Creek
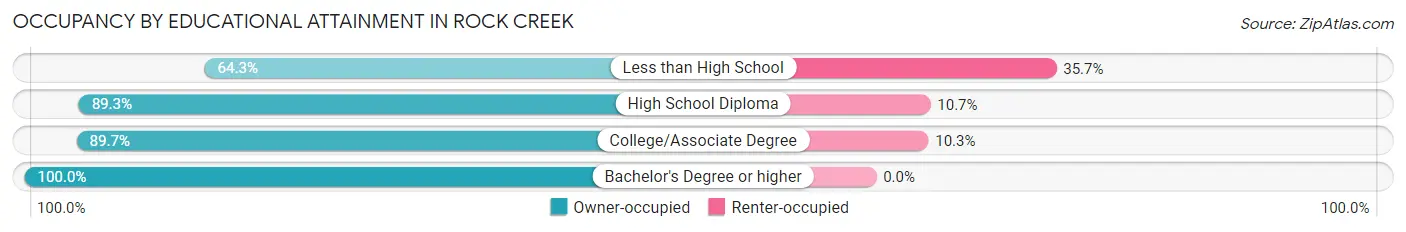
| Household Size | Owner-occupied | Renter-occupied |
| Less than High School | 18 (64.3%) | 10 (35.7%) |
| High School Diploma | 216 (89.3%) | 26 (10.7%) |
| College/Associate Degree | 165 (89.7%) | 19 (10.3%) |
| Bachelor's Degree or higher | 113 (100.0%) | 0 (0.0%) |
Occupancy by Age of Householder in Rock Creek
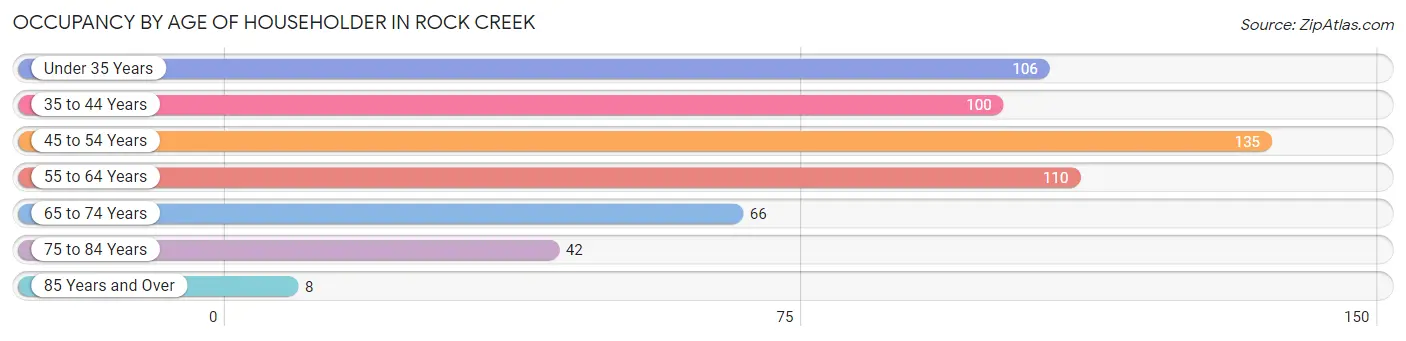
| Age Bracket | # Households | % Households |
| Under 35 Years | 106 | 18.7% |
| 35 to 44 Years | 100 | 17.6% |
| 45 to 54 Years | 135 | 23.8% |
| 55 to 64 Years | 110 | 19.4% |
| 65 to 74 Years | 66 | 11.6% |
| 75 to 84 Years | 42 | 7.4% |
| 85 Years and Over | 8 | 1.4% |
| Total | 567 | 100.0% |
Housing Finances in Rock Creek
Median Income by Occupancy in Rock Creek
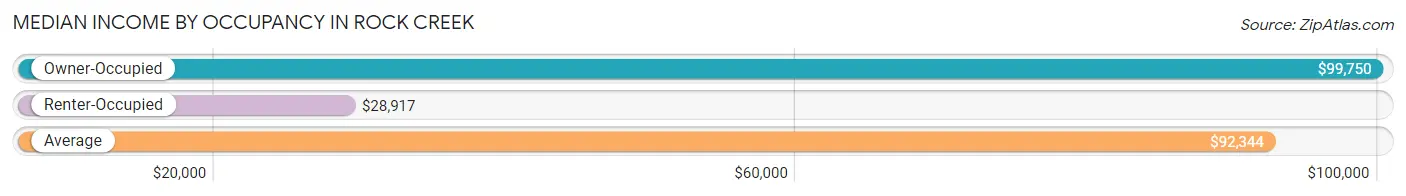
| Occupancy Type | # Households | Median Income |
| Owner-Occupied | 512 (90.3%) | $99,750 |
| Renter-Occupied | 55 (9.7%) | $28,917 |
| Average | 567 (100.0%) | $92,344 |
Occupancy by Householder Income Bracket in Rock Creek
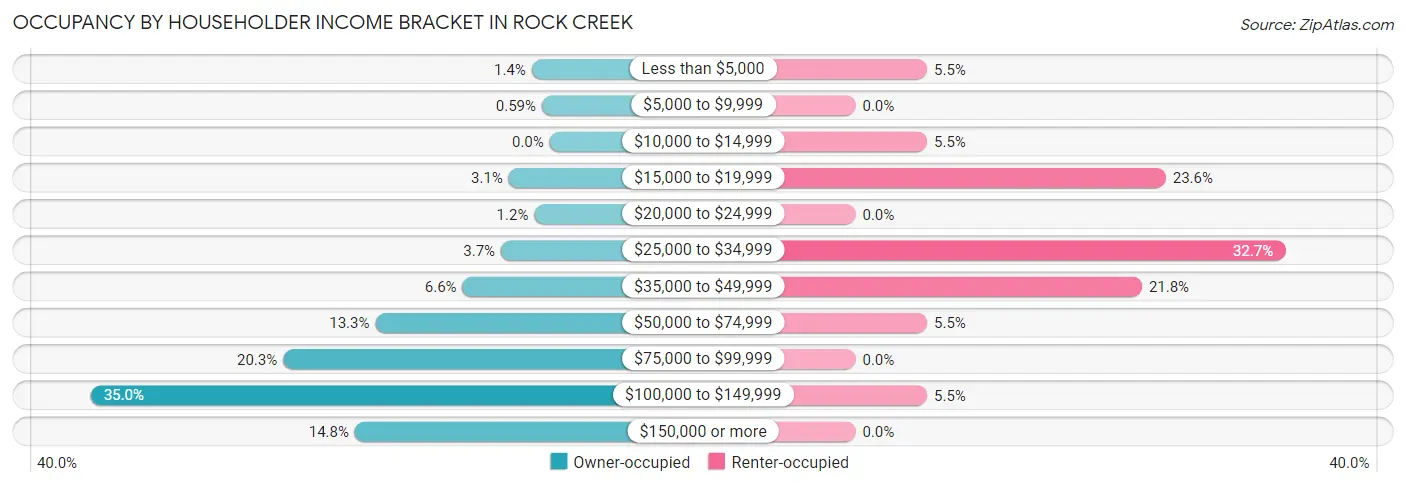
| Income Bracket | Owner-occupied | Renter-occupied |
| Less than $5,000 | 7 (1.4%) | 3 (5.4%) |
| $5,000 to $9,999 | 3 (0.6%) | 0 (0.0%) |
| $10,000 to $14,999 | 0 (0.0%) | 3 (5.4%) |
| $15,000 to $19,999 | 16 (3.1%) | 13 (23.6%) |
| $20,000 to $24,999 | 6 (1.2%) | 0 (0.0%) |
| $25,000 to $34,999 | 19 (3.7%) | 18 (32.7%) |
| $35,000 to $49,999 | 34 (6.6%) | 12 (21.8%) |
| $50,000 to $74,999 | 68 (13.3%) | 3 (5.4%) |
| $75,000 to $99,999 | 104 (20.3%) | 0 (0.0%) |
| $100,000 to $149,999 | 179 (35.0%) | 3 (5.4%) |
| $150,000 or more | 76 (14.8%) | 0 (0.0%) |
| Total | 512 (100.0%) | 55 (100.0%) |
Monthly Housing Cost Tiers in Rock Creek
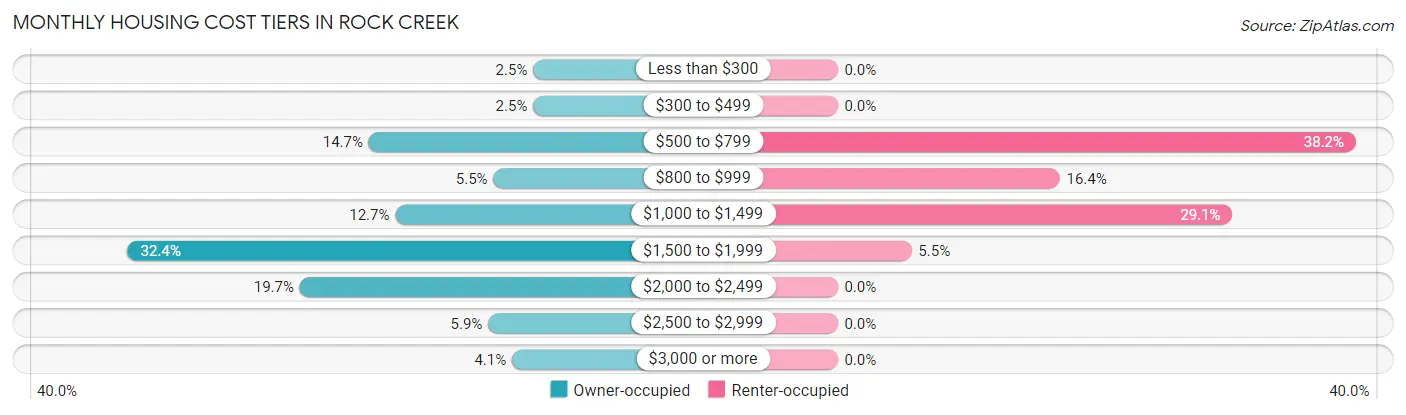
| Monthly Cost | Owner-occupied | Renter-occupied |
| Less than $300 | 13 (2.5%) | 0 (0.0%) |
| $300 to $499 | 13 (2.5%) | 0 (0.0%) |
| $500 to $799 | 75 (14.6%) | 21 (38.2%) |
| $800 to $999 | 28 (5.5%) | 9 (16.4%) |
| $1,000 to $1,499 | 65 (12.7%) | 16 (29.1%) |
| $1,500 to $1,999 | 166 (32.4%) | 3 (5.4%) |
| $2,000 to $2,499 | 101 (19.7%) | 0 (0.0%) |
| $2,500 to $2,999 | 30 (5.9%) | 0 (0.0%) |
| $3,000 or more | 21 (4.1%) | 0 (0.0%) |
| Total | 512 (100.0%) | 55 (100.0%) |
Physical Housing Characteristics in Rock Creek
Housing Structures in Rock Creek
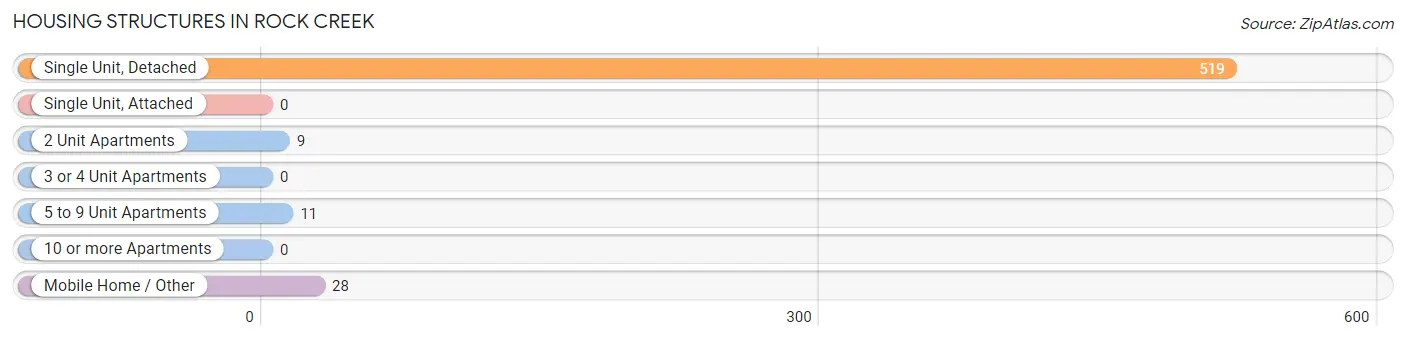
| Structure Type | # Housing Units | % Housing Units |
| Single Unit, Detached | 519 | 91.5% |
| Single Unit, Attached | 0 | 0.0% |
| 2 Unit Apartments | 9 | 1.6% |
| 3 or 4 Unit Apartments | 0 | 0.0% |
| 5 to 9 Unit Apartments | 11 | 1.9% |
| 10 or more Apartments | 0 | 0.0% |
| Mobile Home / Other | 28 | 4.9% |
| Total | 567 | 100.0% |
Housing Structures by Occupancy in Rock Creek
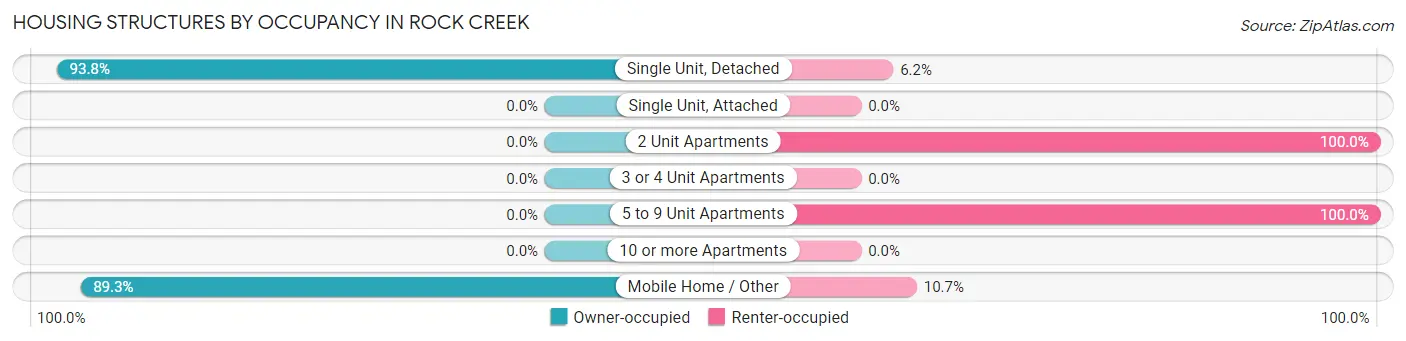
| Structure Type | Owner-occupied | Renter-occupied |
| Single Unit, Detached | 487 (93.8%) | 32 (6.2%) |
| Single Unit, Attached | 0 (0.0%) | 0 (0.0%) |
| 2 Unit Apartments | 0 (0.0%) | 9 (100.0%) |
| 3 or 4 Unit Apartments | 0 (0.0%) | 0 (0.0%) |
| 5 to 9 Unit Apartments | 0 (0.0%) | 11 (100.0%) |
| 10 or more Apartments | 0 (0.0%) | 0 (0.0%) |
| Mobile Home / Other | 25 (89.3%) | 3 (10.7%) |
| Total | 512 (90.3%) | 55 (9.7%) |
Housing Structures by Number of Rooms in Rock Creek
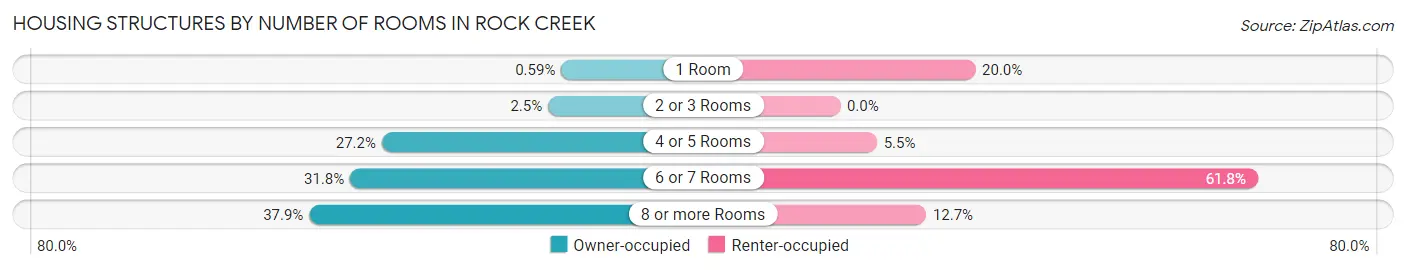
| Number of Rooms | Owner-occupied | Renter-occupied |
| 1 Room | 3 (0.6%) | 11 (20.0%) |
| 2 or 3 Rooms | 13 (2.5%) | 0 (0.0%) |
| 4 or 5 Rooms | 139 (27.2%) | 3 (5.4%) |
| 6 or 7 Rooms | 163 (31.8%) | 34 (61.8%) |
| 8 or more Rooms | 194 (37.9%) | 7 (12.7%) |
| Total | 512 (100.0%) | 55 (100.0%) |
Housing Structure by Heating Type in Rock Creek
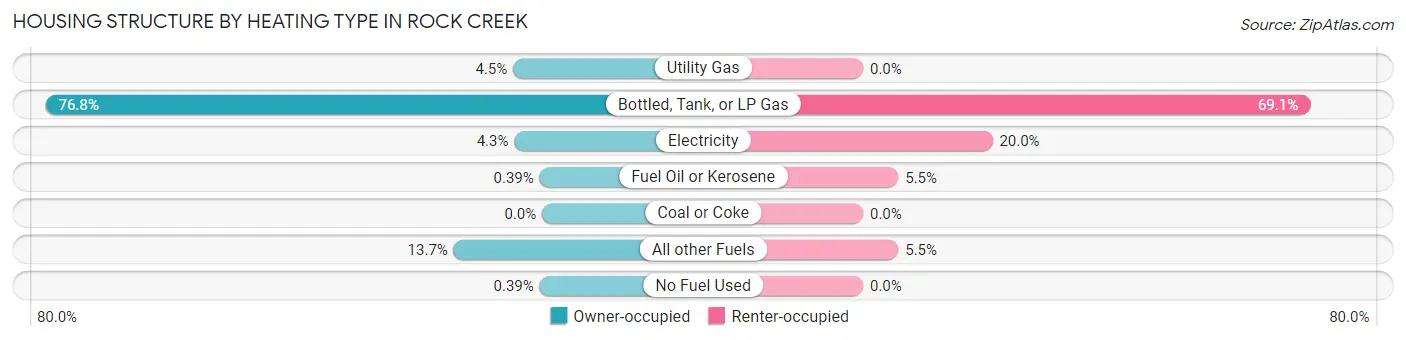
| Heating Type | Owner-occupied | Renter-occupied |
| Utility Gas | 23 (4.5%) | 0 (0.0%) |
| Bottled, Tank, or LP Gas | 393 (76.8%) | 38 (69.1%) |
| Electricity | 22 (4.3%) | 11 (20.0%) |
| Fuel Oil or Kerosene | 2 (0.4%) | 3 (5.4%) |
| Coal or Coke | 0 (0.0%) | 0 (0.0%) |
| All other Fuels | 70 (13.7%) | 3 (5.4%) |
| No Fuel Used | 2 (0.4%) | 0 (0.0%) |
| Total | 512 (100.0%) | 55 (100.0%) |
Household Vehicle Usage in Rock Creek
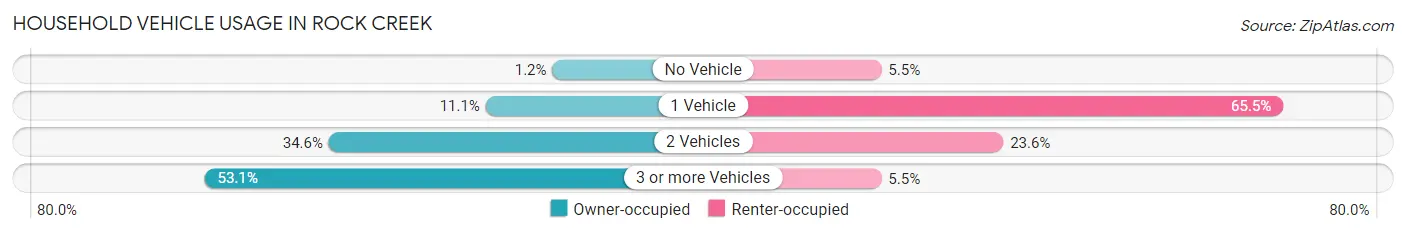
| Vehicles per Household | Owner-occupied | Renter-occupied |
| No Vehicle | 6 (1.2%) | 3 (5.4%) |
| 1 Vehicle | 57 (11.1%) | 36 (65.4%) |
| 2 Vehicles | 177 (34.6%) | 13 (23.6%) |
| 3 or more Vehicles | 272 (53.1%) | 3 (5.4%) |
| Total | 512 (100.0%) | 55 (100.0%) |
Real Estate & Mortgages in Rock Creek
Real Estate and Mortgage Overview in Rock Creek
| Characteristic | Without Mortgage | With Mortgage |
| Housing Units | 125 | 387 |
| Median Property Value | $243,800 | $288,200 |
| Median Household Income | $62,083 | $67 |
| Monthly Housing Costs | $617 | $18 |
| Real Estate Taxes | $2,266 | $3 |
Property Value by Mortgage Status in Rock Creek
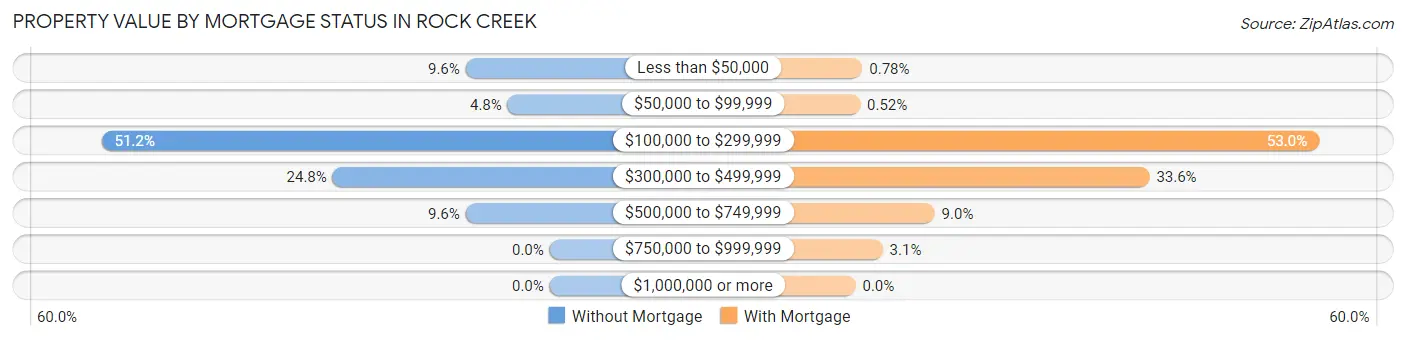
| Property Value | Without Mortgage | With Mortgage |
| Less than $50,000 | 12 (9.6%) | 3 (0.8%) |
| $50,000 to $99,999 | 6 (4.8%) | 2 (0.5%) |
| $100,000 to $299,999 | 64 (51.2%) | 205 (53.0%) |
| $300,000 to $499,999 | 31 (24.8%) | 130 (33.6%) |
| $500,000 to $749,999 | 12 (9.6%) | 35 (9.0%) |
| $750,000 to $999,999 | 0 (0.0%) | 12 (3.1%) |
| $1,000,000 or more | 0 (0.0%) | 0 (0.0%) |
| Total | 125 (100.0%) | 387 (100.0%) |
Household Income by Mortgage Status in Rock Creek
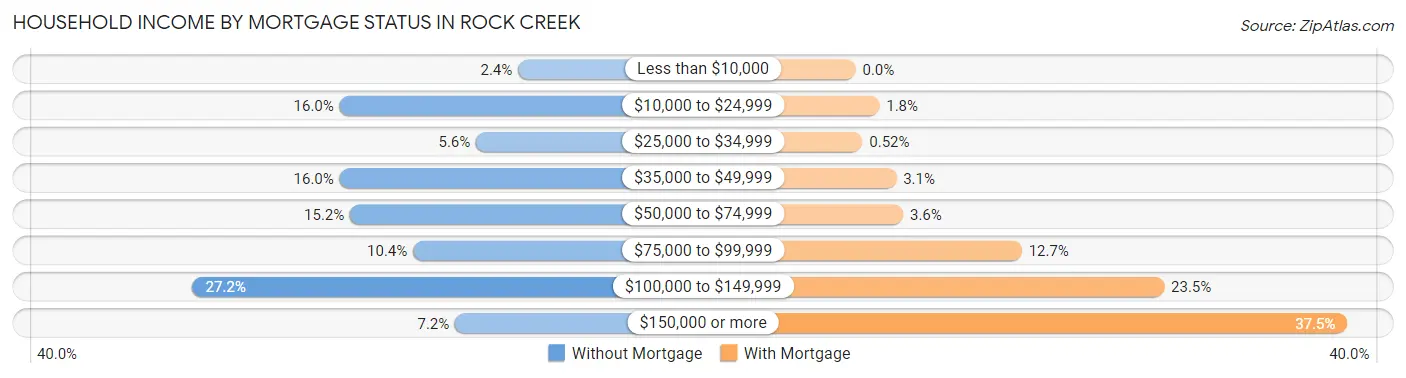
| Household Income | Without Mortgage | With Mortgage |
| Less than $10,000 | 3 (2.4%) | 0 (0.0%) |
| $10,000 to $24,999 | 20 (16.0%) | 7 (1.8%) |
| $25,000 to $34,999 | 7 (5.6%) | 2 (0.5%) |
| $35,000 to $49,999 | 20 (16.0%) | 12 (3.1%) |
| $50,000 to $74,999 | 19 (15.2%) | 14 (3.6%) |
| $75,000 to $99,999 | 13 (10.4%) | 49 (12.7%) |
| $100,000 to $149,999 | 34 (27.2%) | 91 (23.5%) |
| $150,000 or more | 9 (7.2%) | 145 (37.5%) |
| Total | 125 (100.0%) | 387 (100.0%) |
Property Value to Household Income Ratio in Rock Creek
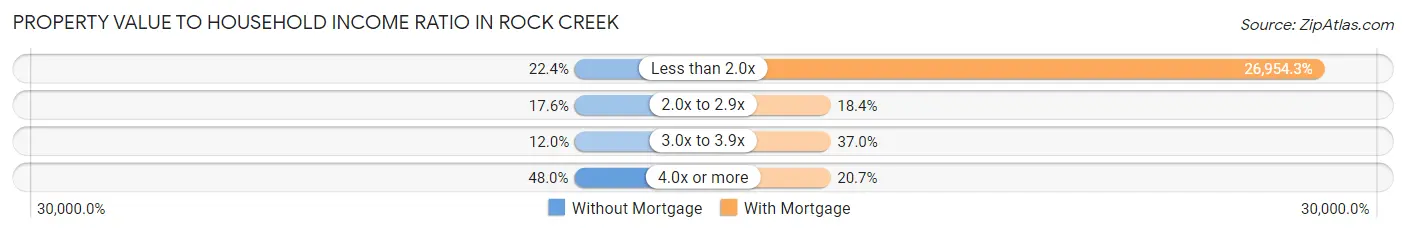
| Value-to-Income Ratio | Without Mortgage | With Mortgage |
| Less than 2.0x | 28 (22.4%) | 104,313 (26,954.3%) |
| 2.0x to 2.9x | 22 (17.6%) | 71 (18.3%) |
| 3.0x to 3.9x | 15 (12.0%) | 143 (36.9%) |
| 4.0x or more | 60 (48.0%) | 80 (20.7%) |
| Total | 125 (100.0%) | 387 (100.0%) |
Real Estate Taxes by Mortgage Status in Rock Creek
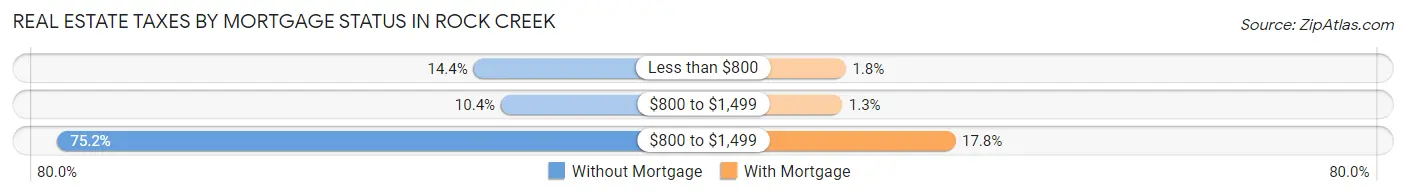
| Property Taxes | Without Mortgage | With Mortgage |
| Less than $800 | 18 (14.4%) | 7 (1.8%) |
| $800 to $1,499 | 13 (10.4%) | 5 (1.3%) |
| $800 to $1,499 | 94 (75.2%) | 69 (17.8%) |
| Total | 125 (100.0%) | 387 (100.0%) |
Health & Disability in Rock Creek
Health Insurance Coverage by Age in Rock Creek
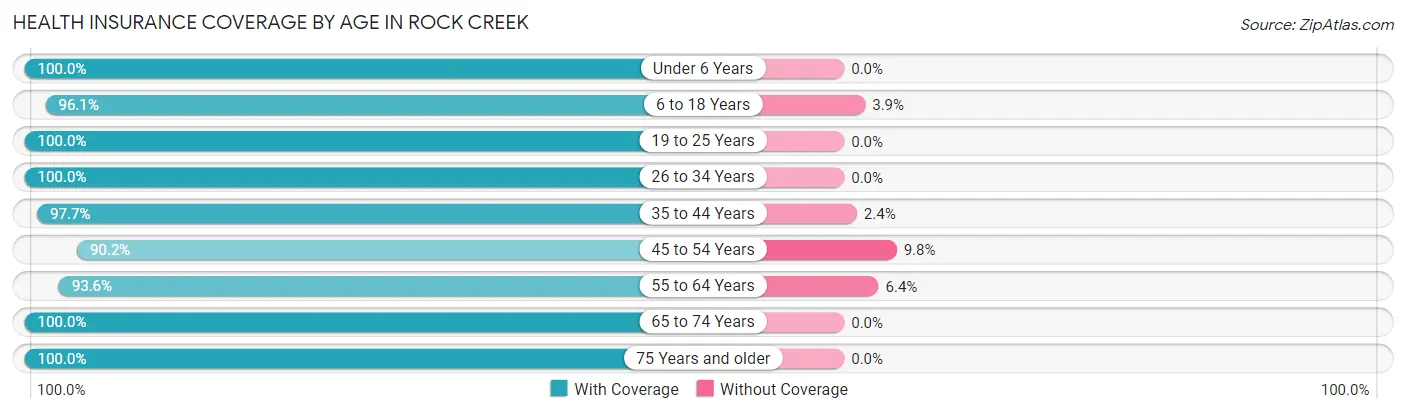
| Age Bracket | With Coverage | Without Coverage |
| Under 6 Years | 216 (100.0%) | 0 (0.0%) |
| 6 to 18 Years | 295 (96.1%) | 12 (3.9%) |
| 19 to 25 Years | 54 (100.0%) | 0 (0.0%) |
| 26 to 34 Years | 199 (100.0%) | 0 (0.0%) |
| 35 to 44 Years | 249 (97.7%) | 6 (2.4%) |
| 45 to 54 Years | 231 (90.2%) | 25 (9.8%) |
| 55 to 64 Years | 205 (93.6%) | 14 (6.4%) |
| 65 to 74 Years | 119 (100.0%) | 0 (0.0%) |
| 75 Years and older | 64 (100.0%) | 0 (0.0%) |
| Total | 1,632 (96.6%) | 57 (3.4%) |
Health Insurance Coverage by Citizenship Status in Rock Creek

| Citizenship Status | With Coverage | Without Coverage |
| Native Born | 216 (100.0%) | 0 (0.0%) |
| Foreign Born, Citizen | 295 (96.1%) | 12 (3.9%) |
| Foreign Born, not a Citizen | 54 (100.0%) | 0 (0.0%) |
Health Insurance Coverage by Household Income in Rock Creek
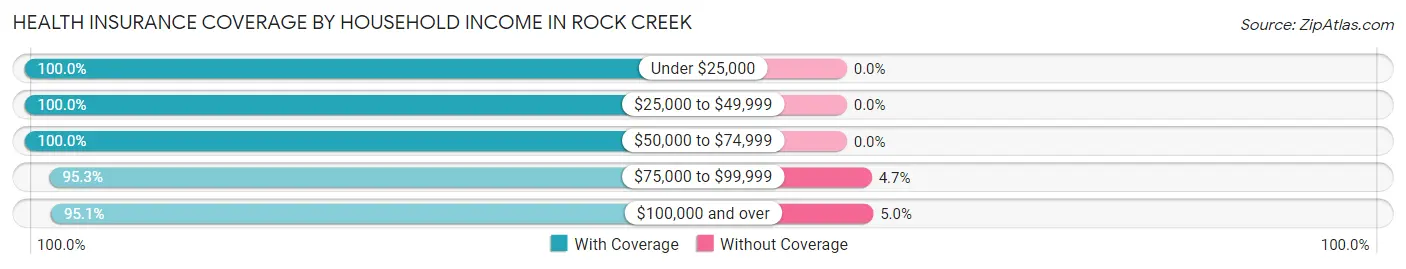
| Household Income | With Coverage | Without Coverage |
| Under $25,000 | 70 (100.0%) | 0 (0.0%) |
| $25,000 to $49,999 | 205 (100.0%) | 0 (0.0%) |
| $50,000 to $74,999 | 236 (100.0%) | 0 (0.0%) |
| $75,000 to $99,999 | 245 (95.3%) | 12 (4.7%) |
| $100,000 and over | 865 (95.1%) | 45 (5.0%) |
Public vs Private Health Insurance Coverage by Age in Rock Creek
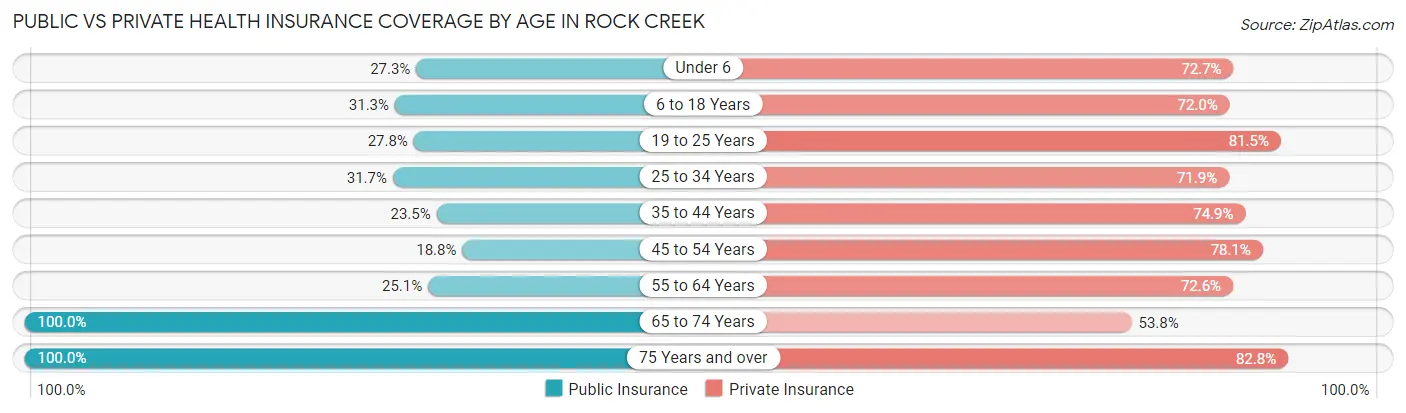
| Age Bracket | Public Insurance | Private Insurance |
| Under 6 | 59 (27.3%) | 157 (72.7%) |
| 6 to 18 Years | 96 (31.3%) | 221 (72.0%) |
| 19 to 25 Years | 15 (27.8%) | 44 (81.5%) |
| 25 to 34 Years | 63 (31.7%) | 143 (71.9%) |
| 35 to 44 Years | 60 (23.5%) | 191 (74.9%) |
| 45 to 54 Years | 48 (18.8%) | 200 (78.1%) |
| 55 to 64 Years | 55 (25.1%) | 159 (72.6%) |
| 65 to 74 Years | 119 (100.0%) | 64 (53.8%) |
| 75 Years and over | 64 (100.0%) | 53 (82.8%) |
| Total | 579 (34.3%) | 1,232 (72.9%) |
Disability Status by Sex by Age in Rock Creek
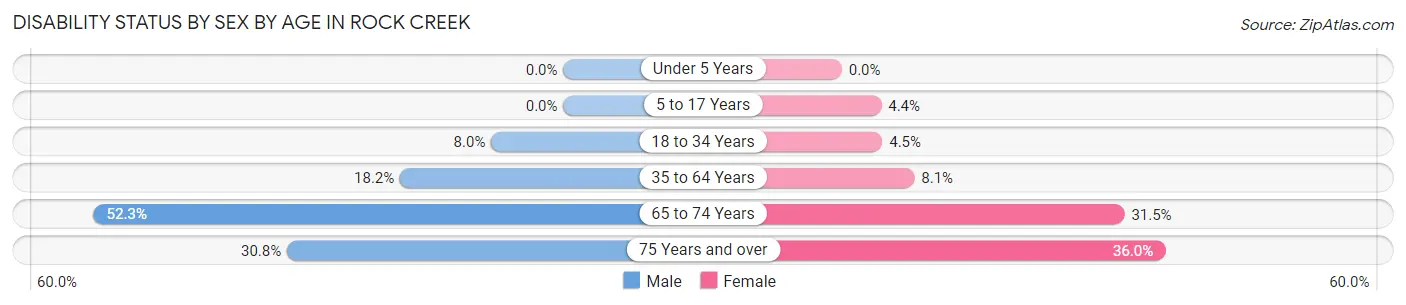
| Age Bracket | Male | Female |
| Under 5 Years | 0 (0.0%) | 0 (0.0%) |
| 5 to 17 Years | 0 (0.0%) | 7 (4.4%) |
| 18 to 34 Years | 11 (8.0%) | 6 (4.5%) |
| 35 to 64 Years | 72 (18.2%) | 27 (8.1%) |
| 65 to 74 Years | 34 (52.3%) | 17 (31.5%) |
| 75 Years and over | 12 (30.8%) | 9 (36.0%) |
Disability Class by Sex by Age in Rock Creek
Disability Class: Hearing Difficulty
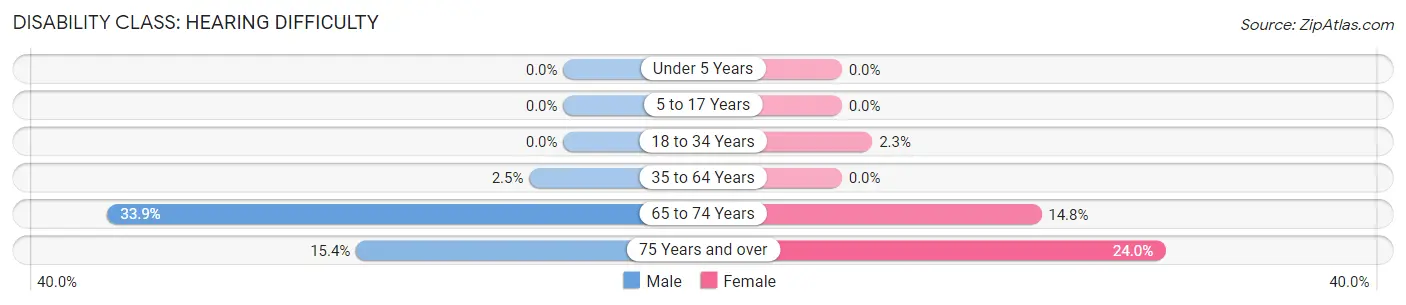
| Age Bracket | Male | Female |
| Under 5 Years | 0 (0.0%) | 0 (0.0%) |
| 5 to 17 Years | 0 (0.0%) | 0 (0.0%) |
| 18 to 34 Years | 0 (0.0%) | 3 (2.3%) |
| 35 to 64 Years | 10 (2.5%) | 0 (0.0%) |
| 65 to 74 Years | 22 (33.9%) | 8 (14.8%) |
| 75 Years and over | 6 (15.4%) | 6 (24.0%) |
Disability Class: Vision Difficulty
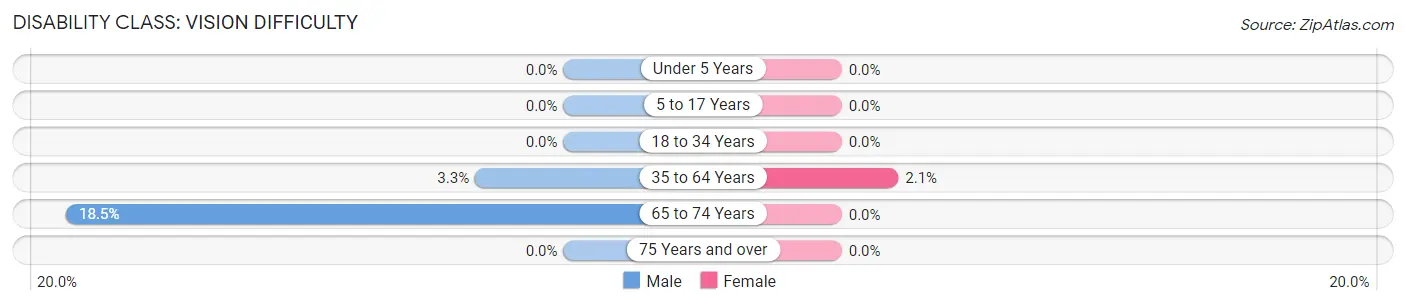
| Age Bracket | Male | Female |
| Under 5 Years | 0 (0.0%) | 0 (0.0%) |
| 5 to 17 Years | 0 (0.0%) | 0 (0.0%) |
| 18 to 34 Years | 0 (0.0%) | 0 (0.0%) |
| 35 to 64 Years | 13 (3.3%) | 7 (2.1%) |
| 65 to 74 Years | 12 (18.5%) | 0 (0.0%) |
| 75 Years and over | 0 (0.0%) | 0 (0.0%) |
Disability Class: Cognitive Difficulty
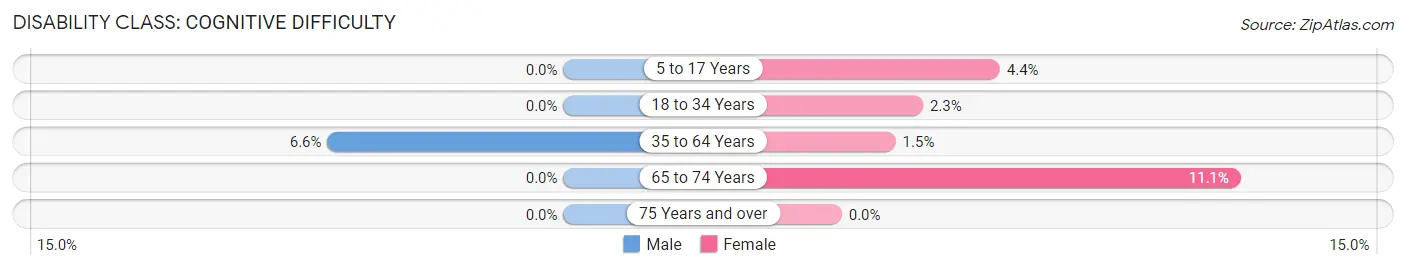
| Age Bracket | Male | Female |
| 5 to 17 Years | 0 (0.0%) | 7 (4.4%) |
| 18 to 34 Years | 0 (0.0%) | 3 (2.3%) |
| 35 to 64 Years | 26 (6.6%) | 5 (1.5%) |
| 65 to 74 Years | 0 (0.0%) | 6 (11.1%) |
| 75 Years and over | 0 (0.0%) | 0 (0.0%) |
Disability Class: Ambulatory Difficulty
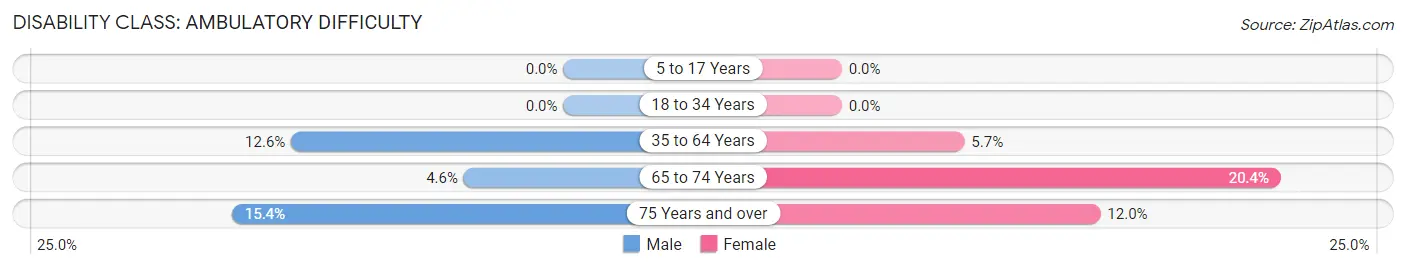
| Age Bracket | Male | Female |
| 5 to 17 Years | 0 (0.0%) | 0 (0.0%) |
| 18 to 34 Years | 0 (0.0%) | 0 (0.0%) |
| 35 to 64 Years | 50 (12.6%) | 19 (5.7%) |
| 65 to 74 Years | 3 (4.6%) | 11 (20.4%) |
| 75 Years and over | 6 (15.4%) | 3 (12.0%) |
Disability Class: Self-Care Difficulty
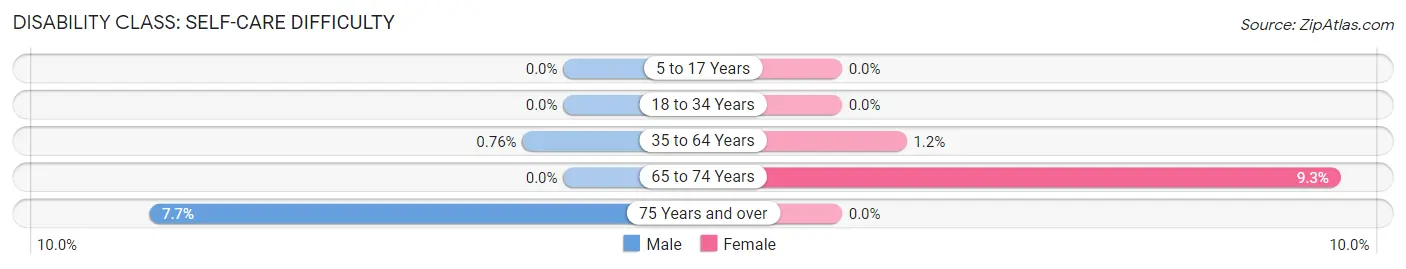
| Age Bracket | Male | Female |
| 5 to 17 Years | 0 (0.0%) | 0 (0.0%) |
| 18 to 34 Years | 0 (0.0%) | 0 (0.0%) |
| 35 to 64 Years | 3 (0.8%) | 4 (1.2%) |
| 65 to 74 Years | 0 (0.0%) | 5 (9.3%) |
| 75 Years and over | 3 (7.7%) | 0 (0.0%) |
Technology Access in Rock Creek
Computing Device Access in Rock Creek
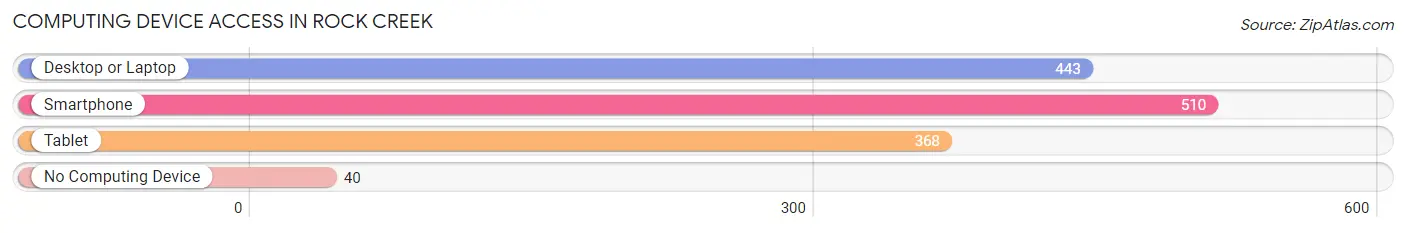
| Device Type | # Households | % Households |
| Desktop or Laptop | 443 | 78.1% |
| Smartphone | 510 | 89.9% |
| Tablet | 368 | 64.9% |
| No Computing Device | 40 | 7.0% |
| Total | 567 | 100.0% |
Internet Access in Rock Creek
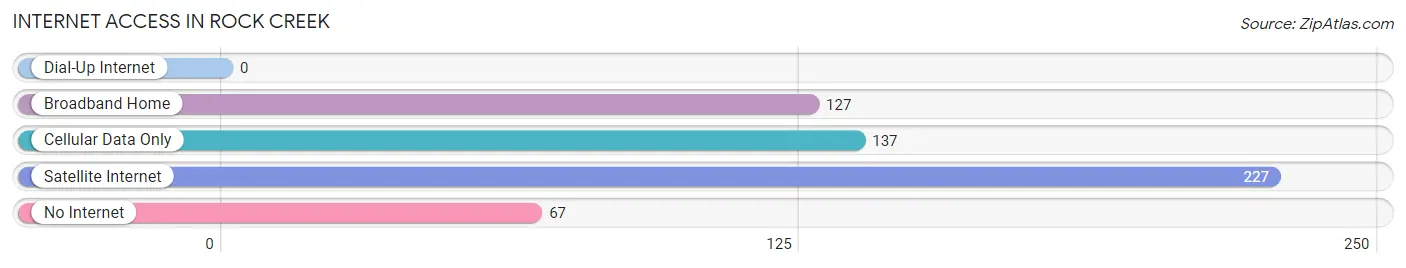
| Internet Type | # Households | % Households |
| Dial-Up Internet | 0 | 0.0% |
| Broadband Home | 127 | 22.4% |
| Cellular Data Only | 137 | 24.2% |
| Satellite Internet | 227 | 40.0% |
| No Internet | 67 | 11.8% |
| Total | 567 | 100.0% |
Rock Creek Summary
Introduction
Rock Creek is a small town located in the state of Minnesota, United States. It is situated in the southeastern corner of the state, near the border with Wisconsin. The town has a population of just over 1,000 people and is part of the Twin Cities metropolitan area. The town is known for its rural charm and its proximity to the St. Croix River.
History
Rock Creek was first settled in the late 1800s by a group of Swedish immigrants. The town was originally called “Swedish Settlement” and was later renamed Rock Creek. The town was officially incorporated in 1887.
The town was initially a farming community, but it soon developed into a small industrial center. The town was home to a number of small factories, including a sawmill, a flour mill, and a brickyard. The town also had a number of stores and businesses, including a hotel, a bank, and a post office.
In the early 1900s, the town experienced a period of growth and prosperity. The population increased from just over 500 in 1900 to nearly 1,000 in 1910. The town also saw the construction of a number of new buildings, including a school, a library, and a hospital.
Geography
Rock Creek is located in the southeastern corner of Minnesota, near the border with Wisconsin. The town is situated on the banks of the St. Croix River, which forms the border between the two states. The town is surrounded by rolling hills and forests, and is located about 25 miles north of the Twin Cities.
The town has a total area of 1.2 square miles, all of which is land. The town has a humid continental climate, with cold winters and warm summers. The average annual temperature is around 40 degrees Fahrenheit.
Economy
Rock Creek’s economy is largely based on agriculture and tourism. The town is home to a number of small farms, which produce a variety of crops, including corn, soybeans, and hay. The town also has a number of small businesses, including restaurants, stores, and a hotel.
The town is also a popular tourist destination. The town is home to a number of historic sites, including the Rock Creek Historic District, which is listed on the National Register of Historic Places. The town also has a number of outdoor recreation opportunities, including fishing, boating, and hiking.
Demographics
As of the 2010 census, the population of Rock Creek was 1,072. The town has a population density of 890 people per square mile. The median age of the population is 44.7 years, and the median household income is $50,000.
The town is predominantly white, with 92.3% of the population identifying as white. The town also has a small Hispanic population, with 4.2% of the population identifying as Hispanic or Latino. The town also has a small African American population, with 1.2% of the population identifying as African American.
Conclusion
Rock Creek is a small town located in the southeastern corner of Minnesota. The town has a population of just over 1,000 people and is known for its rural charm and its proximity to the St. Croix River. The town’s economy is largely based on agriculture and tourism, and the town is home to a number of historic sites and outdoor recreation opportunities. The town is predominantly white, with a small Hispanic and African American population.
Common Questions
What is the Total Population of Rock Creek?
Total Population of Rock Creek is 1,694.
What is the Total Male Population of Rock Creek?
Total Male Population of Rock Creek is 867.
What is the Total Female Population of Rock Creek?
Total Female Population of Rock Creek is 827.
What is the Ratio of Males per 100 Females in Rock Creek?
There are 104.84 Males per 100 Females in Rock Creek.
What is the Ratio of Females per 100 Males in Rock Creek?
There are 95.39 Females per 100 Males in Rock Creek.
What is the Median Population Age in Rock Creek?
Median Population Age in Rock Creek is 36.7 Years.
What is the Average Family Size in Rock Creek
Average Family Size in Rock Creek is 3.4 People.
What is the Average Household Size in Rock Creek
Average Household Size in Rock Creek is 3.0 People.
What is Per Capita Income in Rock Creek?
Per Capita income in Rock Creek is $33,591.
What is the Median Family Income in Rock Creek?
Median Family Income in Rock Creek is $99,500.
What is the Median Household income in Rock Creek?
Median Household Income in Rock Creek is $92,344.
What is Income or Wage Gap in Rock Creek?
Income or Wage Gap in Rock Creek is 7.9%.
Women in Rock Creek earn 92.1 cents for every dollar earned by a man.
What is Inequality or Gini Index in Rock Creek?
Inequality or Gini Index in Rock Creek is 0.33.
How Large is the Labor Force in Rock Creek?
There are 924 People in the Labor Forcein in Rock Creek.
What is the Percentage of People in the Labor Force in Rock Creek?
74.5% of People are in the Labor Force in Rock Creek.
What is the Unemployment Rate in Rock Creek?
Unemployment Rate in Rock Creek is 2.9%.