Pease, MN
Pease Map
Pease Overview
221
TOTAL POPULATION
98
MALE POPULATION
123
FEMALE POPULATION
79.67
MALES / 100 FEMALES
125.51
FEMALES / 100 MALES
33.6
MEDIAN AGE
3.2
AVG FAMILY SIZE
2.6
AVG HOUSEHOLD SIZE
$27,640
PER CAPITA INCOME
$74,375
AVG FAMILY INCOME
$58,214
AVG HOUSEHOLD INCOME
24.9%
WAGE / INCOME GAP [ % ]
75.1¢/ $1
WAGE / INCOME GAP [ $ ]
0.33
INEQUALITY / GINI INDEX
122
LABOR FORCE [ PEOPLE ]
70.9%
PERCENT IN LABOR FORCE
4.1%
UNEMPLOYMENT RATE
Pease Zip Codes
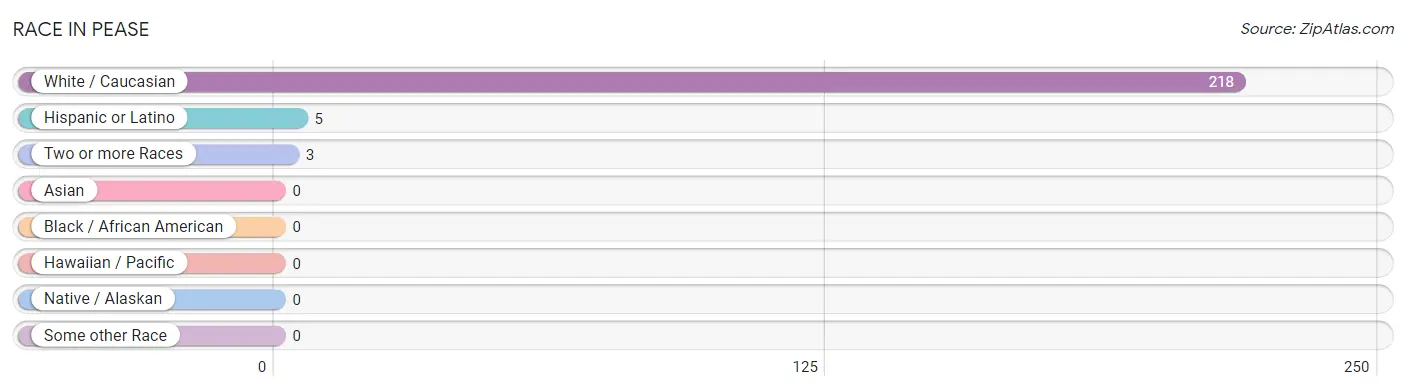
Race in Pease
The most populous races in Pease are White / Caucasian (218 | 98.6%), Hispanic or Latino (5 | 2.3%), and Two or more Races (3 | 1.4%).
| Race | # Population | % Population |
| Asian | 0 | 0.0% |
| Black / African American | 0 | 0.0% |
| Hawaiian / Pacific | 0 | 0.0% |
| Hispanic or Latino | 5 | 2.3% |
| Native / Alaskan | 0 | 0.0% |
| White / Caucasian | 218 | 98.6% |
| Two or more Races | 3 | 1.4% |
| Some other Race | 0 | 0.0% |
| Total | 221 | 100.0% |
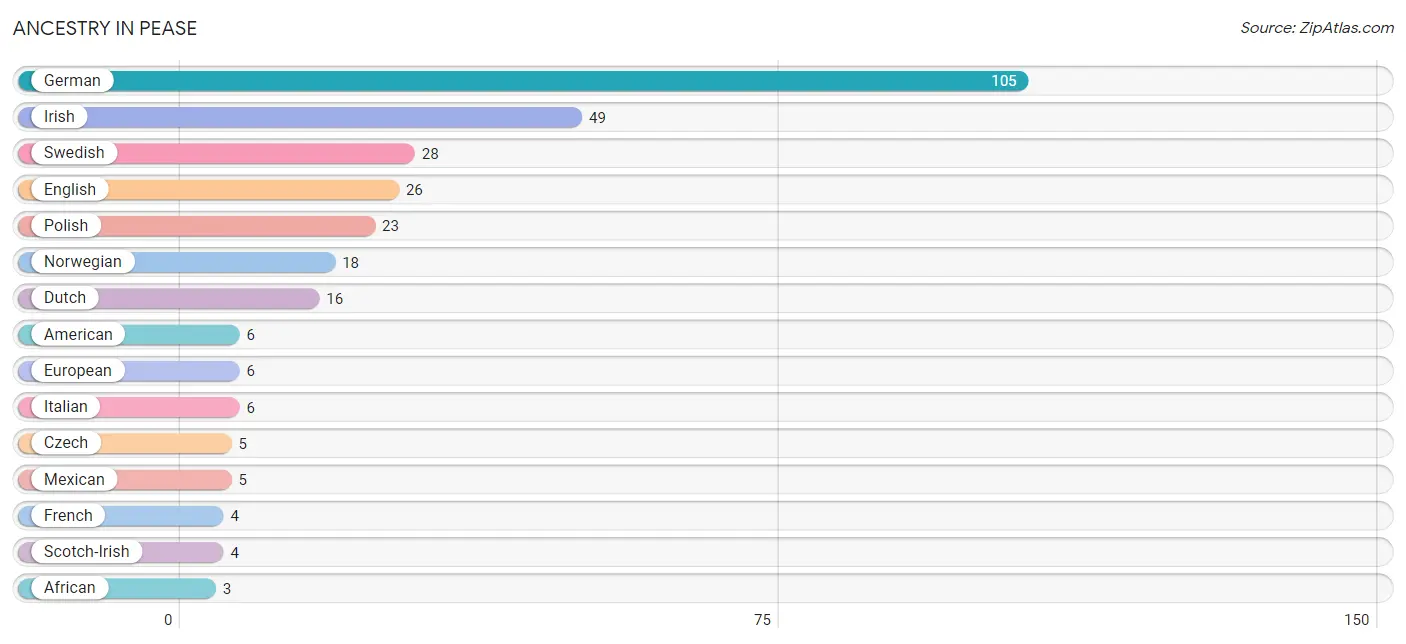
Ancestry in Pease
The most populous ancestries reported in Pease are German (105 | 47.5%), Irish (49 | 22.2%), Swedish (28 | 12.7%), English (26 | 11.8%), and Polish (23 | 10.4%), together accounting for 104.5% of all Pease residents.
| Ancestry | # Population | % Population |
| African | 3 | 1.4% |
| American | 6 | 2.7% |
| Czech | 5 | 2.3% |
| Dutch | 16 | 7.2% |
| English | 26 | 11.8% |
| European | 6 | 2.7% |
| Finnish | 3 | 1.4% |
| French | 4 | 1.8% |
| German | 105 | 47.5% |
| Greek | 1 | 0.4% |
| Irish | 49 | 22.2% |
| Italian | 6 | 2.7% |
| Mexican | 5 | 2.3% |
| Norwegian | 18 | 8.1% |
| Polish | 23 | 10.4% |
| Scotch-Irish | 4 | 1.8% |
| Scottish | 3 | 1.4% |
| Subsaharan African | 3 | 1.4% |
| Swedish | 28 | 12.7% | View All 19 Rows |
Immigrants in Pease

| Immigration Origin | # Population | % Population | View All 0 Rows |
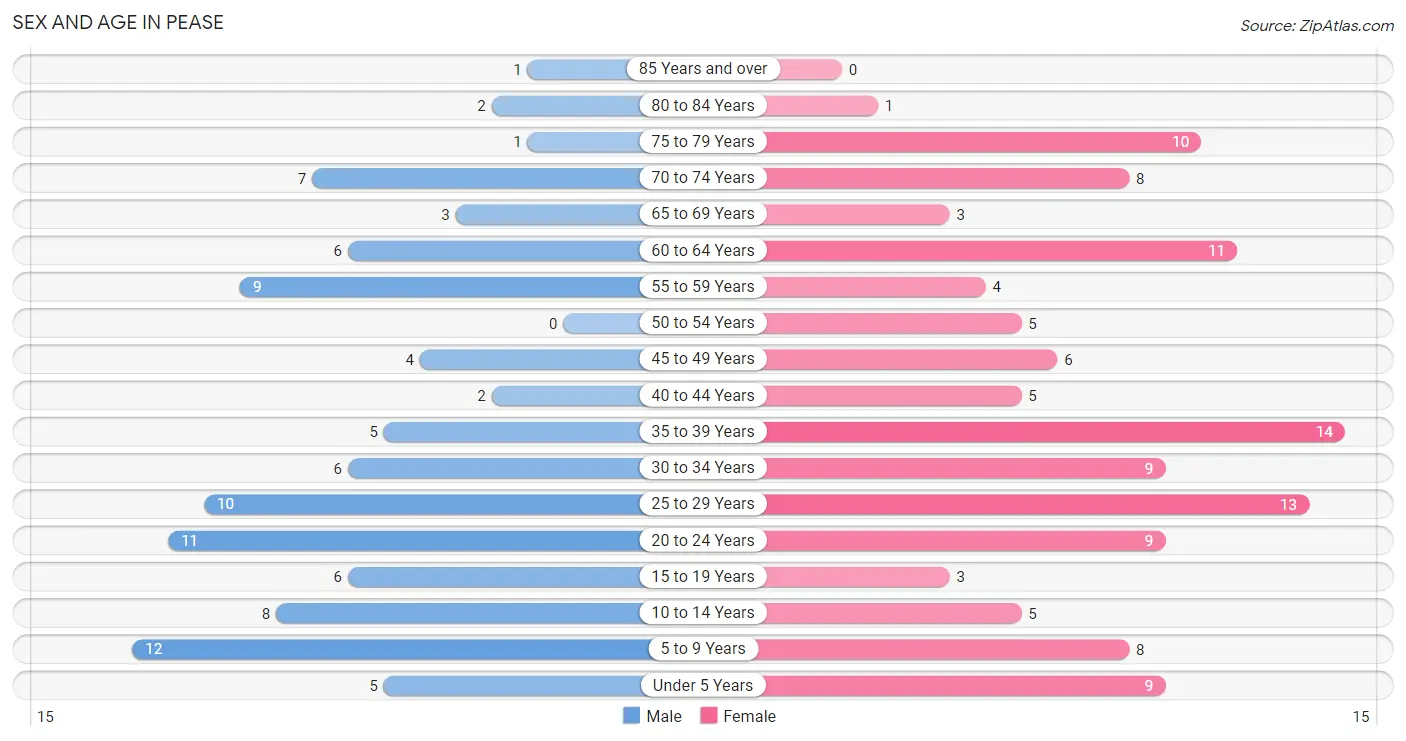
Sex and Age in Pease
Sex and Age in Pease
The most populous age groups in Pease are 5 to 9 Years (12 | 12.2%) for men and 35 to 39 Years (14 | 11.4%) for women.
| Age Bracket | Male | Female |
| Under 5 Years | 5 (5.1%) | 9 (7.3%) |
| 5 to 9 Years | 12 (12.2%) | 8 (6.5%) |
| 10 to 14 Years | 8 (8.2%) | 5 (4.1%) |
| 15 to 19 Years | 6 (6.1%) | 3 (2.4%) |
| 20 to 24 Years | 11 (11.2%) | 9 (7.3%) |
| 25 to 29 Years | 10 (10.2%) | 13 (10.6%) |
| 30 to 34 Years | 6 (6.1%) | 9 (7.3%) |
| 35 to 39 Years | 5 (5.1%) | 14 (11.4%) |
| 40 to 44 Years | 2 (2.0%) | 5 (4.1%) |
| 45 to 49 Years | 4 (4.1%) | 6 (4.9%) |
| 50 to 54 Years | 0 (0.0%) | 5 (4.1%) |
| 55 to 59 Years | 9 (9.2%) | 4 (3.3%) |
| 60 to 64 Years | 6 (6.1%) | 11 (8.9%) |
| 65 to 69 Years | 3 (3.1%) | 3 (2.4%) |
| 70 to 74 Years | 7 (7.1%) | 8 (6.5%) |
| 75 to 79 Years | 1 (1.0%) | 10 (8.1%) |
| 80 to 84 Years | 2 (2.0%) | 1 (0.8%) |
| 85 Years and over | 1 (1.0%) | 0 (0.0%) |
| Total | 98 (100.0%) | 123 (100.0%) |
Families and Households in Pease
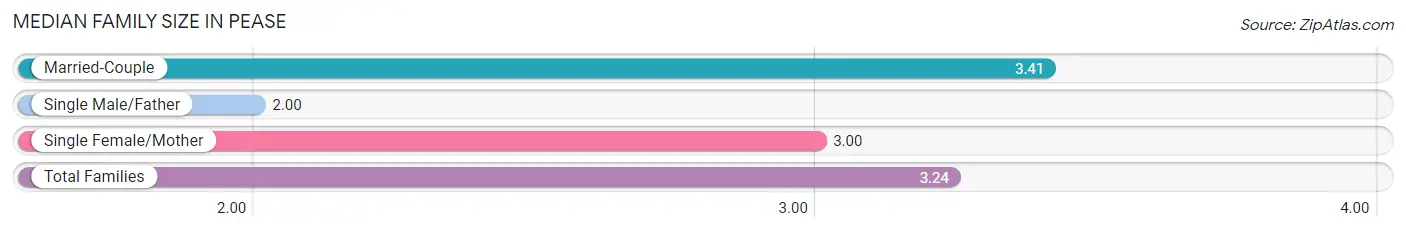
Median Family Size in Pease
The median family size in Pease is 3.24 persons per family, with married-couple families (34 | 69.4%) accounting for the largest median family size of 3.41 persons per family. On the other hand, single male/father families (2 | 4.1%) represent the smallest median family size with 2.00 persons per family.
| Family Type | # Families | Family Size |
| Married-Couple | 34 (69.4%) | 3.41 |
| Single Male/Father | 2 (4.1%) | 2.00 |
| Single Female/Mother | 13 (26.5%) | 3.00 |
| Total Families | 49 (100.0%) | 3.24 |
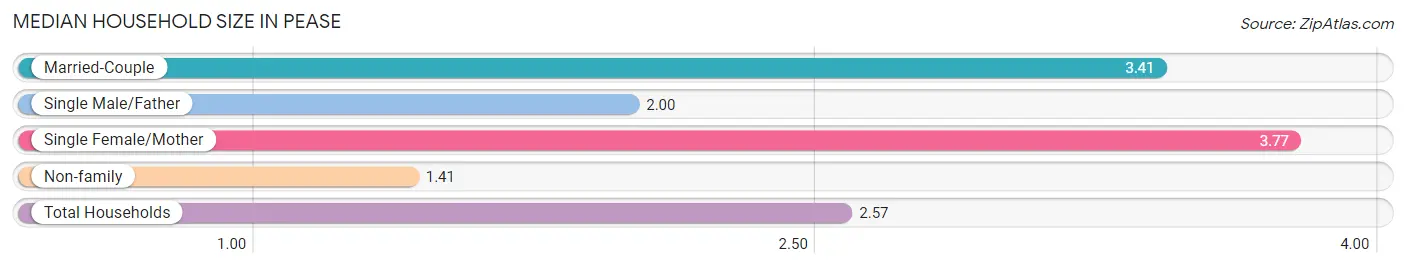
Median Household Size in Pease
The median household size in Pease is 2.57 persons per household, with single female/mother households (13 | 15.1%) accounting for the largest median household size of 3.77 persons per household. non-family households (37 | 43.0%) represent the smallest median household size with 1.41 persons per household.
| Household Type | # Households | Household Size |
| Married-Couple | 34 (39.5%) | 3.41 |
| Single Male/Father | 2 (2.3%) | 2.00 |
| Single Female/Mother | 13 (15.1%) | 3.77 |
| Non-family | 37 (43.0%) | 1.41 |
| Total Households | 86 (100.0%) | 2.57 |
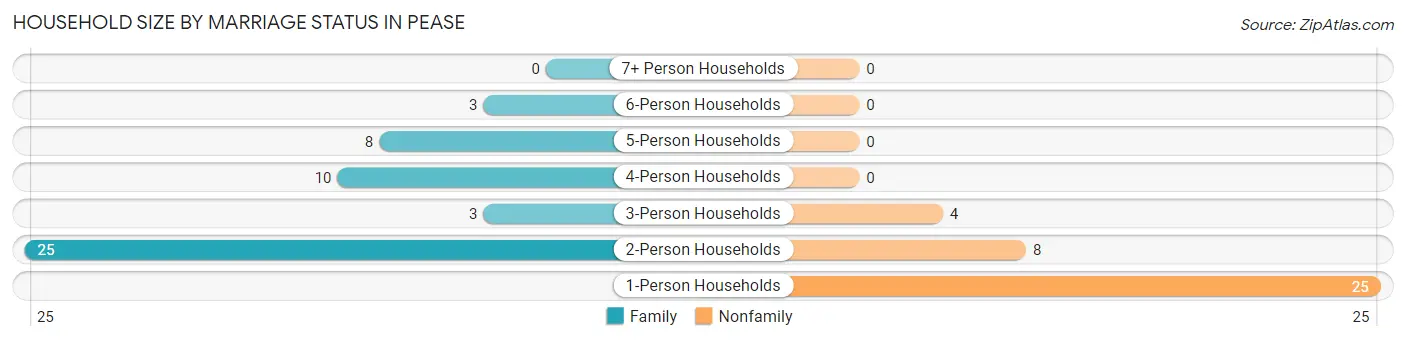
Household Size by Marriage Status in Pease
Out of a total of 86 households in Pease, 49 (57.0%) are family households, while 37 (43.0%) are nonfamily households. The most numerous type of family households are 2-person households, comprising 25, and the most common type of nonfamily households are 1-person households, comprising 25.
| Household Size | Family Households | Nonfamily Households |
| 1-Person Households | - | 25 (29.1%) |
| 2-Person Households | 25 (29.1%) | 8 (9.3%) |
| 3-Person Households | 3 (3.5%) | 4 (4.6%) |
| 4-Person Households | 10 (11.6%) | 0 (0.0%) |
| 5-Person Households | 8 (9.3%) | 0 (0.0%) |
| 6-Person Households | 3 (3.5%) | 0 (0.0%) |
| 7+ Person Households | 0 (0.0%) | 0 (0.0%) |
| Total | 49 (57.0%) | 37 (43.0%) |
Female Fertility in Pease
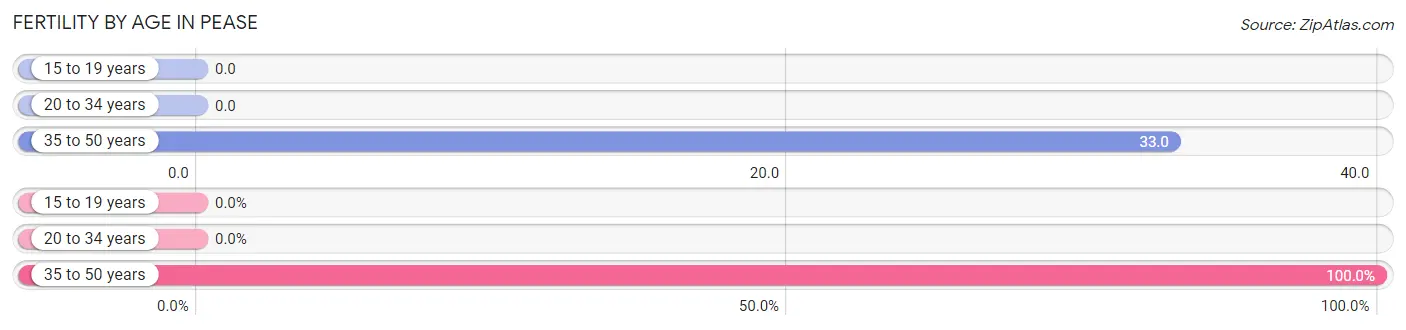
Fertility by Age in Pease
Average fertility rate in Pease is 16.0 births per 1,000 women. Women in the age bracket of 35 to 50 years have the highest fertility rate with 33.0 births per 1,000 women. Women in the age bracket of 35 to 50 years acount for 100.0% of all women with births.
| Age Bracket | Women with Births | Births / 1,000 Women |
| 15 to 19 years | 0 (0.0%) | 0.0 |
| 20 to 34 years | 0 (0.0%) | 0.0 |
| 35 to 50 years | 1 (100.0%) | 33.0 |
| Total | 1 (100.0%) | 16.0 |
Fertility by Age by Marriage Status in Pease
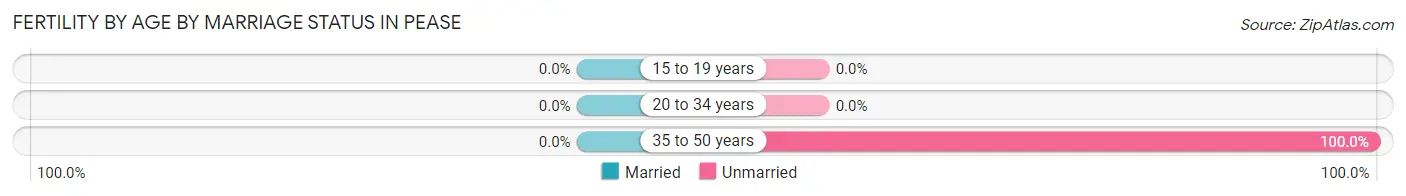
| Age Bracket | Married | Unmarried |
| 15 to 19 years | 0 (0.0%) | 0 (0.0%) |
| 20 to 34 years | 0 (0.0%) | 0 (0.0%) |
| 35 to 50 years | 0 (0.0%) | 1 (100.0%) |
| Total | 0 (0.0%) | 1 (100.0%) |
Fertility by Education in Pease
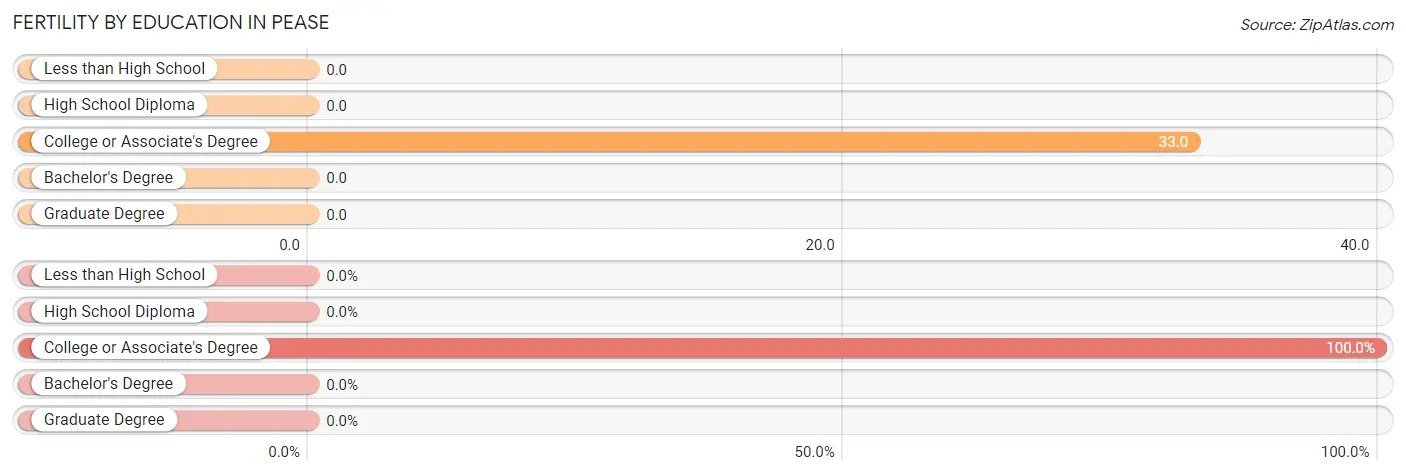
| Educational Attainment | Women with Births | Births / 1,000 Women |
| Less than High School | 0 (0.0%) | 0.0 |
| High School Diploma | 0 (0.0%) | 0.0 |
| College or Associate's Degree | 1 (100.0%) | 33.0 |
| Bachelor's Degree | 0 (0.0%) | 0.0 |
| Graduate Degree | 0 (0.0%) | 0.0 |
| Total | 1 (100.0%) | 16.0 |
Fertility by Education by Marriage Status in Pease
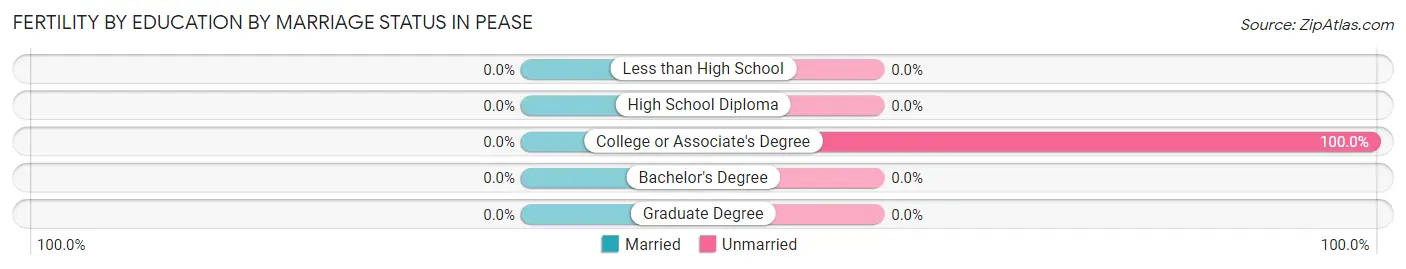
| Educational Attainment | Married | Unmarried |
| Less than High School | 0 (0.0%) | 0 (0.0%) |
| High School Diploma | 0 (0.0%) | 0 (0.0%) |
| College or Associate's Degree | 0 (0.0%) | 1 (100.0%) |
| Bachelor's Degree | 0 (0.0%) | 0 (0.0%) |
| Graduate Degree | 0 (0.0%) | 0 (0.0%) |
| Total | 0 (0.0%) | 1 (100.0%) |
Income in Pease
Income Overview in Pease
Per Capita Income in Pease is $27,640, while median incomes of families and households are $74,375 and $58,214 respectively.
| Characteristic | Number | Measure |
| Per Capita Income | 221 | $27,640 |
| Median Family Income | 49 | $74,375 |
| Mean Family Income | 49 | $79,588 |
| Median Household Income | 86 | $58,214 |
| Mean Household Income | 86 | $65,995 |
| Income Deficit | 49 | $0 |
| Wage / Income Gap (%) | 221 | 24.89% |
| Wage / Income Gap ($) | 221 | 75.11¢ per $1 |
| Gini / Inequality Index | 221 | 0.33 |
Earnings by Sex in Pease
Average Earnings in Pease are $38,571, $29,375 for men and $39,107 for women, a difference of 24.9%.
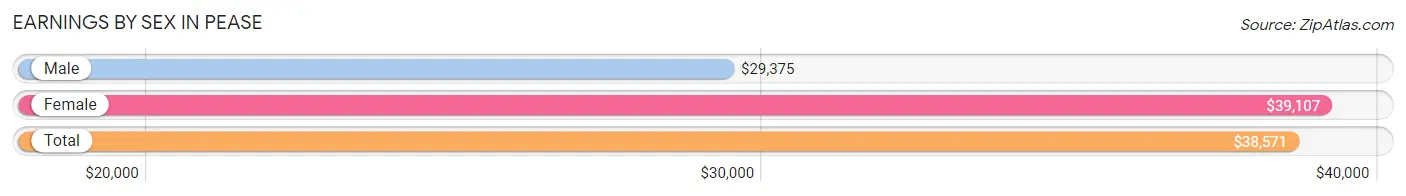
| Sex | Number | Average Earnings |
| Male | 55 (45.1%) | $29,375 |
| Female | 67 (54.9%) | $39,107 |
| Total | 122 (100.0%) | $38,571 |
Earnings by Sex by Income Bracket in Pease
The most common earnings brackets in Pease are $22,500 to $24,999 for men (9 | 16.4%) and $40,000 to $44,999 for women (23 | 34.3%).
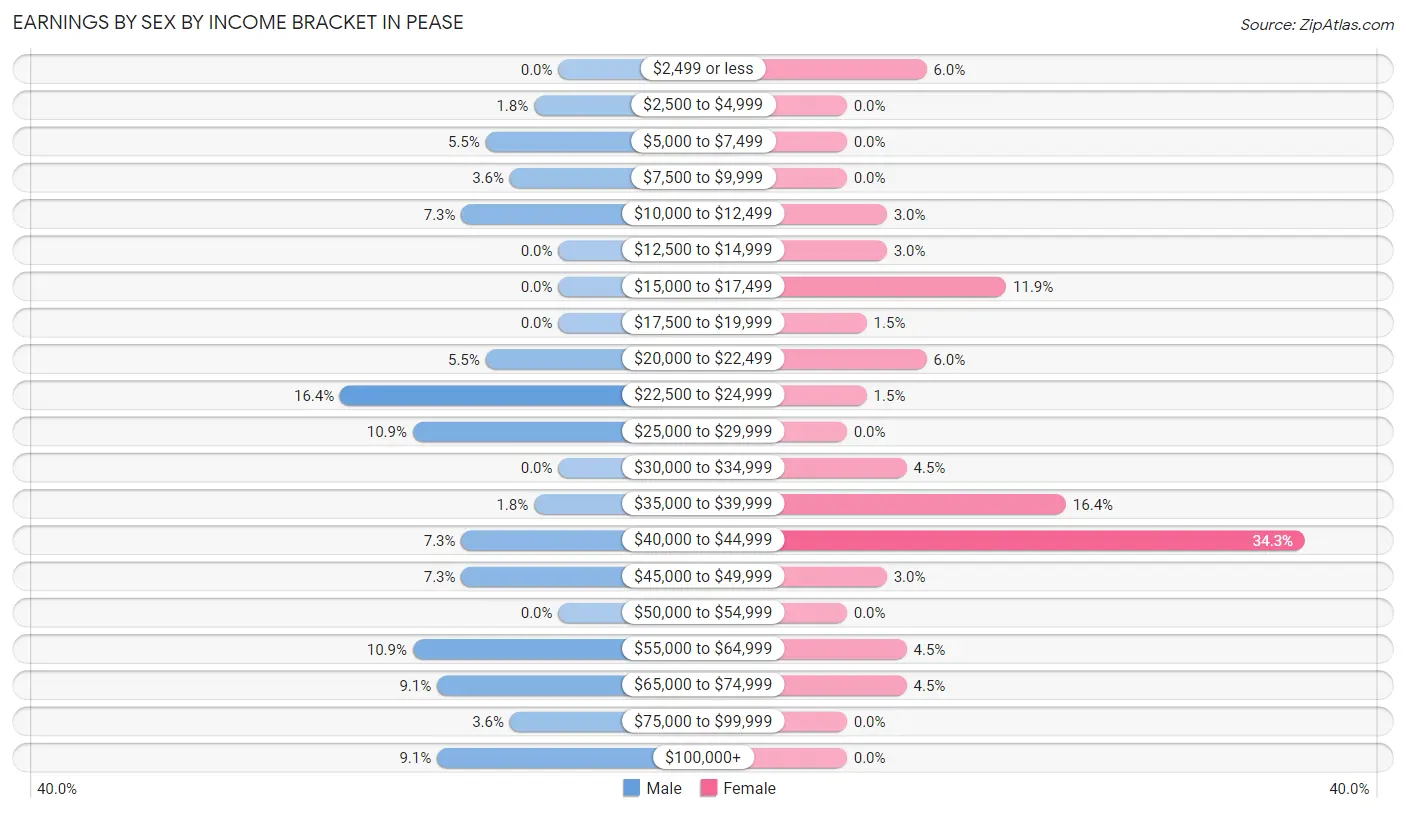
| Income | Male | Female |
| $2,499 or less | 0 (0.0%) | 4 (6.0%) |
| $2,500 to $4,999 | 1 (1.8%) | 0 (0.0%) |
| $5,000 to $7,499 | 3 (5.4%) | 0 (0.0%) |
| $7,500 to $9,999 | 2 (3.6%) | 0 (0.0%) |
| $10,000 to $12,499 | 4 (7.3%) | 2 (3.0%) |
| $12,500 to $14,999 | 0 (0.0%) | 2 (3.0%) |
| $15,000 to $17,499 | 0 (0.0%) | 8 (11.9%) |
| $17,500 to $19,999 | 0 (0.0%) | 1 (1.5%) |
| $20,000 to $22,499 | 3 (5.4%) | 4 (6.0%) |
| $22,500 to $24,999 | 9 (16.4%) | 1 (1.5%) |
| $25,000 to $29,999 | 6 (10.9%) | 0 (0.0%) |
| $30,000 to $34,999 | 0 (0.0%) | 3 (4.5%) |
| $35,000 to $39,999 | 1 (1.8%) | 11 (16.4%) |
| $40,000 to $44,999 | 4 (7.3%) | 23 (34.3%) |
| $45,000 to $49,999 | 4 (7.3%) | 2 (3.0%) |
| $50,000 to $54,999 | 0 (0.0%) | 0 (0.0%) |
| $55,000 to $64,999 | 6 (10.9%) | 3 (4.5%) |
| $65,000 to $74,999 | 5 (9.1%) | 3 (4.5%) |
| $75,000 to $99,999 | 2 (3.6%) | 0 (0.0%) |
| $100,000+ | 5 (9.1%) | 0 (0.0%) |
| Total | 55 (100.0%) | 67 (100.0%) |
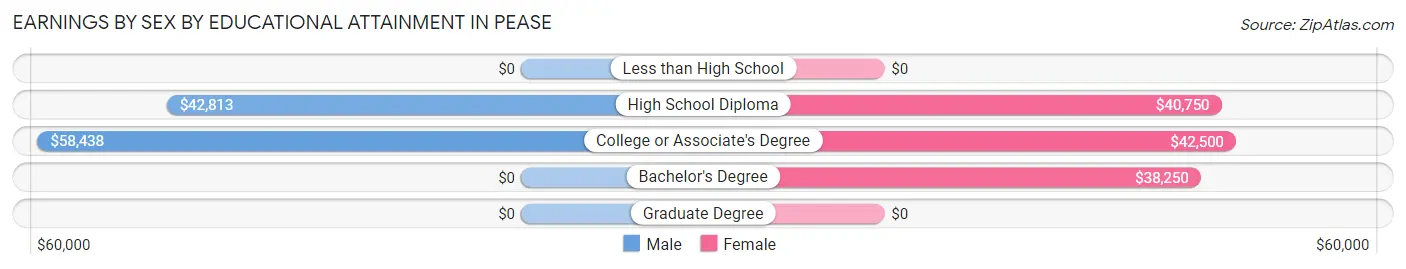
Earnings by Sex by Educational Attainment in Pease
Average earnings in Pease are $44,063 for men and $39,821 for women, a difference of 9.6%. Men with an educational attainment of college or associate's degree enjoy the highest average annual earnings of $58,438, while those with high school diploma education earn the least with $42,813. Women with an educational attainment of college or associate's degree earn the most with the average annual earnings of $42,500, while those with bachelor's degree education have the smallest earnings of $38,250.
| Educational Attainment | Male Income | Female Income |
| Less than High School | - | - |
| High School Diploma | $42,813 | $40,750 |
| College or Associate's Degree | $58,438 | $42,500 |
| Bachelor's Degree | - | - |
| Graduate Degree | - | - |
| Total | $44,063 | $39,821 |
Family Income in Pease
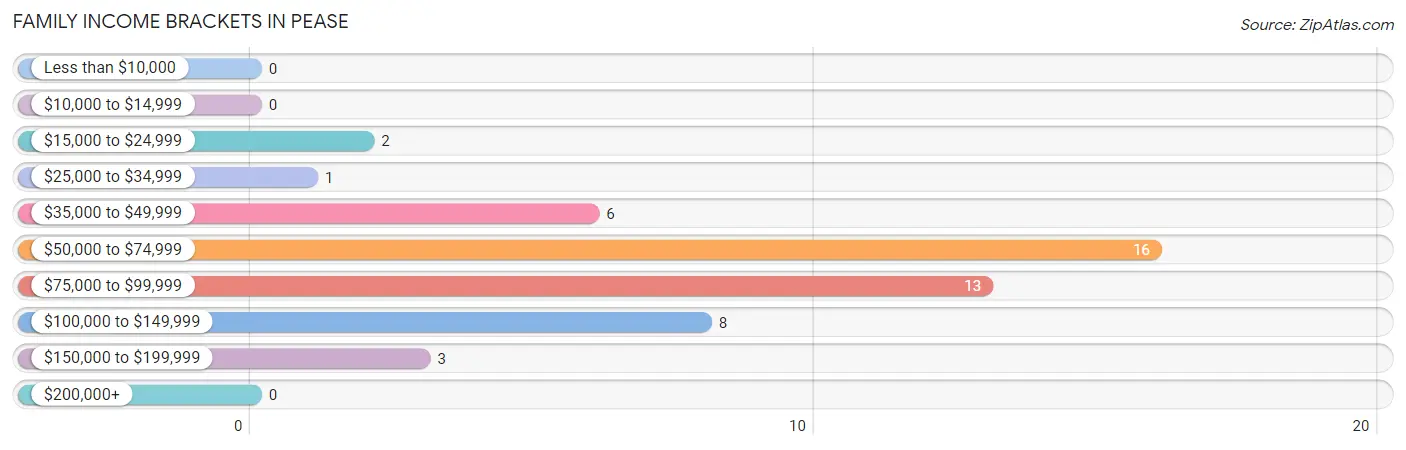
Family Income Brackets in Pease
According to the Pease family income data, there are 16 families falling into the $50,000 to $74,999 income range, which is the most common income bracket and makes up 32.7% of all families.
| Income Bracket | # Families | % Families |
| Less than $10,000 | 0 | 0.0% |
| $10,000 to $14,999 | 0 | 0.0% |
| $15,000 to $24,999 | 2 | 4.1% |
| $25,000 to $34,999 | 1 | 2.0% |
| $35,000 to $49,999 | 6 | 12.2% |
| $50,000 to $74,999 | 16 | 32.7% |
| $75,000 to $99,999 | 13 | 26.5% |
| $100,000 to $149,999 | 8 | 16.3% |
| $150,000 to $199,999 | 3 | 6.1% |
| $200,000+ | 0 | 0.0% |
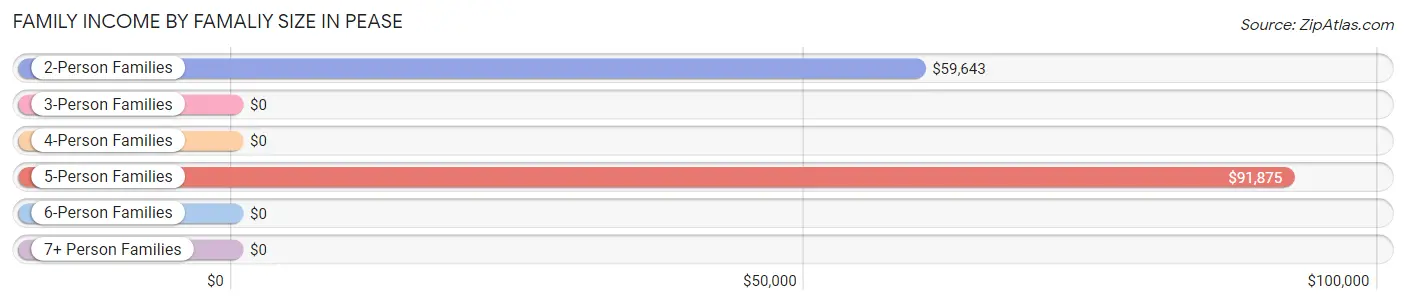
Family Income by Famaliy Size in Pease
5-person families (9 | 18.4%) account for the highest median family income in Pease with $91,875 per family, while 2-person families (30 | 61.2%) have the highest median income of $29,822 per family member.
| Income Bracket | # Families | Median Income |
| 2-Person Families | 30 (61.2%) | $59,643 |
| 3-Person Families | 3 (6.1%) | $0 |
| 4-Person Families | 5 (10.2%) | $0 |
| 5-Person Families | 9 (18.4%) | $91,875 |
| 6-Person Families | 2 (4.1%) | $0 |
| 7+ Person Families | 0 (0.0%) | $0 |
| Total | 49 (100.0%) | $74,375 |
Family Income by Number of Earners in Pease
The median family income in Pease is $74,375, with families comprising 3+ earners (5) having the highest median family income of $118,125, while families with no earners (5) have the lowest median family income of $58,125, accounting for 10.2% and 10.2% of families, respectively.
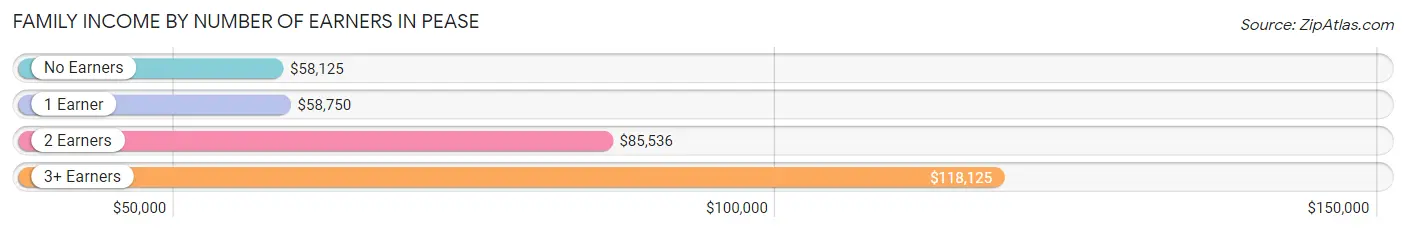
| Number of Earners | # Families | Median Income |
| No Earners | 5 (10.2%) | $58,125 |
| 1 Earner | 12 (24.5%) | $58,750 |
| 2 Earners | 27 (55.1%) | $85,536 |
| 3+ Earners | 5 (10.2%) | $118,125 |
| Total | 49 (100.0%) | $74,375 |
Household Income in Pease
Household Income Brackets in Pease
With 22 households falling in the category, the $50,000 to $74,999 income range is the most frequent in Pease, accounting for 25.6% of all households.
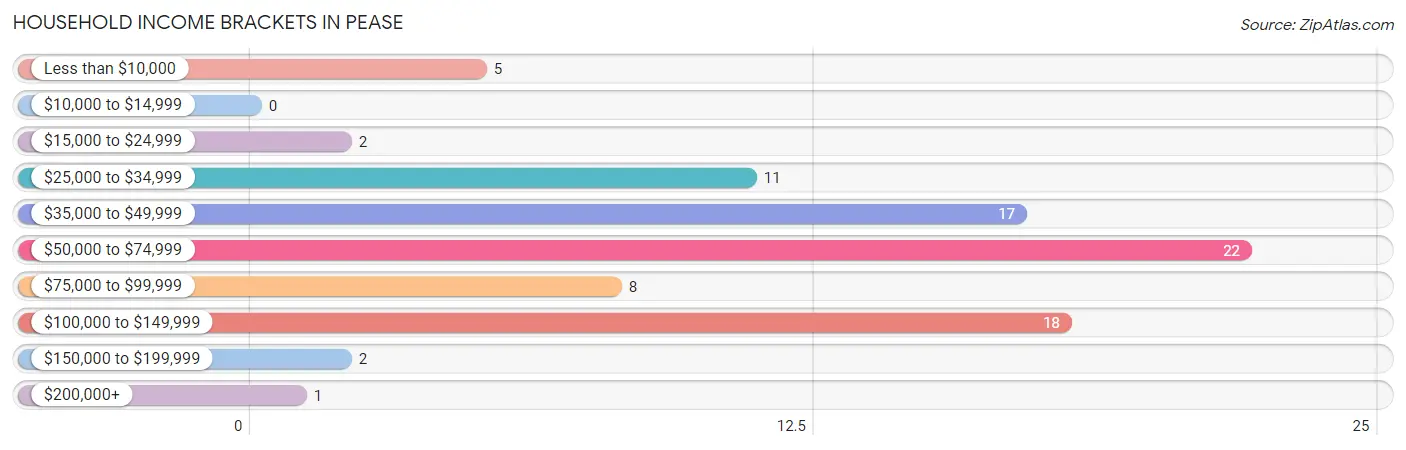
| Income Bracket | # Households | % Households |
| Less than $10,000 | 5 | 5.8% |
| $10,000 to $14,999 | 0 | 0.0% |
| $15,000 to $24,999 | 2 | 2.3% |
| $25,000 to $34,999 | 11 | 12.8% |
| $35,000 to $49,999 | 17 | 19.8% |
| $50,000 to $74,999 | 22 | 25.6% |
| $75,000 to $99,999 | 8 | 9.3% |
| $100,000 to $149,999 | 18 | 20.9% |
| $150,000 to $199,999 | 2 | 2.3% |
| $200,000+ | 1 | 1.2% |
Household Income by Householder Age in Pease
The median household income in Pease is $58,214, with the highest median household income of $101,250 found in the 45 to 64 years age bracket for the primary householder. A total of 26 households (30.2%) fall into this category. Meanwhile, the 15 to 24 years age bracket for the primary householder has the lowest median household income of $0, with 5 households (5.8%) in this group.
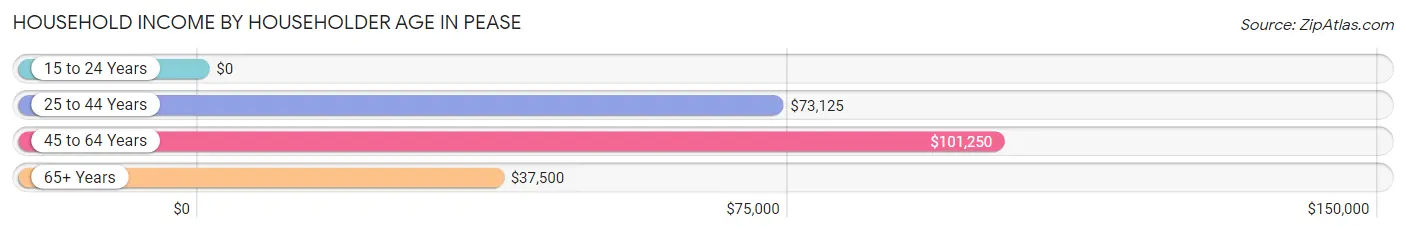
| Income Bracket | # Households | Median Income |
| 15 to 24 Years | 5 (5.8%) | $0 |
| 25 to 44 Years | 27 (31.4%) | $73,125 |
| 45 to 64 Years | 26 (30.2%) | $101,250 |
| 65+ Years | 28 (32.6%) | $37,500 |
| Total | 86 (100.0%) | $58,214 |
Poverty in Pease
Income Below Poverty by Sex and Age in Pease
With 3.2% poverty level for males and 16.0% for females among the residents of Pease, 12 to 14 year old males and 18 to 24 year old females are the most vulnerable to poverty, with 2 males (100.0%) and 6 females (60.0%) in their respective age groups living below the poverty level.
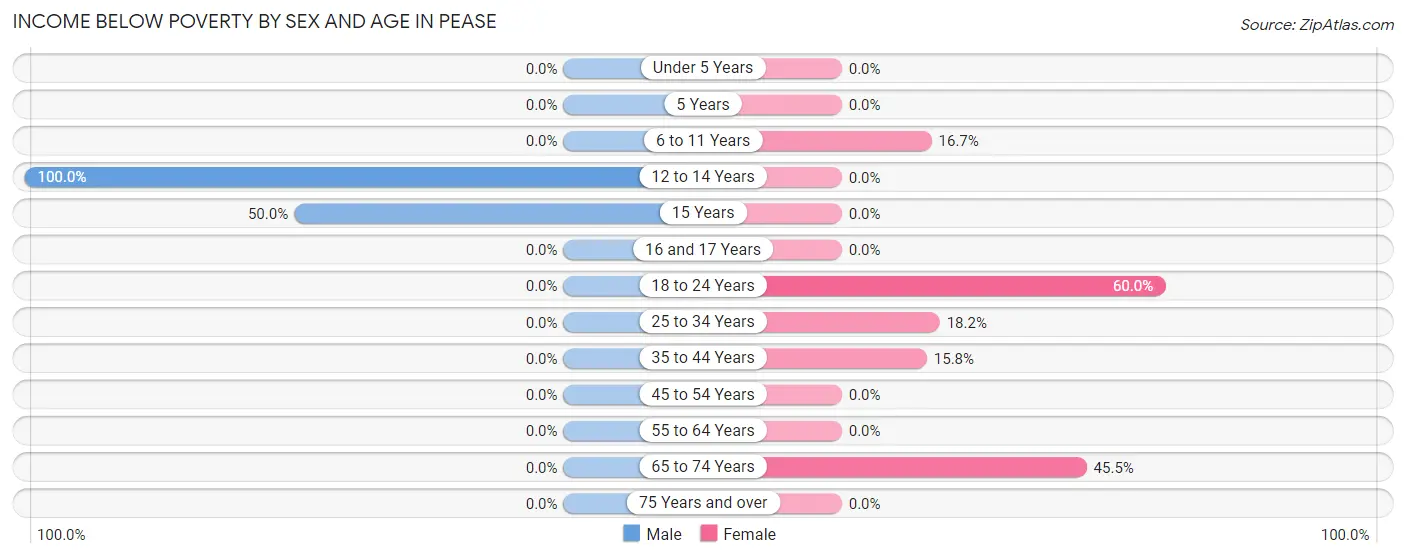
| Age Bracket | Male | Female |
| Under 5 Years | 0 (0.0%) | 0 (0.0%) |
| 5 Years | 0 (0.0%) | 0 (0.0%) |
| 6 to 11 Years | 0 (0.0%) | 1 (16.7%) |
| 12 to 14 Years | 2 (100.0%) | 0 (0.0%) |
| 15 Years | 1 (50.0%) | 0 (0.0%) |
| 16 and 17 Years | 0 (0.0%) | 0 (0.0%) |
| 18 to 24 Years | 0 (0.0%) | 6 (60.0%) |
| 25 to 34 Years | 0 (0.0%) | 4 (18.2%) |
| 35 to 44 Years | 0 (0.0%) | 3 (15.8%) |
| 45 to 54 Years | 0 (0.0%) | 0 (0.0%) |
| 55 to 64 Years | 0 (0.0%) | 0 (0.0%) |
| 65 to 74 Years | 0 (0.0%) | 5 (45.5%) |
| 75 Years and over | 0 (0.0%) | 0 (0.0%) |
| Total | 3 (3.2%) | 19 (16.0%) |
Income Above Poverty by Sex and Age in Pease
According to the poverty statistics in Pease, males aged under 5 years and females aged under 5 years are the age groups that are most secure financially, with 100.0% of males and 100.0% of females in these age groups living above the poverty line.
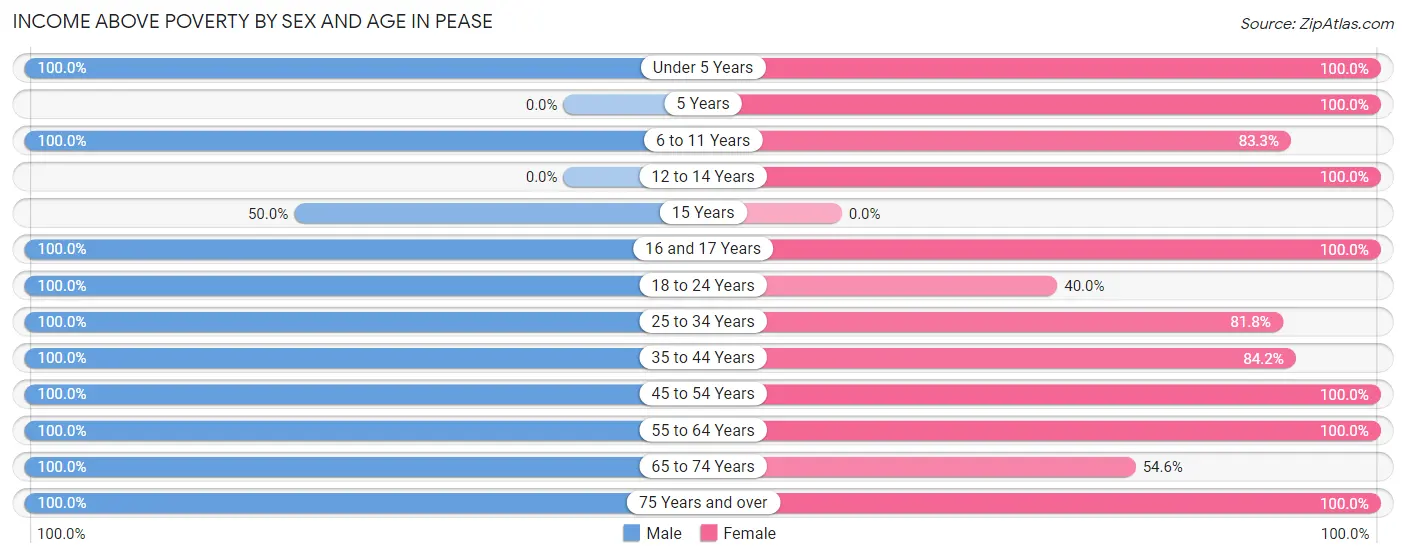
| Age Bracket | Male | Female |
| Under 5 Years | 5 (100.0%) | 9 (100.0%) |
| 5 Years | 0 (0.0%) | 2 (100.0%) |
| 6 to 11 Years | 13 (100.0%) | 5 (83.3%) |
| 12 to 14 Years | 0 (0.0%) | 1 (100.0%) |
| 15 Years | 1 (50.0%) | 0 (0.0%) |
| 16 and 17 Years | 4 (100.0%) | 2 (100.0%) |
| 18 to 24 Years | 11 (100.0%) | 4 (40.0%) |
| 25 to 34 Years | 16 (100.0%) | 18 (81.8%) |
| 35 to 44 Years | 7 (100.0%) | 16 (84.2%) |
| 45 to 54 Years | 4 (100.0%) | 11 (100.0%) |
| 55 to 64 Years | 15 (100.0%) | 15 (100.0%) |
| 65 to 74 Years | 10 (100.0%) | 6 (54.5%) |
| 75 Years and over | 4 (100.0%) | 11 (100.0%) |
| Total | 90 (96.8%) | 100 (84.0%) |
Income Below Poverty Among Married-Couple Families in Pease
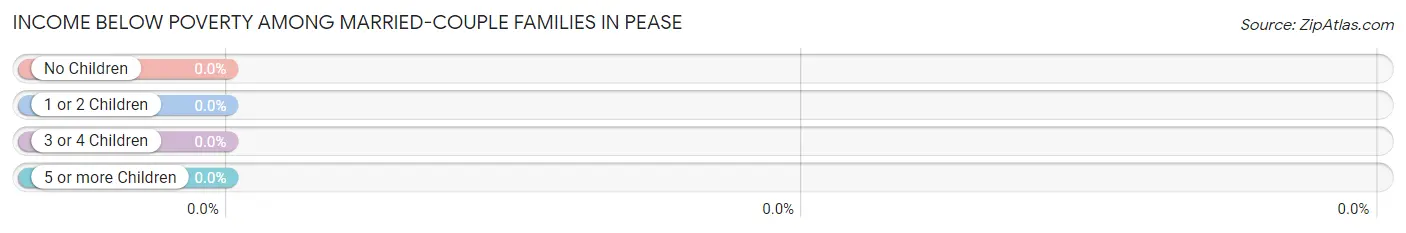
| Children | Above Poverty | Below Poverty |
| No Children | 23 (100.0%) | 0 (0.0%) |
| 1 or 2 Children | 3 (100.0%) | 0 (0.0%) |
| 3 or 4 Children | 8 (100.0%) | 0 (0.0%) |
| 5 or more Children | 0 (0.0%) | 0 (0.0%) |
| Total | 34 (100.0%) | 0 (0.0%) |
Income Below Poverty Among Single-Parent Households in Pease
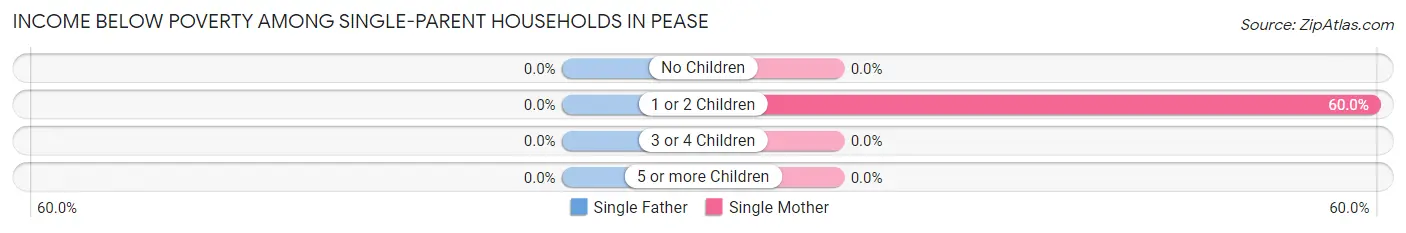
| Children | Single Father | Single Mother |
| No Children | 0 (0.0%) | 0 (0.0%) |
| 1 or 2 Children | 0 (0.0%) | 3 (60.0%) |
| 3 or 4 Children | 0 (0.0%) | 0 (0.0%) |
| 5 or more Children | 0 (0.0%) | 0 (0.0%) |
| Total | 0 (0.0%) | 3 (23.1%) |
Income Below Poverty Among Married-Couple vs Single-Parent Households in Pease
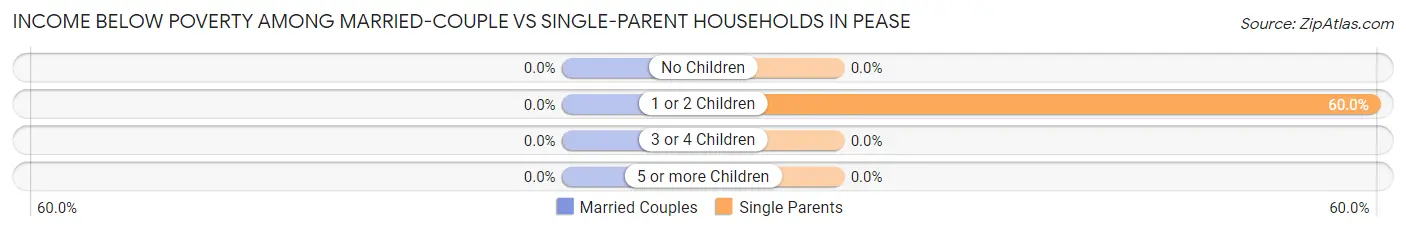
| Children | Married-Couple Families | Single-Parent Households |
| No Children | 0 (0.0%) | 0 (0.0%) |
| 1 or 2 Children | 0 (0.0%) | 3 (60.0%) |
| 3 or 4 Children | 0 (0.0%) | 0 (0.0%) |
| 5 or more Children | 0 (0.0%) | 0 (0.0%) |
| Total | 0 (0.0%) | 3 (20.0%) |
Employment Characteristics in Pease
Employment by Class of Employer in Pease
Among the 117 employed individuals in Pease, private company employees (83 | 70.9%), not-for-profit organizations (19 | 16.2%), and self-employed (not incorporated) (9 | 7.7%) make up the most common classes of employment.
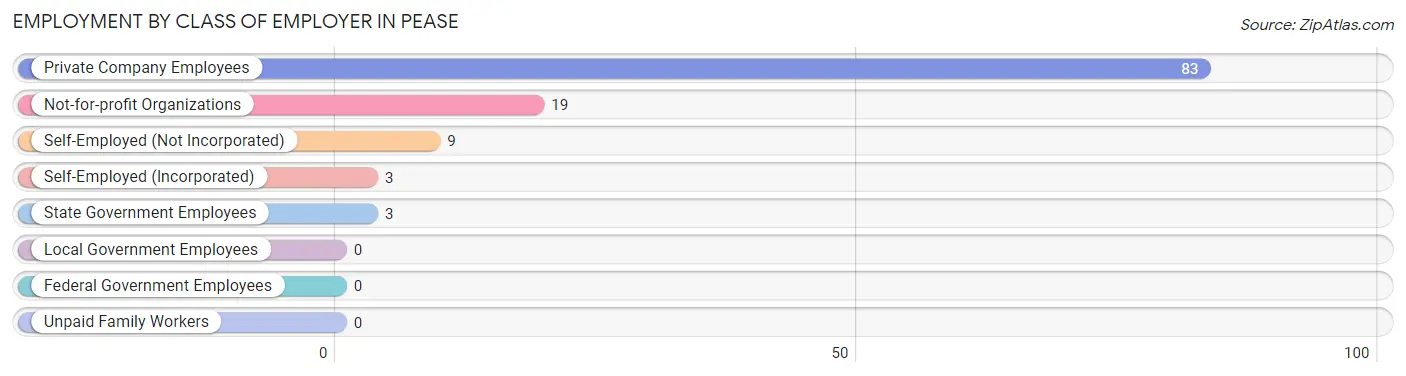
| Employer Class | # Employees | % Employees |
| Private Company Employees | 83 | 70.9% |
| Self-Employed (Incorporated) | 3 | 2.6% |
| Self-Employed (Not Incorporated) | 9 | 7.7% |
| Not-for-profit Organizations | 19 | 16.2% |
| Local Government Employees | 0 | 0.0% |
| State Government Employees | 3 | 2.6% |
| Federal Government Employees | 0 | 0.0% |
| Unpaid Family Workers | 0 | 0.0% |
| Total | 117 | 100.0% |
Employment Status by Age in Pease
According to the labor force statistics for Pease, out of the total population over 16 years of age (172), 70.9% or 122 individuals are in the labor force, with 4.1% or 5 of them unemployed. The age group with the highest labor force participation rate is 30 to 34 years, with 100.0% or 15 individuals in the labor force. Within the labor force, the 30 to 34 years age range has the highest percentage of unemployed individuals, with 26.7% or 4 of them being unemployed.
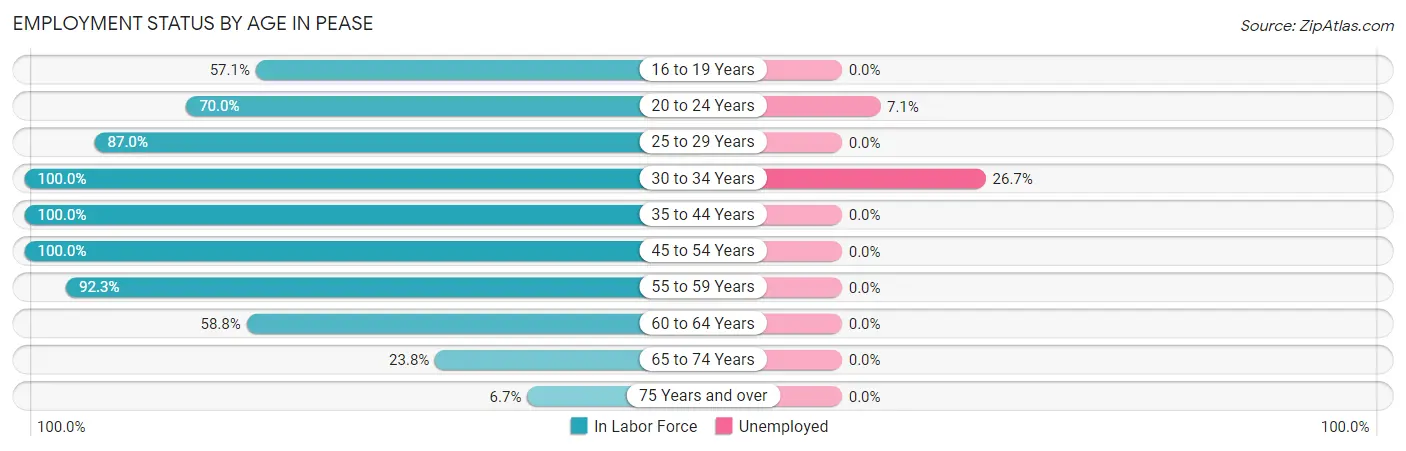
| Age Bracket | In Labor Force | Unemployed |
| 16 to 19 Years | 4 (57.1%) | 0 (0.0%) |
| 20 to 24 Years | 14 (70.0%) | 1 (7.1%) |
| 25 to 29 Years | 20 (87.0%) | 0 (0.0%) |
| 30 to 34 Years | 15 (100.0%) | 4 (26.7%) |
| 35 to 44 Years | 26 (100.0%) | 0 (0.0%) |
| 45 to 54 Years | 15 (100.0%) | 0 (0.0%) |
| 55 to 59 Years | 12 (92.3%) | 0 (0.0%) |
| 60 to 64 Years | 10 (58.8%) | 0 (0.0%) |
| 65 to 74 Years | 5 (23.8%) | 0 (0.0%) |
| 75 Years and over | 1 (6.7%) | 0 (0.0%) |
| Total | 122 (70.9%) | 5 (4.1%) |
Employment Status by Educational Attainment in Pease
According to labor force statistics for Pease, 89.9% of individuals (98) out of the total population between 25 and 64 years of age (109) are in the labor force, with 4.1% or 4 of them being unemployed. The group with the highest labor force participation rate are those with the educational attainment of less than high school, with 100.0% or 4 individuals in the labor force. Within the labor force, individuals with college / associate degree education have the highest percentage of unemployment, with 8.2% or 4 of them being unemployed.
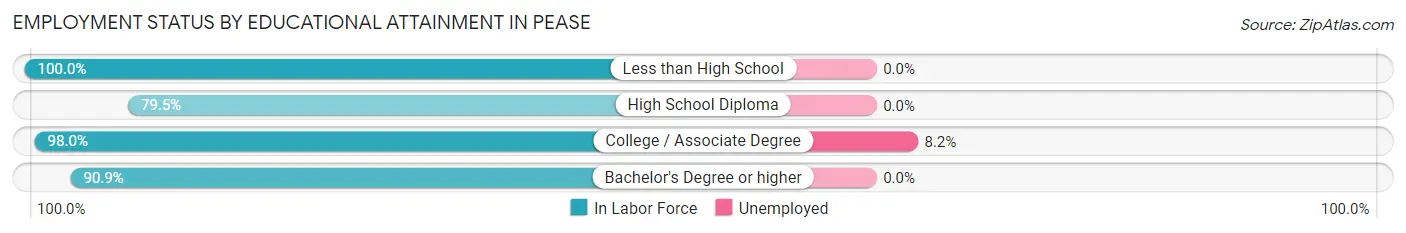
| Educational Attainment | In Labor Force | Unemployed |
| Less than High School | 4 (100.0%) | 0 (0.0%) |
| High School Diploma | 35 (79.5%) | 0 (0.0%) |
| College / Associate Degree | 49 (98.0%) | 4 (8.2%) |
| Bachelor's Degree or higher | 10 (90.9%) | 0 (0.0%) |
| Total | 98 (89.9%) | 4 (4.1%) |
Employment Occupations by Sex in Pease
Management, Business, Science and Arts Occupations
The most common Management, Business, Science and Arts occupations in Pease are Community & Social Service (16 | 13.7%), Education Instruction & Library (8 | 6.8%), Education, Arts & Media (6 | 5.1%), Health Diagnosing & Treating (4 | 3.4%), and Health Technologists (3 | 2.6%).
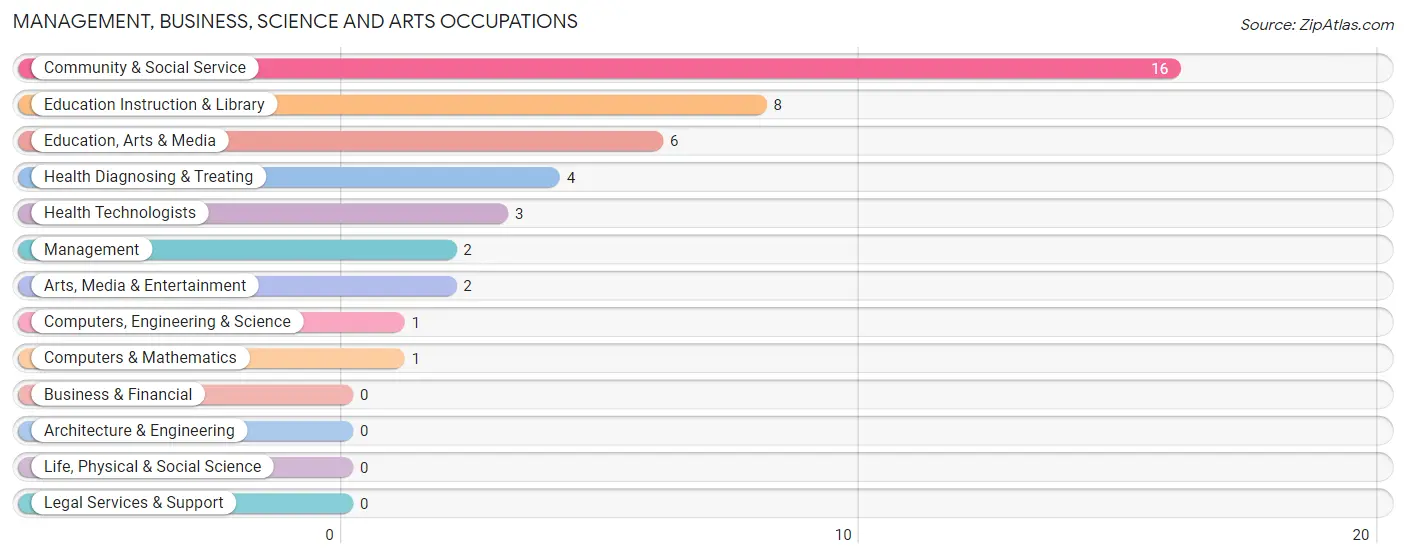
Management, Business, Science and Arts Occupations by Sex
Within the Management, Business, Science and Arts occupations in Pease, the most male-oriented occupations are Management (100.0%), Arts, Media & Entertainment (100.0%), and Health Technologists (66.7%), while the most female-oriented occupations are Computers, Engineering & Science (100.0%), Computers & Mathematics (100.0%), and Education, Arts & Media (100.0%).
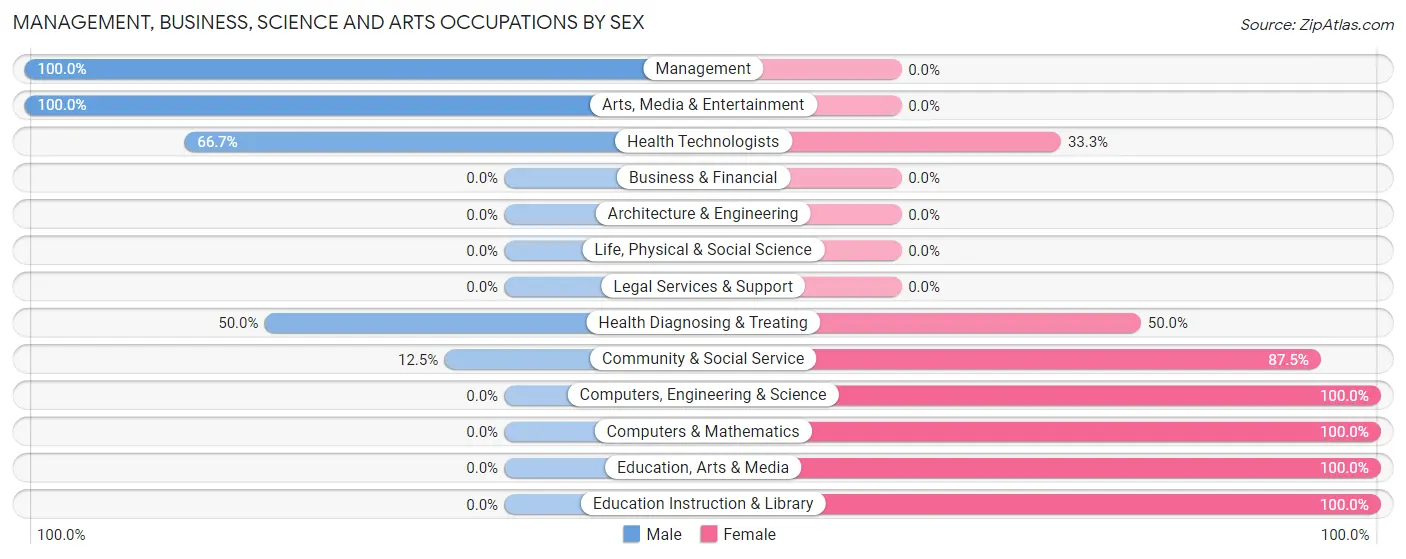
| Occupation | Male | Female |
| Management | 2 (100.0%) | 0 (0.0%) |
| Business & Financial | 0 (0.0%) | 0 (0.0%) |
| Computers, Engineering & Science | 0 (0.0%) | 1 (100.0%) |
| Computers & Mathematics | 0 (0.0%) | 1 (100.0%) |
| Architecture & Engineering | 0 (0.0%) | 0 (0.0%) |
| Life, Physical & Social Science | 0 (0.0%) | 0 (0.0%) |
| Community & Social Service | 2 (12.5%) | 14 (87.5%) |
| Education, Arts & Media | 0 (0.0%) | 6 (100.0%) |
| Legal Services & Support | 0 (0.0%) | 0 (0.0%) |
| Education Instruction & Library | 0 (0.0%) | 8 (100.0%) |
| Arts, Media & Entertainment | 2 (100.0%) | 0 (0.0%) |
| Health Diagnosing & Treating | 2 (50.0%) | 2 (50.0%) |
| Health Technologists | 2 (66.7%) | 1 (33.3%) |
| Total (Category) | 6 (26.1%) | 17 (73.9%) |
| Total (Overall) | 53 (45.3%) | 64 (54.7%) |
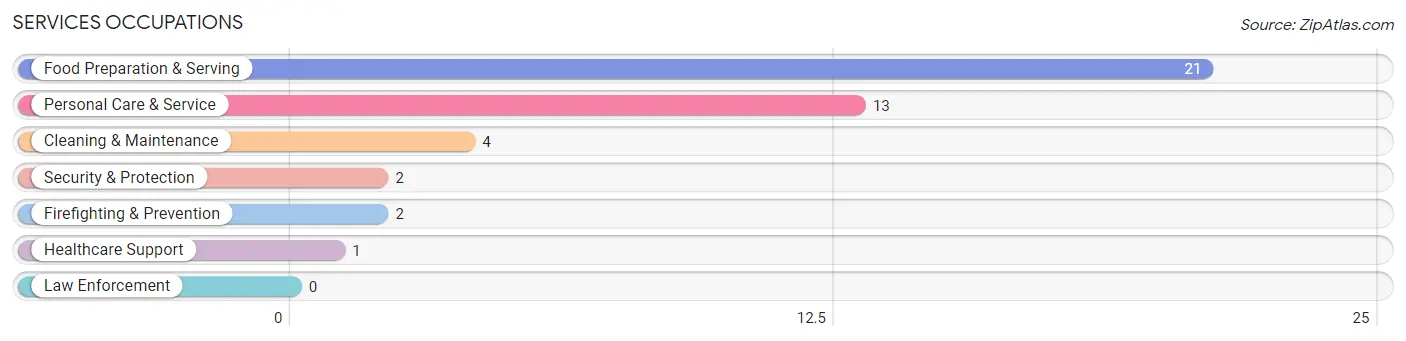
Services Occupations
The most common Services occupations in Pease are Food Preparation & Serving (21 | 17.9%), Personal Care & Service (13 | 11.1%), Cleaning & Maintenance (4 | 3.4%), Security & Protection (2 | 1.7%), and Firefighting & Prevention (2 | 1.7%).
Services Occupations by Sex
Within the Services occupations in Pease, the most male-oriented occupations are Security & Protection (100.0%), Firefighting & Prevention (100.0%), and Cleaning & Maintenance (100.0%), while the most female-oriented occupations are Healthcare Support (100.0%), Personal Care & Service (69.2%), and Food Preparation & Serving (66.7%).
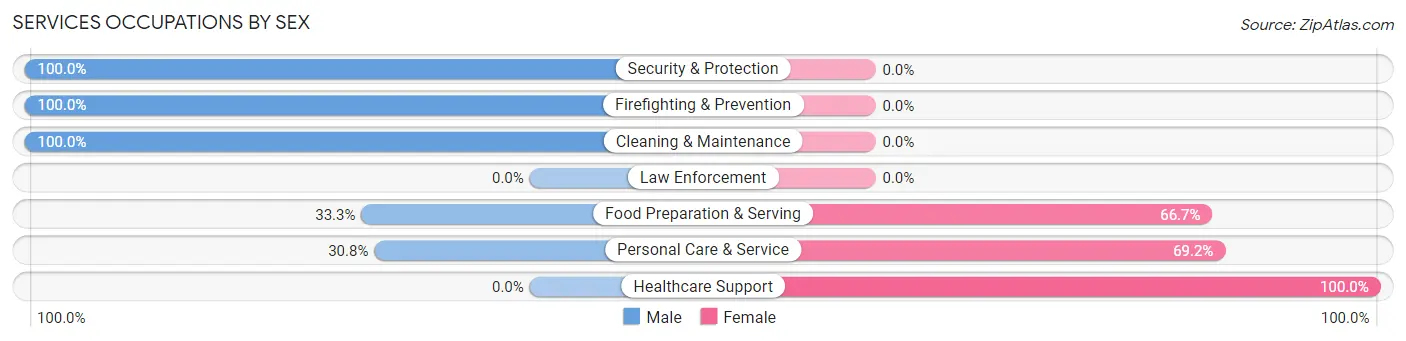
| Occupation | Male | Female |
| Healthcare Support | 0 (0.0%) | 1 (100.0%) |
| Security & Protection | 2 (100.0%) | 0 (0.0%) |
| Firefighting & Prevention | 2 (100.0%) | 0 (0.0%) |
| Law Enforcement | 0 (0.0%) | 0 (0.0%) |
| Food Preparation & Serving | 7 (33.3%) | 14 (66.7%) |
| Cleaning & Maintenance | 4 (100.0%) | 0 (0.0%) |
| Personal Care & Service | 4 (30.8%) | 9 (69.2%) |
| Total (Category) | 17 (41.5%) | 24 (58.5%) |
| Total (Overall) | 53 (45.3%) | 64 (54.7%) |
Sales and Office Occupations
The most common Sales and Office occupations in Pease are Office & Administration (18 | 15.4%), and Sales & Related (7 | 6.0%).

Sales and Office Occupations by Sex

| Occupation | Male | Female |
| Sales & Related | 3 (42.9%) | 4 (57.1%) |
| Office & Administration | 0 (0.0%) | 18 (100.0%) |
| Total (Category) | 3 (12.0%) | 22 (88.0%) |
| Total (Overall) | 53 (45.3%) | 64 (54.7%) |
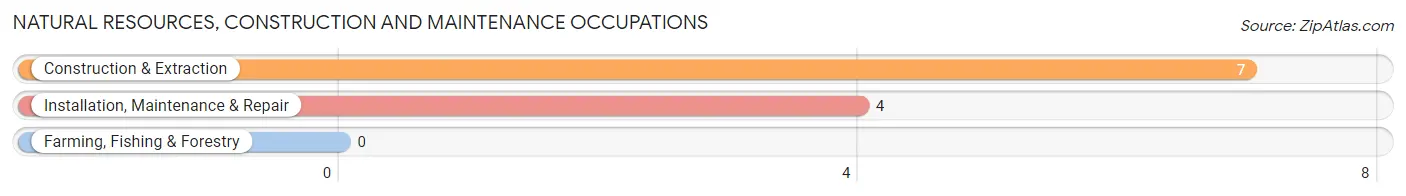
Natural Resources, Construction and Maintenance Occupations
The most common Natural Resources, Construction and Maintenance occupations in Pease are Construction & Extraction (7 | 6.0%), and Installation, Maintenance & Repair (4 | 3.4%).
Natural Resources, Construction and Maintenance Occupations by Sex
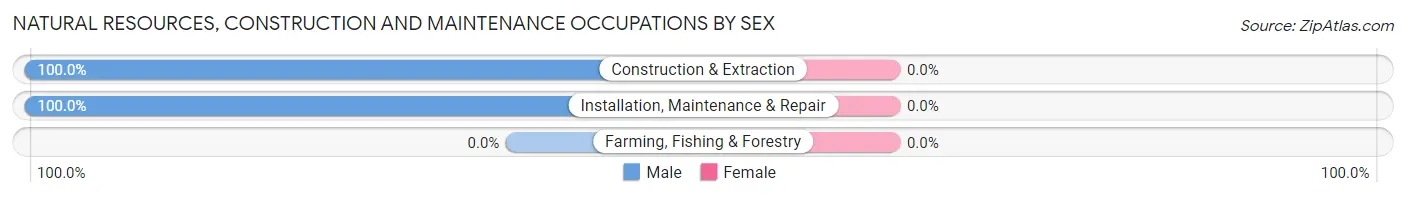
| Occupation | Male | Female |
| Farming, Fishing & Forestry | 0 (0.0%) | 0 (0.0%) |
| Construction & Extraction | 7 (100.0%) | 0 (0.0%) |
| Installation, Maintenance & Repair | 4 (100.0%) | 0 (0.0%) |
| Total (Category) | 11 (100.0%) | 0 (0.0%) |
| Total (Overall) | 53 (45.3%) | 64 (54.7%) |
Production, Transportation and Moving Occupations
The most common Production, Transportation and Moving occupations in Pease are Production (9 | 7.7%), Transportation (7 | 6.0%), and Material Moving (1 | 0.9%).
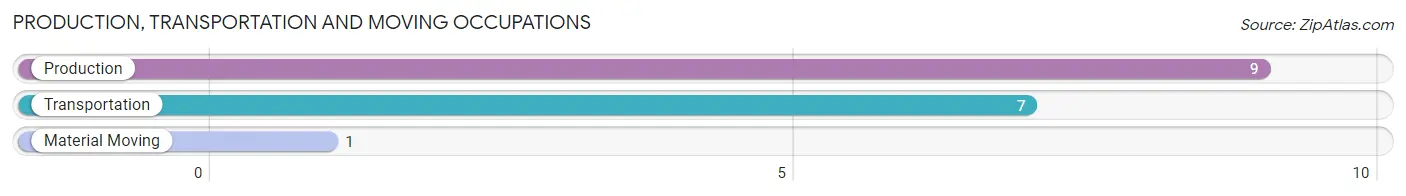
Production, Transportation and Moving Occupations by Sex

| Occupation | Male | Female |
| Production | 9 (100.0%) | 0 (0.0%) |
| Transportation | 7 (100.0%) | 0 (0.0%) |
| Material Moving | 0 (0.0%) | 1 (100.0%) |
| Total (Category) | 16 (94.1%) | 1 (5.9%) |
| Total (Overall) | 53 (45.3%) | 64 (54.7%) |
Employment Industries by Sex in Pease
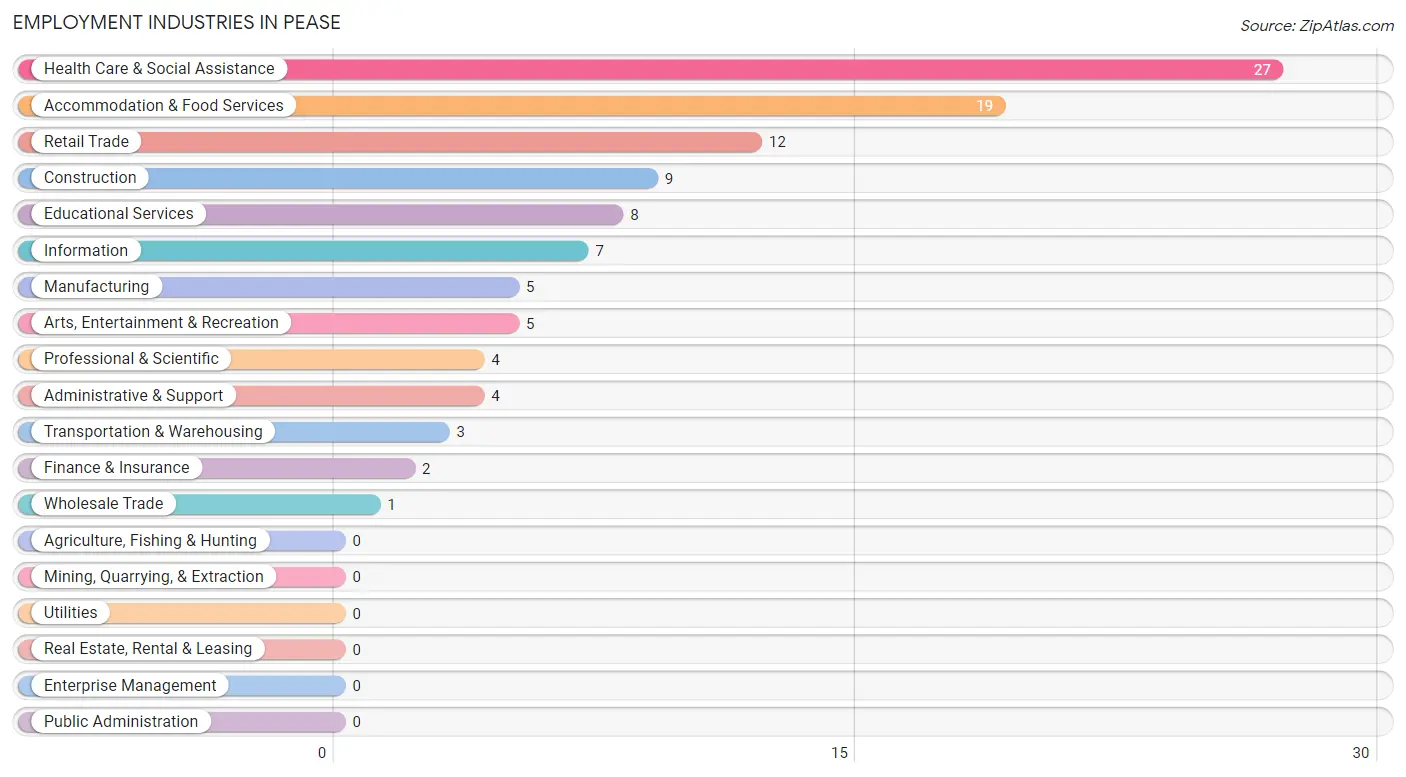
Employment Industries in Pease
The major employment industries in Pease include Health Care & Social Assistance (27 | 23.1%), Accommodation & Food Services (19 | 16.2%), Retail Trade (12 | 10.3%), Construction (9 | 7.7%), and Educational Services (8 | 6.8%).
Employment Industries by Sex in Pease
The Pease industries that see more men than women are Manufacturing (100.0%), Wholesale Trade (100.0%), and Transportation & Warehousing (100.0%), whereas the industries that tend to have a higher number of women are Educational Services (100.0%), Health Care & Social Assistance (77.8%), and Information (71.4%).
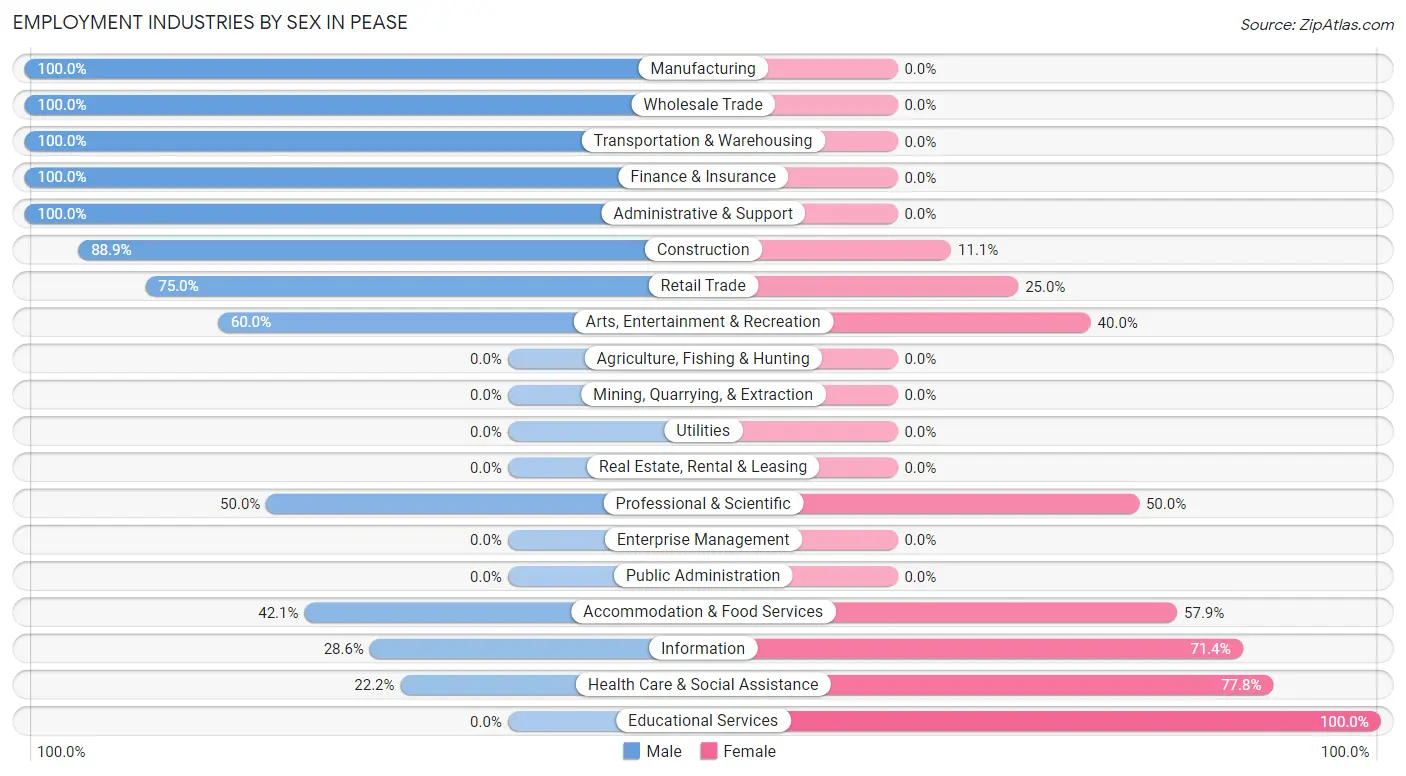
| Industry | Male | Female |
| Agriculture, Fishing & Hunting | 0 (0.0%) | 0 (0.0%) |
| Mining, Quarrying, & Extraction | 0 (0.0%) | 0 (0.0%) |
| Construction | 8 (88.9%) | 1 (11.1%) |
| Manufacturing | 5 (100.0%) | 0 (0.0%) |
| Wholesale Trade | 1 (100.0%) | 0 (0.0%) |
| Retail Trade | 9 (75.0%) | 3 (25.0%) |
| Transportation & Warehousing | 3 (100.0%) | 0 (0.0%) |
| Utilities | 0 (0.0%) | 0 (0.0%) |
| Information | 2 (28.6%) | 5 (71.4%) |
| Finance & Insurance | 2 (100.0%) | 0 (0.0%) |
| Real Estate, Rental & Leasing | 0 (0.0%) | 0 (0.0%) |
| Professional & Scientific | 2 (50.0%) | 2 (50.0%) |
| Enterprise Management | 0 (0.0%) | 0 (0.0%) |
| Administrative & Support | 4 (100.0%) | 0 (0.0%) |
| Educational Services | 0 (0.0%) | 8 (100.0%) |
| Health Care & Social Assistance | 6 (22.2%) | 21 (77.8%) |
| Arts, Entertainment & Recreation | 3 (60.0%) | 2 (40.0%) |
| Accommodation & Food Services | 8 (42.1%) | 11 (57.9%) |
| Public Administration | 0 (0.0%) | 0 (0.0%) |
| Total | 53 (45.3%) | 64 (54.7%) |
Education in Pease
School Enrollment in Pease
The most common levels of schooling among the 49 students in Pease are elementary school (18 | 36.7%), college / undergraduate (13 | 26.5%), and high school (8 | 16.3%).
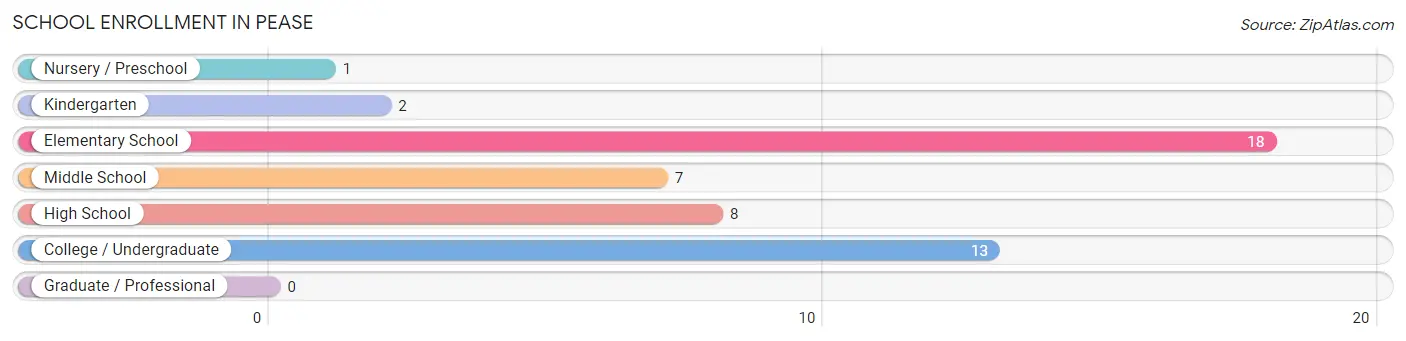
| School Level | # Students | % Students |
| Nursery / Preschool | 1 | 2.0% |
| Kindergarten | 2 | 4.1% |
| Elementary School | 18 | 36.7% |
| Middle School | 7 | 14.3% |
| High School | 8 | 16.3% |
| College / Undergraduate | 13 | 26.5% |
| Graduate / Professional | 0 | 0.0% |
| Total | 49 | 100.0% |
School Enrollment by Age by Funding Source in Pease
Out of a total of 49 students who are enrolled in schools in Pease, 11 (22.4%) attend a private institution, while the remaining 38 (77.6%) are enrolled in public schools. The age group of 10 to 14 year olds has the highest likelihood of being enrolled in private schools, with 4 (50.0% in the age bracket) enrolled. Conversely, the age group of 20 to 24 year olds has the lowest likelihood of being enrolled in a private school, with 1 (100.0% in the age bracket) attending a public institution.
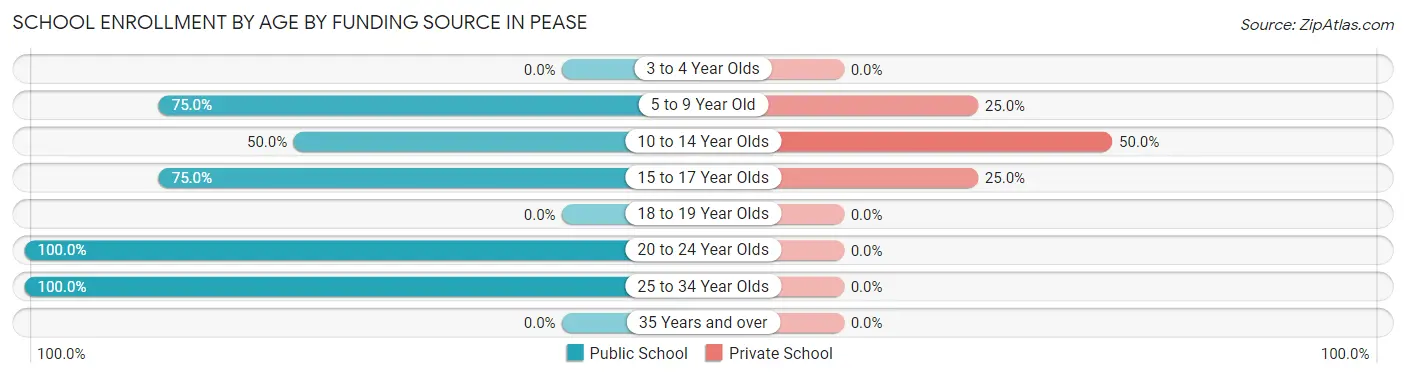
| Age Bracket | Public School | Private School |
| 3 to 4 Year Olds | 0 (0.0%) | 0 (0.0%) |
| 5 to 9 Year Old | 15 (75.0%) | 5 (25.0%) |
| 10 to 14 Year Olds | 4 (50.0%) | 4 (50.0%) |
| 15 to 17 Year Olds | 6 (75.0%) | 2 (25.0%) |
| 18 to 19 Year Olds | 0 (0.0%) | 0 (0.0%) |
| 20 to 24 Year Olds | 1 (100.0%) | 0 (0.0%) |
| 25 to 34 Year Olds | 12 (100.0%) | 0 (0.0%) |
| 35 Years and over | 0 (0.0%) | 0 (0.0%) |
| Total | 38 (77.6%) | 11 (22.4%) |
Educational Attainment by Field of Study in Pease
Education (9 | 60.0%), business (2 | 13.3%), arts & humanities (2 | 13.3%), psychology (1 | 6.7%), and social sciences (1 | 6.7%) are the most common fields of study among 15 individuals in Pease who have obtained a bachelor's degree or higher.
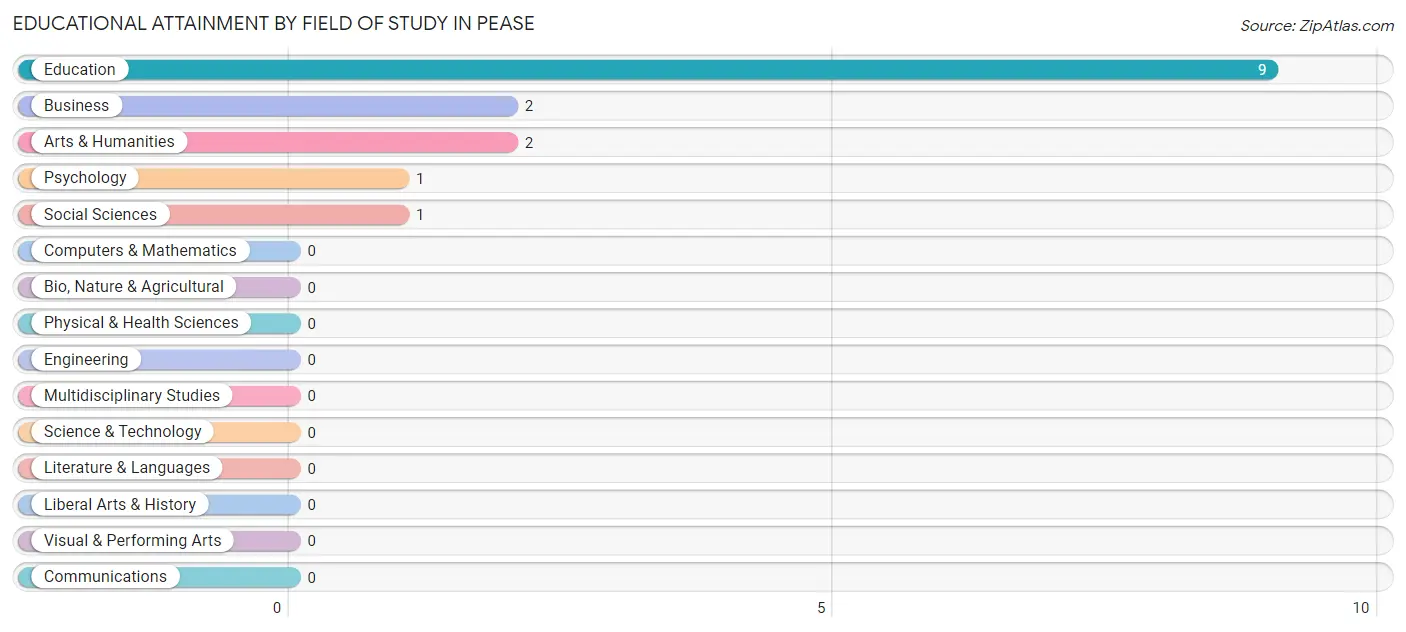
| Field of Study | # Graduates | % Graduates |
| Computers & Mathematics | 0 | 0.0% |
| Bio, Nature & Agricultural | 0 | 0.0% |
| Physical & Health Sciences | 0 | 0.0% |
| Psychology | 1 | 6.7% |
| Social Sciences | 1 | 6.7% |
| Engineering | 0 | 0.0% |
| Multidisciplinary Studies | 0 | 0.0% |
| Science & Technology | 0 | 0.0% |
| Business | 2 | 13.3% |
| Education | 9 | 60.0% |
| Literature & Languages | 0 | 0.0% |
| Liberal Arts & History | 0 | 0.0% |
| Visual & Performing Arts | 0 | 0.0% |
| Communications | 0 | 0.0% |
| Arts & Humanities | 2 | 13.3% |
| Total | 15 | 100.0% |
Transportation & Commute in Pease
Vehicle Availability by Sex in Pease
The most prevalent vehicle ownership categories in Pease are males with 2 vehicles (26, accounting for 49.1%) and females with 2 vehicles (21, making up 40.6%).
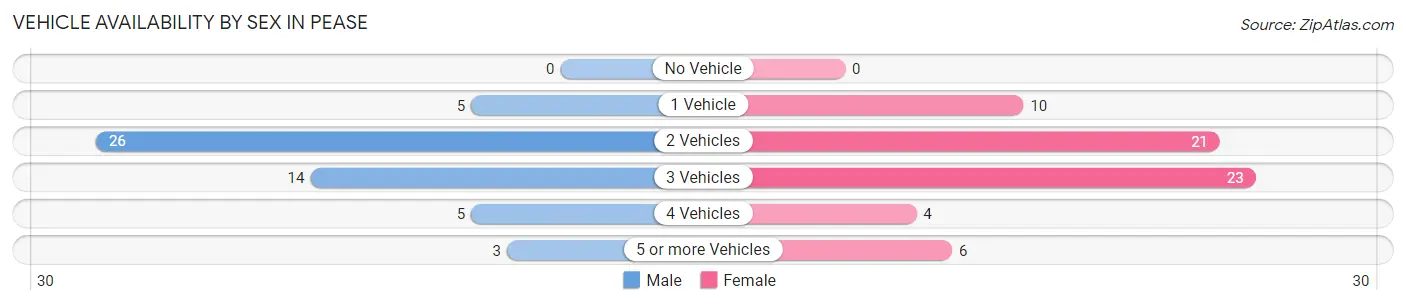
| Vehicles Available | Male | Female |
| No Vehicle | 0 (0.0%) | 0 (0.0%) |
| 1 Vehicle | 5 (9.4%) | 10 (15.6%) |
| 2 Vehicles | 26 (49.1%) | 21 (32.8%) |
| 3 Vehicles | 14 (26.4%) | 23 (35.9%) |
| 4 Vehicles | 5 (9.4%) | 4 (6.2%) |
| 5 or more Vehicles | 3 (5.7%) | 6 (9.4%) |
| Total | 53 (100.0%) | 64 (100.0%) |
Commute Time in Pease
The most frequently occuring commute durations in Pease are 15 to 19 minutes (31 commuters, 28.7%), 10 to 14 minutes (16 commuters, 14.8%), and 25 to 29 minutes (10 commuters, 9.3%).
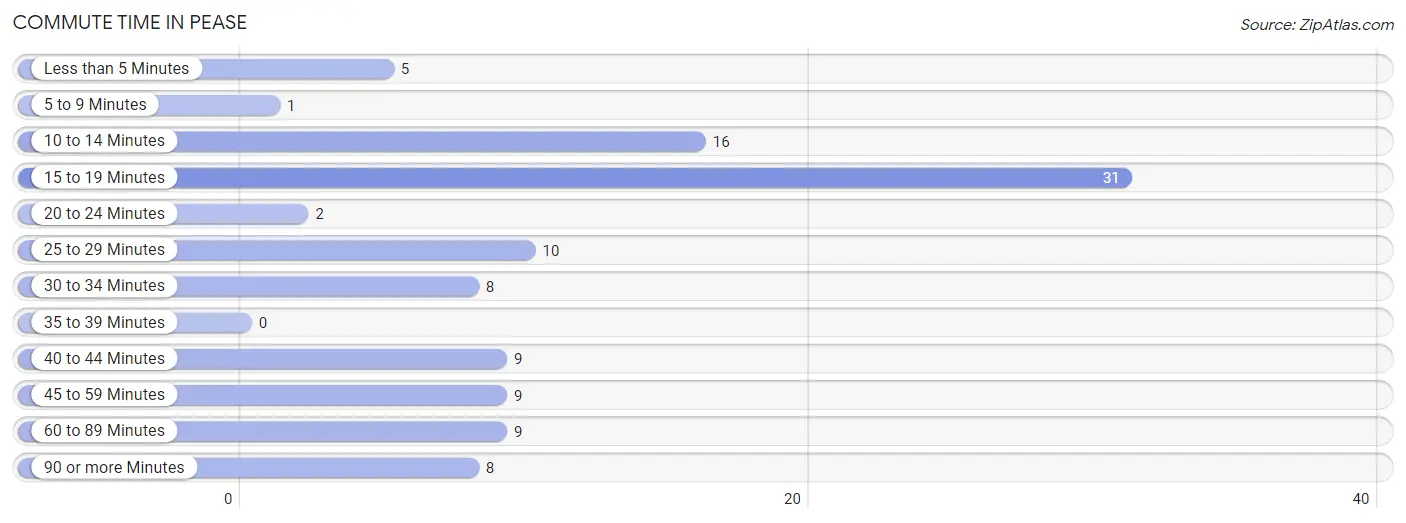
| Commute Time | # Commuters | % Commuters |
| Less than 5 Minutes | 5 | 4.6% |
| 5 to 9 Minutes | 1 | 0.9% |
| 10 to 14 Minutes | 16 | 14.8% |
| 15 to 19 Minutes | 31 | 28.7% |
| 20 to 24 Minutes | 2 | 1.8% |
| 25 to 29 Minutes | 10 | 9.3% |
| 30 to 34 Minutes | 8 | 7.4% |
| 35 to 39 Minutes | 0 | 0.0% |
| 40 to 44 Minutes | 9 | 8.3% |
| 45 to 59 Minutes | 9 | 8.3% |
| 60 to 89 Minutes | 9 | 8.3% |
| 90 or more Minutes | 8 | 7.4% |
Commute Time by Sex in Pease
The most common commute times in Pease are 15 to 19 minutes (15 commuters, 31.2%) for males and 15 to 19 minutes (16 commuters, 26.7%) for females.
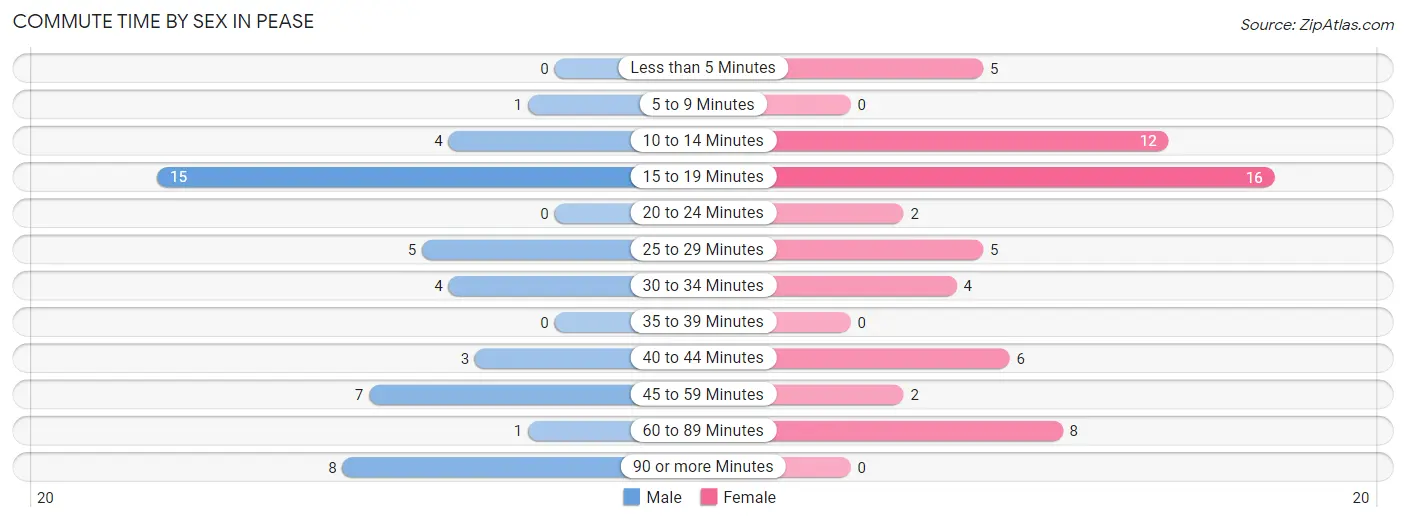
| Commute Time | Male | Female |
| Less than 5 Minutes | 0 (0.0%) | 5 (8.3%) |
| 5 to 9 Minutes | 1 (2.1%) | 0 (0.0%) |
| 10 to 14 Minutes | 4 (8.3%) | 12 (20.0%) |
| 15 to 19 Minutes | 15 (31.2%) | 16 (26.7%) |
| 20 to 24 Minutes | 0 (0.0%) | 2 (3.3%) |
| 25 to 29 Minutes | 5 (10.4%) | 5 (8.3%) |
| 30 to 34 Minutes | 4 (8.3%) | 4 (6.7%) |
| 35 to 39 Minutes | 0 (0.0%) | 0 (0.0%) |
| 40 to 44 Minutes | 3 (6.2%) | 6 (10.0%) |
| 45 to 59 Minutes | 7 (14.6%) | 2 (3.3%) |
| 60 to 89 Minutes | 1 (2.1%) | 8 (13.3%) |
| 90 or more Minutes | 8 (16.7%) | 0 (0.0%) |
Time of Departure to Work by Sex in Pease
The most frequent times of departure to work in Pease are 12:00 AM to 4:59 AM (13, 27.1%) for males and 5:00 AM to 5:29 AM (10, 16.7%) for females.
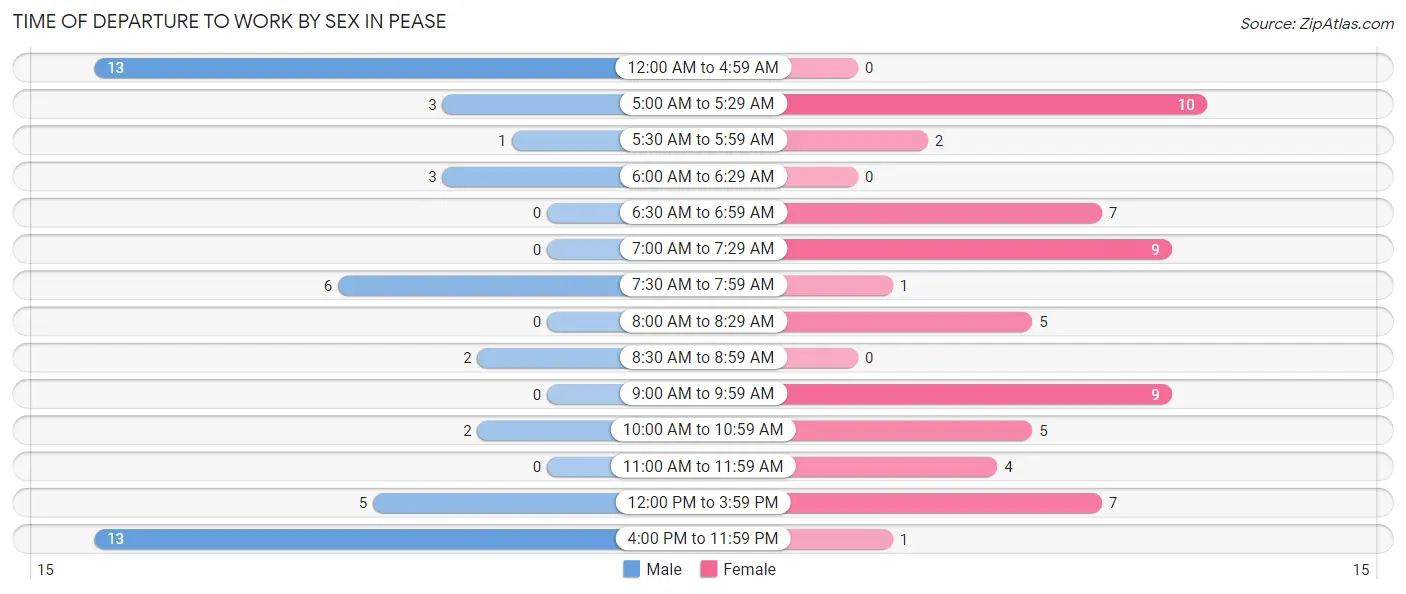
| Time of Departure | Male | Female |
| 12:00 AM to 4:59 AM | 13 (27.1%) | 0 (0.0%) |
| 5:00 AM to 5:29 AM | 3 (6.2%) | 10 (16.7%) |
| 5:30 AM to 5:59 AM | 1 (2.1%) | 2 (3.3%) |
| 6:00 AM to 6:29 AM | 3 (6.2%) | 0 (0.0%) |
| 6:30 AM to 6:59 AM | 0 (0.0%) | 7 (11.7%) |
| 7:00 AM to 7:29 AM | 0 (0.0%) | 9 (15.0%) |
| 7:30 AM to 7:59 AM | 6 (12.5%) | 1 (1.7%) |
| 8:00 AM to 8:29 AM | 0 (0.0%) | 5 (8.3%) |
| 8:30 AM to 8:59 AM | 2 (4.2%) | 0 (0.0%) |
| 9:00 AM to 9:59 AM | 0 (0.0%) | 9 (15.0%) |
| 10:00 AM to 10:59 AM | 2 (4.2%) | 5 (8.3%) |
| 11:00 AM to 11:59 AM | 0 (0.0%) | 4 (6.7%) |
| 12:00 PM to 3:59 PM | 5 (10.4%) | 7 (11.7%) |
| 4:00 PM to 11:59 PM | 13 (27.1%) | 1 (1.7%) |
| Total | 48 (100.0%) | 60 (100.0%) |
Housing Occupancy in Pease
Occupancy by Ownership in Pease
Of the total 86 dwellings in Pease, owner-occupied units account for 67 (77.9%), while renter-occupied units make up 19 (22.1%).
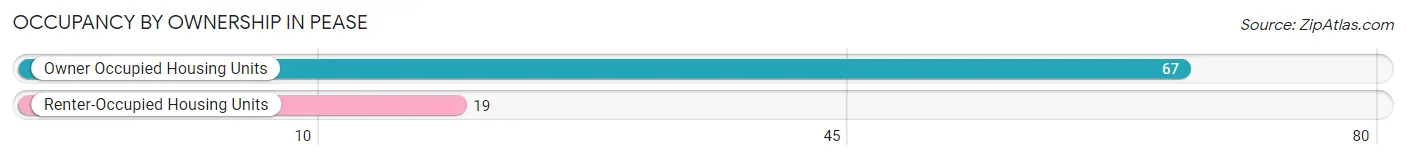
| Occupancy | # Housing Units | % Housing Units |
| Owner Occupied Housing Units | 67 | 77.9% |
| Renter-Occupied Housing Units | 19 | 22.1% |
| Total Occupied Housing Units | 86 | 100.0% |
Occupancy by Household Size in Pease
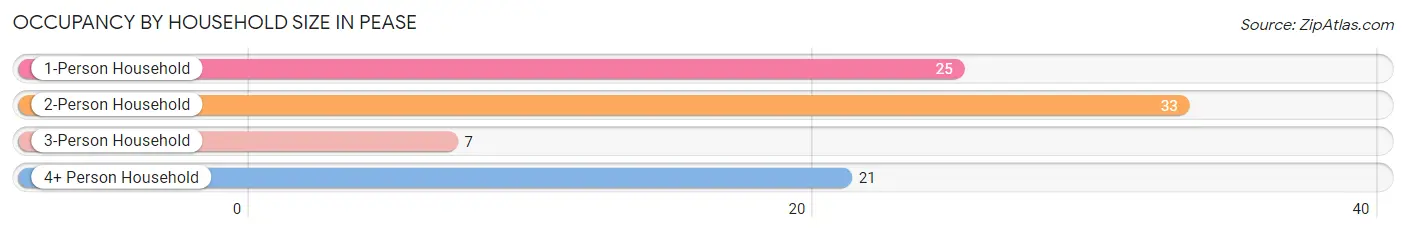
| Household Size | # Housing Units | % Housing Units |
| 1-Person Household | 25 | 29.1% |
| 2-Person Household | 33 | 38.4% |
| 3-Person Household | 7 | 8.1% |
| 4+ Person Household | 21 | 24.4% |
| Total Housing Units | 86 | 100.0% |
Occupancy by Ownership by Household Size in Pease
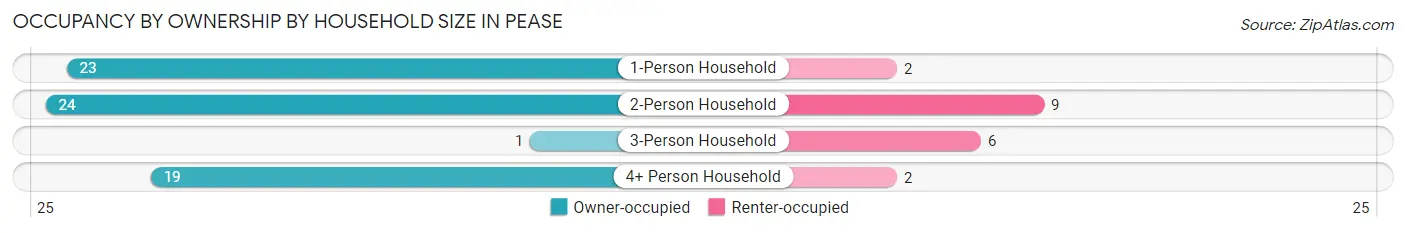
| Household Size | Owner-occupied | Renter-occupied |
| 1-Person Household | 23 (92.0%) | 2 (8.0%) |
| 2-Person Household | 24 (72.7%) | 9 (27.3%) |
| 3-Person Household | 1 (14.3%) | 6 (85.7%) |
| 4+ Person Household | 19 (90.5%) | 2 (9.5%) |
| Total Housing Units | 67 (77.9%) | 19 (22.1%) |
Occupancy by Educational Attainment in Pease
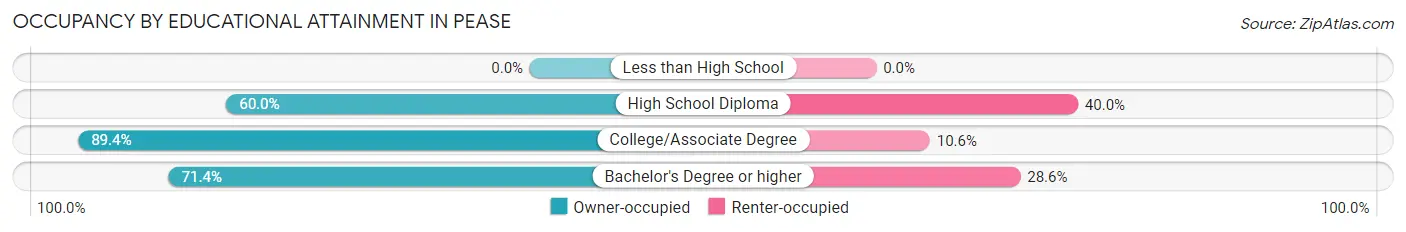
| Household Size | Owner-occupied | Renter-occupied |
| Less than High School | 0 (0.0%) | 0 (0.0%) |
| High School Diploma | 15 (60.0%) | 10 (40.0%) |
| College/Associate Degree | 42 (89.4%) | 5 (10.6%) |
| Bachelor's Degree or higher | 10 (71.4%) | 4 (28.6%) |
Occupancy by Age of Householder in Pease
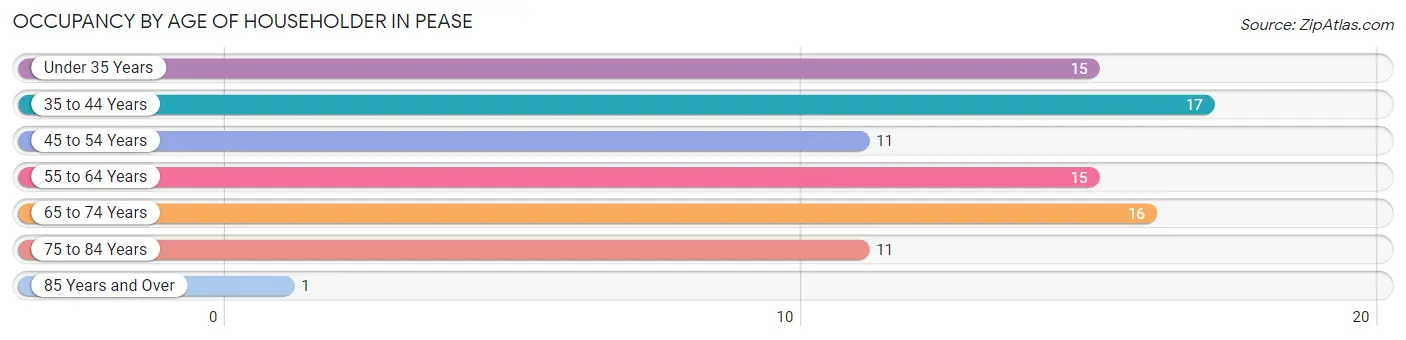
| Age Bracket | # Households | % Households |
| Under 35 Years | 15 | 17.4% |
| 35 to 44 Years | 17 | 19.8% |
| 45 to 54 Years | 11 | 12.8% |
| 55 to 64 Years | 15 | 17.4% |
| 65 to 74 Years | 16 | 18.6% |
| 75 to 84 Years | 11 | 12.8% |
| 85 Years and Over | 1 | 1.2% |
| Total | 86 | 100.0% |
Housing Finances in Pease
Median Income by Occupancy in Pease
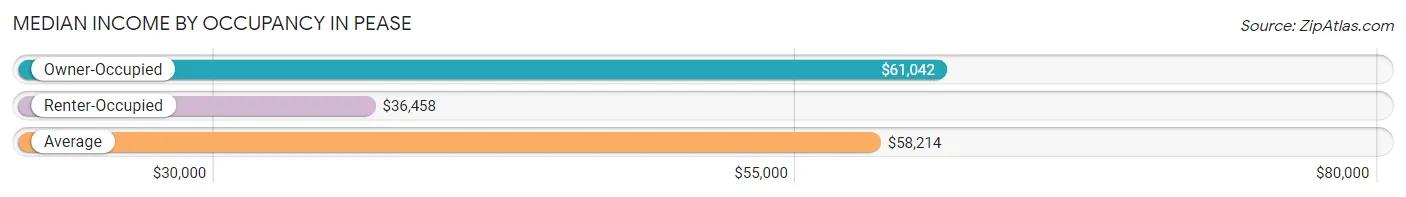
| Occupancy Type | # Households | Median Income |
| Owner-Occupied | 67 (77.9%) | $61,042 |
| Renter-Occupied | 19 (22.1%) | $36,458 |
| Average | 86 (100.0%) | $58,214 |
Occupancy by Householder Income Bracket in Pease
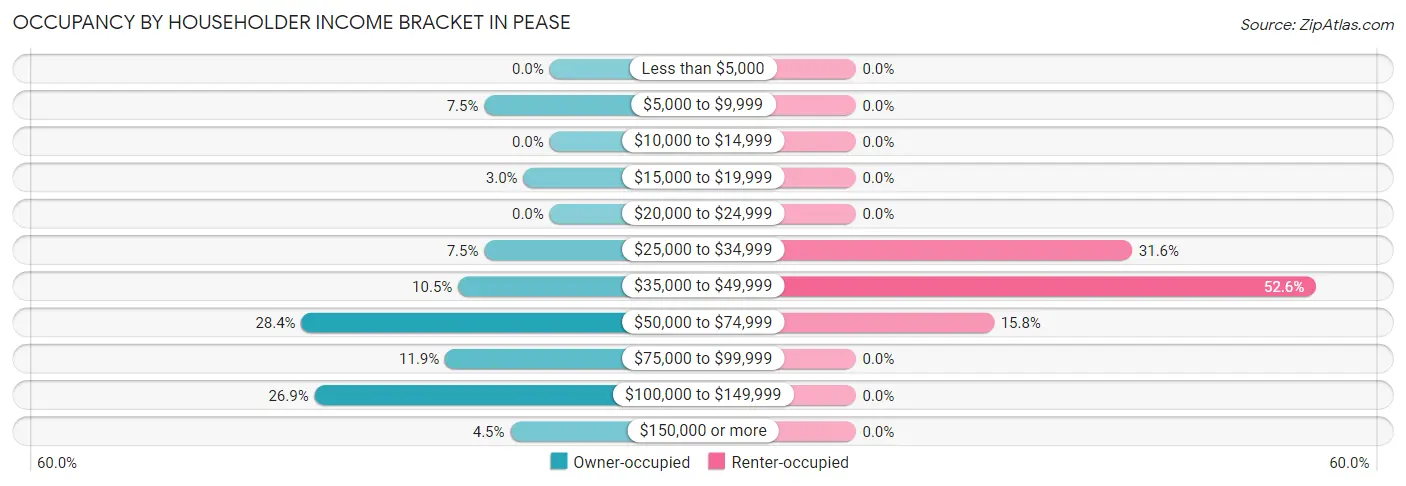
| Income Bracket | Owner-occupied | Renter-occupied |
| Less than $5,000 | 0 (0.0%) | 0 (0.0%) |
| $5,000 to $9,999 | 5 (7.5%) | 0 (0.0%) |
| $10,000 to $14,999 | 0 (0.0%) | 0 (0.0%) |
| $15,000 to $19,999 | 2 (3.0%) | 0 (0.0%) |
| $20,000 to $24,999 | 0 (0.0%) | 0 (0.0%) |
| $25,000 to $34,999 | 5 (7.5%) | 6 (31.6%) |
| $35,000 to $49,999 | 7 (10.4%) | 10 (52.6%) |
| $50,000 to $74,999 | 19 (28.4%) | 3 (15.8%) |
| $75,000 to $99,999 | 8 (11.9%) | 0 (0.0%) |
| $100,000 to $149,999 | 18 (26.9%) | 0 (0.0%) |
| $150,000 or more | 3 (4.5%) | 0 (0.0%) |
| Total | 67 (100.0%) | 19 (100.0%) |
Monthly Housing Cost Tiers in Pease
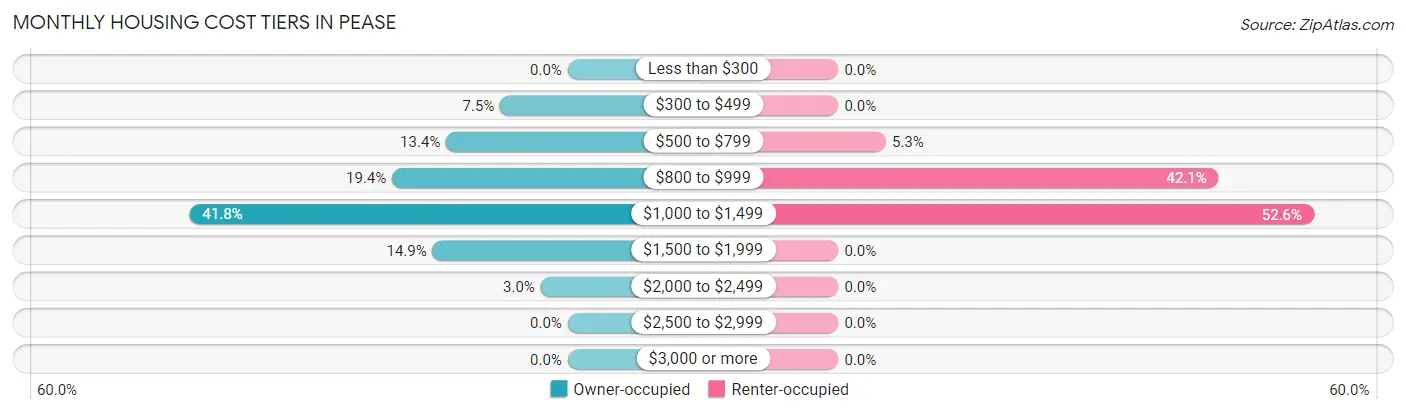
| Monthly Cost | Owner-occupied | Renter-occupied |
| Less than $300 | 0 (0.0%) | 0 (0.0%) |
| $300 to $499 | 5 (7.5%) | 0 (0.0%) |
| $500 to $799 | 9 (13.4%) | 1 (5.3%) |
| $800 to $999 | 13 (19.4%) | 8 (42.1%) |
| $1,000 to $1,499 | 28 (41.8%) | 10 (52.6%) |
| $1,500 to $1,999 | 10 (14.9%) | 0 (0.0%) |
| $2,000 to $2,499 | 2 (3.0%) | 0 (0.0%) |
| $2,500 to $2,999 | 0 (0.0%) | 0 (0.0%) |
| $3,000 or more | 0 (0.0%) | 0 (0.0%) |
| Total | 67 (100.0%) | 19 (100.0%) |
Physical Housing Characteristics in Pease
Housing Structures in Pease
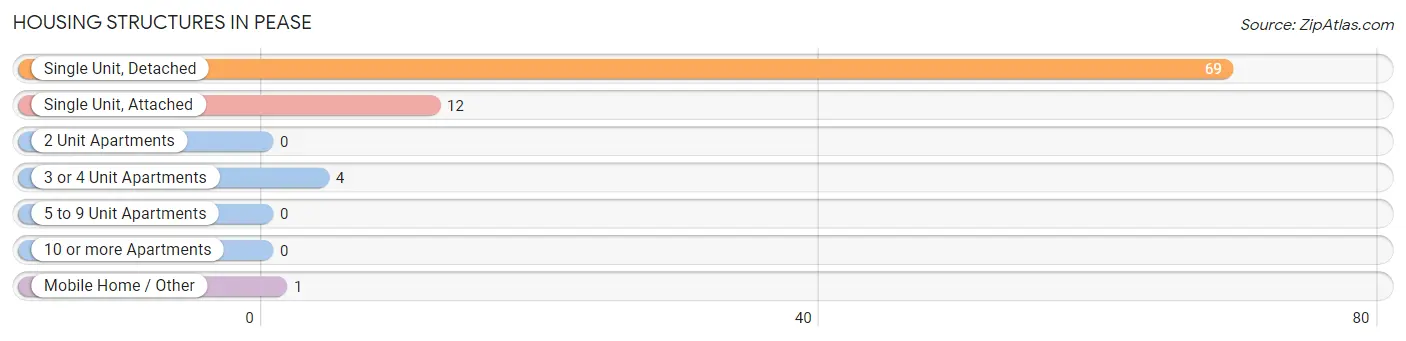
| Structure Type | # Housing Units | % Housing Units |
| Single Unit, Detached | 69 | 80.2% |
| Single Unit, Attached | 12 | 14.0% |
| 2 Unit Apartments | 0 | 0.0% |
| 3 or 4 Unit Apartments | 4 | 4.6% |
| 5 to 9 Unit Apartments | 0 | 0.0% |
| 10 or more Apartments | 0 | 0.0% |
| Mobile Home / Other | 1 | 1.2% |
| Total | 86 | 100.0% |
Housing Structures by Occupancy in Pease
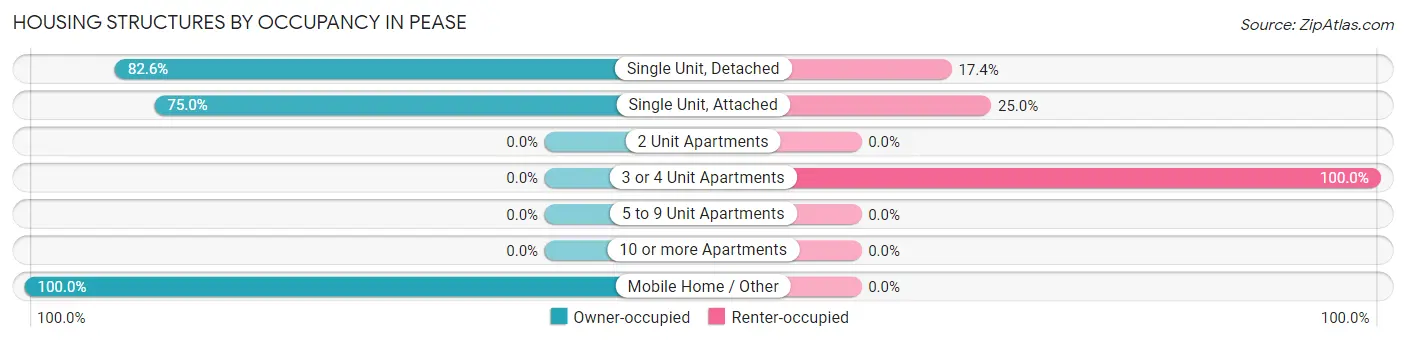
| Structure Type | Owner-occupied | Renter-occupied |
| Single Unit, Detached | 57 (82.6%) | 12 (17.4%) |
| Single Unit, Attached | 9 (75.0%) | 3 (25.0%) |
| 2 Unit Apartments | 0 (0.0%) | 0 (0.0%) |
| 3 or 4 Unit Apartments | 0 (0.0%) | 4 (100.0%) |
| 5 to 9 Unit Apartments | 0 (0.0%) | 0 (0.0%) |
| 10 or more Apartments | 0 (0.0%) | 0 (0.0%) |
| Mobile Home / Other | 1 (100.0%) | 0 (0.0%) |
| Total | 67 (77.9%) | 19 (22.1%) |
Housing Structures by Number of Rooms in Pease
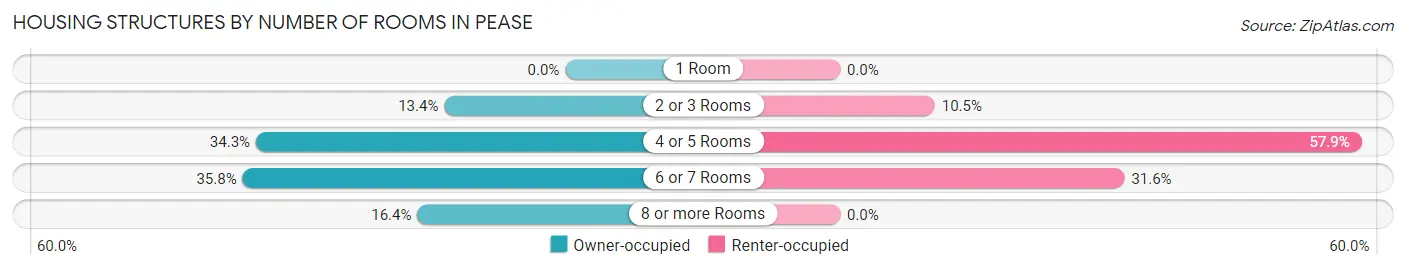
| Number of Rooms | Owner-occupied | Renter-occupied |
| 1 Room | 0 (0.0%) | 0 (0.0%) |
| 2 or 3 Rooms | 9 (13.4%) | 2 (10.5%) |
| 4 or 5 Rooms | 23 (34.3%) | 11 (57.9%) |
| 6 or 7 Rooms | 24 (35.8%) | 6 (31.6%) |
| 8 or more Rooms | 11 (16.4%) | 0 (0.0%) |
| Total | 67 (100.0%) | 19 (100.0%) |
Housing Structure by Heating Type in Pease
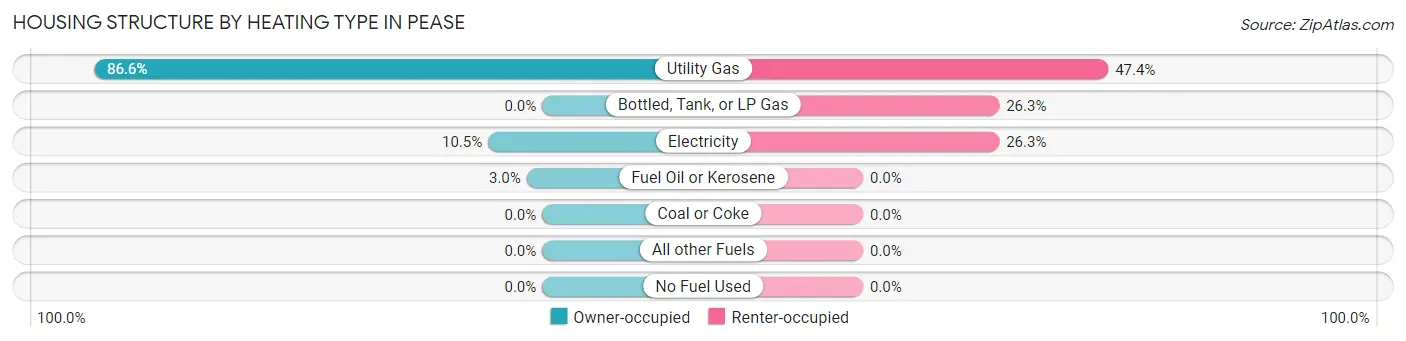
| Heating Type | Owner-occupied | Renter-occupied |
| Utility Gas | 58 (86.6%) | 9 (47.4%) |
| Bottled, Tank, or LP Gas | 0 (0.0%) | 5 (26.3%) |
| Electricity | 7 (10.4%) | 5 (26.3%) |
| Fuel Oil or Kerosene | 2 (3.0%) | 0 (0.0%) |
| Coal or Coke | 0 (0.0%) | 0 (0.0%) |
| All other Fuels | 0 (0.0%) | 0 (0.0%) |
| No Fuel Used | 0 (0.0%) | 0 (0.0%) |
| Total | 67 (100.0%) | 19 (100.0%) |
Household Vehicle Usage in Pease
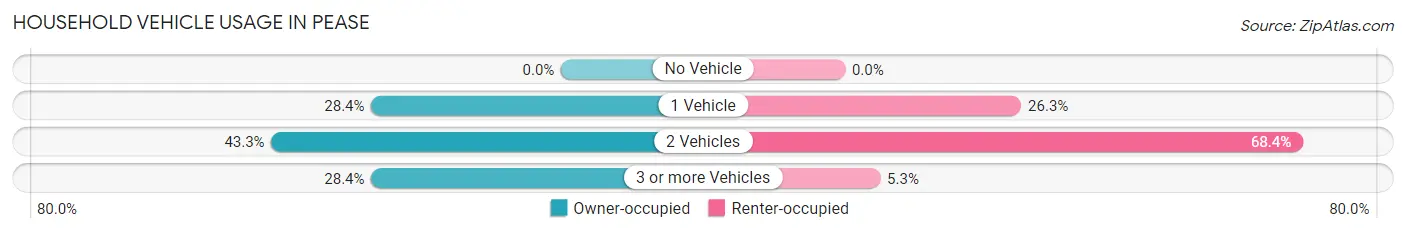
| Vehicles per Household | Owner-occupied | Renter-occupied |
| No Vehicle | 0 (0.0%) | 0 (0.0%) |
| 1 Vehicle | 19 (28.4%) | 5 (26.3%) |
| 2 Vehicles | 29 (43.3%) | 13 (68.4%) |
| 3 or more Vehicles | 19 (28.4%) | 1 (5.3%) |
| Total | 67 (100.0%) | 19 (100.0%) |
Real Estate & Mortgages in Pease
Real Estate and Mortgage Overview in Pease
| Characteristic | Without Mortgage | With Mortgage |
| Housing Units | 11 | 56 |
| Median Property Value | $158,900 | $142,500 |
| Median Household Income | $54,063 | $1 |
| Monthly Housing Costs | $513 | $0 |
| Real Estate Taxes | $1,438 | $0 |
Property Value by Mortgage Status in Pease
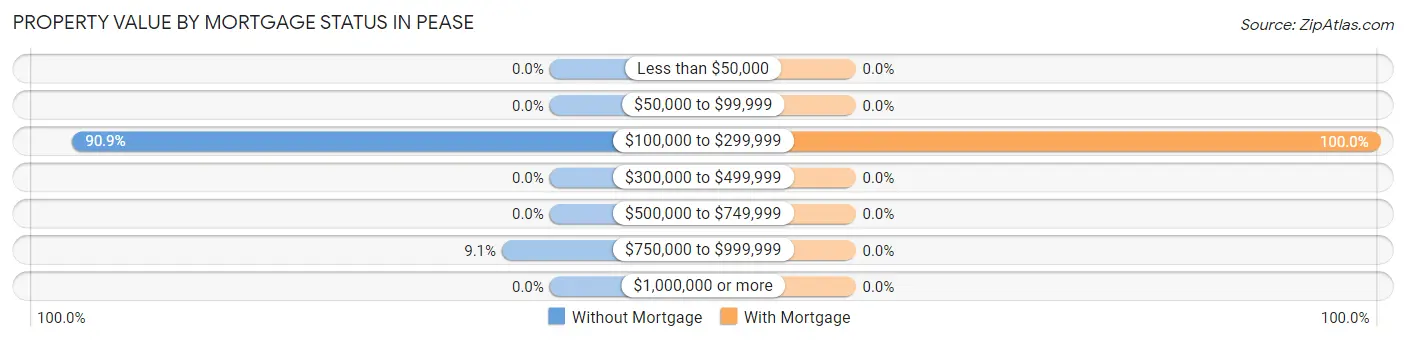
| Property Value | Without Mortgage | With Mortgage |
| Less than $50,000 | 0 (0.0%) | 0 (0.0%) |
| $50,000 to $99,999 | 0 (0.0%) | 0 (0.0%) |
| $100,000 to $299,999 | 10 (90.9%) | 56 (100.0%) |
| $300,000 to $499,999 | 0 (0.0%) | 0 (0.0%) |
| $500,000 to $749,999 | 0 (0.0%) | 0 (0.0%) |
| $750,000 to $999,999 | 1 (9.1%) | 0 (0.0%) |
| $1,000,000 or more | 0 (0.0%) | 0 (0.0%) |
| Total | 11 (100.0%) | 56 (100.0%) |
Household Income by Mortgage Status in Pease
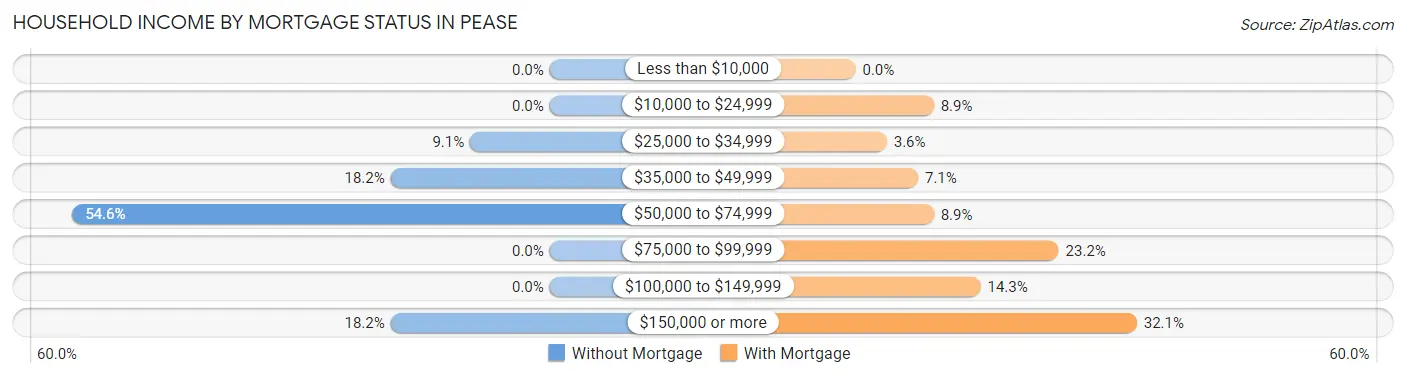
| Household Income | Without Mortgage | With Mortgage |
| Less than $10,000 | 0 (0.0%) | 0 (0.0%) |
| $10,000 to $24,999 | 0 (0.0%) | 5 (8.9%) |
| $25,000 to $34,999 | 1 (9.1%) | 2 (3.6%) |
| $35,000 to $49,999 | 2 (18.2%) | 4 (7.1%) |
| $50,000 to $74,999 | 6 (54.5%) | 5 (8.9%) |
| $75,000 to $99,999 | 0 (0.0%) | 13 (23.2%) |
| $100,000 to $149,999 | 0 (0.0%) | 8 (14.3%) |
| $150,000 or more | 2 (18.2%) | 18 (32.1%) |
| Total | 11 (100.0%) | 56 (100.0%) |
Property Value to Household Income Ratio in Pease
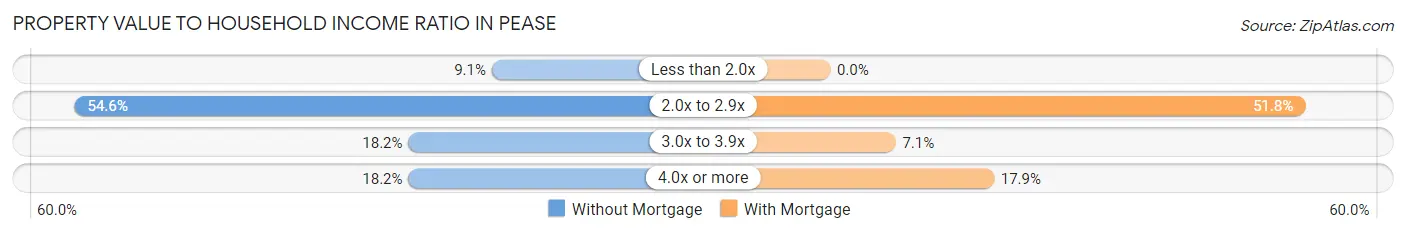
| Value-to-Income Ratio | Without Mortgage | With Mortgage |
| Less than 2.0x | 1 (9.1%) | 0 (0.0%) |
| 2.0x to 2.9x | 6 (54.5%) | 29 (51.8%) |
| 3.0x to 3.9x | 2 (18.2%) | 4 (7.1%) |
| 4.0x or more | 2 (18.2%) | 10 (17.9%) |
| Total | 11 (100.0%) | 56 (100.0%) |
Real Estate Taxes by Mortgage Status in Pease
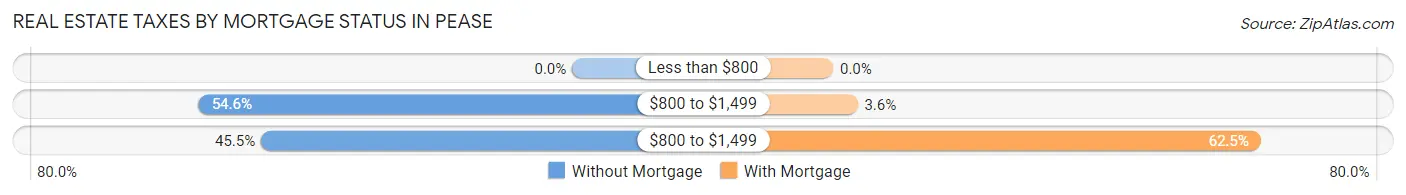
| Property Taxes | Without Mortgage | With Mortgage |
| Less than $800 | 0 (0.0%) | 0 (0.0%) |
| $800 to $1,499 | 6 (54.5%) | 2 (3.6%) |
| $800 to $1,499 | 5 (45.5%) | 35 (62.5%) |
| Total | 11 (100.0%) | 56 (100.0%) |
Health & Disability in Pease
Health Insurance Coverage by Age in Pease
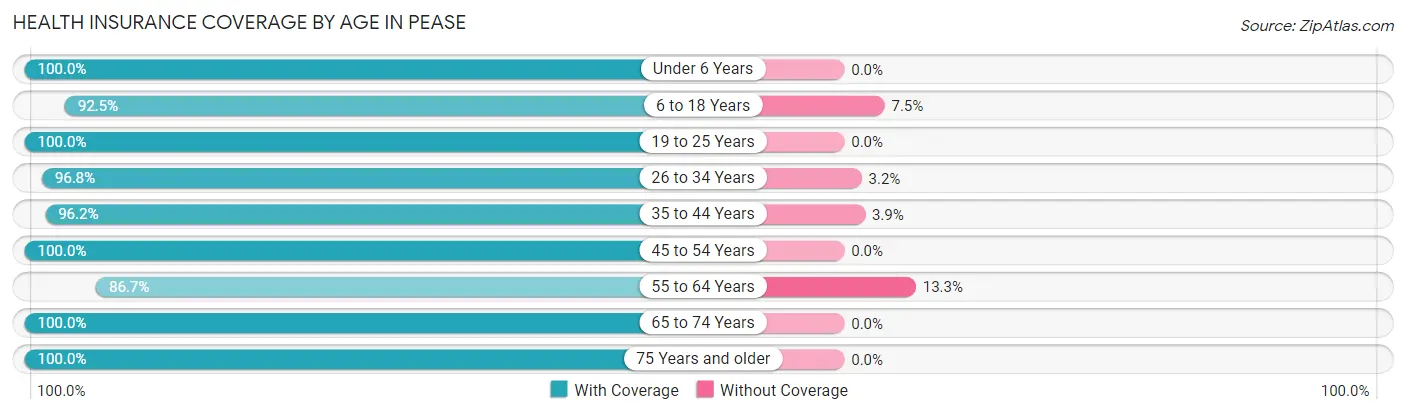
| Age Bracket | With Coverage | Without Coverage |
| Under 6 Years | 16 (100.0%) | 0 (0.0%) |
| 6 to 18 Years | 37 (92.5%) | 3 (7.5%) |
| 19 to 25 Years | 27 (100.0%) | 0 (0.0%) |
| 26 to 34 Years | 30 (96.8%) | 1 (3.2%) |
| 35 to 44 Years | 25 (96.2%) | 1 (3.8%) |
| 45 to 54 Years | 15 (100.0%) | 0 (0.0%) |
| 55 to 64 Years | 26 (86.7%) | 4 (13.3%) |
| 65 to 74 Years | 21 (100.0%) | 0 (0.0%) |
| 75 Years and older | 15 (100.0%) | 0 (0.0%) |
| Total | 212 (95.9%) | 9 (4.1%) |
Health Insurance Coverage by Citizenship Status in Pease
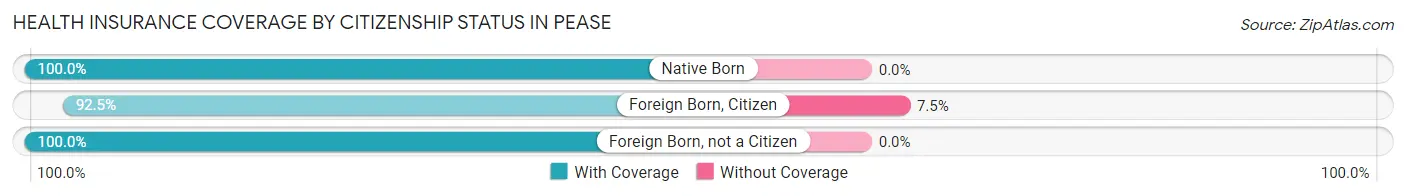
| Citizenship Status | With Coverage | Without Coverage |
| Native Born | 16 (100.0%) | 0 (0.0%) |
| Foreign Born, Citizen | 37 (92.5%) | 3 (7.5%) |
| Foreign Born, not a Citizen | 27 (100.0%) | 0 (0.0%) |
Health Insurance Coverage by Household Income in Pease
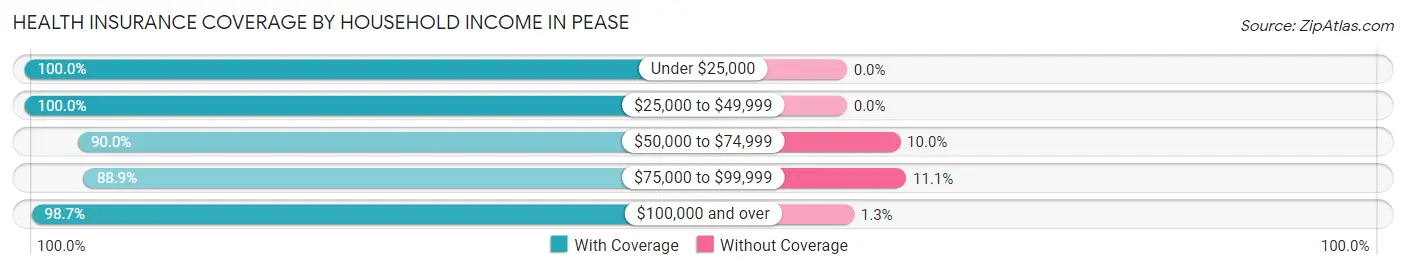
| Household Income | With Coverage | Without Coverage |
| Under $25,000 | 11 (100.0%) | 0 (0.0%) |
| $25,000 to $49,999 | 58 (100.0%) | 0 (0.0%) |
| $50,000 to $74,999 | 36 (90.0%) | 4 (10.0%) |
| $75,000 to $99,999 | 32 (88.9%) | 4 (11.1%) |
| $100,000 and over | 75 (98.7%) | 1 (1.3%) |
Public vs Private Health Insurance Coverage by Age in Pease
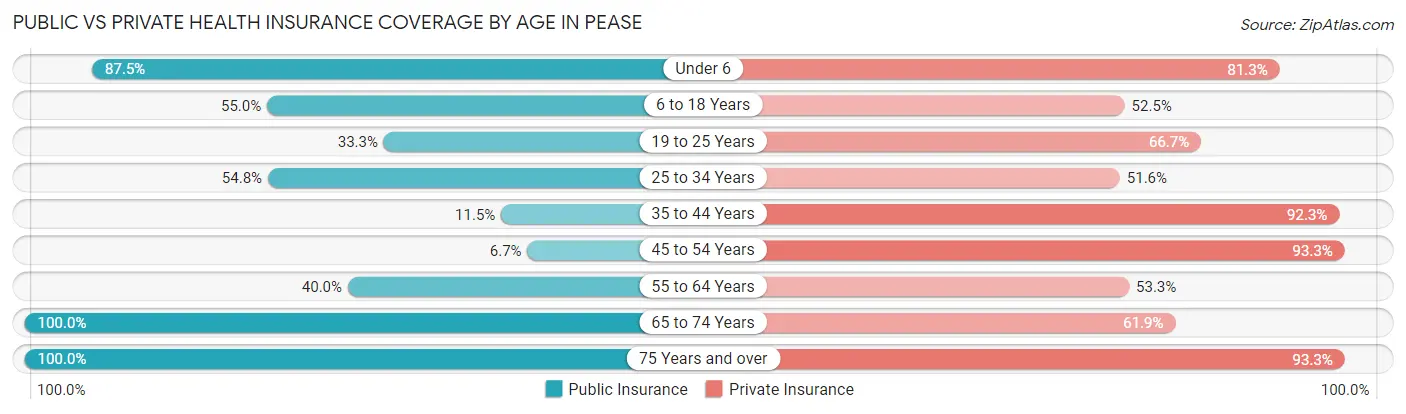
| Age Bracket | Public Insurance | Private Insurance |
| Under 6 | 14 (87.5%) | 13 (81.2%) |
| 6 to 18 Years | 22 (55.0%) | 21 (52.5%) |
| 19 to 25 Years | 9 (33.3%) | 18 (66.7%) |
| 25 to 34 Years | 17 (54.8%) | 16 (51.6%) |
| 35 to 44 Years | 3 (11.5%) | 24 (92.3%) |
| 45 to 54 Years | 1 (6.7%) | 14 (93.3%) |
| 55 to 64 Years | 12 (40.0%) | 16 (53.3%) |
| 65 to 74 Years | 21 (100.0%) | 13 (61.9%) |
| 75 Years and over | 15 (100.0%) | 14 (93.3%) |
| Total | 114 (51.6%) | 149 (67.4%) |
Disability Status by Sex by Age in Pease
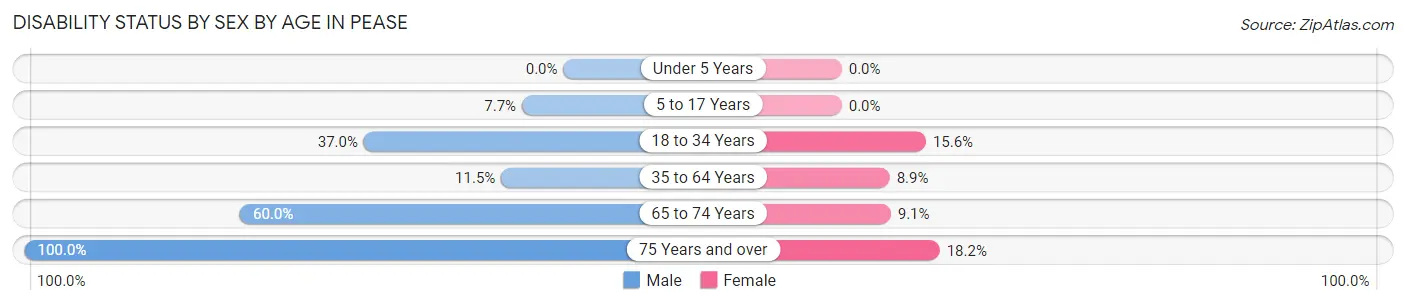
| Age Bracket | Male | Female |
| Under 5 Years | 0 (0.0%) | 0 (0.0%) |
| 5 to 17 Years | 2 (7.7%) | 0 (0.0%) |
| 18 to 34 Years | 10 (37.0%) | 5 (15.6%) |
| 35 to 64 Years | 3 (11.5%) | 4 (8.9%) |
| 65 to 74 Years | 6 (60.0%) | 1 (9.1%) |
| 75 Years and over | 4 (100.0%) | 2 (18.2%) |
Disability Class by Sex by Age in Pease
Disability Class: Hearing Difficulty
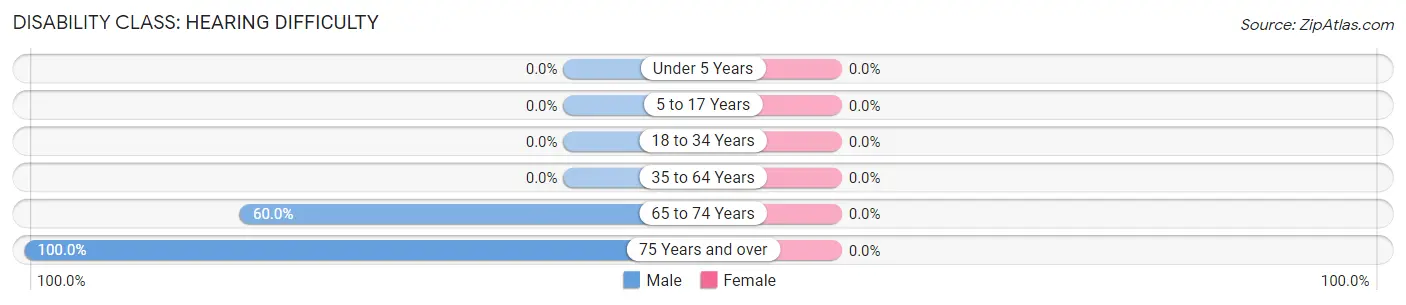
| Age Bracket | Male | Female |
| Under 5 Years | 0 (0.0%) | 0 (0.0%) |
| 5 to 17 Years | 0 (0.0%) | 0 (0.0%) |
| 18 to 34 Years | 0 (0.0%) | 0 (0.0%) |
| 35 to 64 Years | 0 (0.0%) | 0 (0.0%) |
| 65 to 74 Years | 6 (60.0%) | 0 (0.0%) |
| 75 Years and over | 4 (100.0%) | 0 (0.0%) |
Disability Class: Vision Difficulty
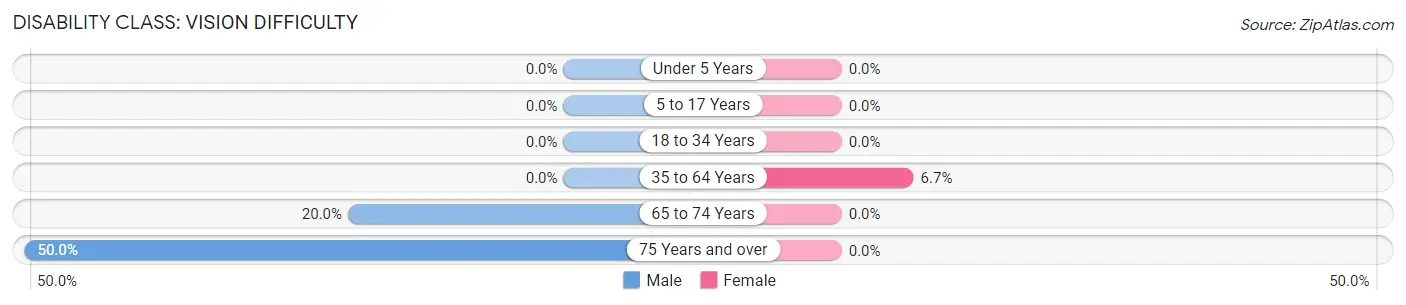
| Age Bracket | Male | Female |
| Under 5 Years | 0 (0.0%) | 0 (0.0%) |
| 5 to 17 Years | 0 (0.0%) | 0 (0.0%) |
| 18 to 34 Years | 0 (0.0%) | 0 (0.0%) |
| 35 to 64 Years | 0 (0.0%) | 3 (6.7%) |
| 65 to 74 Years | 2 (20.0%) | 0 (0.0%) |
| 75 Years and over | 2 (50.0%) | 0 (0.0%) |
Disability Class: Cognitive Difficulty
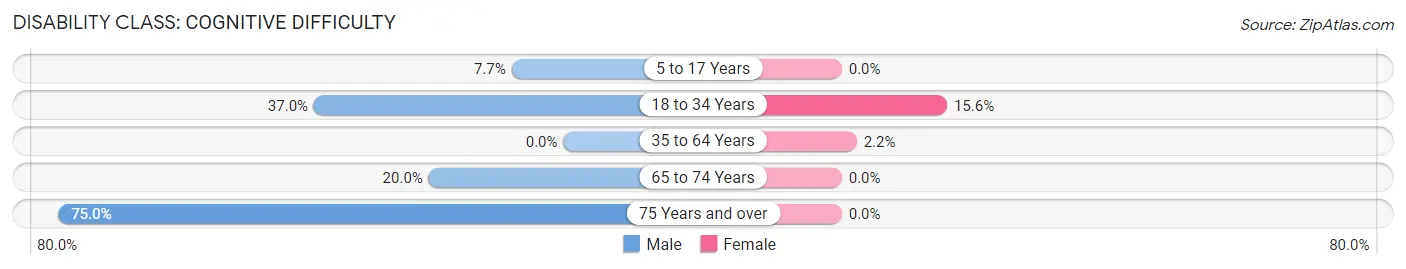
| Age Bracket | Male | Female |
| 5 to 17 Years | 2 (7.7%) | 0 (0.0%) |
| 18 to 34 Years | 10 (37.0%) | 5 (15.6%) |
| 35 to 64 Years | 0 (0.0%) | 1 (2.2%) |
| 65 to 74 Years | 2 (20.0%) | 0 (0.0%) |
| 75 Years and over | 3 (75.0%) | 0 (0.0%) |
Disability Class: Ambulatory Difficulty
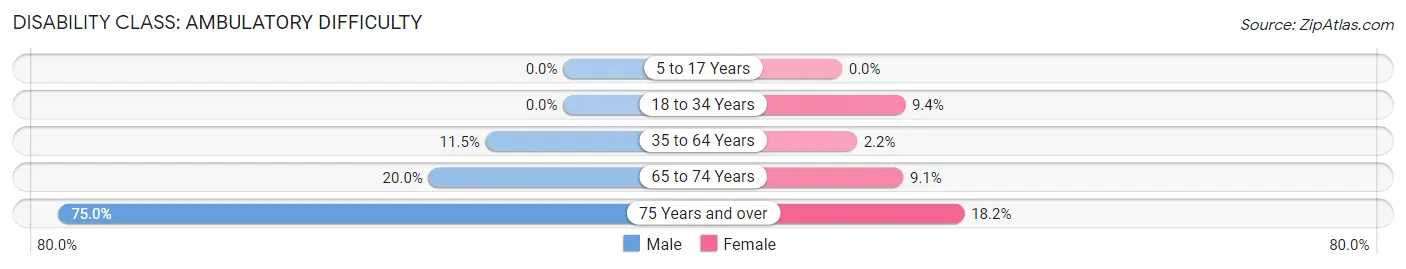
| Age Bracket | Male | Female |
| 5 to 17 Years | 0 (0.0%) | 0 (0.0%) |
| 18 to 34 Years | 0 (0.0%) | 3 (9.4%) |
| 35 to 64 Years | 3 (11.5%) | 1 (2.2%) |
| 65 to 74 Years | 2 (20.0%) | 1 (9.1%) |
| 75 Years and over | 3 (75.0%) | 2 (18.2%) |
Disability Class: Self-Care Difficulty
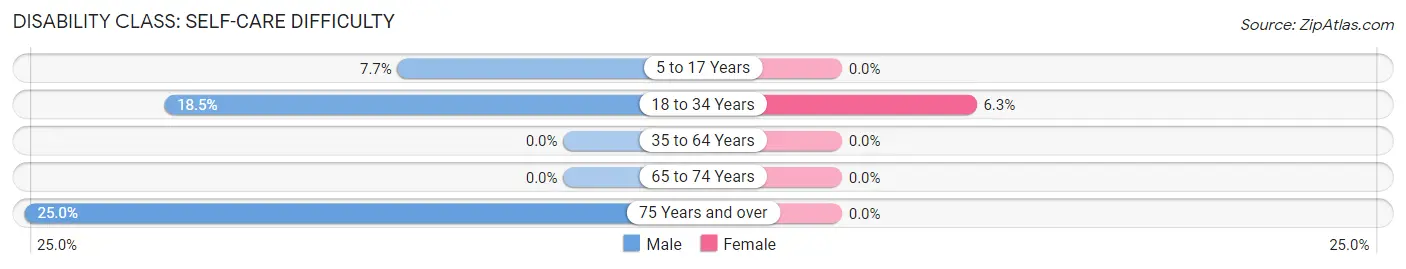
| Age Bracket | Male | Female |
| 5 to 17 Years | 2 (7.7%) | 0 (0.0%) |
| 18 to 34 Years | 5 (18.5%) | 2 (6.2%) |
| 35 to 64 Years | 0 (0.0%) | 0 (0.0%) |
| 65 to 74 Years | 0 (0.0%) | 0 (0.0%) |
| 75 Years and over | 1 (25.0%) | 0 (0.0%) |
Technology Access in Pease
Computing Device Access in Pease
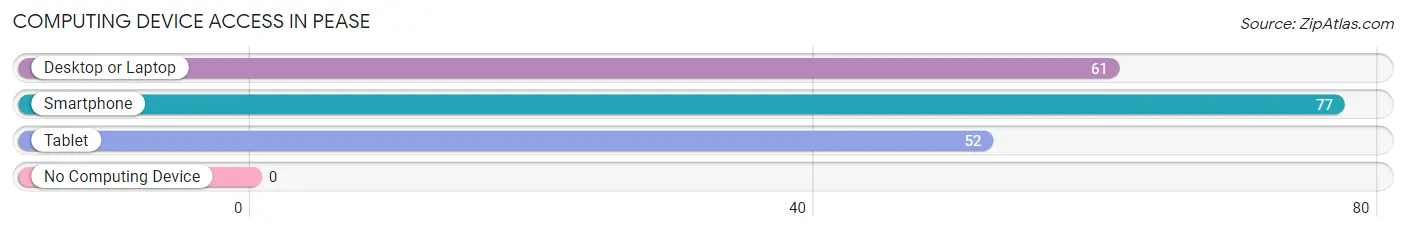
| Device Type | # Households | % Households |
| Desktop or Laptop | 61 | 70.9% |
| Smartphone | 77 | 89.5% |
| Tablet | 52 | 60.5% |
| No Computing Device | 0 | 0.0% |
| Total | 86 | 100.0% |
Internet Access in Pease
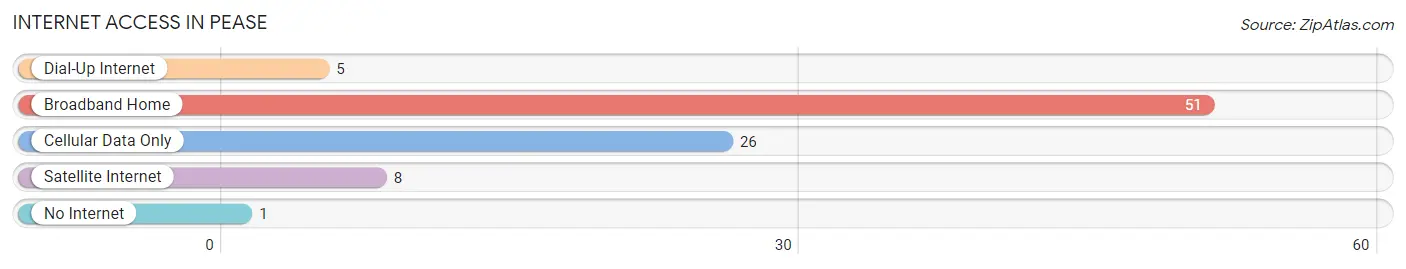
| Internet Type | # Households | % Households |
| Dial-Up Internet | 5 | 5.8% |
| Broadband Home | 51 | 59.3% |
| Cellular Data Only | 26 | 30.2% |
| Satellite Internet | 8 | 9.3% |
| No Internet | 1 | 1.2% |
| Total | 86 | 100.0% |
Pease Summary
Pease, Minnesota is a small city located in the southeastern corner of the state, near the border of Wisconsin. It is part of the Twin Cities metropolitan area and is located in Pine County. The city has a population of just over 1,000 people and is known for its rural charm and small-town atmosphere.
History
Pease was founded in 1856 by a group of settlers from Wisconsin. The town was named after the Pease family, who were among the first settlers. The town was originally a logging and farming community, and the first post office was established in 1858.
In the late 19th century, Pease became a popular tourist destination due to its proximity to the St. Croix River. The town was also known for its mineral springs, which were believed to have healing properties.
In the early 20th century, Pease began to experience a decline in population as people moved away to larger cities. However, the town was able to remain relatively stable due to its proximity to the Twin Cities.
Geography
Pease is located in the southeastern corner of Minnesota, near the border of Wisconsin. The city is situated on the banks of the St. Croix River, which is a major tributary of the Mississippi River. The city is surrounded by rolling hills and forests, and is located in the Pine County.
The climate in Pease is typical of the Midwest, with cold winters and hot summers. The average temperature in the winter is around 20 degrees Fahrenheit, and the average temperature in the summer is around 75 degrees Fahrenheit.
Economy
The economy of Pease is largely based on agriculture and tourism. The city is home to several farms, which produce a variety of crops, including corn, soybeans, and wheat. The city is also home to several tourist attractions, including the St. Croix River, which is a popular destination for fishing, boating, and swimming.
The city is also home to several small businesses, including restaurants, shops, and other services. The city is also home to a small industrial park, which is home to several manufacturing companies.
Demographics
As of the 2010 census, the population of Pease was 1,072. The racial makeup of the city was 97.3% White, 0.7% African American, 0.2% Native American, 0.2% Asian, 0.1% Pacific Islander, 0.3% from other races, and 1.3% from two or more races. Hispanic or Latino of any race were 1.3% of the population.
The median income for a household in Pease was $41,250, and the median income for a family was $50,000. The per capita income for the city was $20,845. About 8.3% of families and 10.2% of the population were below the poverty line, including 14.3% of those under age 18 and 6.3% of those age 65 or over.
Overall, Pease is a small city with a rural charm and a small-town atmosphere. The city is home to a variety of businesses and attractions, and is a popular destination for tourists and outdoor enthusiasts. The city is also home to a diverse population, with a variety of racial and ethnic backgrounds.
Common Questions
What is the Total Population of Pease?
Total Population of Pease is 221.
What is the Total Male Population of Pease?
Total Male Population of Pease is 98.
What is the Total Female Population of Pease?
Total Female Population of Pease is 123.
What is the Ratio of Males per 100 Females in Pease?
There are 79.67 Males per 100 Females in Pease.
What is the Ratio of Females per 100 Males in Pease?
There are 125.51 Females per 100 Males in Pease.
What is the Median Population Age in Pease?
Median Population Age in Pease is 33.6 Years.
What is the Average Family Size in Pease
Average Family Size in Pease is 3.2 People.
What is the Average Household Size in Pease
Average Household Size in Pease is 2.6 People.
What is Per Capita Income in Pease?
Per Capita income in Pease is $27,640.
What is the Median Family Income in Pease?
Median Family Income in Pease is $74,375.
What is the Median Household income in Pease?
Median Household Income in Pease is $58,214.
What is Income or Wage Gap in Pease?
Income or Wage Gap in Pease is 24.9%.
Women in Pease earn 75.1 cents for every dollar earned by a man.
What is Inequality or Gini Index in Pease?
Inequality or Gini Index in Pease is 0.33.
How Large is the Labor Force in Pease?
There are 122 People in the Labor Forcein in Pease.
What is the Percentage of People in the Labor Force in Pease?
70.9% of People are in the Labor Force in Pease.
What is the Unemployment Rate in Pease?
Unemployment Rate in Pease is 4.1%.