Parkers Prairie, MN
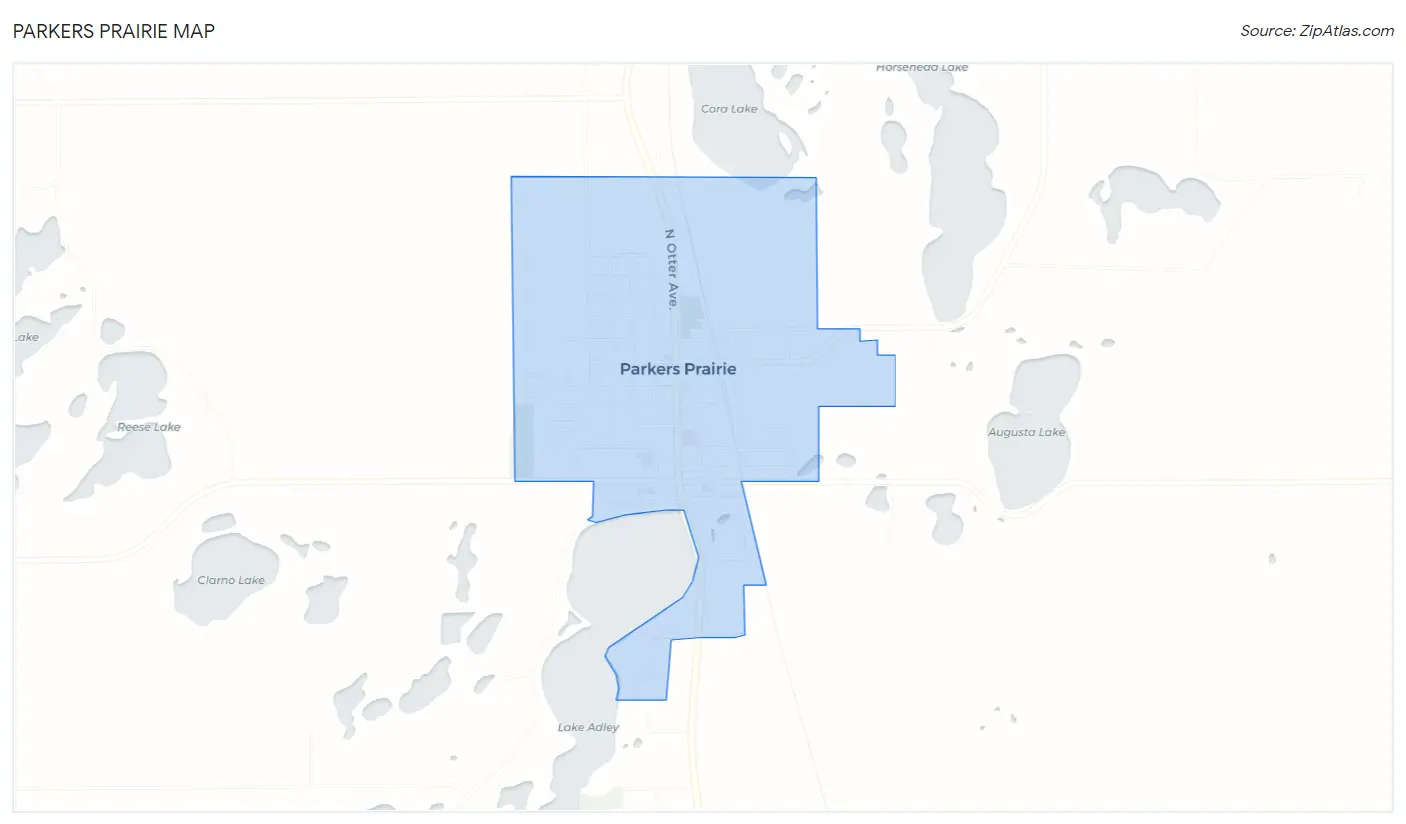
Parkers Prairie Map
Parkers Prairie Overview
1,209
TOTAL POPULATION
578
MALE POPULATION
631
FEMALE POPULATION
91.60
MALES / 100 FEMALES
109.17
FEMALES / 100 MALES
41.0
MEDIAN AGE
3.0
AVG FAMILY SIZE
2.6
AVG HOUSEHOLD SIZE
$26,601
PER CAPITA INCOME
$65,688
AVG FAMILY INCOME
$57,875
AVG HOUSEHOLD INCOME
28.2%
WAGE / INCOME GAP [ % ]
71.8¢/ $1
WAGE / INCOME GAP [ $ ]
$6,189
FAMILY INCOME DEFICIT
0.41
INEQUALITY / GINI INDEX
524
LABOR FORCE [ PEOPLE ]
55.4%
PERCENT IN LABOR FORCE
4.8%
UNEMPLOYMENT RATE
Parkers Prairie Zip Codes
Parkers Prairie Area Codes
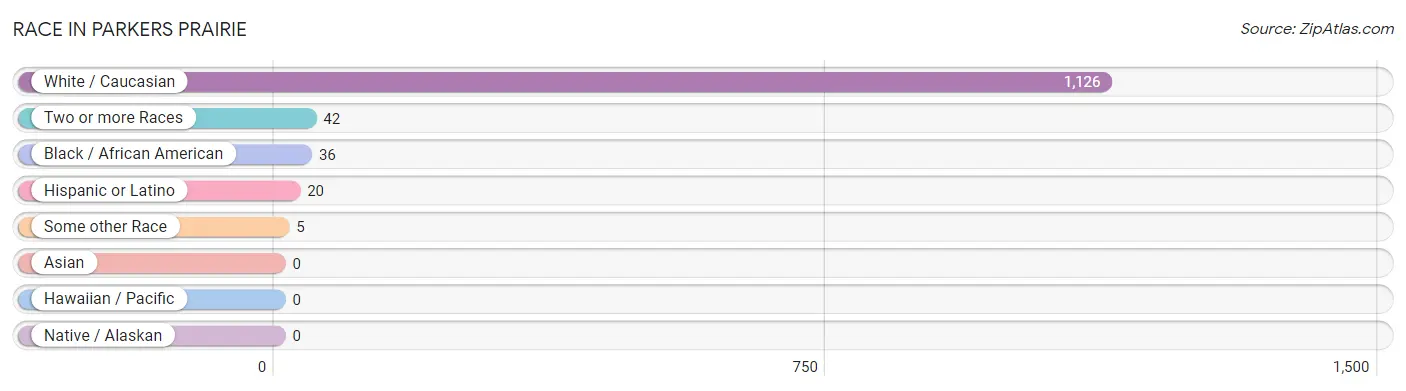
Race in Parkers Prairie
The most populous races in Parkers Prairie are White / Caucasian (1,126 | 93.1%), Two or more Races (42 | 3.5%), and Black / African American (36 | 3.0%).
| Race | # Population | % Population |
| Asian | 0 | 0.0% |
| Black / African American | 36 | 3.0% |
| Hawaiian / Pacific | 0 | 0.0% |
| Hispanic or Latino | 20 | 1.7% |
| Native / Alaskan | 0 | 0.0% |
| White / Caucasian | 1,126 | 93.1% |
| Two or more Races | 42 | 3.5% |
| Some other Race | 5 | 0.4% |
| Total | 1,209 | 100.0% |
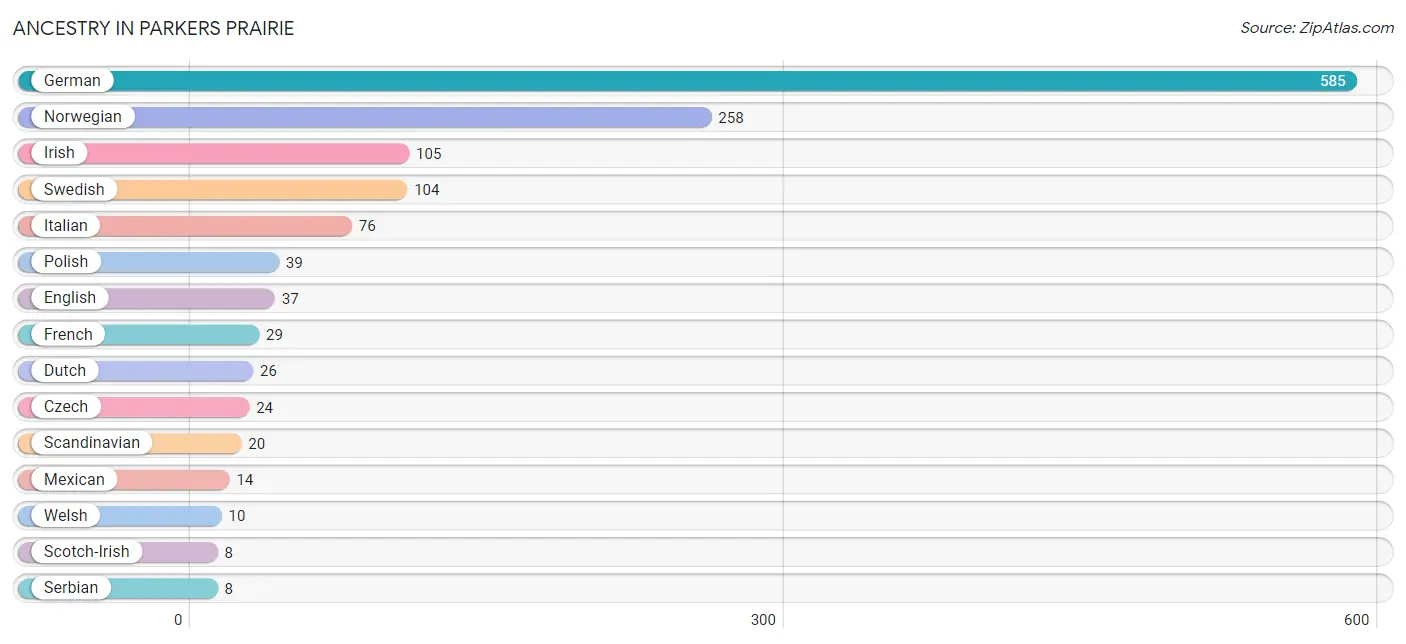
Ancestry in Parkers Prairie
The most populous ancestries reported in Parkers Prairie are German (585 | 48.4%), Norwegian (258 | 21.3%), Irish (105 | 8.7%), Swedish (104 | 8.6%), and Italian (76 | 6.3%), together accounting for 93.3% of all Parkers Prairie residents.
| Ancestry | # Population | % Population |
| American | 3 | 0.3% |
| Canadian | 5 | 0.4% |
| Czech | 24 | 2.0% |
| Dutch | 26 | 2.1% |
| English | 37 | 3.1% |
| European | 2 | 0.2% |
| French | 29 | 2.4% |
| German | 585 | 48.4% |
| Irish | 105 | 8.7% |
| Italian | 76 | 6.3% |
| Mexican | 14 | 1.2% |
| Norwegian | 258 | 21.3% |
| Polish | 39 | 3.2% |
| Scandinavian | 20 | 1.7% |
| Scotch-Irish | 8 | 0.7% |
| Scottish | 1 | 0.1% |
| Serbian | 8 | 0.7% |
| Spaniard | 2 | 0.2% |
| Subsaharan African | 6 | 0.5% |
| Swedish | 104 | 8.6% |
| Welsh | 10 | 0.8% | View All 21 Rows |
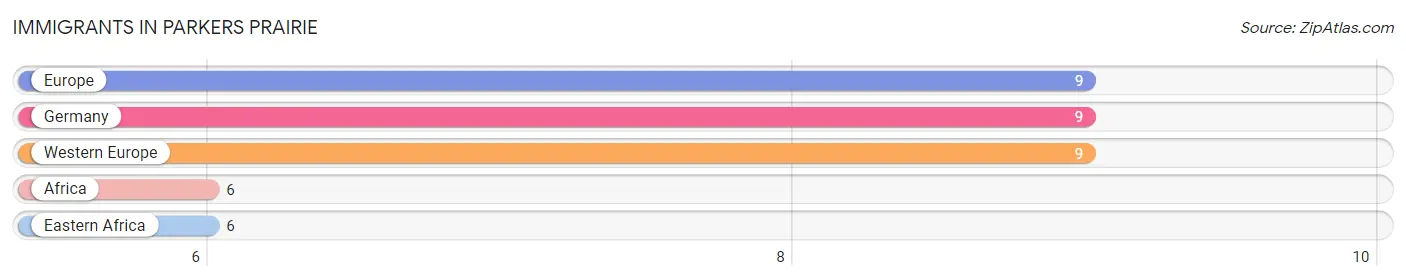
Immigrants in Parkers Prairie
The most numerous immigrant groups reported in Parkers Prairie came from Europe (9 | 0.7%), Germany (9 | 0.7%), Western Europe (9 | 0.7%), Africa (6 | 0.5%), and Eastern Africa (6 | 0.5%), together accounting for 3.2% of all Parkers Prairie residents.
| Immigration Origin | # Population | % Population |
| Africa | 6 | 0.5% |
| Eastern Africa | 6 | 0.5% |
| Europe | 9 | 0.7% |
| Germany | 9 | 0.7% |
| Western Europe | 9 | 0.7% | View All 5 Rows |
Sex and Age in Parkers Prairie
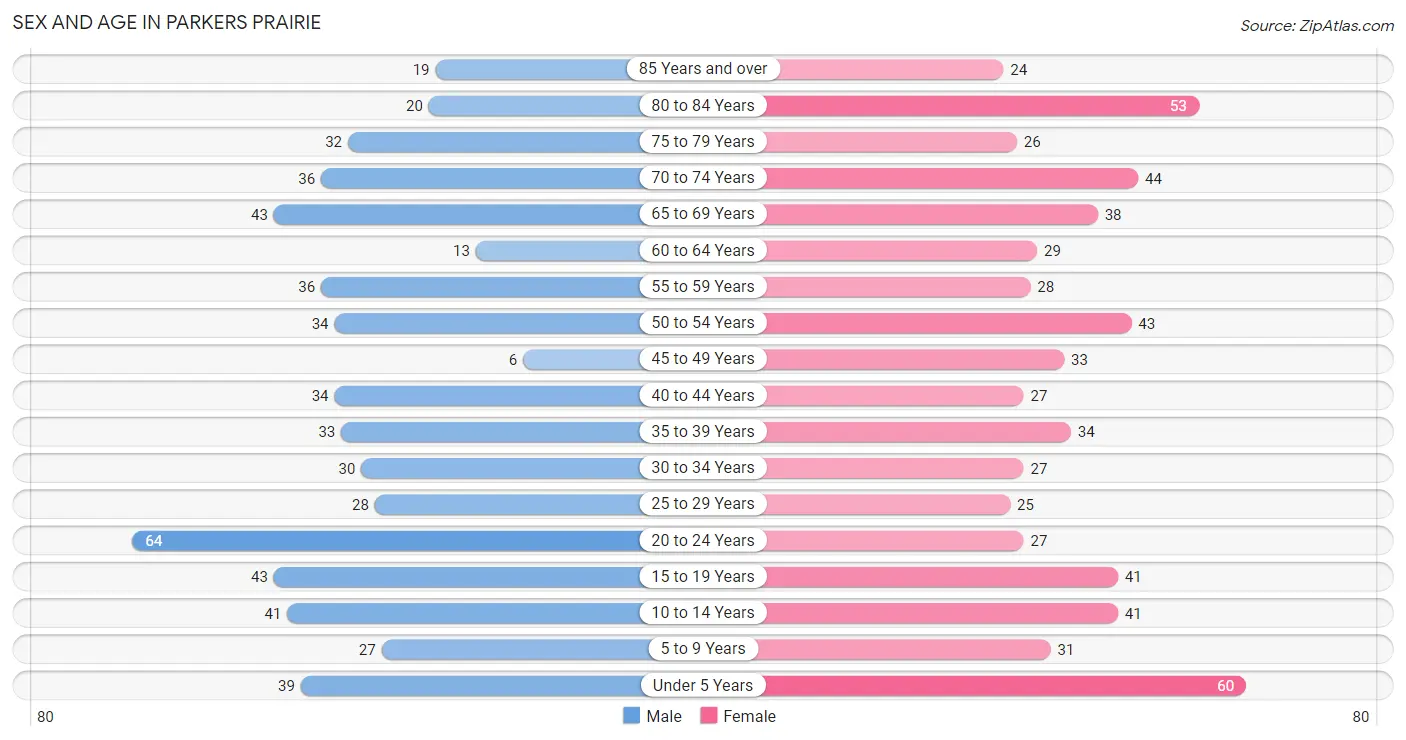
Sex and Age in Parkers Prairie
The most populous age groups in Parkers Prairie are 20 to 24 Years (64 | 11.1%) for men and Under 5 Years (60 | 9.5%) for women.
| Age Bracket | Male | Female |
| Under 5 Years | 39 (6.8%) | 60 (9.5%) |
| 5 to 9 Years | 27 (4.7%) | 31 (4.9%) |
| 10 to 14 Years | 41 (7.1%) | 41 (6.5%) |
| 15 to 19 Years | 43 (7.4%) | 41 (6.5%) |
| 20 to 24 Years | 64 (11.1%) | 27 (4.3%) |
| 25 to 29 Years | 28 (4.8%) | 25 (4.0%) |
| 30 to 34 Years | 30 (5.2%) | 27 (4.3%) |
| 35 to 39 Years | 33 (5.7%) | 34 (5.4%) |
| 40 to 44 Years | 34 (5.9%) | 27 (4.3%) |
| 45 to 49 Years | 6 (1.0%) | 33 (5.2%) |
| 50 to 54 Years | 34 (5.9%) | 43 (6.8%) |
| 55 to 59 Years | 36 (6.2%) | 28 (4.4%) |
| 60 to 64 Years | 13 (2.2%) | 29 (4.6%) |
| 65 to 69 Years | 43 (7.4%) | 38 (6.0%) |
| 70 to 74 Years | 36 (6.2%) | 44 (7.0%) |
| 75 to 79 Years | 32 (5.5%) | 26 (4.1%) |
| 80 to 84 Years | 20 (3.5%) | 53 (8.4%) |
| 85 Years and over | 19 (3.3%) | 24 (3.8%) |
| Total | 578 (100.0%) | 631 (100.0%) |
Families and Households in Parkers Prairie
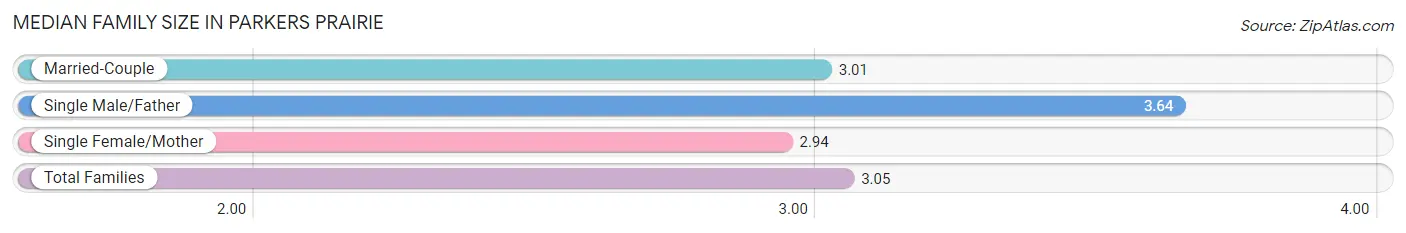
Median Family Size in Parkers Prairie
The median family size in Parkers Prairie is 3.05 persons per family, with single male/father families (22 | 7.8%) accounting for the largest median family size of 3.64 persons per family. On the other hand, single female/mother families (47 | 16.7%) represent the smallest median family size with 2.94 persons per family.
| Family Type | # Families | Family Size |
| Married-Couple | 212 (75.4%) | 3.01 |
| Single Male/Father | 22 (7.8%) | 3.64 |
| Single Female/Mother | 47 (16.7%) | 2.94 |
| Total Families | 281 (100.0%) | 3.05 |
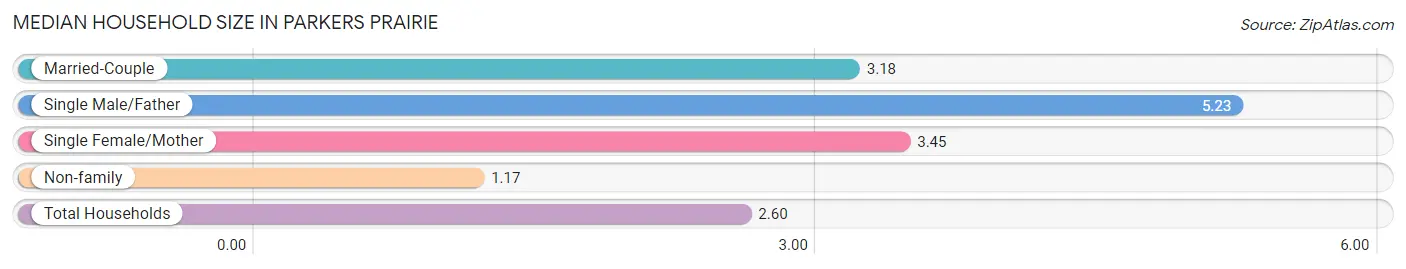
Median Household Size in Parkers Prairie
The median household size in Parkers Prairie is 2.60 persons per household, with single male/father households (22 | 5.0%) accounting for the largest median household size of 5.23 persons per household. non-family households (156 | 35.7%) represent the smallest median household size with 1.17 persons per household.
| Household Type | # Households | Household Size |
| Married-Couple | 212 (48.5%) | 3.18 |
| Single Male/Father | 22 (5.0%) | 5.23 |
| Single Female/Mother | 47 (10.8%) | 3.45 |
| Non-family | 156 (35.7%) | 1.17 |
| Total Households | 437 (100.0%) | 2.60 |
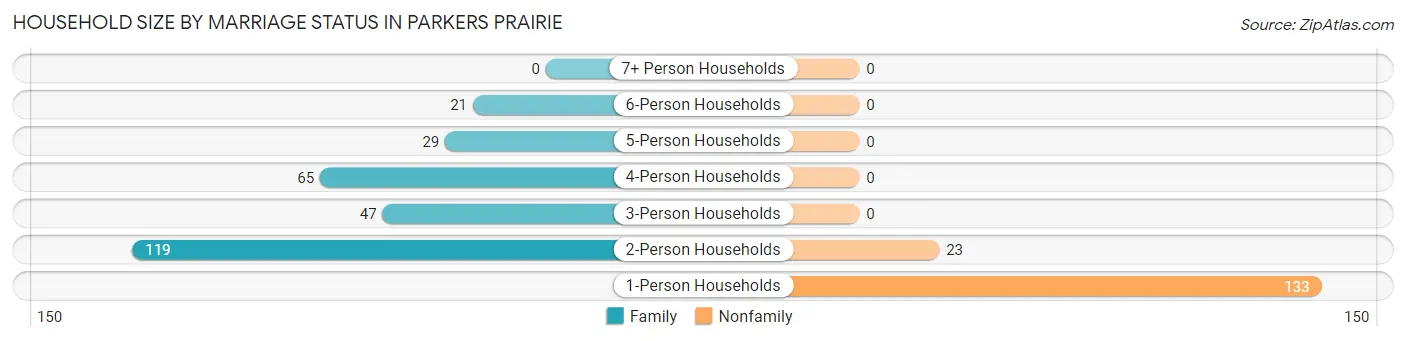
Household Size by Marriage Status in Parkers Prairie
Out of a total of 437 households in Parkers Prairie, 281 (64.3%) are family households, while 156 (35.7%) are nonfamily households. The most numerous type of family households are 2-person households, comprising 119, and the most common type of nonfamily households are 1-person households, comprising 133.
| Household Size | Family Households | Nonfamily Households |
| 1-Person Households | - | 133 (30.4%) |
| 2-Person Households | 119 (27.2%) | 23 (5.3%) |
| 3-Person Households | 47 (10.8%) | 0 (0.0%) |
| 4-Person Households | 65 (14.9%) | 0 (0.0%) |
| 5-Person Households | 29 (6.6%) | 0 (0.0%) |
| 6-Person Households | 21 (4.8%) | 0 (0.0%) |
| 7+ Person Households | 0 (0.0%) | 0 (0.0%) |
| Total | 281 (64.3%) | 156 (35.7%) |
Female Fertility in Parkers Prairie
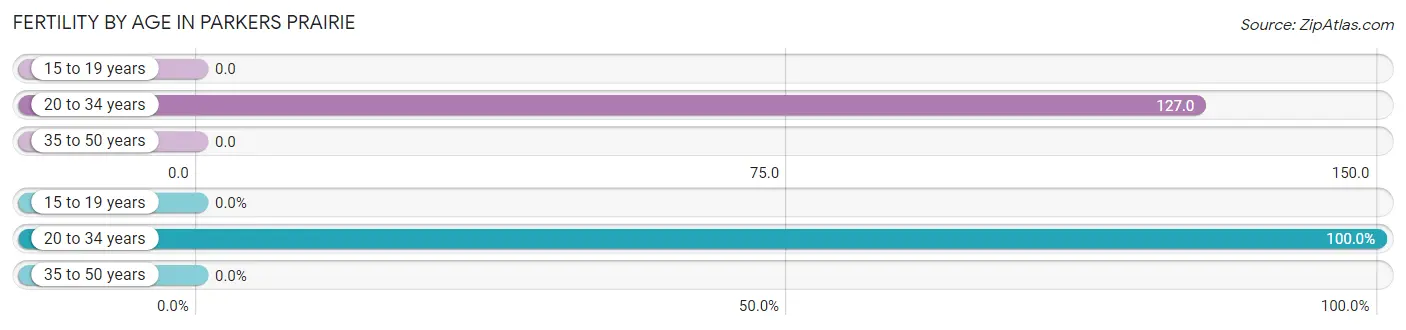
Fertility by Age in Parkers Prairie
Average fertility rate in Parkers Prairie is 44.0 births per 1,000 women. Women in the age bracket of 20 to 34 years have the highest fertility rate with 127.0 births per 1,000 women. Women in the age bracket of 20 to 34 years acount for 100.0% of all women with births.
| Age Bracket | Women with Births | Births / 1,000 Women |
| 15 to 19 years | 0 (0.0%) | 0.0 |
| 20 to 34 years | 10 (100.0%) | 127.0 |
| 35 to 50 years | 0 (0.0%) | 0.0 |
| Total | 10 (100.0%) | 44.0 |
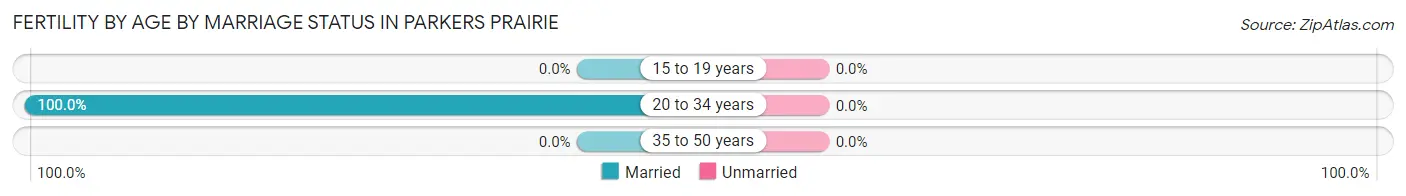
Fertility by Age by Marriage Status in Parkers Prairie
| Age Bracket | Married | Unmarried |
| 15 to 19 years | 0 (0.0%) | 0 (0.0%) |
| 20 to 34 years | 10 (100.0%) | 0 (0.0%) |
| 35 to 50 years | 0 (0.0%) | 0 (0.0%) |
| Total | 10 (100.0%) | 0 (0.0%) |
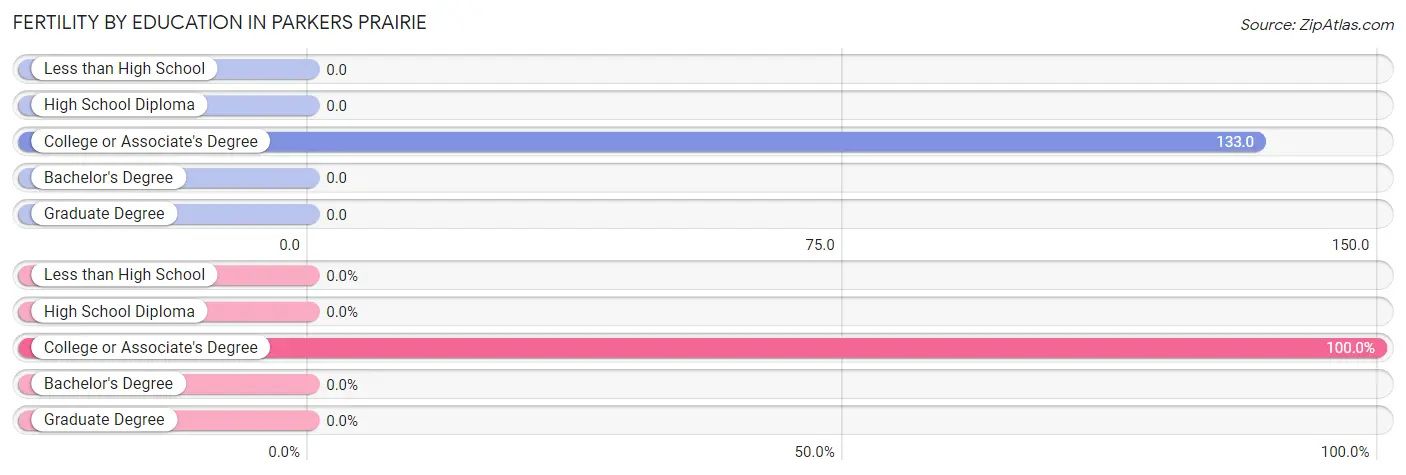
Fertility by Education in Parkers Prairie
| Educational Attainment | Women with Births | Births / 1,000 Women |
| Less than High School | 0 (0.0%) | 0.0 |
| High School Diploma | 0 (0.0%) | 0.0 |
| College or Associate's Degree | 10 (100.0%) | 133.0 |
| Bachelor's Degree | 0 (0.0%) | 0.0 |
| Graduate Degree | 0 (0.0%) | 0.0 |
| Total | 10 (100.0%) | 44.0 |
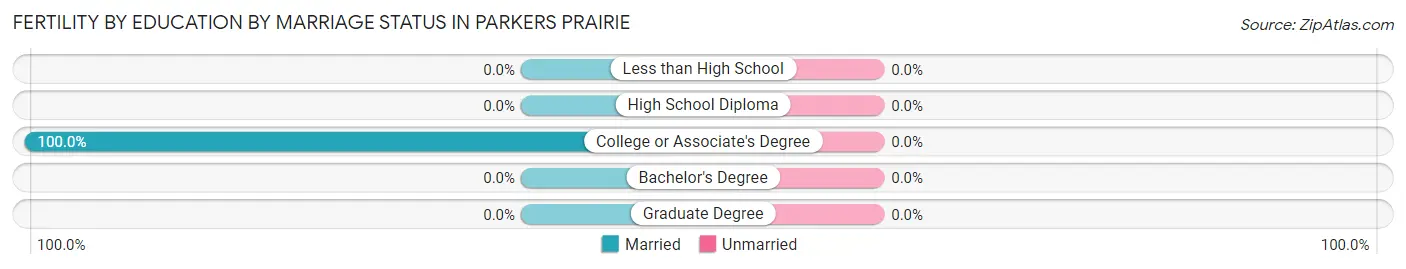
Fertility by Education by Marriage Status in Parkers Prairie
| Educational Attainment | Married | Unmarried |
| Less than High School | 0 (0.0%) | 0 (0.0%) |
| High School Diploma | 0 (0.0%) | 0 (0.0%) |
| College or Associate's Degree | 10 (100.0%) | 0 (0.0%) |
| Bachelor's Degree | 0 (0.0%) | 0 (0.0%) |
| Graduate Degree | 0 (0.0%) | 0 (0.0%) |
| Total | 10 (100.0%) | 0 (0.0%) |
Income in Parkers Prairie
Income Overview in Parkers Prairie
Per Capita Income in Parkers Prairie is $26,601, while median incomes of families and households are $65,688 and $57,875 respectively.
| Characteristic | Number | Measure |
| Per Capita Income | 1,209 | $26,601 |
| Median Family Income | 281 | $65,688 |
| Mean Family Income | 281 | $78,416 |
| Median Household Income | 437 | $57,875 |
| Mean Household Income | 437 | $68,177 |
| Income Deficit | 281 | $6,189 |
| Wage / Income Gap (%) | 1,209 | 28.17% |
| Wage / Income Gap ($) | 1,209 | 71.83¢ per $1 |
| Gini / Inequality Index | 1,209 | 0.41 |
Earnings by Sex in Parkers Prairie
Average Earnings in Parkers Prairie are $35,833, $39,833 for men and $28,611 for women, a difference of 28.2%.
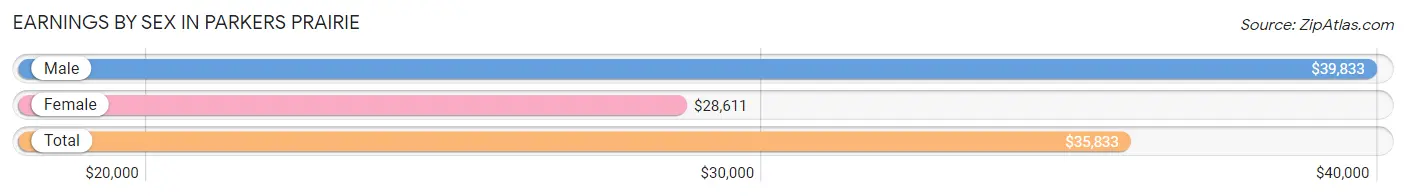
| Sex | Number | Average Earnings |
| Male | 304 (55.1%) | $39,833 |
| Female | 248 (44.9%) | $28,611 |
| Total | 552 (100.0%) | $35,833 |
Earnings by Sex by Income Bracket in Parkers Prairie
The most common earnings brackets in Parkers Prairie are $45,000 to $49,999 for men (34 | 11.2%) and $40,000 to $44,999 for women (24 | 9.7%).
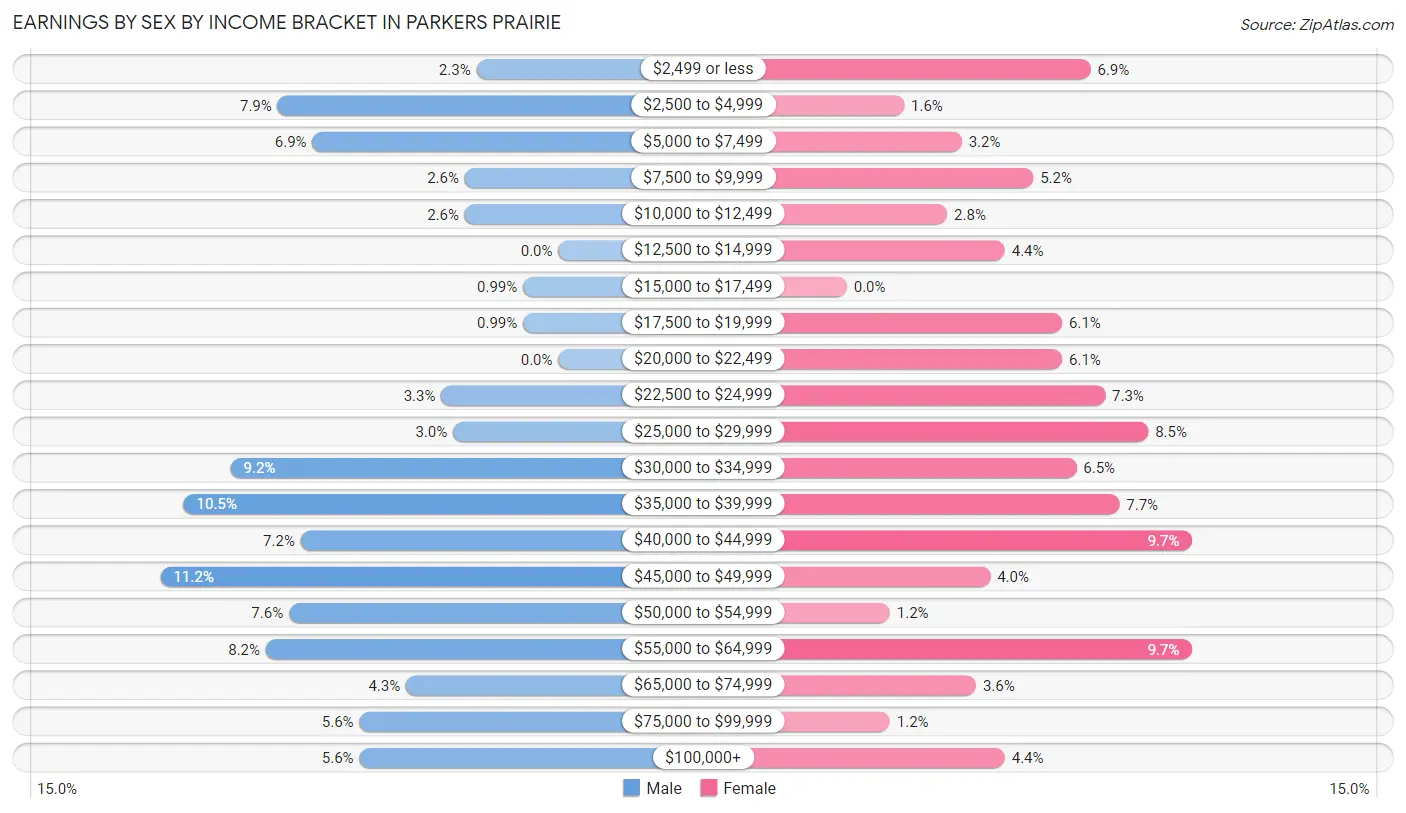
| Income | Male | Female |
| $2,499 or less | 7 (2.3%) | 17 (6.9%) |
| $2,500 to $4,999 | 24 (7.9%) | 4 (1.6%) |
| $5,000 to $7,499 | 21 (6.9%) | 8 (3.2%) |
| $7,500 to $9,999 | 8 (2.6%) | 13 (5.2%) |
| $10,000 to $12,499 | 8 (2.6%) | 7 (2.8%) |
| $12,500 to $14,999 | 0 (0.0%) | 11 (4.4%) |
| $15,000 to $17,499 | 3 (1.0%) | 0 (0.0%) |
| $17,500 to $19,999 | 3 (1.0%) | 15 (6.0%) |
| $20,000 to $22,499 | 0 (0.0%) | 15 (6.0%) |
| $22,500 to $24,999 | 10 (3.3%) | 18 (7.3%) |
| $25,000 to $29,999 | 9 (3.0%) | 21 (8.5%) |
| $30,000 to $34,999 | 28 (9.2%) | 16 (6.5%) |
| $35,000 to $39,999 | 32 (10.5%) | 19 (7.7%) |
| $40,000 to $44,999 | 22 (7.2%) | 24 (9.7%) |
| $45,000 to $49,999 | 34 (11.2%) | 10 (4.0%) |
| $50,000 to $54,999 | 23 (7.6%) | 3 (1.2%) |
| $55,000 to $64,999 | 25 (8.2%) | 24 (9.7%) |
| $65,000 to $74,999 | 13 (4.3%) | 9 (3.6%) |
| $75,000 to $99,999 | 17 (5.6%) | 3 (1.2%) |
| $100,000+ | 17 (5.6%) | 11 (4.4%) |
| Total | 304 (100.0%) | 248 (100.0%) |
Earnings by Sex by Educational Attainment in Parkers Prairie
Average earnings in Parkers Prairie are $44,545 for men and $31,154 for women, a difference of 30.1%. Men with an educational attainment of college or associate's degree enjoy the highest average annual earnings of $49,286, while those with bachelor's degree education earn the least with $27,813. Women with an educational attainment of bachelor's degree earn the most with the average annual earnings of $55,938, while those with high school diploma education have the smallest earnings of $24,861.
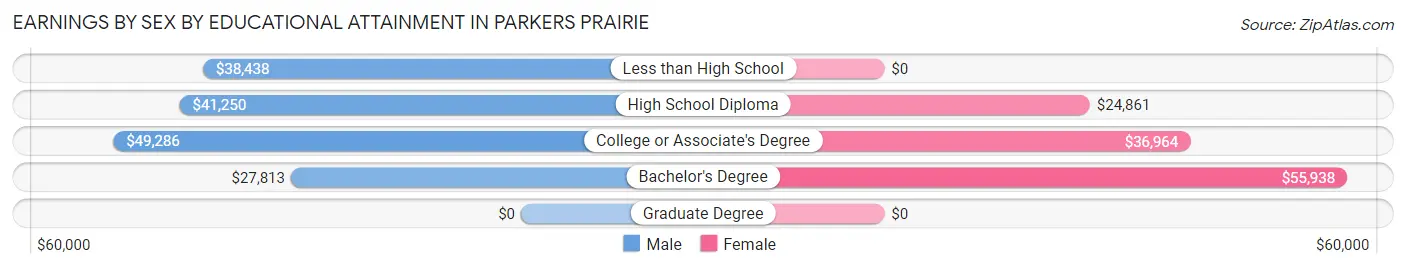
| Educational Attainment | Male Income | Female Income |
| Less than High School | $38,438 | $0 |
| High School Diploma | $41,250 | $24,861 |
| College or Associate's Degree | $49,286 | $36,964 |
| Bachelor's Degree | $27,813 | $55,938 |
| Graduate Degree | - | - |
| Total | $44,545 | $31,154 |
Family Income in Parkers Prairie
Family Income Brackets in Parkers Prairie
According to the Parkers Prairie family income data, there are 65 families falling into the $50,000 to $74,999 income range, which is the most common income bracket and makes up 23.1% of all families. Conversely, the $10,000 to $14,999 income bracket is the least frequent group with only 3 families (1.1%) belonging to this category.
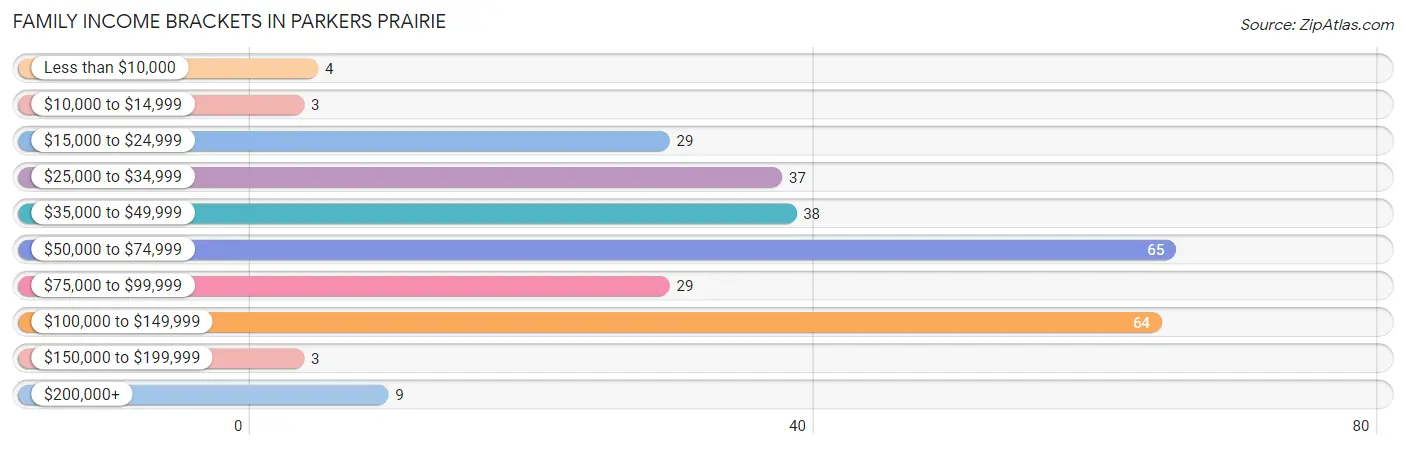
| Income Bracket | # Families | % Families |
| Less than $10,000 | 4 | 1.4% |
| $10,000 to $14,999 | 3 | 1.1% |
| $15,000 to $24,999 | 29 | 10.3% |
| $25,000 to $34,999 | 37 | 13.2% |
| $35,000 to $49,999 | 38 | 13.5% |
| $50,000 to $74,999 | 65 | 23.1% |
| $75,000 to $99,999 | 29 | 10.3% |
| $100,000 to $149,999 | 64 | 22.8% |
| $150,000 to $199,999 | 3 | 1.1% |
| $200,000+ | 9 | 3.2% |
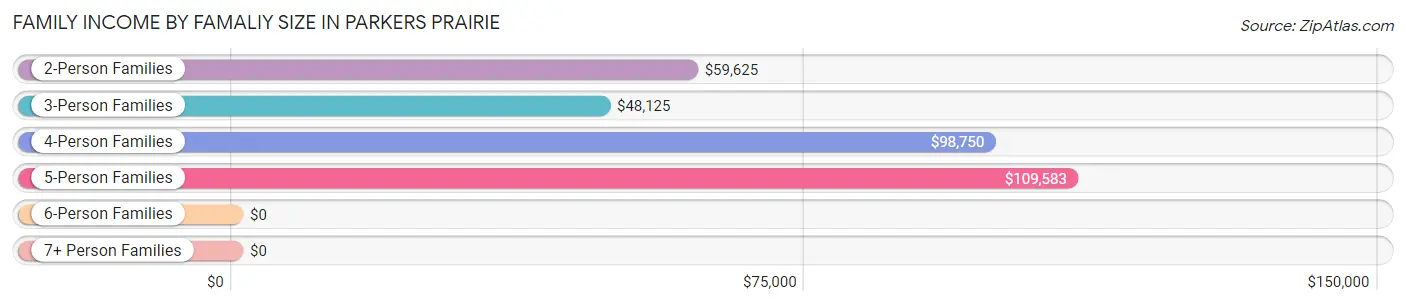
Family Income by Famaliy Size in Parkers Prairie
5-person families (27 | 9.6%) account for the highest median family income in Parkers Prairie with $109,583 per family, while 2-person families (135 | 48.0%) have the highest median income of $29,812 per family member.
| Income Bracket | # Families | Median Income |
| 2-Person Families | 135 (48.0%) | $59,625 |
| 3-Person Families | 57 (20.3%) | $48,125 |
| 4-Person Families | 59 (21.0%) | $98,750 |
| 5-Person Families | 27 (9.6%) | $109,583 |
| 6-Person Families | 3 (1.1%) | $0 |
| 7+ Person Families | 0 (0.0%) | $0 |
| Total | 281 (100.0%) | $65,688 |
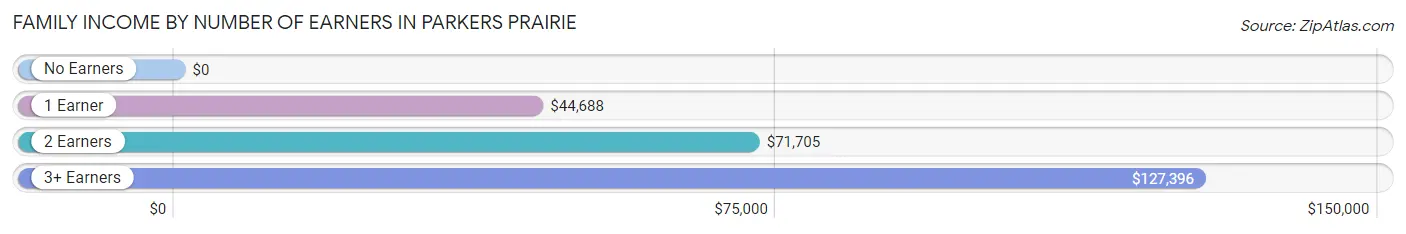
Family Income by Number of Earners in Parkers Prairie
| Number of Earners | # Families | Median Income |
| No Earners | 57 (20.3%) | $0 |
| 1 Earner | 74 (26.3%) | $44,688 |
| 2 Earners | 115 (40.9%) | $71,705 |
| 3+ Earners | 35 (12.5%) | $127,396 |
| Total | 281 (100.0%) | $65,688 |
Household Income in Parkers Prairie
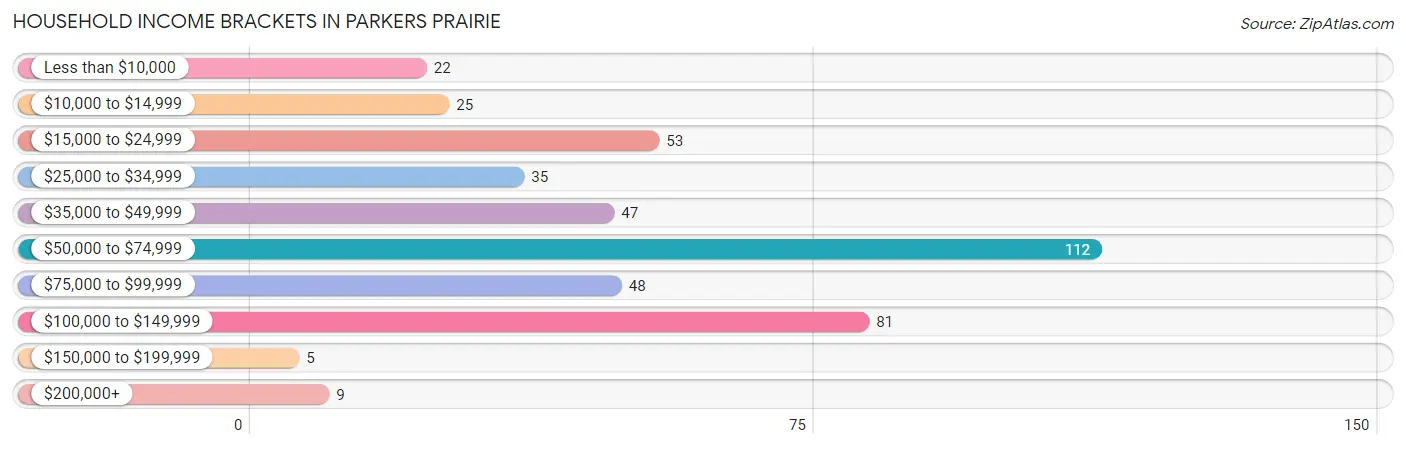
Household Income Brackets in Parkers Prairie
With 112 households falling in the category, the $50,000 to $74,999 income range is the most frequent in Parkers Prairie, accounting for 25.6% of all households. In contrast, only 5 households (1.1%) fall into the $150,000 to $199,999 income bracket, making it the least populous group.
| Income Bracket | # Households | % Households |
| Less than $10,000 | 22 | 5.0% |
| $10,000 to $14,999 | 25 | 5.7% |
| $15,000 to $24,999 | 53 | 12.1% |
| $25,000 to $34,999 | 35 | 8.0% |
| $35,000 to $49,999 | 47 | 10.8% |
| $50,000 to $74,999 | 112 | 25.6% |
| $75,000 to $99,999 | 48 | 11.0% |
| $100,000 to $149,999 | 81 | 18.5% |
| $150,000 to $199,999 | 5 | 1.1% |
| $200,000+ | 9 | 2.1% |
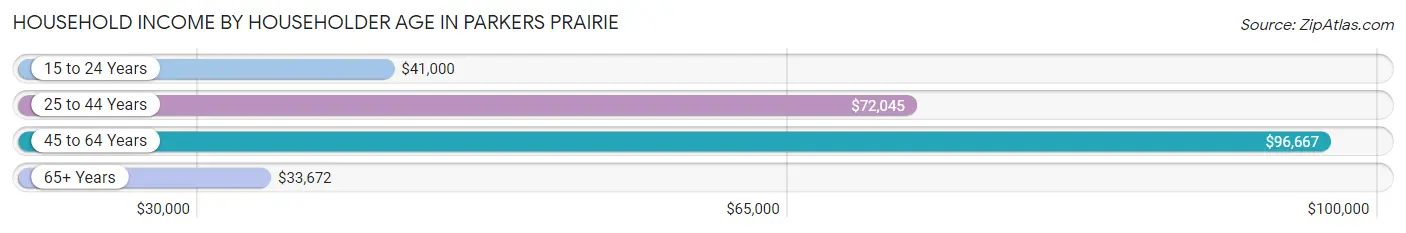
Household Income by Householder Age in Parkers Prairie
The median household income in Parkers Prairie is $57,875, with the highest median household income of $96,667 found in the 45 to 64 years age bracket for the primary householder. A total of 104 households (23.8%) fall into this category. Meanwhile, the 65+ years age bracket for the primary householder has the lowest median household income of $33,672, with 189 households (43.2%) in this group.
| Income Bracket | # Households | Median Income |
| 15 to 24 Years | 20 (4.6%) | $41,000 |
| 25 to 44 Years | 124 (28.4%) | $72,045 |
| 45 to 64 Years | 104 (23.8%) | $96,667 |
| 65+ Years | 189 (43.2%) | $33,672 |
| Total | 437 (100.0%) | $57,875 |
Poverty in Parkers Prairie
Income Below Poverty by Sex and Age in Parkers Prairie
With 12.3% poverty level for males and 16.0% for females among the residents of Parkers Prairie, 6 to 11 year old males and under 5 year old females are the most vulnerable to poverty, with 20 males (45.5%) and 20 females (38.5%) in their respective age groups living below the poverty level.
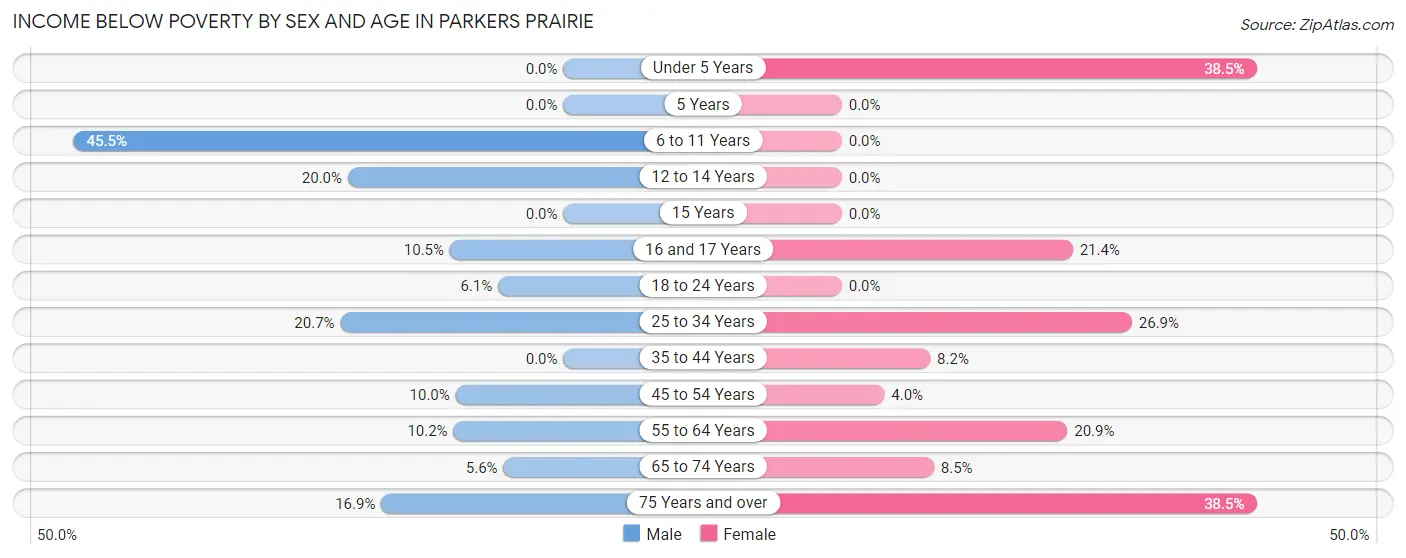
| Age Bracket | Male | Female |
| Under 5 Years | 0 (0.0%) | 20 (38.5%) |
| 5 Years | 0 (0.0%) | 0 (0.0%) |
| 6 to 11 Years | 20 (45.5%) | 0 (0.0%) |
| 12 to 14 Years | 3 (20.0%) | 0 (0.0%) |
| 15 Years | 0 (0.0%) | 0 (0.0%) |
| 16 and 17 Years | 4 (10.5%) | 3 (21.4%) |
| 18 to 24 Years | 4 (6.1%) | 0 (0.0%) |
| 25 to 34 Years | 12 (20.7%) | 14 (26.9%) |
| 35 to 44 Years | 0 (0.0%) | 5 (8.2%) |
| 45 to 54 Years | 4 (10.0%) | 3 (4.0%) |
| 55 to 64 Years | 5 (10.2%) | 9 (20.9%) |
| 65 to 74 Years | 3 (5.6%) | 7 (8.5%) |
| 75 Years and over | 12 (16.9%) | 30 (38.5%) |
| Total | 67 (12.3%) | 91 (16.0%) |
Income Above Poverty by Sex and Age in Parkers Prairie
According to the poverty statistics in Parkers Prairie, males aged under 5 years and females aged 5 years are the age groups that are most secure financially, with 100.0% of males and 100.0% of females in these age groups living above the poverty line.
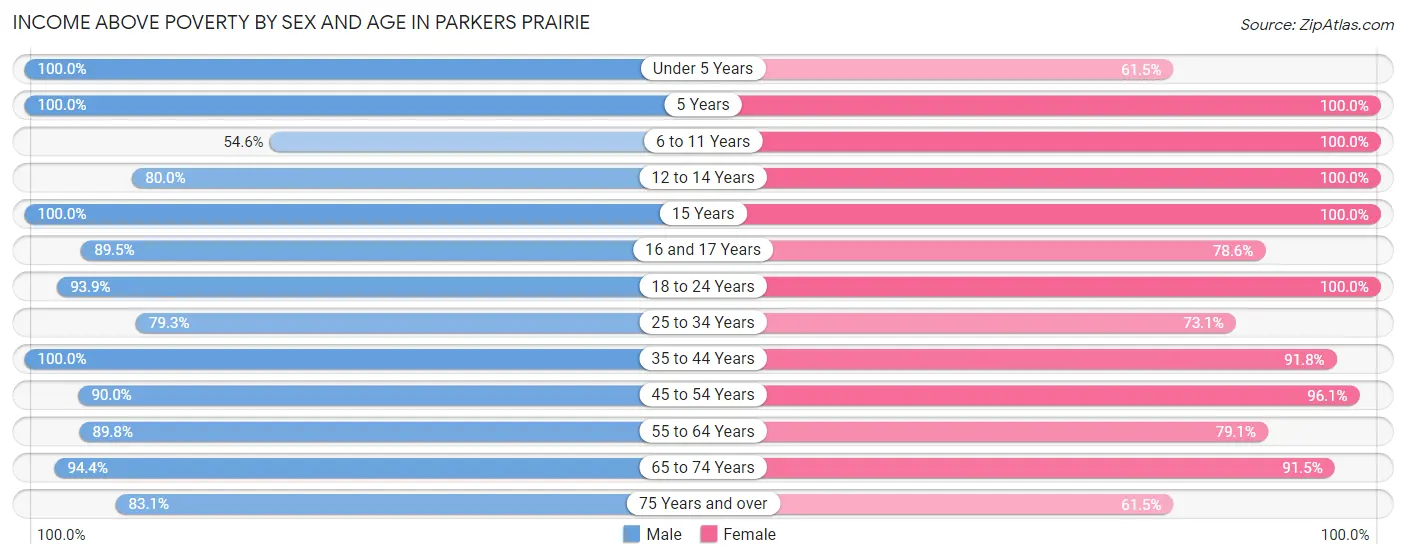
| Age Bracket | Male | Female |
| Under 5 Years | 32 (100.0%) | 32 (61.5%) |
| 5 Years | 9 (100.0%) | 2 (100.0%) |
| 6 to 11 Years | 24 (54.5%) | 29 (100.0%) |
| 12 to 14 Years | 12 (80.0%) | 26 (100.0%) |
| 15 Years | 3 (100.0%) | 21 (100.0%) |
| 16 and 17 Years | 34 (89.5%) | 11 (78.6%) |
| 18 to 24 Years | 62 (93.9%) | 33 (100.0%) |
| 25 to 34 Years | 46 (79.3%) | 38 (73.1%) |
| 35 to 44 Years | 67 (100.0%) | 56 (91.8%) |
| 45 to 54 Years | 36 (90.0%) | 73 (96.1%) |
| 55 to 64 Years | 44 (89.8%) | 34 (79.1%) |
| 65 to 74 Years | 51 (94.4%) | 75 (91.5%) |
| 75 Years and over | 59 (83.1%) | 48 (61.5%) |
| Total | 479 (87.7%) | 478 (84.0%) |
Income Below Poverty Among Married-Couple Families in Parkers Prairie
The poverty statistics for married-couple families in Parkers Prairie show that 7.5% or 16 of the total 212 families live below the poverty line. Families with 1 or 2 children have the highest poverty rate of 10.6%, comprising of 7 families. On the other hand, families with 3 or 4 children have the lowest poverty rate of 0.0%, which includes 0 families.
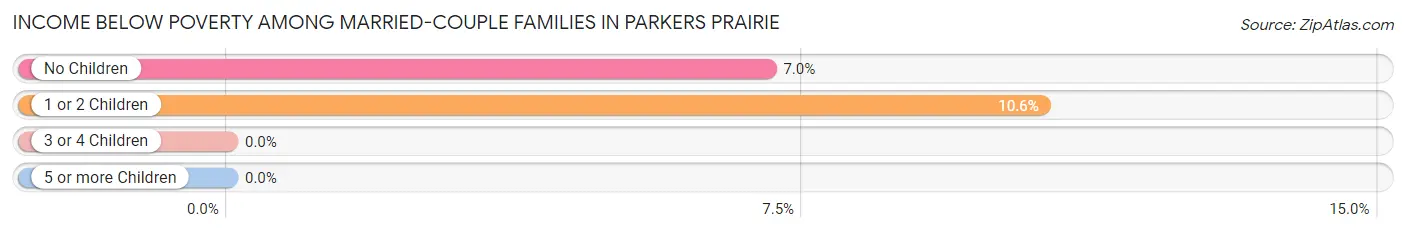
| Children | Above Poverty | Below Poverty |
| No Children | 119 (93.0%) | 9 (7.0%) |
| 1 or 2 Children | 59 (89.4%) | 7 (10.6%) |
| 3 or 4 Children | 18 (100.0%) | 0 (0.0%) |
| 5 or more Children | 0 (0.0%) | 0 (0.0%) |
| Total | 196 (92.4%) | 16 (7.5%) |
Income Below Poverty Among Single-Parent Households in Parkers Prairie
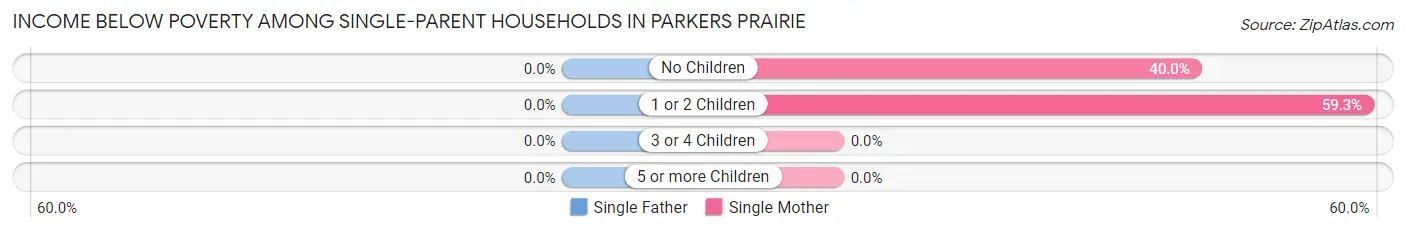
| Children | Single Father | Single Mother |
| No Children | 0 (0.0%) | 4 (40.0%) |
| 1 or 2 Children | 0 (0.0%) | 16 (59.3%) |
| 3 or 4 Children | 0 (0.0%) | 0 (0.0%) |
| 5 or more Children | 0 (0.0%) | 0 (0.0%) |
| Total | 0 (0.0%) | 20 (42.5%) |
Income Below Poverty Among Married-Couple vs Single-Parent Households in Parkers Prairie
The poverty data for Parkers Prairie shows that 16 of the married-couple family households (7.5%) and 20 of the single-parent households (29.0%) are living below the poverty level. Within the married-couple family households, those with 1 or 2 children have the highest poverty rate, with 7 households (10.6%) falling below the poverty line. Among the single-parent households, those with 1 or 2 children have the highest poverty rate, with 16 household (43.2%) living below poverty.
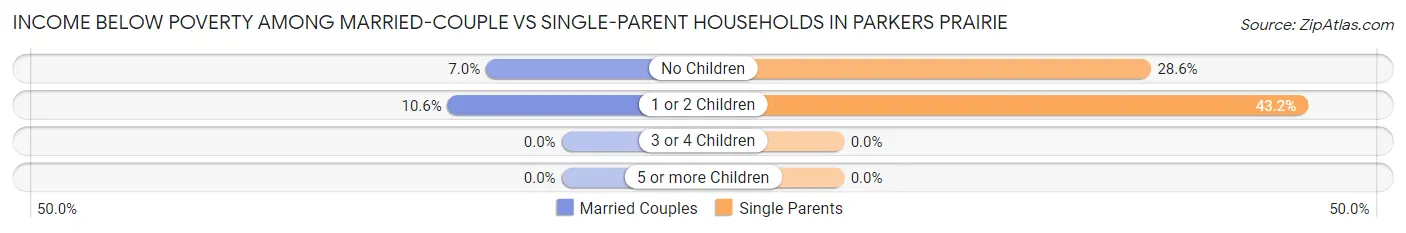
| Children | Married-Couple Families | Single-Parent Households |
| No Children | 9 (7.0%) | 4 (28.6%) |
| 1 or 2 Children | 7 (10.6%) | 16 (43.2%) |
| 3 or 4 Children | 0 (0.0%) | 0 (0.0%) |
| 5 or more Children | 0 (0.0%) | 0 (0.0%) |
| Total | 16 (7.5%) | 20 (29.0%) |
Employment Characteristics in Parkers Prairie
Employment by Class of Employer in Parkers Prairie
Among the 492 employed individuals in Parkers Prairie, private company employees (316 | 64.2%), local government employees (60 | 12.2%), and not-for-profit organizations (52 | 10.6%) make up the most common classes of employment.
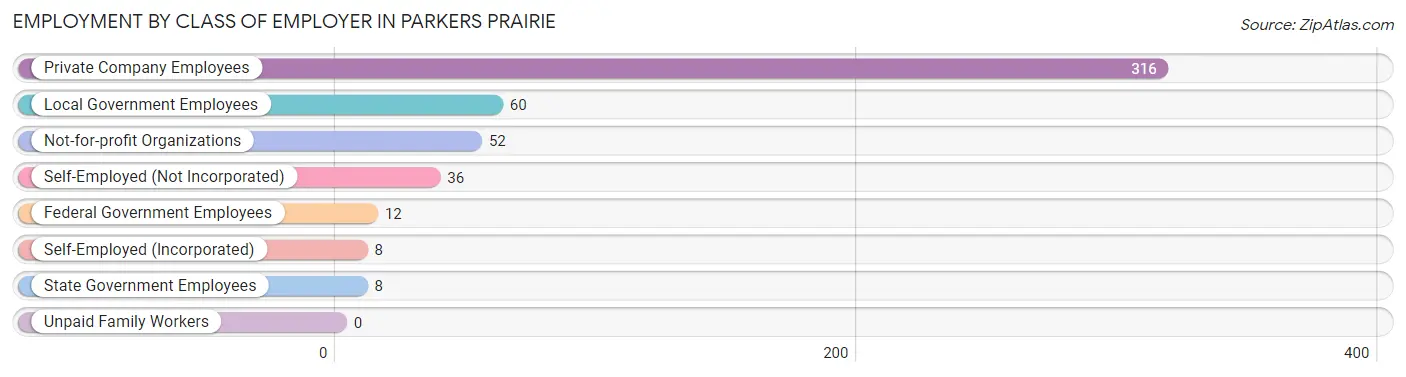
| Employer Class | # Employees | % Employees |
| Private Company Employees | 316 | 64.2% |
| Self-Employed (Incorporated) | 8 | 1.6% |
| Self-Employed (Not Incorporated) | 36 | 7.3% |
| Not-for-profit Organizations | 52 | 10.6% |
| Local Government Employees | 60 | 12.2% |
| State Government Employees | 8 | 1.6% |
| Federal Government Employees | 12 | 2.4% |
| Unpaid Family Workers | 0 | 0.0% |
| Total | 492 | 100.0% |
Employment Status by Age in Parkers Prairie
According to the labor force statistics for Parkers Prairie, out of the total population over 16 years of age (946), 55.4% or 524 individuals are in the labor force, with 4.8% or 25 of them unemployed. The age group with the highest labor force participation rate is 25 to 29 years, with 100.0% or 53 individuals in the labor force. Within the labor force, the 30 to 34 years age range has the highest percentage of unemployed individuals, with 13.7% or 7 of them being unemployed.
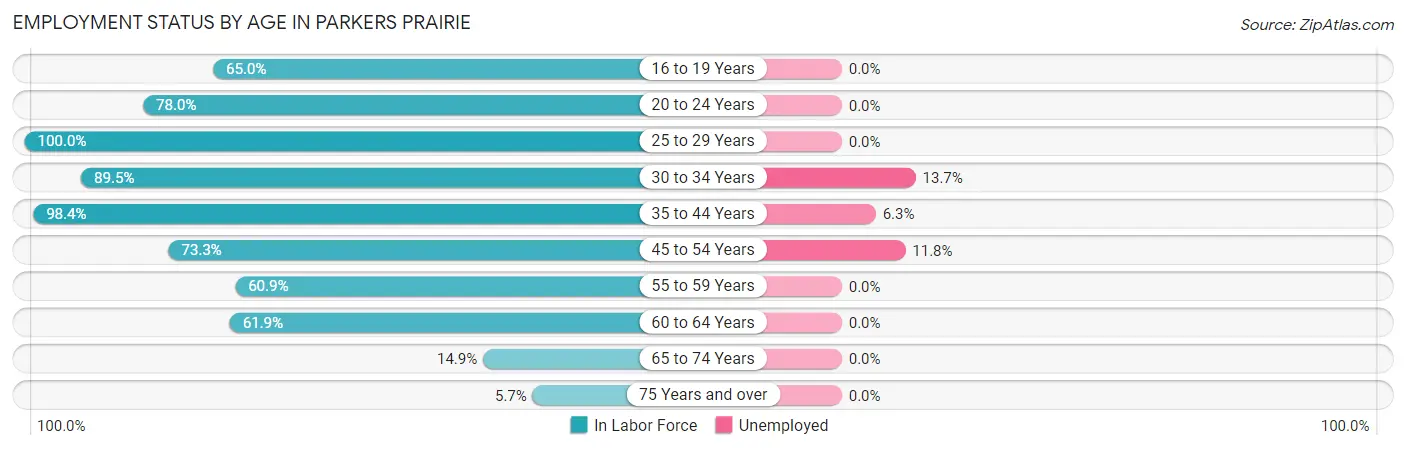
| Age Bracket | In Labor Force | Unemployed |
| 16 to 19 Years | 39 (65.0%) | 0 (0.0%) |
| 20 to 24 Years | 71 (78.0%) | 0 (0.0%) |
| 25 to 29 Years | 53 (100.0%) | 0 (0.0%) |
| 30 to 34 Years | 51 (89.5%) | 7 (13.7%) |
| 35 to 44 Years | 126 (98.4%) | 8 (6.3%) |
| 45 to 54 Years | 85 (73.3%) | 10 (11.8%) |
| 55 to 59 Years | 39 (60.9%) | 0 (0.0%) |
| 60 to 64 Years | 26 (61.9%) | 0 (0.0%) |
| 65 to 74 Years | 24 (14.9%) | 0 (0.0%) |
| 75 Years and over | 10 (5.7%) | 0 (0.0%) |
| Total | 524 (55.4%) | 25 (4.8%) |
Employment Status by Educational Attainment in Parkers Prairie
According to labor force statistics for Parkers Prairie, 82.6% of individuals (380) out of the total population between 25 and 64 years of age (460) are in the labor force, with 6.6% or 25 of them being unemployed. The group with the highest labor force participation rate are those with the educational attainment of less than high school, with 95.6% or 43 individuals in the labor force. Within the labor force, individuals with bachelor's degree or higher education have the highest percentage of unemployment, with 19.2% or 10 of them being unemployed.
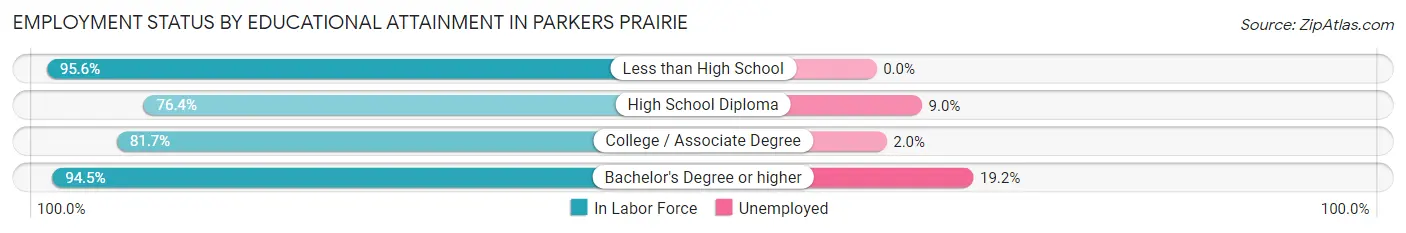
| Educational Attainment | In Labor Force | Unemployed |
| Less than High School | 43 (95.6%) | 0 (0.0%) |
| High School Diploma | 133 (76.4%) | 16 (9.0%) |
| College / Associate Degree | 152 (81.7%) | 4 (2.0%) |
| Bachelor's Degree or higher | 52 (94.5%) | 11 (19.2%) |
| Total | 380 (82.6%) | 30 (6.6%) |
Employment Occupations by Sex in Parkers Prairie
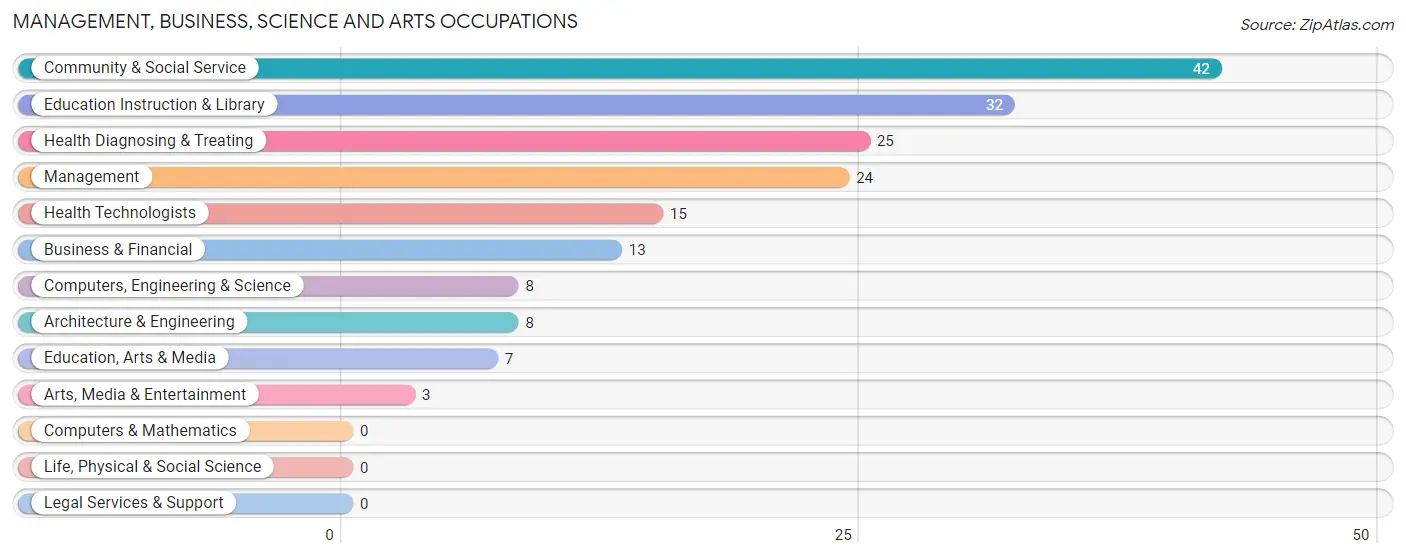
Management, Business, Science and Arts Occupations
The most common Management, Business, Science and Arts occupations in Parkers Prairie are Community & Social Service (42 | 8.4%), Education Instruction & Library (32 | 6.4%), Health Diagnosing & Treating (25 | 5.0%), Management (24 | 4.8%), and Health Technologists (15 | 3.0%).
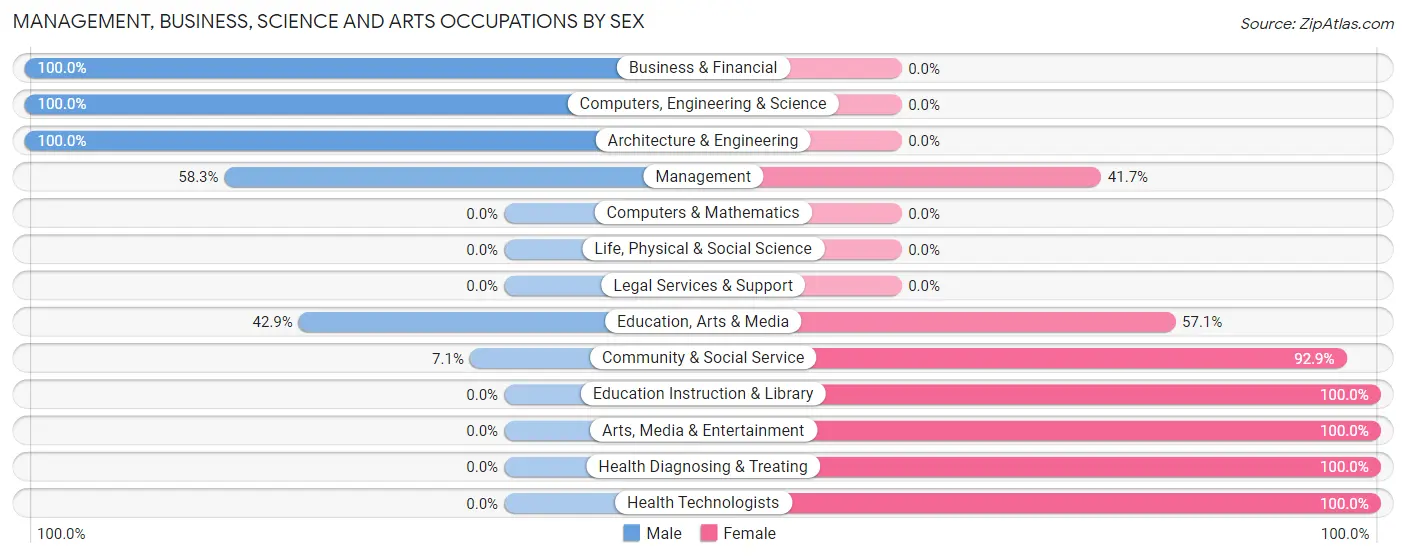
Management, Business, Science and Arts Occupations by Sex
Within the Management, Business, Science and Arts occupations in Parkers Prairie, the most male-oriented occupations are Business & Financial (100.0%), Computers, Engineering & Science (100.0%), and Architecture & Engineering (100.0%), while the most female-oriented occupations are Education Instruction & Library (100.0%), Arts, Media & Entertainment (100.0%), and Health Diagnosing & Treating (100.0%).
| Occupation | Male | Female |
| Management | 14 (58.3%) | 10 (41.7%) |
| Business & Financial | 13 (100.0%) | 0 (0.0%) |
| Computers, Engineering & Science | 8 (100.0%) | 0 (0.0%) |
| Computers & Mathematics | 0 (0.0%) | 0 (0.0%) |
| Architecture & Engineering | 8 (100.0%) | 0 (0.0%) |
| Life, Physical & Social Science | 0 (0.0%) | 0 (0.0%) |
| Community & Social Service | 3 (7.1%) | 39 (92.9%) |
| Education, Arts & Media | 3 (42.9%) | 4 (57.1%) |
| Legal Services & Support | 0 (0.0%) | 0 (0.0%) |
| Education Instruction & Library | 0 (0.0%) | 32 (100.0%) |
| Arts, Media & Entertainment | 0 (0.0%) | 3 (100.0%) |
| Health Diagnosing & Treating | 0 (0.0%) | 25 (100.0%) |
| Health Technologists | 0 (0.0%) | 15 (100.0%) |
| Total (Category) | 38 (33.9%) | 74 (66.1%) |
| Total (Overall) | 283 (56.7%) | 216 (43.3%) |
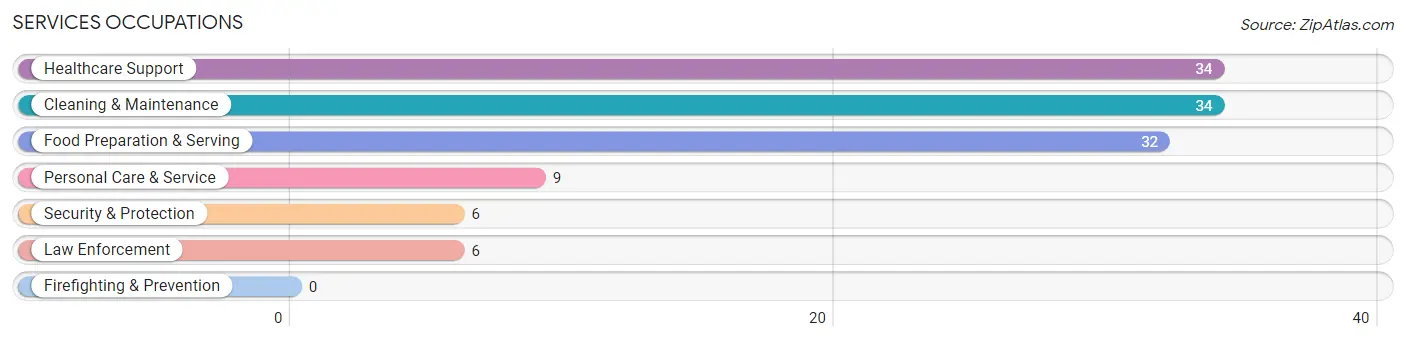
Services Occupations
The most common Services occupations in Parkers Prairie are Healthcare Support (34 | 6.8%), Cleaning & Maintenance (34 | 6.8%), Food Preparation & Serving (32 | 6.4%), Personal Care & Service (9 | 1.8%), and Security & Protection (6 | 1.2%).
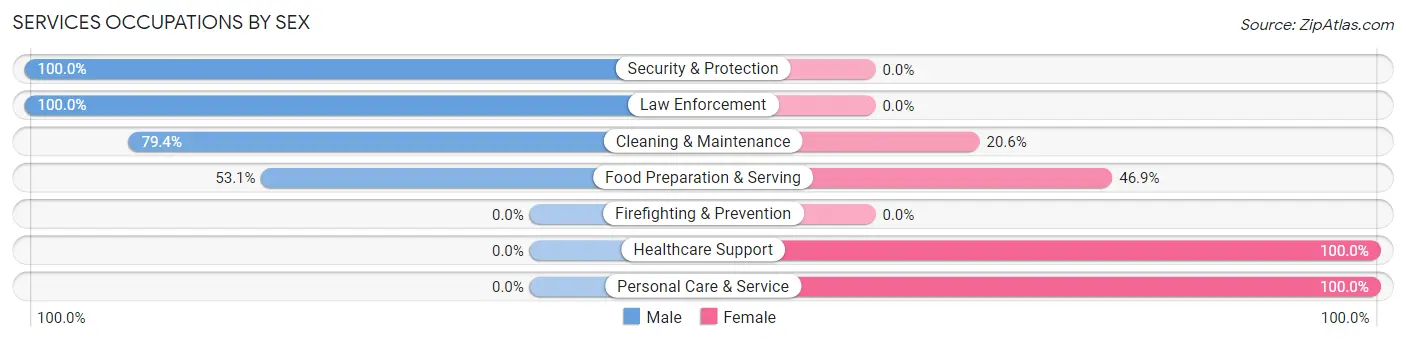
Services Occupations by Sex
Within the Services occupations in Parkers Prairie, the most male-oriented occupations are Security & Protection (100.0%), Law Enforcement (100.0%), and Cleaning & Maintenance (79.4%), while the most female-oriented occupations are Healthcare Support (100.0%), Personal Care & Service (100.0%), and Food Preparation & Serving (46.9%).
| Occupation | Male | Female |
| Healthcare Support | 0 (0.0%) | 34 (100.0%) |
| Security & Protection | 6 (100.0%) | 0 (0.0%) |
| Firefighting & Prevention | 0 (0.0%) | 0 (0.0%) |
| Law Enforcement | 6 (100.0%) | 0 (0.0%) |
| Food Preparation & Serving | 17 (53.1%) | 15 (46.9%) |
| Cleaning & Maintenance | 27 (79.4%) | 7 (20.6%) |
| Personal Care & Service | 0 (0.0%) | 9 (100.0%) |
| Total (Category) | 50 (43.5%) | 65 (56.5%) |
| Total (Overall) | 283 (56.7%) | 216 (43.3%) |
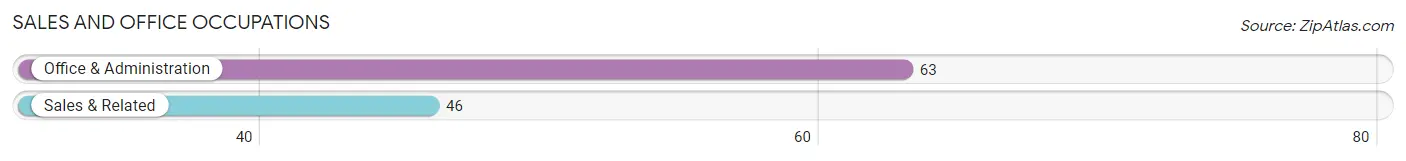
Sales and Office Occupations
The most common Sales and Office occupations in Parkers Prairie are Office & Administration (63 | 12.6%), and Sales & Related (46 | 9.2%).
Sales and Office Occupations by Sex
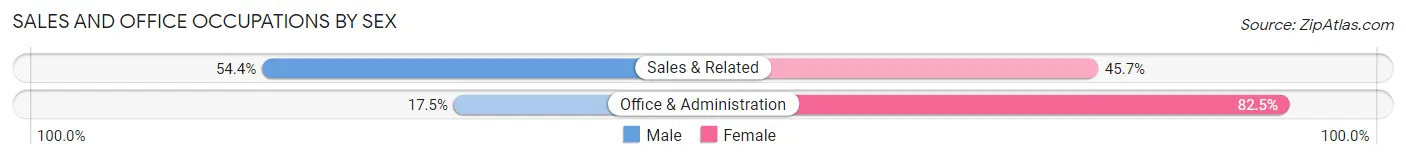
| Occupation | Male | Female |
| Sales & Related | 25 (54.3%) | 21 (45.7%) |
| Office & Administration | 11 (17.5%) | 52 (82.5%) |
| Total (Category) | 36 (33.0%) | 73 (67.0%) |
| Total (Overall) | 283 (56.7%) | 216 (43.3%) |
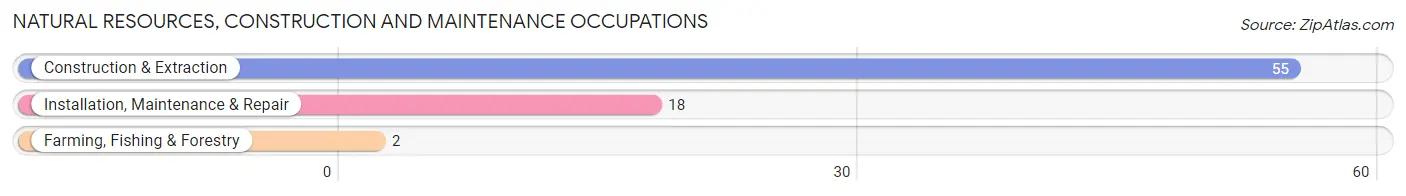
Natural Resources, Construction and Maintenance Occupations
The most common Natural Resources, Construction and Maintenance occupations in Parkers Prairie are Construction & Extraction (55 | 11.0%), Installation, Maintenance & Repair (18 | 3.6%), and Farming, Fishing & Forestry (2 | 0.4%).
Natural Resources, Construction and Maintenance Occupations by Sex
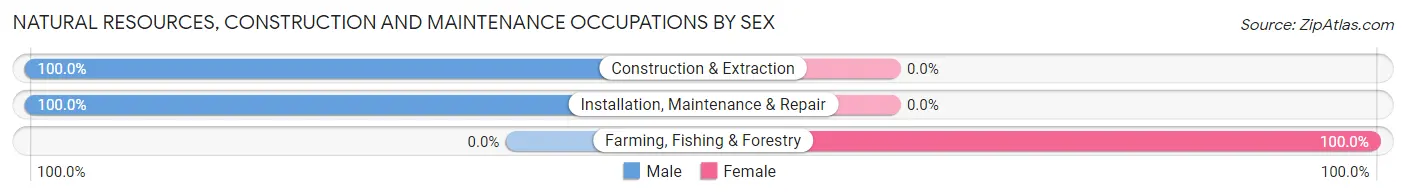
| Occupation | Male | Female |
| Farming, Fishing & Forestry | 0 (0.0%) | 2 (100.0%) |
| Construction & Extraction | 55 (100.0%) | 0 (0.0%) |
| Installation, Maintenance & Repair | 18 (100.0%) | 0 (0.0%) |
| Total (Category) | 73 (97.3%) | 2 (2.7%) |
| Total (Overall) | 283 (56.7%) | 216 (43.3%) |
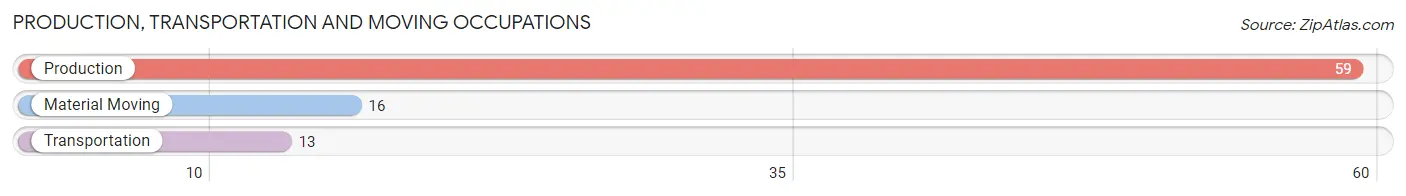
Production, Transportation and Moving Occupations
The most common Production, Transportation and Moving occupations in Parkers Prairie are Production (59 | 11.8%), Material Moving (16 | 3.2%), and Transportation (13 | 2.6%).
Production, Transportation and Moving Occupations by Sex
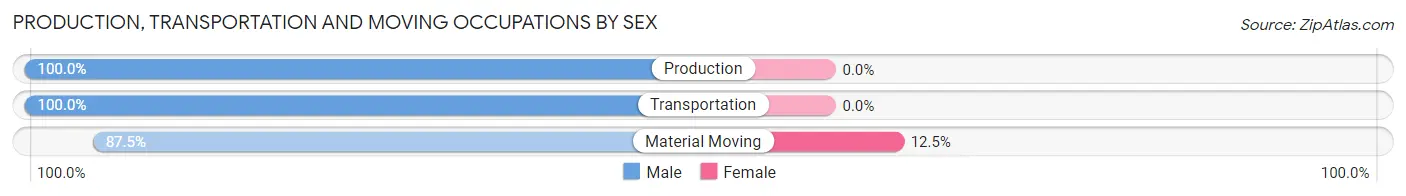
| Occupation | Male | Female |
| Production | 59 (100.0%) | 0 (0.0%) |
| Transportation | 13 (100.0%) | 0 (0.0%) |
| Material Moving | 14 (87.5%) | 2 (12.5%) |
| Total (Category) | 86 (97.7%) | 2 (2.3%) |
| Total (Overall) | 283 (56.7%) | 216 (43.3%) |
Employment Industries by Sex in Parkers Prairie
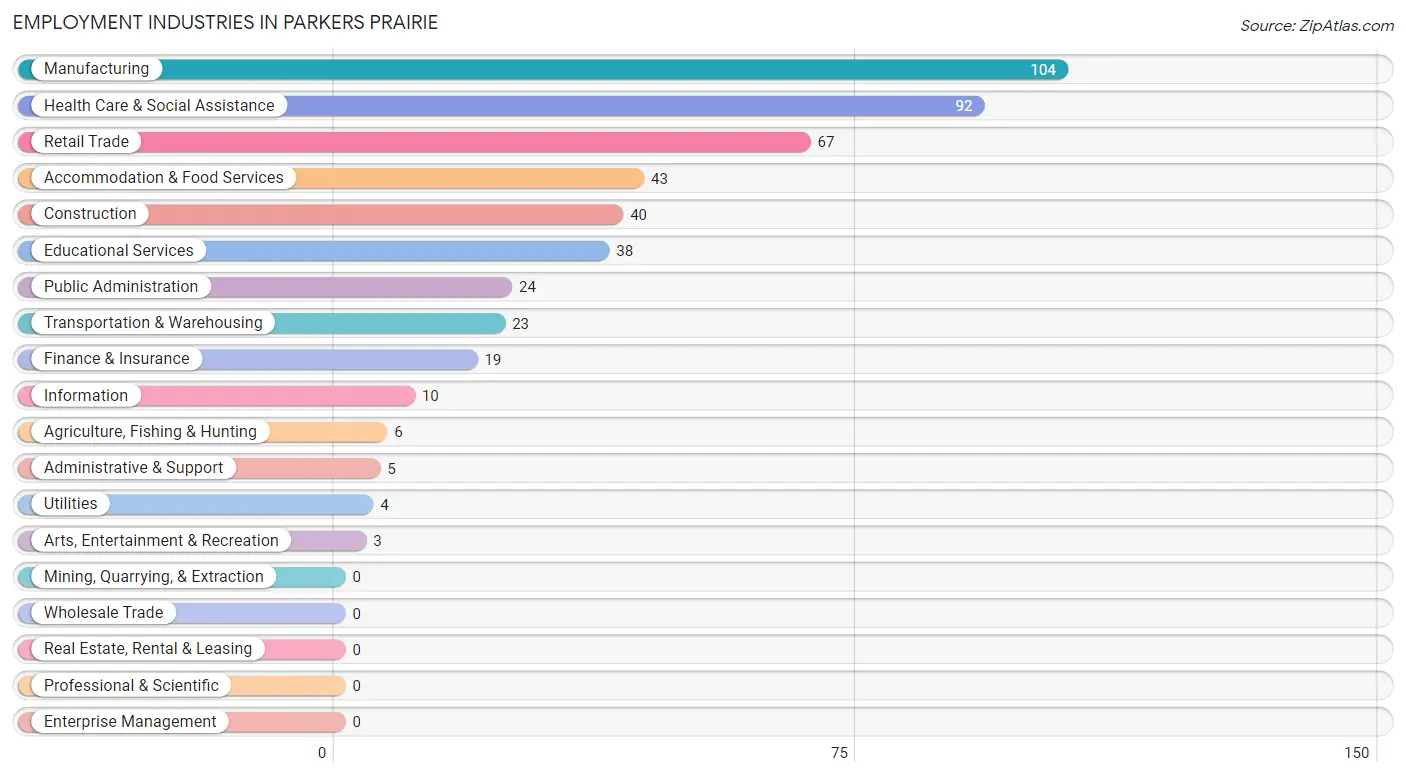
Employment Industries in Parkers Prairie
The major employment industries in Parkers Prairie include Manufacturing (104 | 20.8%), Health Care & Social Assistance (92 | 18.4%), Retail Trade (67 | 13.4%), Accommodation & Food Services (43 | 8.6%), and Construction (40 | 8.0%).
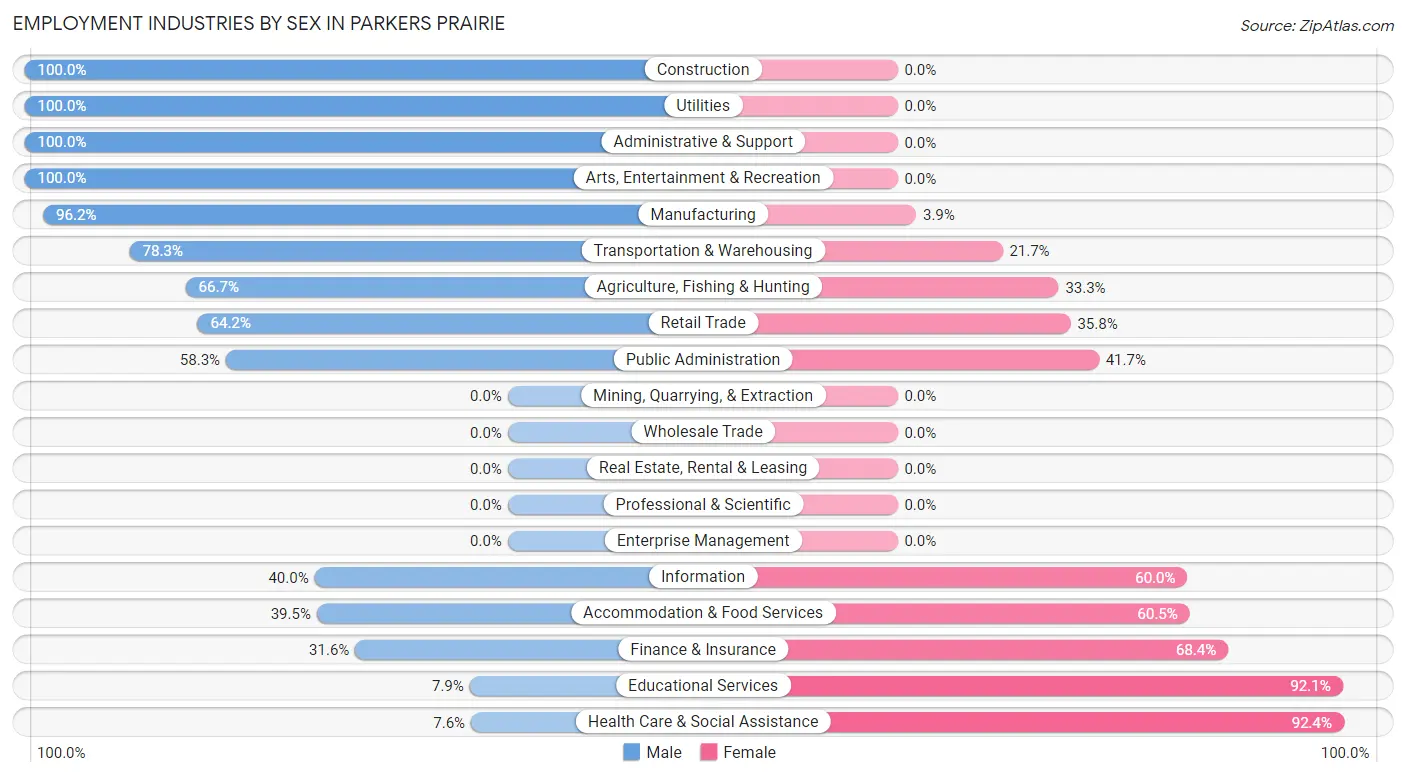
Employment Industries by Sex in Parkers Prairie
The Parkers Prairie industries that see more men than women are Construction (100.0%), Utilities (100.0%), and Administrative & Support (100.0%), whereas the industries that tend to have a higher number of women are Health Care & Social Assistance (92.4%), Educational Services (92.1%), and Finance & Insurance (68.4%).
| Industry | Male | Female |
| Agriculture, Fishing & Hunting | 4 (66.7%) | 2 (33.3%) |
| Mining, Quarrying, & Extraction | 0 (0.0%) | 0 (0.0%) |
| Construction | 40 (100.0%) | 0 (0.0%) |
| Manufacturing | 100 (96.2%) | 4 (3.8%) |
| Wholesale Trade | 0 (0.0%) | 0 (0.0%) |
| Retail Trade | 43 (64.2%) | 24 (35.8%) |
| Transportation & Warehousing | 18 (78.3%) | 5 (21.7%) |
| Utilities | 4 (100.0%) | 0 (0.0%) |
| Information | 4 (40.0%) | 6 (60.0%) |
| Finance & Insurance | 6 (31.6%) | 13 (68.4%) |
| Real Estate, Rental & Leasing | 0 (0.0%) | 0 (0.0%) |
| Professional & Scientific | 0 (0.0%) | 0 (0.0%) |
| Enterprise Management | 0 (0.0%) | 0 (0.0%) |
| Administrative & Support | 5 (100.0%) | 0 (0.0%) |
| Educational Services | 3 (7.9%) | 35 (92.1%) |
| Health Care & Social Assistance | 7 (7.6%) | 85 (92.4%) |
| Arts, Entertainment & Recreation | 3 (100.0%) | 0 (0.0%) |
| Accommodation & Food Services | 17 (39.5%) | 26 (60.5%) |
| Public Administration | 14 (58.3%) | 10 (41.7%) |
| Total | 283 (56.7%) | 216 (43.3%) |
Education in Parkers Prairie
School Enrollment in Parkers Prairie
The most common levels of schooling among the 280 students in Parkers Prairie are high school (82 | 29.3%), middle school (65 | 23.2%), and elementary school (37 | 13.2%).
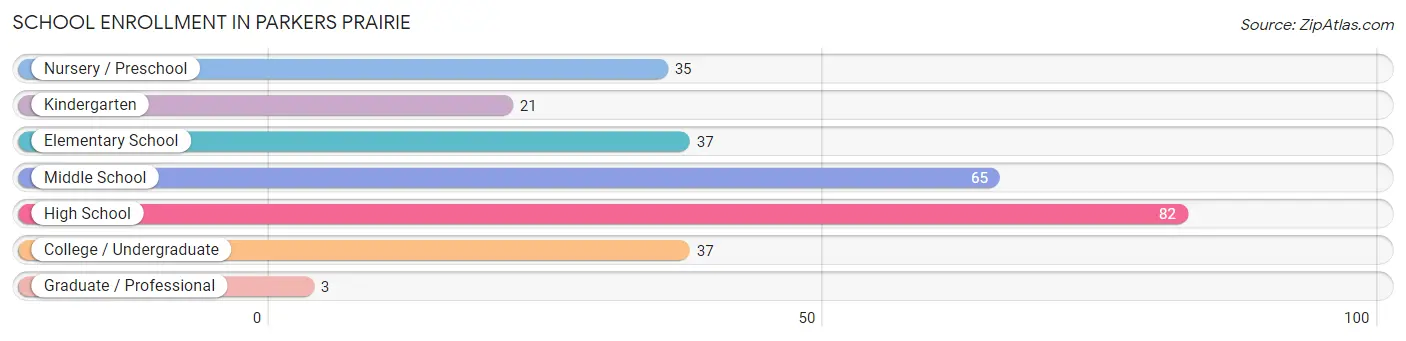
| School Level | # Students | % Students |
| Nursery / Preschool | 35 | 12.5% |
| Kindergarten | 21 | 7.5% |
| Elementary School | 37 | 13.2% |
| Middle School | 65 | 23.2% |
| High School | 82 | 29.3% |
| College / Undergraduate | 37 | 13.2% |
| Graduate / Professional | 3 | 1.1% |
| Total | 280 | 100.0% |
School Enrollment by Age by Funding Source in Parkers Prairie
Out of a total of 280 students who are enrolled in schools in Parkers Prairie, 4 (1.4%) attend a private institution, while the remaining 276 (98.6%) are enrolled in public schools. The age group of 5 to 9 year old has the highest likelihood of being enrolled in private schools, with 4 (6.9% in the age bracket) enrolled. Conversely, the age group of 3 to 4 year olds has the lowest likelihood of being enrolled in a private school, with 24 (100.0% in the age bracket) attending a public institution.
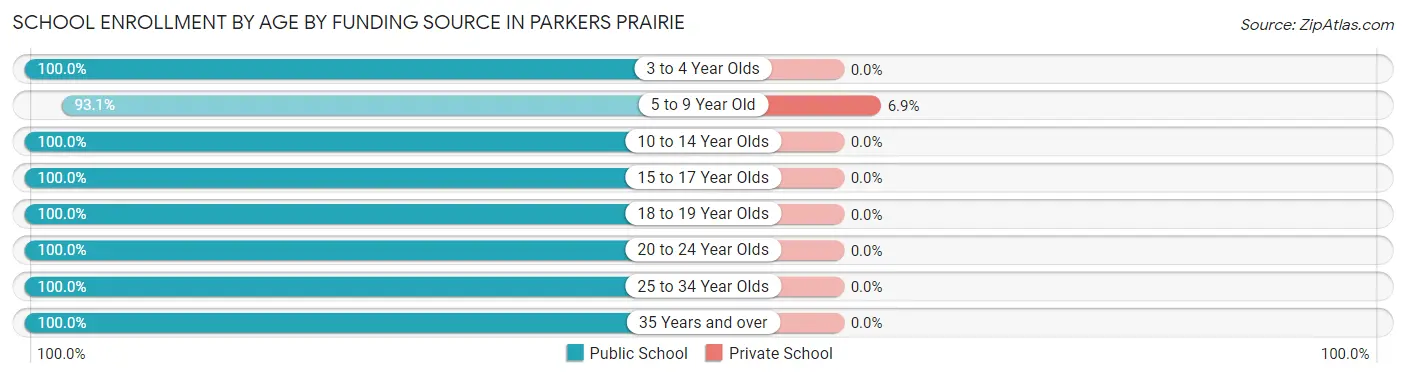
| Age Bracket | Public School | Private School |
| 3 to 4 Year Olds | 24 (100.0%) | 0 (0.0%) |
| 5 to 9 Year Old | 54 (93.1%) | 4 (6.9%) |
| 10 to 14 Year Olds | 82 (100.0%) | 0 (0.0%) |
| 15 to 17 Year Olds | 73 (100.0%) | 0 (0.0%) |
| 18 to 19 Year Olds | 6 (100.0%) | 0 (0.0%) |
| 20 to 24 Year Olds | 20 (100.0%) | 0 (0.0%) |
| 25 to 34 Year Olds | 6 (100.0%) | 0 (0.0%) |
| 35 Years and over | 11 (100.0%) | 0 (0.0%) |
| Total | 276 (98.6%) | 4 (1.4%) |
Educational Attainment by Field of Study in Parkers Prairie
Education (41 | 41.8%), business (13 | 13.3%), bio, nature & agricultural (12 | 12.2%), science & technology (12 | 12.2%), and arts & humanities (6 | 6.1%) are the most common fields of study among 98 individuals in Parkers Prairie who have obtained a bachelor's degree or higher.
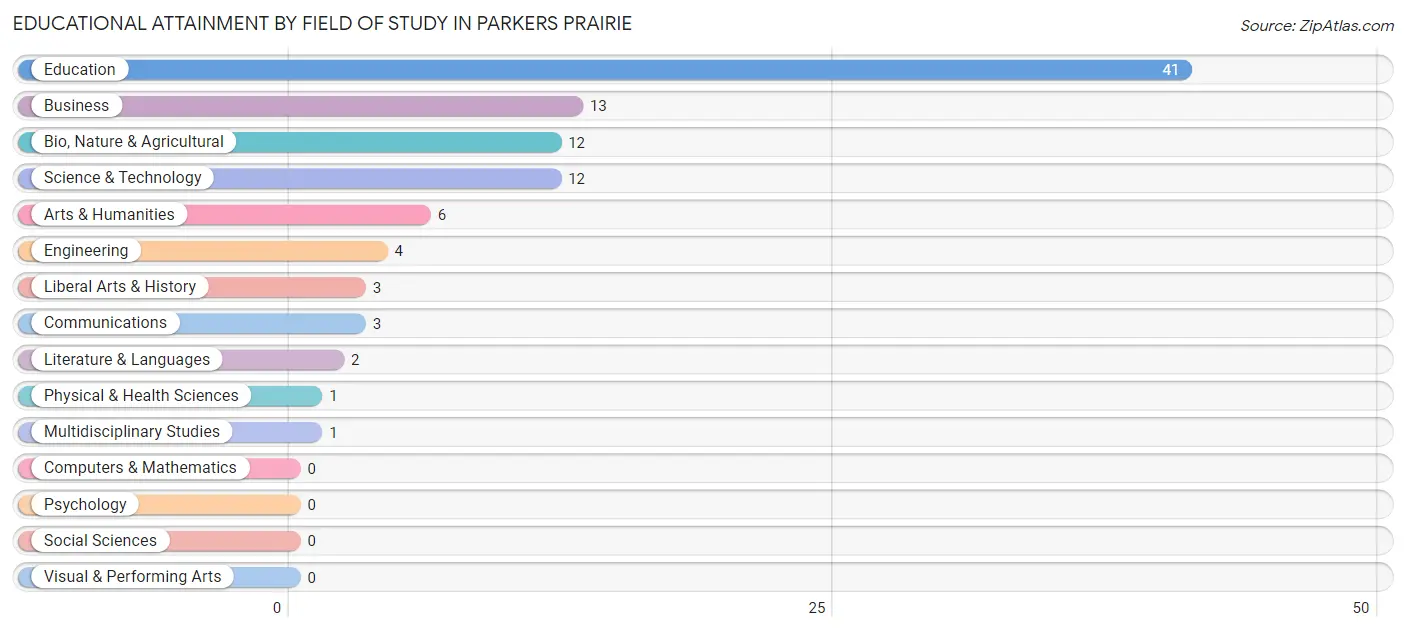
| Field of Study | # Graduates | % Graduates |
| Computers & Mathematics | 0 | 0.0% |
| Bio, Nature & Agricultural | 12 | 12.2% |
| Physical & Health Sciences | 1 | 1.0% |
| Psychology | 0 | 0.0% |
| Social Sciences | 0 | 0.0% |
| Engineering | 4 | 4.1% |
| Multidisciplinary Studies | 1 | 1.0% |
| Science & Technology | 12 | 12.2% |
| Business | 13 | 13.3% |
| Education | 41 | 41.8% |
| Literature & Languages | 2 | 2.0% |
| Liberal Arts & History | 3 | 3.1% |
| Visual & Performing Arts | 0 | 0.0% |
| Communications | 3 | 3.1% |
| Arts & Humanities | 6 | 6.1% |
| Total | 98 | 100.0% |
Transportation & Commute in Parkers Prairie
Vehicle Availability by Sex in Parkers Prairie
The most prevalent vehicle ownership categories in Parkers Prairie are males with 3 vehicles (84, accounting for 30.4%) and females with 3 vehicles (64, making up 40.2%).
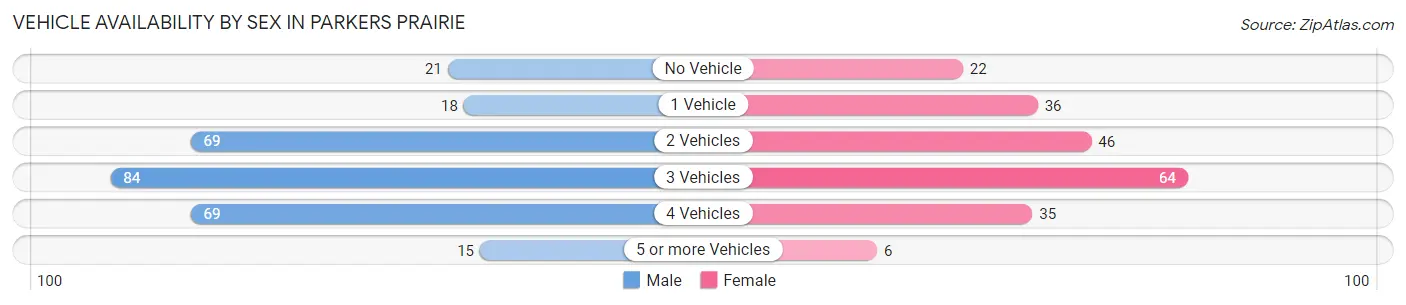
| Vehicles Available | Male | Female |
| No Vehicle | 21 (7.6%) | 22 (10.5%) |
| 1 Vehicle | 18 (6.5%) | 36 (17.2%) |
| 2 Vehicles | 69 (25.0%) | 46 (22.0%) |
| 3 Vehicles | 84 (30.4%) | 64 (30.6%) |
| 4 Vehicles | 69 (25.0%) | 35 (16.8%) |
| 5 or more Vehicles | 15 (5.4%) | 6 (2.9%) |
| Total | 276 (100.0%) | 209 (100.0%) |
Commute Time in Parkers Prairie
The most frequently occuring commute durations in Parkers Prairie are 5 to 9 minutes (81 commuters, 17.3%), 30 to 34 minutes (65 commuters, 13.9%), and 25 to 29 minutes (63 commuters, 13.4%).
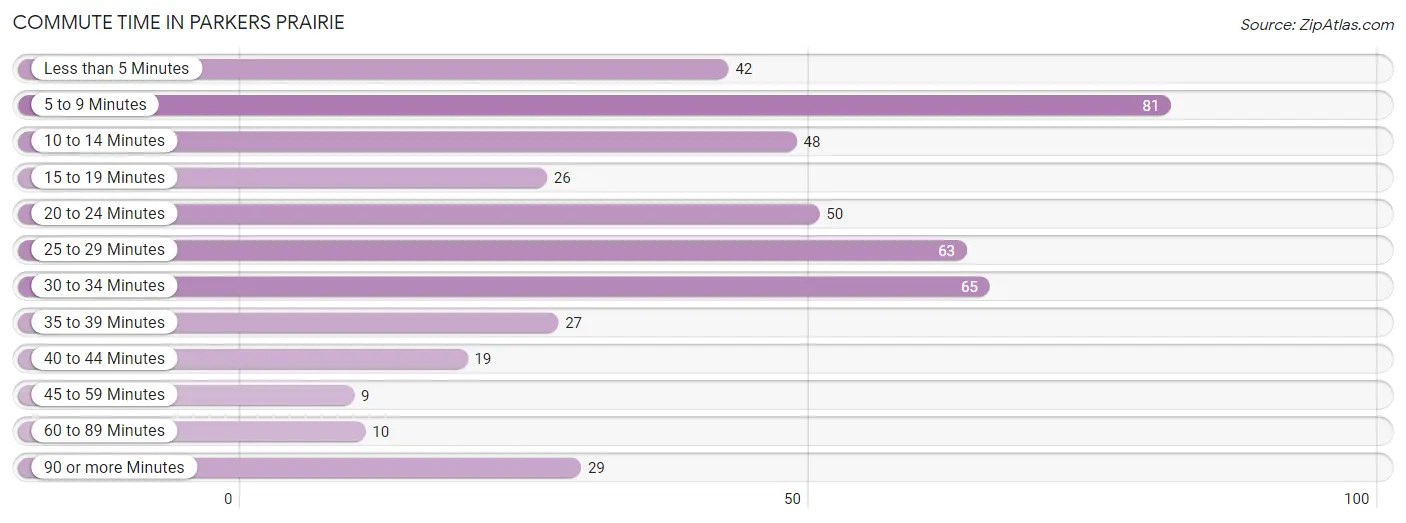
| Commute Time | # Commuters | % Commuters |
| Less than 5 Minutes | 42 | 9.0% |
| 5 to 9 Minutes | 81 | 17.3% |
| 10 to 14 Minutes | 48 | 10.2% |
| 15 to 19 Minutes | 26 | 5.5% |
| 20 to 24 Minutes | 50 | 10.7% |
| 25 to 29 Minutes | 63 | 13.4% |
| 30 to 34 Minutes | 65 | 13.9% |
| 35 to 39 Minutes | 27 | 5.8% |
| 40 to 44 Minutes | 19 | 4.1% |
| 45 to 59 Minutes | 9 | 1.9% |
| 60 to 89 Minutes | 10 | 2.1% |
| 90 or more Minutes | 29 | 6.2% |
Commute Time by Sex in Parkers Prairie
The most common commute times in Parkers Prairie are 30 to 34 minutes (35 commuters, 13.2%) for males and 5 to 9 minutes (73 commuters, 36.0%) for females.
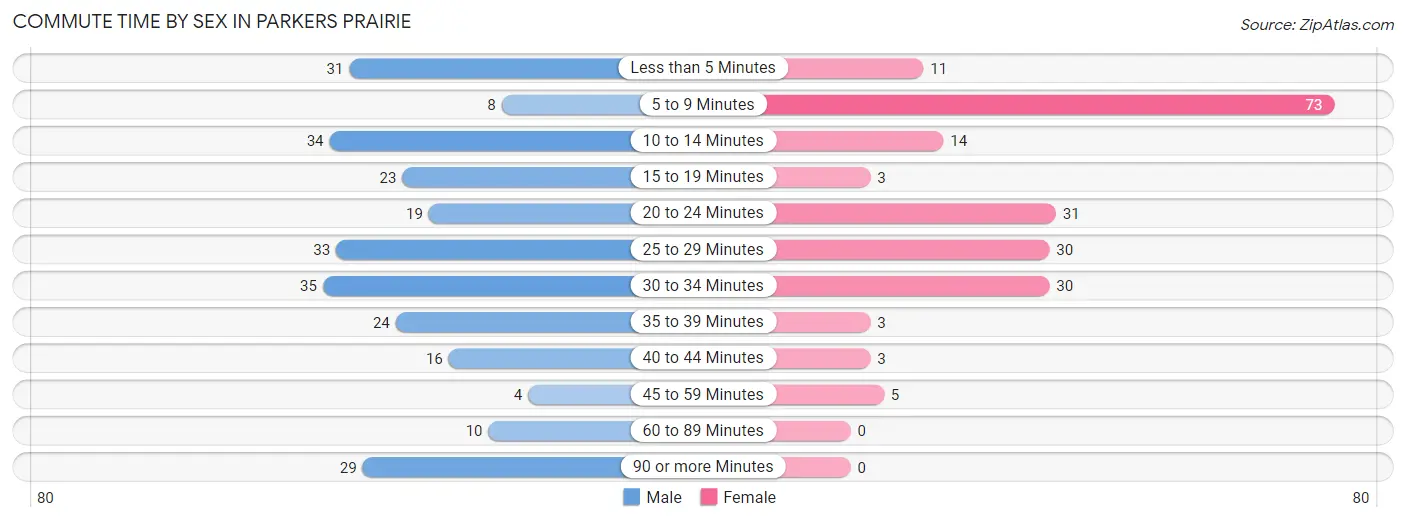
| Commute Time | Male | Female |
| Less than 5 Minutes | 31 (11.7%) | 11 (5.4%) |
| 5 to 9 Minutes | 8 (3.0%) | 73 (36.0%) |
| 10 to 14 Minutes | 34 (12.8%) | 14 (6.9%) |
| 15 to 19 Minutes | 23 (8.6%) | 3 (1.5%) |
| 20 to 24 Minutes | 19 (7.1%) | 31 (15.3%) |
| 25 to 29 Minutes | 33 (12.4%) | 30 (14.8%) |
| 30 to 34 Minutes | 35 (13.2%) | 30 (14.8%) |
| 35 to 39 Minutes | 24 (9.0%) | 3 (1.5%) |
| 40 to 44 Minutes | 16 (6.0%) | 3 (1.5%) |
| 45 to 59 Minutes | 4 (1.5%) | 5 (2.5%) |
| 60 to 89 Minutes | 10 (3.8%) | 0 (0.0%) |
| 90 or more Minutes | 29 (10.9%) | 0 (0.0%) |
Time of Departure to Work by Sex in Parkers Prairie
The most frequent times of departure to work in Parkers Prairie are 12:00 PM to 3:59 PM (63, 23.7%) for males and 8:00 AM to 8:29 AM (40, 19.7%) for females.
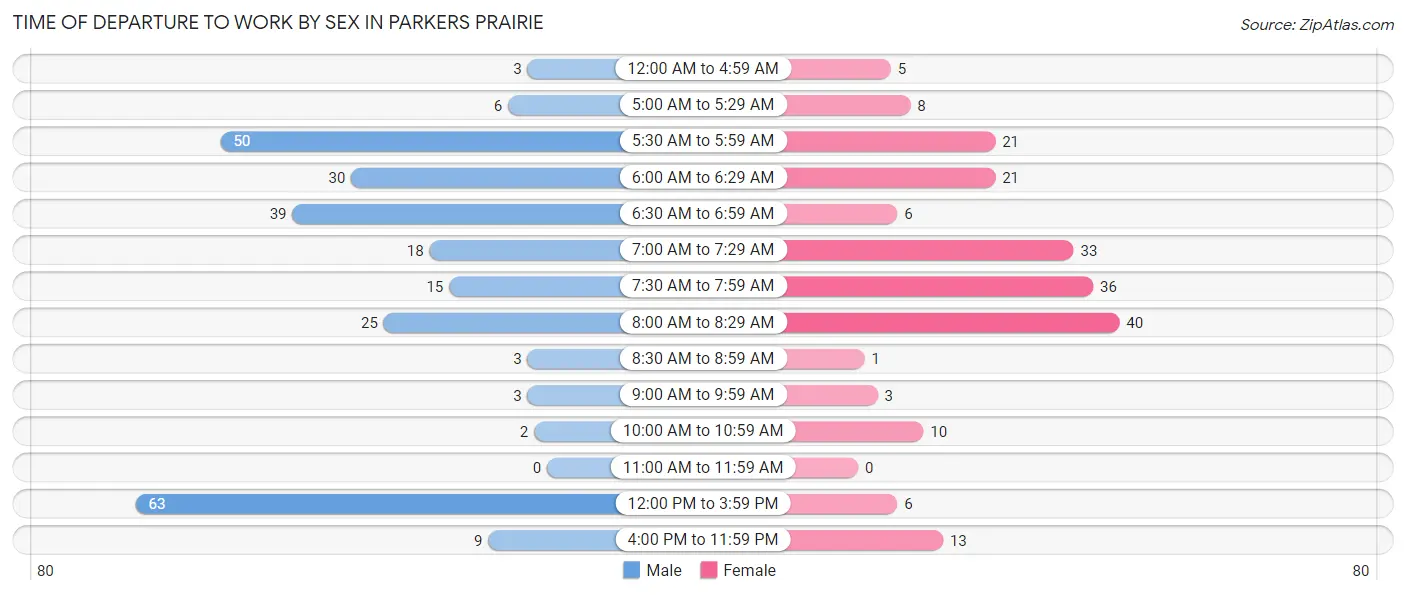
| Time of Departure | Male | Female |
| 12:00 AM to 4:59 AM | 3 (1.1%) | 5 (2.5%) |
| 5:00 AM to 5:29 AM | 6 (2.3%) | 8 (3.9%) |
| 5:30 AM to 5:59 AM | 50 (18.8%) | 21 (10.3%) |
| 6:00 AM to 6:29 AM | 30 (11.3%) | 21 (10.3%) |
| 6:30 AM to 6:59 AM | 39 (14.7%) | 6 (3.0%) |
| 7:00 AM to 7:29 AM | 18 (6.8%) | 33 (16.3%) |
| 7:30 AM to 7:59 AM | 15 (5.6%) | 36 (17.7%) |
| 8:00 AM to 8:29 AM | 25 (9.4%) | 40 (19.7%) |
| 8:30 AM to 8:59 AM | 3 (1.1%) | 1 (0.5%) |
| 9:00 AM to 9:59 AM | 3 (1.1%) | 3 (1.5%) |
| 10:00 AM to 10:59 AM | 2 (0.7%) | 10 (4.9%) |
| 11:00 AM to 11:59 AM | 0 (0.0%) | 0 (0.0%) |
| 12:00 PM to 3:59 PM | 63 (23.7%) | 6 (3.0%) |
| 4:00 PM to 11:59 PM | 9 (3.4%) | 13 (6.4%) |
| Total | 266 (100.0%) | 203 (100.0%) |
Housing Occupancy in Parkers Prairie
Occupancy by Ownership in Parkers Prairie
Of the total 437 dwellings in Parkers Prairie, owner-occupied units account for 339 (77.6%), while renter-occupied units make up 98 (22.4%).
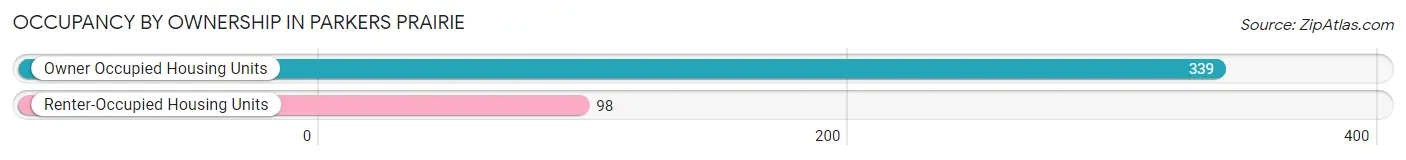
| Occupancy | # Housing Units | % Housing Units |
| Owner Occupied Housing Units | 339 | 77.6% |
| Renter-Occupied Housing Units | 98 | 22.4% |
| Total Occupied Housing Units | 437 | 100.0% |
Occupancy by Household Size in Parkers Prairie
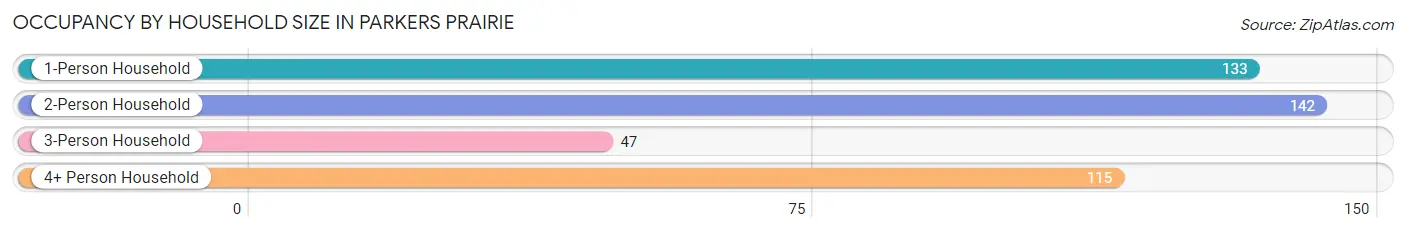
| Household Size | # Housing Units | % Housing Units |
| 1-Person Household | 133 | 30.4% |
| 2-Person Household | 142 | 32.5% |
| 3-Person Household | 47 | 10.8% |
| 4+ Person Household | 115 | 26.3% |
| Total Housing Units | 437 | 100.0% |
Occupancy by Ownership by Household Size in Parkers Prairie
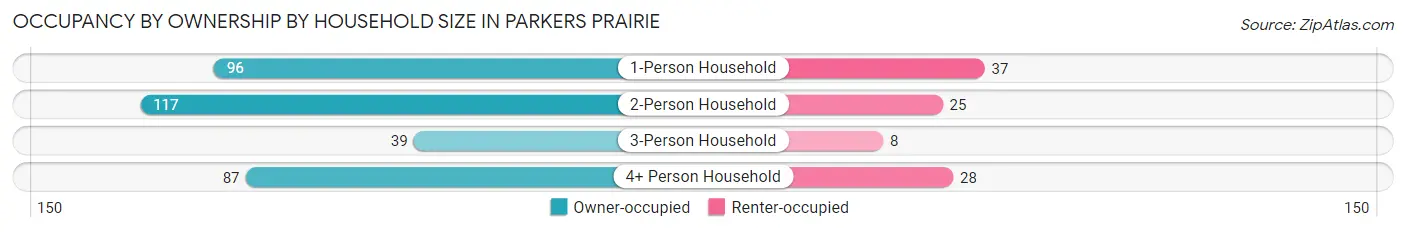
| Household Size | Owner-occupied | Renter-occupied |
| 1-Person Household | 96 (72.2%) | 37 (27.8%) |
| 2-Person Household | 117 (82.4%) | 25 (17.6%) |
| 3-Person Household | 39 (83.0%) | 8 (17.0%) |
| 4+ Person Household | 87 (75.6%) | 28 (24.3%) |
| Total Housing Units | 339 (77.6%) | 98 (22.4%) |
Occupancy by Educational Attainment in Parkers Prairie
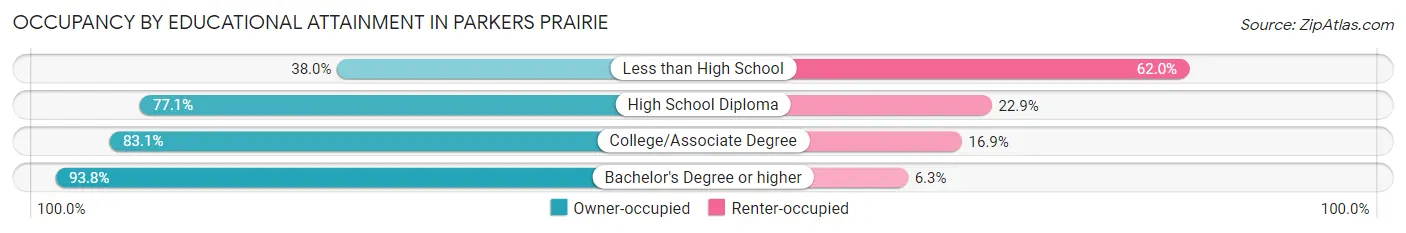
| Household Size | Owner-occupied | Renter-occupied |
| Less than High School | 19 (38.0%) | 31 (62.0%) |
| High School Diploma | 108 (77.1%) | 32 (22.9%) |
| College/Associate Degree | 152 (83.1%) | 31 (16.9%) |
| Bachelor's Degree or higher | 60 (93.8%) | 4 (6.2%) |
Occupancy by Age of Householder in Parkers Prairie
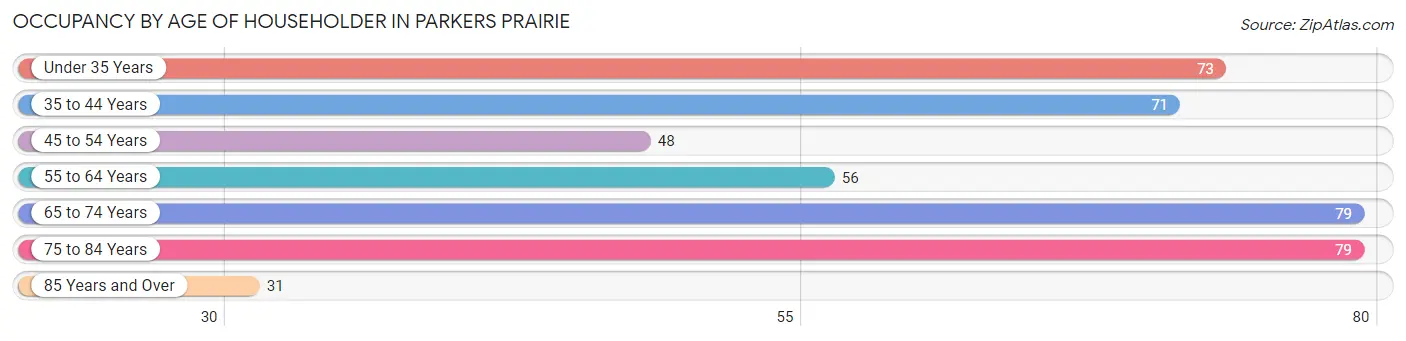
| Age Bracket | # Households | % Households |
| Under 35 Years | 73 | 16.7% |
| 35 to 44 Years | 71 | 16.3% |
| 45 to 54 Years | 48 | 11.0% |
| 55 to 64 Years | 56 | 12.8% |
| 65 to 74 Years | 79 | 18.1% |
| 75 to 84 Years | 79 | 18.1% |
| 85 Years and Over | 31 | 7.1% |
| Total | 437 | 100.0% |
Housing Finances in Parkers Prairie
Median Income by Occupancy in Parkers Prairie
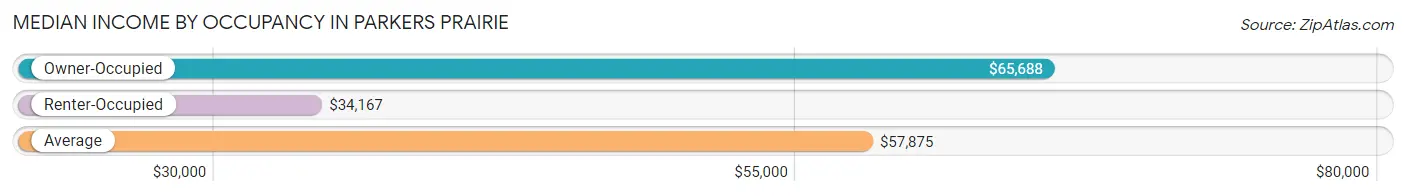
| Occupancy Type | # Households | Median Income |
| Owner-Occupied | 339 (77.6%) | $65,688 |
| Renter-Occupied | 98 (22.4%) | $34,167 |
| Average | 437 (100.0%) | $57,875 |
Occupancy by Householder Income Bracket in Parkers Prairie
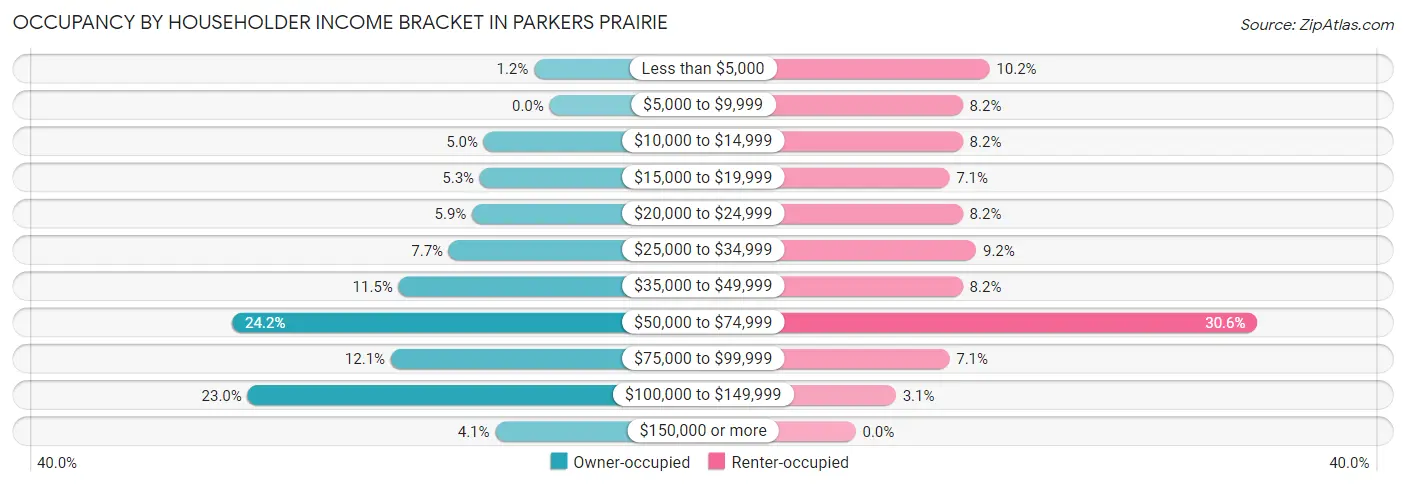
| Income Bracket | Owner-occupied | Renter-occupied |
| Less than $5,000 | 4 (1.2%) | 10 (10.2%) |
| $5,000 to $9,999 | 0 (0.0%) | 8 (8.2%) |
| $10,000 to $14,999 | 17 (5.0%) | 8 (8.2%) |
| $15,000 to $19,999 | 18 (5.3%) | 7 (7.1%) |
| $20,000 to $24,999 | 20 (5.9%) | 8 (8.2%) |
| $25,000 to $34,999 | 26 (7.7%) | 9 (9.2%) |
| $35,000 to $49,999 | 39 (11.5%) | 8 (8.2%) |
| $50,000 to $74,999 | 82 (24.2%) | 30 (30.6%) |
| $75,000 to $99,999 | 41 (12.1%) | 7 (7.1%) |
| $100,000 to $149,999 | 78 (23.0%) | 3 (3.1%) |
| $150,000 or more | 14 (4.1%) | 0 (0.0%) |
| Total | 339 (100.0%) | 98 (100.0%) |
Monthly Housing Cost Tiers in Parkers Prairie
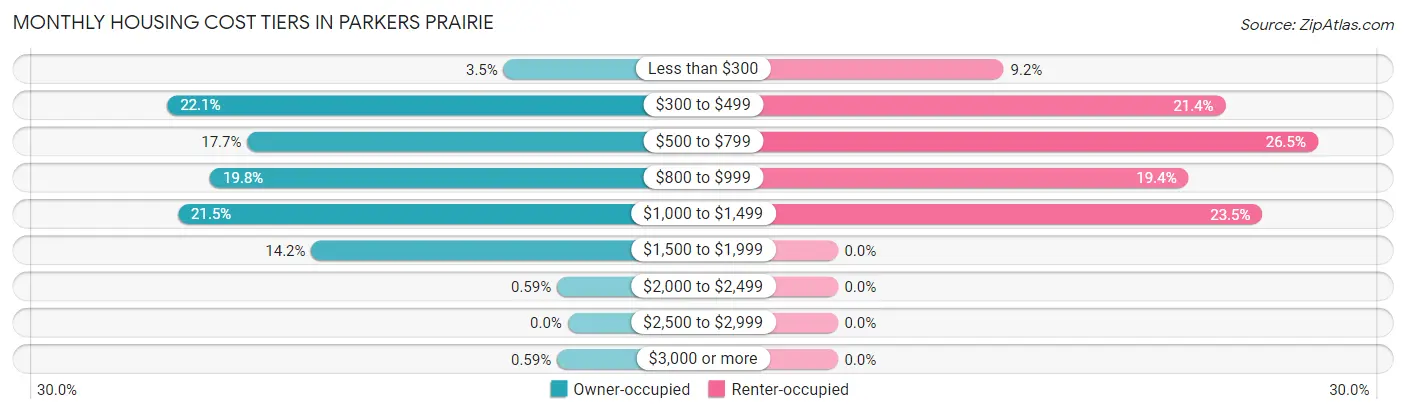
| Monthly Cost | Owner-occupied | Renter-occupied |
| Less than $300 | 12 (3.5%) | 9 (9.2%) |
| $300 to $499 | 75 (22.1%) | 21 (21.4%) |
| $500 to $799 | 60 (17.7%) | 26 (26.5%) |
| $800 to $999 | 67 (19.8%) | 19 (19.4%) |
| $1,000 to $1,499 | 73 (21.5%) | 23 (23.5%) |
| $1,500 to $1,999 | 48 (14.2%) | 0 (0.0%) |
| $2,000 to $2,499 | 2 (0.6%) | 0 (0.0%) |
| $2,500 to $2,999 | 0 (0.0%) | 0 (0.0%) |
| $3,000 or more | 2 (0.6%) | 0 (0.0%) |
| Total | 339 (100.0%) | 98 (100.0%) |
Physical Housing Characteristics in Parkers Prairie
Housing Structures in Parkers Prairie
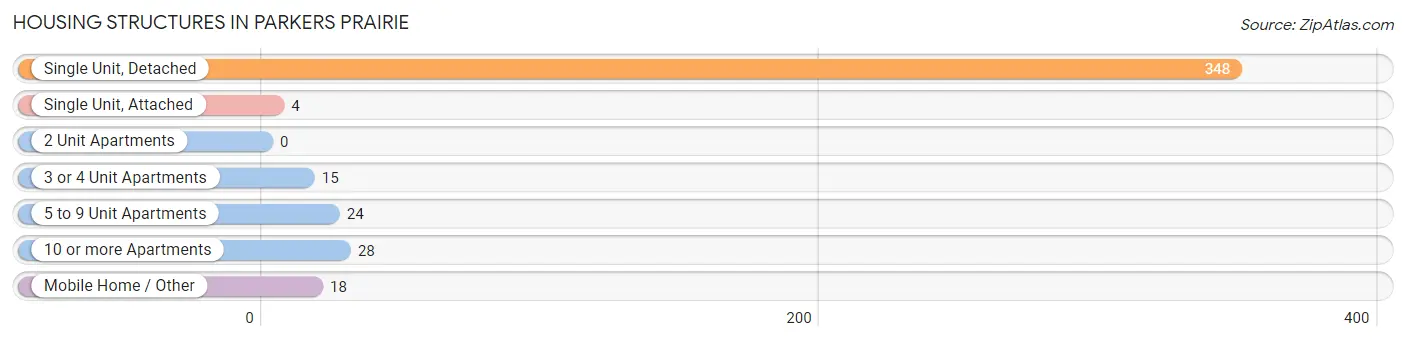
| Structure Type | # Housing Units | % Housing Units |
| Single Unit, Detached | 348 | 79.6% |
| Single Unit, Attached | 4 | 0.9% |
| 2 Unit Apartments | 0 | 0.0% |
| 3 or 4 Unit Apartments | 15 | 3.4% |
| 5 to 9 Unit Apartments | 24 | 5.5% |
| 10 or more Apartments | 28 | 6.4% |
| Mobile Home / Other | 18 | 4.1% |
| Total | 437 | 100.0% |
Housing Structures by Occupancy in Parkers Prairie
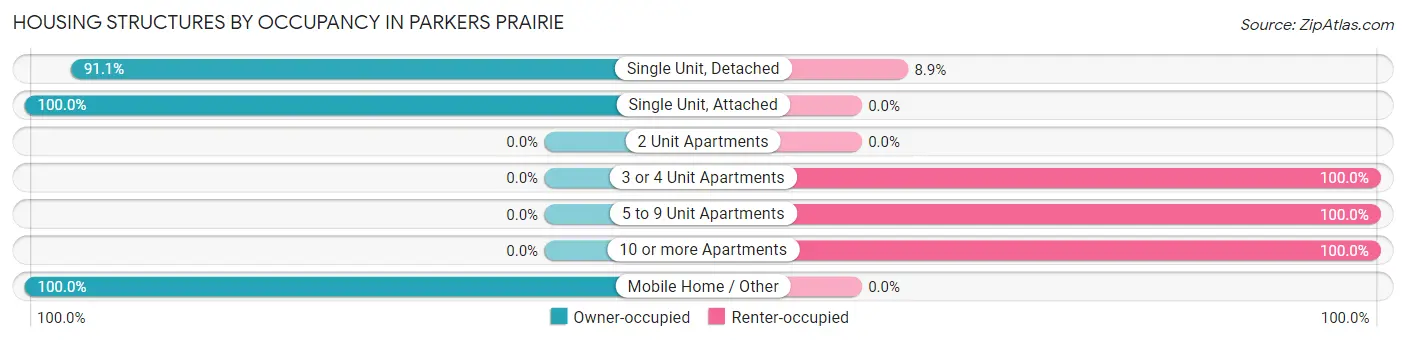
| Structure Type | Owner-occupied | Renter-occupied |
| Single Unit, Detached | 317 (91.1%) | 31 (8.9%) |
| Single Unit, Attached | 4 (100.0%) | 0 (0.0%) |
| 2 Unit Apartments | 0 (0.0%) | 0 (0.0%) |
| 3 or 4 Unit Apartments | 0 (0.0%) | 15 (100.0%) |
| 5 to 9 Unit Apartments | 0 (0.0%) | 24 (100.0%) |
| 10 or more Apartments | 0 (0.0%) | 28 (100.0%) |
| Mobile Home / Other | 18 (100.0%) | 0 (0.0%) |
| Total | 339 (77.6%) | 98 (22.4%) |
Housing Structures by Number of Rooms in Parkers Prairie
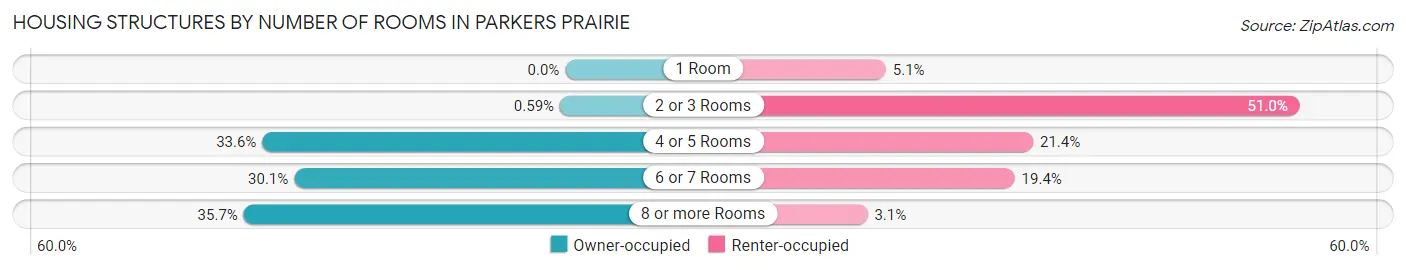
| Number of Rooms | Owner-occupied | Renter-occupied |
| 1 Room | 0 (0.0%) | 5 (5.1%) |
| 2 or 3 Rooms | 2 (0.6%) | 50 (51.0%) |
| 4 or 5 Rooms | 114 (33.6%) | 21 (21.4%) |
| 6 or 7 Rooms | 102 (30.1%) | 19 (19.4%) |
| 8 or more Rooms | 121 (35.7%) | 3 (3.1%) |
| Total | 339 (100.0%) | 98 (100.0%) |
Housing Structure by Heating Type in Parkers Prairie
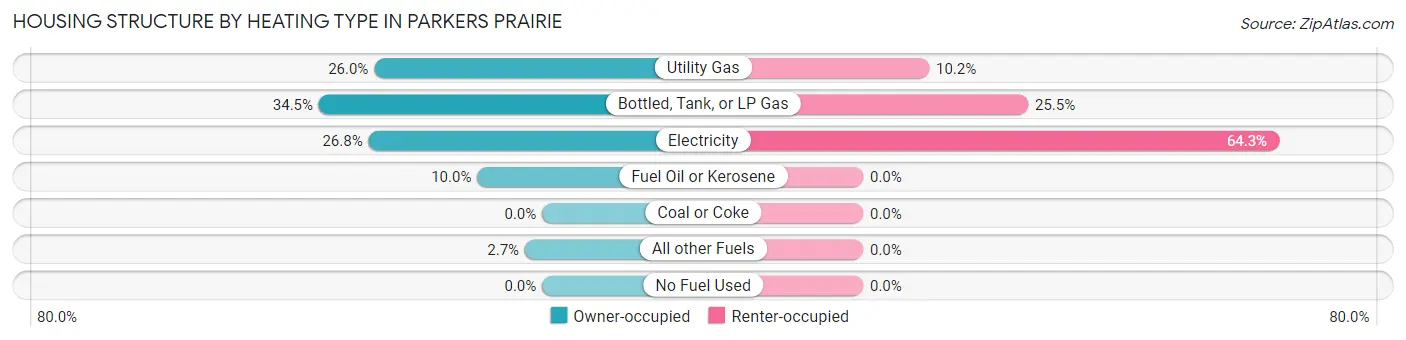
| Heating Type | Owner-occupied | Renter-occupied |
| Utility Gas | 88 (26.0%) | 10 (10.2%) |
| Bottled, Tank, or LP Gas | 117 (34.5%) | 25 (25.5%) |
| Electricity | 91 (26.8%) | 63 (64.3%) |
| Fuel Oil or Kerosene | 34 (10.0%) | 0 (0.0%) |
| Coal or Coke | 0 (0.0%) | 0 (0.0%) |
| All other Fuels | 9 (2.6%) | 0 (0.0%) |
| No Fuel Used | 0 (0.0%) | 0 (0.0%) |
| Total | 339 (100.0%) | 98 (100.0%) |
Household Vehicle Usage in Parkers Prairie
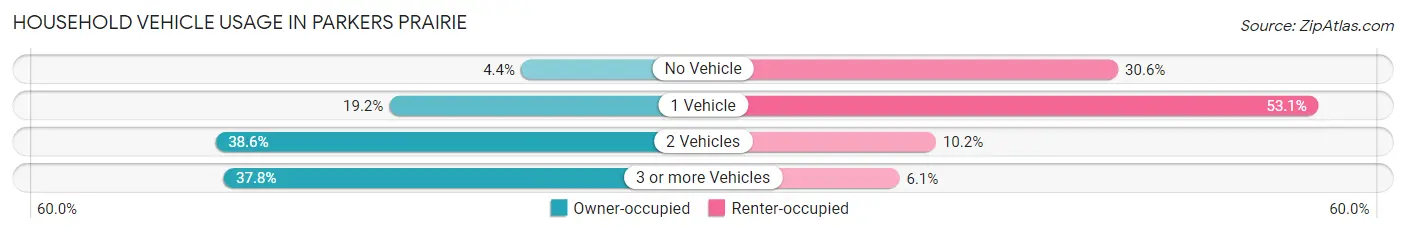
| Vehicles per Household | Owner-occupied | Renter-occupied |
| No Vehicle | 15 (4.4%) | 30 (30.6%) |
| 1 Vehicle | 65 (19.2%) | 52 (53.1%) |
| 2 Vehicles | 131 (38.6%) | 10 (10.2%) |
| 3 or more Vehicles | 128 (37.8%) | 6 (6.1%) |
| Total | 339 (100.0%) | 98 (100.0%) |
Real Estate & Mortgages in Parkers Prairie
Real Estate and Mortgage Overview in Parkers Prairie
| Characteristic | Without Mortgage | With Mortgage |
| Housing Units | 165 | 174 |
| Median Property Value | $122,900 | $144,400 |
| Median Household Income | $46,563 | $5 |
| Monthly Housing Costs | $487 | $2 |
| Real Estate Taxes | $1,515 | $0 |
Property Value by Mortgage Status in Parkers Prairie
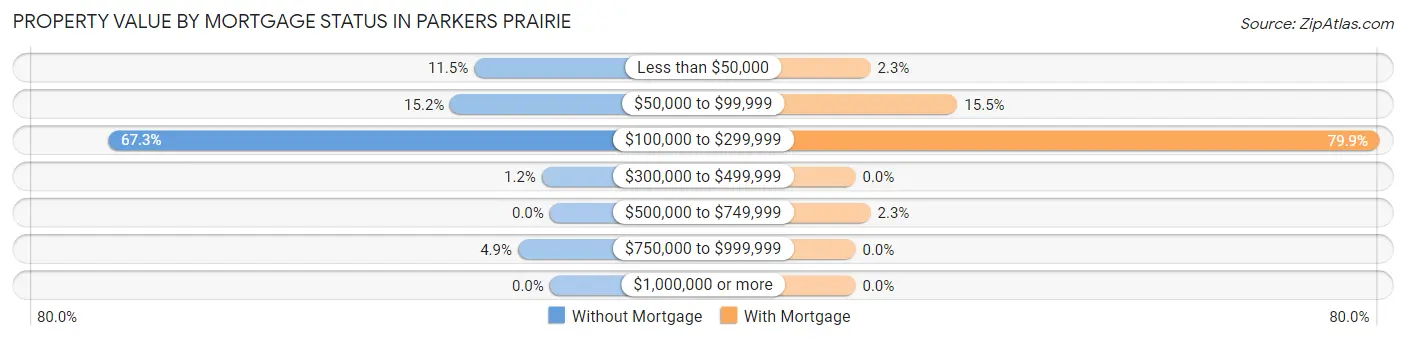
| Property Value | Without Mortgage | With Mortgage |
| Less than $50,000 | 19 (11.5%) | 4 (2.3%) |
| $50,000 to $99,999 | 25 (15.1%) | 27 (15.5%) |
| $100,000 to $299,999 | 111 (67.3%) | 139 (79.9%) |
| $300,000 to $499,999 | 2 (1.2%) | 0 (0.0%) |
| $500,000 to $749,999 | 0 (0.0%) | 4 (2.3%) |
| $750,000 to $999,999 | 8 (4.9%) | 0 (0.0%) |
| $1,000,000 or more | 0 (0.0%) | 0 (0.0%) |
| Total | 165 (100.0%) | 174 (100.0%) |
Household Income by Mortgage Status in Parkers Prairie
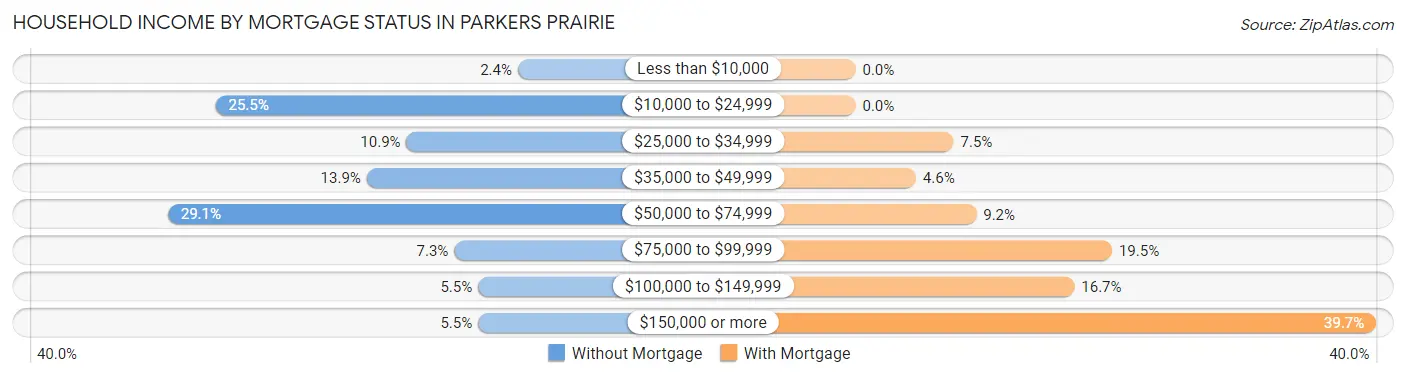
| Household Income | Without Mortgage | With Mortgage |
| Less than $10,000 | 4 (2.4%) | 0 (0.0%) |
| $10,000 to $24,999 | 42 (25.5%) | 0 (0.0%) |
| $25,000 to $34,999 | 18 (10.9%) | 13 (7.5%) |
| $35,000 to $49,999 | 23 (13.9%) | 8 (4.6%) |
| $50,000 to $74,999 | 48 (29.1%) | 16 (9.2%) |
| $75,000 to $99,999 | 12 (7.3%) | 34 (19.5%) |
| $100,000 to $149,999 | 9 (5.4%) | 29 (16.7%) |
| $150,000 or more | 9 (5.4%) | 69 (39.7%) |
| Total | 165 (100.0%) | 174 (100.0%) |
Property Value to Household Income Ratio in Parkers Prairie
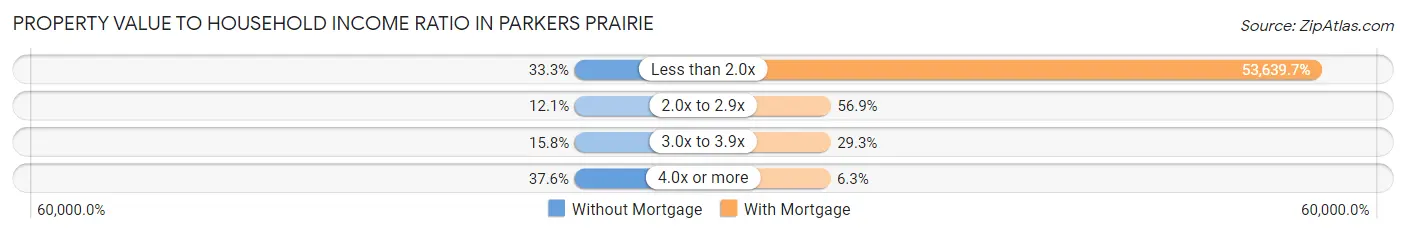
| Value-to-Income Ratio | Without Mortgage | With Mortgage |
| Less than 2.0x | 55 (33.3%) | 93,333 (53,639.7%) |
| 2.0x to 2.9x | 20 (12.1%) | 99 (56.9%) |
| 3.0x to 3.9x | 26 (15.8%) | 51 (29.3%) |
| 4.0x or more | 62 (37.6%) | 11 (6.3%) |
| Total | 165 (100.0%) | 174 (100.0%) |
Real Estate Taxes by Mortgage Status in Parkers Prairie
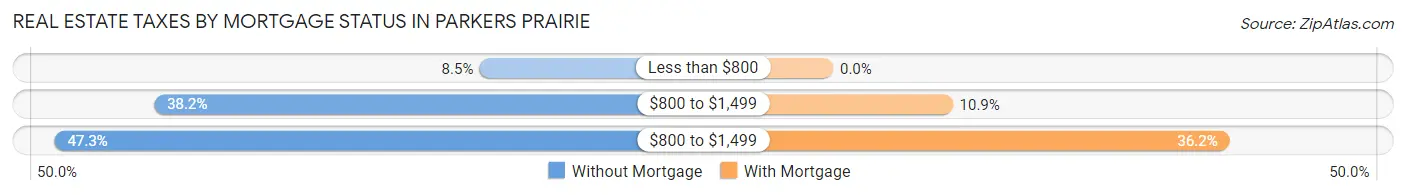
| Property Taxes | Without Mortgage | With Mortgage |
| Less than $800 | 14 (8.5%) | 0 (0.0%) |
| $800 to $1,499 | 63 (38.2%) | 19 (10.9%) |
| $800 to $1,499 | 78 (47.3%) | 63 (36.2%) |
| Total | 165 (100.0%) | 174 (100.0%) |
Health & Disability in Parkers Prairie
Health Insurance Coverage by Age in Parkers Prairie
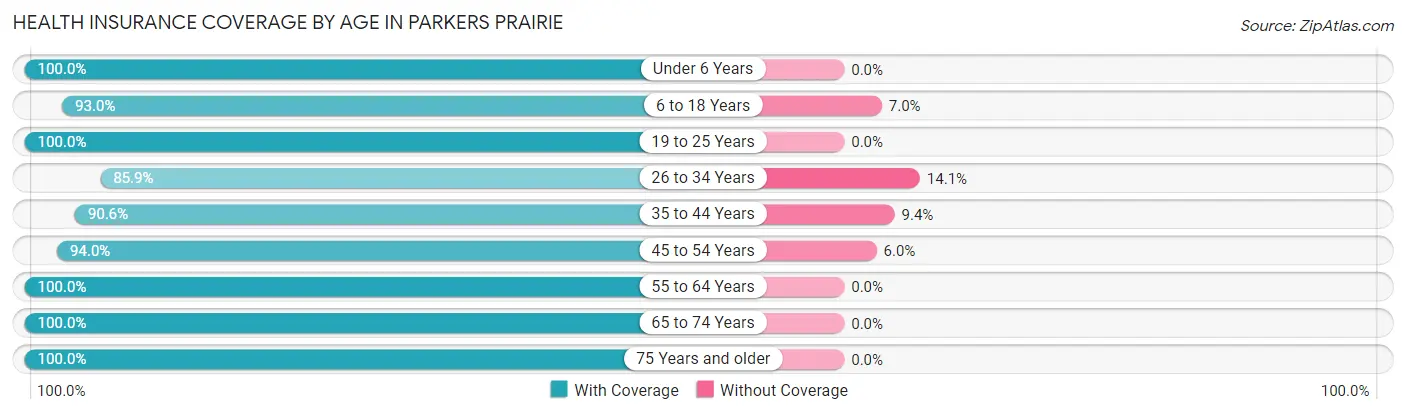
| Age Bracket | With Coverage | Without Coverage |
| Under 6 Years | 118 (100.0%) | 0 (0.0%) |
| 6 to 18 Years | 186 (93.0%) | 14 (7.0%) |
| 19 to 25 Years | 128 (100.0%) | 0 (0.0%) |
| 26 to 34 Years | 67 (85.9%) | 11 (14.1%) |
| 35 to 44 Years | 116 (90.6%) | 12 (9.4%) |
| 45 to 54 Years | 109 (94.0%) | 7 (6.0%) |
| 55 to 64 Years | 92 (100.0%) | 0 (0.0%) |
| 65 to 74 Years | 136 (100.0%) | 0 (0.0%) |
| 75 Years and older | 149 (100.0%) | 0 (0.0%) |
| Total | 1,101 (96.2%) | 44 (3.8%) |
Health Insurance Coverage by Citizenship Status in Parkers Prairie
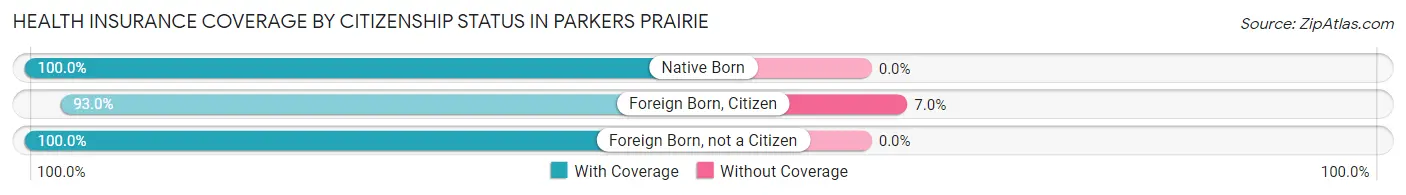
| Citizenship Status | With Coverage | Without Coverage |
| Native Born | 118 (100.0%) | 0 (0.0%) |
| Foreign Born, Citizen | 186 (93.0%) | 14 (7.0%) |
| Foreign Born, not a Citizen | 128 (100.0%) | 0 (0.0%) |
Health Insurance Coverage by Household Income in Parkers Prairie
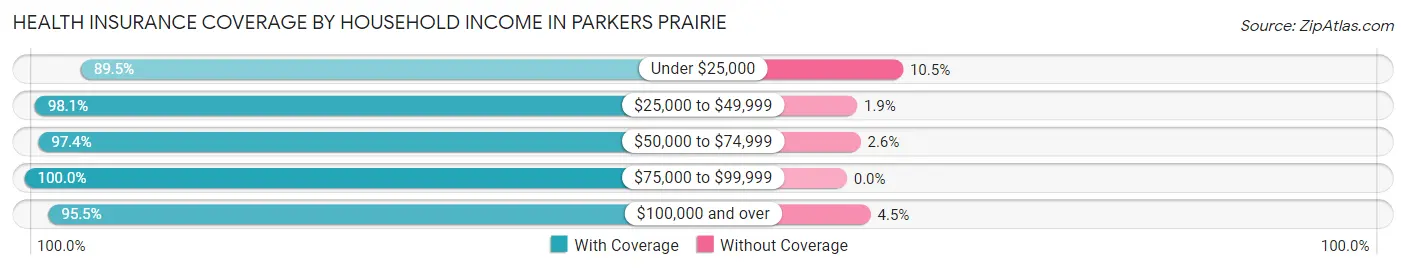
| Household Income | With Coverage | Without Coverage |
| Under $25,000 | 136 (89.5%) | 16 (10.5%) |
| $25,000 to $49,999 | 153 (98.1%) | 3 (1.9%) |
| $50,000 to $74,999 | 303 (97.4%) | 8 (2.6%) |
| $75,000 to $99,999 | 135 (100.0%) | 0 (0.0%) |
| $100,000 and over | 364 (95.5%) | 17 (4.5%) |
Public vs Private Health Insurance Coverage by Age in Parkers Prairie
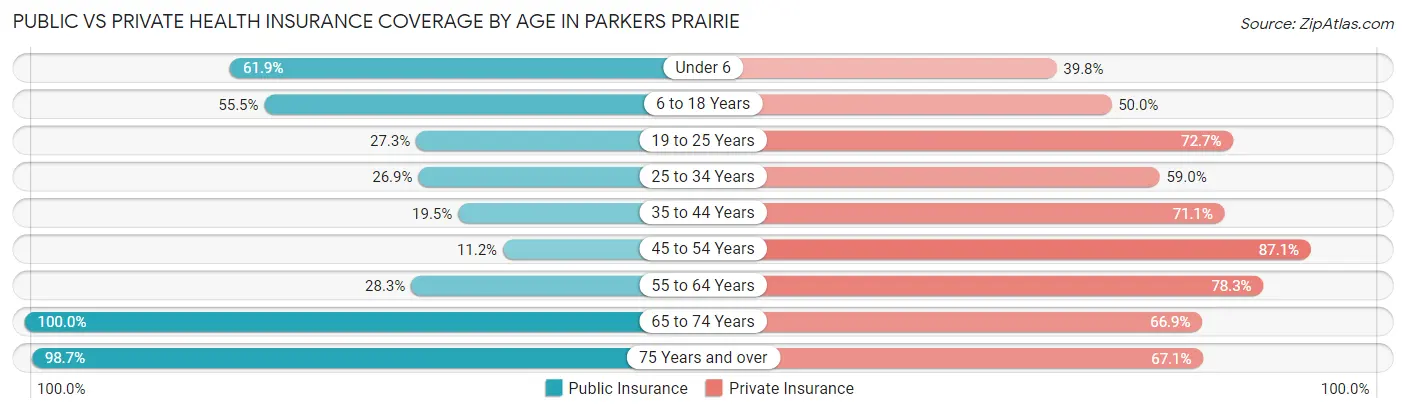
| Age Bracket | Public Insurance | Private Insurance |
| Under 6 | 73 (61.9%) | 47 (39.8%) |
| 6 to 18 Years | 111 (55.5%) | 100 (50.0%) |
| 19 to 25 Years | 35 (27.3%) | 93 (72.7%) |
| 25 to 34 Years | 21 (26.9%) | 46 (59.0%) |
| 35 to 44 Years | 25 (19.5%) | 91 (71.1%) |
| 45 to 54 Years | 13 (11.2%) | 101 (87.1%) |
| 55 to 64 Years | 26 (28.3%) | 72 (78.3%) |
| 65 to 74 Years | 136 (100.0%) | 91 (66.9%) |
| 75 Years and over | 147 (98.7%) | 100 (67.1%) |
| Total | 587 (51.3%) | 741 (64.7%) |
Disability Status by Sex by Age in Parkers Prairie
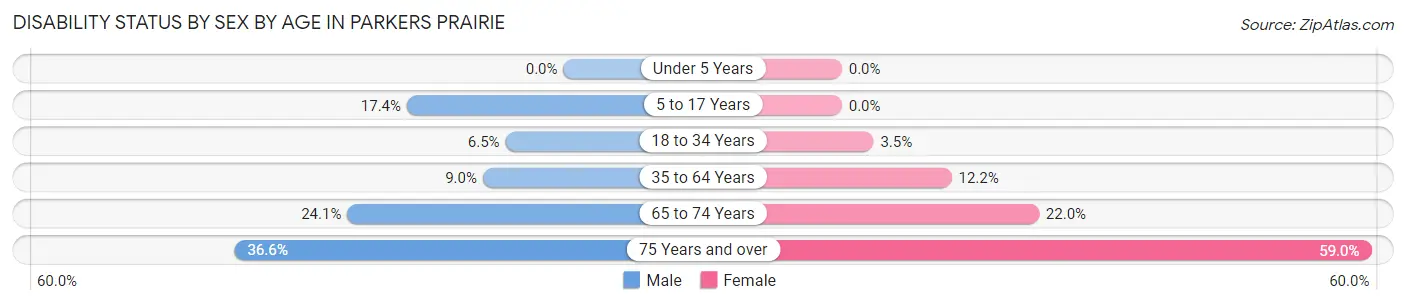
| Age Bracket | Male | Female |
| Under 5 Years | 0 (0.0%) | 0 (0.0%) |
| 5 to 17 Years | 19 (17.4%) | 0 (0.0%) |
| 18 to 34 Years | 8 (6.5%) | 3 (3.5%) |
| 35 to 64 Years | 14 (9.0%) | 22 (12.2%) |
| 65 to 74 Years | 13 (24.1%) | 18 (22.0%) |
| 75 Years and over | 26 (36.6%) | 46 (59.0%) |
Disability Class by Sex by Age in Parkers Prairie
Disability Class: Hearing Difficulty
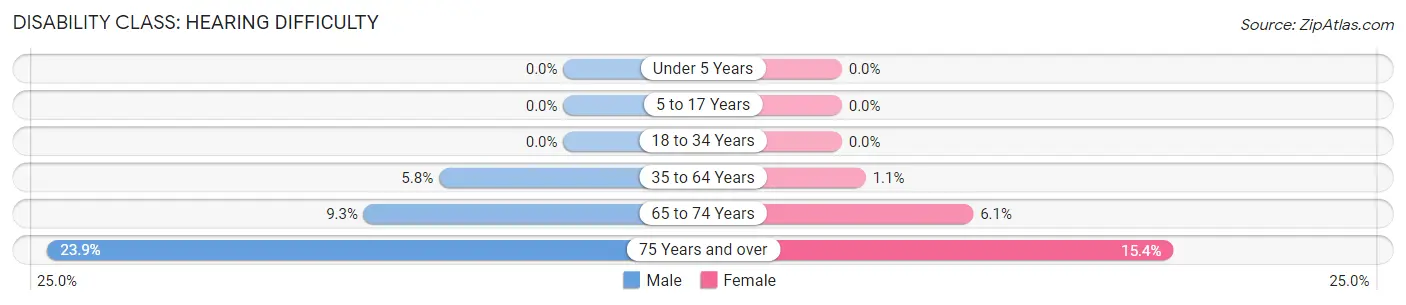
| Age Bracket | Male | Female |
| Under 5 Years | 0 (0.0%) | 0 (0.0%) |
| 5 to 17 Years | 0 (0.0%) | 0 (0.0%) |
| 18 to 34 Years | 0 (0.0%) | 0 (0.0%) |
| 35 to 64 Years | 9 (5.8%) | 2 (1.1%) |
| 65 to 74 Years | 5 (9.3%) | 5 (6.1%) |
| 75 Years and over | 17 (23.9%) | 12 (15.4%) |
Disability Class: Vision Difficulty
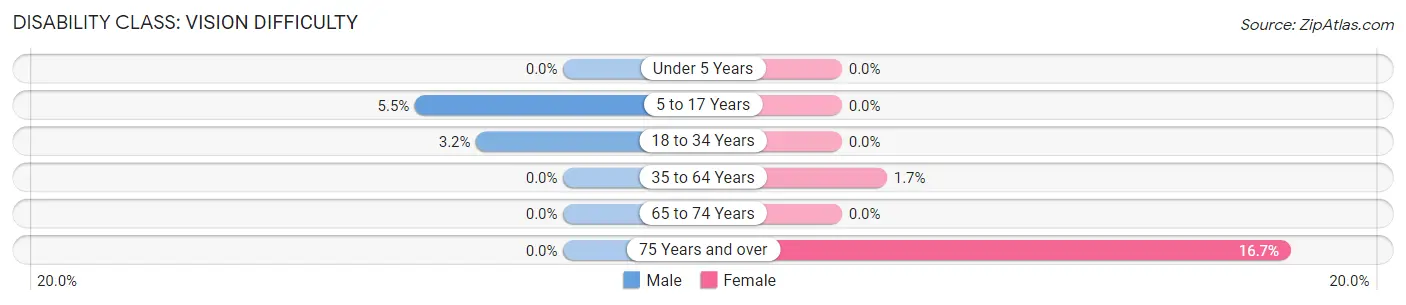
| Age Bracket | Male | Female |
| Under 5 Years | 0 (0.0%) | 0 (0.0%) |
| 5 to 17 Years | 6 (5.5%) | 0 (0.0%) |
| 18 to 34 Years | 4 (3.2%) | 0 (0.0%) |
| 35 to 64 Years | 0 (0.0%) | 3 (1.7%) |
| 65 to 74 Years | 0 (0.0%) | 0 (0.0%) |
| 75 Years and over | 0 (0.0%) | 13 (16.7%) |
Disability Class: Cognitive Difficulty
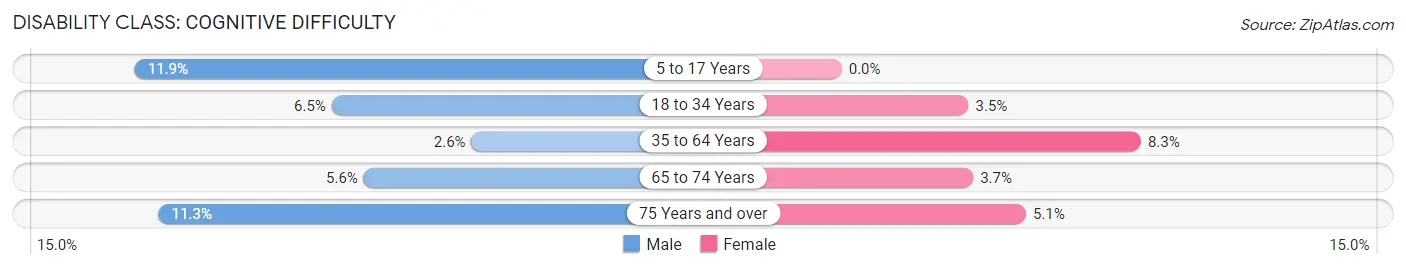
| Age Bracket | Male | Female |
| 5 to 17 Years | 13 (11.9%) | 0 (0.0%) |
| 18 to 34 Years | 8 (6.5%) | 3 (3.5%) |
| 35 to 64 Years | 4 (2.6%) | 15 (8.3%) |
| 65 to 74 Years | 3 (5.6%) | 3 (3.7%) |
| 75 Years and over | 8 (11.3%) | 4 (5.1%) |
Disability Class: Ambulatory Difficulty
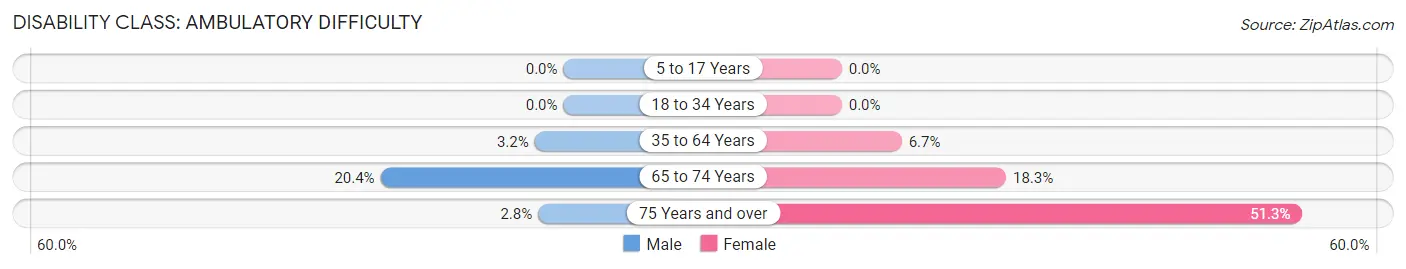
| Age Bracket | Male | Female |
| 5 to 17 Years | 0 (0.0%) | 0 (0.0%) |
| 18 to 34 Years | 0 (0.0%) | 0 (0.0%) |
| 35 to 64 Years | 5 (3.2%) | 12 (6.7%) |
| 65 to 74 Years | 11 (20.4%) | 15 (18.3%) |
| 75 Years and over | 2 (2.8%) | 40 (51.3%) |
Disability Class: Self-Care Difficulty
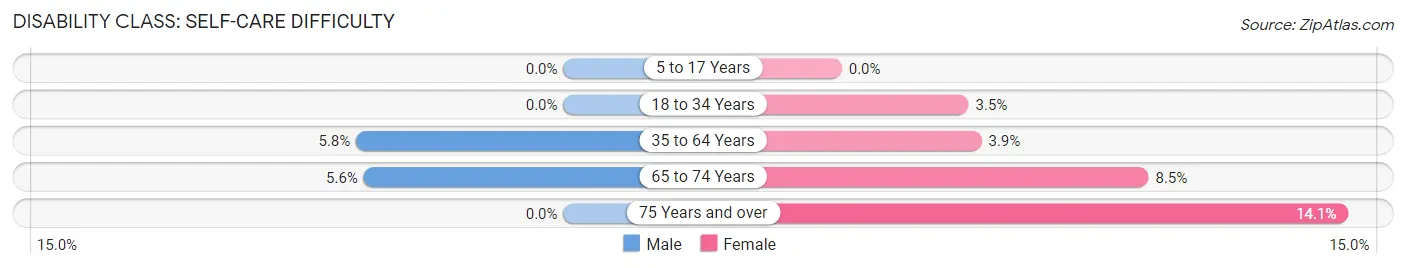
| Age Bracket | Male | Female |
| 5 to 17 Years | 0 (0.0%) | 0 (0.0%) |
| 18 to 34 Years | 0 (0.0%) | 3 (3.5%) |
| 35 to 64 Years | 9 (5.8%) | 7 (3.9%) |
| 65 to 74 Years | 3 (5.6%) | 7 (8.5%) |
| 75 Years and over | 0 (0.0%) | 11 (14.1%) |
Technology Access in Parkers Prairie
Computing Device Access in Parkers Prairie
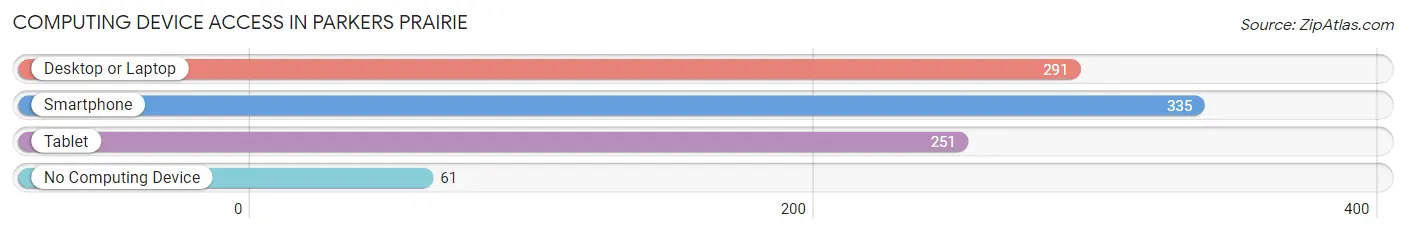
| Device Type | # Households | % Households |
| Desktop or Laptop | 291 | 66.6% |
| Smartphone | 335 | 76.7% |
| Tablet | 251 | 57.4% |
| No Computing Device | 61 | 14.0% |
| Total | 437 | 100.0% |
Internet Access in Parkers Prairie
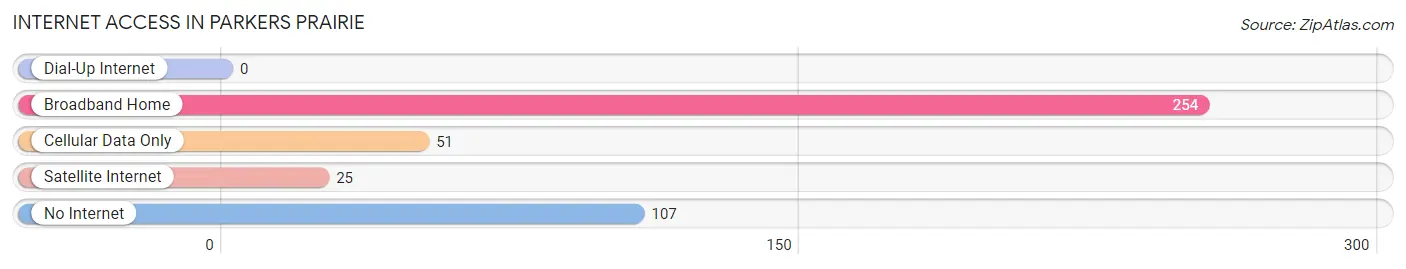
| Internet Type | # Households | % Households |
| Dial-Up Internet | 0 | 0.0% |
| Broadband Home | 254 | 58.1% |
| Cellular Data Only | 51 | 11.7% |
| Satellite Internet | 25 | 5.7% |
| No Internet | 107 | 24.5% |
| Total | 437 | 100.0% |
Parkers Prairie Summary
Parkers Prairie is a small city located in Otter Tail County, Minnesota. It is situated on the western shore of Lake Osakis, about 30 miles northwest of Alexandria. The city has a population of 1,068 as of the 2010 census.
History
The area that is now Parkers Prairie was first settled in the late 1800s by settlers from Norway and Germany. The first post office was established in 1877 and the city was officially incorporated in 1881. The city was named after the first postmaster, William Parker.
The city was originally a farming community, but in the early 1900s, the area began to develop into a resort town. The first hotel was built in 1906 and the city soon became a popular destination for fishing and hunting.
Geography
Parkers Prairie is located at 46°25'N, 95°37'W (46.4167, -95.6167). The city is situated on the western shore of Lake Osakis, about 30 miles northwest of Alexandria. The city has a total area of 1.2 square miles, all of which is land.
The city is located in a rural area of Minnesota, surrounded by rolling hills and farmland. The terrain is mostly flat, with some small hills and valleys. The city is located in the Central Lakes region of Minnesota, which is known for its lakes and forests.
Economy
The economy of Parkers Prairie is largely based on tourism and agriculture. The city is a popular destination for fishing, hunting, and other outdoor activities. The city also has several small businesses, including restaurants, retail stores, and service providers.
The city is also home to several manufacturing companies, including a wood products company, a metal fabrication company, and a plastics company. The city also has a small airport, which is used for general aviation.
Demographics
As of the 2010 census, the population of Parkers Prairie was 1,068. The racial makeup of the city was 97.2% White, 0.3% African American, 0.3% Native American, 0.3% Asian, 0.2% from other races, and 1.7% from two or more races. Hispanic or Latino of any race were 1.2% of the population.
The median income for a household in the city was $41,250, and the median income for a family was $50,000. The per capita income for the city was $20,845. About 8.2% of families and 10.2% of the population were below the poverty line, including 14.3% of those under age 18 and 8.3% of those age 65 or over.
Conclusion
Parkers Prairie is a small city located in Otter Tail County, Minnesota. It is situated on the western shore of Lake Osakis, about 30 miles northwest of Alexandria. The city has a population of 1,068 as of the 2010 census. The economy of Parkers Prairie is largely based on tourism and agriculture, and the city is a popular destination for fishing, hunting, and other outdoor activities. The racial makeup of the city is 97.2% White, 0.3% African American, 0.3% Native American, 0.3% Asian, 0.2% from other races, and 1.7% from two or more races. The median income for a household in the city was $41,250, and the median income for a family was $50,000.
Common Questions
What is the Total Population of Parkers Prairie?
Total Population of Parkers Prairie is 1,209.
What is the Total Male Population of Parkers Prairie?
Total Male Population of Parkers Prairie is 578.
What is the Total Female Population of Parkers Prairie?
Total Female Population of Parkers Prairie is 631.
What is the Ratio of Males per 100 Females in Parkers Prairie?
There are 91.60 Males per 100 Females in Parkers Prairie.
What is the Ratio of Females per 100 Males in Parkers Prairie?
There are 109.17 Females per 100 Males in Parkers Prairie.
What is the Median Population Age in Parkers Prairie?
Median Population Age in Parkers Prairie is 41.0 Years.
What is the Average Family Size in Parkers Prairie
Average Family Size in Parkers Prairie is 3.0 People.
What is the Average Household Size in Parkers Prairie
Average Household Size in Parkers Prairie is 2.6 People.
What is Per Capita Income in Parkers Prairie?
Per Capita income in Parkers Prairie is $26,601.
What is the Median Family Income in Parkers Prairie?
Median Family Income in Parkers Prairie is $65,688.
What is the Median Household income in Parkers Prairie?
Median Household Income in Parkers Prairie is $57,875.
What is Income or Wage Gap in Parkers Prairie?
Income or Wage Gap in Parkers Prairie is 28.2%.
Women in Parkers Prairie earn 71.8 cents for every dollar earned by a man.
What is Family Income Deficit in Parkers Prairie?
Family Income Deficit in Parkers Prairie is $6,189.
Families that are below poverty line in Parkers Prairie earn $6,189 less on average than the poverty threshold level.
What is Inequality or Gini Index in Parkers Prairie?
Inequality or Gini Index in Parkers Prairie is 0.41.
How Large is the Labor Force in Parkers Prairie?
There are 524 People in the Labor Forcein in Parkers Prairie.
What is the Percentage of People in the Labor Force in Parkers Prairie?
55.4% of People are in the Labor Force in Parkers Prairie.
What is the Unemployment Rate in Parkers Prairie?
Unemployment Rate in Parkers Prairie is 4.8%.