Lake Lillian, MN
Lake Lillian Map
Lake Lillian Overview
201
TOTAL POPULATION
109
MALE POPULATION
92
FEMALE POPULATION
118.48
MALES / 100 FEMALES
84.40
FEMALES / 100 MALES
53.6
MEDIAN AGE
2.6
AVG FAMILY SIZE
1.9
AVG HOUSEHOLD SIZE
$33,450
PER CAPITA INCOME
$66,250
AVG FAMILY INCOME
$61,250
AVG HOUSEHOLD INCOME
5.3%
WAGE / INCOME GAP [ % ]
94.7¢/ $1
WAGE / INCOME GAP [ $ ]
0.40
INEQUALITY / GINI INDEX
107
LABOR FORCE [ PEOPLE ]
60.8%
PERCENT IN LABOR FORCE
5.6%
UNEMPLOYMENT RATE
Lake Lillian Zip Codes
Lake Lillian Area Codes
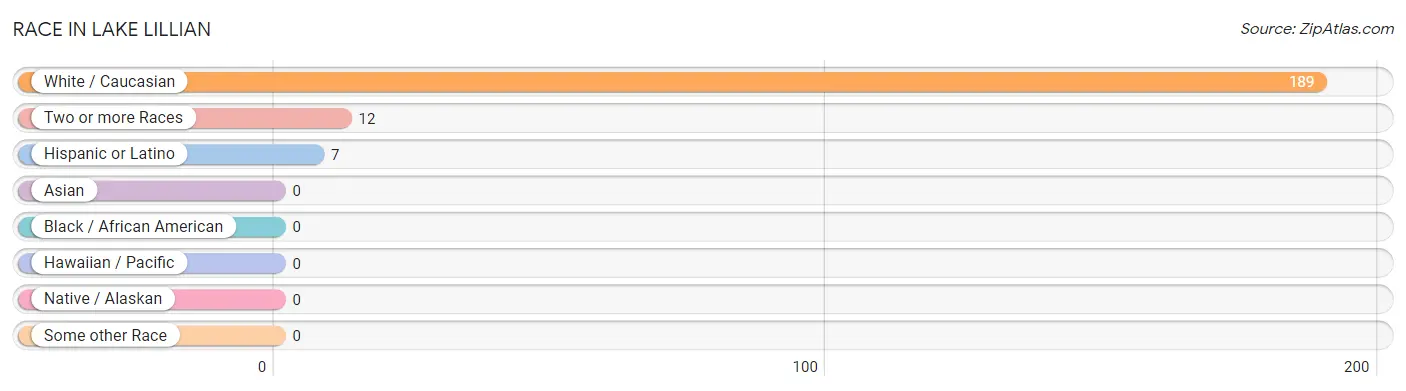
Race in Lake Lillian
The most populous races in Lake Lillian are White / Caucasian (189 | 94.0%), Two or more Races (12 | 6.0%), and Hispanic or Latino (7 | 3.5%).
| Race | # Population | % Population |
| Asian | 0 | 0.0% |
| Black / African American | 0 | 0.0% |
| Hawaiian / Pacific | 0 | 0.0% |
| Hispanic or Latino | 7 | 3.5% |
| Native / Alaskan | 0 | 0.0% |
| White / Caucasian | 189 | 94.0% |
| Two or more Races | 12 | 6.0% |
| Some other Race | 0 | 0.0% |
| Total | 201 | 100.0% |
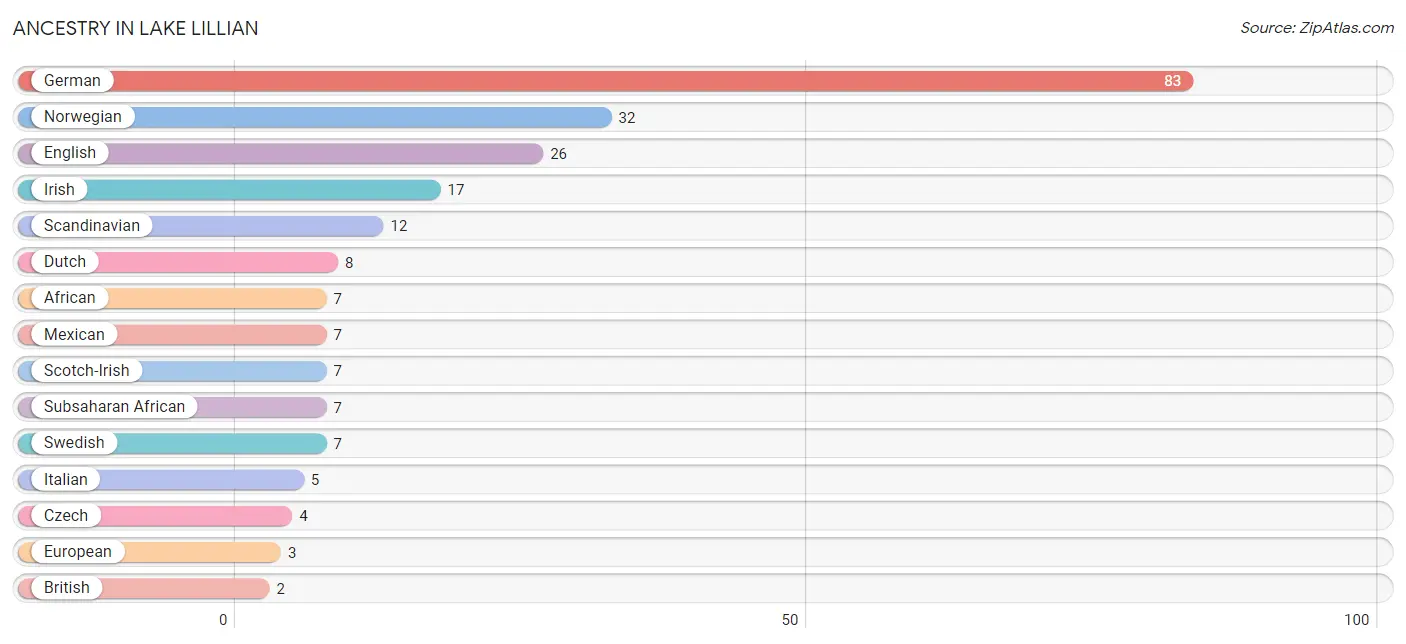
Ancestry in Lake Lillian
The most populous ancestries reported in Lake Lillian are German (83 | 41.3%), Norwegian (32 | 15.9%), English (26 | 12.9%), Irish (17 | 8.5%), and Scandinavian (12 | 6.0%), together accounting for 84.6% of all Lake Lillian residents.
| Ancestry | # Population | % Population |
| African | 7 | 3.5% |
| American | 1 | 0.5% |
| British | 2 | 1.0% |
| Czech | 4 | 2.0% |
| Dutch | 8 | 4.0% |
| English | 26 | 12.9% |
| European | 3 | 1.5% |
| French | 1 | 0.5% |
| French Canadian | 2 | 1.0% |
| German | 83 | 41.3% |
| Irish | 17 | 8.5% |
| Italian | 5 | 2.5% |
| Mexican | 7 | 3.5% |
| Norwegian | 32 | 15.9% |
| Polish | 1 | 0.5% |
| Scandinavian | 12 | 6.0% |
| Scotch-Irish | 7 | 3.5% |
| Subsaharan African | 7 | 3.5% |
| Swedish | 7 | 3.5% | View All 19 Rows |
Immigrants in Lake Lillian

| Immigration Origin | # Population | % Population | View All 0 Rows |
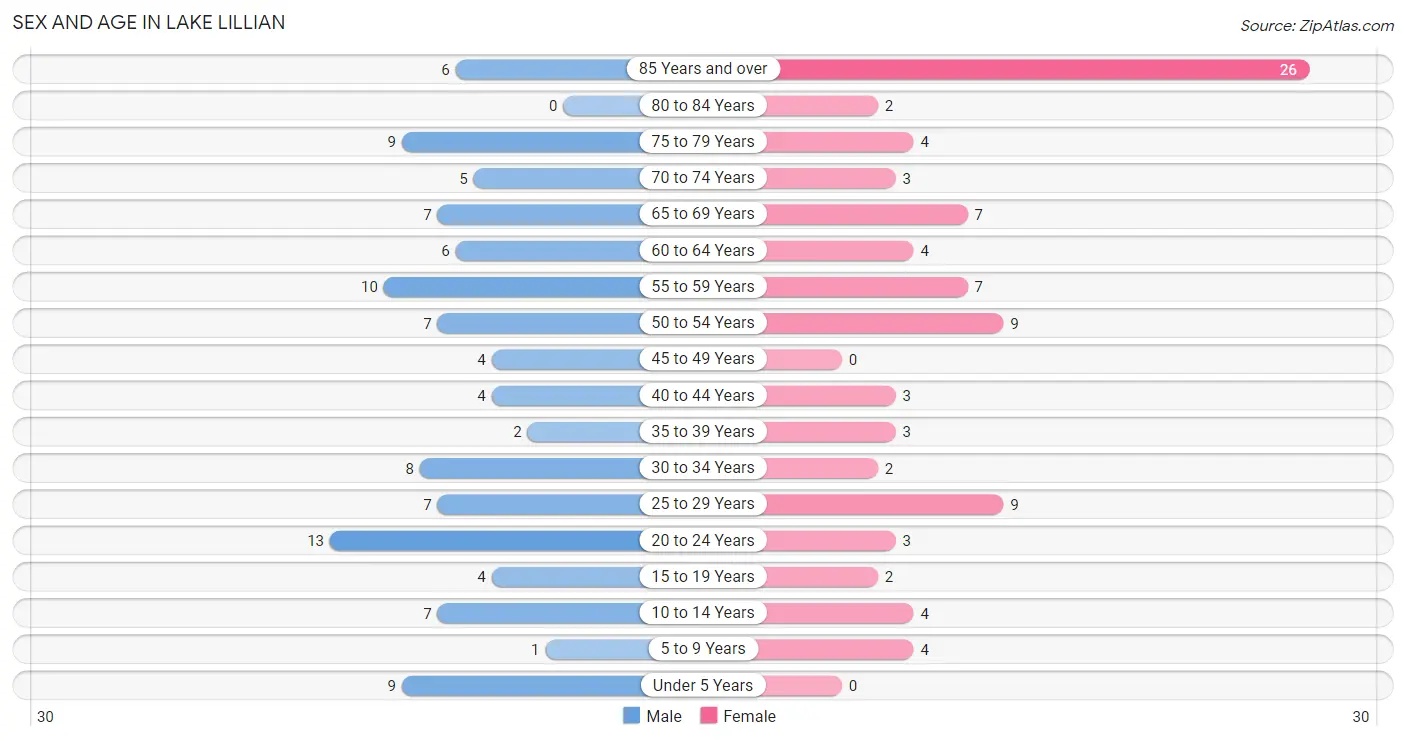
Sex and Age in Lake Lillian
Sex and Age in Lake Lillian
The most populous age groups in Lake Lillian are 20 to 24 Years (13 | 11.9%) for men and 85 Years and over (26 | 28.3%) for women.
| Age Bracket | Male | Female |
| Under 5 Years | 9 (8.3%) | 0 (0.0%) |
| 5 to 9 Years | 1 (0.9%) | 4 (4.3%) |
| 10 to 14 Years | 7 (6.4%) | 4 (4.3%) |
| 15 to 19 Years | 4 (3.7%) | 2 (2.2%) |
| 20 to 24 Years | 13 (11.9%) | 3 (3.3%) |
| 25 to 29 Years | 7 (6.4%) | 9 (9.8%) |
| 30 to 34 Years | 8 (7.3%) | 2 (2.2%) |
| 35 to 39 Years | 2 (1.8%) | 3 (3.3%) |
| 40 to 44 Years | 4 (3.7%) | 3 (3.3%) |
| 45 to 49 Years | 4 (3.7%) | 0 (0.0%) |
| 50 to 54 Years | 7 (6.4%) | 9 (9.8%) |
| 55 to 59 Years | 10 (9.2%) | 7 (7.6%) |
| 60 to 64 Years | 6 (5.5%) | 4 (4.3%) |
| 65 to 69 Years | 7 (6.4%) | 7 (7.6%) |
| 70 to 74 Years | 5 (4.6%) | 3 (3.3%) |
| 75 to 79 Years | 9 (8.3%) | 4 (4.3%) |
| 80 to 84 Years | 0 (0.0%) | 2 (2.2%) |
| 85 Years and over | 6 (5.5%) | 26 (28.3%) |
| Total | 109 (100.0%) | 92 (100.0%) |
Families and Households in Lake Lillian
Median Family Size in Lake Lillian
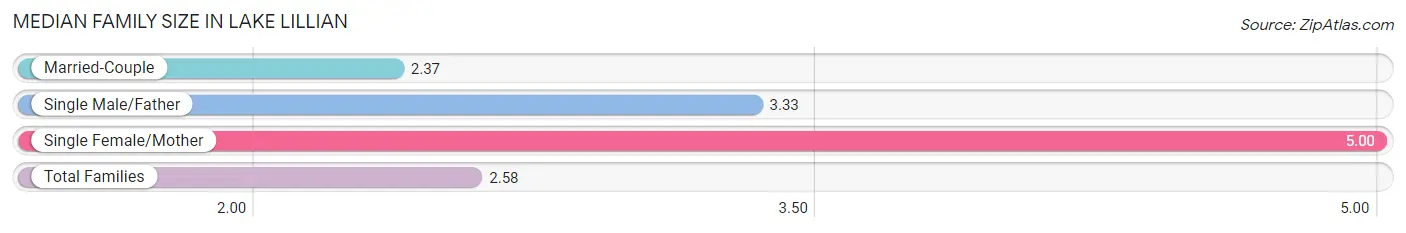
The median family size in Lake Lillian is 2.58 persons per family, with single female/mother families (2 | 5.0%) accounting for the largest median family size of 5 persons per family. On the other hand, married-couple families (35 | 87.5%) represent the smallest median family size with 2.37 persons per family.
| Family Type | # Families | Family Size |
| Married-Couple | 35 (87.5%) | 2.37 |
| Single Male/Father | 3 (7.5%) | 3.33 |
| Single Female/Mother | 2 (5.0%) | 5.00 |
| Total Families | 40 (100.0%) | 2.58 |
Median Household Size in Lake Lillian
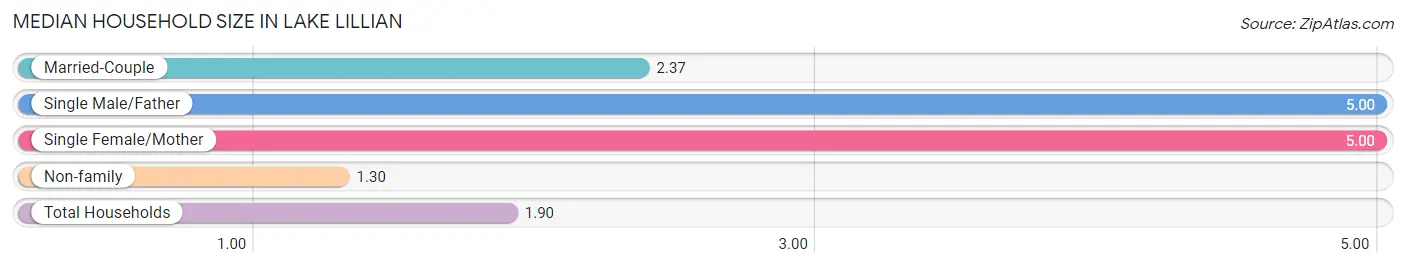
The median household size in Lake Lillian is 1.90 persons per household, with single male/father households (3 | 3.2%) accounting for the largest median household size of 5 persons per household. non-family households (53 | 57.0%) represent the smallest median household size with 1.30 persons per household.
| Household Type | # Households | Household Size |
| Married-Couple | 35 (37.6%) | 2.37 |
| Single Male/Father | 3 (3.2%) | 5.00 |
| Single Female/Mother | 2 (2.1%) | 5.00 |
| Non-family | 53 (57.0%) | 1.30 |
| Total Households | 93 (100.0%) | 1.90 |
Household Size by Marriage Status in Lake Lillian
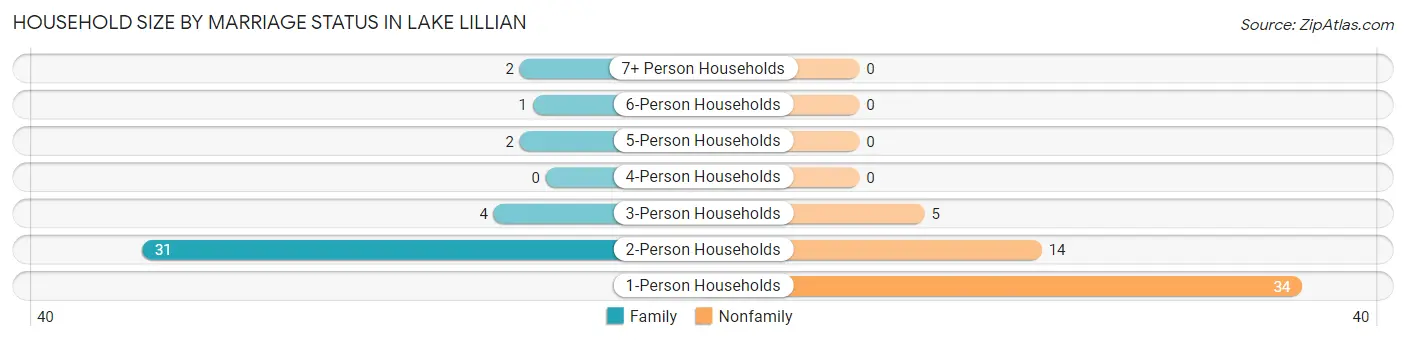
Out of a total of 93 households in Lake Lillian, 40 (43.0%) are family households, while 53 (57.0%) are nonfamily households. The most numerous type of family households are 2-person households, comprising 31, and the most common type of nonfamily households are 1-person households, comprising 34.
| Household Size | Family Households | Nonfamily Households |
| 1-Person Households | - | 34 (36.6%) |
| 2-Person Households | 31 (33.3%) | 14 (15.0%) |
| 3-Person Households | 4 (4.3%) | 5 (5.4%) |
| 4-Person Households | 0 (0.0%) | 0 (0.0%) |
| 5-Person Households | 2 (2.1%) | 0 (0.0%) |
| 6-Person Households | 1 (1.1%) | 0 (0.0%) |
| 7+ Person Households | 2 (2.1%) | 0 (0.0%) |
| Total | 40 (43.0%) | 53 (57.0%) |
Female Fertility in Lake Lillian
Fertility by Age in Lake Lillian
| Age Bracket | Women with Births | Births / 1,000 Women |
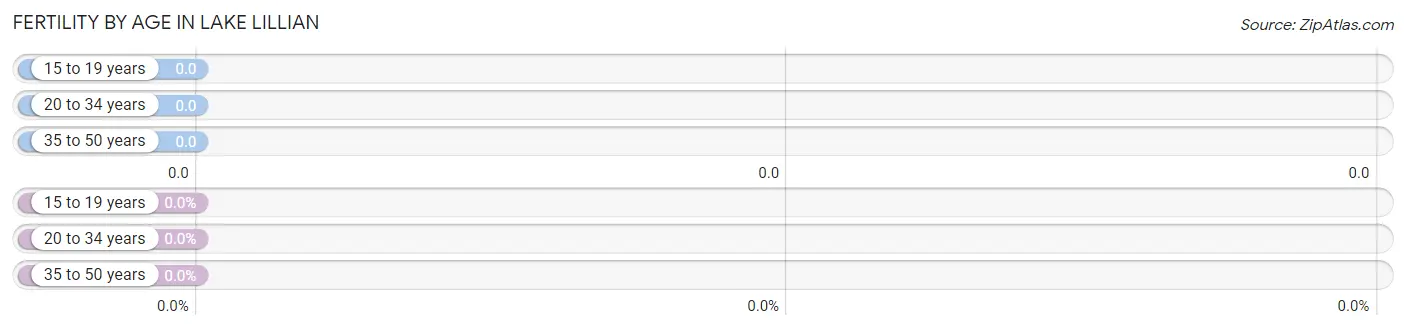
| 15 to 19 years | 0 (0.0%) | 0.0 |
| 20 to 34 years | 0 (0.0%) | 0.0 |
| 35 to 50 years | 0 (0.0%) | 0.0 |
| Total | 0 (0.0%) | 0.0 |
Fertility by Age by Marriage Status in Lake Lillian
| Age Bracket | Married | Unmarried |
| 15 to 19 years | 0 (0.0%) | 0 (0.0%) |
| 20 to 34 years | 0 (0.0%) | 0 (0.0%) |
| 35 to 50 years | 0 (0.0%) | 0 (0.0%) |
| Total | 0 (0.0%) | 0 (0.0%) |
Fertility by Education in Lake Lillian
| Educational Attainment | Women with Births | Births / 1,000 Women |
| Less than High School | 0 (0.0%) | 0.0 |
| High School Diploma | 0 (0.0%) | 0.0 |
| College or Associate's Degree | 0 (0.0%) | 0.0 |
| Bachelor's Degree | 0 (0.0%) | 0.0 |
| Graduate Degree | 0 (0.0%) | 0.0 |
| Total | 0 (0.0%) | 0.0 |
Fertility by Education by Marriage Status in Lake Lillian
| Educational Attainment | Married | Unmarried |
| Less than High School | 0 (0.0%) | 0 (0.0%) |
| High School Diploma | 0 (0.0%) | 0 (0.0%) |
| College or Associate's Degree | 0 (0.0%) | 0 (0.0%) |
| Bachelor's Degree | 0 (0.0%) | 0 (0.0%) |
| Graduate Degree | 0 (0.0%) | 0 (0.0%) |
| Total | 0 (0.0%) | 0 (0.0%) |
Income in Lake Lillian
Income Overview in Lake Lillian
Per Capita Income in Lake Lillian is $33,450, while median incomes of families and households are $66,250 and $61,250 respectively.
| Characteristic | Number | Measure |
| Per Capita Income | 201 | $33,450 |
| Median Family Income | 40 | $66,250 |
| Mean Family Income | 40 | $77,698 |
| Median Household Income | 93 | $61,250 |
| Mean Household Income | 93 | $74,530 |
| Income Deficit | 40 | $0 |
| Wage / Income Gap (%) | 201 | 5.26% |
| Wage / Income Gap ($) | 201 | 94.74¢ per $1 |
| Gini / Inequality Index | 201 | 0.40 |
Earnings by Sex in Lake Lillian
Average Earnings in Lake Lillian are $33,750, $32,500 for men and $34,306 for women, a difference of 5.3%.
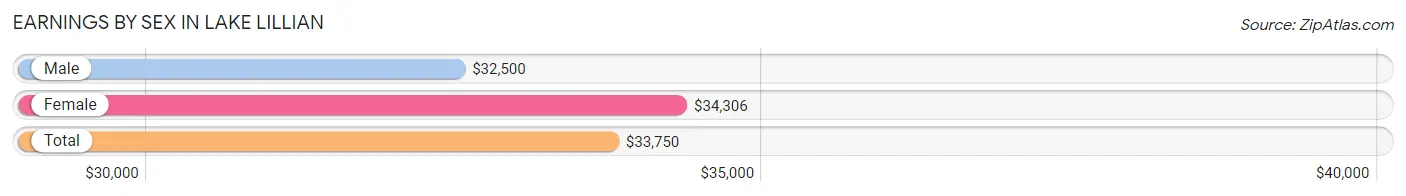
| Sex | Number | Average Earnings |
| Male | 68 (60.2%) | $32,500 |
| Female | 45 (39.8%) | $34,306 |
| Total | 113 (100.0%) | $33,750 |
Earnings by Sex by Income Bracket in Lake Lillian
The most common earnings brackets in Lake Lillian are $75,000 to $99,999 for men (10 | 14.7%) and $30,000 to $34,999 for women (9 | 20.0%).
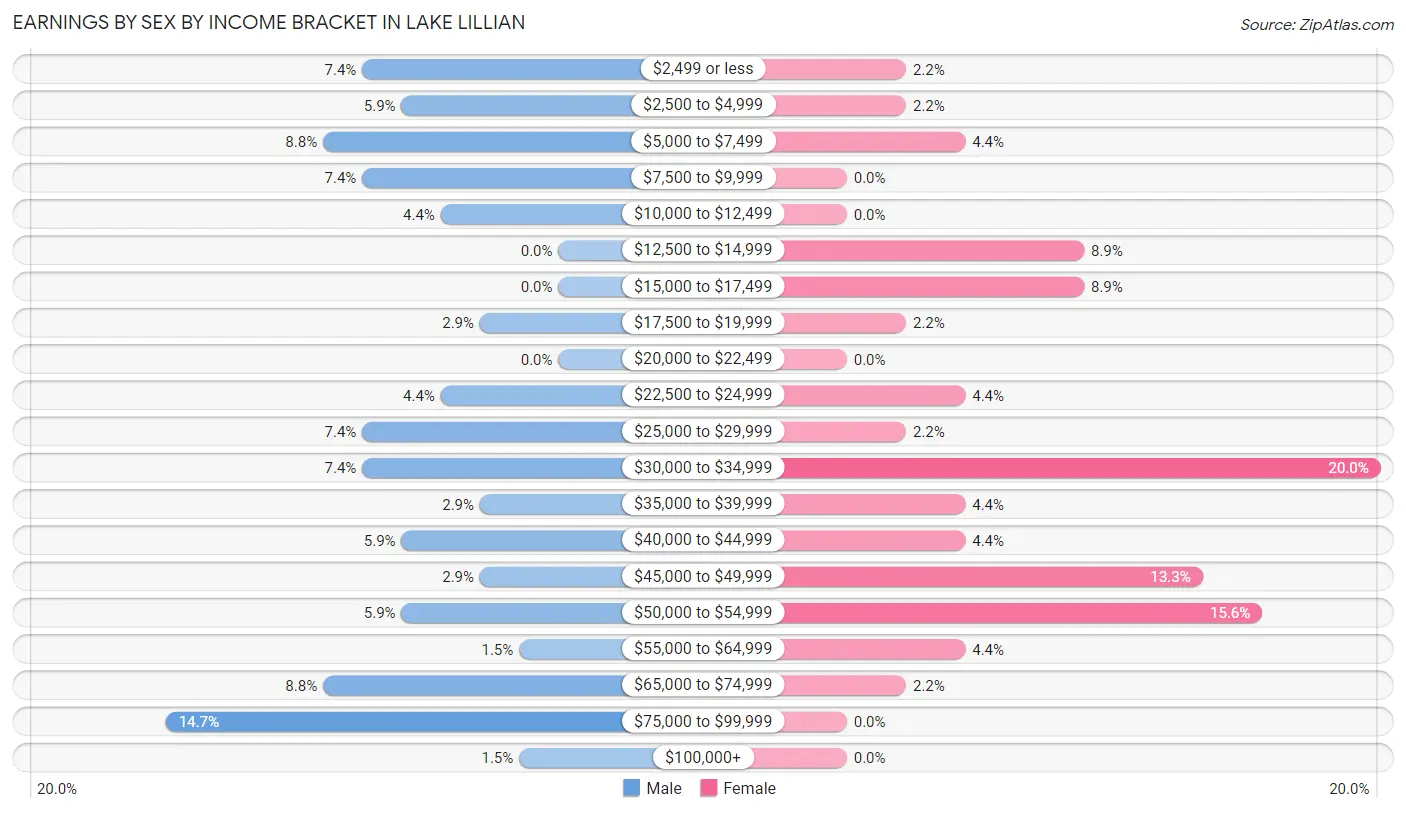
| Income | Male | Female |
| $2,499 or less | 5 (7.3%) | 1 (2.2%) |
| $2,500 to $4,999 | 4 (5.9%) | 1 (2.2%) |
| $5,000 to $7,499 | 6 (8.8%) | 2 (4.4%) |
| $7,500 to $9,999 | 5 (7.3%) | 0 (0.0%) |
| $10,000 to $12,499 | 3 (4.4%) | 0 (0.0%) |
| $12,500 to $14,999 | 0 (0.0%) | 4 (8.9%) |
| $15,000 to $17,499 | 0 (0.0%) | 4 (8.9%) |
| $17,500 to $19,999 | 2 (2.9%) | 1 (2.2%) |
| $20,000 to $22,499 | 0 (0.0%) | 0 (0.0%) |
| $22,500 to $24,999 | 3 (4.4%) | 2 (4.4%) |
| $25,000 to $29,999 | 5 (7.3%) | 1 (2.2%) |
| $30,000 to $34,999 | 5 (7.3%) | 9 (20.0%) |
| $35,000 to $39,999 | 2 (2.9%) | 2 (4.4%) |
| $40,000 to $44,999 | 4 (5.9%) | 2 (4.4%) |
| $45,000 to $49,999 | 2 (2.9%) | 6 (13.3%) |
| $50,000 to $54,999 | 4 (5.9%) | 7 (15.6%) |
| $55,000 to $64,999 | 1 (1.5%) | 2 (4.4%) |
| $65,000 to $74,999 | 6 (8.8%) | 1 (2.2%) |
| $75,000 to $99,999 | 10 (14.7%) | 0 (0.0%) |
| $100,000+ | 1 (1.5%) | 0 (0.0%) |
| Total | 68 (100.0%) | 45 (100.0%) |
Earnings by Sex by Educational Attainment in Lake Lillian
Average earnings in Lake Lillian are $40,938 for men and $34,167 for women, a difference of 16.5%. Men with an educational attainment of college or associate's degree enjoy the highest average annual earnings of $51,250, while those with high school diploma education earn the least with $33,750. Women with an educational attainment of bachelor's degree earn the most with the average annual earnings of $45,625, while those with high school diploma education have the smallest earnings of $20,000.
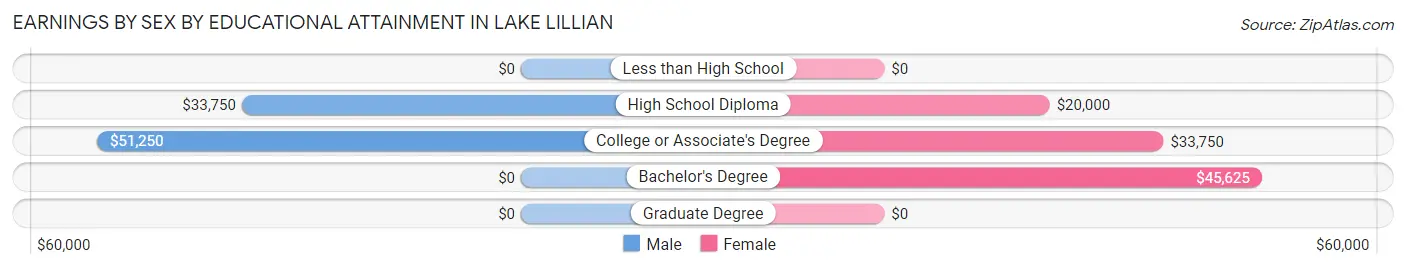
| Educational Attainment | Male Income | Female Income |
| Less than High School | - | - |
| High School Diploma | $33,750 | $20,000 |
| College or Associate's Degree | $51,250 | $33,750 |
| Bachelor's Degree | - | - |
| Graduate Degree | - | - |
| Total | $40,938 | $34,167 |
Family Income in Lake Lillian
Family Income Brackets in Lake Lillian
According to the Lake Lillian family income data, there are 15 families falling into the $50,000 to $74,999 income range, which is the most common income bracket and makes up 37.5% of all families.
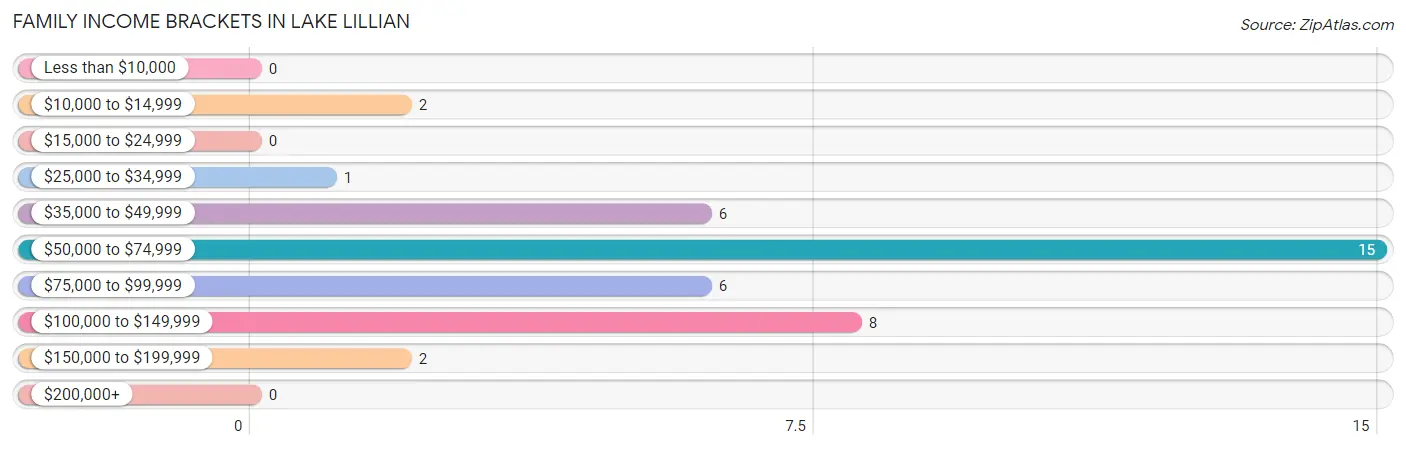
| Income Bracket | # Families | % Families |
| Less than $10,000 | 0 | 0.0% |
| $10,000 to $14,999 | 2 | 5.0% |
| $15,000 to $24,999 | 0 | 0.0% |
| $25,000 to $34,999 | 1 | 2.5% |
| $35,000 to $49,999 | 6 | 15.0% |
| $50,000 to $74,999 | 15 | 37.5% |
| $75,000 to $99,999 | 6 | 15.0% |
| $100,000 to $149,999 | 8 | 20.0% |
| $150,000 to $199,999 | 2 | 5.0% |
| $200,000+ | 0 | 0.0% |
Family Income by Famaliy Size in Lake Lillian
2-person families (31 | 77.5%) account for the highest median family income in Lake Lillian with $65,625 per family, while 2-person families (31 | 77.5%) have the highest median income of $32,812 per family member.
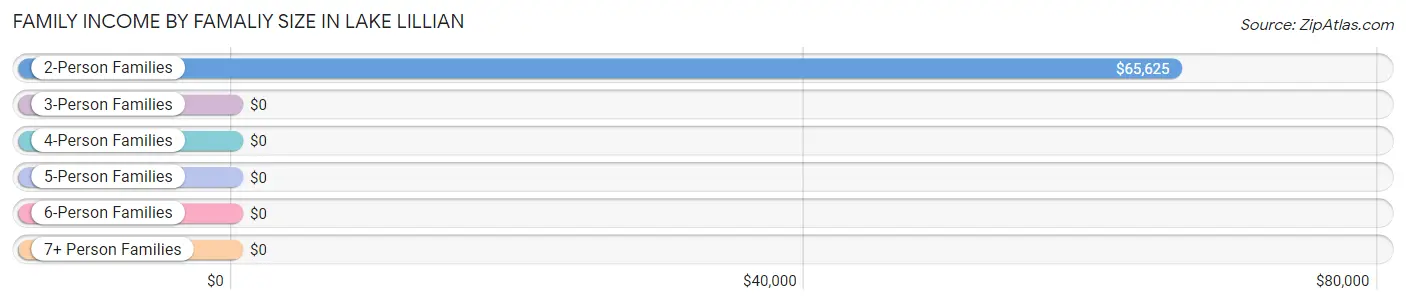
| Income Bracket | # Families | Median Income |
| 2-Person Families | 31 (77.5%) | $65,625 |
| 3-Person Families | 4 (10.0%) | $0 |
| 4-Person Families | 2 (5.0%) | $0 |
| 5-Person Families | 2 (5.0%) | $0 |
| 6-Person Families | 1 (2.5%) | $0 |
| 7+ Person Families | 0 (0.0%) | $0 |
| Total | 40 (100.0%) | $66,250 |
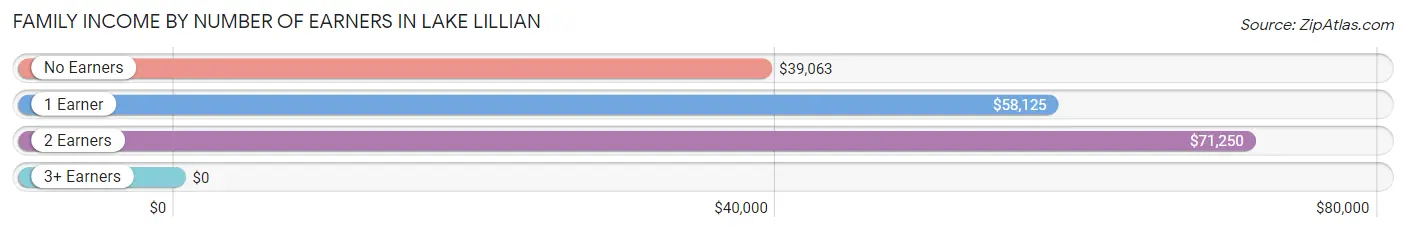
Family Income by Number of Earners in Lake Lillian
| Number of Earners | # Families | Median Income |
| No Earners | 7 (17.5%) | $39,063 |
| 1 Earner | 7 (17.5%) | $58,125 |
| 2 Earners | 23 (57.5%) | $71,250 |
| 3+ Earners | 3 (7.5%) | $0 |
| Total | 40 (100.0%) | $66,250 |
Household Income in Lake Lillian
Household Income Brackets in Lake Lillian
With 20 households falling in the category, the $50,000 to $74,999 income range is the most frequent in Lake Lillian, accounting for 21.5% of all households. In contrast, only 1 households (1.1%) fall into the $200,000+ income bracket, making it the least populous group.
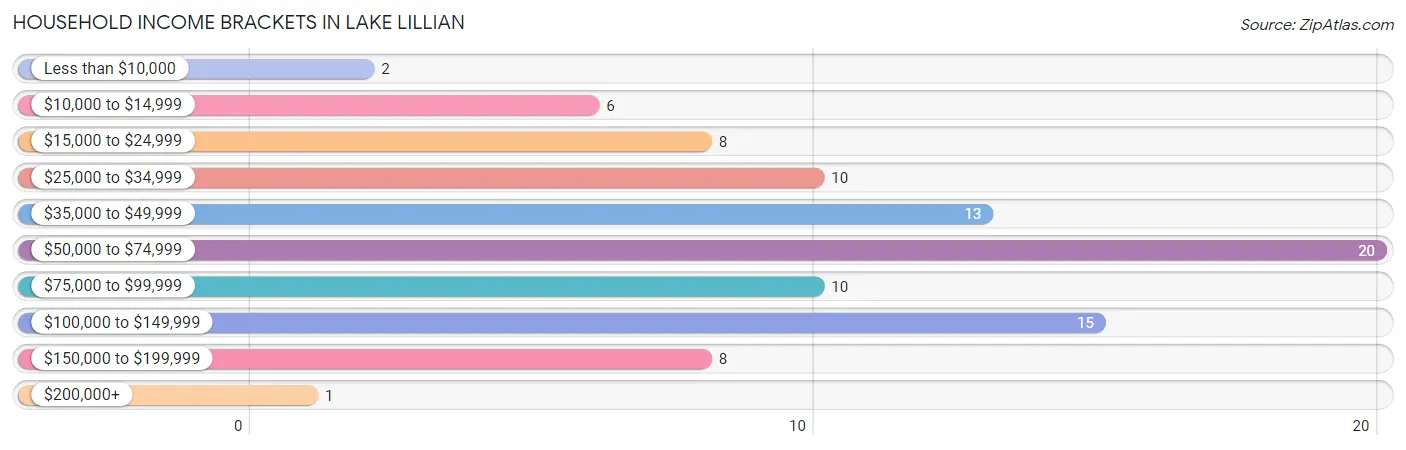
| Income Bracket | # Households | % Households |
| Less than $10,000 | 2 | 2.2% |
| $10,000 to $14,999 | 6 | 6.5% |
| $15,000 to $24,999 | 8 | 8.6% |
| $25,000 to $34,999 | 10 | 10.8% |
| $35,000 to $49,999 | 13 | 14.0% |
| $50,000 to $74,999 | 20 | 21.5% |
| $75,000 to $99,999 | 10 | 10.8% |
| $100,000 to $149,999 | 15 | 16.1% |
| $150,000 to $199,999 | 8 | 8.6% |
| $200,000+ | 1 | 1.1% |
Household Income by Householder Age in Lake Lillian
The median household income in Lake Lillian is $61,250, with the highest median household income of $105,625 found in the 25 to 44 years age bracket for the primary householder. A total of 23 households (24.7%) fall into this category. Meanwhile, the 15 to 24 years age bracket for the primary householder has the lowest median household income of $0, with 10 households (10.7%) in this group.
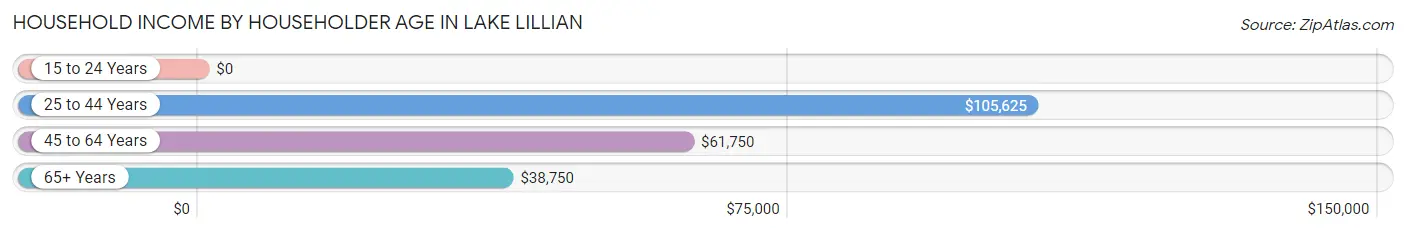
| Income Bracket | # Households | Median Income |
| 15 to 24 Years | 10 (10.7%) | $0 |
| 25 to 44 Years | 23 (24.7%) | $105,625 |
| 45 to 64 Years | 29 (31.2%) | $61,750 |
| 65+ Years | 31 (33.3%) | $38,750 |
| Total | 93 (100.0%) | $61,250 |
Poverty in Lake Lillian
Income Below Poverty by Sex and Age in Lake Lillian
With 16.5% poverty level for males and 10.9% for females among the residents of Lake Lillian, 5 year old males and 18 to 24 year old females are the most vulnerable to poverty, with 1 males (100.0%) and 2 females (40.0%) in their respective age groups living below the poverty level.
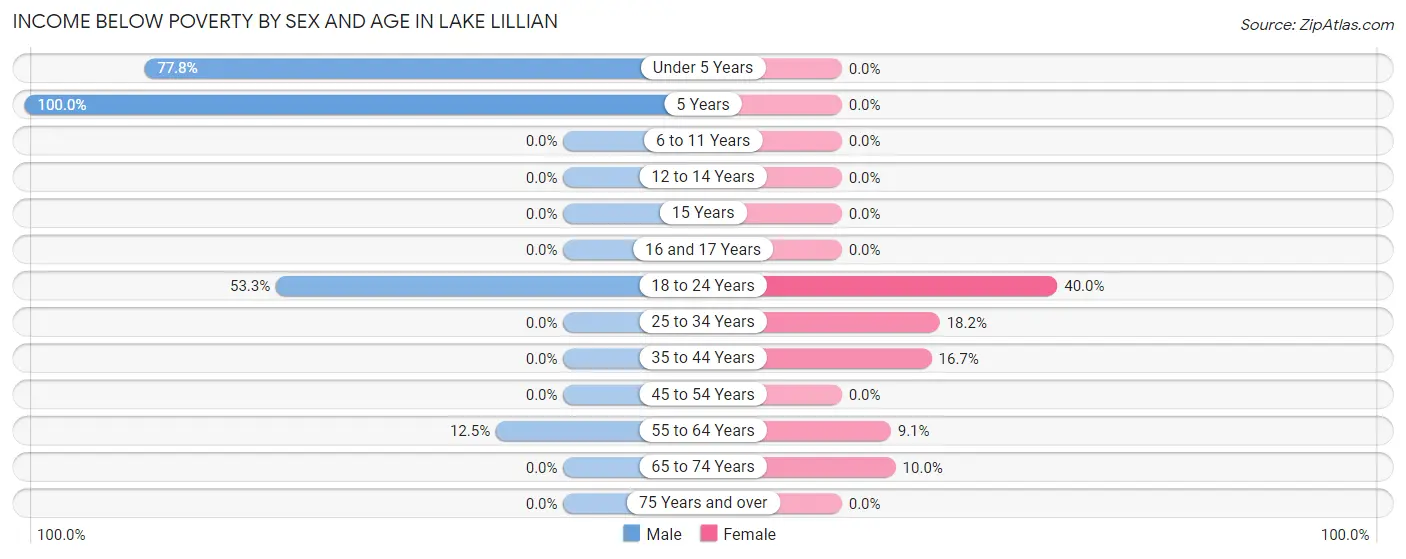
| Age Bracket | Male | Female |
| Under 5 Years | 7 (77.8%) | 0 (0.0%) |
| 5 Years | 1 (100.0%) | 0 (0.0%) |
| 6 to 11 Years | 0 (0.0%) | 0 (0.0%) |
| 12 to 14 Years | 0 (0.0%) | 0 (0.0%) |
| 15 Years | 0 (0.0%) | 0 (0.0%) |
| 16 and 17 Years | 0 (0.0%) | 0 (0.0%) |
| 18 to 24 Years | 8 (53.3%) | 2 (40.0%) |
| 25 to 34 Years | 0 (0.0%) | 2 (18.2%) |
| 35 to 44 Years | 0 (0.0%) | 1 (16.7%) |
| 45 to 54 Years | 0 (0.0%) | 0 (0.0%) |
| 55 to 64 Years | 2 (12.5%) | 1 (9.1%) |
| 65 to 74 Years | 0 (0.0%) | 1 (10.0%) |
| 75 Years and over | 0 (0.0%) | 0 (0.0%) |
| Total | 18 (16.5%) | 7 (10.9%) |
Income Above Poverty by Sex and Age in Lake Lillian
According to the poverty statistics in Lake Lillian, males aged 6 to 11 years and females aged 6 to 11 years are the age groups that are most secure financially, with 100.0% of males and 100.0% of females in these age groups living above the poverty line.
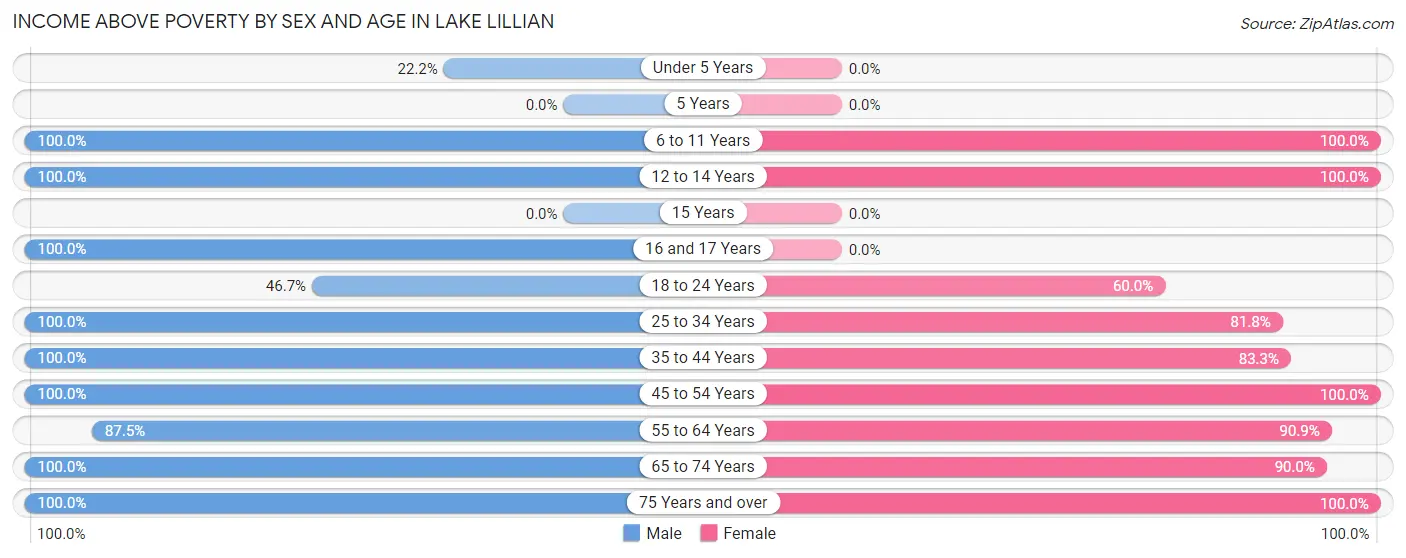
| Age Bracket | Male | Female |
| Under 5 Years | 2 (22.2%) | 0 (0.0%) |
| 5 Years | 0 (0.0%) | 0 (0.0%) |
| 6 to 11 Years | 3 (100.0%) | 2 (100.0%) |
| 12 to 14 Years | 4 (100.0%) | 2 (100.0%) |
| 15 Years | 0 (0.0%) | 0 (0.0%) |
| 16 and 17 Years | 2 (100.0%) | 0 (0.0%) |
| 18 to 24 Years | 7 (46.7%) | 3 (60.0%) |
| 25 to 34 Years | 15 (100.0%) | 9 (81.8%) |
| 35 to 44 Years | 6 (100.0%) | 5 (83.3%) |
| 45 to 54 Years | 11 (100.0%) | 9 (100.0%) |
| 55 to 64 Years | 14 (87.5%) | 10 (90.9%) |
| 65 to 74 Years | 12 (100.0%) | 9 (90.0%) |
| 75 Years and over | 15 (100.0%) | 8 (100.0%) |
| Total | 91 (83.5%) | 57 (89.1%) |
Income Below Poverty Among Married-Couple Families in Lake Lillian
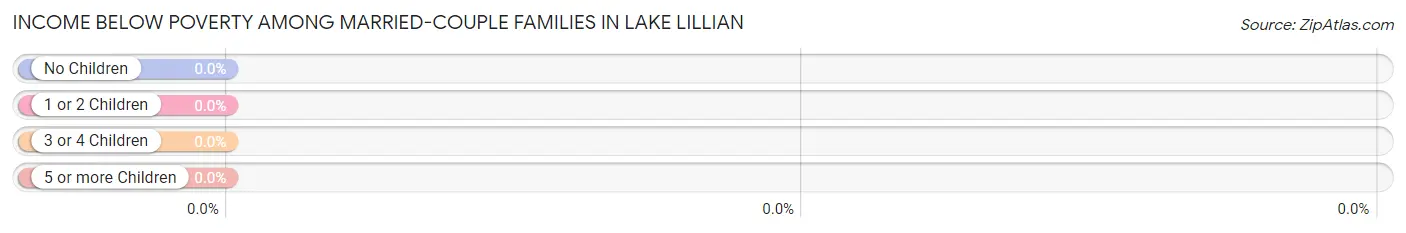
| Children | Above Poverty | Below Poverty |
| No Children | 32 (100.0%) | 0 (0.0%) |
| 1 or 2 Children | 2 (100.0%) | 0 (0.0%) |
| 3 or 4 Children | 1 (100.0%) | 0 (0.0%) |
| 5 or more Children | 0 (0.0%) | 0 (0.0%) |
| Total | 35 (100.0%) | 0 (0.0%) |
Income Below Poverty Among Single-Parent Households in Lake Lillian
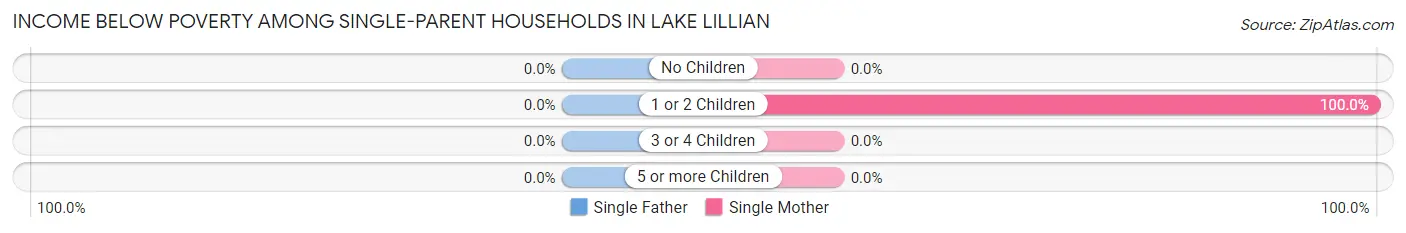
| Children | Single Father | Single Mother |
| No Children | 0 (0.0%) | 0 (0.0%) |
| 1 or 2 Children | 0 (0.0%) | 2 (100.0%) |
| 3 or 4 Children | 0 (0.0%) | 0 (0.0%) |
| 5 or more Children | 0 (0.0%) | 0 (0.0%) |
| Total | 0 (0.0%) | 2 (100.0%) |
Income Below Poverty Among Married-Couple vs Single-Parent Households in Lake Lillian
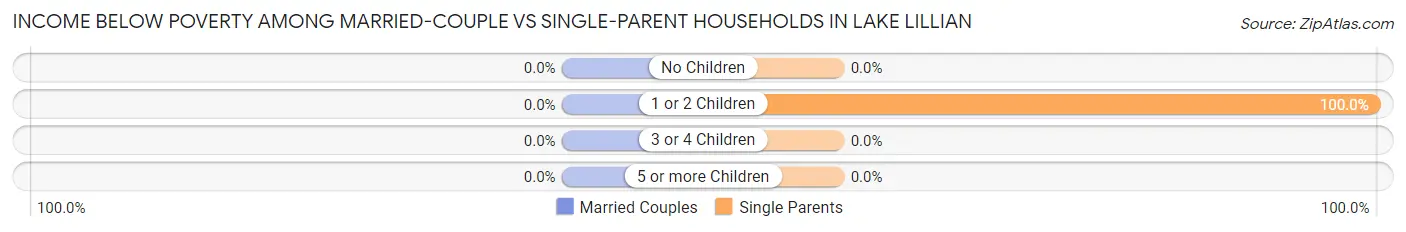
| Children | Married-Couple Families | Single-Parent Households |
| No Children | 0 (0.0%) | 0 (0.0%) |
| 1 or 2 Children | 0 (0.0%) | 2 (100.0%) |
| 3 or 4 Children | 0 (0.0%) | 0 (0.0%) |
| 5 or more Children | 0 (0.0%) | 0 (0.0%) |
| Total | 0 (0.0%) | 2 (40.0%) |
Employment Characteristics in Lake Lillian
Employment by Class of Employer in Lake Lillian
Among the 101 employed individuals in Lake Lillian, private company employees (72 | 71.3%), self-employed (incorporated) (9 | 8.9%), and local government employees (9 | 8.9%) make up the most common classes of employment.
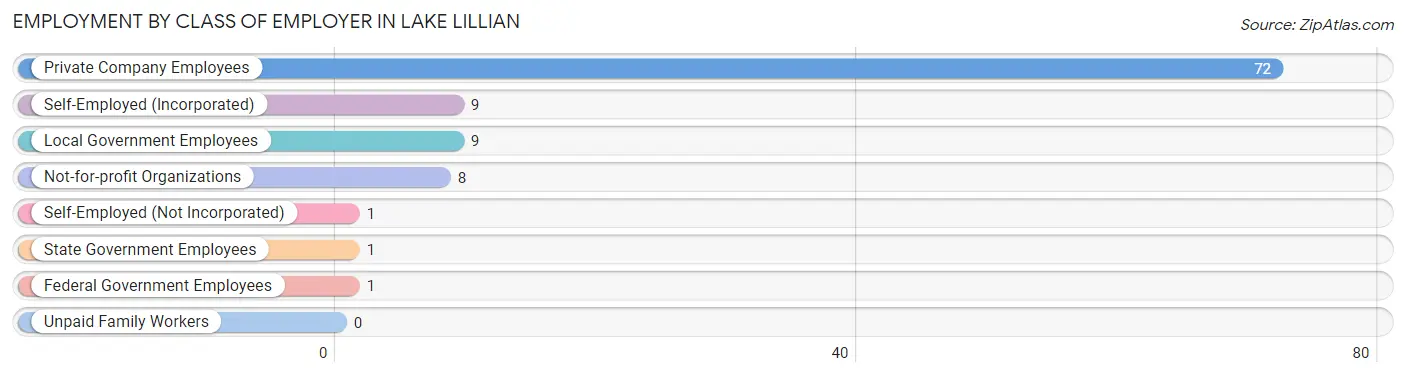
| Employer Class | # Employees | % Employees |
| Private Company Employees | 72 | 71.3% |
| Self-Employed (Incorporated) | 9 | 8.9% |
| Self-Employed (Not Incorporated) | 1 | 1.0% |
| Not-for-profit Organizations | 8 | 7.9% |
| Local Government Employees | 9 | 8.9% |
| State Government Employees | 1 | 1.0% |
| Federal Government Employees | 1 | 1.0% |
| Unpaid Family Workers | 0 | 0.0% |
| Total | 101 | 100.0% |
Employment Status by Age in Lake Lillian
According to the labor force statistics for Lake Lillian, out of the total population over 16 years of age (176), 60.8% or 107 individuals are in the labor force, with 5.6% or 6 of them unemployed. The age group with the highest labor force participation rate is 20 to 24 years, with 100.0% or 16 individuals in the labor force. Within the labor force, the 35 to 44 years age range has the highest percentage of unemployed individuals, with 16.7% or 2 of them being unemployed.
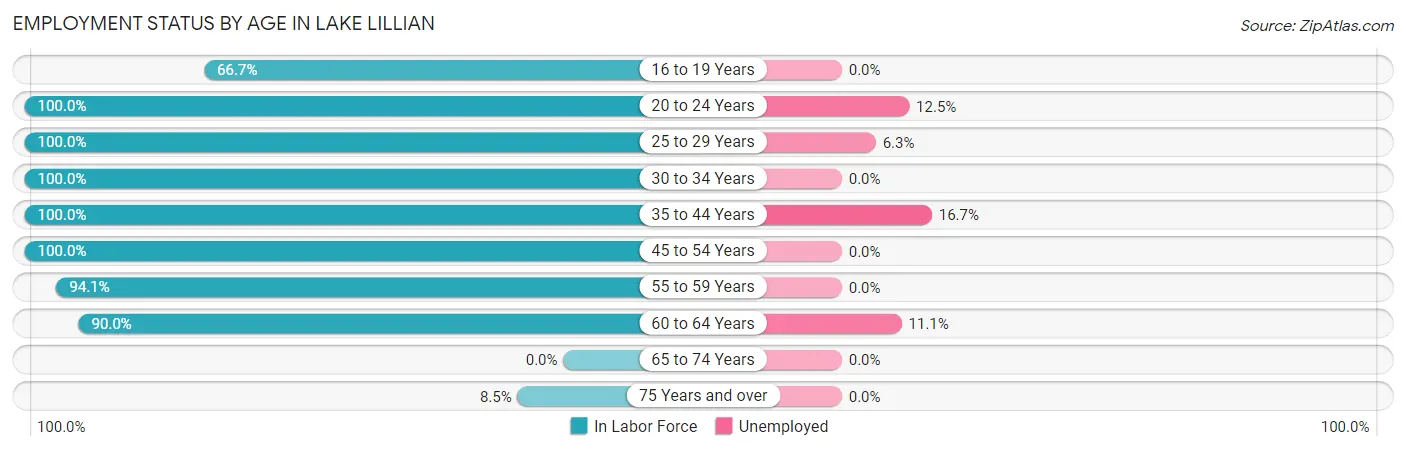
| Age Bracket | In Labor Force | Unemployed |
| 16 to 19 Years | 4 (66.7%) | 0 (0.0%) |
| 20 to 24 Years | 16 (100.0%) | 2 (12.5%) |
| 25 to 29 Years | 16 (100.0%) | 1 (6.3%) |
| 30 to 34 Years | 10 (100.0%) | 0 (0.0%) |
| 35 to 44 Years | 12 (100.0%) | 2 (16.7%) |
| 45 to 54 Years | 20 (100.0%) | 0 (0.0%) |
| 55 to 59 Years | 16 (94.1%) | 0 (0.0%) |
| 60 to 64 Years | 9 (90.0%) | 1 (11.1%) |
| 65 to 74 Years | 0 (0.0%) | 0 (0.0%) |
| 75 Years and over | 4 (8.5%) | 0 (0.0%) |
| Total | 107 (60.8%) | 6 (5.6%) |
Employment Status by Educational Attainment in Lake Lillian
According to labor force statistics for Lake Lillian, 97.6% of individuals (83) out of the total population between 25 and 64 years of age (85) are in the labor force, with 4.8% or 4 of them being unemployed. The group with the highest labor force participation rate are those with the educational attainment of less than high school, with 100.0% or 1 individuals in the labor force. Within the labor force, individuals with high school diploma education have the highest percentage of unemployment, with 9.7% or 3 of them being unemployed.
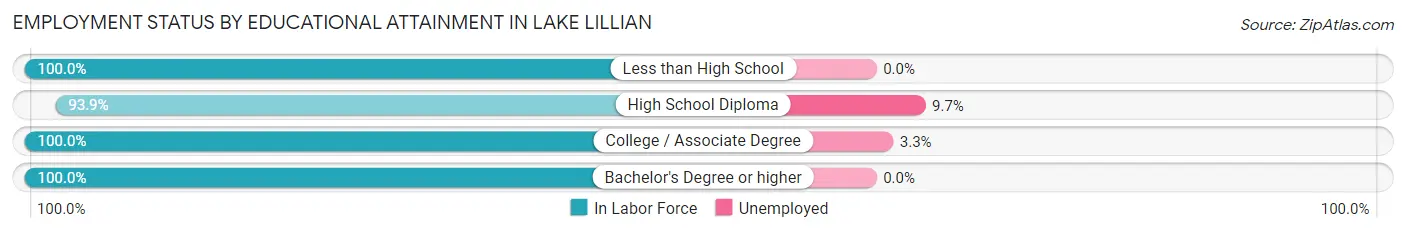
| Educational Attainment | In Labor Force | Unemployed |
| Less than High School | 1 (100.0%) | 0 (0.0%) |
| High School Diploma | 31 (93.9%) | 3 (9.7%) |
| College / Associate Degree | 30 (100.0%) | 1 (3.3%) |
| Bachelor's Degree or higher | 21 (100.0%) | 0 (0.0%) |
| Total | 83 (97.6%) | 4 (4.8%) |
Employment Occupations by Sex in Lake Lillian
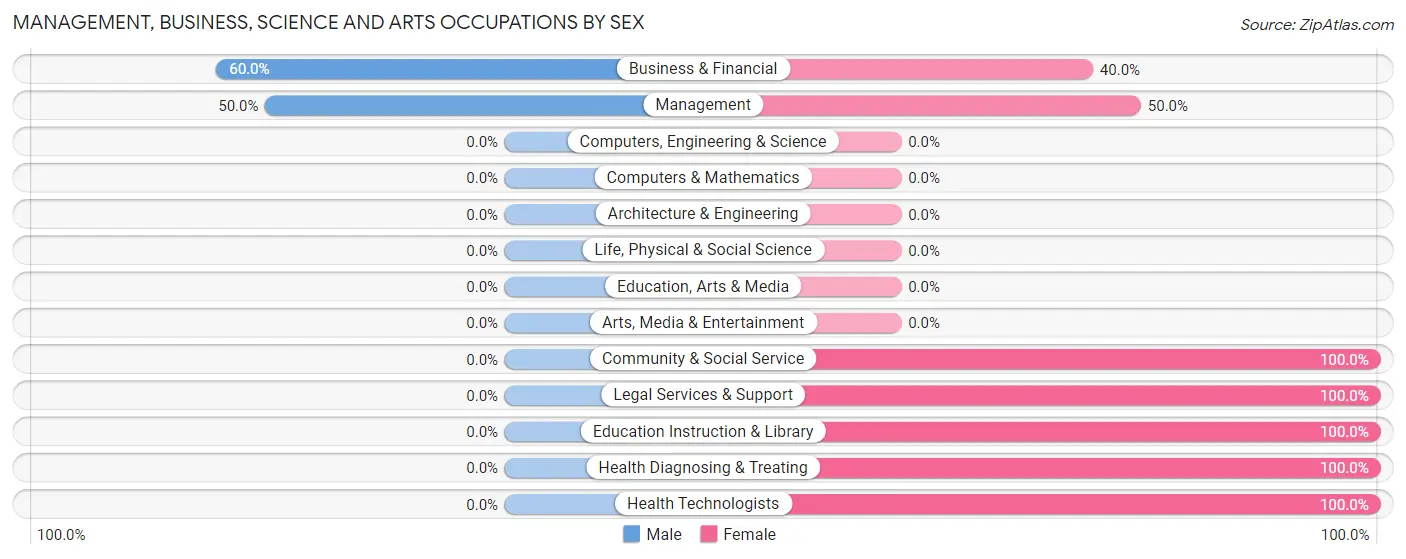
Management, Business, Science and Arts Occupations
The most common Management, Business, Science and Arts occupations in Lake Lillian are Management (10 | 9.9%), Community & Social Service (8 | 7.9%), Education Instruction & Library (7 | 6.9%), Business & Financial (5 | 5.0%), and Health Diagnosing & Treating (2 | 2.0%).
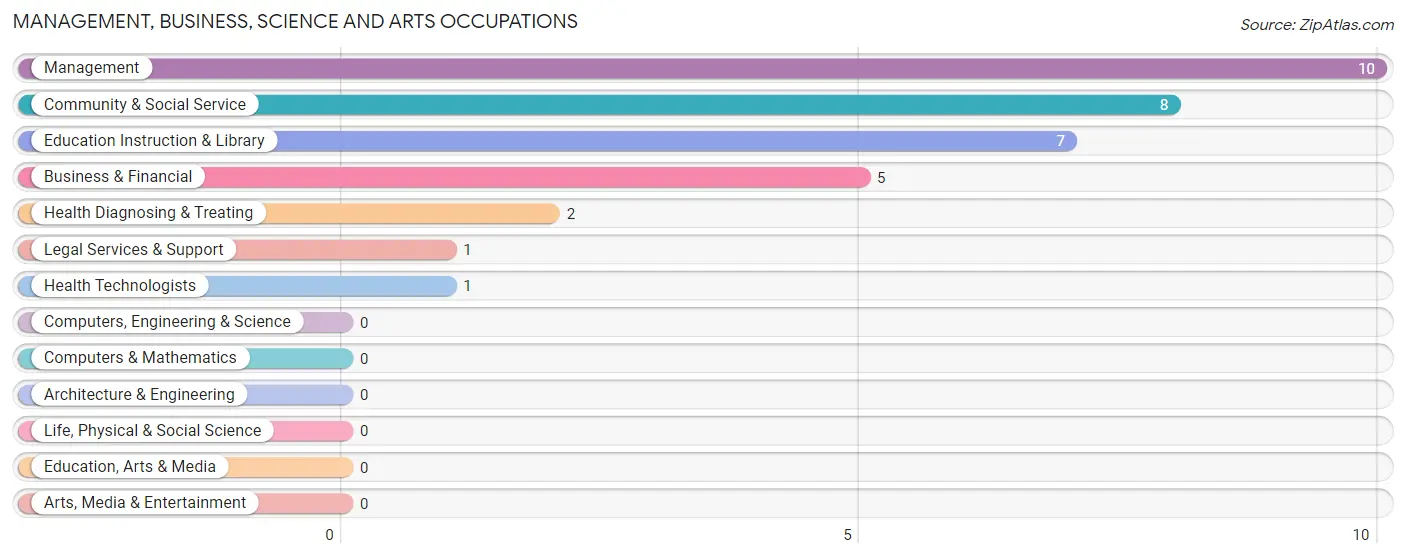
Management, Business, Science and Arts Occupations by Sex
Within the Management, Business, Science and Arts occupations in Lake Lillian, the most male-oriented occupations are Business & Financial (60.0%), and Management (50.0%), while the most female-oriented occupations are Community & Social Service (100.0%), Legal Services & Support (100.0%), and Education Instruction & Library (100.0%).
| Occupation | Male | Female |
| Management | 5 (50.0%) | 5 (50.0%) |
| Business & Financial | 3 (60.0%) | 2 (40.0%) |
| Computers, Engineering & Science | 0 (0.0%) | 0 (0.0%) |
| Computers & Mathematics | 0 (0.0%) | 0 (0.0%) |
| Architecture & Engineering | 0 (0.0%) | 0 (0.0%) |
| Life, Physical & Social Science | 0 (0.0%) | 0 (0.0%) |
| Community & Social Service | 0 (0.0%) | 8 (100.0%) |
| Education, Arts & Media | 0 (0.0%) | 0 (0.0%) |
| Legal Services & Support | 0 (0.0%) | 1 (100.0%) |
| Education Instruction & Library | 0 (0.0%) | 7 (100.0%) |
| Arts, Media & Entertainment | 0 (0.0%) | 0 (0.0%) |
| Health Diagnosing & Treating | 0 (0.0%) | 2 (100.0%) |
| Health Technologists | 0 (0.0%) | 1 (100.0%) |
| Total (Category) | 8 (32.0%) | 17 (68.0%) |
| Total (Overall) | 59 (58.4%) | 42 (41.6%) |
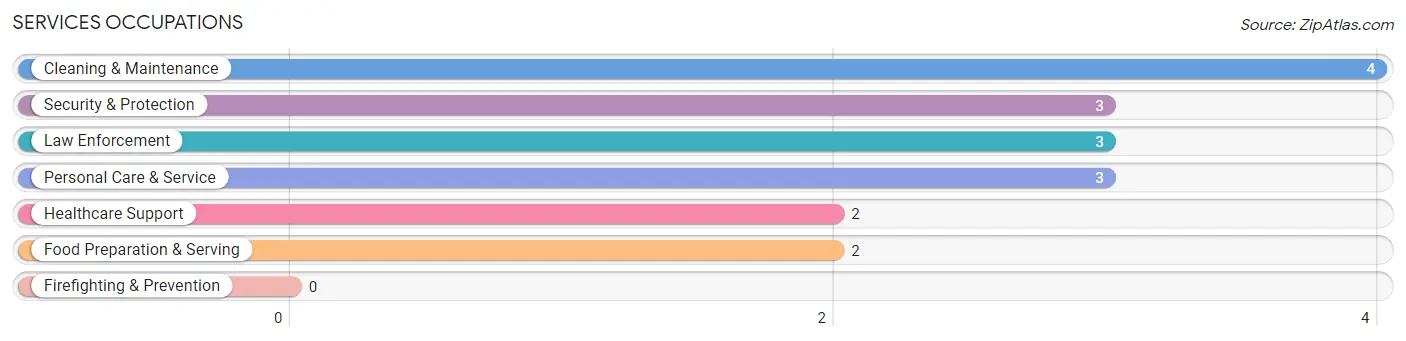
Services Occupations
The most common Services occupations in Lake Lillian are Cleaning & Maintenance (4 | 4.0%), Security & Protection (3 | 3.0%), Law Enforcement (3 | 3.0%), Personal Care & Service (3 | 3.0%), and Healthcare Support (2 | 2.0%).
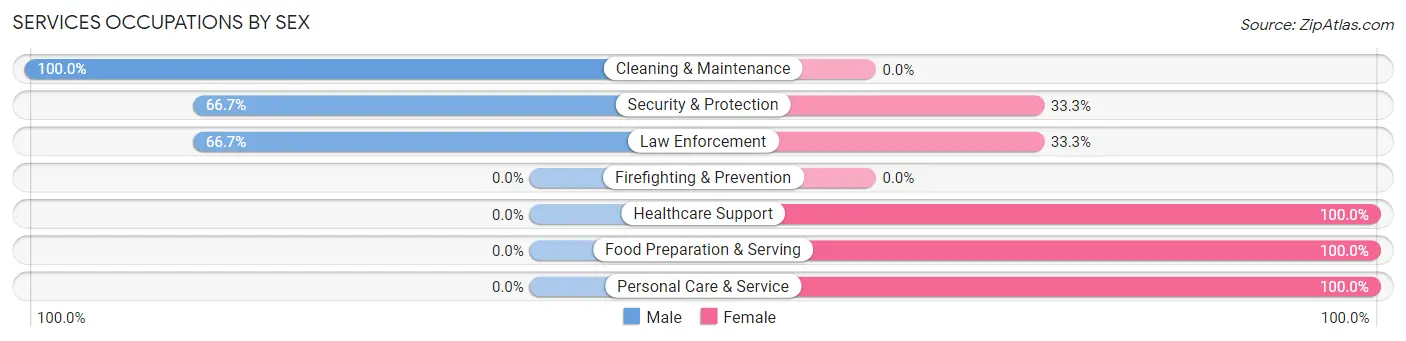
Services Occupations by Sex
Within the Services occupations in Lake Lillian, the most male-oriented occupations are Cleaning & Maintenance (100.0%), Security & Protection (66.7%), and Law Enforcement (66.7%), while the most female-oriented occupations are Healthcare Support (100.0%), Food Preparation & Serving (100.0%), and Personal Care & Service (100.0%).
| Occupation | Male | Female |
| Healthcare Support | 0 (0.0%) | 2 (100.0%) |
| Security & Protection | 2 (66.7%) | 1 (33.3%) |
| Firefighting & Prevention | 0 (0.0%) | 0 (0.0%) |
| Law Enforcement | 2 (66.7%) | 1 (33.3%) |
| Food Preparation & Serving | 0 (0.0%) | 2 (100.0%) |
| Cleaning & Maintenance | 4 (100.0%) | 0 (0.0%) |
| Personal Care & Service | 0 (0.0%) | 3 (100.0%) |
| Total (Category) | 6 (42.9%) | 8 (57.1%) |
| Total (Overall) | 59 (58.4%) | 42 (41.6%) |
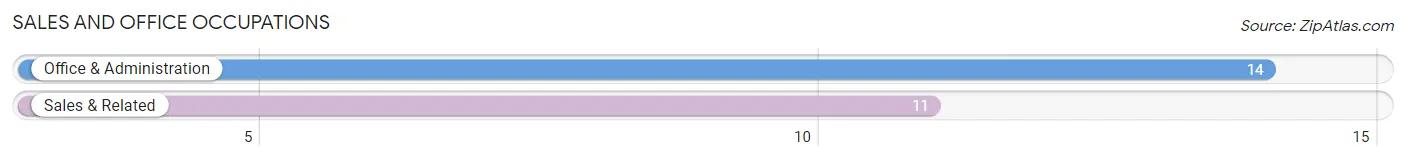
Sales and Office Occupations
The most common Sales and Office occupations in Lake Lillian are Office & Administration (14 | 13.9%), and Sales & Related (11 | 10.9%).
Sales and Office Occupations by Sex
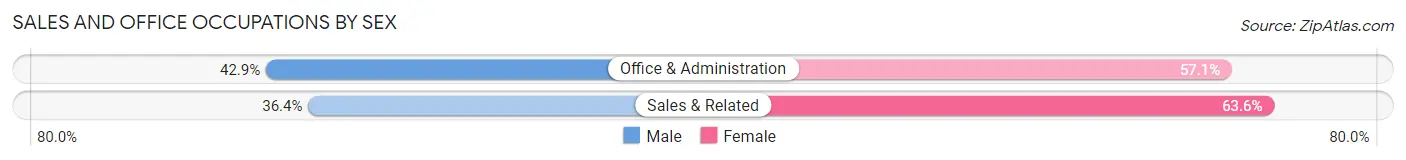
| Occupation | Male | Female |
| Sales & Related | 4 (36.4%) | 7 (63.6%) |
| Office & Administration | 6 (42.9%) | 8 (57.1%) |
| Total (Category) | 10 (40.0%) | 15 (60.0%) |
| Total (Overall) | 59 (58.4%) | 42 (41.6%) |
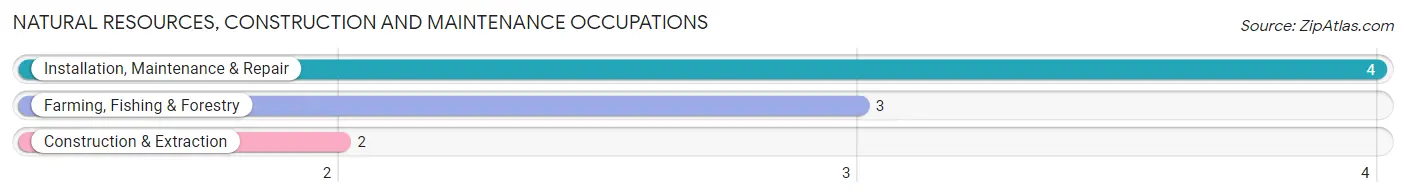
Natural Resources, Construction and Maintenance Occupations
The most common Natural Resources, Construction and Maintenance occupations in Lake Lillian are Installation, Maintenance & Repair (4 | 4.0%), Farming, Fishing & Forestry (3 | 3.0%), and Construction & Extraction (2 | 2.0%).
Natural Resources, Construction and Maintenance Occupations by Sex
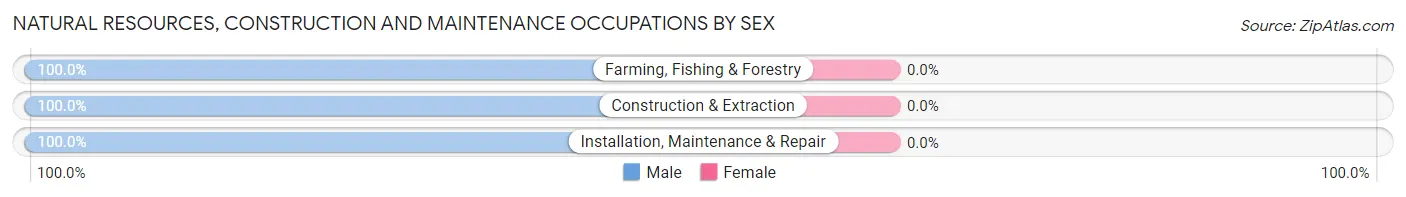
| Occupation | Male | Female |
| Farming, Fishing & Forestry | 3 (100.0%) | 0 (0.0%) |
| Construction & Extraction | 2 (100.0%) | 0 (0.0%) |
| Installation, Maintenance & Repair | 4 (100.0%) | 0 (0.0%) |
| Total (Category) | 9 (100.0%) | 0 (0.0%) |
| Total (Overall) | 59 (58.4%) | 42 (41.6%) |
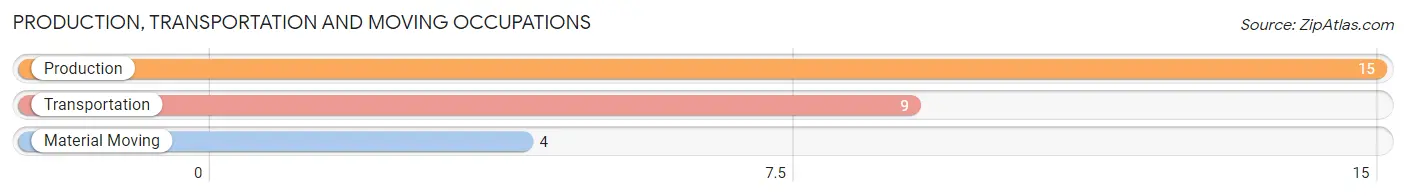
Production, Transportation and Moving Occupations
The most common Production, Transportation and Moving occupations in Lake Lillian are Production (15 | 14.8%), Transportation (9 | 8.9%), and Material Moving (4 | 4.0%).
Production, Transportation and Moving Occupations by Sex
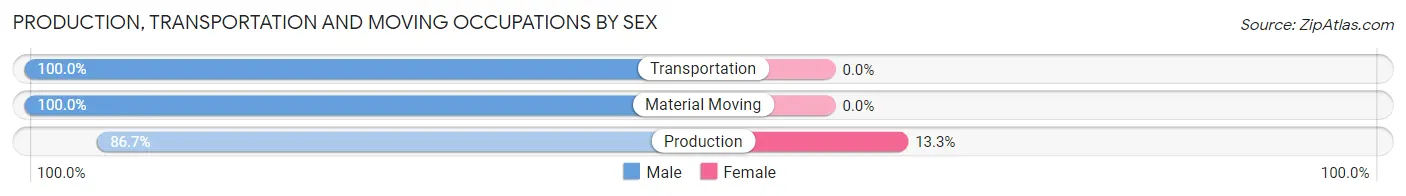
| Occupation | Male | Female |
| Production | 13 (86.7%) | 2 (13.3%) |
| Transportation | 9 (100.0%) | 0 (0.0%) |
| Material Moving | 4 (100.0%) | 0 (0.0%) |
| Total (Category) | 26 (92.9%) | 2 (7.1%) |
| Total (Overall) | 59 (58.4%) | 42 (41.6%) |
Employment Industries by Sex in Lake Lillian
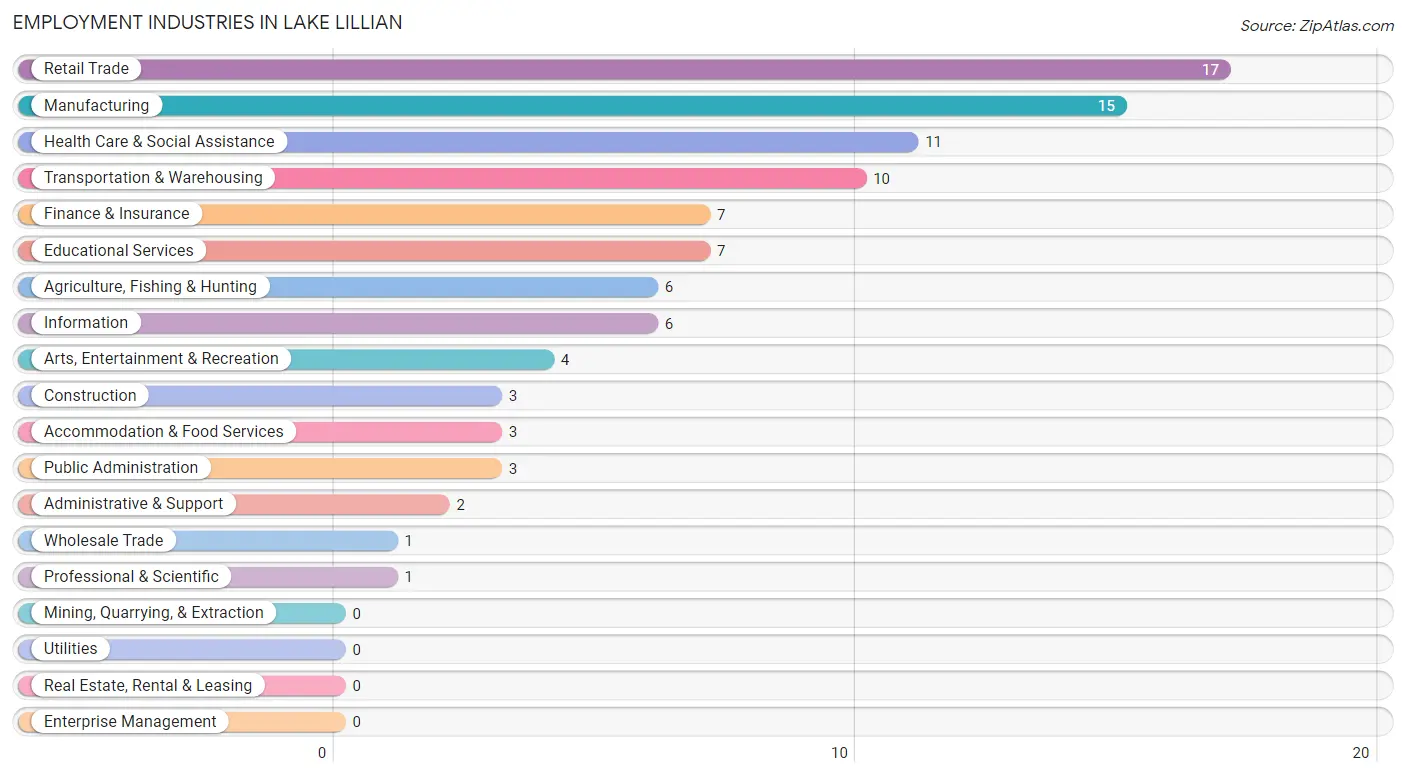
Employment Industries in Lake Lillian
The major employment industries in Lake Lillian include Retail Trade (17 | 16.8%), Manufacturing (15 | 14.8%), Health Care & Social Assistance (11 | 10.9%), Transportation & Warehousing (10 | 9.9%), and Finance & Insurance (7 | 6.9%).
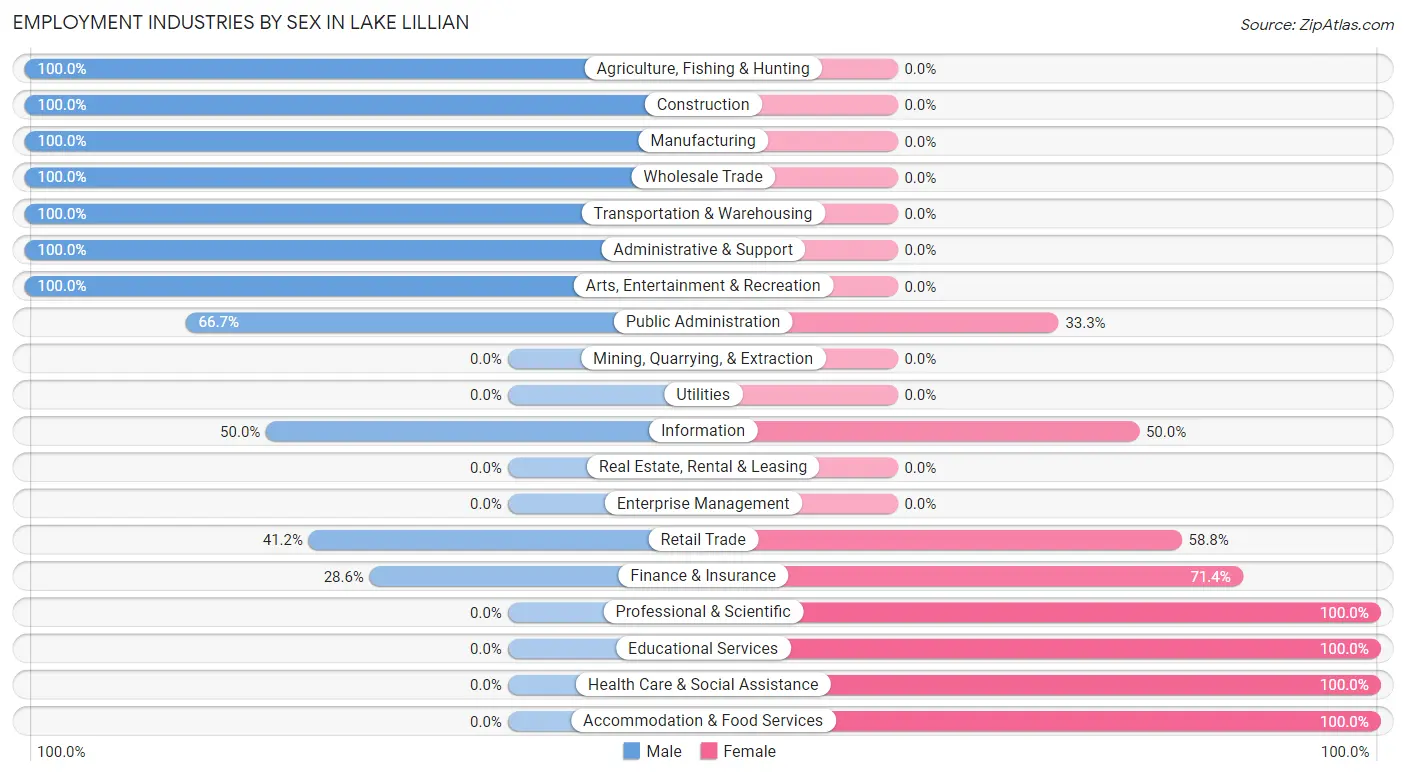
Employment Industries by Sex in Lake Lillian
The Lake Lillian industries that see more men than women are Agriculture, Fishing & Hunting (100.0%), Construction (100.0%), and Manufacturing (100.0%), whereas the industries that tend to have a higher number of women are Professional & Scientific (100.0%), Educational Services (100.0%), and Health Care & Social Assistance (100.0%).
| Industry | Male | Female |
| Agriculture, Fishing & Hunting | 6 (100.0%) | 0 (0.0%) |
| Mining, Quarrying, & Extraction | 0 (0.0%) | 0 (0.0%) |
| Construction | 3 (100.0%) | 0 (0.0%) |
| Manufacturing | 15 (100.0%) | 0 (0.0%) |
| Wholesale Trade | 1 (100.0%) | 0 (0.0%) |
| Retail Trade | 7 (41.2%) | 10 (58.8%) |
| Transportation & Warehousing | 10 (100.0%) | 0 (0.0%) |
| Utilities | 0 (0.0%) | 0 (0.0%) |
| Information | 3 (50.0%) | 3 (50.0%) |
| Finance & Insurance | 2 (28.6%) | 5 (71.4%) |
| Real Estate, Rental & Leasing | 0 (0.0%) | 0 (0.0%) |
| Professional & Scientific | 0 (0.0%) | 1 (100.0%) |
| Enterprise Management | 0 (0.0%) | 0 (0.0%) |
| Administrative & Support | 2 (100.0%) | 0 (0.0%) |
| Educational Services | 0 (0.0%) | 7 (100.0%) |
| Health Care & Social Assistance | 0 (0.0%) | 11 (100.0%) |
| Arts, Entertainment & Recreation | 4 (100.0%) | 0 (0.0%) |
| Accommodation & Food Services | 0 (0.0%) | 3 (100.0%) |
| Public Administration | 2 (66.7%) | 1 (33.3%) |
| Total | 59 (58.4%) | 42 (41.6%) |
Education in Lake Lillian
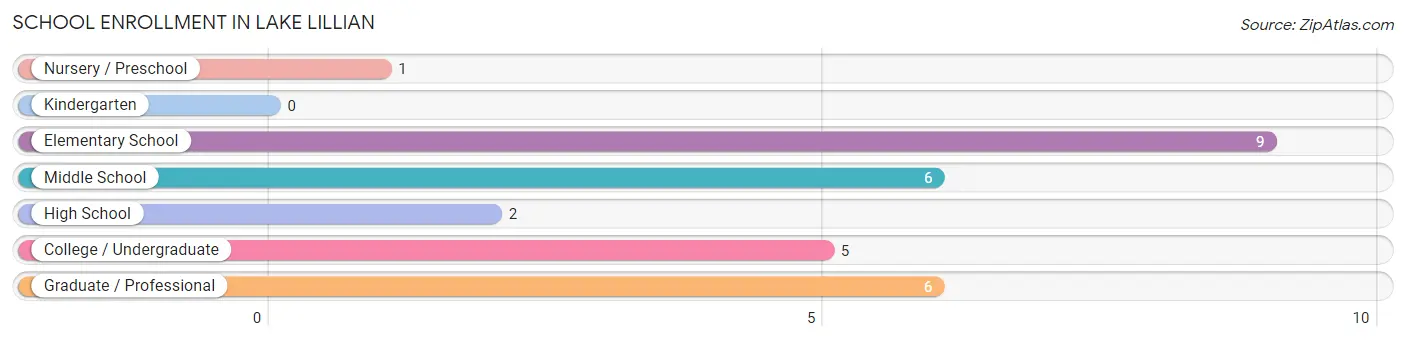
School Enrollment in Lake Lillian
The most common levels of schooling among the 29 students in Lake Lillian are elementary school (9 | 31.0%), middle school (6 | 20.7%), and graduate / professional (6 | 20.7%).
| School Level | # Students | % Students |
| Nursery / Preschool | 1 | 3.5% |
| Kindergarten | 0 | 0.0% |
| Elementary School | 9 | 31.0% |
| Middle School | 6 | 20.7% |
| High School | 2 | 6.9% |
| College / Undergraduate | 5 | 17.2% |
| Graduate / Professional | 6 | 20.7% |
| Total | 29 | 100.0% |
School Enrollment by Age by Funding Source in Lake Lillian
Out of a total of 29 students who are enrolled in schools in Lake Lillian, 10 (34.5%) attend a private institution, while the remaining 19 (65.5%) are enrolled in public schools. The age group of 25 to 34 year olds has the highest likelihood of being enrolled in private schools, with 6 (85.7% in the age bracket) enrolled. Conversely, the age group of 5 to 9 year old has the lowest likelihood of being enrolled in a private school, with 5 (100.0% in the age bracket) attending a public institution.
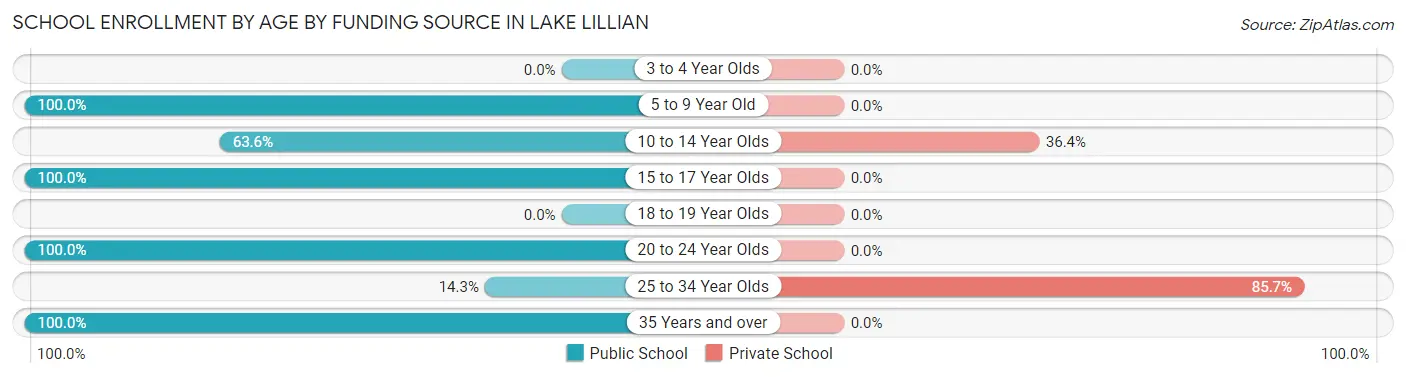
| Age Bracket | Public School | Private School |
| 3 to 4 Year Olds | 0 (0.0%) | 0 (0.0%) |
| 5 to 9 Year Old | 5 (100.0%) | 0 (0.0%) |
| 10 to 14 Year Olds | 7 (63.6%) | 4 (36.4%) |
| 15 to 17 Year Olds | 2 (100.0%) | 0 (0.0%) |
| 18 to 19 Year Olds | 0 (0.0%) | 0 (0.0%) |
| 20 to 24 Year Olds | 2 (100.0%) | 0 (0.0%) |
| 25 to 34 Year Olds | 1 (14.3%) | 6 (85.7%) |
| 35 Years and over | 2 (100.0%) | 0 (0.0%) |
| Total | 19 (65.5%) | 10 (34.5%) |
Educational Attainment by Field of Study in Lake Lillian
Business (10 | 38.5%), education (7 | 26.9%), computers & mathematics (2 | 7.7%), bio, nature & agricultural (2 | 7.7%), and liberal arts & history (2 | 7.7%) are the most common fields of study among 26 individuals in Lake Lillian who have obtained a bachelor's degree or higher.
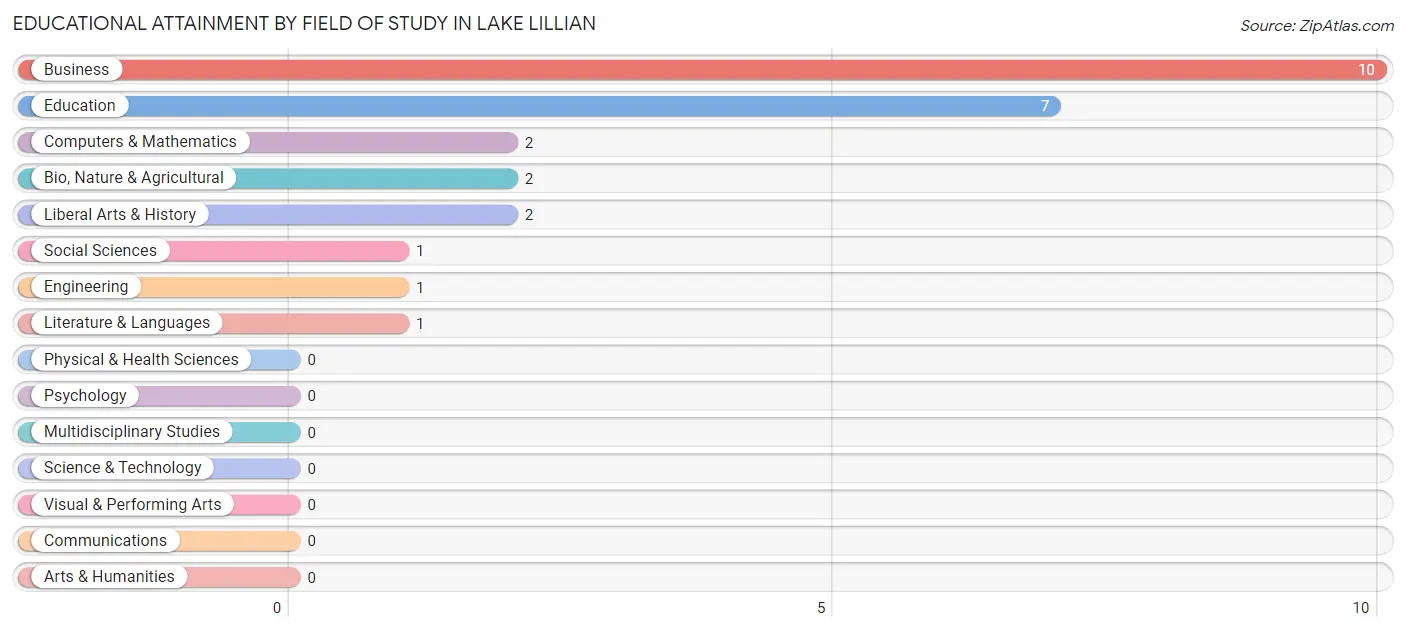
| Field of Study | # Graduates | % Graduates |
| Computers & Mathematics | 2 | 7.7% |
| Bio, Nature & Agricultural | 2 | 7.7% |
| Physical & Health Sciences | 0 | 0.0% |
| Psychology | 0 | 0.0% |
| Social Sciences | 1 | 3.8% |
| Engineering | 1 | 3.8% |
| Multidisciplinary Studies | 0 | 0.0% |
| Science & Technology | 0 | 0.0% |
| Business | 10 | 38.5% |
| Education | 7 | 26.9% |
| Literature & Languages | 1 | 3.8% |
| Liberal Arts & History | 2 | 7.7% |
| Visual & Performing Arts | 0 | 0.0% |
| Communications | 0 | 0.0% |
| Arts & Humanities | 0 | 0.0% |
| Total | 26 | 100.0% |
Transportation & Commute in Lake Lillian
Vehicle Availability by Sex in Lake Lillian
The most prevalent vehicle ownership categories in Lake Lillian are males with 2 vehicles (21, accounting for 35.6%) and females with 2 vehicles (17, making up 50.0%).
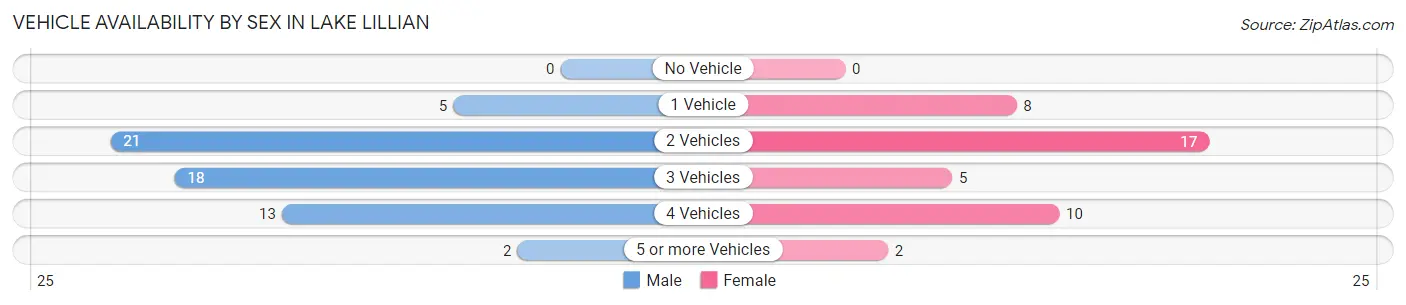
| Vehicles Available | Male | Female |
| No Vehicle | 0 (0.0%) | 0 (0.0%) |
| 1 Vehicle | 5 (8.5%) | 8 (19.1%) |
| 2 Vehicles | 21 (35.6%) | 17 (40.5%) |
| 3 Vehicles | 18 (30.5%) | 5 (11.9%) |
| 4 Vehicles | 13 (22.0%) | 10 (23.8%) |
| 5 or more Vehicles | 2 (3.4%) | 2 (4.8%) |
| Total | 59 (100.0%) | 42 (100.0%) |
Commute Time in Lake Lillian
The most frequently occuring commute durations in Lake Lillian are 30 to 34 minutes (23 commuters, 22.8%), 20 to 24 minutes (19 commuters, 18.8%), and 25 to 29 minutes (17 commuters, 16.8%).
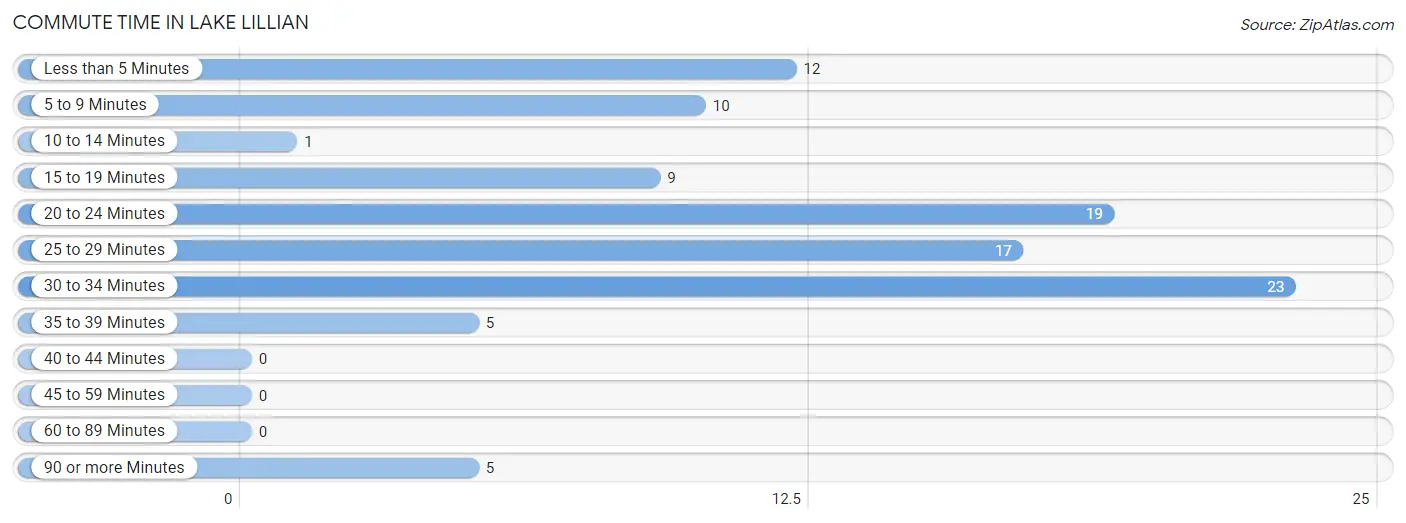
| Commute Time | # Commuters | % Commuters |
| Less than 5 Minutes | 12 | 11.9% |
| 5 to 9 Minutes | 10 | 9.9% |
| 10 to 14 Minutes | 1 | 1.0% |
| 15 to 19 Minutes | 9 | 8.9% |
| 20 to 24 Minutes | 19 | 18.8% |
| 25 to 29 Minutes | 17 | 16.8% |
| 30 to 34 Minutes | 23 | 22.8% |
| 35 to 39 Minutes | 5 | 5.0% |
| 40 to 44 Minutes | 0 | 0.0% |
| 45 to 59 Minutes | 0 | 0.0% |
| 60 to 89 Minutes | 0 | 0.0% |
| 90 or more Minutes | 5 | 5.0% |
Commute Time by Sex in Lake Lillian
The most common commute times in Lake Lillian are 20 to 24 minutes (10 commuters, 17.0%) for males and 30 to 34 minutes (16 commuters, 38.1%) for females.
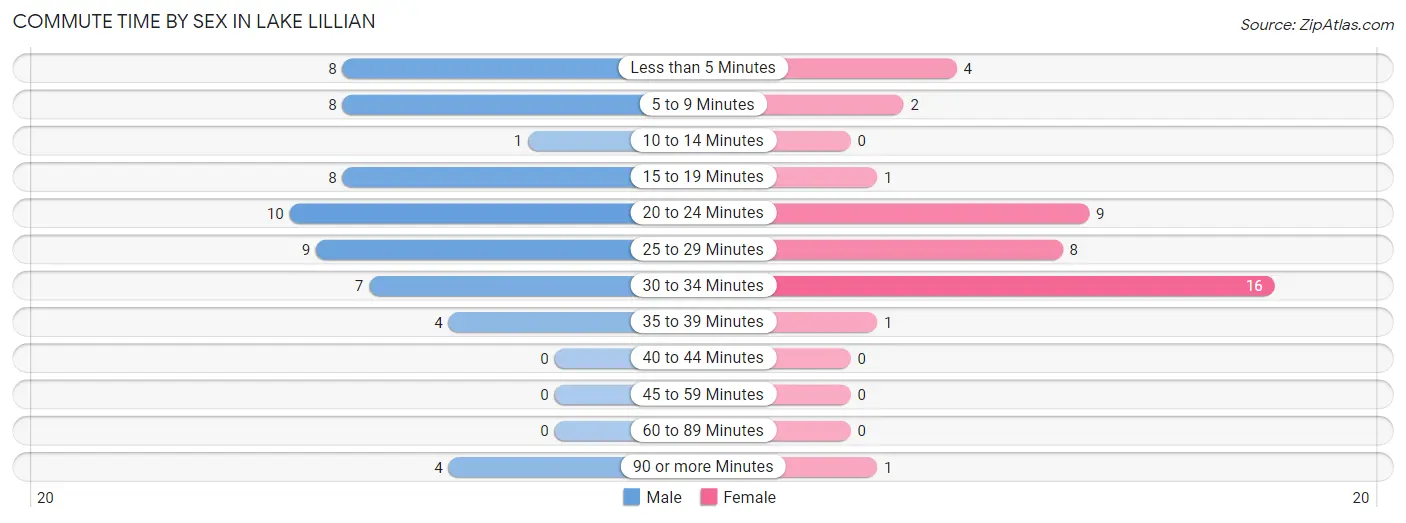
| Commute Time | Male | Female |
| Less than 5 Minutes | 8 (13.6%) | 4 (9.5%) |
| 5 to 9 Minutes | 8 (13.6%) | 2 (4.8%) |
| 10 to 14 Minutes | 1 (1.7%) | 0 (0.0%) |
| 15 to 19 Minutes | 8 (13.6%) | 1 (2.4%) |
| 20 to 24 Minutes | 10 (17.0%) | 9 (21.4%) |
| 25 to 29 Minutes | 9 (15.2%) | 8 (19.1%) |
| 30 to 34 Minutes | 7 (11.9%) | 16 (38.1%) |
| 35 to 39 Minutes | 4 (6.8%) | 1 (2.4%) |
| 40 to 44 Minutes | 0 (0.0%) | 0 (0.0%) |
| 45 to 59 Minutes | 0 (0.0%) | 0 (0.0%) |
| 60 to 89 Minutes | 0 (0.0%) | 0 (0.0%) |
| 90 or more Minutes | 4 (6.8%) | 1 (2.4%) |
Time of Departure to Work by Sex in Lake Lillian
The most frequent times of departure to work in Lake Lillian are 6:30 AM to 6:59 AM (10, 17.0%) for males and 7:00 AM to 7:29 AM (12, 28.6%) for females.
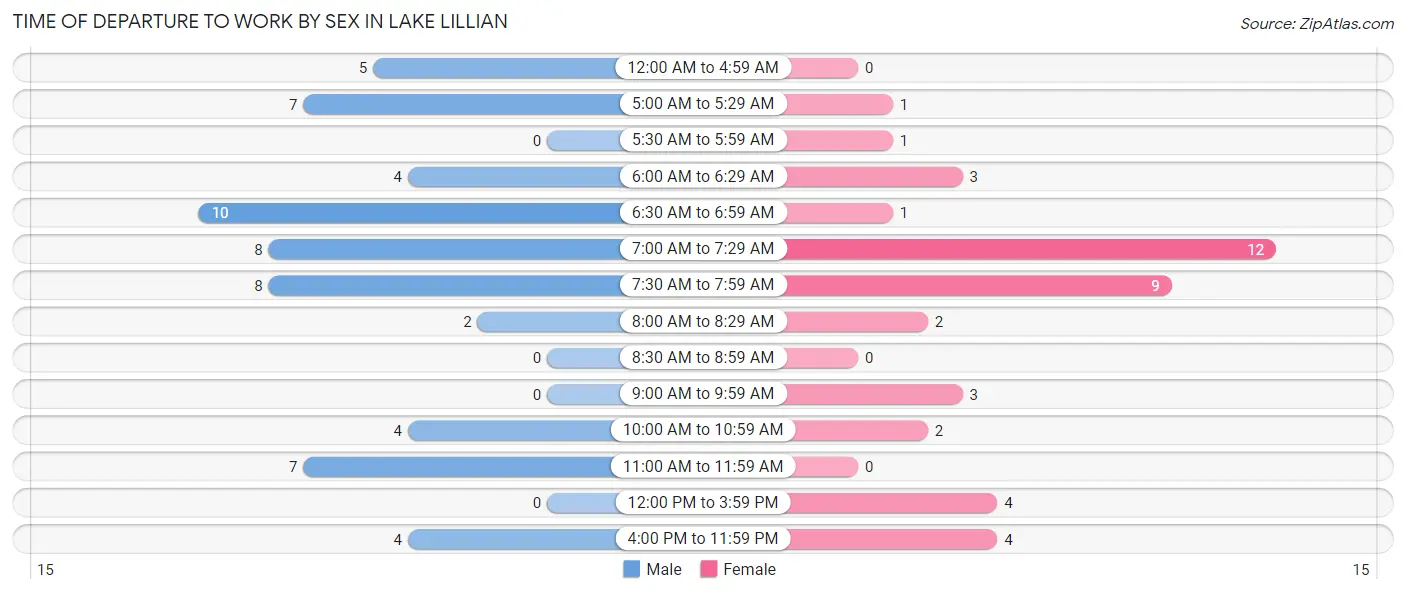
| Time of Departure | Male | Female |
| 12:00 AM to 4:59 AM | 5 (8.5%) | 0 (0.0%) |
| 5:00 AM to 5:29 AM | 7 (11.9%) | 1 (2.4%) |
| 5:30 AM to 5:59 AM | 0 (0.0%) | 1 (2.4%) |
| 6:00 AM to 6:29 AM | 4 (6.8%) | 3 (7.1%) |
| 6:30 AM to 6:59 AM | 10 (17.0%) | 1 (2.4%) |
| 7:00 AM to 7:29 AM | 8 (13.6%) | 12 (28.6%) |
| 7:30 AM to 7:59 AM | 8 (13.6%) | 9 (21.4%) |
| 8:00 AM to 8:29 AM | 2 (3.4%) | 2 (4.8%) |
| 8:30 AM to 8:59 AM | 0 (0.0%) | 0 (0.0%) |
| 9:00 AM to 9:59 AM | 0 (0.0%) | 3 (7.1%) |
| 10:00 AM to 10:59 AM | 4 (6.8%) | 2 (4.8%) |
| 11:00 AM to 11:59 AM | 7 (11.9%) | 0 (0.0%) |
| 12:00 PM to 3:59 PM | 0 (0.0%) | 4 (9.5%) |
| 4:00 PM to 11:59 PM | 4 (6.8%) | 4 (9.5%) |
| Total | 59 (100.0%) | 42 (100.0%) |
Housing Occupancy in Lake Lillian
Occupancy by Ownership in Lake Lillian
Of the total 93 dwellings in Lake Lillian, owner-occupied units account for 76 (81.7%), while renter-occupied units make up 17 (18.3%).
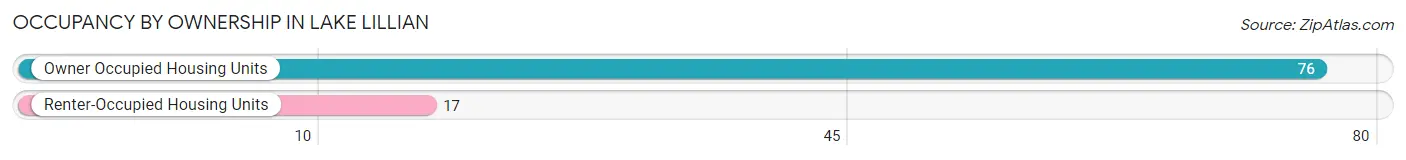
| Occupancy | # Housing Units | % Housing Units |
| Owner Occupied Housing Units | 76 | 81.7% |
| Renter-Occupied Housing Units | 17 | 18.3% |
| Total Occupied Housing Units | 93 | 100.0% |
Occupancy by Household Size in Lake Lillian
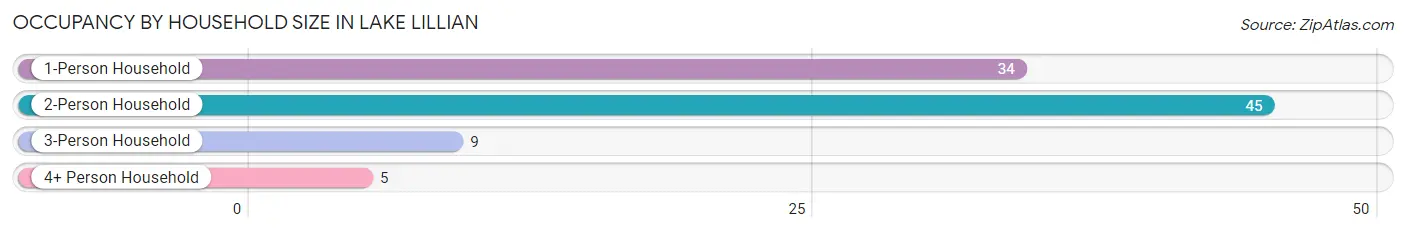
| Household Size | # Housing Units | % Housing Units |
| 1-Person Household | 34 | 36.6% |
| 2-Person Household | 45 | 48.4% |
| 3-Person Household | 9 | 9.7% |
| 4+ Person Household | 5 | 5.4% |
| Total Housing Units | 93 | 100.0% |
Occupancy by Ownership by Household Size in Lake Lillian
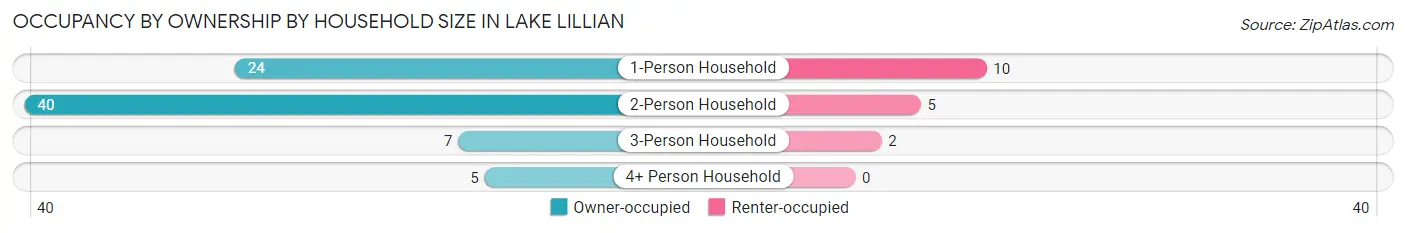
| Household Size | Owner-occupied | Renter-occupied |
| 1-Person Household | 24 (70.6%) | 10 (29.4%) |
| 2-Person Household | 40 (88.9%) | 5 (11.1%) |
| 3-Person Household | 7 (77.8%) | 2 (22.2%) |
| 4+ Person Household | 5 (100.0%) | 0 (0.0%) |
| Total Housing Units | 76 (81.7%) | 17 (18.3%) |
Occupancy by Educational Attainment in Lake Lillian
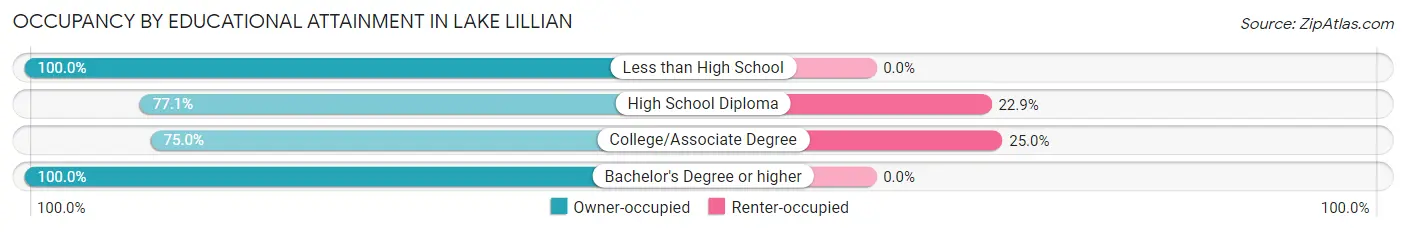
| Household Size | Owner-occupied | Renter-occupied |
| Less than High School | 2 (100.0%) | 0 (0.0%) |
| High School Diploma | 27 (77.1%) | 8 (22.9%) |
| College/Associate Degree | 27 (75.0%) | 9 (25.0%) |
| Bachelor's Degree or higher | 20 (100.0%) | 0 (0.0%) |
Occupancy by Age of Householder in Lake Lillian
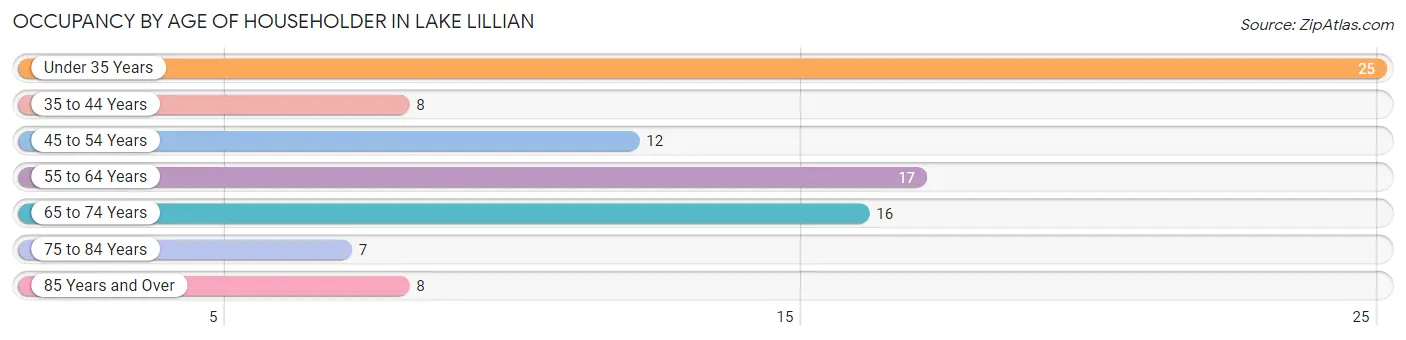
| Age Bracket | # Households | % Households |
| Under 35 Years | 25 | 26.9% |
| 35 to 44 Years | 8 | 8.6% |
| 45 to 54 Years | 12 | 12.9% |
| 55 to 64 Years | 17 | 18.3% |
| 65 to 74 Years | 16 | 17.2% |
| 75 to 84 Years | 7 | 7.5% |
| 85 Years and Over | 8 | 8.6% |
| Total | 93 | 100.0% |
Housing Finances in Lake Lillian
Median Income by Occupancy in Lake Lillian
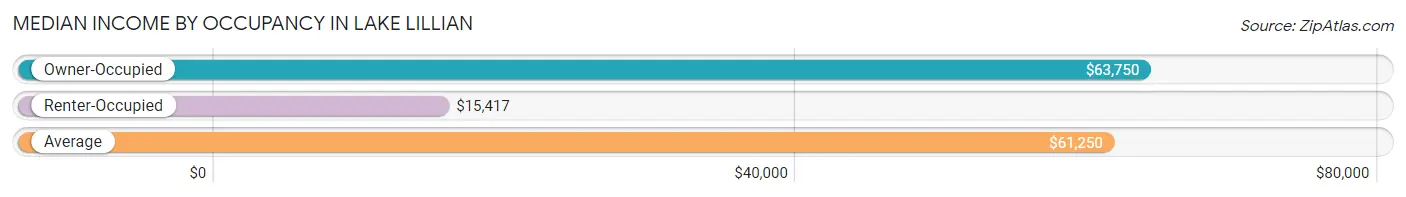
| Occupancy Type | # Households | Median Income |
| Owner-Occupied | 76 (81.7%) | $63,750 |
| Renter-Occupied | 17 (18.3%) | $15,417 |
| Average | 93 (100.0%) | $61,250 |
Occupancy by Householder Income Bracket in Lake Lillian
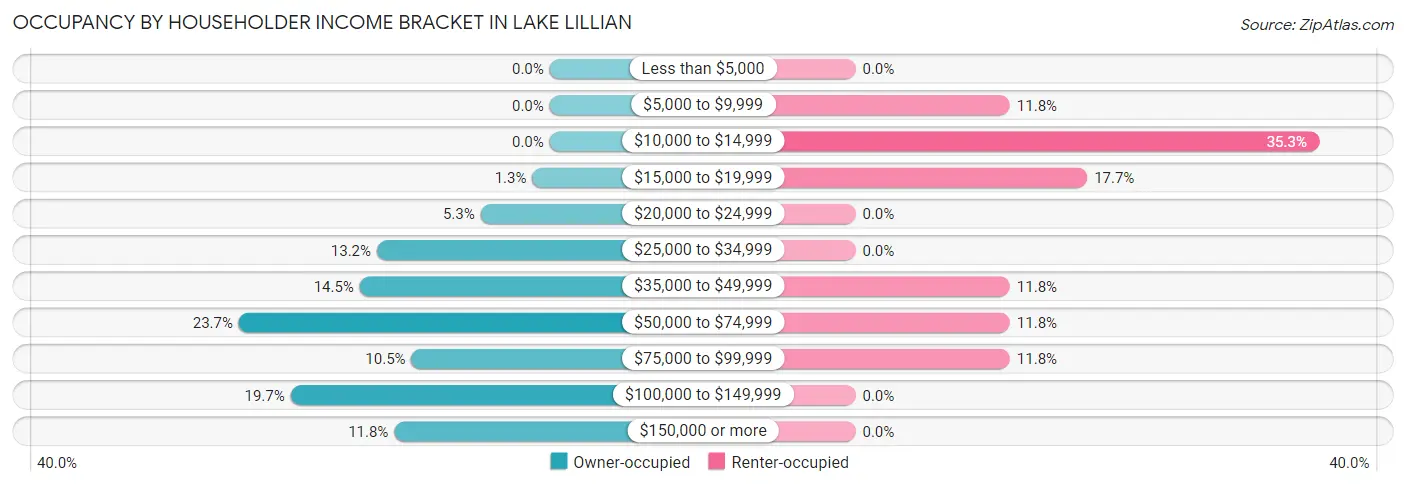
| Income Bracket | Owner-occupied | Renter-occupied |
| Less than $5,000 | 0 (0.0%) | 0 (0.0%) |
| $5,000 to $9,999 | 0 (0.0%) | 2 (11.8%) |
| $10,000 to $14,999 | 0 (0.0%) | 6 (35.3%) |
| $15,000 to $19,999 | 1 (1.3%) | 3 (17.6%) |
| $20,000 to $24,999 | 4 (5.3%) | 0 (0.0%) |
| $25,000 to $34,999 | 10 (13.2%) | 0 (0.0%) |
| $35,000 to $49,999 | 11 (14.5%) | 2 (11.8%) |
| $50,000 to $74,999 | 18 (23.7%) | 2 (11.8%) |
| $75,000 to $99,999 | 8 (10.5%) | 2 (11.8%) |
| $100,000 to $149,999 | 15 (19.7%) | 0 (0.0%) |
| $150,000 or more | 9 (11.8%) | 0 (0.0%) |
| Total | 76 (100.0%) | 17 (100.0%) |
Monthly Housing Cost Tiers in Lake Lillian
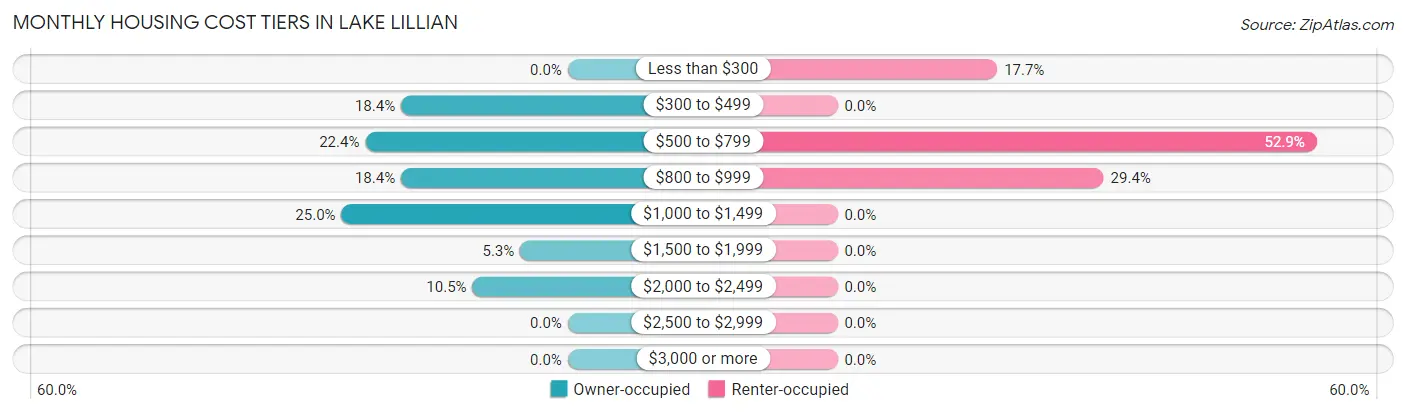
| Monthly Cost | Owner-occupied | Renter-occupied |
| Less than $300 | 0 (0.0%) | 3 (17.6%) |
| $300 to $499 | 14 (18.4%) | 0 (0.0%) |
| $500 to $799 | 17 (22.4%) | 9 (52.9%) |
| $800 to $999 | 14 (18.4%) | 5 (29.4%) |
| $1,000 to $1,499 | 19 (25.0%) | 0 (0.0%) |
| $1,500 to $1,999 | 4 (5.3%) | 0 (0.0%) |
| $2,000 to $2,499 | 8 (10.5%) | 0 (0.0%) |
| $2,500 to $2,999 | 0 (0.0%) | 0 (0.0%) |
| $3,000 or more | 0 (0.0%) | 0 (0.0%) |
| Total | 76 (100.0%) | 17 (100.0%) |
Physical Housing Characteristics in Lake Lillian
Housing Structures in Lake Lillian
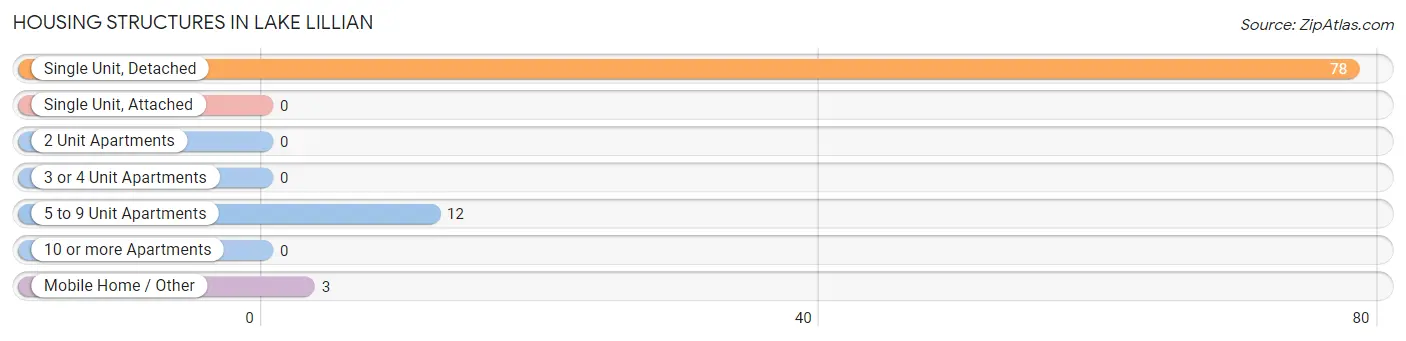
| Structure Type | # Housing Units | % Housing Units |
| Single Unit, Detached | 78 | 83.9% |
| Single Unit, Attached | 0 | 0.0% |
| 2 Unit Apartments | 0 | 0.0% |
| 3 or 4 Unit Apartments | 0 | 0.0% |
| 5 to 9 Unit Apartments | 12 | 12.9% |
| 10 or more Apartments | 0 | 0.0% |
| Mobile Home / Other | 3 | 3.2% |
| Total | 93 | 100.0% |
Housing Structures by Occupancy in Lake Lillian
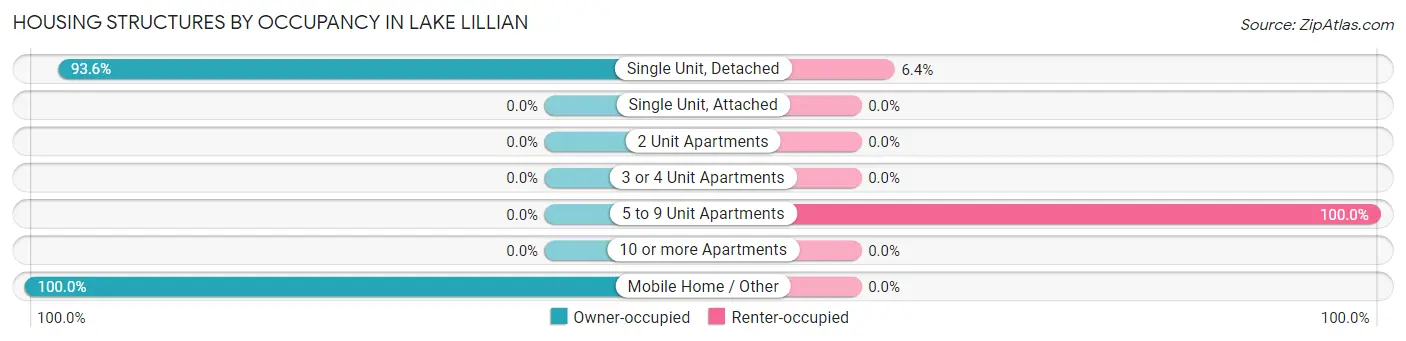
| Structure Type | Owner-occupied | Renter-occupied |
| Single Unit, Detached | 73 (93.6%) | 5 (6.4%) |
| Single Unit, Attached | 0 (0.0%) | 0 (0.0%) |
| 2 Unit Apartments | 0 (0.0%) | 0 (0.0%) |
| 3 or 4 Unit Apartments | 0 (0.0%) | 0 (0.0%) |
| 5 to 9 Unit Apartments | 0 (0.0%) | 12 (100.0%) |
| 10 or more Apartments | 0 (0.0%) | 0 (0.0%) |
| Mobile Home / Other | 3 (100.0%) | 0 (0.0%) |
| Total | 76 (81.7%) | 17 (18.3%) |
Housing Structures by Number of Rooms in Lake Lillian
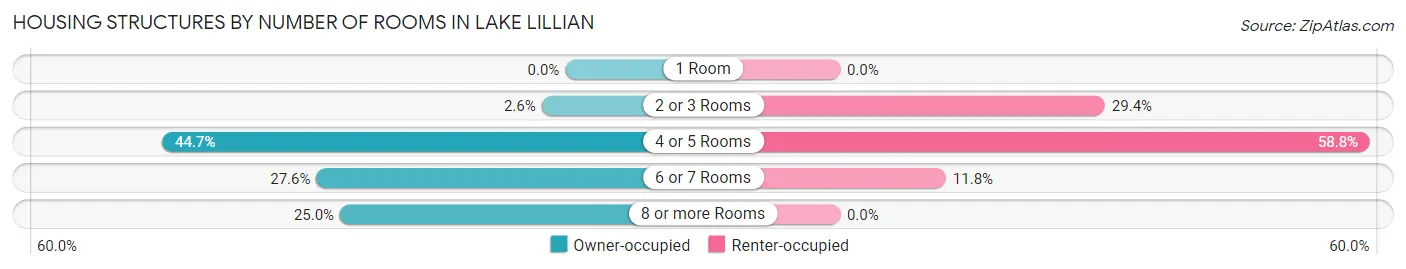
| Number of Rooms | Owner-occupied | Renter-occupied |
| 1 Room | 0 (0.0%) | 0 (0.0%) |
| 2 or 3 Rooms | 2 (2.6%) | 5 (29.4%) |
| 4 or 5 Rooms | 34 (44.7%) | 10 (58.8%) |
| 6 or 7 Rooms | 21 (27.6%) | 2 (11.8%) |
| 8 or more Rooms | 19 (25.0%) | 0 (0.0%) |
| Total | 76 (100.0%) | 17 (100.0%) |
Housing Structure by Heating Type in Lake Lillian
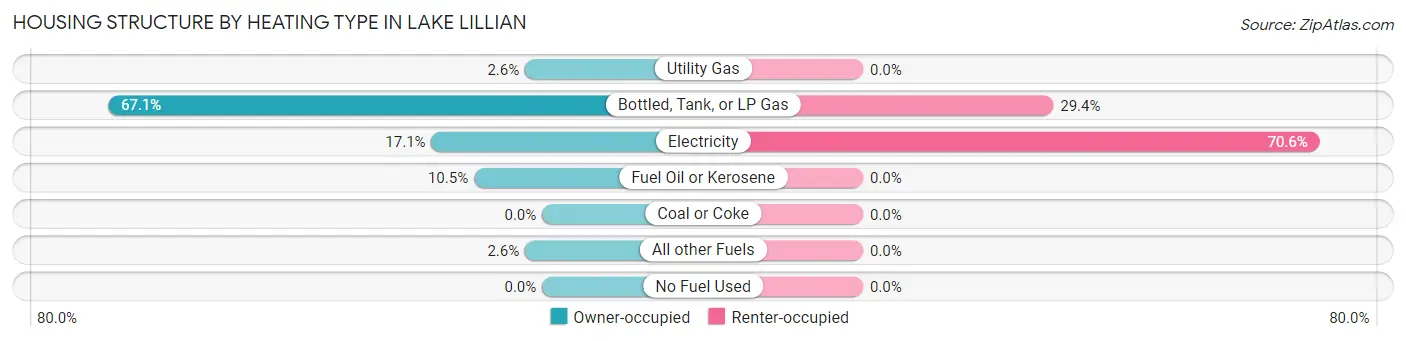
| Heating Type | Owner-occupied | Renter-occupied |
| Utility Gas | 2 (2.6%) | 0 (0.0%) |
| Bottled, Tank, or LP Gas | 51 (67.1%) | 5 (29.4%) |
| Electricity | 13 (17.1%) | 12 (70.6%) |
| Fuel Oil or Kerosene | 8 (10.5%) | 0 (0.0%) |
| Coal or Coke | 0 (0.0%) | 0 (0.0%) |
| All other Fuels | 2 (2.6%) | 0 (0.0%) |
| No Fuel Used | 0 (0.0%) | 0 (0.0%) |
| Total | 76 (100.0%) | 17 (100.0%) |
Household Vehicle Usage in Lake Lillian
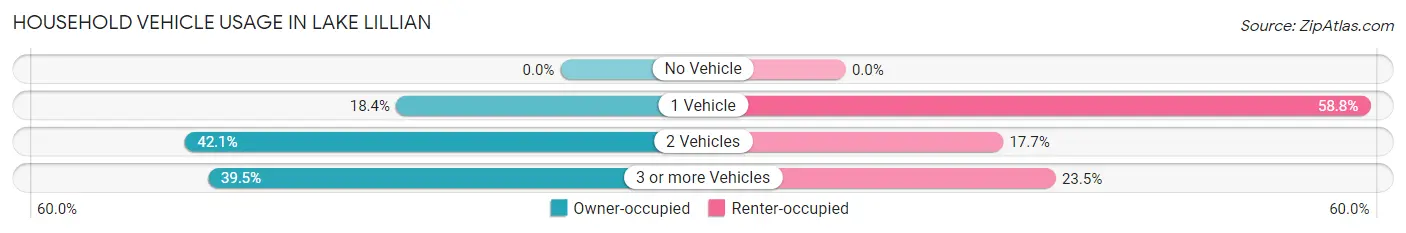
| Vehicles per Household | Owner-occupied | Renter-occupied |
| No Vehicle | 0 (0.0%) | 0 (0.0%) |
| 1 Vehicle | 14 (18.4%) | 10 (58.8%) |
| 2 Vehicles | 32 (42.1%) | 3 (17.6%) |
| 3 or more Vehicles | 30 (39.5%) | 4 (23.5%) |
| Total | 76 (100.0%) | 17 (100.0%) |
Real Estate & Mortgages in Lake Lillian
Real Estate and Mortgage Overview in Lake Lillian
| Characteristic | Without Mortgage | With Mortgage |
| Housing Units | 34 | 42 |
| Median Property Value | $70,000 | $97,500 |
| Median Household Income | $47,500 | $6 |
| Monthly Housing Costs | $527 | $0 |
| Real Estate Taxes | $1,222 | $0 |
Property Value by Mortgage Status in Lake Lillian
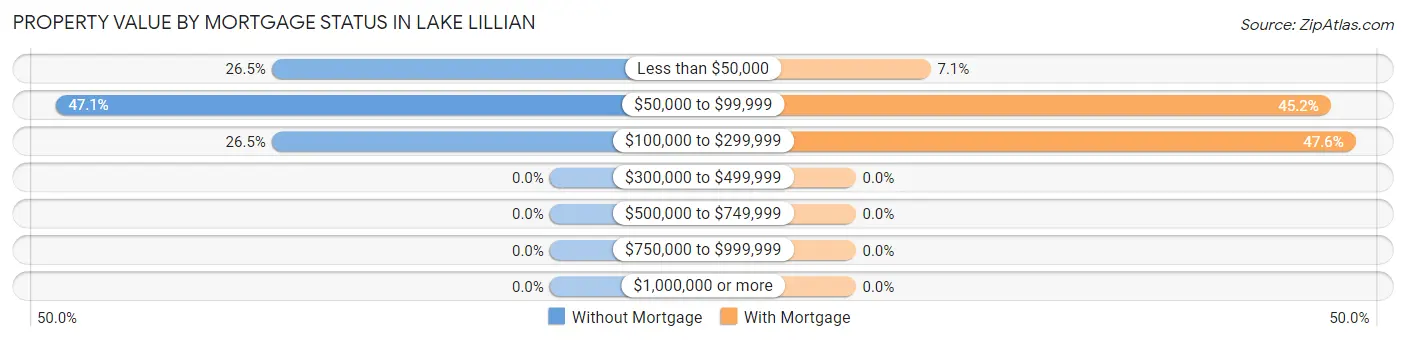
| Property Value | Without Mortgage | With Mortgage |
| Less than $50,000 | 9 (26.5%) | 3 (7.1%) |
| $50,000 to $99,999 | 16 (47.1%) | 19 (45.2%) |
| $100,000 to $299,999 | 9 (26.5%) | 20 (47.6%) |
| $300,000 to $499,999 | 0 (0.0%) | 0 (0.0%) |
| $500,000 to $749,999 | 0 (0.0%) | 0 (0.0%) |
| $750,000 to $999,999 | 0 (0.0%) | 0 (0.0%) |
| $1,000,000 or more | 0 (0.0%) | 0 (0.0%) |
| Total | 34 (100.0%) | 42 (100.0%) |
Household Income by Mortgage Status in Lake Lillian
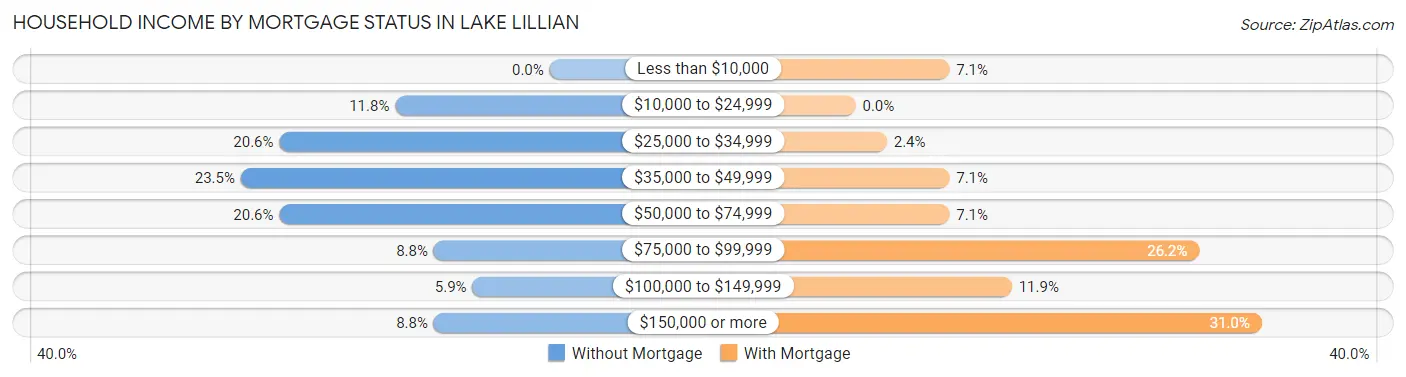
| Household Income | Without Mortgage | With Mortgage |
| Less than $10,000 | 0 (0.0%) | 3 (7.1%) |
| $10,000 to $24,999 | 4 (11.8%) | 0 (0.0%) |
| $25,000 to $34,999 | 7 (20.6%) | 1 (2.4%) |
| $35,000 to $49,999 | 8 (23.5%) | 3 (7.1%) |
| $50,000 to $74,999 | 7 (20.6%) | 3 (7.1%) |
| $75,000 to $99,999 | 3 (8.8%) | 11 (26.2%) |
| $100,000 to $149,999 | 2 (5.9%) | 5 (11.9%) |
| $150,000 or more | 3 (8.8%) | 13 (30.9%) |
| Total | 34 (100.0%) | 42 (100.0%) |
Property Value to Household Income Ratio in Lake Lillian
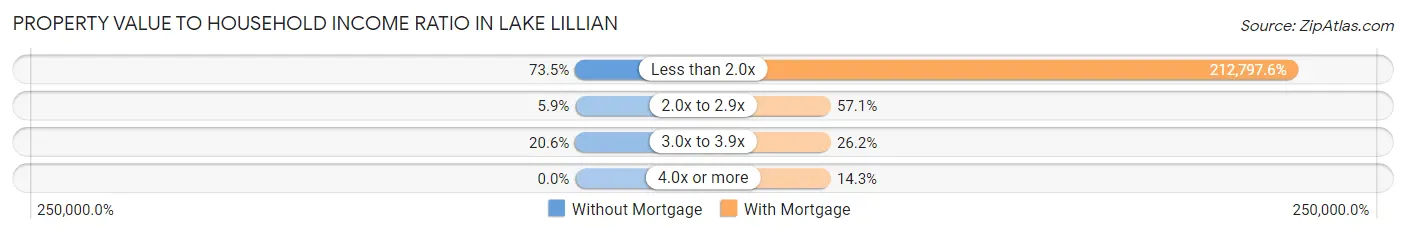
| Value-to-Income Ratio | Without Mortgage | With Mortgage |
| Less than 2.0x | 25 (73.5%) | 89,375 (212,797.6%) |
| 2.0x to 2.9x | 2 (5.9%) | 24 (57.1%) |
| 3.0x to 3.9x | 7 (20.6%) | 11 (26.2%) |
| 4.0x or more | 0 (0.0%) | 6 (14.3%) |
| Total | 34 (100.0%) | 42 (100.0%) |
Real Estate Taxes by Mortgage Status in Lake Lillian
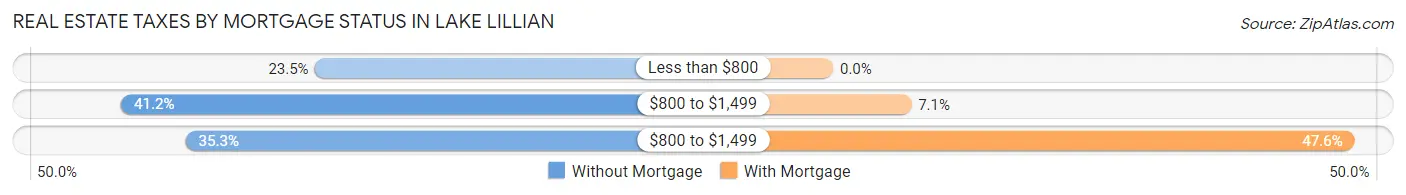
| Property Taxes | Without Mortgage | With Mortgage |
| Less than $800 | 8 (23.5%) | 0 (0.0%) |
| $800 to $1,499 | 14 (41.2%) | 3 (7.1%) |
| $800 to $1,499 | 12 (35.3%) | 20 (47.6%) |
| Total | 34 (100.0%) | 42 (100.0%) |
Health & Disability in Lake Lillian
Health Insurance Coverage by Age in Lake Lillian
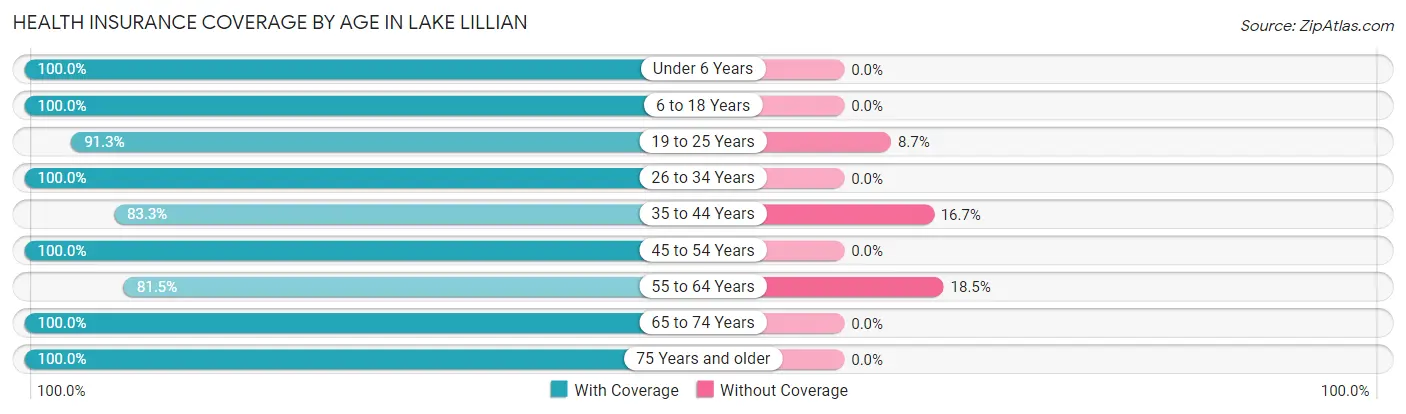
| Age Bracket | With Coverage | Without Coverage |
| Under 6 Years | 10 (100.0%) | 0 (0.0%) |
| 6 to 18 Years | 17 (100.0%) | 0 (0.0%) |
| 19 to 25 Years | 21 (91.3%) | 2 (8.7%) |
| 26 to 34 Years | 23 (100.0%) | 0 (0.0%) |
| 35 to 44 Years | 10 (83.3%) | 2 (16.7%) |
| 45 to 54 Years | 20 (100.0%) | 0 (0.0%) |
| 55 to 64 Years | 22 (81.5%) | 5 (18.5%) |
| 65 to 74 Years | 22 (100.0%) | 0 (0.0%) |
| 75 Years and older | 23 (100.0%) | 0 (0.0%) |
| Total | 168 (94.9%) | 9 (5.1%) |
Health Insurance Coverage by Citizenship Status in Lake Lillian
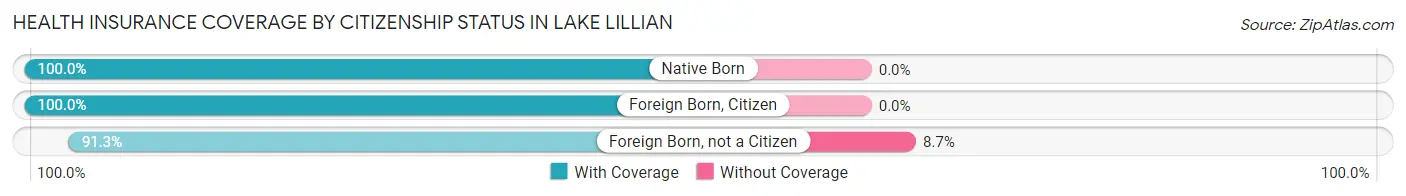
| Citizenship Status | With Coverage | Without Coverage |
| Native Born | 10 (100.0%) | 0 (0.0%) |
| Foreign Born, Citizen | 17 (100.0%) | 0 (0.0%) |
| Foreign Born, not a Citizen | 21 (91.3%) | 2 (8.7%) |
Health Insurance Coverage by Household Income in Lake Lillian
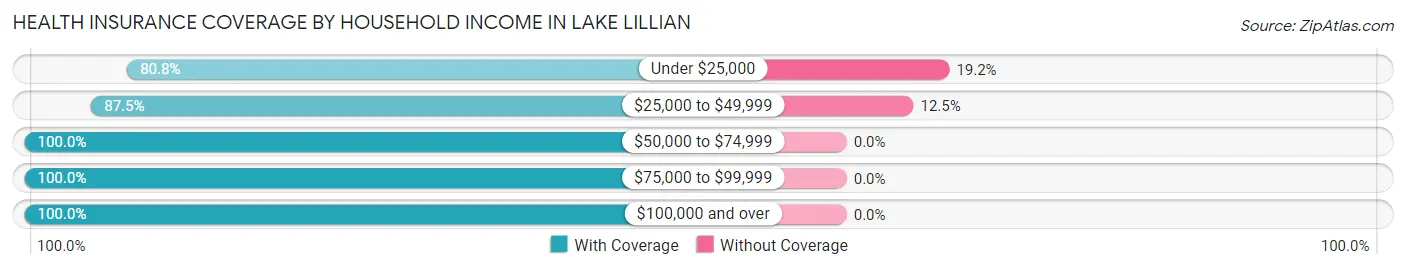
| Household Income | With Coverage | Without Coverage |
| Under $25,000 | 21 (80.8%) | 5 (19.2%) |
| $25,000 to $49,999 | 28 (87.5%) | 4 (12.5%) |
| $50,000 to $74,999 | 45 (100.0%) | 0 (0.0%) |
| $75,000 to $99,999 | 22 (100.0%) | 0 (0.0%) |
| $100,000 and over | 52 (100.0%) | 0 (0.0%) |
Public vs Private Health Insurance Coverage by Age in Lake Lillian
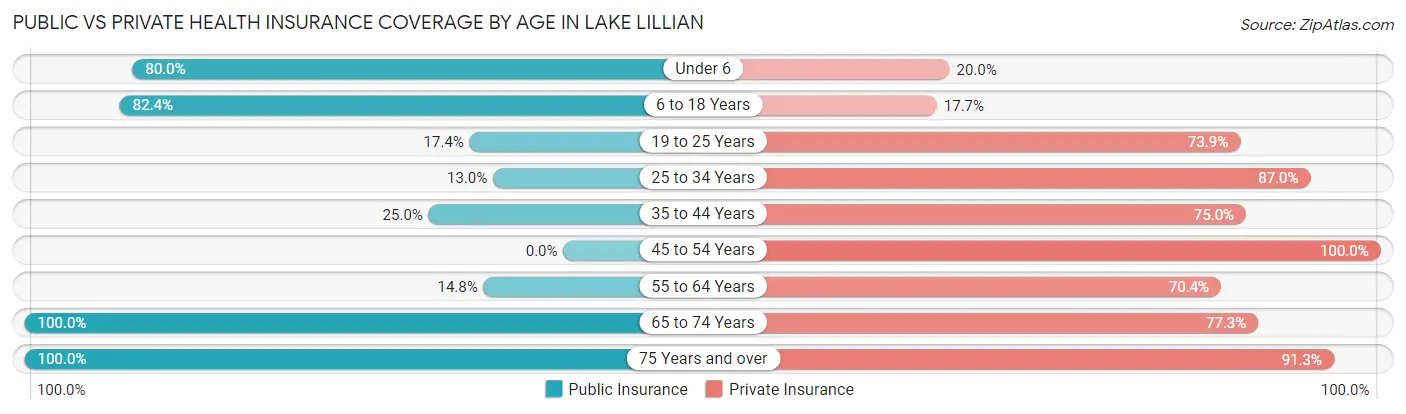
| Age Bracket | Public Insurance | Private Insurance |
| Under 6 | 8 (80.0%) | 2 (20.0%) |
| 6 to 18 Years | 14 (82.4%) | 3 (17.6%) |
| 19 to 25 Years | 4 (17.4%) | 17 (73.9%) |
| 25 to 34 Years | 3 (13.0%) | 20 (87.0%) |
| 35 to 44 Years | 3 (25.0%) | 9 (75.0%) |
| 45 to 54 Years | 0 (0.0%) | 20 (100.0%) |
| 55 to 64 Years | 4 (14.8%) | 19 (70.4%) |
| 65 to 74 Years | 22 (100.0%) | 17 (77.3%) |
| 75 Years and over | 23 (100.0%) | 21 (91.3%) |
| Total | 81 (45.8%) | 128 (72.3%) |
Disability Status by Sex by Age in Lake Lillian
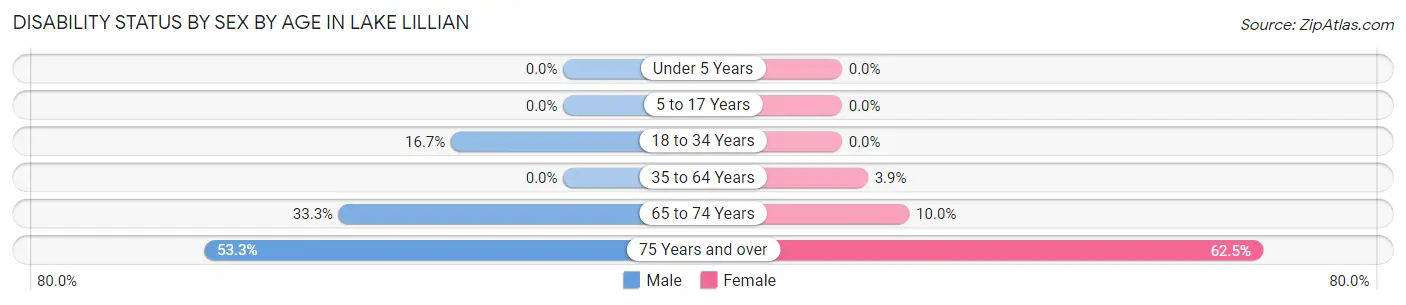
| Age Bracket | Male | Female |
| Under 5 Years | 0 (0.0%) | 0 (0.0%) |
| 5 to 17 Years | 0 (0.0%) | 0 (0.0%) |
| 18 to 34 Years | 5 (16.7%) | 0 (0.0%) |
| 35 to 64 Years | 0 (0.0%) | 1 (3.8%) |
| 65 to 74 Years | 4 (33.3%) | 1 (10.0%) |
| 75 Years and over | 8 (53.3%) | 5 (62.5%) |
Disability Class by Sex by Age in Lake Lillian
Disability Class: Hearing Difficulty
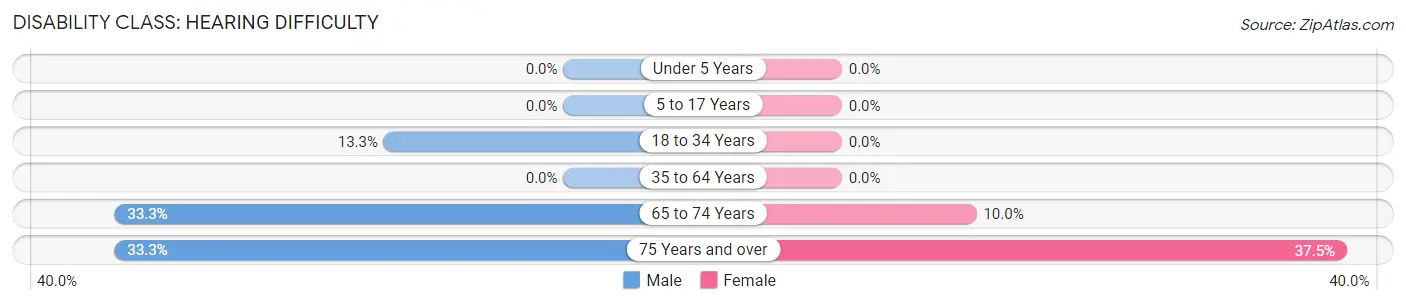
| Age Bracket | Male | Female |
| Under 5 Years | 0 (0.0%) | 0 (0.0%) |
| 5 to 17 Years | 0 (0.0%) | 0 (0.0%) |
| 18 to 34 Years | 4 (13.3%) | 0 (0.0%) |
| 35 to 64 Years | 0 (0.0%) | 0 (0.0%) |
| 65 to 74 Years | 4 (33.3%) | 1 (10.0%) |
| 75 Years and over | 5 (33.3%) | 3 (37.5%) |
Disability Class: Vision Difficulty
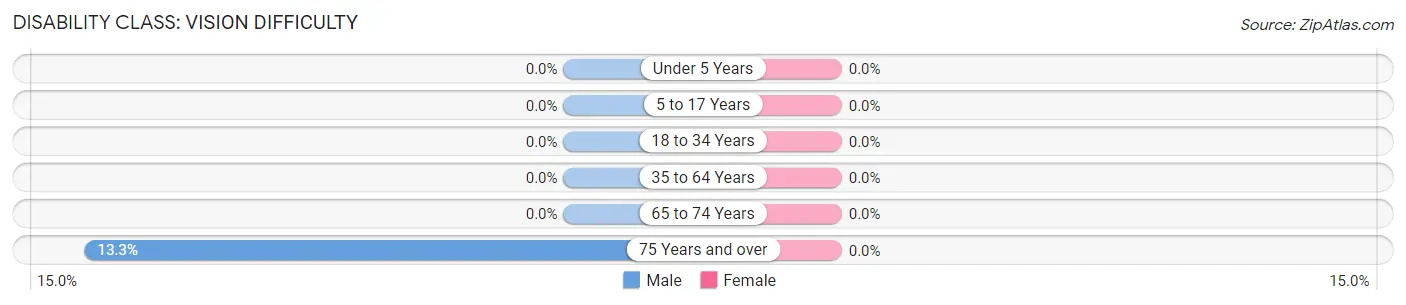
| Age Bracket | Male | Female |
| Under 5 Years | 0 (0.0%) | 0 (0.0%) |
| 5 to 17 Years | 0 (0.0%) | 0 (0.0%) |
| 18 to 34 Years | 0 (0.0%) | 0 (0.0%) |
| 35 to 64 Years | 0 (0.0%) | 0 (0.0%) |
| 65 to 74 Years | 0 (0.0%) | 0 (0.0%) |
| 75 Years and over | 2 (13.3%) | 0 (0.0%) |
Disability Class: Cognitive Difficulty
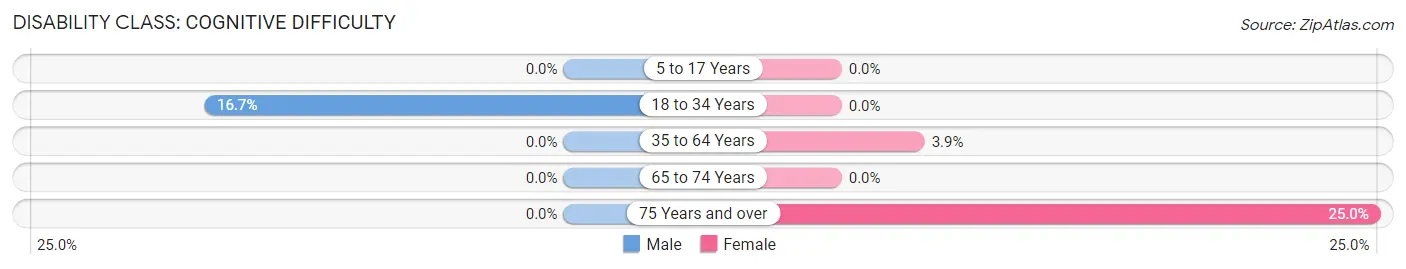
| Age Bracket | Male | Female |
| 5 to 17 Years | 0 (0.0%) | 0 (0.0%) |
| 18 to 34 Years | 5 (16.7%) | 0 (0.0%) |
| 35 to 64 Years | 0 (0.0%) | 1 (3.8%) |
| 65 to 74 Years | 0 (0.0%) | 0 (0.0%) |
| 75 Years and over | 0 (0.0%) | 2 (25.0%) |
Disability Class: Ambulatory Difficulty
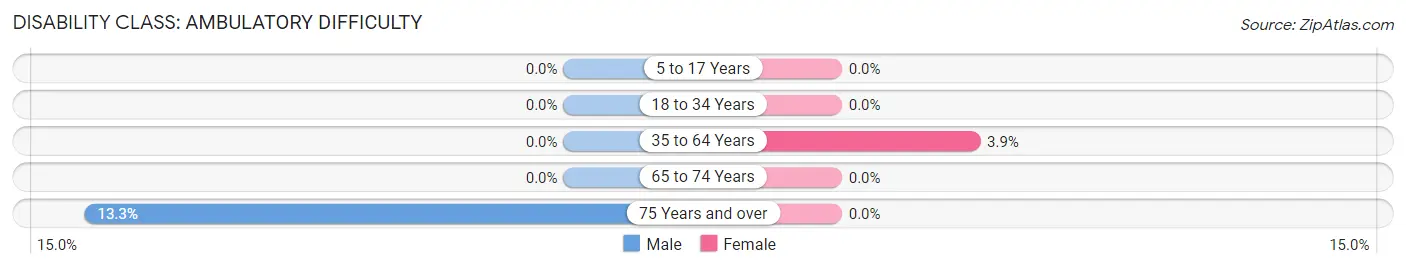
| Age Bracket | Male | Female |
| 5 to 17 Years | 0 (0.0%) | 0 (0.0%) |
| 18 to 34 Years | 0 (0.0%) | 0 (0.0%) |
| 35 to 64 Years | 0 (0.0%) | 1 (3.8%) |
| 65 to 74 Years | 0 (0.0%) | 0 (0.0%) |
| 75 Years and over | 2 (13.3%) | 0 (0.0%) |
Disability Class: Self-Care Difficulty
| Age Bracket | Male | Female |
| 5 to 17 Years | 0 (0.0%) | 0 (0.0%) |
| 18 to 34 Years | 0 (0.0%) | 0 (0.0%) |
| 35 to 64 Years | 0 (0.0%) | 0 (0.0%) |
| 65 to 74 Years | 0 (0.0%) | 0 (0.0%) |
| 75 Years and over | 0 (0.0%) | 0 (0.0%) |
Technology Access in Lake Lillian
Computing Device Access in Lake Lillian
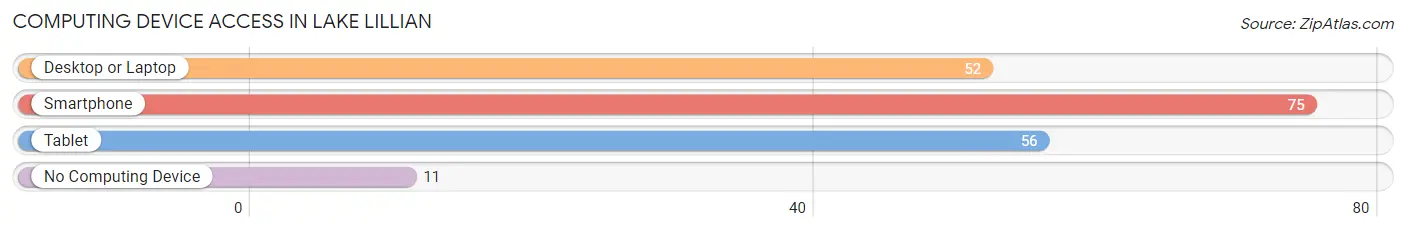
| Device Type | # Households | % Households |
| Desktop or Laptop | 52 | 55.9% |
| Smartphone | 75 | 80.6% |
| Tablet | 56 | 60.2% |
| No Computing Device | 11 | 11.8% |
| Total | 93 | 100.0% |
Internet Access in Lake Lillian
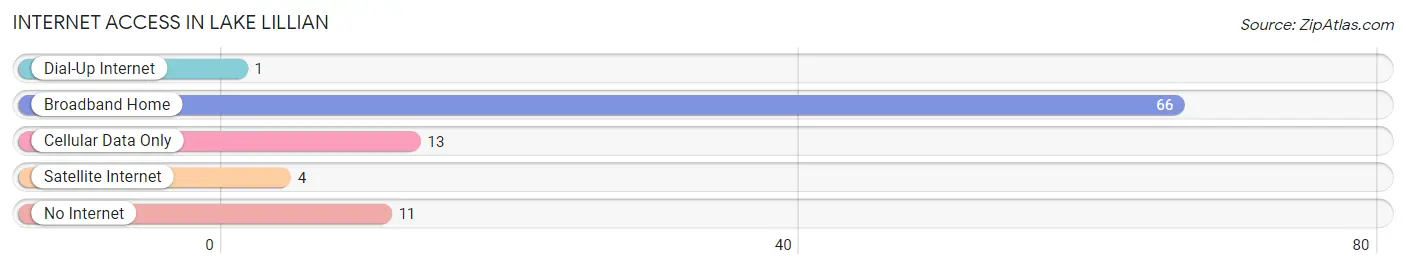
| Internet Type | # Households | % Households |
| Dial-Up Internet | 1 | 1.1% |
| Broadband Home | 66 | 71.0% |
| Cellular Data Only | 13 | 14.0% |
| Satellite Internet | 4 | 4.3% |
| No Internet | 11 | 11.8% |
| Total | 93 | 100.0% |
Lake Lillian Summary
Lake Lillian is a small city located in Kandiyohi County, Minnesota. It is situated on the western shore of Lake Lillian, a small lake of the same name. The city has a population of approximately 500 people and is located about 30 miles west of Willmar, the county seat.
History
The area around Lake Lillian was first settled in the late 1800s by Norwegian immigrants. The first settlers were attracted to the area by the abundance of fish and game in the lake and surrounding area. The first post office was established in 1887 and the town was officially incorporated in 1895.
The city was named after Lillian Anderson, the daughter of one of the first settlers. The city grew slowly over the years, but the population remained relatively small until the 1950s when the city began to experience a population boom. This was due to the construction of a dam on the lake, which created a larger lake and increased the number of recreational opportunities in the area.
Geography
Lake Lillian is located in the western part of Kandiyohi County, Minnesota. It is situated on the western shore of Lake Lillian, a small lake of the same name. The city is located about 30 miles west of Willmar, the county seat. The city is surrounded by farmland and is located near the edge of the Minnesota River Valley.
The city has a total area of 0.6 square miles, all of which is land. The elevation of the city is 1,072 feet above sea level. The climate of the area is characterized by warm summers and cold winters.
Economy
The economy of Lake Lillian is largely based on agriculture and tourism. The city is home to several small businesses, including a grocery store, a hardware store, and a few restaurants. The city also has a small marina on the lake, which provides access to the lake for recreational activities such as fishing and boating.
The city is also home to a number of small manufacturing businesses, including a woodworking shop and a metal fabrication shop. The city is also home to a number of small farms, which produce a variety of crops, including corn, soybeans, and wheat.
Demographics
As of the 2010 census, the population of Lake Lillian was 498 people. The racial makeup of the city was 97.2% White, 0.2% African American, 0.2% Native American, 0.2% Asian, 0.2% from other races, and 1.8% from two or more races. Hispanic or Latino of any race were 0.8% of the population.
The median income for a household in the city was $41,250, and the median income for a family was $45,000. The per capita income for the city was $18,945. About 8.2% of families and 10.2% of the population were below the poverty line, including 11.2% of those under age 18 and 8.2% of those age 65 or over.
Conclusion
Lake Lillian is a small city located in Kandiyohi County, Minnesota. It is situated on the western shore of Lake Lillian, a small lake of the same name. The city has a population of approximately 500 people and is located about 30 miles west of Willmar, the county seat. The economy of Lake Lillian is largely based on agriculture and tourism, and the city is home to several small businesses, including a grocery store, a hardware store, and a few restaurants. The racial makeup of the city is predominantly White, with a small percentage of African American, Native American, and Asian residents. The median income for a household in the city is $41,250, and the per capita income for the city is $18,945.
Common Questions
What is the Total Population of Lake Lillian?
Total Population of Lake Lillian is 201.
What is the Total Male Population of Lake Lillian?
Total Male Population of Lake Lillian is 109.
What is the Total Female Population of Lake Lillian?
Total Female Population of Lake Lillian is 92.
What is the Ratio of Males per 100 Females in Lake Lillian?
There are 118.48 Males per 100 Females in Lake Lillian.
What is the Ratio of Females per 100 Males in Lake Lillian?
There are 84.40 Females per 100 Males in Lake Lillian.
What is the Median Population Age in Lake Lillian?
Median Population Age in Lake Lillian is 53.6 Years.
What is the Average Family Size in Lake Lillian
Average Family Size in Lake Lillian is 2.6 People.
What is the Average Household Size in Lake Lillian
Average Household Size in Lake Lillian is 1.9 People.
What is Per Capita Income in Lake Lillian?
Per Capita income in Lake Lillian is $33,450.
What is the Median Family Income in Lake Lillian?
Median Family Income in Lake Lillian is $66,250.
What is the Median Household income in Lake Lillian?
Median Household Income in Lake Lillian is $61,250.
What is Income or Wage Gap in Lake Lillian?
Income or Wage Gap in Lake Lillian is 5.3%.
Women in Lake Lillian earn 94.7 cents for every dollar earned by a man.
What is Inequality or Gini Index in Lake Lillian?
Inequality or Gini Index in Lake Lillian is 0.40.
How Large is the Labor Force in Lake Lillian?
There are 107 People in the Labor Forcein in Lake Lillian.
What is the Percentage of People in the Labor Force in Lake Lillian?
60.8% of People are in the Labor Force in Lake Lillian.
What is the Unemployment Rate in Lake Lillian?
Unemployment Rate in Lake Lillian is 5.6%.