Hatfield, MN
Hatfield Map
Hatfield Overview
32
TOTAL POPULATION
14
MALE POPULATION
18
FEMALE POPULATION
77.78
MALES / 100 FEMALES
128.57
FEMALES / 100 MALES
32.7
MEDIAN AGE
3.2
AVG FAMILY SIZE
2.7
AVG HOUSEHOLD SIZE
$25,178
PER CAPITA INCOME
$84,250
AVG FAMILY INCOME
$83,500
AVG HOUSEHOLD INCOME
0.20
INEQUALITY / GINI INDEX
18
LABOR FORCE [ PEOPLE ]
85.7%
PERCENT IN LABOR FORCE
Hatfield Area Codes
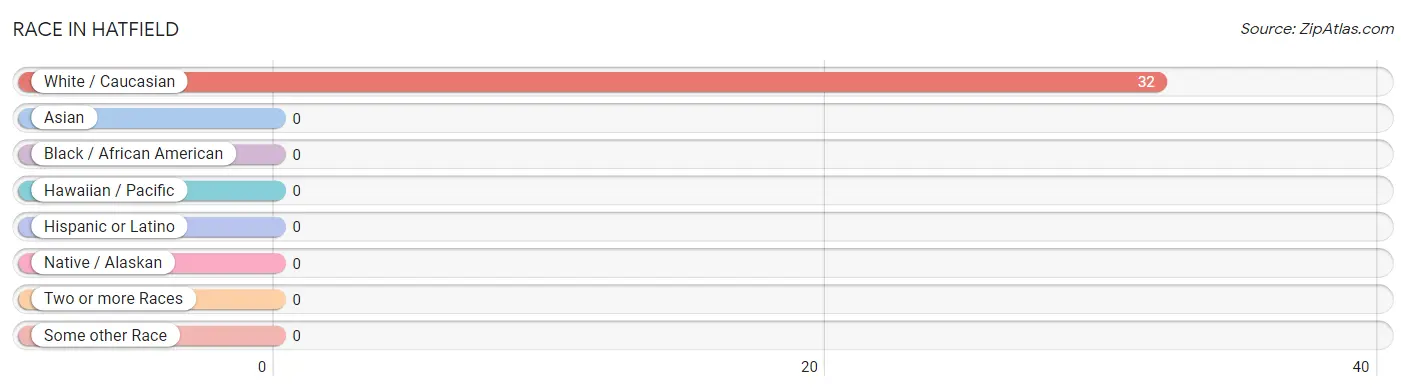
Race in Hatfield
The most populous races in Hatfield are , and White / Caucasian (32 | 100.0%).
| Race | # Population | % Population |
| Asian | 0 | 0.0% |
| Black / African American | 0 | 0.0% |
| Hawaiian / Pacific | 0 | 0.0% |
| Hispanic or Latino | 0 | 0.0% |
| Native / Alaskan | 0 | 0.0% |
| White / Caucasian | 32 | 100.0% |
| Two or more Races | 0 | 0.0% |
| Some other Race | 0 | 0.0% |
| Total | 32 | 100.0% |
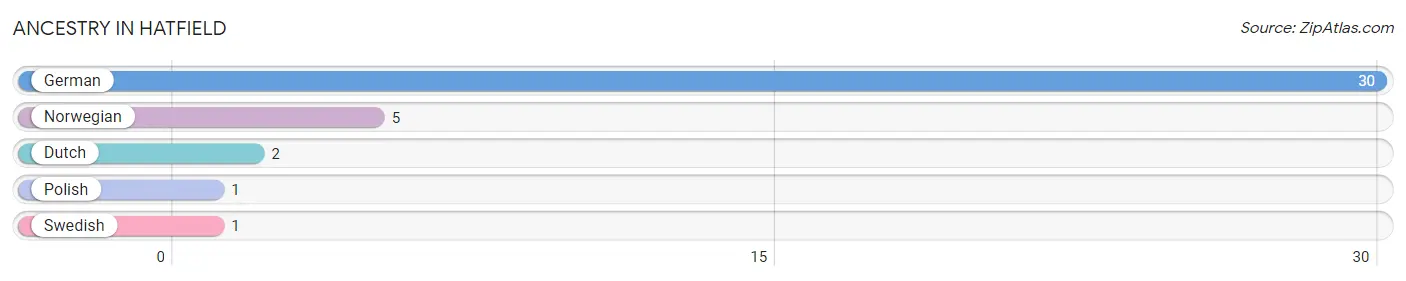
Ancestry in Hatfield
The most populous ancestries reported in Hatfield are German (30 | 93.8%), Norwegian (5 | 15.6%), Dutch (2 | 6.2%), Polish (1 | 3.1%), and Swedish (1 | 3.1%), together accounting for 121.9% of all Hatfield residents.
| Ancestry | # Population | % Population |
| Dutch | 2 | 6.2% |
| German | 30 | 93.8% |
| Norwegian | 5 | 15.6% |
| Polish | 1 | 3.1% |
| Swedish | 1 | 3.1% | View All 5 Rows |
Immigrants in Hatfield

| Immigration Origin | # Population | % Population | View All 0 Rows |
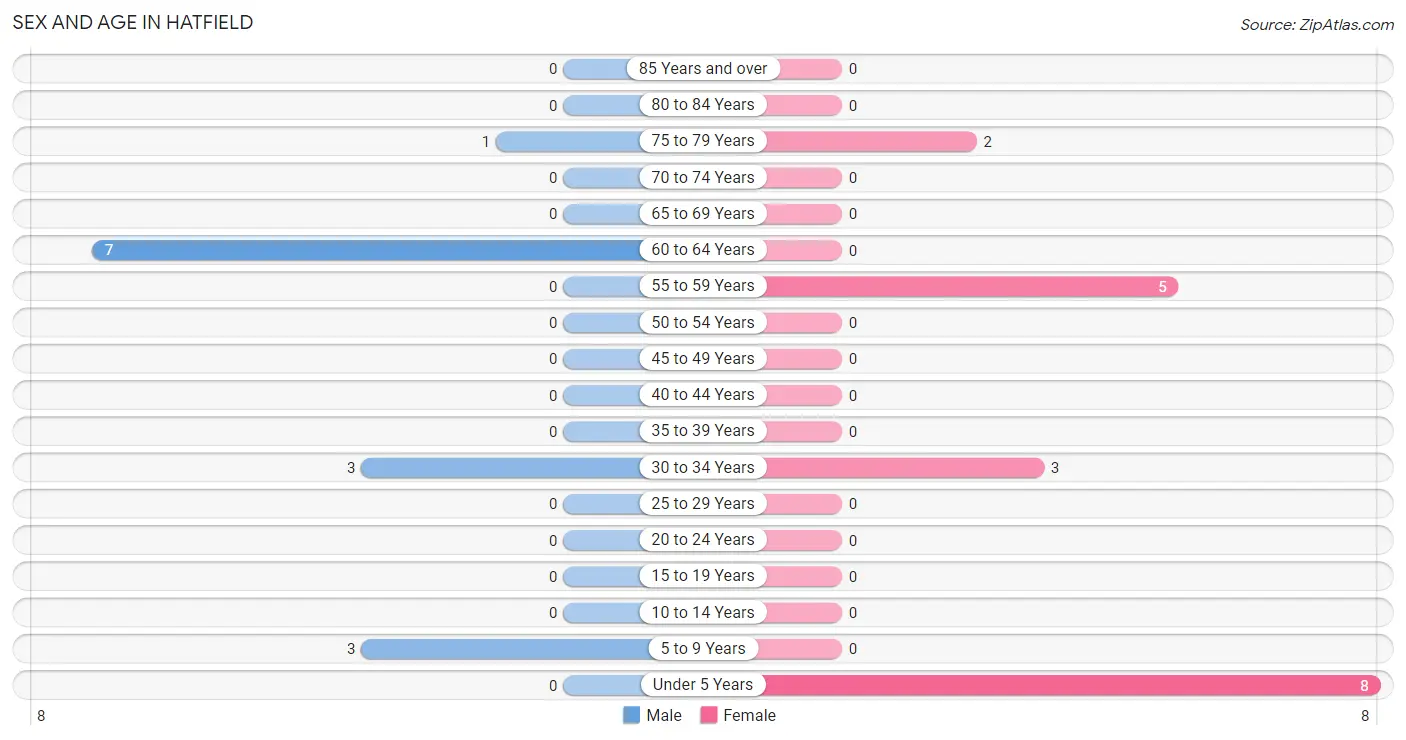
Sex and Age in Hatfield
Sex and Age in Hatfield
The most populous age groups in Hatfield are 60 to 64 Years (7 | 50.0%) for men and Under 5 Years (8 | 44.4%) for women.
| Age Bracket | Male | Female |
| Under 5 Years | 0 (0.0%) | 8 (44.4%) |
| 5 to 9 Years | 3 (21.4%) | 0 (0.0%) |
| 10 to 14 Years | 0 (0.0%) | 0 (0.0%) |
| 15 to 19 Years | 0 (0.0%) | 0 (0.0%) |
| 20 to 24 Years | 0 (0.0%) | 0 (0.0%) |
| 25 to 29 Years | 0 (0.0%) | 0 (0.0%) |
| 30 to 34 Years | 3 (21.4%) | 3 (16.7%) |
| 35 to 39 Years | 0 (0.0%) | 0 (0.0%) |
| 40 to 44 Years | 0 (0.0%) | 0 (0.0%) |
| 45 to 49 Years | 0 (0.0%) | 0 (0.0%) |
| 50 to 54 Years | 0 (0.0%) | 0 (0.0%) |
| 55 to 59 Years | 0 (0.0%) | 5 (27.8%) |
| 60 to 64 Years | 7 (50.0%) | 0 (0.0%) |
| 65 to 69 Years | 0 (0.0%) | 0 (0.0%) |
| 70 to 74 Years | 0 (0.0%) | 0 (0.0%) |
| 75 to 79 Years | 1 (7.1%) | 2 (11.1%) |
| 80 to 84 Years | 0 (0.0%) | 0 (0.0%) |
| 85 Years and over | 0 (0.0%) | 0 (0.0%) |
| Total | 14 (100.0%) | 18 (100.0%) |
Families and Households in Hatfield
Median Family Size in Hatfield
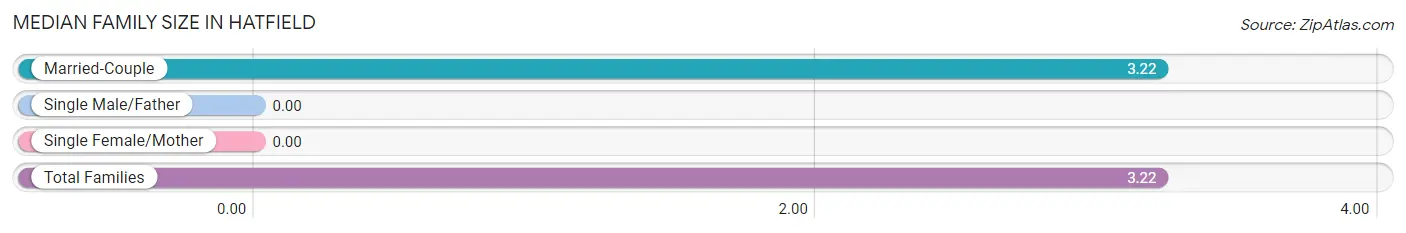
| Family Type | # Families | Family Size |
| Married-Couple | 9 (100.0%) | 3.22 |
| Single Male/Father | 0 (0.0%) | - |
| Single Female/Mother | 0 (0.0%) | - |
| Total Families | 9 (100.0%) | 3.22 |
Median Household Size in Hatfield
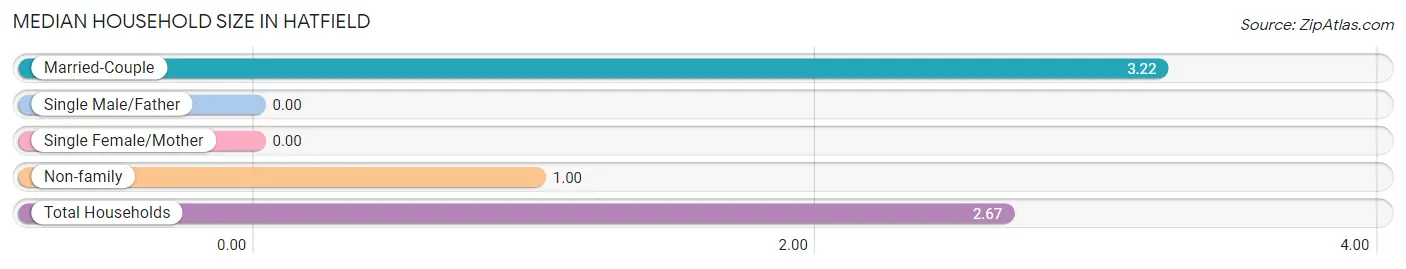
| Household Type | # Households | Household Size |
| Married-Couple | 9 (75.0%) | 3.22 |
| Single Male/Father | 0 (0.0%) | - |
| Single Female/Mother | 0 (0.0%) | - |
| Non-family | 3 (25.0%) | 1.00 |
| Total Households | 12 (100.0%) | 2.67 |
Household Size by Marriage Status in Hatfield
Out of a total of 12 households in Hatfield, 9 (75.0%) are family households, while 3 (25.0%) are nonfamily households. The most numerous type of family households are 2-person households, comprising 6, and the most common type of nonfamily households are 1-person households, comprising 3.
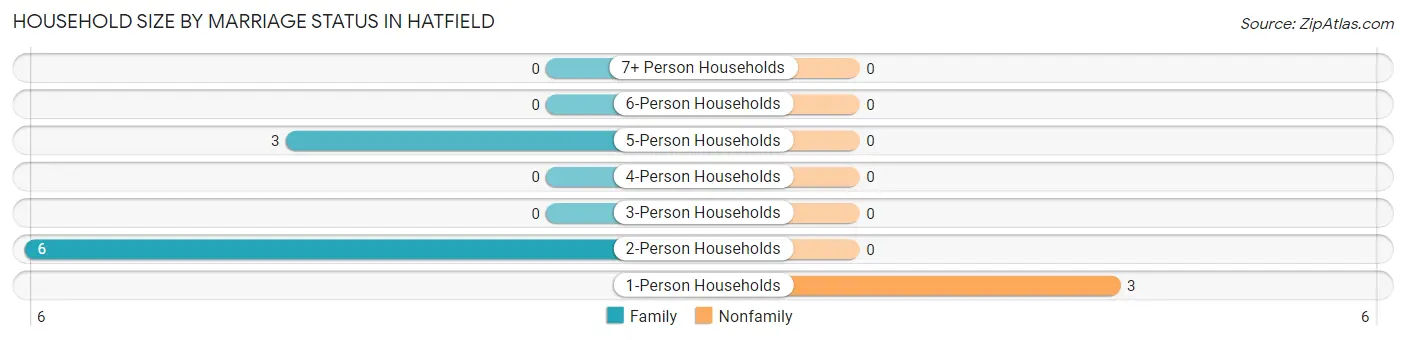
| Household Size | Family Households | Nonfamily Households |
| 1-Person Households | - | 3 (25.0%) |
| 2-Person Households | 6 (50.0%) | 0 (0.0%) |
| 3-Person Households | 0 (0.0%) | 0 (0.0%) |
| 4-Person Households | 0 (0.0%) | 0 (0.0%) |
| 5-Person Households | 3 (25.0%) | 0 (0.0%) |
| 6-Person Households | 0 (0.0%) | 0 (0.0%) |
| 7+ Person Households | 0 (0.0%) | 0 (0.0%) |
| Total | 9 (75.0%) | 3 (25.0%) |
Female Fertility in Hatfield
Fertility by Age in Hatfield
| Age Bracket | Women with Births | Births / 1,000 Women |
| 15 to 19 years | 0 (0.0%) | 0.0 |
| 20 to 34 years | 0 (0.0%) | 0.0 |
| 35 to 50 years | 0 (0.0%) | 0.0 |
| Total | 0 (0.0%) | 0.0 |
Fertility by Age by Marriage Status in Hatfield
| Age Bracket | Married | Unmarried |
| 15 to 19 years | 0 (0.0%) | 0 (0.0%) |
| 20 to 34 years | 0 (0.0%) | 0 (0.0%) |
| 35 to 50 years | 0 (0.0%) | 0 (0.0%) |
| Total | 0 (0.0%) | 0 (0.0%) |
Fertility by Education in Hatfield
| Educational Attainment | Women with Births | Births / 1,000 Women |
| Less than High School | 0 (0.0%) | 0.0 |
| High School Diploma | 0 (0.0%) | 0.0 |
| College or Associate's Degree | 0 (0.0%) | 0.0 |
| Bachelor's Degree | 0 (0.0%) | 0.0 |
| Graduate Degree | 0 (0.0%) | 0.0 |
| Total | 0 (0.0%) | 0.0 |
Fertility by Education by Marriage Status in Hatfield
| Educational Attainment | Married | Unmarried |
| Less than High School | 0 (0.0%) | 0 (0.0%) |
| High School Diploma | 0 (0.0%) | 0 (0.0%) |
| College or Associate's Degree | 0 (0.0%) | 0 (0.0%) |
| Bachelor's Degree | 0 (0.0%) | 0 (0.0%) |
| Graduate Degree | 0 (0.0%) | 0 (0.0%) |
| Total | 0 (0.0%) | 0 (0.0%) |
Income in Hatfield
Income Overview in Hatfield
Per Capita Income in Hatfield is $25,178, while median incomes of families and households are $84,250 and $83,500 respectively.
| Characteristic | Number | Measure |
| Per Capita Income | 32 | $25,178 |
| Median Family Income | 9 | $84,250 |
| Mean Family Income | 9 | $81,967 |
| Median Household Income | 12 | $83,500 |
| Mean Household Income | 12 | $67,142 |
| Income Deficit | 9 | $0 |
| Wage / Income Gap (%) | 32 | 0.00% |
| Wage / Income Gap ($) | 32 | 100.00¢ per $1 |
| Gini / Inequality Index | 32 | 0.20 |
Earnings by Sex in Hatfield
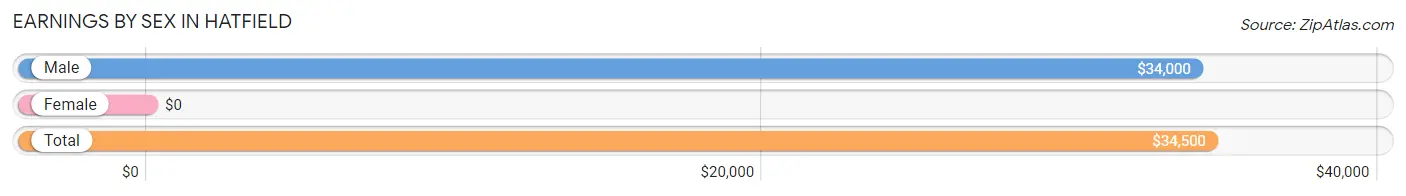
| Sex | Number | Average Earnings |
| Male | 10 (55.6%) | $34,000 |
| Female | 8 (44.4%) | $0 |
| Total | 18 (100.0%) | $34,500 |
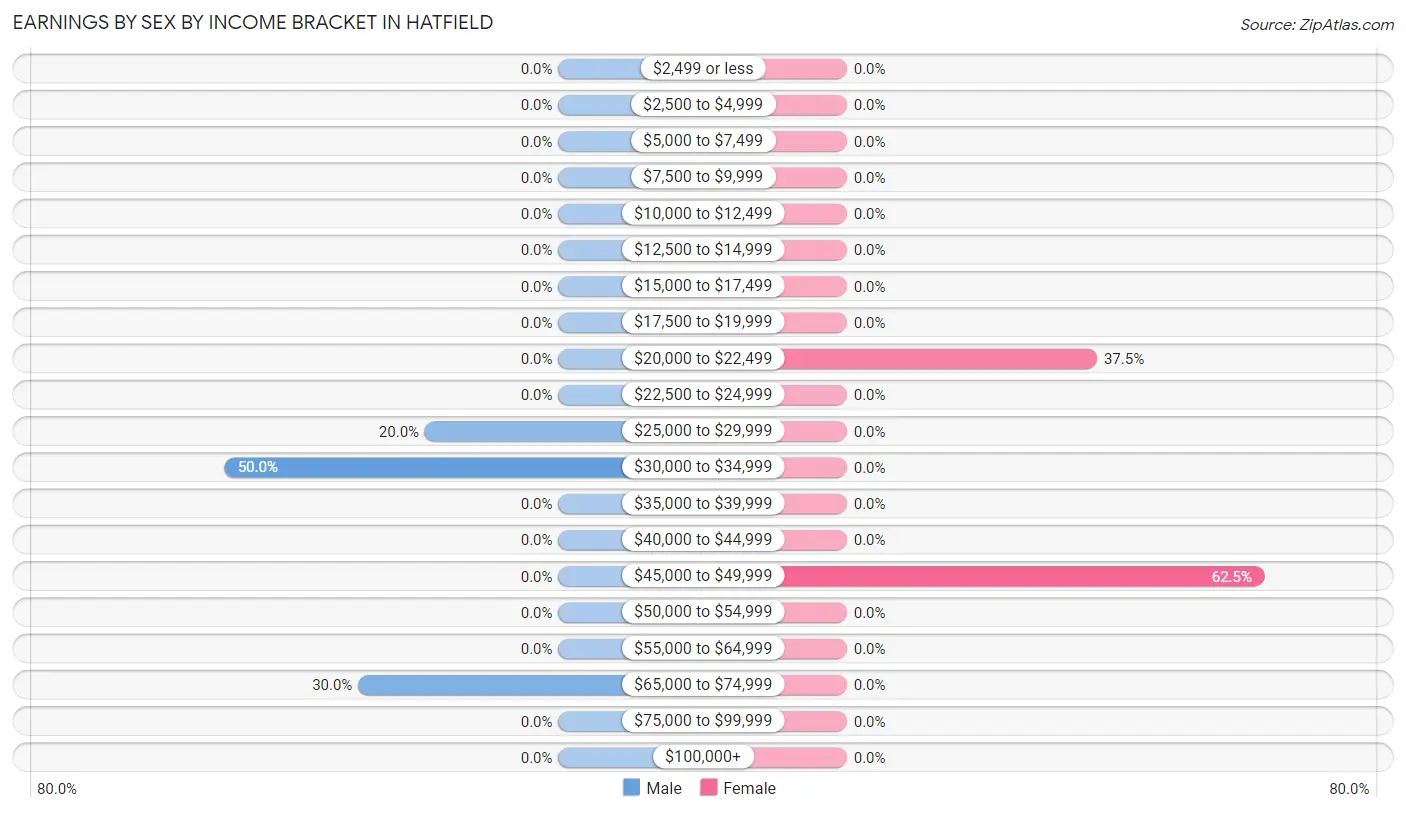
Earnings by Sex by Income Bracket in Hatfield
The most common earnings brackets in Hatfield are $30,000 to $34,999 for men (5 | 50.0%) and $45,000 to $49,999 for women (5 | 62.5%).
| Income | Male | Female |
| $2,499 or less | 0 (0.0%) | 0 (0.0%) |
| $2,500 to $4,999 | 0 (0.0%) | 0 (0.0%) |
| $5,000 to $7,499 | 0 (0.0%) | 0 (0.0%) |
| $7,500 to $9,999 | 0 (0.0%) | 0 (0.0%) |
| $10,000 to $12,499 | 0 (0.0%) | 0 (0.0%) |
| $12,500 to $14,999 | 0 (0.0%) | 0 (0.0%) |
| $15,000 to $17,499 | 0 (0.0%) | 0 (0.0%) |
| $17,500 to $19,999 | 0 (0.0%) | 0 (0.0%) |
| $20,000 to $22,499 | 0 (0.0%) | 3 (37.5%) |
| $22,500 to $24,999 | 0 (0.0%) | 0 (0.0%) |
| $25,000 to $29,999 | 2 (20.0%) | 0 (0.0%) |
| $30,000 to $34,999 | 5 (50.0%) | 0 (0.0%) |
| $35,000 to $39,999 | 0 (0.0%) | 0 (0.0%) |
| $40,000 to $44,999 | 0 (0.0%) | 0 (0.0%) |
| $45,000 to $49,999 | 0 (0.0%) | 5 (62.5%) |
| $50,000 to $54,999 | 0 (0.0%) | 0 (0.0%) |
| $55,000 to $64,999 | 0 (0.0%) | 0 (0.0%) |
| $65,000 to $74,999 | 3 (30.0%) | 0 (0.0%) |
| $75,000 to $99,999 | 0 (0.0%) | 0 (0.0%) |
| $100,000+ | 0 (0.0%) | 0 (0.0%) |
| Total | 10 (100.0%) | 8 (100.0%) |
Earnings by Sex by Educational Attainment in Hatfield
| Educational Attainment | Male Income | Female Income |
| Less than High School | - | - |
| High School Diploma | - | - |
| College or Associate's Degree | - | - |
| Bachelor's Degree | - | - |
| Graduate Degree | - | - |
| Total | $34,000 | $0 |
Family Income in Hatfield
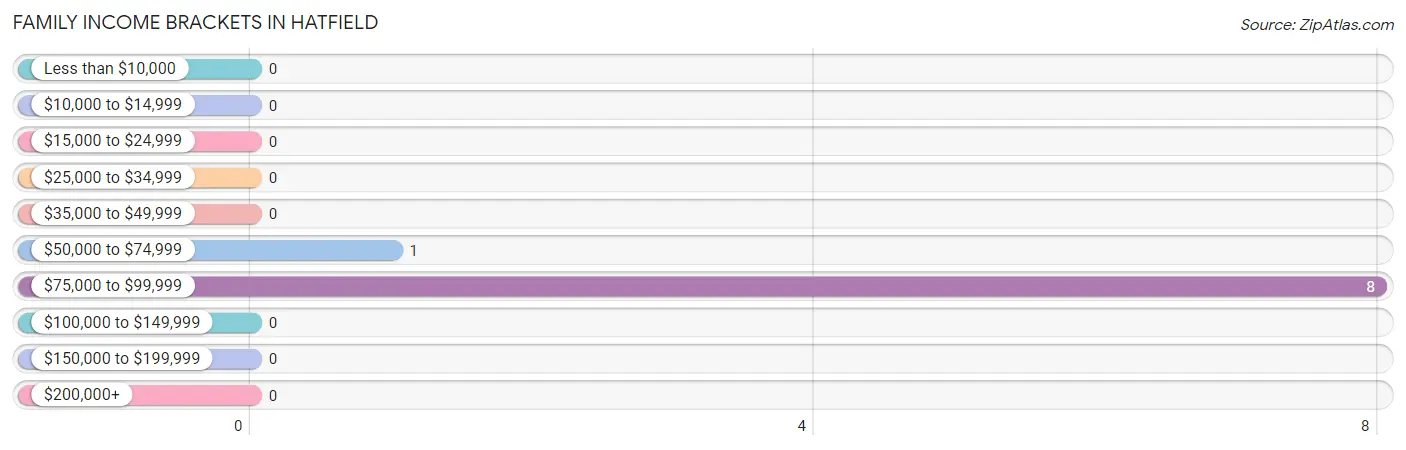
Family Income Brackets in Hatfield
According to the Hatfield family income data, there are 8 families falling into the $75,000 to $99,999 income range, which is the most common income bracket and makes up 88.9% of all families.
| Income Bracket | # Families | % Families |
| Less than $10,000 | 0 | 0.0% |
| $10,000 to $14,999 | 0 | 0.0% |
| $15,000 to $24,999 | 0 | 0.0% |
| $25,000 to $34,999 | 0 | 0.0% |
| $35,000 to $49,999 | 0 | 0.0% |
| $50,000 to $74,999 | 1 | 11.1% |
| $75,000 to $99,999 | 8 | 88.9% |
| $100,000 to $149,999 | 0 | 0.0% |
| $150,000 to $199,999 | 0 | 0.0% |
| $200,000+ | 0 | 0.0% |
Family Income by Famaliy Size in Hatfield
| Income Bracket | # Families | Median Income |
| 2-Person Families | 6 (66.7%) | $0 |
| 3-Person Families | 0 (0.0%) | $0 |
| 4-Person Families | 0 (0.0%) | $0 |
| 5-Person Families | 3 (33.3%) | $0 |
| 6-Person Families | 0 (0.0%) | $0 |
| 7+ Person Families | 0 (0.0%) | $0 |
| Total | 9 (100.0%) | $84,250 |
Family Income by Number of Earners in Hatfield
| Number of Earners | # Families | Median Income |
| No Earners | 1 (11.1%) | $0 |
| 1 Earner | 0 (0.0%) | $0 |
| 2 Earners | 8 (88.9%) | $0 |
| 3+ Earners | 0 (0.0%) | $0 |
| Total | 9 (100.0%) | $84,250 |
Household Income in Hatfield
Household Income Brackets in Hatfield
With 8 households falling in the category, the $75,000 to $99,999 income range is the most frequent in Hatfield, accounting for 66.7% of all households.
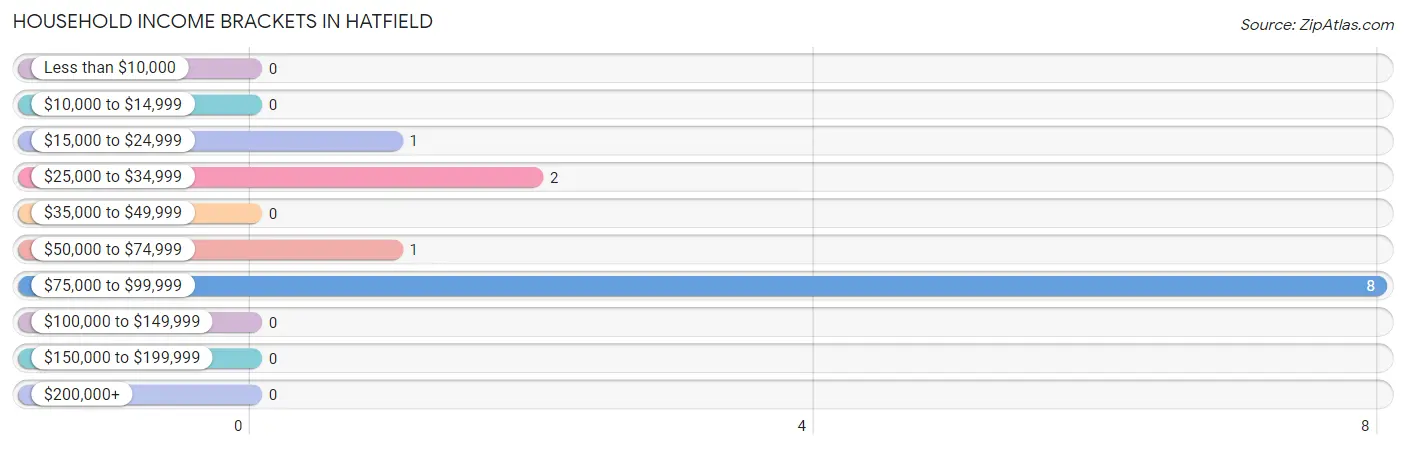
| Income Bracket | # Households | % Households |
| Less than $10,000 | 0 | 0.0% |
| $10,000 to $14,999 | 0 | 0.0% |
| $15,000 to $24,999 | 1 | 8.3% |
| $25,000 to $34,999 | 2 | 16.7% |
| $35,000 to $49,999 | 0 | 0.0% |
| $50,000 to $74,999 | 1 | 8.3% |
| $75,000 to $99,999 | 8 | 66.7% |
| $100,000 to $149,999 | 0 | 0.0% |
| $150,000 to $199,999 | 0 | 0.0% |
| $200,000+ | 0 | 0.0% |
Household Income by Householder Age in Hatfield
| Income Bracket | # Households | Median Income |
| 15 to 24 Years | 0 (0.0%) | $0 |
| 25 to 44 Years | 3 (25.0%) | $0 |
| 45 to 64 Years | 7 (58.3%) | $0 |
| 65+ Years | 2 (16.7%) | $0 |
| Total | 12 (100.0%) | $83,500 |
Poverty in Hatfield
Income Below Poverty by Sex and Age in Hatfield
| Age Bracket | Male | Female |
| Under 5 Years | 0 (0.0%) | 0 (0.0%) |
| 5 Years | 0 (0.0%) | 0 (0.0%) |
| 6 to 11 Years | 0 (0.0%) | 0 (0.0%) |
| 12 to 14 Years | 0 (0.0%) | 0 (0.0%) |
| 15 Years | 0 (0.0%) | 0 (0.0%) |
| 16 and 17 Years | 0 (0.0%) | 0 (0.0%) |
| 18 to 24 Years | 0 (0.0%) | 0 (0.0%) |
| 25 to 34 Years | 0 (0.0%) | 0 (0.0%) |
| 35 to 44 Years | 0 (0.0%) | 0 (0.0%) |
| 45 to 54 Years | 0 (0.0%) | 0 (0.0%) |
| 55 to 64 Years | 0 (0.0%) | 0 (0.0%) |
| 65 to 74 Years | 0 (0.0%) | 0 (0.0%) |
| 75 Years and over | 0 (0.0%) | 0 (0.0%) |
| Total | 0 (0.0%) | 0 (0.0%) |
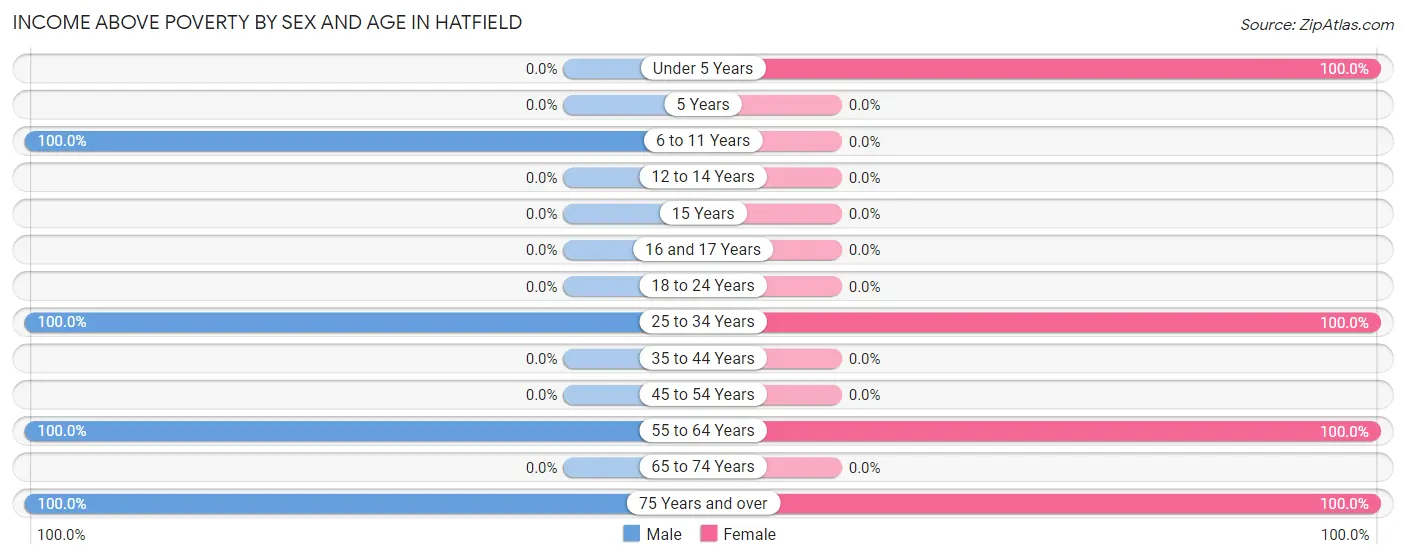
Income Above Poverty by Sex and Age in Hatfield
According to the poverty statistics in Hatfield, males aged 6 to 11 years and females aged under 5 years are the age groups that are most secure financially, with 100.0% of males and 100.0% of females in these age groups living above the poverty line.
| Age Bracket | Male | Female |
| Under 5 Years | 0 (0.0%) | 8 (100.0%) |
| 5 Years | 0 (0.0%) | 0 (0.0%) |
| 6 to 11 Years | 3 (100.0%) | 0 (0.0%) |
| 12 to 14 Years | 0 (0.0%) | 0 (0.0%) |
| 15 Years | 0 (0.0%) | 0 (0.0%) |
| 16 and 17 Years | 0 (0.0%) | 0 (0.0%) |
| 18 to 24 Years | 0 (0.0%) | 0 (0.0%) |
| 25 to 34 Years | 3 (100.0%) | 3 (100.0%) |
| 35 to 44 Years | 0 (0.0%) | 0 (0.0%) |
| 45 to 54 Years | 0 (0.0%) | 0 (0.0%) |
| 55 to 64 Years | 7 (100.0%) | 5 (100.0%) |
| 65 to 74 Years | 0 (0.0%) | 0 (0.0%) |
| 75 Years and over | 1 (100.0%) | 2 (100.0%) |
| Total | 14 (100.0%) | 18 (100.0%) |
Income Below Poverty Among Married-Couple Families in Hatfield
| Children | Above Poverty | Below Poverty |
| No Children | 6 (100.0%) | 0 (0.0%) |
| 1 or 2 Children | 0 (0.0%) | 0 (0.0%) |
| 3 or 4 Children | 3 (100.0%) | 0 (0.0%) |
| 5 or more Children | 0 (0.0%) | 0 (0.0%) |
| Total | 9 (100.0%) | 0 (0.0%) |
Income Below Poverty Among Single-Parent Households in Hatfield
| Children | Single Father | Single Mother |
| No Children | 0 (0.0%) | 0 (0.0%) |
| 1 or 2 Children | 0 (0.0%) | 0 (0.0%) |
| 3 or 4 Children | 0 (0.0%) | 0 (0.0%) |
| 5 or more Children | 0 (0.0%) | 0 (0.0%) |
| Total | 0 (0.0%) | 0 (0.0%) |
Income Below Poverty Among Married-Couple vs Single-Parent Households in Hatfield
| Children | Married-Couple Families | Single-Parent Households |
| No Children | 0 (0.0%) | 0 (0.0%) |
| 1 or 2 Children | 0 (0.0%) | 0 (0.0%) |
| 3 or 4 Children | 0 (0.0%) | 0 (0.0%) |
| 5 or more Children | 0 (0.0%) | 0 (0.0%) |
| Total | 0 (0.0%) | 0 (0.0%) |
Employment Characteristics in Hatfield
Employment by Class of Employer in Hatfield
Among the 18 employed individuals in Hatfield, private company employees (11 | 61.1%), self-employed (not incorporated) (5 | 27.8%), and self-employed (incorporated) (2 | 11.1%) make up the most common classes of employment.
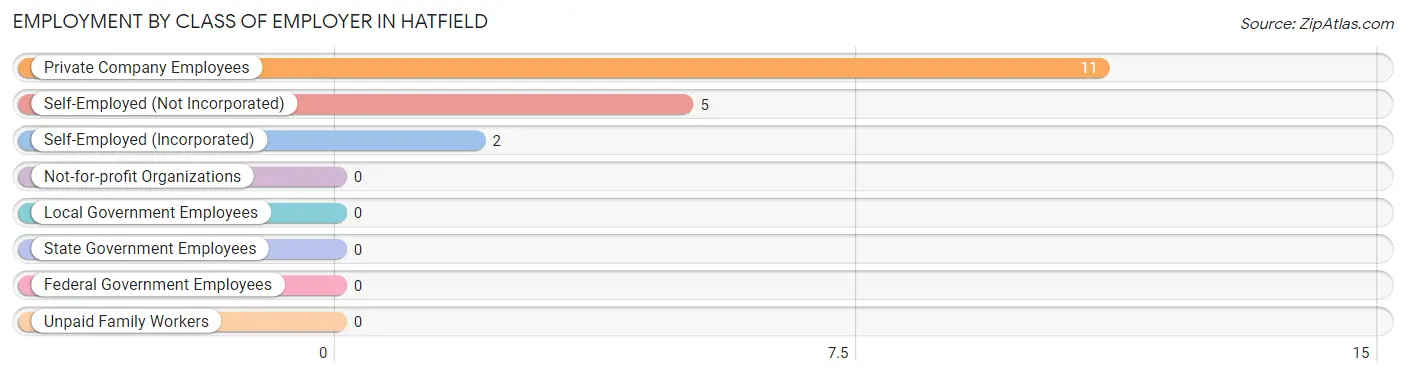
| Employer Class | # Employees | % Employees |
| Private Company Employees | 11 | 61.1% |
| Self-Employed (Incorporated) | 2 | 11.1% |
| Self-Employed (Not Incorporated) | 5 | 27.8% |
| Not-for-profit Organizations | 0 | 0.0% |
| Local Government Employees | 0 | 0.0% |
| State Government Employees | 0 | 0.0% |
| Federal Government Employees | 0 | 0.0% |
| Unpaid Family Workers | 0 | 0.0% |
| Total | 18 | 100.0% |
Employment Status by Age in Hatfield
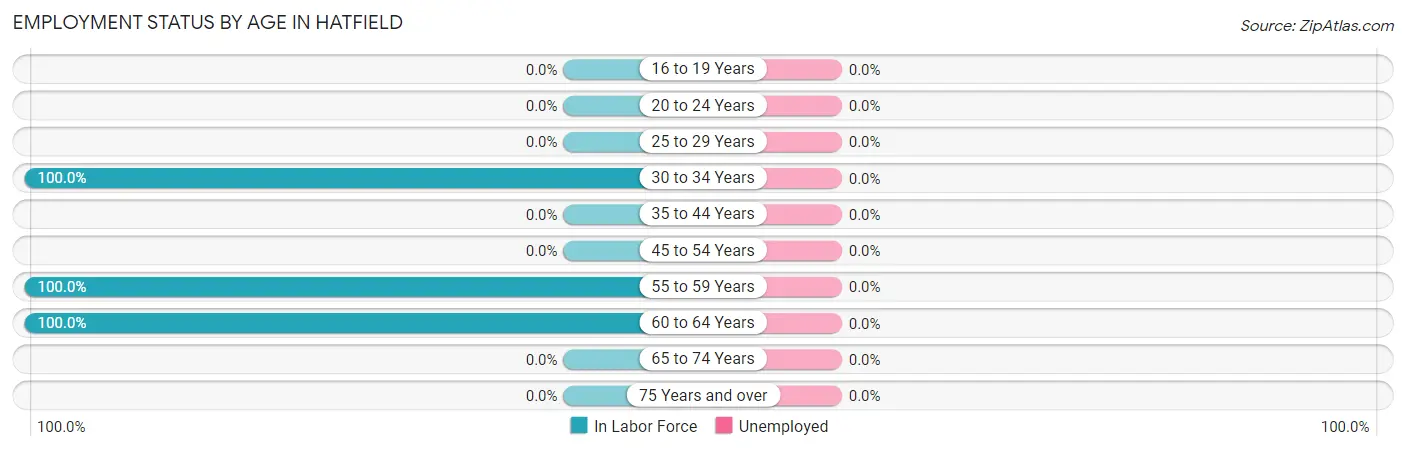
| Age Bracket | In Labor Force | Unemployed |
| 16 to 19 Years | 0 (0.0%) | 0 (0.0%) |
| 20 to 24 Years | 0 (0.0%) | 0 (0.0%) |
| 25 to 29 Years | 0 (0.0%) | 0 (0.0%) |
| 30 to 34 Years | 6 (100.0%) | 0 (0.0%) |
| 35 to 44 Years | 0 (0.0%) | 0 (0.0%) |
| 45 to 54 Years | 0 (0.0%) | 0 (0.0%) |
| 55 to 59 Years | 5 (100.0%) | 0 (0.0%) |
| 60 to 64 Years | 7 (100.0%) | 0 (0.0%) |
| 65 to 74 Years | 0 (0.0%) | 0 (0.0%) |
| 75 Years and over | 0 (0.0%) | 0 (0.0%) |
| Total | 18 (85.7%) | 0 (0.0%) |
Employment Status by Educational Attainment in Hatfield
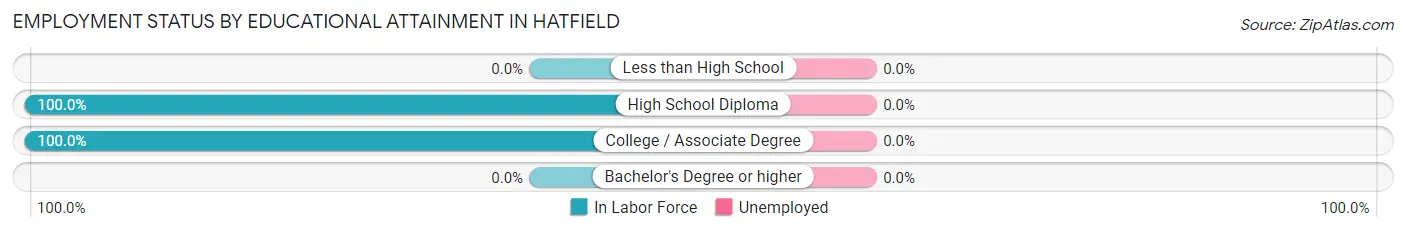
| Educational Attainment | In Labor Force | Unemployed |
| Less than High School | 0 (0.0%) | 0 (0.0%) |
| High School Diploma | 10 (100.0%) | 0 (0.0%) |
| College / Associate Degree | 8 (100.0%) | 0 (0.0%) |
| Bachelor's Degree or higher | 0 (0.0%) | 0 (0.0%) |
| Total | 18 (100.0%) | 0 (0.0%) |
Employment Occupations by Sex in Hatfield
Management, Business, Science and Arts Occupations
The most common Management, Business, Science and Arts occupations in Hatfield are Management (12 | 66.7%), Health Diagnosing & Treating (3 | 16.7%), and Health Technologists (3 | 16.7%).
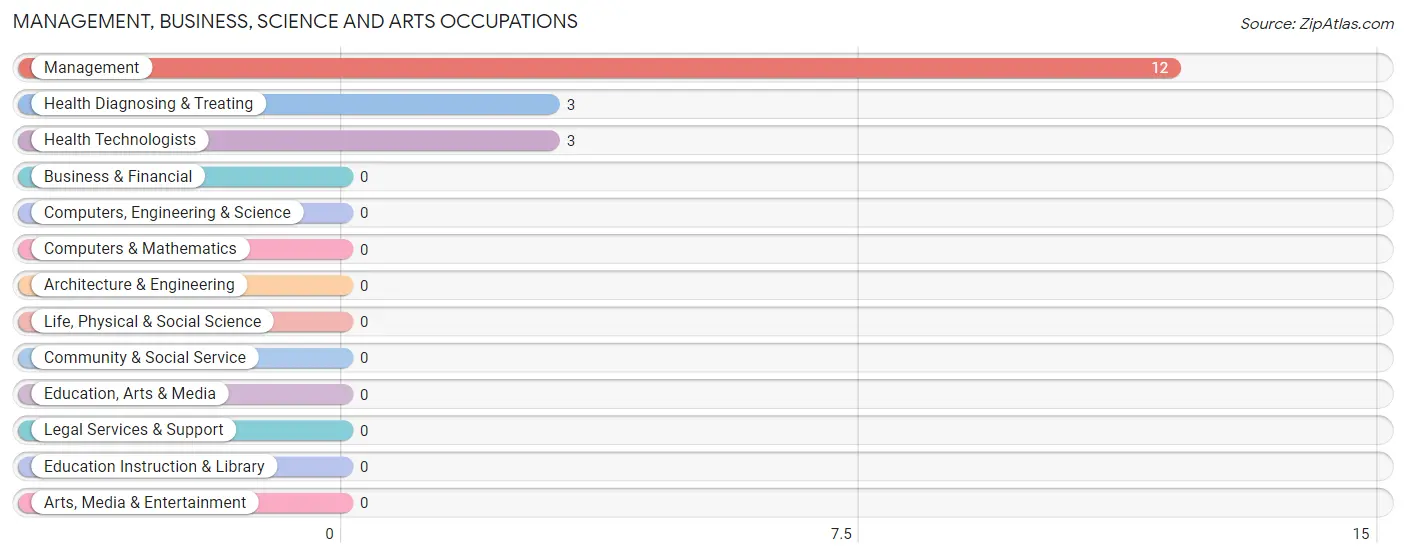
Management, Business, Science and Arts Occupations by Sex
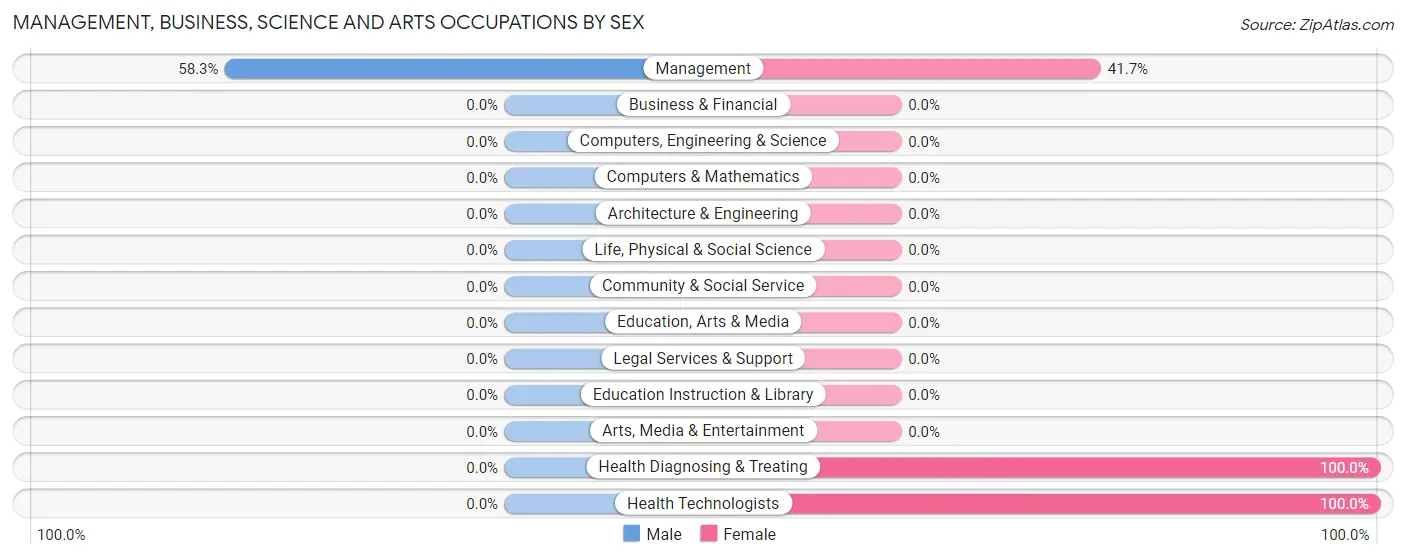
| Occupation | Male | Female |
| Management | 7 (58.3%) | 5 (41.7%) |
| Business & Financial | 0 (0.0%) | 0 (0.0%) |
| Computers, Engineering & Science | 0 (0.0%) | 0 (0.0%) |
| Computers & Mathematics | 0 (0.0%) | 0 (0.0%) |
| Architecture & Engineering | 0 (0.0%) | 0 (0.0%) |
| Life, Physical & Social Science | 0 (0.0%) | 0 (0.0%) |
| Community & Social Service | 0 (0.0%) | 0 (0.0%) |
| Education, Arts & Media | 0 (0.0%) | 0 (0.0%) |
| Legal Services & Support | 0 (0.0%) | 0 (0.0%) |
| Education Instruction & Library | 0 (0.0%) | 0 (0.0%) |
| Arts, Media & Entertainment | 0 (0.0%) | 0 (0.0%) |
| Health Diagnosing & Treating | 0 (0.0%) | 3 (100.0%) |
| Health Technologists | 0 (0.0%) | 3 (100.0%) |
| Total (Category) | 7 (46.7%) | 8 (53.3%) |
| Total (Overall) | 10 (55.6%) | 8 (44.4%) |
Services Occupations
Services Occupations by Sex
| Occupation | Male | Female |
| Healthcare Support | 0 (0.0%) | 0 (0.0%) |
| Security & Protection | 0 (0.0%) | 0 (0.0%) |
| Firefighting & Prevention | 0 (0.0%) | 0 (0.0%) |
| Law Enforcement | 0 (0.0%) | 0 (0.0%) |
| Food Preparation & Serving | 0 (0.0%) | 0 (0.0%) |
| Cleaning & Maintenance | 0 (0.0%) | 0 (0.0%) |
| Personal Care & Service | 0 (0.0%) | 0 (0.0%) |
| Total (Category) | 0 (0.0%) | 0 (0.0%) |
| Total (Overall) | 10 (55.6%) | 8 (44.4%) |
Sales and Office Occupations
Sales and Office Occupations by Sex
| Occupation | Male | Female |
| Sales & Related | 0 (0.0%) | 0 (0.0%) |
| Office & Administration | 0 (0.0%) | 0 (0.0%) |
| Total (Category) | 0 (0.0%) | 0 (0.0%) |
| Total (Overall) | 10 (55.6%) | 8 (44.4%) |
Natural Resources, Construction and Maintenance Occupations
Natural Resources, Construction and Maintenance Occupations by Sex
| Occupation | Male | Female |
| Farming, Fishing & Forestry | 0 (0.0%) | 0 (0.0%) |
| Construction & Extraction | 0 (0.0%) | 0 (0.0%) |
| Installation, Maintenance & Repair | 0 (0.0%) | 0 (0.0%) |
| Total (Category) | 0 (0.0%) | 0 (0.0%) |
| Total (Overall) | 10 (55.6%) | 8 (44.4%) |
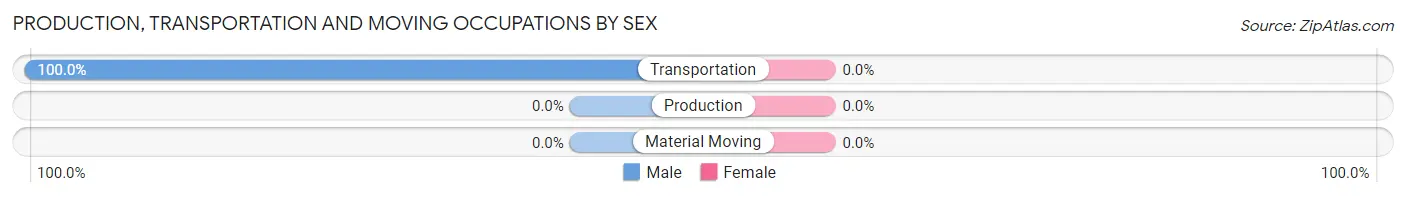
Production, Transportation and Moving Occupations
The most common Production, Transportation and Moving occupations in Hatfield are , and Transportation (3 | 16.7%).
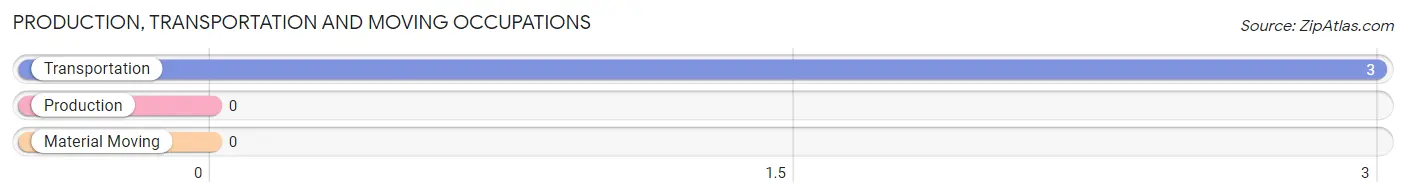
Production, Transportation and Moving Occupations by Sex
| Occupation | Male | Female |
| Production | 0 (0.0%) | 0 (0.0%) |
| Transportation | 3 (100.0%) | 0 (0.0%) |
| Material Moving | 0 (0.0%) | 0 (0.0%) |
| Total (Category) | 3 (100.0%) | 0 (0.0%) |
| Total (Overall) | 10 (55.6%) | 8 (44.4%) |
Employment Industries by Sex in Hatfield
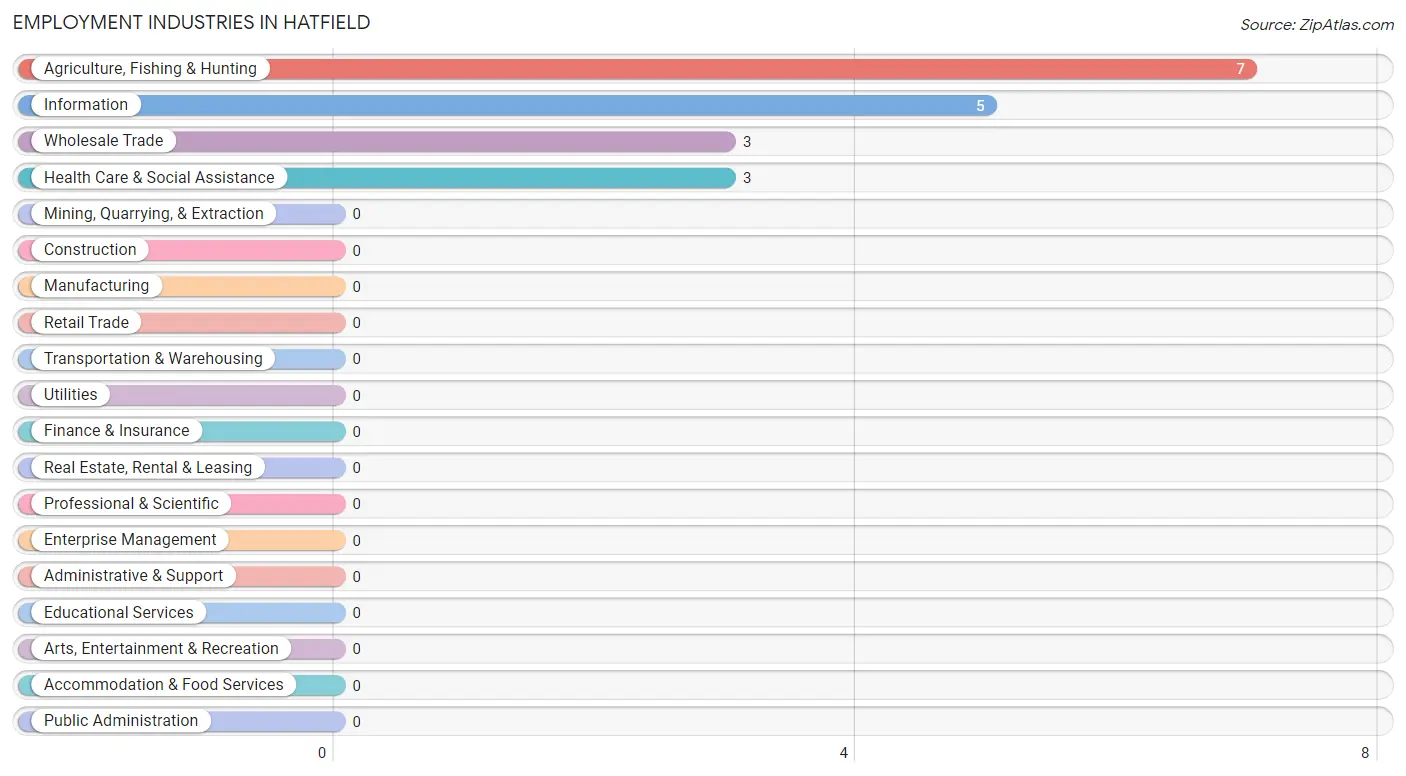
Employment Industries in Hatfield
The major employment industries in Hatfield include Agriculture, Fishing & Hunting (7 | 38.9%), Information (5 | 27.8%), Wholesale Trade (3 | 16.7%), and Health Care & Social Assistance (3 | 16.7%).
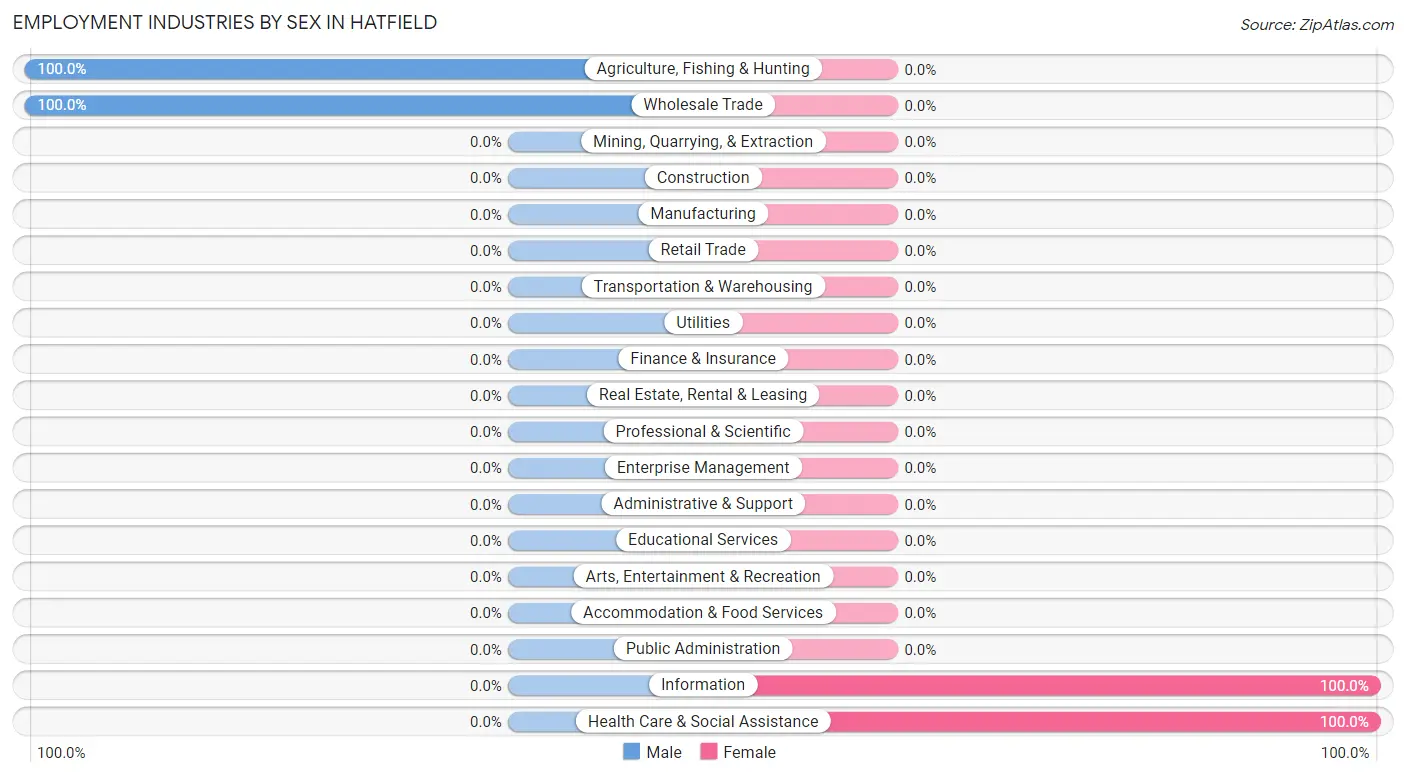
Employment Industries by Sex in Hatfield
The Hatfield industries that see more men than women are Agriculture, Fishing & Hunting (100.0%), and Wholesale Trade (100.0%), whereas the industries that tend to have a higher number of women are Information (100.0%), and Health Care & Social Assistance (100.0%).
| Industry | Male | Female |
| Agriculture, Fishing & Hunting | 7 (100.0%) | 0 (0.0%) |
| Mining, Quarrying, & Extraction | 0 (0.0%) | 0 (0.0%) |
| Construction | 0 (0.0%) | 0 (0.0%) |
| Manufacturing | 0 (0.0%) | 0 (0.0%) |
| Wholesale Trade | 3 (100.0%) | 0 (0.0%) |
| Retail Trade | 0 (0.0%) | 0 (0.0%) |
| Transportation & Warehousing | 0 (0.0%) | 0 (0.0%) |
| Utilities | 0 (0.0%) | 0 (0.0%) |
| Information | 0 (0.0%) | 5 (100.0%) |
| Finance & Insurance | 0 (0.0%) | 0 (0.0%) |
| Real Estate, Rental & Leasing | 0 (0.0%) | 0 (0.0%) |
| Professional & Scientific | 0 (0.0%) | 0 (0.0%) |
| Enterprise Management | 0 (0.0%) | 0 (0.0%) |
| Administrative & Support | 0 (0.0%) | 0 (0.0%) |
| Educational Services | 0 (0.0%) | 0 (0.0%) |
| Health Care & Social Assistance | 0 (0.0%) | 3 (100.0%) |
| Arts, Entertainment & Recreation | 0 (0.0%) | 0 (0.0%) |
| Accommodation & Food Services | 0 (0.0%) | 0 (0.0%) |
| Public Administration | 0 (0.0%) | 0 (0.0%) |
| Total | 10 (55.6%) | 8 (44.4%) |
Education in Hatfield
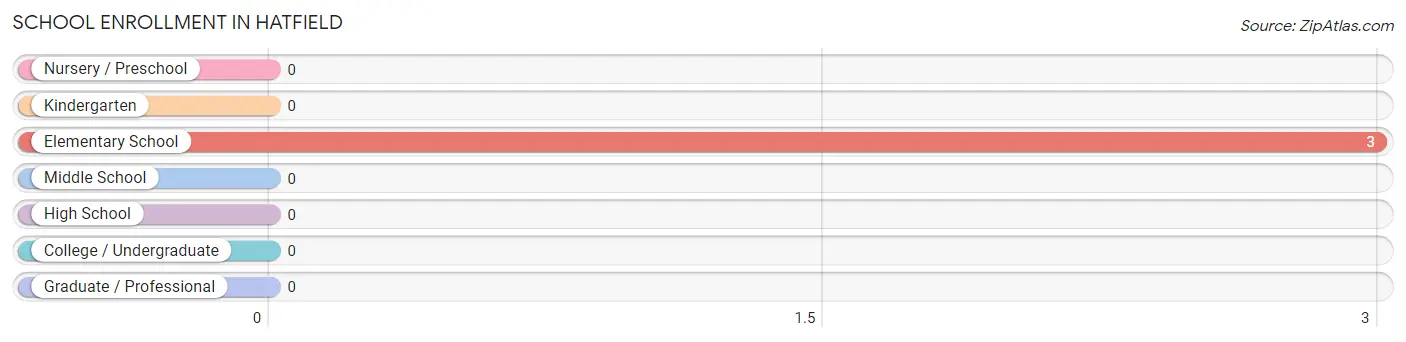
School Enrollment in Hatfield
| School Level | # Students | % Students |
| Nursery / Preschool | 0 | 0.0% |
| Kindergarten | 0 | 0.0% |
| Elementary School | 3 | 100.0% |
| Middle School | 0 | 0.0% |
| High School | 0 | 0.0% |
| College / Undergraduate | 0 | 0.0% |
| Graduate / Professional | 0 | 0.0% |
| Total | 3 | 100.0% |
School Enrollment by Age by Funding Source in Hatfield
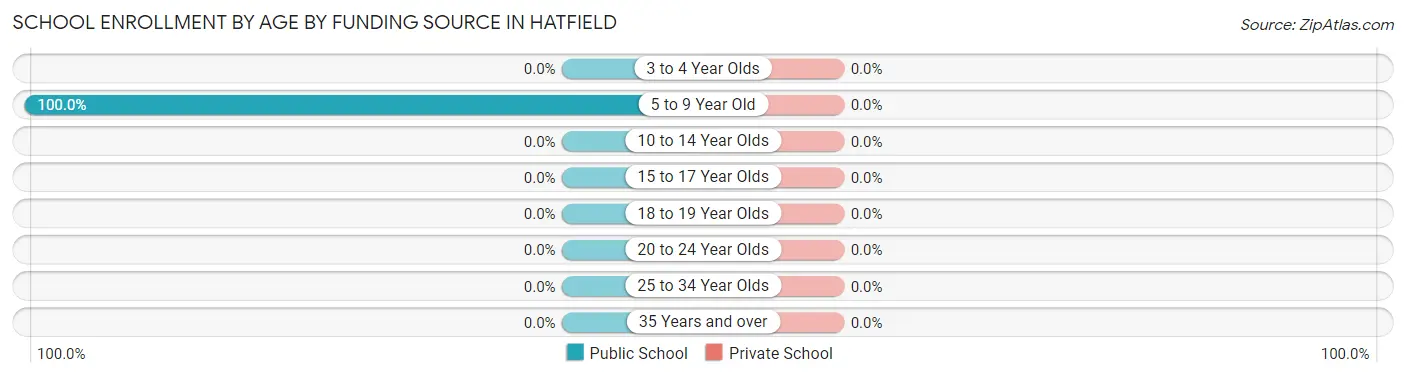
| Age Bracket | Public School | Private School |
| 3 to 4 Year Olds | 0 (0.0%) | 0 (0.0%) |
| 5 to 9 Year Old | 3 (100.0%) | 0 (0.0%) |
| 10 to 14 Year Olds | 0 (0.0%) | 0 (0.0%) |
| 15 to 17 Year Olds | 0 (0.0%) | 0 (0.0%) |
| 18 to 19 Year Olds | 0 (0.0%) | 0 (0.0%) |
| 20 to 24 Year Olds | 0 (0.0%) | 0 (0.0%) |
| 25 to 34 Year Olds | 0 (0.0%) | 0 (0.0%) |
| 35 Years and over | 0 (0.0%) | 0 (0.0%) |
| Total | 3 (100.0%) | 0 (0.0%) |
Educational Attainment by Field of Study in Hatfield
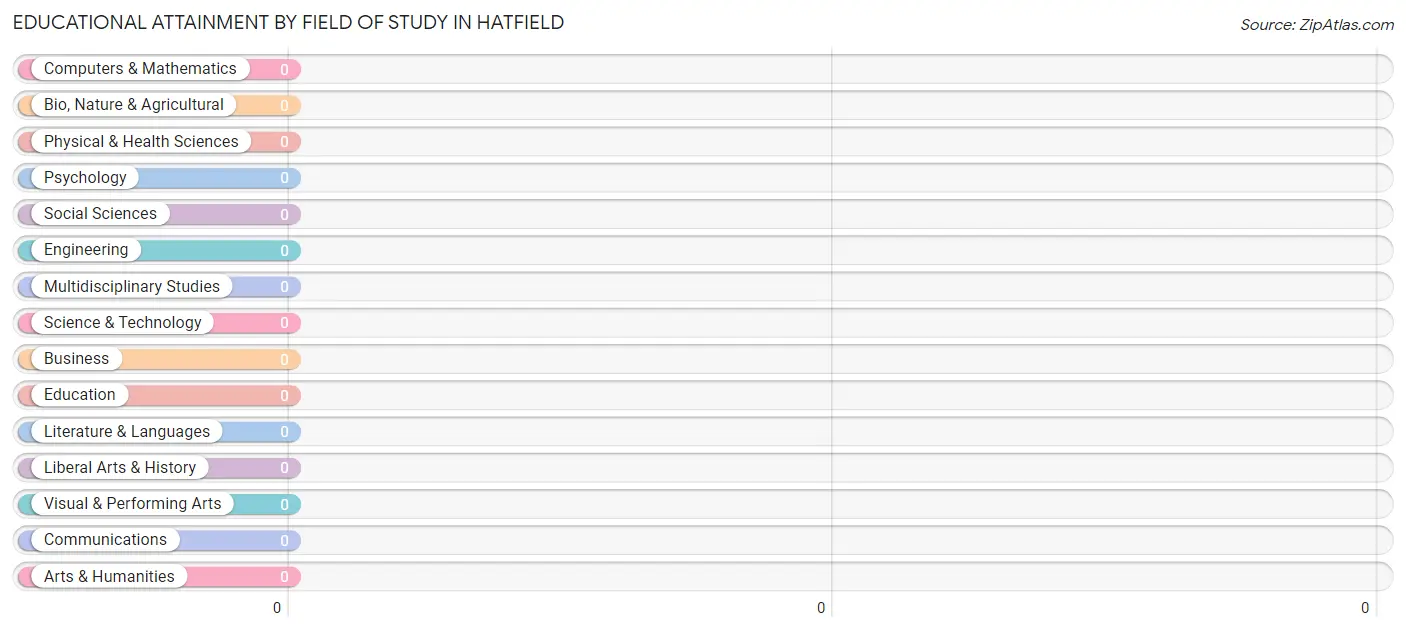
| Field of Study | # Graduates | % Graduates |
| Computers & Mathematics | 0 | 0.0% |
| Bio, Nature & Agricultural | 0 | 0.0% |
| Physical & Health Sciences | 0 | 0.0% |
| Psychology | 0 | 0.0% |
| Social Sciences | 0 | 0.0% |
| Engineering | 0 | 0.0% |
| Multidisciplinary Studies | 0 | 0.0% |
| Science & Technology | 0 | 0.0% |
| Business | 0 | 0.0% |
| Education | 0 | 0.0% |
| Literature & Languages | 0 | 0.0% |
| Liberal Arts & History | 0 | 0.0% |
| Visual & Performing Arts | 0 | 0.0% |
| Communications | 0 | 0.0% |
| Arts & Humanities | 0 | 0.0% |
| Total | 0 | 0.0% |
Transportation & Commute in Hatfield
Vehicle Availability by Sex in Hatfield
The most prevalent vehicle ownership categories in Hatfield are males with 4 vehicles (5, accounting for 50.0%) and females with 4 vehicles (5, making up 62.5%).
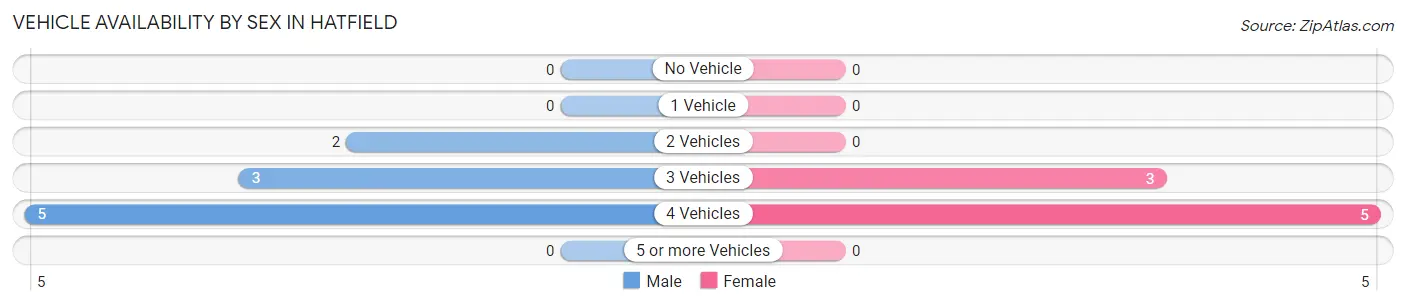
| Vehicles Available | Male | Female |
| No Vehicle | 0 (0.0%) | 0 (0.0%) |
| 1 Vehicle | 0 (0.0%) | 0 (0.0%) |
| 2 Vehicles | 2 (20.0%) | 0 (0.0%) |
| 3 Vehicles | 3 (30.0%) | 3 (37.5%) |
| 4 Vehicles | 5 (50.0%) | 5 (62.5%) |
| 5 or more Vehicles | 0 (0.0%) | 0 (0.0%) |
| Total | 10 (100.0%) | 8 (100.0%) |
Commute Time in Hatfield
The most frequently occuring commute durations in Hatfield are 45 to 59 minutes (6 commuters, 54.5%), 10 to 14 minutes (5 commuters, 45.5%), and less than 5 minutes (0 commuters, 0.0%).
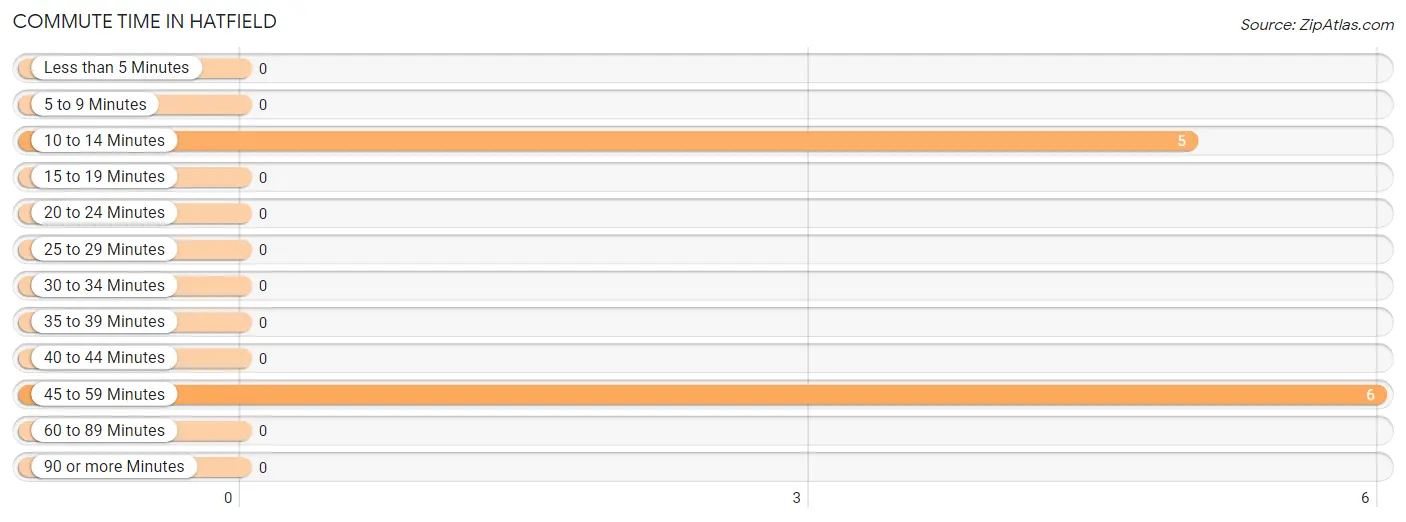
| Commute Time | # Commuters | % Commuters |
| Less than 5 Minutes | 0 | 0.0% |
| 5 to 9 Minutes | 0 | 0.0% |
| 10 to 14 Minutes | 5 | 45.5% |
| 15 to 19 Minutes | 0 | 0.0% |
| 20 to 24 Minutes | 0 | 0.0% |
| 25 to 29 Minutes | 0 | 0.0% |
| 30 to 34 Minutes | 0 | 0.0% |
| 35 to 39 Minutes | 0 | 0.0% |
| 40 to 44 Minutes | 0 | 0.0% |
| 45 to 59 Minutes | 6 | 54.5% |
| 60 to 89 Minutes | 0 | 0.0% |
| 90 or more Minutes | 0 | 0.0% |
Commute Time by Sex in Hatfield
The most common commute times in Hatfield are 45 to 59 minutes (3 commuters, 100.0%) for males and 10 to 14 minutes (5 commuters, 62.5%) for females.
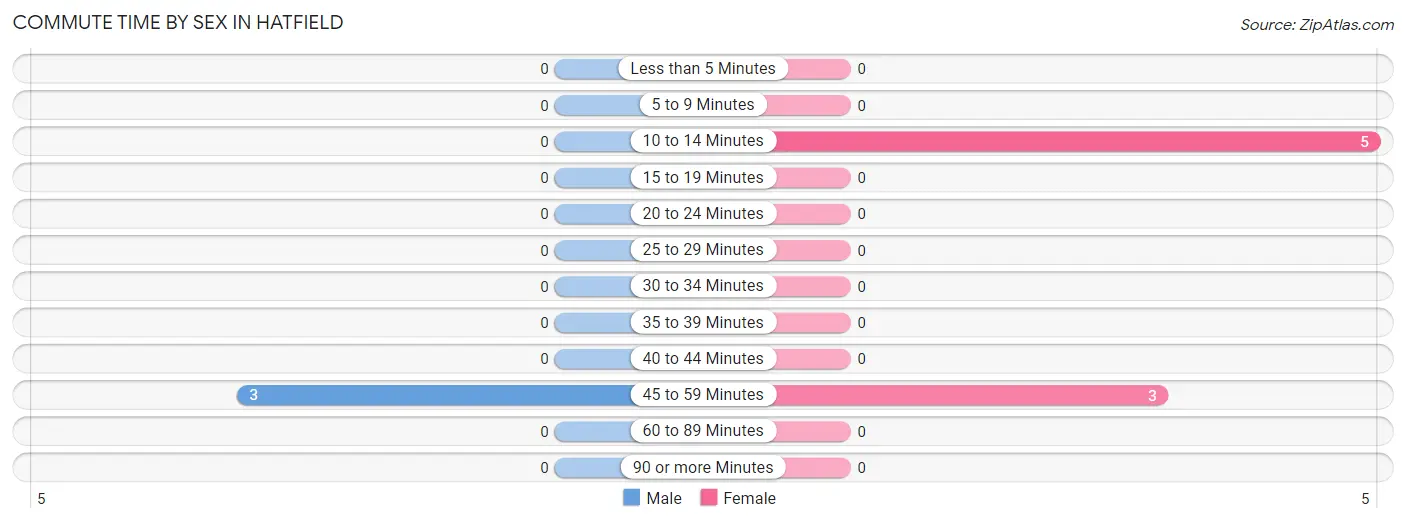
| Commute Time | Male | Female |
| Less than 5 Minutes | 0 (0.0%) | 0 (0.0%) |
| 5 to 9 Minutes | 0 (0.0%) | 0 (0.0%) |
| 10 to 14 Minutes | 0 (0.0%) | 5 (62.5%) |
| 15 to 19 Minutes | 0 (0.0%) | 0 (0.0%) |
| 20 to 24 Minutes | 0 (0.0%) | 0 (0.0%) |
| 25 to 29 Minutes | 0 (0.0%) | 0 (0.0%) |
| 30 to 34 Minutes | 0 (0.0%) | 0 (0.0%) |
| 35 to 39 Minutes | 0 (0.0%) | 0 (0.0%) |
| 40 to 44 Minutes | 0 (0.0%) | 0 (0.0%) |
| 45 to 59 Minutes | 3 (100.0%) | 3 (37.5%) |
| 60 to 89 Minutes | 0 (0.0%) | 0 (0.0%) |
| 90 or more Minutes | 0 (0.0%) | 0 (0.0%) |
Time of Departure to Work by Sex in Hatfield
The most frequent times of departure to work in Hatfield are 12:00 AM to 4:59 AM (3, 100.0%) for males and 8:00 AM to 8:29 AM (5, 62.5%) for females.
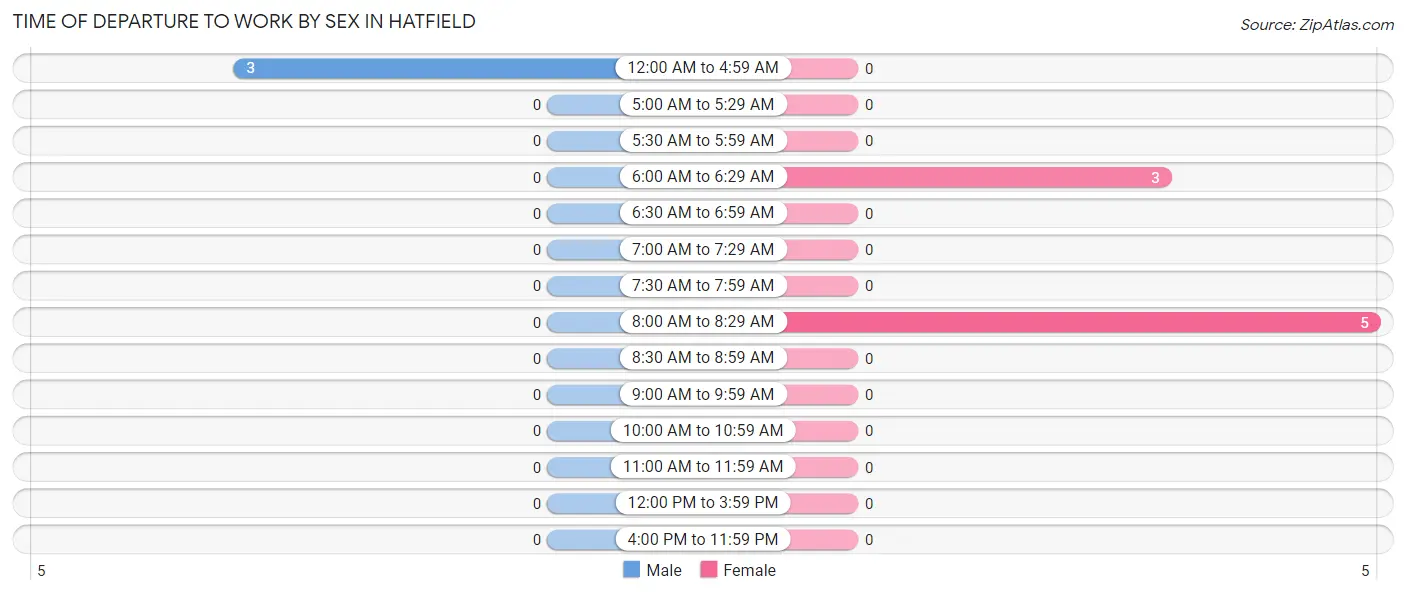
| Time of Departure | Male | Female |
| 12:00 AM to 4:59 AM | 3 (100.0%) | 0 (0.0%) |
| 5:00 AM to 5:29 AM | 0 (0.0%) | 0 (0.0%) |
| 5:30 AM to 5:59 AM | 0 (0.0%) | 0 (0.0%) |
| 6:00 AM to 6:29 AM | 0 (0.0%) | 3 (37.5%) |
| 6:30 AM to 6:59 AM | 0 (0.0%) | 0 (0.0%) |
| 7:00 AM to 7:29 AM | 0 (0.0%) | 0 (0.0%) |
| 7:30 AM to 7:59 AM | 0 (0.0%) | 0 (0.0%) |
| 8:00 AM to 8:29 AM | 0 (0.0%) | 5 (62.5%) |
| 8:30 AM to 8:59 AM | 0 (0.0%) | 0 (0.0%) |
| 9:00 AM to 9:59 AM | 0 (0.0%) | 0 (0.0%) |
| 10:00 AM to 10:59 AM | 0 (0.0%) | 0 (0.0%) |
| 11:00 AM to 11:59 AM | 0 (0.0%) | 0 (0.0%) |
| 12:00 PM to 3:59 PM | 0 (0.0%) | 0 (0.0%) |
| 4:00 PM to 11:59 PM | 0 (0.0%) | 0 (0.0%) |
| Total | 3 (100.0%) | 8 (100.0%) |
Housing Occupancy in Hatfield
Occupancy by Ownership in Hatfield
Of the total 12 dwellings in Hatfield, owner-occupied units account for 12 (100.0%), while renter-occupied units make up 0 (0.0%).
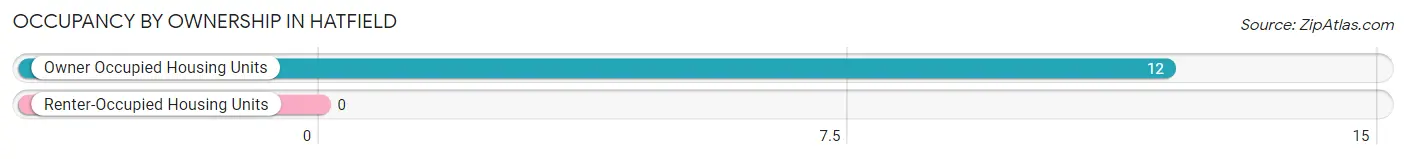
| Occupancy | # Housing Units | % Housing Units |
| Owner Occupied Housing Units | 12 | 100.0% |
| Renter-Occupied Housing Units | 0 | 0.0% |
| Total Occupied Housing Units | 12 | 100.0% |
Occupancy by Household Size in Hatfield
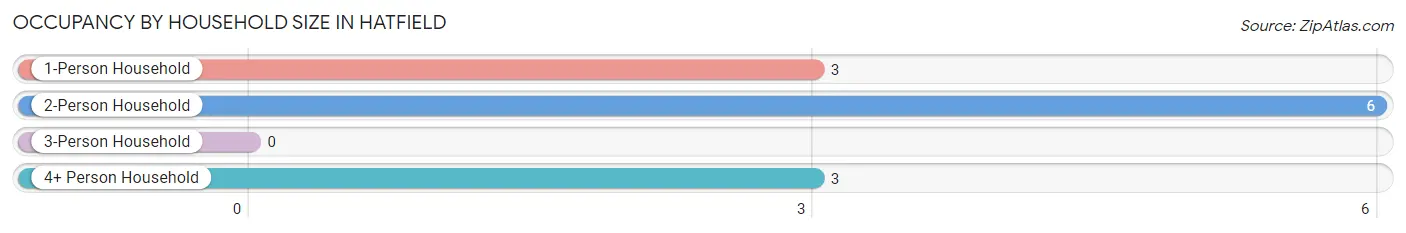
| Household Size | # Housing Units | % Housing Units |
| 1-Person Household | 3 | 25.0% |
| 2-Person Household | 6 | 50.0% |
| 3-Person Household | 0 | 0.0% |
| 4+ Person Household | 3 | 25.0% |
| Total Housing Units | 12 | 100.0% |
Occupancy by Ownership by Household Size in Hatfield
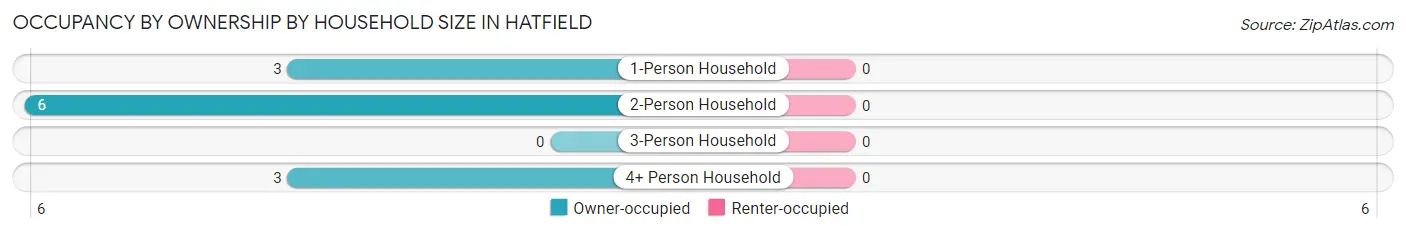
| Household Size | Owner-occupied | Renter-occupied |
| 1-Person Household | 3 (100.0%) | 0 (0.0%) |
| 2-Person Household | 6 (100.0%) | 0 (0.0%) |
| 3-Person Household | 0 (0.0%) | 0 (0.0%) |
| 4+ Person Household | 3 (100.0%) | 0 (0.0%) |
| Total Housing Units | 12 (100.0%) | 0 (0.0%) |
Occupancy by Educational Attainment in Hatfield
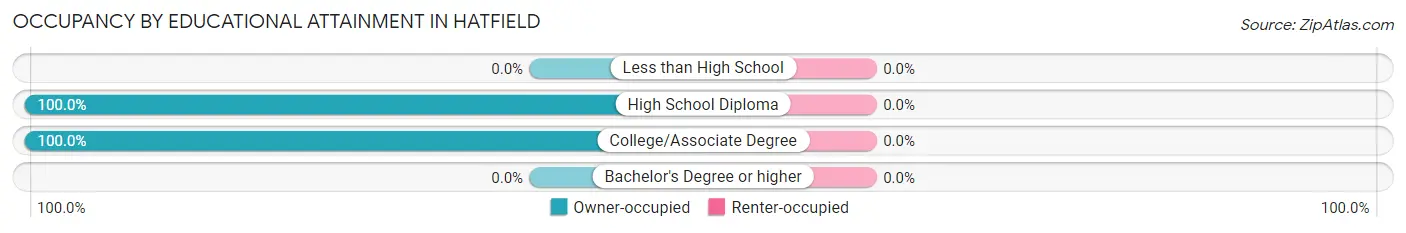
| Household Size | Owner-occupied | Renter-occupied |
| Less than High School | 0 (0.0%) | 0 (0.0%) |
| High School Diploma | 7 (100.0%) | 0 (0.0%) |
| College/Associate Degree | 5 (100.0%) | 0 (0.0%) |
| Bachelor's Degree or higher | 0 (0.0%) | 0 (0.0%) |
Occupancy by Age of Householder in Hatfield
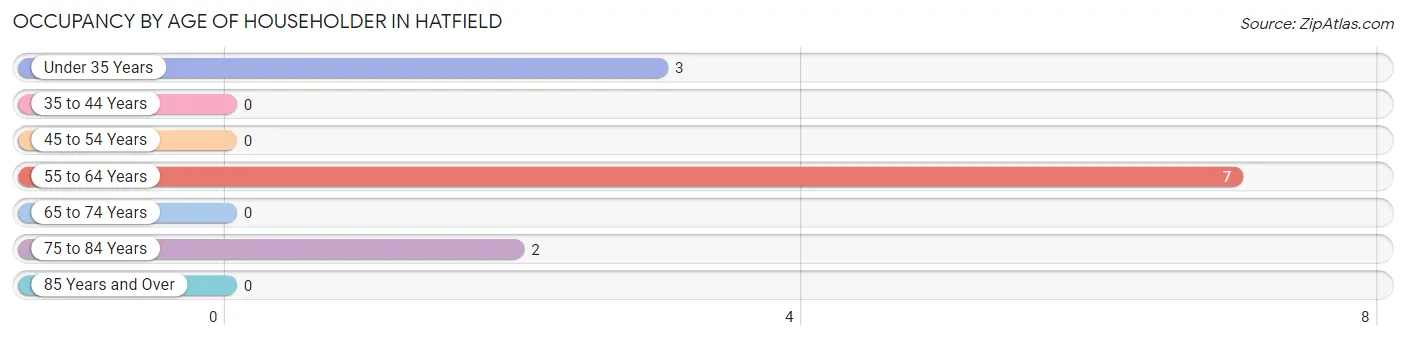
| Age Bracket | # Households | % Households |
| Under 35 Years | 3 | 25.0% |
| 35 to 44 Years | 0 | 0.0% |
| 45 to 54 Years | 0 | 0.0% |
| 55 to 64 Years | 7 | 58.3% |
| 65 to 74 Years | 0 | 0.0% |
| 75 to 84 Years | 2 | 16.7% |
| 85 Years and Over | 0 | 0.0% |
| Total | 12 | 100.0% |
Housing Finances in Hatfield
Median Income by Occupancy in Hatfield
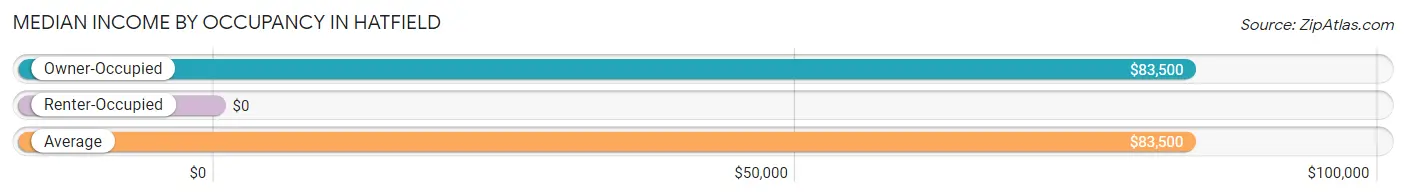
| Occupancy Type | # Households | Median Income |
| Owner-Occupied | 12 (100.0%) | $83,500 |
| Renter-Occupied | 0 (0.0%) | $0 |
| Average | 12 (100.0%) | $83,500 |
Occupancy by Householder Income Bracket in Hatfield
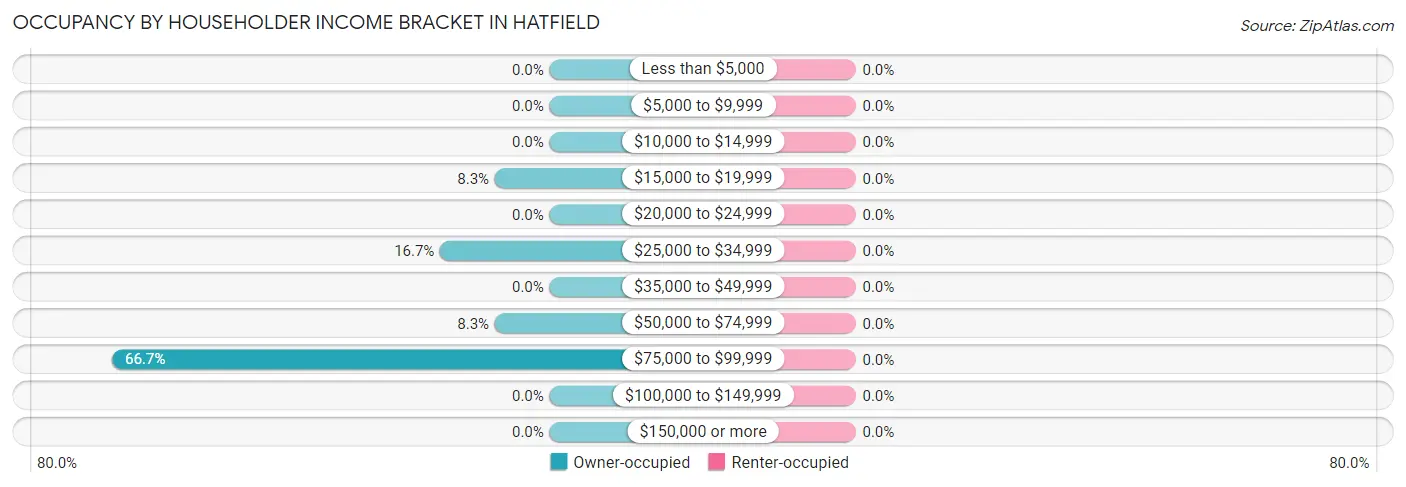
| Income Bracket | Owner-occupied | Renter-occupied |
| Less than $5,000 | 0 (0.0%) | 0 (0.0%) |
| $5,000 to $9,999 | 0 (0.0%) | 0 (0.0%) |
| $10,000 to $14,999 | 0 (0.0%) | 0 (0.0%) |
| $15,000 to $19,999 | 1 (8.3%) | 0 (0.0%) |
| $20,000 to $24,999 | 0 (0.0%) | 0 (0.0%) |
| $25,000 to $34,999 | 2 (16.7%) | 0 (0.0%) |
| $35,000 to $49,999 | 0 (0.0%) | 0 (0.0%) |
| $50,000 to $74,999 | 1 (8.3%) | 0 (0.0%) |
| $75,000 to $99,999 | 8 (66.7%) | 0 (0.0%) |
| $100,000 to $149,999 | 0 (0.0%) | 0 (0.0%) |
| $150,000 or more | 0 (0.0%) | 0 (0.0%) |
| Total | 12 (100.0%) | 0 (0.0%) |
Monthly Housing Cost Tiers in Hatfield
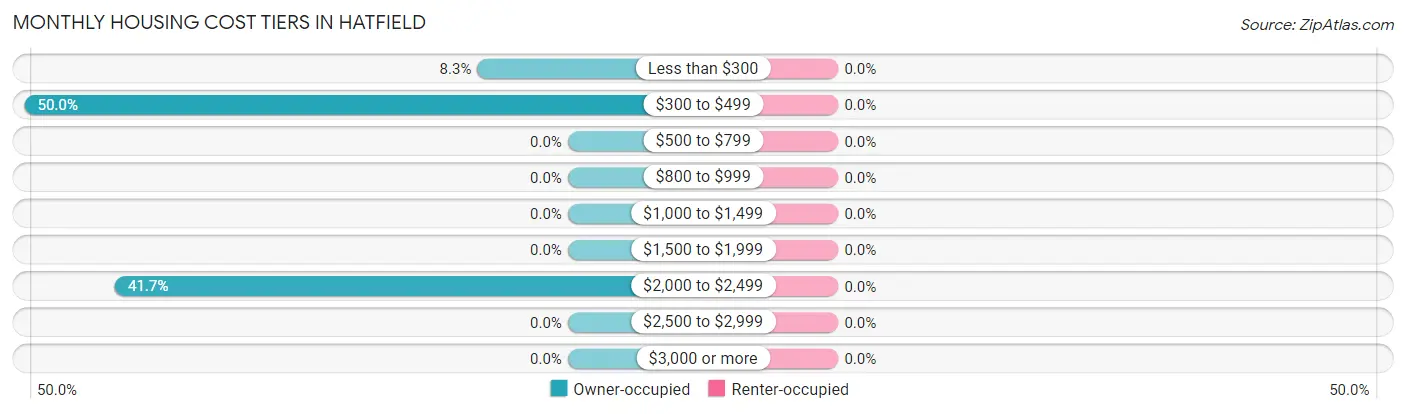
| Monthly Cost | Owner-occupied | Renter-occupied |
| Less than $300 | 1 (8.3%) | 0 (0.0%) |
| $300 to $499 | 6 (50.0%) | 0 (0.0%) |
| $500 to $799 | 0 (0.0%) | 0 (0.0%) |
| $800 to $999 | 0 (0.0%) | 0 (0.0%) |
| $1,000 to $1,499 | 0 (0.0%) | 0 (0.0%) |
| $1,500 to $1,999 | 0 (0.0%) | 0 (0.0%) |
| $2,000 to $2,499 | 5 (41.7%) | 0 (0.0%) |
| $2,500 to $2,999 | 0 (0.0%) | 0 (0.0%) |
| $3,000 or more | 0 (0.0%) | 0 (0.0%) |
| Total | 12 (100.0%) | 0 (0.0%) |
Physical Housing Characteristics in Hatfield
Housing Structures in Hatfield
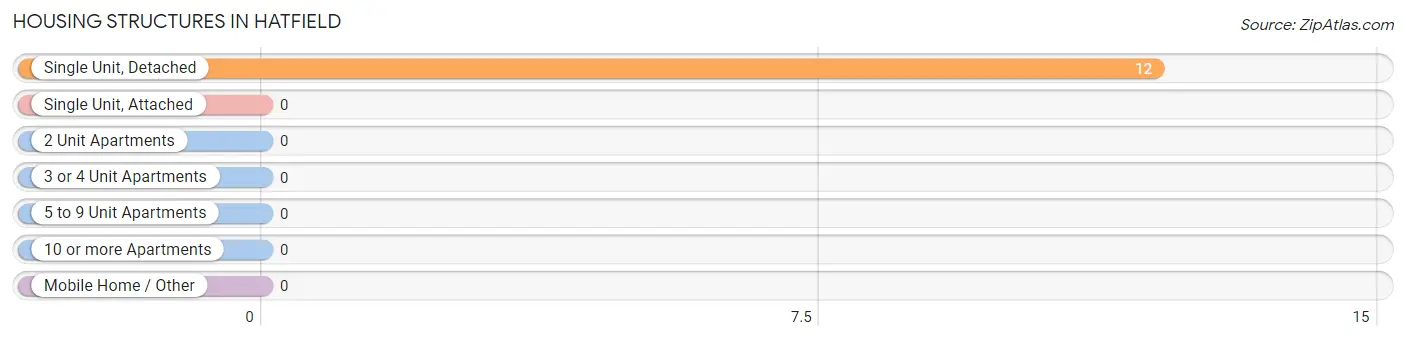
| Structure Type | # Housing Units | % Housing Units |
| Single Unit, Detached | 12 | 100.0% |
| Single Unit, Attached | 0 | 0.0% |
| 2 Unit Apartments | 0 | 0.0% |
| 3 or 4 Unit Apartments | 0 | 0.0% |
| 5 to 9 Unit Apartments | 0 | 0.0% |
| 10 or more Apartments | 0 | 0.0% |
| Mobile Home / Other | 0 | 0.0% |
| Total | 12 | 100.0% |
Housing Structures by Occupancy in Hatfield
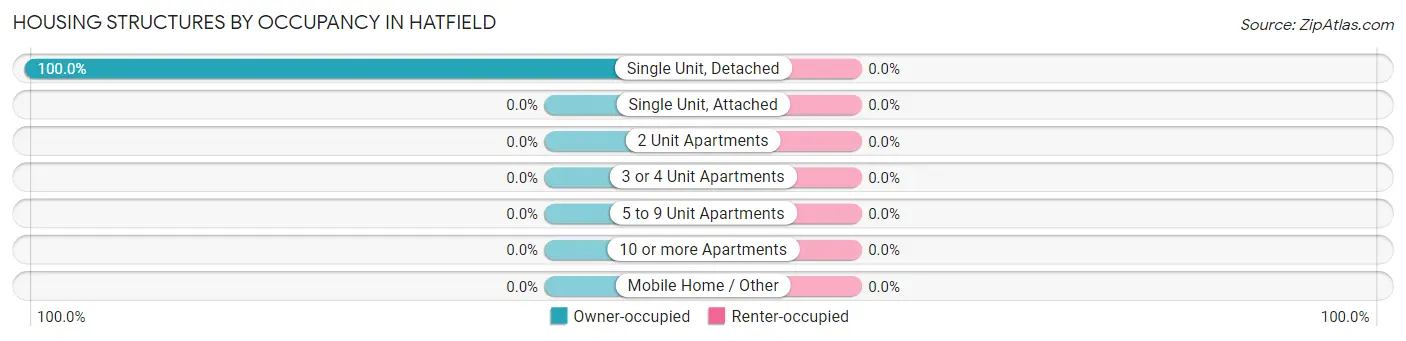
| Structure Type | Owner-occupied | Renter-occupied |
| Single Unit, Detached | 12 (100.0%) | 0 (0.0%) |
| Single Unit, Attached | 0 (0.0%) | 0 (0.0%) |
| 2 Unit Apartments | 0 (0.0%) | 0 (0.0%) |
| 3 or 4 Unit Apartments | 0 (0.0%) | 0 (0.0%) |
| 5 to 9 Unit Apartments | 0 (0.0%) | 0 (0.0%) |
| 10 or more Apartments | 0 (0.0%) | 0 (0.0%) |
| Mobile Home / Other | 0 (0.0%) | 0 (0.0%) |
| Total | 12 (100.0%) | 0 (0.0%) |
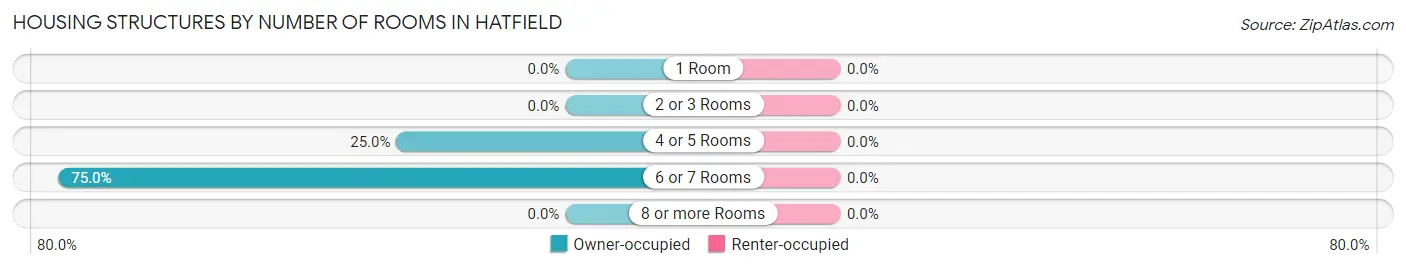
Housing Structures by Number of Rooms in Hatfield
| Number of Rooms | Owner-occupied | Renter-occupied |
| 1 Room | 0 (0.0%) | 0 (0.0%) |
| 2 or 3 Rooms | 0 (0.0%) | 0 (0.0%) |
| 4 or 5 Rooms | 3 (25.0%) | 0 (0.0%) |
| 6 or 7 Rooms | 9 (75.0%) | 0 (0.0%) |
| 8 or more Rooms | 0 (0.0%) | 0 (0.0%) |
| Total | 12 (100.0%) | 0 (0.0%) |
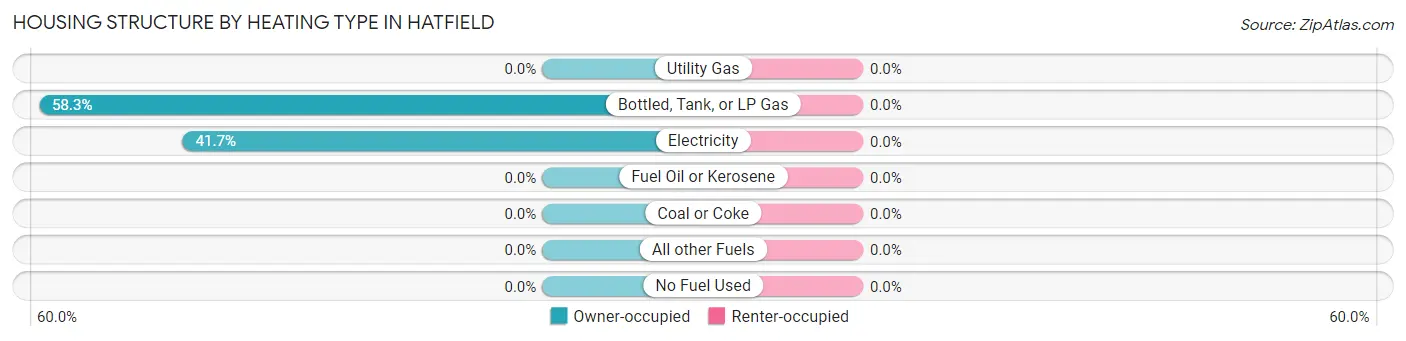
Housing Structure by Heating Type in Hatfield
| Heating Type | Owner-occupied | Renter-occupied |
| Utility Gas | 0 (0.0%) | 0 (0.0%) |
| Bottled, Tank, or LP Gas | 7 (58.3%) | 0 (0.0%) |
| Electricity | 5 (41.7%) | 0 (0.0%) |
| Fuel Oil or Kerosene | 0 (0.0%) | 0 (0.0%) |
| Coal or Coke | 0 (0.0%) | 0 (0.0%) |
| All other Fuels | 0 (0.0%) | 0 (0.0%) |
| No Fuel Used | 0 (0.0%) | 0 (0.0%) |
| Total | 12 (100.0%) | 0 (0.0%) |
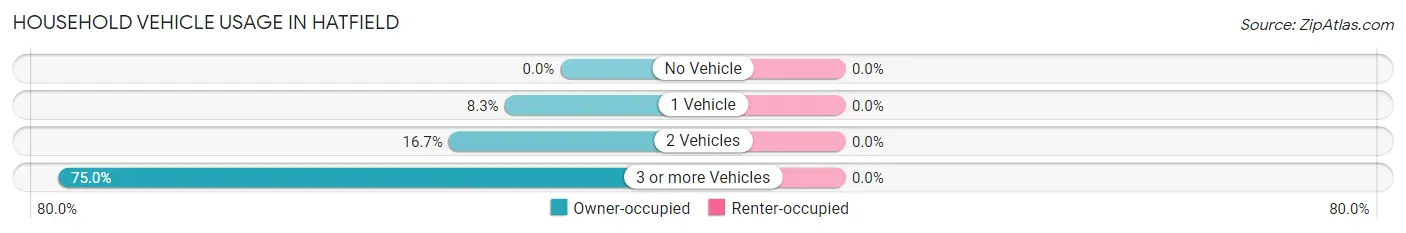
Household Vehicle Usage in Hatfield
| Vehicles per Household | Owner-occupied | Renter-occupied |
| No Vehicle | 0 (0.0%) | 0 (0.0%) |
| 1 Vehicle | 1 (8.3%) | 0 (0.0%) |
| 2 Vehicles | 2 (16.7%) | 0 (0.0%) |
| 3 or more Vehicles | 9 (75.0%) | 0 (0.0%) |
| Total | 12 (100.0%) | 0 (0.0%) |
Real Estate & Mortgages in Hatfield
Real Estate and Mortgage Overview in Hatfield
| Characteristic | Without Mortgage | With Mortgage |
| Housing Units | 7 | 5 |
| Median Property Value | $168,800 | $0 |
| Median Household Income | - | - |
| Monthly Housing Costs | $388 | $0 |
| Real Estate Taxes | - | - |
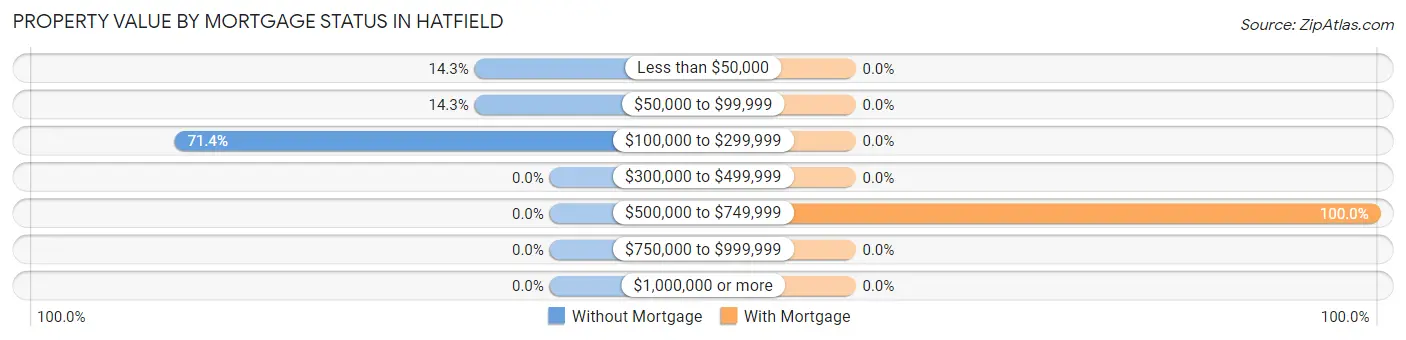
Property Value by Mortgage Status in Hatfield
| Property Value | Without Mortgage | With Mortgage |
| Less than $50,000 | 1 (14.3%) | 0 (0.0%) |
| $50,000 to $99,999 | 1 (14.3%) | 0 (0.0%) |
| $100,000 to $299,999 | 5 (71.4%) | 0 (0.0%) |
| $300,000 to $499,999 | 0 (0.0%) | 0 (0.0%) |
| $500,000 to $749,999 | 0 (0.0%) | 5 (100.0%) |
| $750,000 to $999,999 | 0 (0.0%) | 0 (0.0%) |
| $1,000,000 or more | 0 (0.0%) | 0 (0.0%) |
| Total | 7 (100.0%) | 5 (100.0%) |
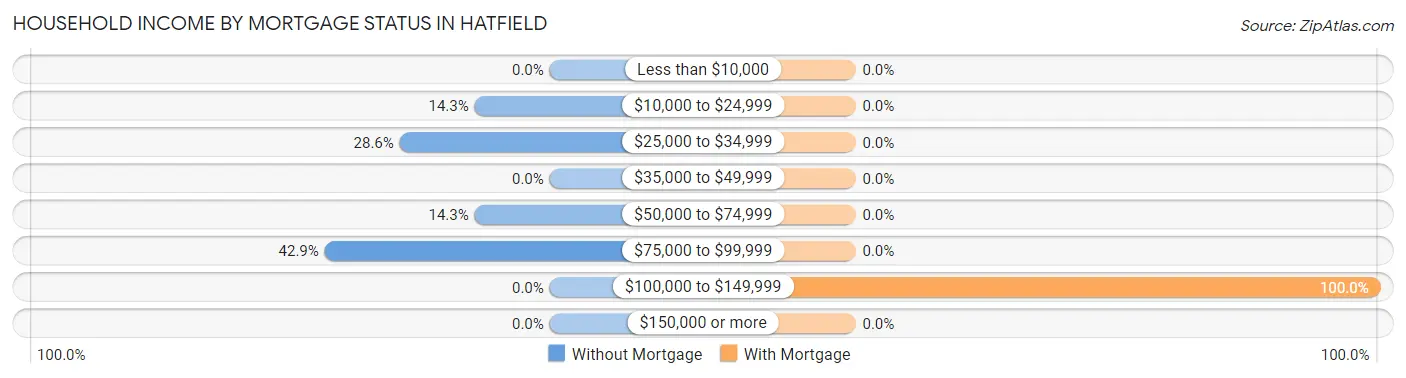
Household Income by Mortgage Status in Hatfield
| Household Income | Without Mortgage | With Mortgage |
| Less than $10,000 | 0 (0.0%) | 0 (0.0%) |
| $10,000 to $24,999 | 1 (14.3%) | 0 (0.0%) |
| $25,000 to $34,999 | 2 (28.6%) | 0 (0.0%) |
| $35,000 to $49,999 | 0 (0.0%) | 0 (0.0%) |
| $50,000 to $74,999 | 1 (14.3%) | 0 (0.0%) |
| $75,000 to $99,999 | 3 (42.9%) | 0 (0.0%) |
| $100,000 to $149,999 | 0 (0.0%) | 5 (100.0%) |
| $150,000 or more | 0 (0.0%) | 0 (0.0%) |
| Total | 7 (100.0%) | 5 (100.0%) |
Property Value to Household Income Ratio in Hatfield
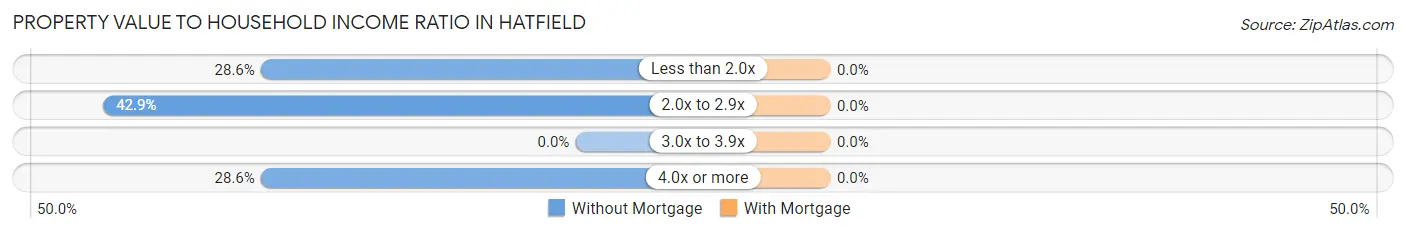
| Value-to-Income Ratio | Without Mortgage | With Mortgage |
| Less than 2.0x | 2 (28.6%) | 0 (0.0%) |
| 2.0x to 2.9x | 3 (42.9%) | 0 (0.0%) |
| 3.0x to 3.9x | 0 (0.0%) | 0 (0.0%) |
| 4.0x or more | 2 (28.6%) | 0 (0.0%) |
| Total | 7 (100.0%) | 5 (100.0%) |
Real Estate Taxes by Mortgage Status in Hatfield
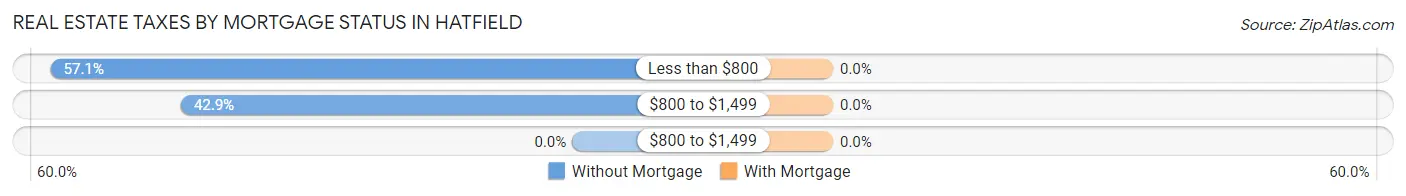
| Property Taxes | Without Mortgage | With Mortgage |
| Less than $800 | 4 (57.1%) | 0 (0.0%) |
| $800 to $1,499 | 3 (42.9%) | 0 (0.0%) |
| $800 to $1,499 | 0 (0.0%) | 0 (0.0%) |
| Total | 7 (100.0%) | 5 (100.0%) |
Health & Disability in Hatfield
Health Insurance Coverage by Age in Hatfield
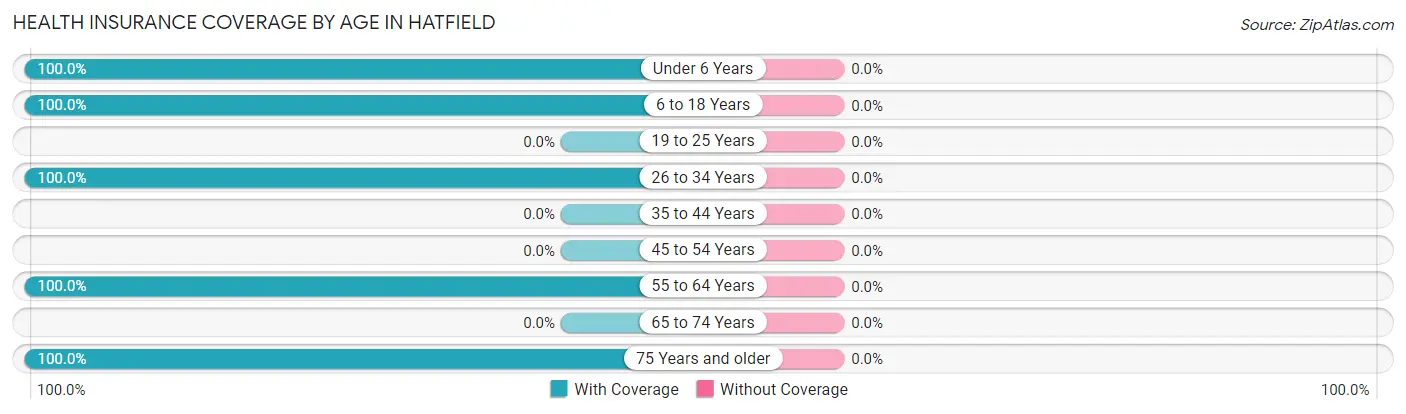
| Age Bracket | With Coverage | Without Coverage |
| Under 6 Years | 8 (100.0%) | 0 (0.0%) |
| 6 to 18 Years | 3 (100.0%) | 0 (0.0%) |
| 19 to 25 Years | 0 (0.0%) | 0 (0.0%) |
| 26 to 34 Years | 6 (100.0%) | 0 (0.0%) |
| 35 to 44 Years | 0 (0.0%) | 0 (0.0%) |
| 45 to 54 Years | 0 (0.0%) | 0 (0.0%) |
| 55 to 64 Years | 12 (100.0%) | 0 (0.0%) |
| 65 to 74 Years | 0 (0.0%) | 0 (0.0%) |
| 75 Years and older | 3 (100.0%) | 0 (0.0%) |
| Total | 32 (100.0%) | 0 (0.0%) |
Health Insurance Coverage by Citizenship Status in Hatfield
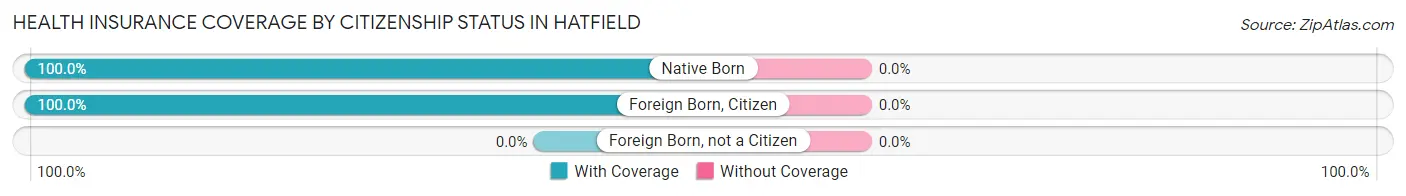
| Citizenship Status | With Coverage | Without Coverage |
| Native Born | 8 (100.0%) | 0 (0.0%) |
| Foreign Born, Citizen | 3 (100.0%) | 0 (0.0%) |
| Foreign Born, not a Citizen | 0 (0.0%) | 0 (0.0%) |
Health Insurance Coverage by Household Income in Hatfield
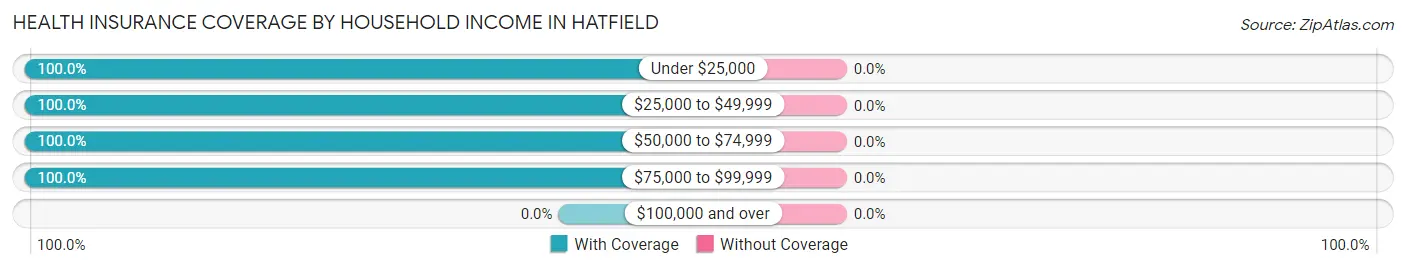
| Household Income | With Coverage | Without Coverage |
| Under $25,000 | 1 (100.0%) | 0 (0.0%) |
| $25,000 to $49,999 | 2 (100.0%) | 0 (0.0%) |
| $50,000 to $74,999 | 2 (100.0%) | 0 (0.0%) |
| $75,000 to $99,999 | 27 (100.0%) | 0 (0.0%) |
| $100,000 and over | 0 (0.0%) | 0 (0.0%) |
Public vs Private Health Insurance Coverage by Age in Hatfield
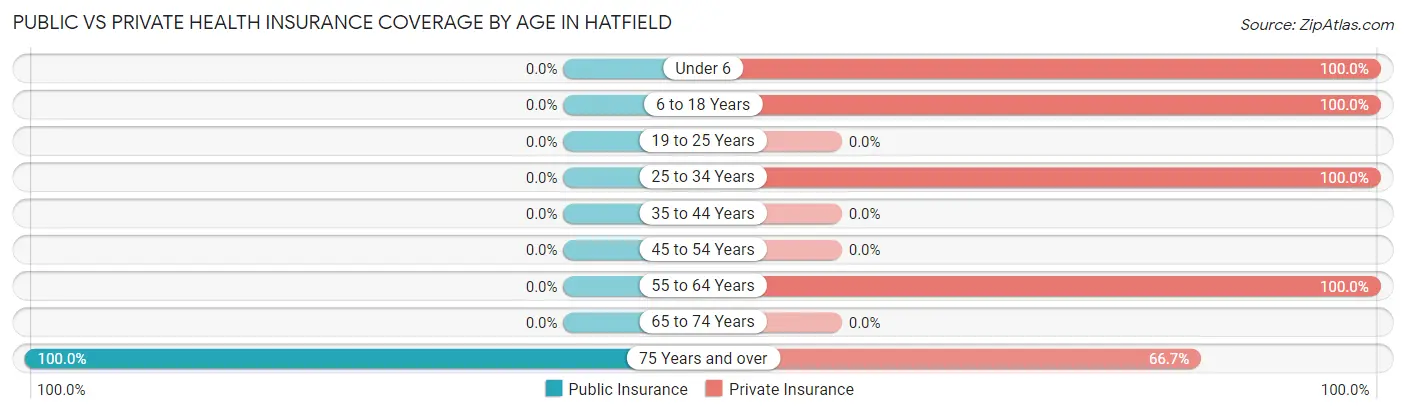
| Age Bracket | Public Insurance | Private Insurance |
| Under 6 | 0 (0.0%) | 8 (100.0%) |
| 6 to 18 Years | 0 (0.0%) | 3 (100.0%) |
| 19 to 25 Years | 0 (0.0%) | 0 (0.0%) |
| 25 to 34 Years | 0 (0.0%) | 6 (100.0%) |
| 35 to 44 Years | 0 (0.0%) | 0 (0.0%) |
| 45 to 54 Years | 0 (0.0%) | 0 (0.0%) |
| 55 to 64 Years | 0 (0.0%) | 12 (100.0%) |
| 65 to 74 Years | 0 (0.0%) | 0 (0.0%) |
| 75 Years and over | 3 (100.0%) | 2 (66.7%) |
| Total | 3 (9.4%) | 31 (96.9%) |
Disability Status by Sex by Age in Hatfield
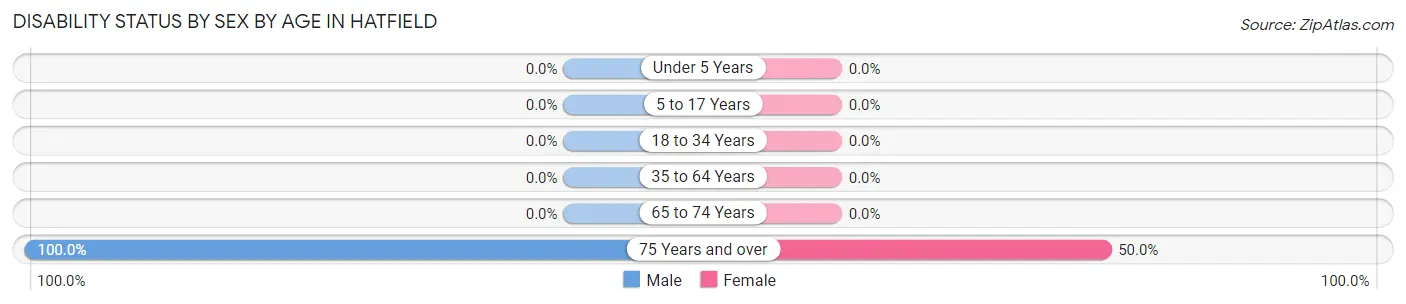
| Age Bracket | Male | Female |
| Under 5 Years | 0 (0.0%) | 0 (0.0%) |
| 5 to 17 Years | 0 (0.0%) | 0 (0.0%) |
| 18 to 34 Years | 0 (0.0%) | 0 (0.0%) |
| 35 to 64 Years | 0 (0.0%) | 0 (0.0%) |
| 65 to 74 Years | 0 (0.0%) | 0 (0.0%) |
| 75 Years and over | 1 (100.0%) | 1 (50.0%) |
Disability Class by Sex by Age in Hatfield
Disability Class: Hearing Difficulty
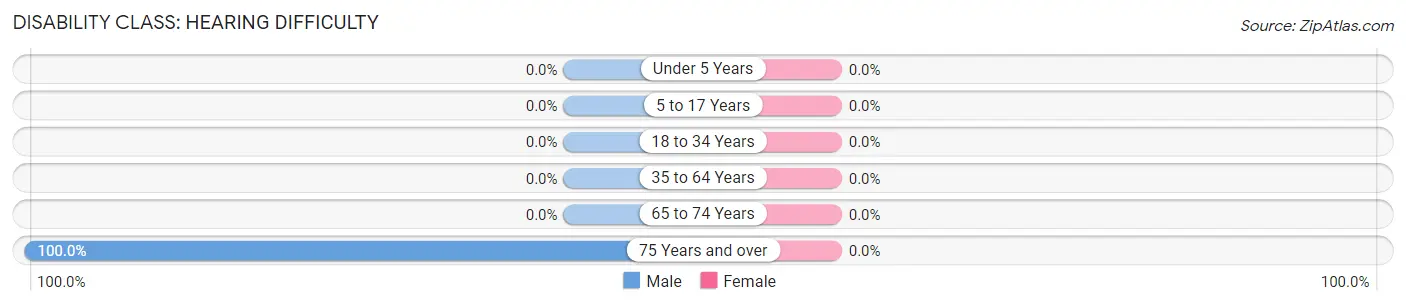
| Age Bracket | Male | Female |
| Under 5 Years | 0 (0.0%) | 0 (0.0%) |
| 5 to 17 Years | 0 (0.0%) | 0 (0.0%) |
| 18 to 34 Years | 0 (0.0%) | 0 (0.0%) |
| 35 to 64 Years | 0 (0.0%) | 0 (0.0%) |
| 65 to 74 Years | 0 (0.0%) | 0 (0.0%) |
| 75 Years and over | 1 (100.0%) | 0 (0.0%) |
Disability Class: Vision Difficulty
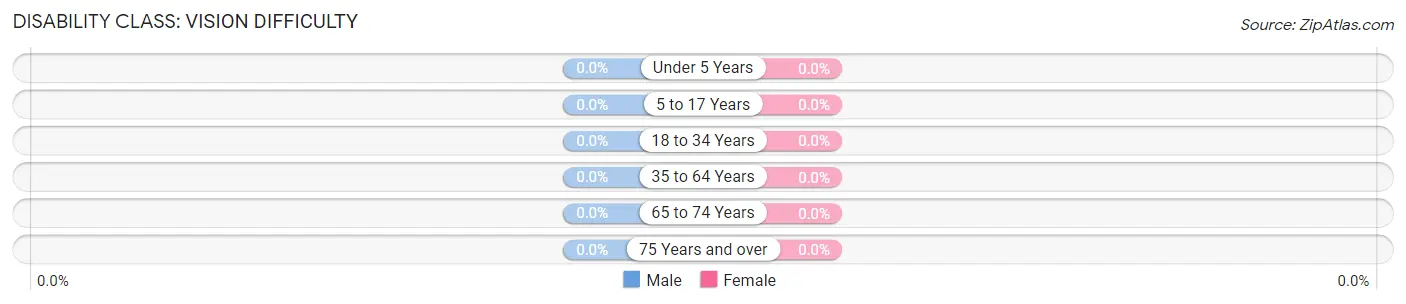
| Age Bracket | Male | Female |
| Under 5 Years | 0 (0.0%) | 0 (0.0%) |
| 5 to 17 Years | 0 (0.0%) | 0 (0.0%) |
| 18 to 34 Years | 0 (0.0%) | 0 (0.0%) |
| 35 to 64 Years | 0 (0.0%) | 0 (0.0%) |
| 65 to 74 Years | 0 (0.0%) | 0 (0.0%) |
| 75 Years and over | 0 (0.0%) | 0 (0.0%) |
Disability Class: Cognitive Difficulty
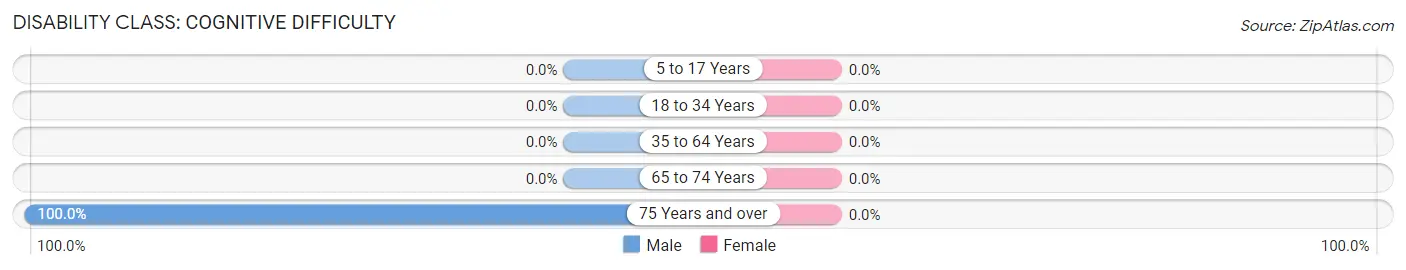
| Age Bracket | Male | Female |
| 5 to 17 Years | 0 (0.0%) | 0 (0.0%) |
| 18 to 34 Years | 0 (0.0%) | 0 (0.0%) |
| 35 to 64 Years | 0 (0.0%) | 0 (0.0%) |
| 65 to 74 Years | 0 (0.0%) | 0 (0.0%) |
| 75 Years and over | 1 (100.0%) | 0 (0.0%) |
Disability Class: Ambulatory Difficulty
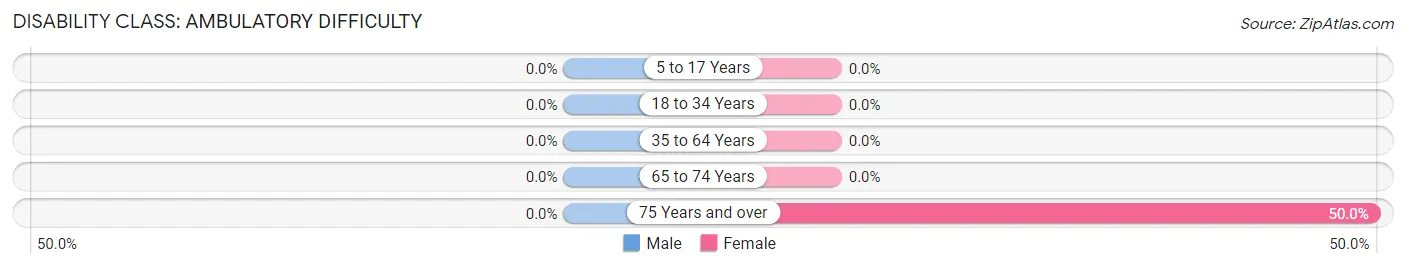
| Age Bracket | Male | Female |
| 5 to 17 Years | 0 (0.0%) | 0 (0.0%) |
| 18 to 34 Years | 0 (0.0%) | 0 (0.0%) |
| 35 to 64 Years | 0 (0.0%) | 0 (0.0%) |
| 65 to 74 Years | 0 (0.0%) | 0 (0.0%) |
| 75 Years and over | 0 (0.0%) | 1 (50.0%) |
Disability Class: Self-Care Difficulty
| Age Bracket | Male | Female |
| 5 to 17 Years | 0 (0.0%) | 0 (0.0%) |
| 18 to 34 Years | 0 (0.0%) | 0 (0.0%) |
| 35 to 64 Years | 0 (0.0%) | 0 (0.0%) |
| 65 to 74 Years | 0 (0.0%) | 0 (0.0%) |
| 75 Years and over | 0 (0.0%) | 0 (0.0%) |
Technology Access in Hatfield
Computing Device Access in Hatfield
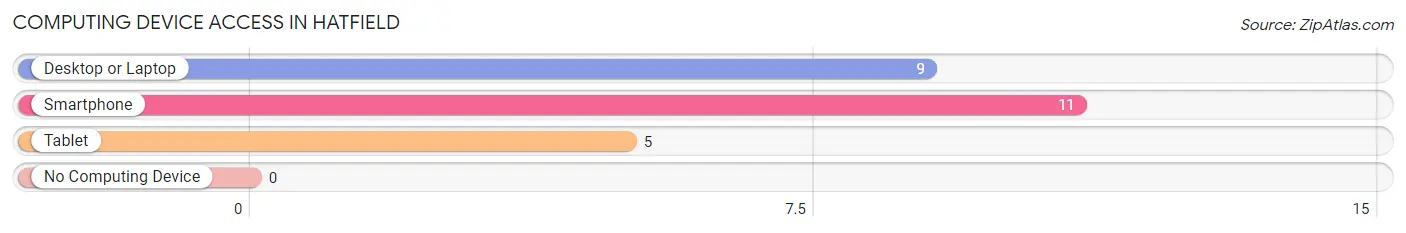
| Device Type | # Households | % Households |
| Desktop or Laptop | 9 | 75.0% |
| Smartphone | 11 | 91.7% |
| Tablet | 5 | 41.7% |
| No Computing Device | 0 | 0.0% |
| Total | 12 | 100.0% |
Internet Access in Hatfield
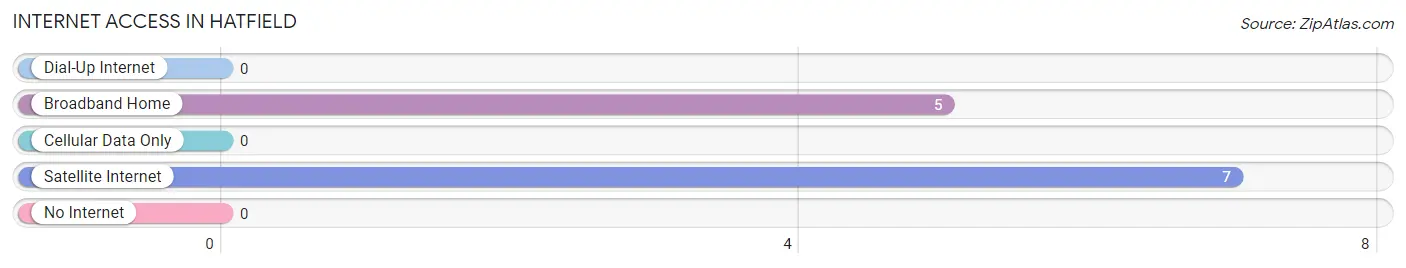
| Internet Type | # Households | % Households |
| Dial-Up Internet | 0 | 0.0% |
| Broadband Home | 5 | 41.7% |
| Cellular Data Only | 0 | 0.0% |
| Satellite Internet | 7 | 58.3% |
| No Internet | 0 | 0.0% |
| Total | 12 | 100.0% |
Hatfield Summary
Hatfield, Minnesota is a small town located in the northwestern corner of the state, near the border of North Dakota. It is part of the Red River Valley region, and is situated on the banks of the Red River. The town has a population of just over 500 people, and is the county seat of Kittson County.
History
Hatfield was founded in 1881 by a group of Norwegian settlers. The town was named after the nearby Hatfield Creek, which was named after a settler named Hatfield. The town was originally a farming community, and the settlers grew wheat, oats, and barley. The town was incorporated in 1883, and the first post office was established in 1884.
In the early 1900s, the town began to grow and prosper. The railroad arrived in 1906, and the town became a hub for the surrounding area. The railroad brought new businesses and industries to the town, and the population began to grow.
In the 1950s, the town began to decline. The railroad was abandoned, and many of the businesses and industries left the town. The population began to decline, and the town became a small, rural community.
Geography
Hatfield is located in the northwestern corner of Minnesota, near the border of North Dakota. It is part of the Red River Valley region, and is situated on the banks of the Red River. The town is surrounded by rolling hills and farmland, and is located about 30 miles from the nearest major city, Grand Forks, North Dakota.
The climate in Hatfield is typical of the northern plains region. Summers are warm and humid, with temperatures reaching into the 80s and 90s. Winters are cold and snowy, with temperatures often dropping below zero.
Economy
The economy of Hatfield is largely based on agriculture. The town is surrounded by farmland, and the main crops grown in the area are wheat, oats, and barley. The town also has a few small businesses, including a grocery store, a hardware store, and a few restaurants.
The town is also home to a few small manufacturing companies. These companies produce a variety of products, including furniture, clothing, and electronics.
Demographics
As of the 2010 census, the population of Hatfield was 514. The town is predominantly white, with 95.3% of the population being white. The median household income is $41,250, and the median age is 44.
The town is home to a variety of religious denominations, including Lutheran, Catholic, and Methodist. The town also has a small Native American population, with 1.2% of the population being Native American.
Conclusion
Hatfield, Minnesota is a small town located in the northwestern corner of the state, near the border of North Dakota. It is part of the Red River Valley region, and is situated on the banks of the Red River. The town has a population of just over 500 people, and is the county seat of Kittson County. The economy of Hatfield is largely based on agriculture, and the town is also home to a few small businesses and manufacturing companies. The town is predominantly white, with 95.3% of the population being white. The median household income is $41,250, and the median age is 44. Hatfield is a small, rural community that has a rich history and a bright future.
Common Questions
What is the Total Population of Hatfield?
Total Population of Hatfield is 32.
What is the Total Male Population of Hatfield?
Total Male Population of Hatfield is 14.
What is the Total Female Population of Hatfield?
Total Female Population of Hatfield is 18.
What is the Ratio of Males per 100 Females in Hatfield?
There are 77.78 Males per 100 Females in Hatfield.
What is the Ratio of Females per 100 Males in Hatfield?
There are 128.57 Females per 100 Males in Hatfield.
What is the Median Population Age in Hatfield?
Median Population Age in Hatfield is 32.7 Years.
What is the Average Family Size in Hatfield
Average Family Size in Hatfield is 3.2 People.
What is the Average Household Size in Hatfield
Average Household Size in Hatfield is 2.7 People.
What is Per Capita Income in Hatfield?
Per Capita income in Hatfield is $25,178.
What is the Median Family Income in Hatfield?
Median Family Income in Hatfield is $84,250.
What is the Median Household income in Hatfield?
Median Household Income in Hatfield is $83,500.
What is Inequality or Gini Index in Hatfield?
Inequality or Gini Index in Hatfield is 0.20.
How Large is the Labor Force in Hatfield?
There are 18 People in the Labor Forcein in Hatfield.
What is the Percentage of People in the Labor Force in Hatfield?
85.7% of People are in the Labor Force in Hatfield.