Evan, MN
Evan Map
Evan Overview
71
TOTAL POPULATION
29
MALE POPULATION
42
FEMALE POPULATION
69.05
MALES / 100 FEMALES
144.83
FEMALES / 100 MALES
50.8
MEDIAN AGE
3.1
AVG FAMILY SIZE
2.5
AVG HOUSEHOLD SIZE
$25,387
PER CAPITA INCOME
$39,375
AVG HOUSEHOLD INCOME
0.45
INEQUALITY / GINI INDEX
44
LABOR FORCE [ PEOPLE ]
72.1%
PERCENT IN LABOR FORCE
11.4%
UNEMPLOYMENT RATE
Evan Area Codes
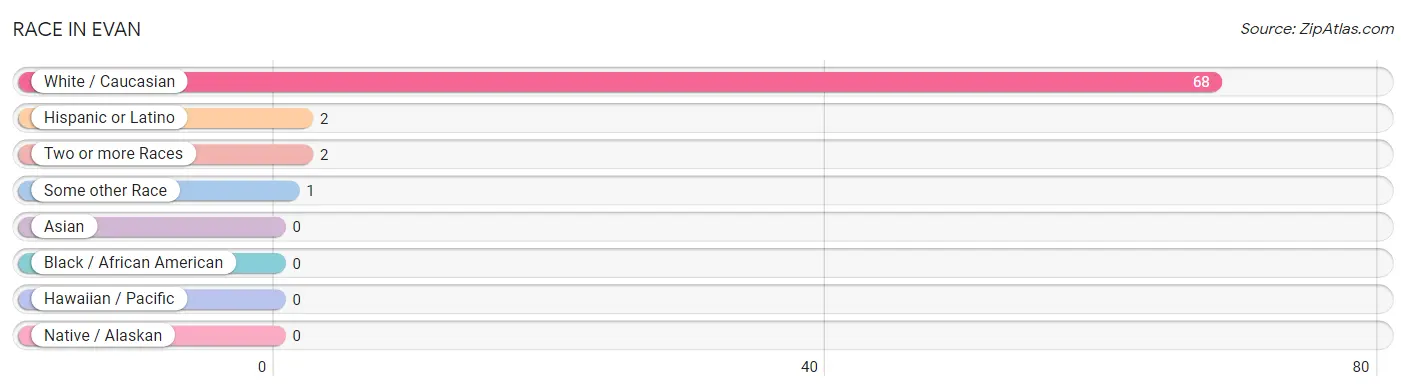
Race in Evan
The most populous races in Evan are White / Caucasian (68 | 95.8%), Hispanic or Latino (2 | 2.8%), and Two or more Races (2 | 2.8%).
| Race | # Population | % Population |
| Asian | 0 | 0.0% |
| Black / African American | 0 | 0.0% |
| Hawaiian / Pacific | 0 | 0.0% |
| Hispanic or Latino | 2 | 2.8% |
| Native / Alaskan | 0 | 0.0% |
| White / Caucasian | 68 | 95.8% |
| Two or more Races | 2 | 2.8% |
| Some other Race | 1 | 1.4% |
| Total | 71 | 100.0% |
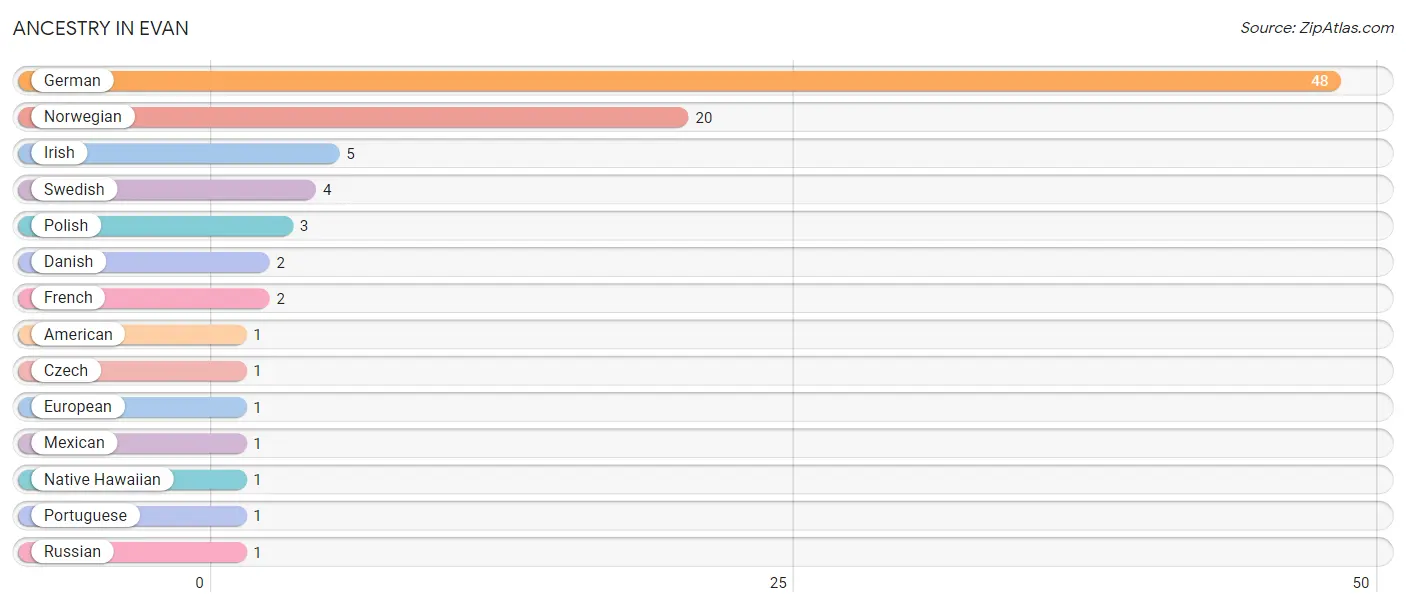
Ancestry in Evan
The most populous ancestries reported in Evan are German (48 | 67.6%), Norwegian (20 | 28.2%), Irish (5 | 7.0%), Swedish (4 | 5.6%), and Polish (3 | 4.2%), together accounting for 112.7% of all Evan residents.
| Ancestry | # Population | % Population |
| American | 1 | 1.4% |
| Czech | 1 | 1.4% |
| Danish | 2 | 2.8% |
| European | 1 | 1.4% |
| French | 2 | 2.8% |
| German | 48 | 67.6% |
| Irish | 5 | 7.0% |
| Mexican | 1 | 1.4% |
| Native Hawaiian | 1 | 1.4% |
| Norwegian | 20 | 28.2% |
| Polish | 3 | 4.2% |
| Portuguese | 1 | 1.4% |
| Russian | 1 | 1.4% |
| Swedish | 4 | 5.6% | View All 14 Rows |
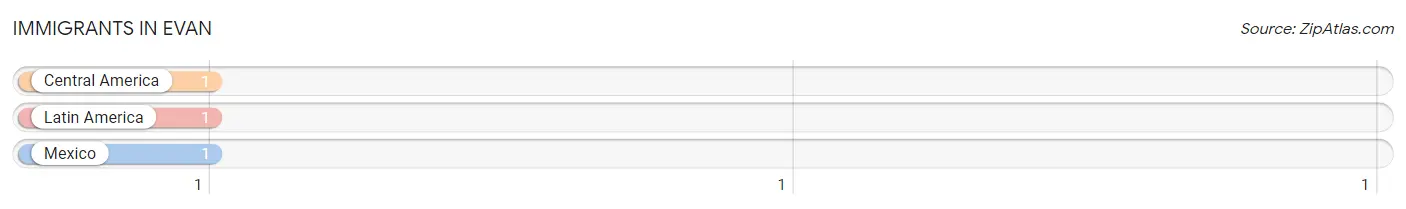
Immigrants in Evan
The most numerous immigrant groups reported in Evan came from Central America (1 | 1.4%), Latin America (1 | 1.4%), and Mexico (1 | 1.4%), together accounting for 4.2% of all Evan residents.
| Immigration Origin | # Population | % Population |
| Central America | 1 | 1.4% |
| Latin America | 1 | 1.4% |
| Mexico | 1 | 1.4% | View All 3 Rows |
Sex and Age in Evan
Sex and Age in Evan
The most populous age groups in Evan are 60 to 64 Years (8 | 27.6%) for men and 35 to 39 Years (12 | 28.6%) for women.
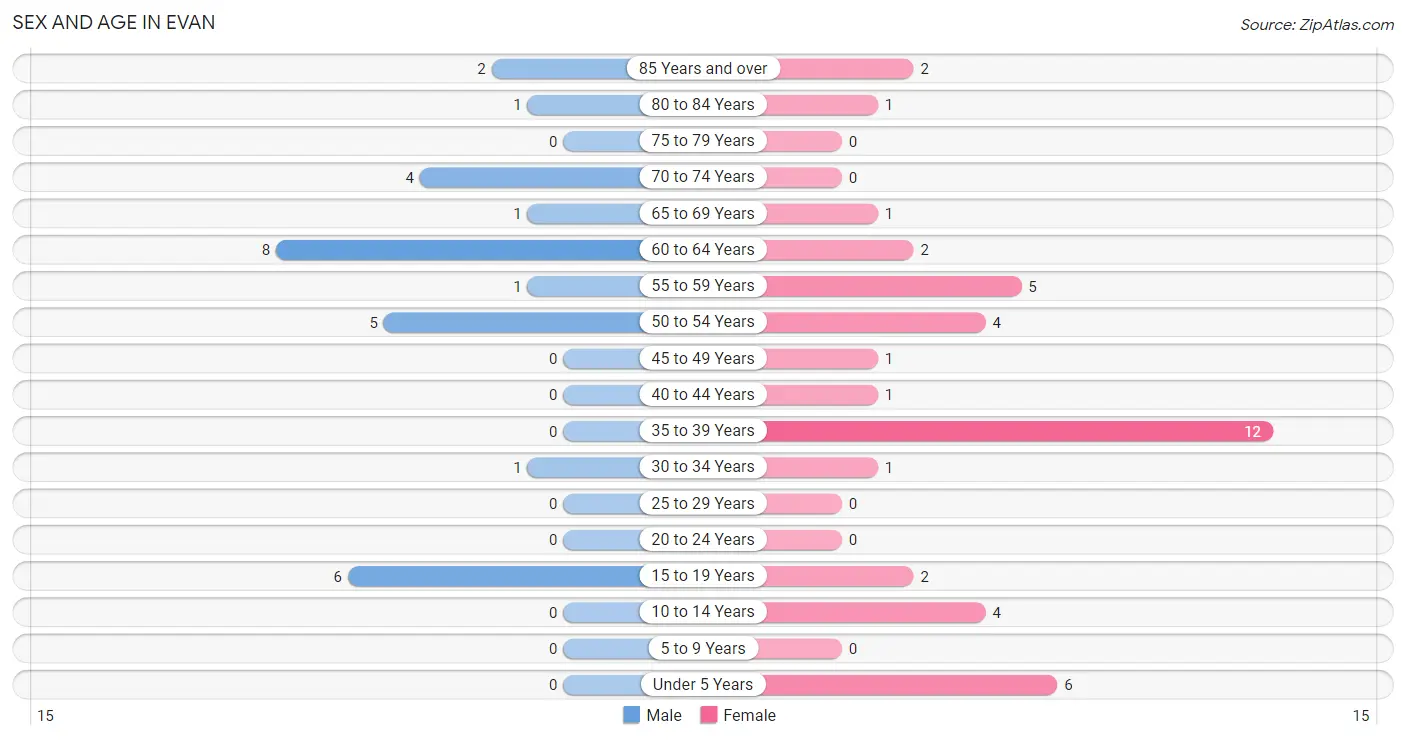
| Age Bracket | Male | Female |
| Under 5 Years | 0 (0.0%) | 6 (14.3%) |
| 5 to 9 Years | 0 (0.0%) | 0 (0.0%) |
| 10 to 14 Years | 0 (0.0%) | 4 (9.5%) |
| 15 to 19 Years | 6 (20.7%) | 2 (4.8%) |
| 20 to 24 Years | 0 (0.0%) | 0 (0.0%) |
| 25 to 29 Years | 0 (0.0%) | 0 (0.0%) |
| 30 to 34 Years | 1 (3.5%) | 1 (2.4%) |
| 35 to 39 Years | 0 (0.0%) | 12 (28.6%) |
| 40 to 44 Years | 0 (0.0%) | 1 (2.4%) |
| 45 to 49 Years | 0 (0.0%) | 1 (2.4%) |
| 50 to 54 Years | 5 (17.2%) | 4 (9.5%) |
| 55 to 59 Years | 1 (3.5%) | 5 (11.9%) |
| 60 to 64 Years | 8 (27.6%) | 2 (4.8%) |
| 65 to 69 Years | 1 (3.5%) | 1 (2.4%) |
| 70 to 74 Years | 4 (13.8%) | 0 (0.0%) |
| 75 to 79 Years | 0 (0.0%) | 0 (0.0%) |
| 80 to 84 Years | 1 (3.5%) | 1 (2.4%) |
| 85 Years and over | 2 (6.9%) | 2 (4.8%) |
| Total | 29 (100.0%) | 42 (100.0%) |
Families and Households in Evan
Median Family Size in Evan
The median family size in Evan is 3.11 persons per family, with single male/father families (3 | 15.8%) accounting for the largest median family size of 3.67 persons per family. On the other hand, single female/mother families (4 | 21.0%) represent the smallest median family size with 2.00 persons per family.
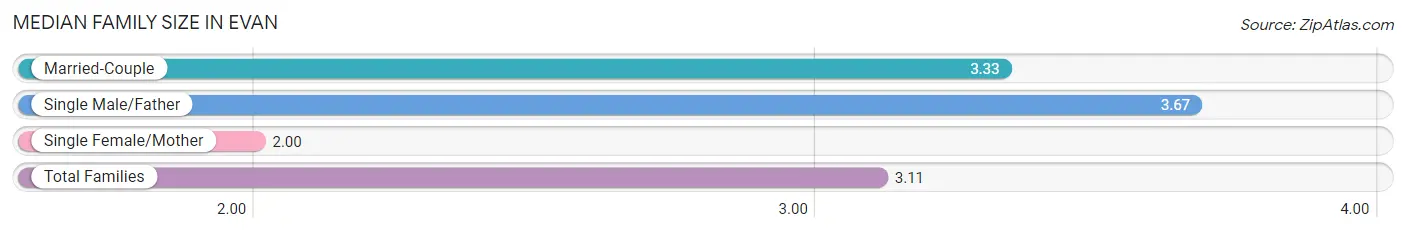
| Family Type | # Families | Family Size |
| Married-Couple | 12 (63.2%) | 3.33 |
| Single Male/Father | 3 (15.8%) | 3.67 |
| Single Female/Mother | 4 (21.0%) | 2.00 |
| Total Families | 19 (100.0%) | 3.11 |
Median Household Size in Evan
The median household size in Evan is 2.45 persons per household, with single male/father households (3 | 10.3%) accounting for the largest median household size of 3.67 persons per household. non-family households (10 | 34.5%) represent the smallest median household size with 1.20 persons per household.
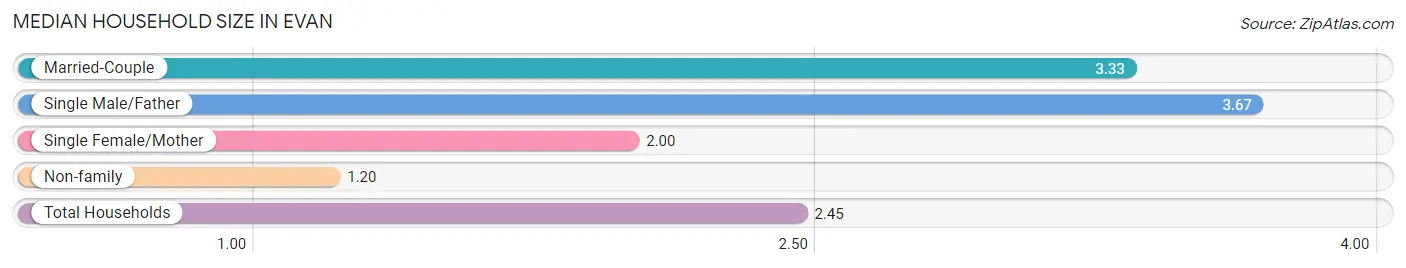
| Household Type | # Households | Household Size |
| Married-Couple | 12 (41.4%) | 3.33 |
| Single Male/Father | 3 (10.3%) | 3.67 |
| Single Female/Mother | 4 (13.8%) | 2.00 |
| Non-family | 10 (34.5%) | 1.20 |
| Total Households | 29 (100.0%) | 2.45 |
Household Size by Marriage Status in Evan
Out of a total of 29 households in Evan, 19 (65.5%) are family households, while 10 (34.5%) are nonfamily households. The most numerous type of family households are 2-person households, comprising 14, and the most common type of nonfamily households are 1-person households, comprising 8.
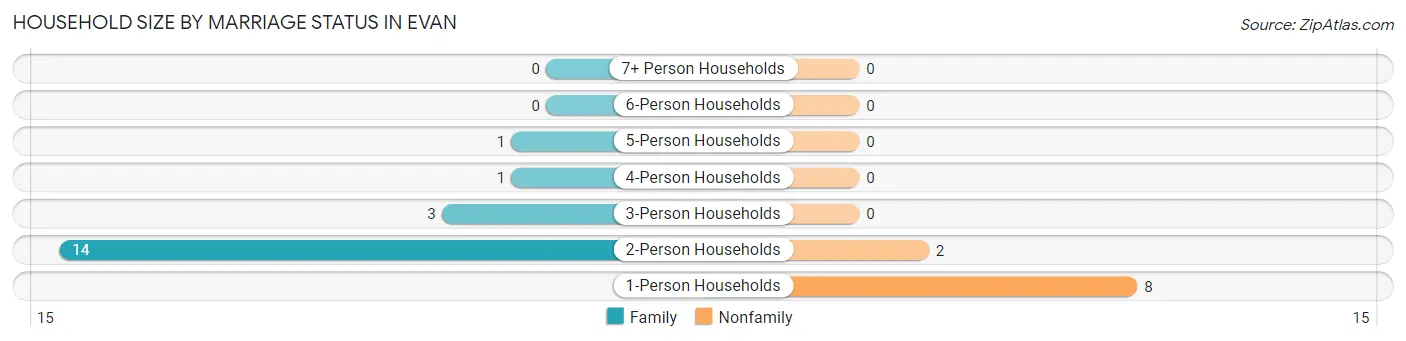
| Household Size | Family Households | Nonfamily Households |
| 1-Person Households | - | 8 (27.6%) |
| 2-Person Households | 14 (48.3%) | 2 (6.9%) |
| 3-Person Households | 3 (10.3%) | 0 (0.0%) |
| 4-Person Households | 1 (3.5%) | 0 (0.0%) |
| 5-Person Households | 1 (3.5%) | 0 (0.0%) |
| 6-Person Households | 0 (0.0%) | 0 (0.0%) |
| 7+ Person Households | 0 (0.0%) | 0 (0.0%) |
| Total | 19 (65.5%) | 10 (34.5%) |
Female Fertility in Evan
Fertility by Age in Evan
| Age Bracket | Women with Births | Births / 1,000 Women |
| 15 to 19 years | 0 (0.0%) | 0.0 |
| 20 to 34 years | 0 (0.0%) | 0.0 |
| 35 to 50 years | 0 (0.0%) | 0.0 |
| Total | 0 (0.0%) | 0.0 |
Fertility by Age by Marriage Status in Evan
| Age Bracket | Married | Unmarried |
| 15 to 19 years | 0 (0.0%) | 0 (0.0%) |
| 20 to 34 years | 0 (0.0%) | 0 (0.0%) |
| 35 to 50 years | 0 (0.0%) | 0 (0.0%) |
| Total | 0 (0.0%) | 0 (0.0%) |
Fertility by Education in Evan
| Educational Attainment | Women with Births | Births / 1,000 Women |
| Less than High School | 0 (0.0%) | 0.0 |
| High School Diploma | 0 (0.0%) | 0.0 |
| College or Associate's Degree | 0 (0.0%) | 0.0 |
| Bachelor's Degree | 0 (0.0%) | 0.0 |
| Graduate Degree | 0 (0.0%) | 0.0 |
| Total | 0 (0.0%) | 0.0 |
Fertility by Education by Marriage Status in Evan
| Educational Attainment | Married | Unmarried |
| Less than High School | 0 (0.0%) | 0 (0.0%) |
| High School Diploma | 0 (0.0%) | 0 (0.0%) |
| College or Associate's Degree | 0 (0.0%) | 0 (0.0%) |
| Bachelor's Degree | 0 (0.0%) | 0 (0.0%) |
| Graduate Degree | 0 (0.0%) | 0 (0.0%) |
| Total | 0 (0.0%) | 0 (0.0%) |
Income in Evan
Income Overview in Evan
| Characteristic | Number | Measure |
| Per Capita Income | 71 | $25,387 |
| Median Family Income | 19 | $0 |
| Mean Family Income | 19 | $70,505 |
| Median Household Income | 29 | $39,375 |
| Mean Household Income | 29 | $58,090 |
| Income Deficit | 19 | $0 |
| Wage / Income Gap (%) | 71 | 0.00% |
| Wage / Income Gap ($) | 71 | 100.00¢ per $1 |
| Gini / Inequality Index | 71 | 0.45 |
Earnings by Sex in Evan
| Sex | Number | Average Earnings |
| Male | 21 (43.8%) | $0 |
| Female | 27 (56.2%) | $0 |
| Total | 48 (100.0%) | $0 |
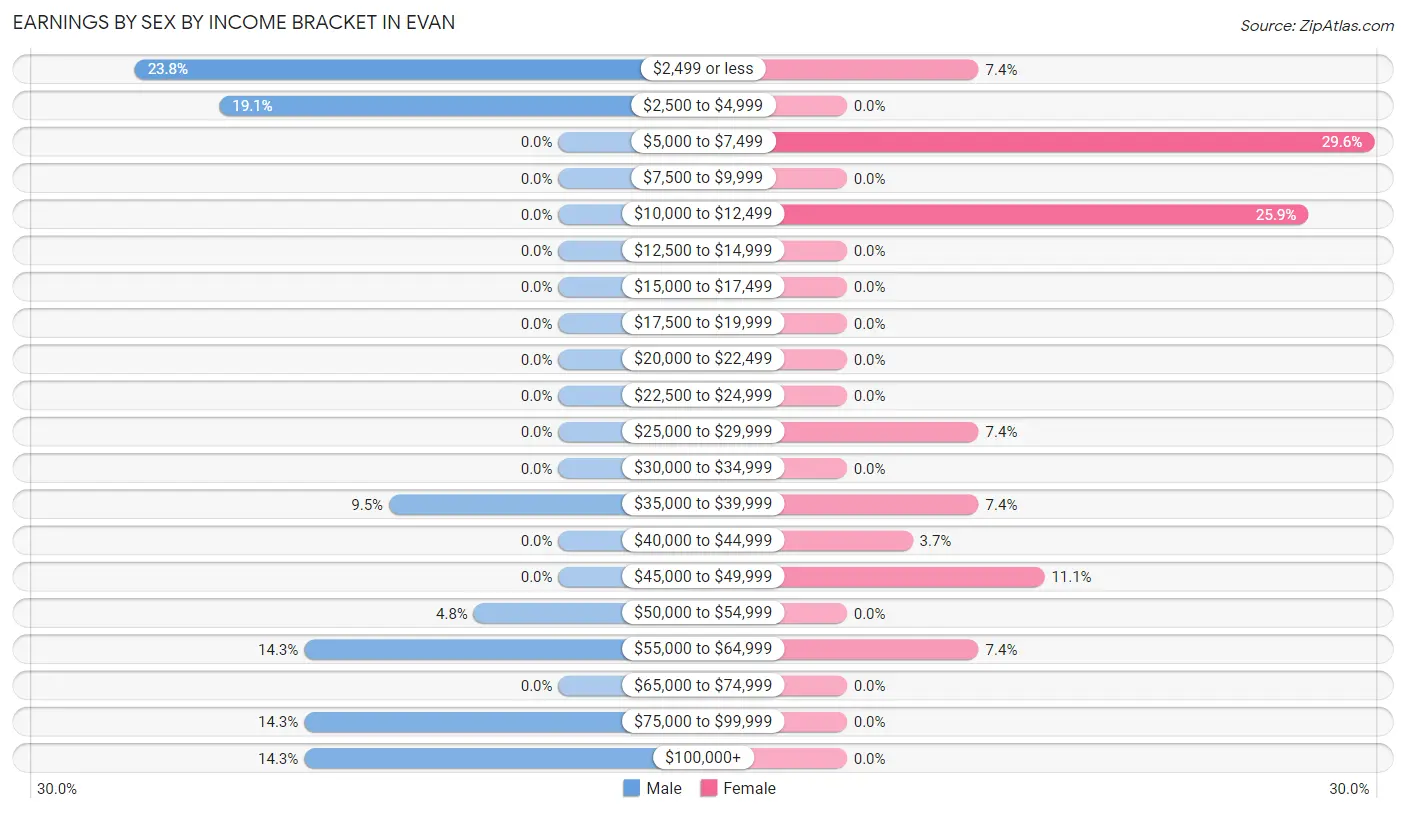
Earnings by Sex by Income Bracket in Evan
The most common earnings brackets in Evan are $2,499 or less for men (5 | 23.8%) and $5,000 to $7,499 for women (8 | 29.6%).
| Income | Male | Female |
| $2,499 or less | 5 (23.8%) | 2 (7.4%) |
| $2,500 to $4,999 | 4 (19.1%) | 0 (0.0%) |
| $5,000 to $7,499 | 0 (0.0%) | 8 (29.6%) |
| $7,500 to $9,999 | 0 (0.0%) | 0 (0.0%) |
| $10,000 to $12,499 | 0 (0.0%) | 7 (25.9%) |
| $12,500 to $14,999 | 0 (0.0%) | 0 (0.0%) |
| $15,000 to $17,499 | 0 (0.0%) | 0 (0.0%) |
| $17,500 to $19,999 | 0 (0.0%) | 0 (0.0%) |
| $20,000 to $22,499 | 0 (0.0%) | 0 (0.0%) |
| $22,500 to $24,999 | 0 (0.0%) | 0 (0.0%) |
| $25,000 to $29,999 | 0 (0.0%) | 2 (7.4%) |
| $30,000 to $34,999 | 0 (0.0%) | 0 (0.0%) |
| $35,000 to $39,999 | 2 (9.5%) | 2 (7.4%) |
| $40,000 to $44,999 | 0 (0.0%) | 1 (3.7%) |
| $45,000 to $49,999 | 0 (0.0%) | 3 (11.1%) |
| $50,000 to $54,999 | 1 (4.8%) | 0 (0.0%) |
| $55,000 to $64,999 | 3 (14.3%) | 2 (7.4%) |
| $65,000 to $74,999 | 0 (0.0%) | 0 (0.0%) |
| $75,000 to $99,999 | 3 (14.3%) | 0 (0.0%) |
| $100,000+ | 3 (14.3%) | 0 (0.0%) |
| Total | 21 (100.0%) | 27 (100.0%) |
Earnings by Sex by Educational Attainment in Evan
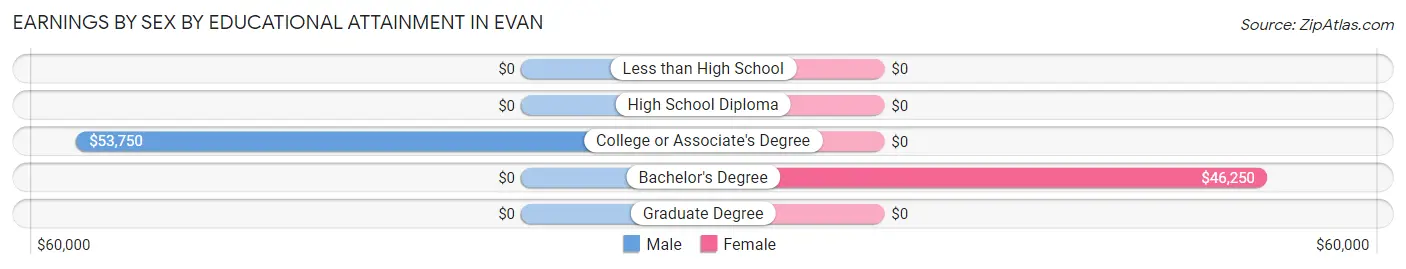
| Educational Attainment | Male Income | Female Income |
| Less than High School | - | - |
| High School Diploma | - | - |
| College or Associate's Degree | $53,750 | $0 |
| Bachelor's Degree | - | - |
| Graduate Degree | - | - |
| Total | $55,625 | $0 |
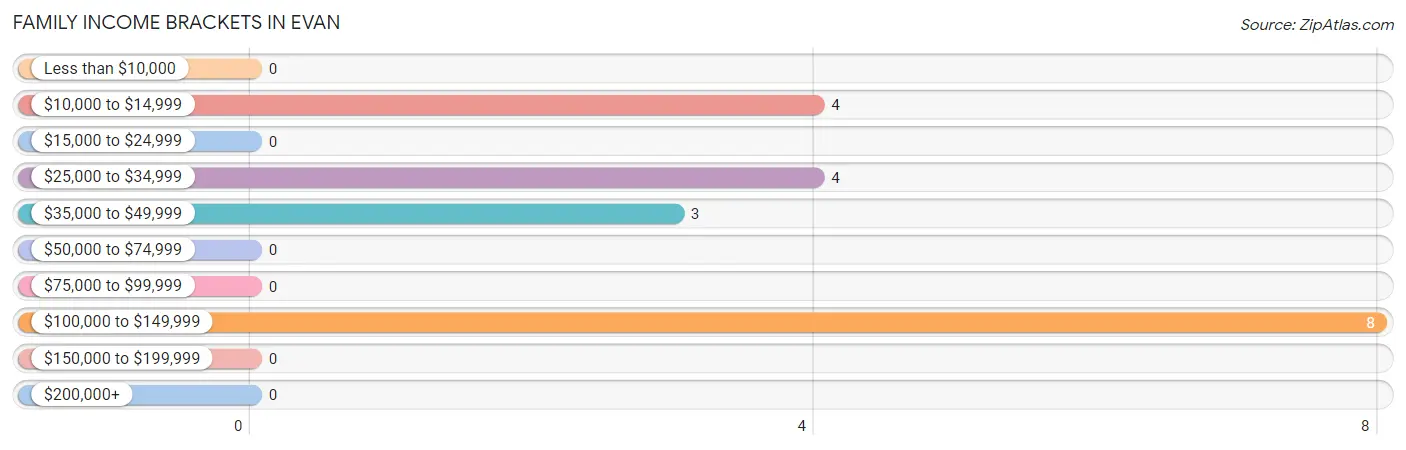
Family Income in Evan
Family Income Brackets in Evan
According to the Evan family income data, there are 8 families falling into the $100,000 to $149,999 income range, which is the most common income bracket and makes up 42.1% of all families.
| Income Bracket | # Families | % Families |
| Less than $10,000 | 0 | 0.0% |
| $10,000 to $14,999 | 4 | 21.1% |
| $15,000 to $24,999 | 0 | 0.0% |
| $25,000 to $34,999 | 4 | 21.1% |
| $35,000 to $49,999 | 3 | 15.8% |
| $50,000 to $74,999 | 0 | 0.0% |
| $75,000 to $99,999 | 0 | 0.0% |
| $100,000 to $149,999 | 8 | 42.1% |
| $150,000 to $199,999 | 0 | 0.0% |
| $200,000+ | 0 | 0.0% |
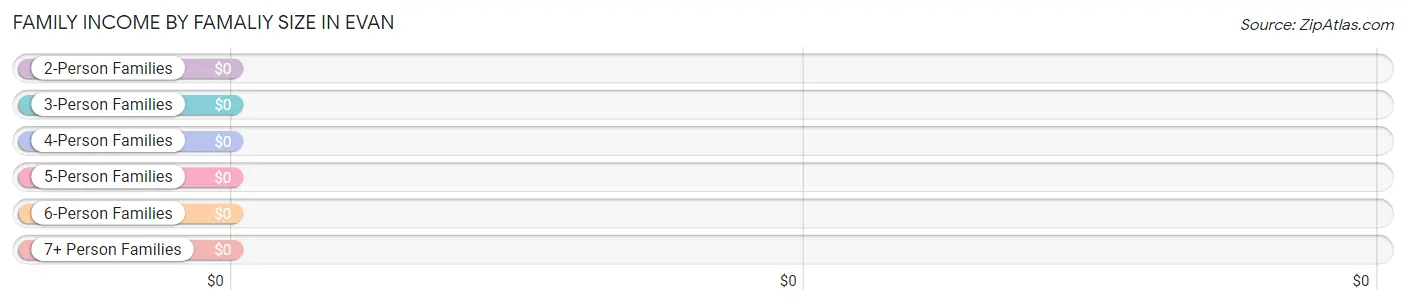
Family Income by Famaliy Size in Evan
| Income Bracket | # Families | Median Income |
| 2-Person Families | 14 (73.7%) | $0 |
| 3-Person Families | 3 (15.8%) | $0 |
| 4-Person Families | 1 (5.3%) | $0 |
| 5-Person Families | 1 (5.3%) | $0 |
| 6-Person Families | 0 (0.0%) | $0 |
| 7+ Person Families | 0 (0.0%) | $0 |
| Total | 19 (100.0%) | $0 |
Family Income by Number of Earners in Evan
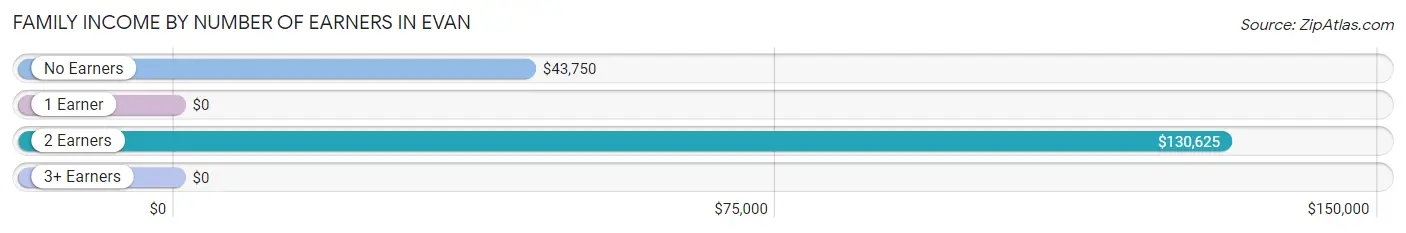
| Number of Earners | # Families | Median Income |
| No Earners | 3 (15.8%) | $43,750 |
| 1 Earner | 4 (21.0%) | $0 |
| 2 Earners | 11 (57.9%) | $130,625 |
| 3+ Earners | 1 (5.3%) | $0 |
| Total | 19 (100.0%) | $0 |
Household Income in Evan
Household Income Brackets in Evan
With 8 households falling in the category, the $100,000 to $149,999 income range is the most frequent in Evan, accounting for 27.6% of all households.
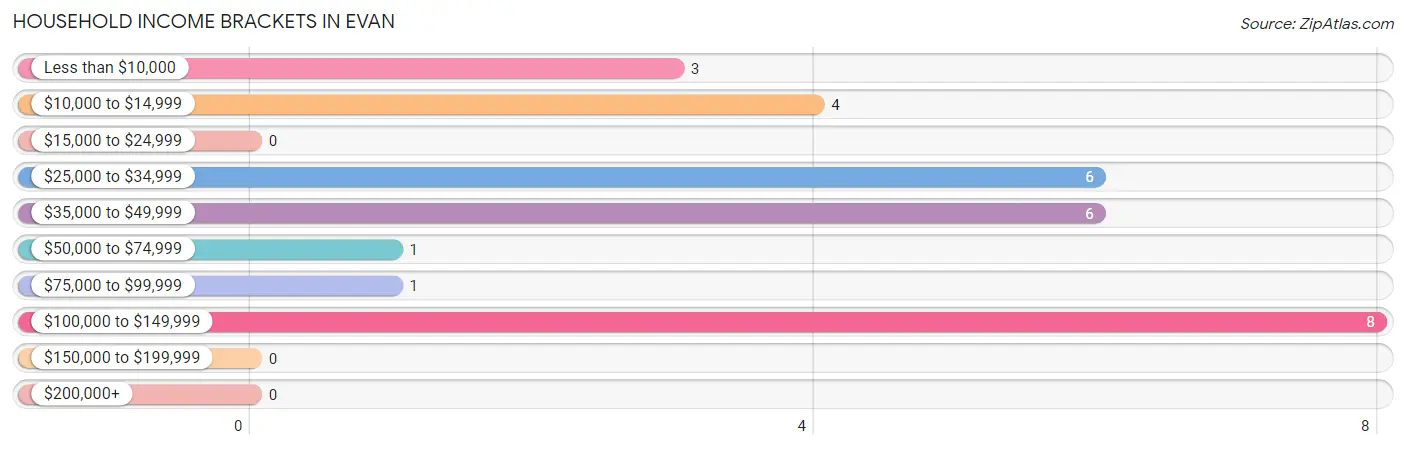
| Income Bracket | # Households | % Households |
| Less than $10,000 | 3 | 10.3% |
| $10,000 to $14,999 | 4 | 13.8% |
| $15,000 to $24,999 | 0 | 0.0% |
| $25,000 to $34,999 | 6 | 20.7% |
| $35,000 to $49,999 | 6 | 20.7% |
| $50,000 to $74,999 | 1 | 3.4% |
| $75,000 to $99,999 | 1 | 3.4% |
| $100,000 to $149,999 | 8 | 27.6% |
| $150,000 to $199,999 | 0 | 0.0% |
| $200,000+ | 0 | 0.0% |
Household Income by Householder Age in Evan
The median household income in Evan is $39,375, with the highest median household income of $57,500 found in the 65+ years age bracket for the primary householder. A total of 6 households (20.7%) fall into this category.
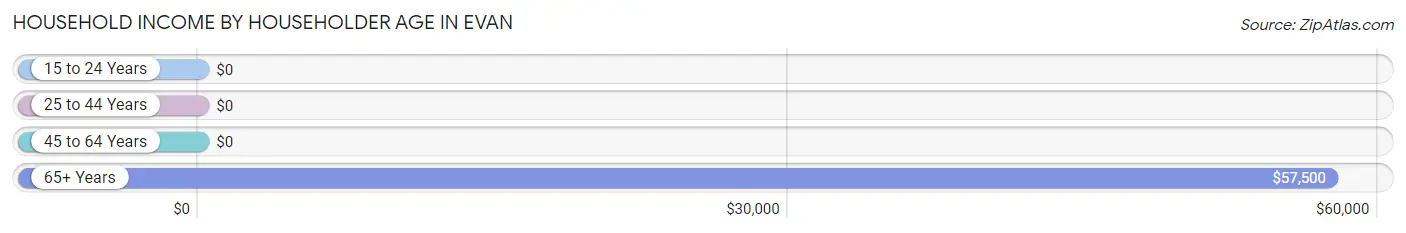
| Income Bracket | # Households | Median Income |
| 15 to 24 Years | 0 (0.0%) | $0 |
| 25 to 44 Years | 6 (20.7%) | $0 |
| 45 to 64 Years | 17 (58.6%) | $0 |
| 65+ Years | 6 (20.7%) | $57,500 |
| Total | 29 (100.0%) | $39,375 |
Poverty in Evan
Income Below Poverty by Sex and Age in Evan
With 17.2% poverty level for males and 19.1% for females among the residents of Evan, 65 to 74 year old males and 12 to 14 year old females are the most vulnerable to poverty, with 2 males (40.0%) and 4 females (100.0%) in their respective age groups living below the poverty level.
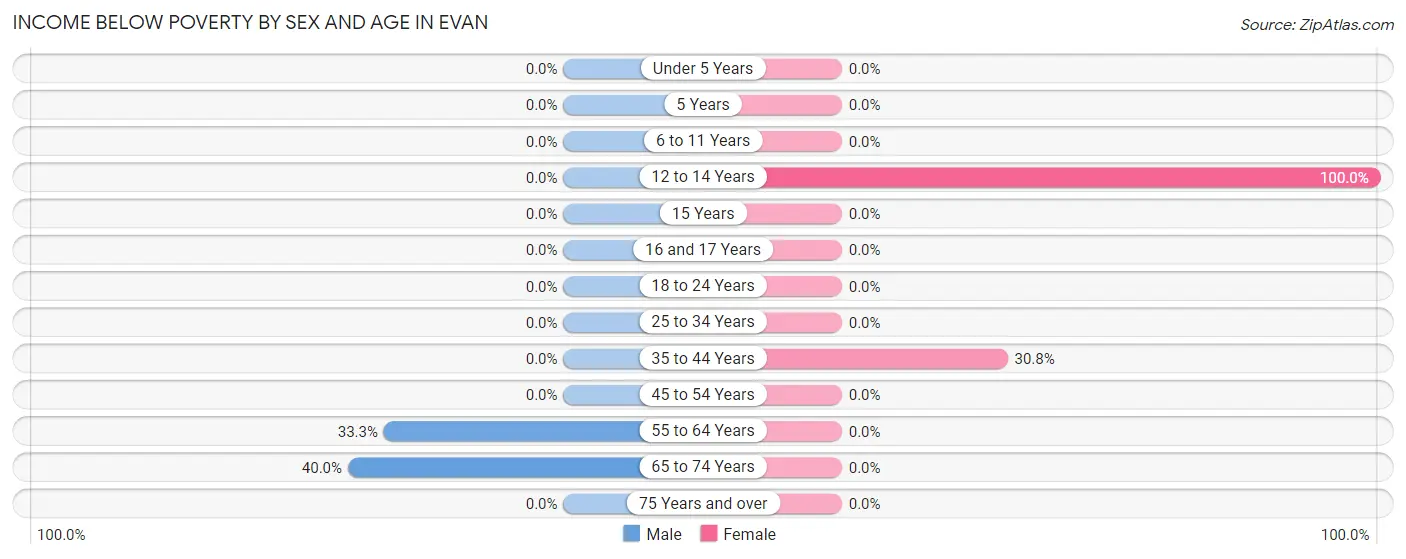
| Age Bracket | Male | Female |
| Under 5 Years | 0 (0.0%) | 0 (0.0%) |
| 5 Years | 0 (0.0%) | 0 (0.0%) |
| 6 to 11 Years | 0 (0.0%) | 0 (0.0%) |
| 12 to 14 Years | 0 (0.0%) | 4 (100.0%) |
| 15 Years | 0 (0.0%) | 0 (0.0%) |
| 16 and 17 Years | 0 (0.0%) | 0 (0.0%) |
| 18 to 24 Years | 0 (0.0%) | 0 (0.0%) |
| 25 to 34 Years | 0 (0.0%) | 0 (0.0%) |
| 35 to 44 Years | 0 (0.0%) | 4 (30.8%) |
| 45 to 54 Years | 0 (0.0%) | 0 (0.0%) |
| 55 to 64 Years | 3 (33.3%) | 0 (0.0%) |
| 65 to 74 Years | 2 (40.0%) | 0 (0.0%) |
| 75 Years and over | 0 (0.0%) | 0 (0.0%) |
| Total | 5 (17.2%) | 8 (19.1%) |
Income Above Poverty by Sex and Age in Evan
According to the poverty statistics in Evan, males aged 16 and 17 years and females aged under 5 years are the age groups that are most secure financially, with 100.0% of males and 100.0% of females in these age groups living above the poverty line.
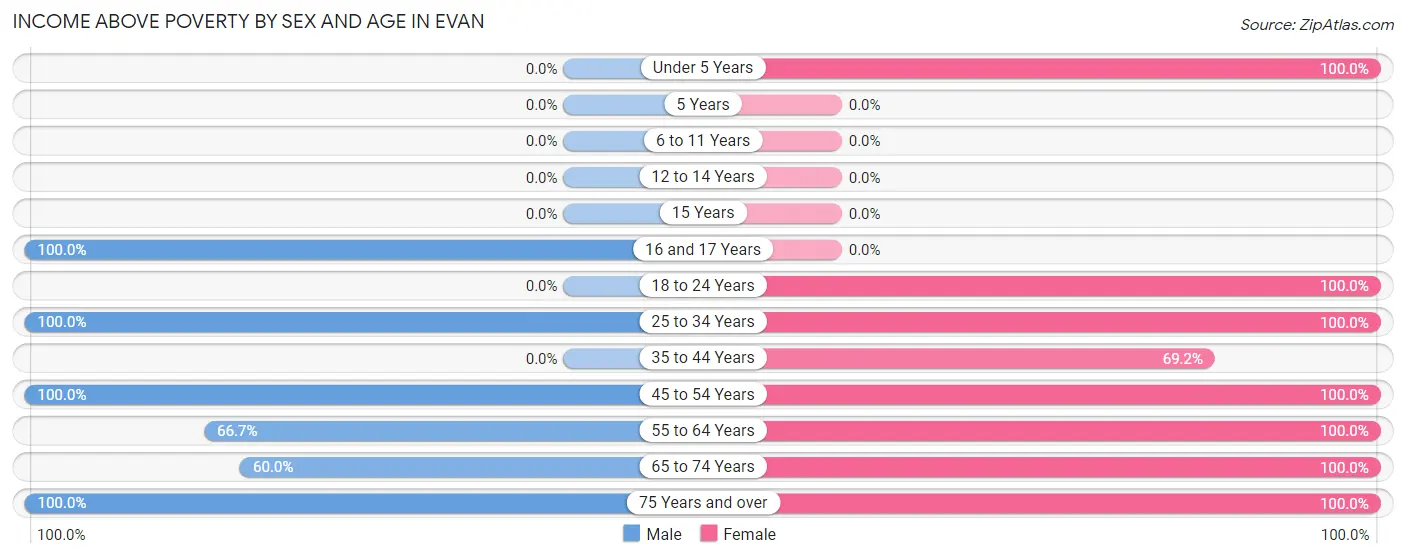
| Age Bracket | Male | Female |
| Under 5 Years | 0 (0.0%) | 6 (100.0%) |
| 5 Years | 0 (0.0%) | 0 (0.0%) |
| 6 to 11 Years | 0 (0.0%) | 0 (0.0%) |
| 12 to 14 Years | 0 (0.0%) | 0 (0.0%) |
| 15 Years | 0 (0.0%) | 0 (0.0%) |
| 16 and 17 Years | 6 (100.0%) | 0 (0.0%) |
| 18 to 24 Years | 0 (0.0%) | 2 (100.0%) |
| 25 to 34 Years | 1 (100.0%) | 1 (100.0%) |
| 35 to 44 Years | 0 (0.0%) | 9 (69.2%) |
| 45 to 54 Years | 5 (100.0%) | 5 (100.0%) |
| 55 to 64 Years | 6 (66.7%) | 7 (100.0%) |
| 65 to 74 Years | 3 (60.0%) | 1 (100.0%) |
| 75 Years and over | 3 (100.0%) | 3 (100.0%) |
| Total | 24 (82.8%) | 34 (80.9%) |
Income Below Poverty Among Married-Couple Families in Evan
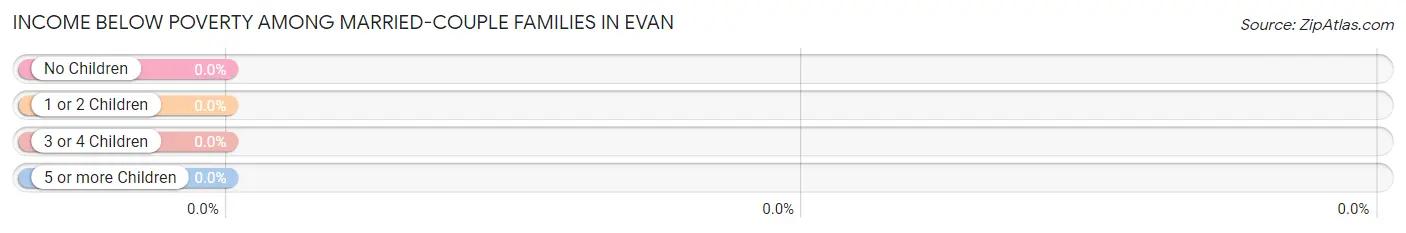
| Children | Above Poverty | Below Poverty |
| No Children | 7 (100.0%) | 0 (0.0%) |
| 1 or 2 Children | 4 (100.0%) | 0 (0.0%) |
| 3 or 4 Children | 1 (100.0%) | 0 (0.0%) |
| 5 or more Children | 0 (0.0%) | 0 (0.0%) |
| Total | 12 (100.0%) | 0 (0.0%) |
Income Below Poverty Among Single-Parent Households in Evan
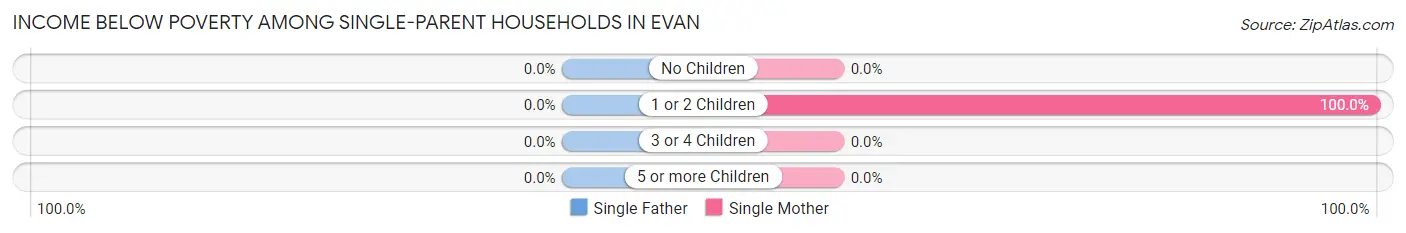
| Children | Single Father | Single Mother |
| No Children | 0 (0.0%) | 0 (0.0%) |
| 1 or 2 Children | 0 (0.0%) | 4 (100.0%) |
| 3 or 4 Children | 0 (0.0%) | 0 (0.0%) |
| 5 or more Children | 0 (0.0%) | 0 (0.0%) |
| Total | 0 (0.0%) | 4 (100.0%) |
Income Below Poverty Among Married-Couple vs Single-Parent Households in Evan
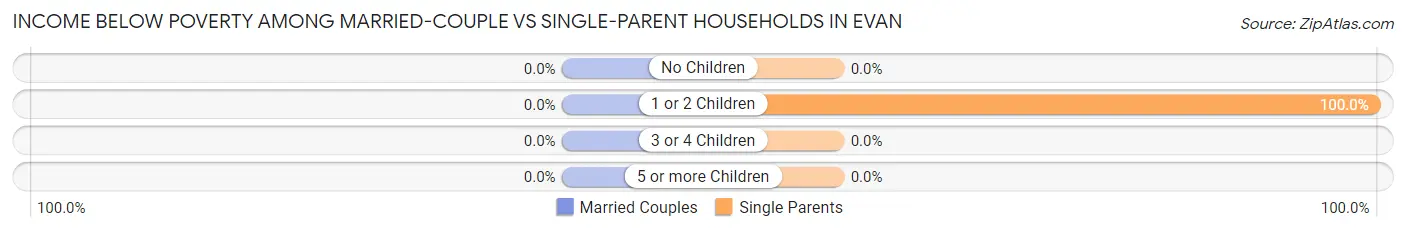
| Children | Married-Couple Families | Single-Parent Households |
| No Children | 0 (0.0%) | 0 (0.0%) |
| 1 or 2 Children | 0 (0.0%) | 4 (100.0%) |
| 3 or 4 Children | 0 (0.0%) | 0 (0.0%) |
| 5 or more Children | 0 (0.0%) | 0 (0.0%) |
| Total | 0 (0.0%) | 4 (57.1%) |
Employment Characteristics in Evan
Employment by Class of Employer in Evan
Among the 39 employed individuals in Evan, private company employees (22 | 56.4%), local government employees (9 | 23.1%), and not-for-profit organizations (5 | 12.8%) make up the most common classes of employment.
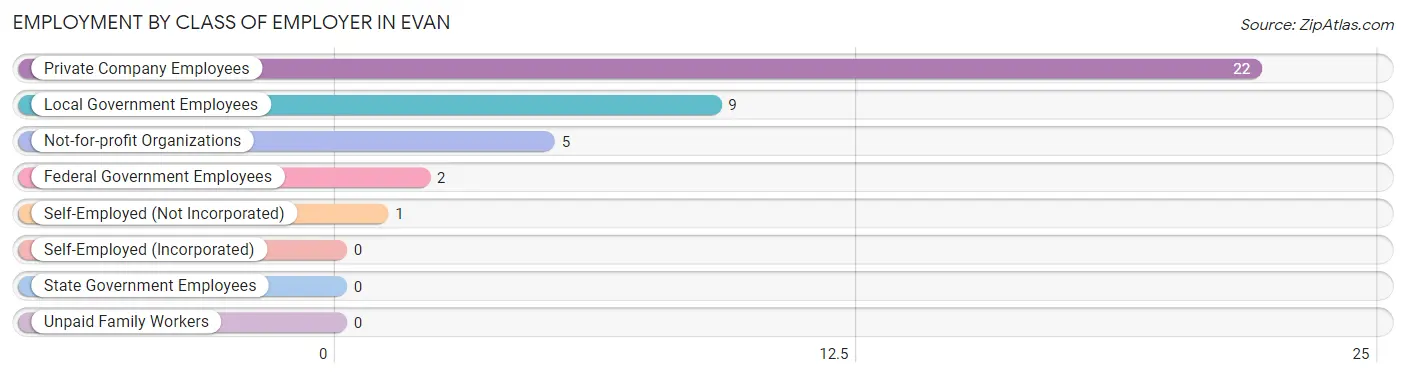
| Employer Class | # Employees | % Employees |
| Private Company Employees | 22 | 56.4% |
| Self-Employed (Incorporated) | 0 | 0.0% |
| Self-Employed (Not Incorporated) | 1 | 2.6% |
| Not-for-profit Organizations | 5 | 12.8% |
| Local Government Employees | 9 | 23.1% |
| State Government Employees | 0 | 0.0% |
| Federal Government Employees | 2 | 5.1% |
| Unpaid Family Workers | 0 | 0.0% |
| Total | 39 | 100.0% |
Employment Status by Age in Evan
According to the labor force statistics for Evan, out of the total population over 16 years of age (61), 72.1% or 44 individuals are in the labor force, with 11.4% or 5 of them unemployed. The age group with the highest labor force participation rate is 30 to 34 years, with 100.0% or 2 individuals in the labor force. Within the labor force, the 16 to 19 years age range has the highest percentage of unemployed individuals, with 66.7% or 4 of them being unemployed.
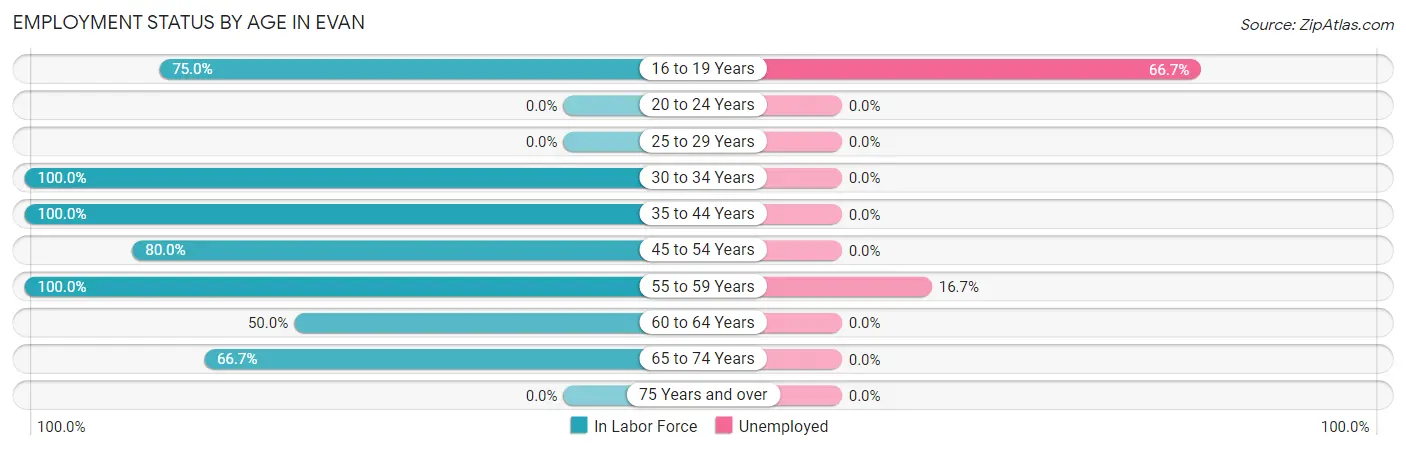
| Age Bracket | In Labor Force | Unemployed |
| 16 to 19 Years | 6 (75.0%) | 4 (66.7%) |
| 20 to 24 Years | 0 (0.0%) | 0 (0.0%) |
| 25 to 29 Years | 0 (0.0%) | 0 (0.0%) |
| 30 to 34 Years | 2 (100.0%) | 0 (0.0%) |
| 35 to 44 Years | 13 (100.0%) | 0 (0.0%) |
| 45 to 54 Years | 8 (80.0%) | 0 (0.0%) |
| 55 to 59 Years | 6 (100.0%) | 1 (16.7%) |
| 60 to 64 Years | 5 (50.0%) | 0 (0.0%) |
| 65 to 74 Years | 4 (66.7%) | 0 (0.0%) |
| 75 Years and over | 0 (0.0%) | 0 (0.0%) |
| Total | 44 (72.1%) | 5 (11.4%) |
Employment Status by Educational Attainment in Evan
According to labor force statistics for Evan, 82.9% of individuals (34) out of the total population between 25 and 64 years of age (41) are in the labor force, with 2.9% or 1 of them being unemployed. The group with the highest labor force participation rate are those with the educational attainment of bachelor's degree or higher, with 100.0% or 9 individuals in the labor force. Within the labor force, individuals with high school diploma education have the highest percentage of unemployment, with 7.7% or 1 of them being unemployed.
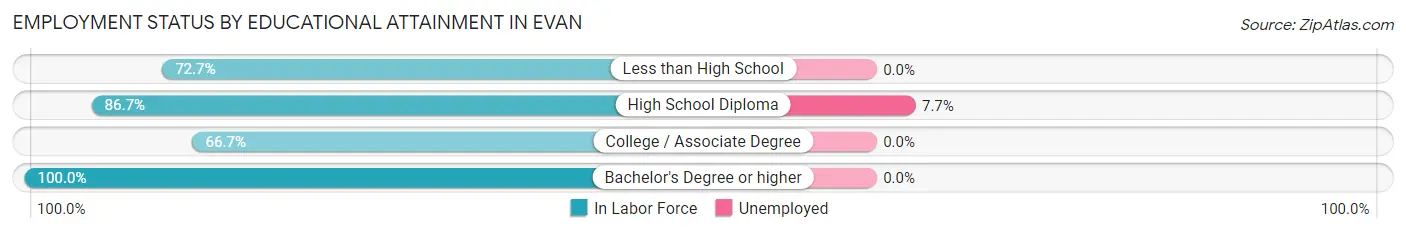
| Educational Attainment | In Labor Force | Unemployed |
| Less than High School | 8 (72.7%) | 0 (0.0%) |
| High School Diploma | 13 (86.7%) | 1 (7.7%) |
| College / Associate Degree | 4 (66.7%) | 0 (0.0%) |
| Bachelor's Degree or higher | 9 (100.0%) | 0 (0.0%) |
| Total | 34 (82.9%) | 1 (2.9%) |
Employment Occupations by Sex in Evan
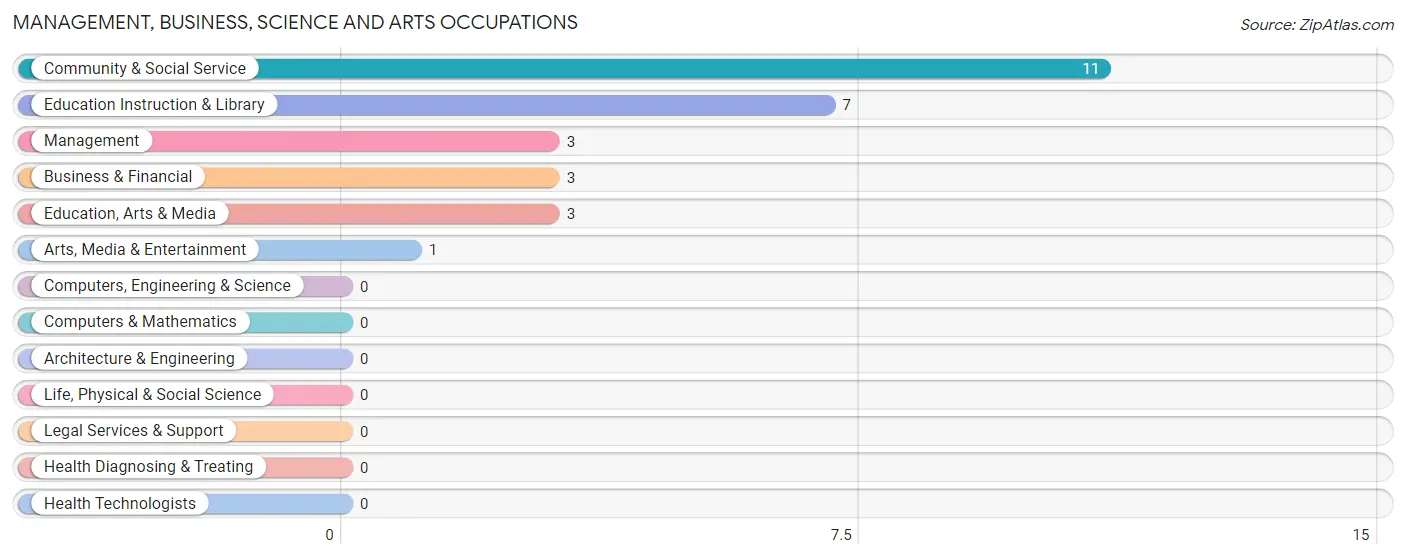
Management, Business, Science and Arts Occupations
The most common Management, Business, Science and Arts occupations in Evan are Community & Social Service (11 | 28.2%), Education Instruction & Library (7 | 17.9%), Management (3 | 7.7%), Business & Financial (3 | 7.7%), and Education, Arts & Media (3 | 7.7%).
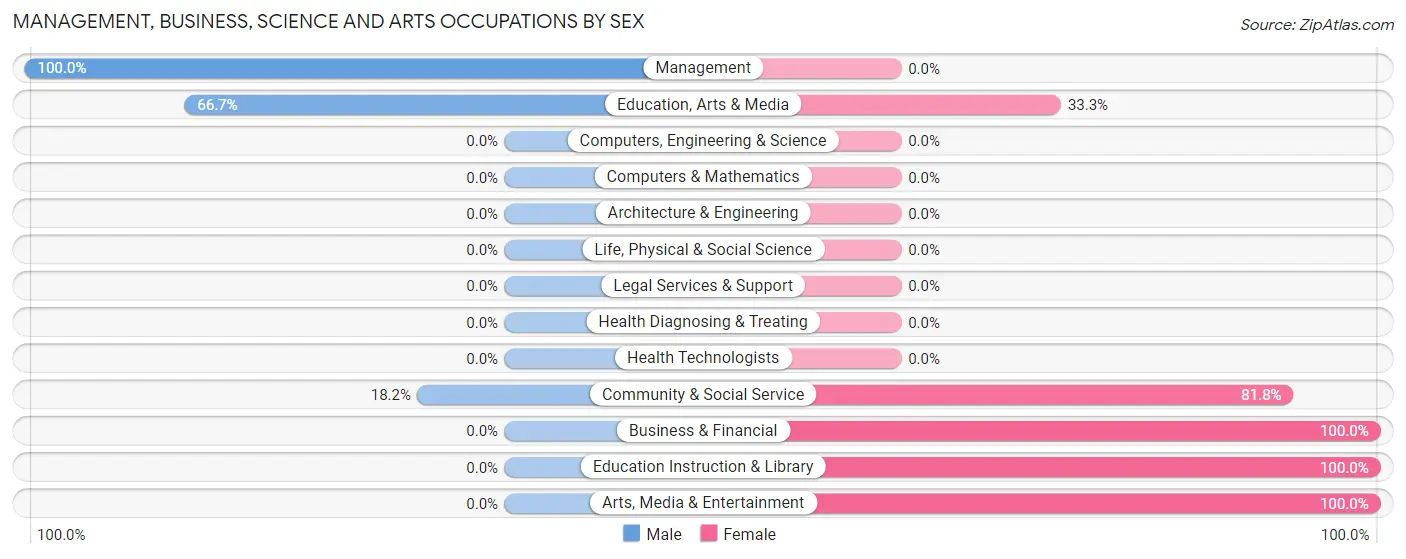
Management, Business, Science and Arts Occupations by Sex
Within the Management, Business, Science and Arts occupations in Evan, the most male-oriented occupations are Management (100.0%), Education, Arts & Media (66.7%), and Community & Social Service (18.2%), while the most female-oriented occupations are Business & Financial (100.0%), Education Instruction & Library (100.0%), and Arts, Media & Entertainment (100.0%).
| Occupation | Male | Female |
| Management | 3 (100.0%) | 0 (0.0%) |
| Business & Financial | 0 (0.0%) | 3 (100.0%) |
| Computers, Engineering & Science | 0 (0.0%) | 0 (0.0%) |
| Computers & Mathematics | 0 (0.0%) | 0 (0.0%) |
| Architecture & Engineering | 0 (0.0%) | 0 (0.0%) |
| Life, Physical & Social Science | 0 (0.0%) | 0 (0.0%) |
| Community & Social Service | 2 (18.2%) | 9 (81.8%) |
| Education, Arts & Media | 2 (66.7%) | 1 (33.3%) |
| Legal Services & Support | 0 (0.0%) | 0 (0.0%) |
| Education Instruction & Library | 0 (0.0%) | 7 (100.0%) |
| Arts, Media & Entertainment | 0 (0.0%) | 1 (100.0%) |
| Health Diagnosing & Treating | 0 (0.0%) | 0 (0.0%) |
| Health Technologists | 0 (0.0%) | 0 (0.0%) |
| Total (Category) | 5 (29.4%) | 12 (70.6%) |
| Total (Overall) | 12 (30.8%) | 27 (69.2%) |
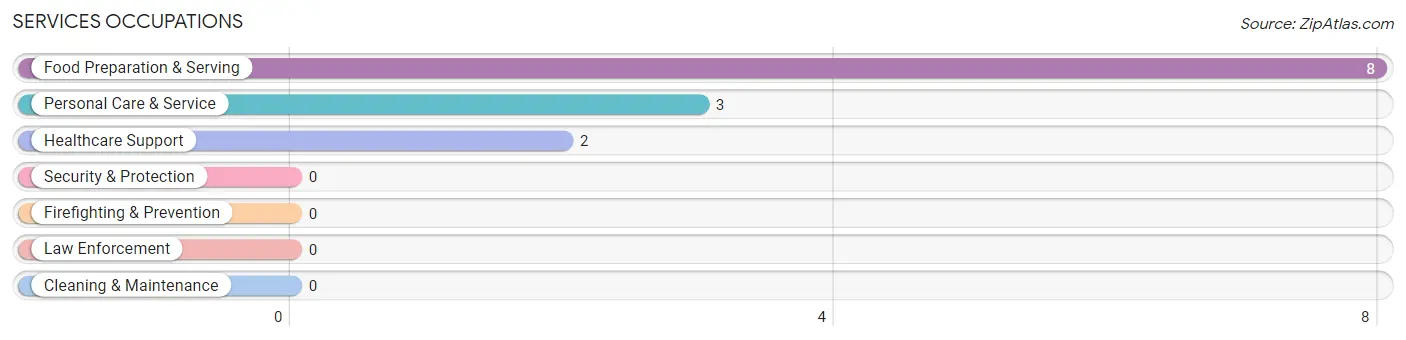
Services Occupations
The most common Services occupations in Evan are Food Preparation & Serving (8 | 20.5%), Personal Care & Service (3 | 7.7%), and Healthcare Support (2 | 5.1%).
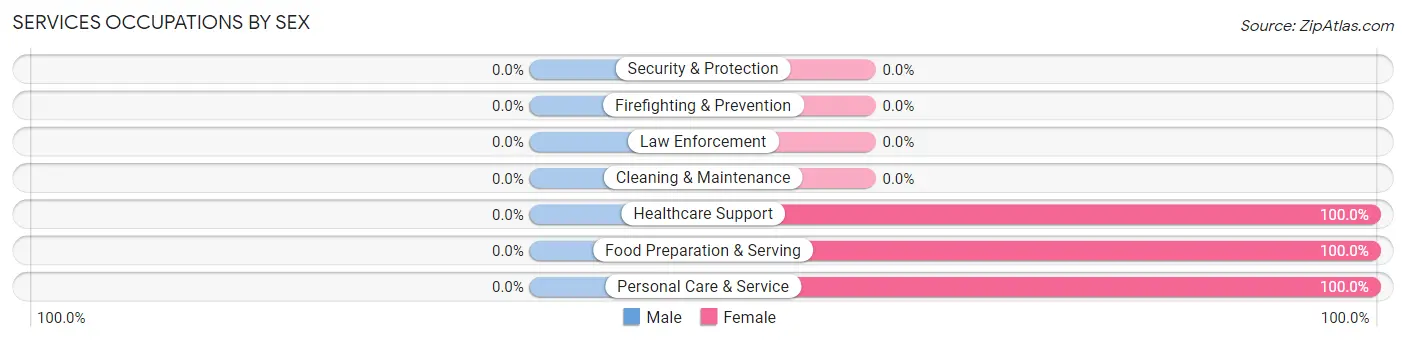
Services Occupations by Sex
| Occupation | Male | Female |
| Healthcare Support | 0 (0.0%) | 2 (100.0%) |
| Security & Protection | 0 (0.0%) | 0 (0.0%) |
| Firefighting & Prevention | 0 (0.0%) | 0 (0.0%) |
| Law Enforcement | 0 (0.0%) | 0 (0.0%) |
| Food Preparation & Serving | 0 (0.0%) | 8 (100.0%) |
| Cleaning & Maintenance | 0 (0.0%) | 0 (0.0%) |
| Personal Care & Service | 0 (0.0%) | 3 (100.0%) |
| Total (Category) | 0 (0.0%) | 13 (100.0%) |
| Total (Overall) | 12 (30.8%) | 27 (69.2%) |
Sales and Office Occupations
Sales and Office Occupations by Sex
| Occupation | Male | Female |
| Sales & Related | 0 (0.0%) | 0 (0.0%) |
| Office & Administration | 0 (0.0%) | 0 (0.0%) |
| Total (Category) | 0 (0.0%) | 0 (0.0%) |
| Total (Overall) | 12 (30.8%) | 27 (69.2%) |
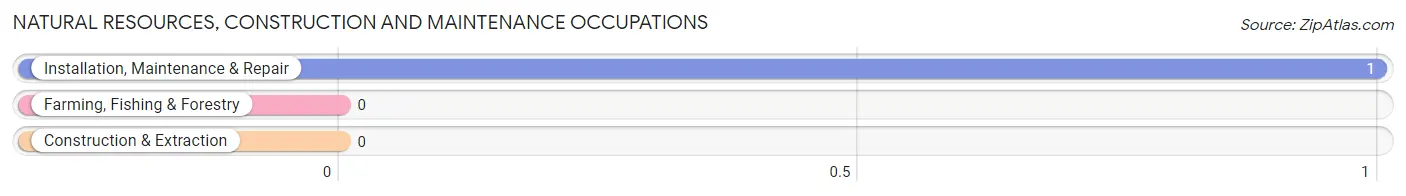
Natural Resources, Construction and Maintenance Occupations
The most common Natural Resources, Construction and Maintenance occupations in Evan are , and Installation, Maintenance & Repair (1 | 2.6%).
Natural Resources, Construction and Maintenance Occupations by Sex
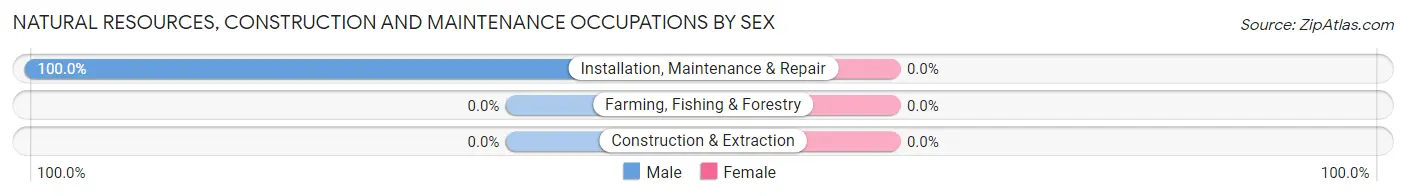
| Occupation | Male | Female |
| Farming, Fishing & Forestry | 0 (0.0%) | 0 (0.0%) |
| Construction & Extraction | 0 (0.0%) | 0 (0.0%) |
| Installation, Maintenance & Repair | 1 (100.0%) | 0 (0.0%) |
| Total (Category) | 1 (100.0%) | 0 (0.0%) |
| Total (Overall) | 12 (30.8%) | 27 (69.2%) |
Production, Transportation and Moving Occupations
The most common Production, Transportation and Moving occupations in Evan are Production (6 | 15.4%), Transportation (1 | 2.6%), and Material Moving (1 | 2.6%).
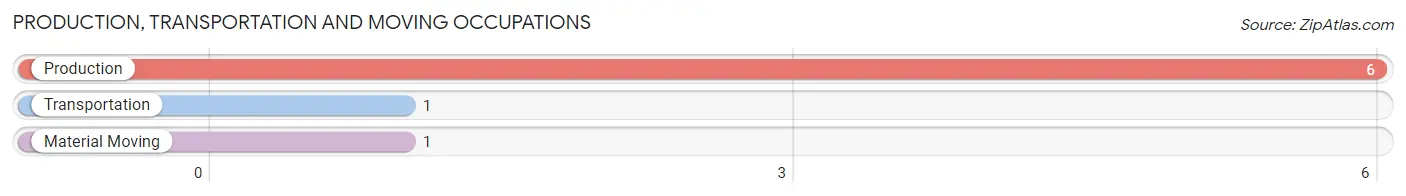
Production, Transportation and Moving Occupations by Sex
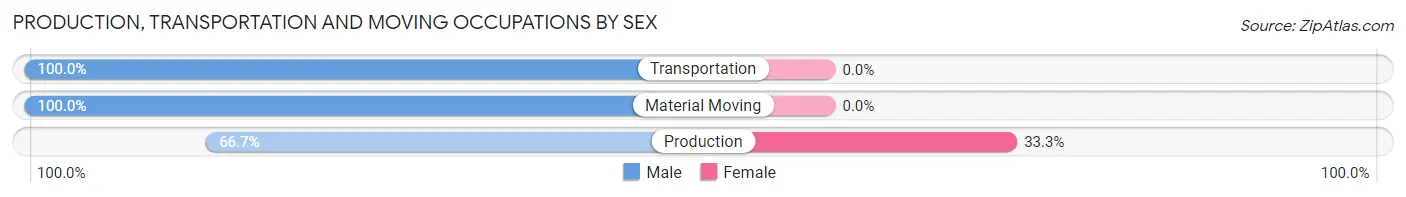
| Occupation | Male | Female |
| Production | 4 (66.7%) | 2 (33.3%) |
| Transportation | 1 (100.0%) | 0 (0.0%) |
| Material Moving | 1 (100.0%) | 0 (0.0%) |
| Total (Category) | 6 (75.0%) | 2 (25.0%) |
| Total (Overall) | 12 (30.8%) | 27 (69.2%) |
Employment Industries by Sex in Evan
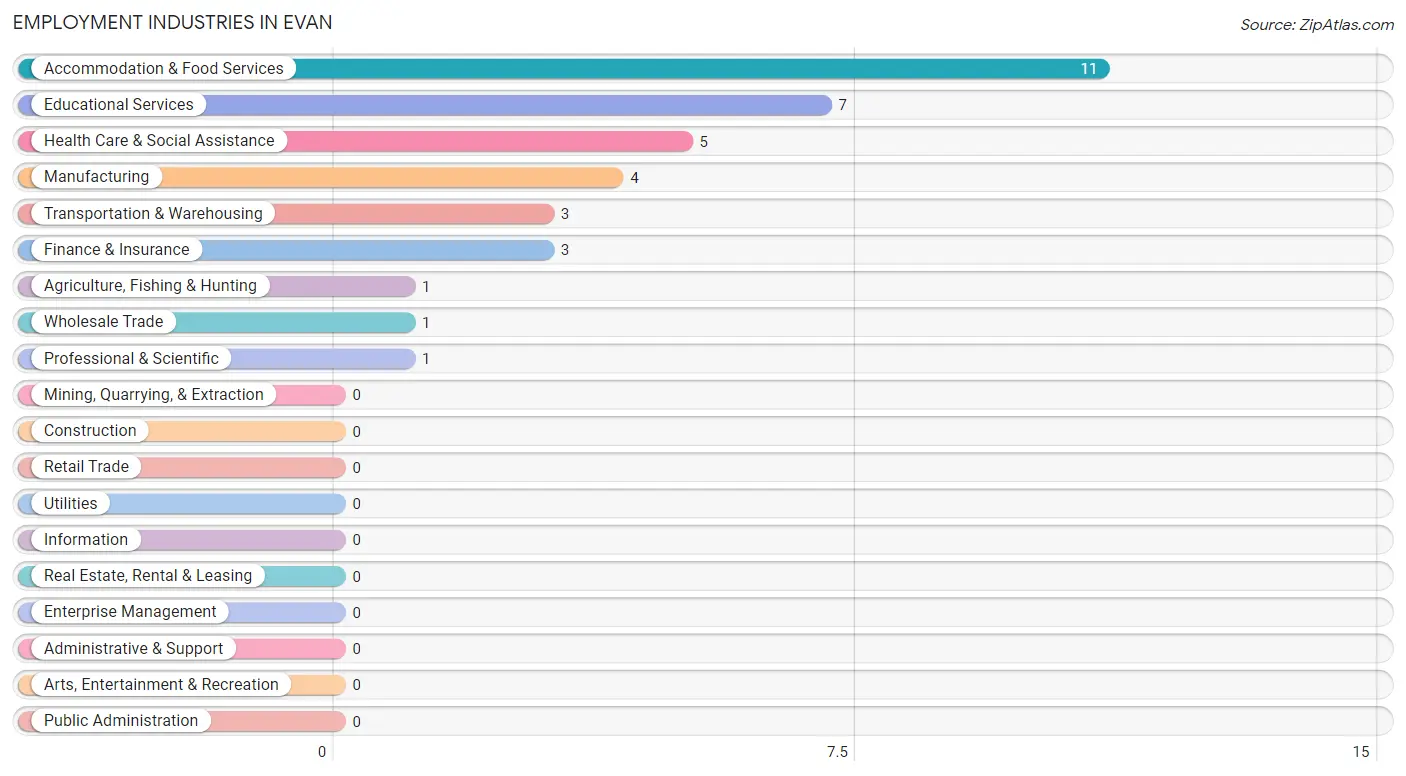
Employment Industries in Evan
The major employment industries in Evan include Accommodation & Food Services (11 | 28.2%), Educational Services (7 | 17.9%), Health Care & Social Assistance (5 | 12.8%), Manufacturing (4 | 10.3%), and Transportation & Warehousing (3 | 7.7%).
Employment Industries by Sex in Evan
The Evan industries that see more men than women are Agriculture, Fishing & Hunting (100.0%), Wholesale Trade (100.0%), and Transportation & Warehousing (100.0%), whereas the industries that tend to have a higher number of women are Professional & Scientific (100.0%), Educational Services (100.0%), and Health Care & Social Assistance (100.0%).
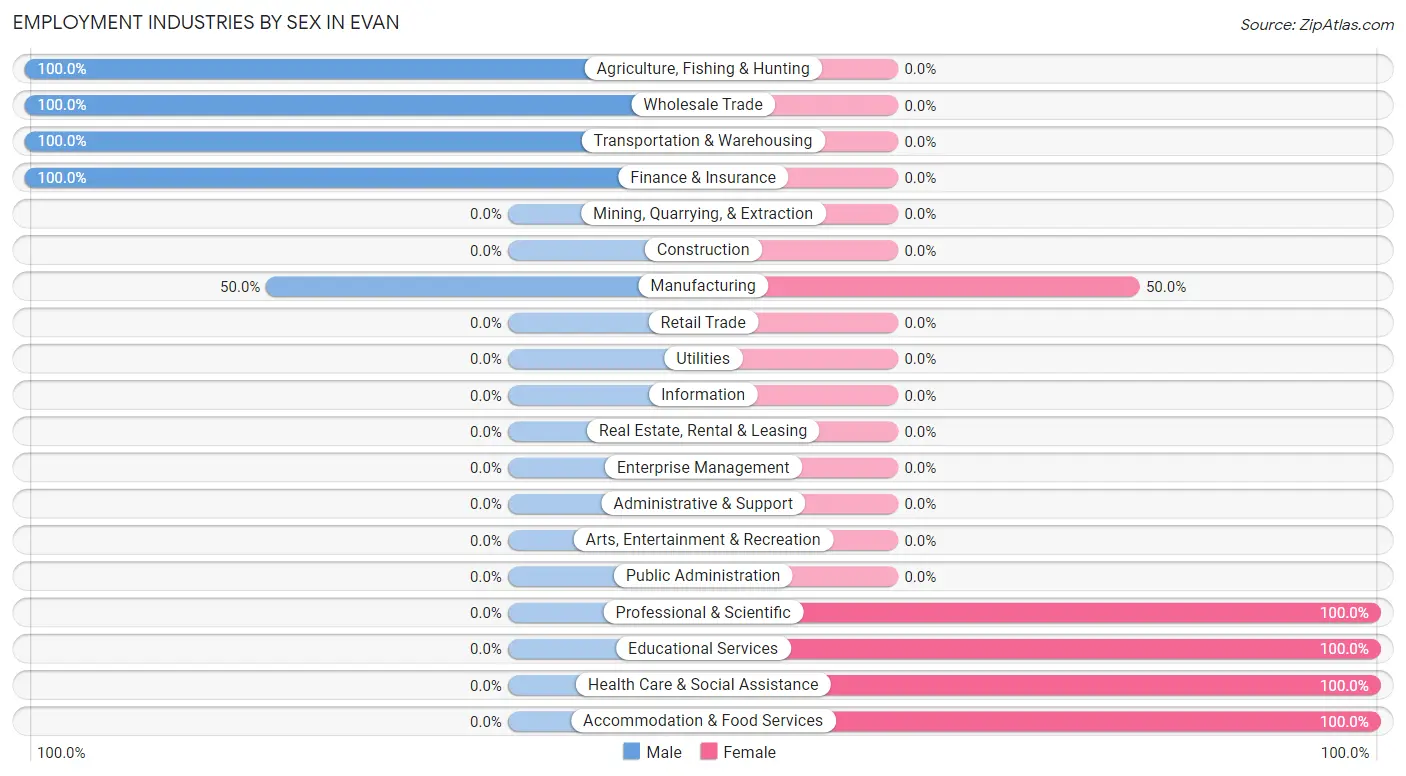
| Industry | Male | Female |
| Agriculture, Fishing & Hunting | 1 (100.0%) | 0 (0.0%) |
| Mining, Quarrying, & Extraction | 0 (0.0%) | 0 (0.0%) |
| Construction | 0 (0.0%) | 0 (0.0%) |
| Manufacturing | 2 (50.0%) | 2 (50.0%) |
| Wholesale Trade | 1 (100.0%) | 0 (0.0%) |
| Retail Trade | 0 (0.0%) | 0 (0.0%) |
| Transportation & Warehousing | 3 (100.0%) | 0 (0.0%) |
| Utilities | 0 (0.0%) | 0 (0.0%) |
| Information | 0 (0.0%) | 0 (0.0%) |
| Finance & Insurance | 3 (100.0%) | 0 (0.0%) |
| Real Estate, Rental & Leasing | 0 (0.0%) | 0 (0.0%) |
| Professional & Scientific | 0 (0.0%) | 1 (100.0%) |
| Enterprise Management | 0 (0.0%) | 0 (0.0%) |
| Administrative & Support | 0 (0.0%) | 0 (0.0%) |
| Educational Services | 0 (0.0%) | 7 (100.0%) |
| Health Care & Social Assistance | 0 (0.0%) | 5 (100.0%) |
| Arts, Entertainment & Recreation | 0 (0.0%) | 0 (0.0%) |
| Accommodation & Food Services | 0 (0.0%) | 11 (100.0%) |
| Public Administration | 0 (0.0%) | 0 (0.0%) |
| Total | 12 (30.8%) | 27 (69.2%) |
Education in Evan
School Enrollment in Evan
The most common levels of schooling among the 14 students in Evan are high school (8 | 57.1%), middle school (4 | 28.6%), and nursery / preschool (2 | 14.3%).
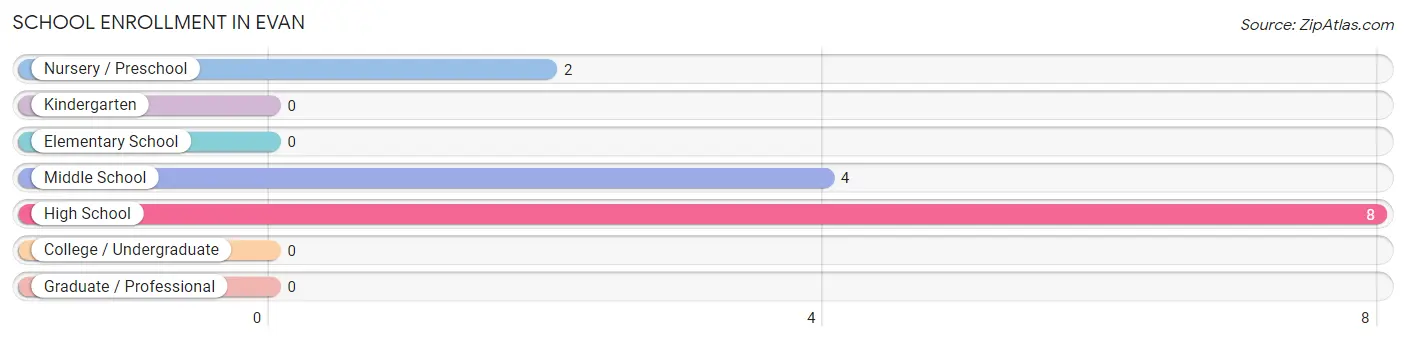
| School Level | # Students | % Students |
| Nursery / Preschool | 2 | 14.3% |
| Kindergarten | 0 | 0.0% |
| Elementary School | 0 | 0.0% |
| Middle School | 4 | 28.6% |
| High School | 8 | 57.1% |
| College / Undergraduate | 0 | 0.0% |
| Graduate / Professional | 0 | 0.0% |
| Total | 14 | 100.0% |
School Enrollment by Age by Funding Source in Evan
Out of a total of 14 students who are enrolled in schools in Evan, 2 (14.3%) attend a private institution, while the remaining 12 (85.7%) are enrolled in public schools. The age group of 3 to 4 year olds has the highest likelihood of being enrolled in private schools, with 2 (100.0% in the age bracket) enrolled. Conversely, the age group of 10 to 14 year olds has the lowest likelihood of being enrolled in a private school, with 4 (100.0% in the age bracket) attending a public institution.
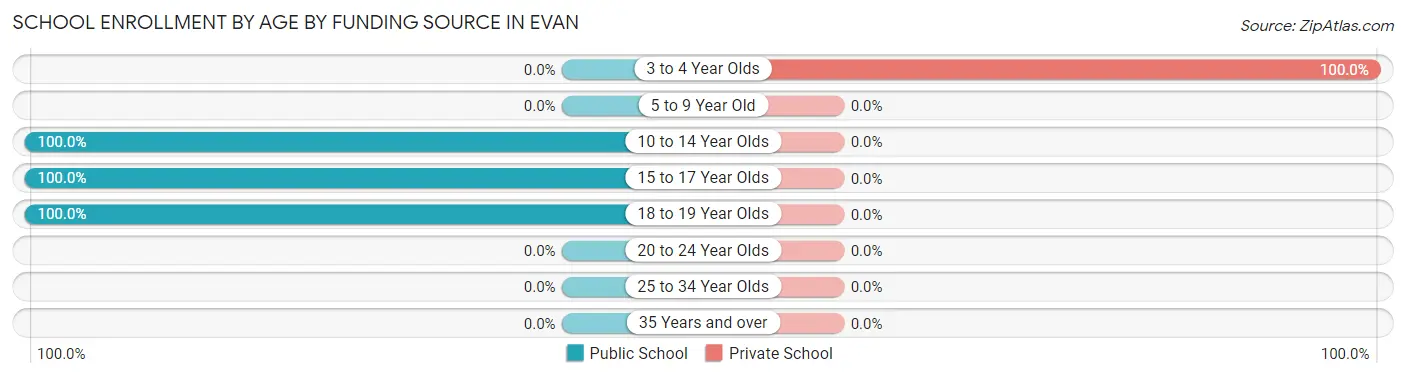
| Age Bracket | Public School | Private School |
| 3 to 4 Year Olds | 0 (0.0%) | 2 (100.0%) |
| 5 to 9 Year Old | 0 (0.0%) | 0 (0.0%) |
| 10 to 14 Year Olds | 4 (100.0%) | 0 (0.0%) |
| 15 to 17 Year Olds | 6 (100.0%) | 0 (0.0%) |
| 18 to 19 Year Olds | 2 (100.0%) | 0 (0.0%) |
| 20 to 24 Year Olds | 0 (0.0%) | 0 (0.0%) |
| 25 to 34 Year Olds | 0 (0.0%) | 0 (0.0%) |
| 35 Years and over | 0 (0.0%) | 0 (0.0%) |
| Total | 12 (85.7%) | 2 (14.3%) |
Educational Attainment by Field of Study in Evan
Bio, nature & agricultural (3 | 33.3%), business (3 | 33.3%), engineering (2 | 22.2%), and literature & languages (1 | 11.1%) are the most common fields of study among 9 individuals in Evan who have obtained a bachelor's degree or higher.
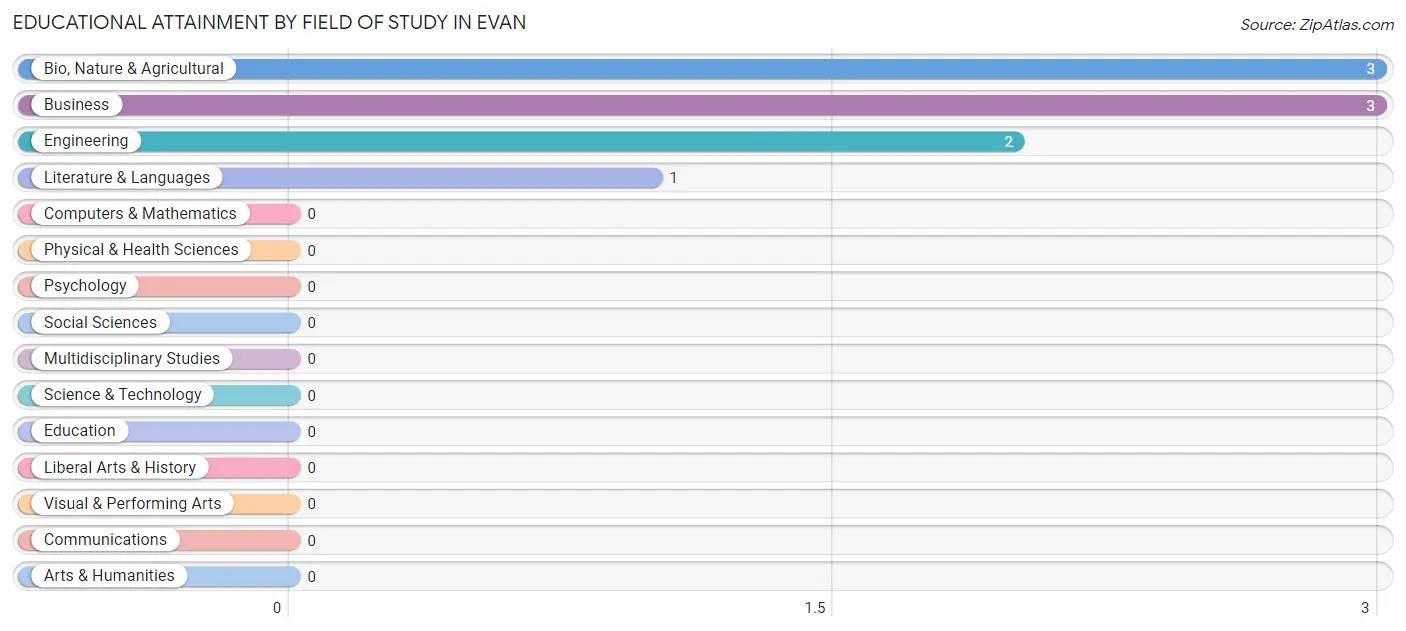
| Field of Study | # Graduates | % Graduates |
| Computers & Mathematics | 0 | 0.0% |
| Bio, Nature & Agricultural | 3 | 33.3% |
| Physical & Health Sciences | 0 | 0.0% |
| Psychology | 0 | 0.0% |
| Social Sciences | 0 | 0.0% |
| Engineering | 2 | 22.2% |
| Multidisciplinary Studies | 0 | 0.0% |
| Science & Technology | 0 | 0.0% |
| Business | 3 | 33.3% |
| Education | 0 | 0.0% |
| Literature & Languages | 1 | 11.1% |
| Liberal Arts & History | 0 | 0.0% |
| Visual & Performing Arts | 0 | 0.0% |
| Communications | 0 | 0.0% |
| Arts & Humanities | 0 | 0.0% |
| Total | 9 | 100.0% |
Transportation & Commute in Evan
Vehicle Availability by Sex in Evan
The most prevalent vehicle ownership categories in Evan are males with 2 vehicles (4, accounting for 33.3%) and females with 2 vehicles (17, making up 14.8%).
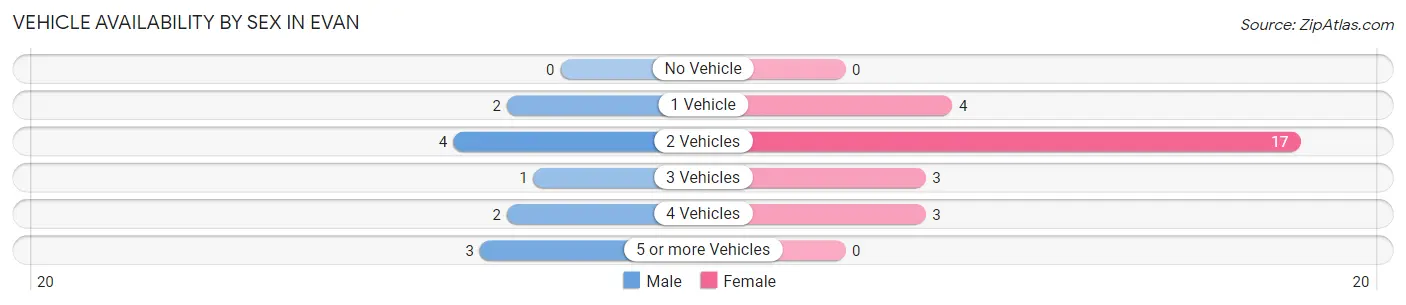
| Vehicles Available | Male | Female |
| No Vehicle | 0 (0.0%) | 0 (0.0%) |
| 1 Vehicle | 2 (16.7%) | 4 (14.8%) |
| 2 Vehicles | 4 (33.3%) | 17 (63.0%) |
| 3 Vehicles | 1 (8.3%) | 3 (11.1%) |
| 4 Vehicles | 2 (16.7%) | 3 (11.1%) |
| 5 or more Vehicles | 3 (25.0%) | 0 (0.0%) |
| Total | 12 (100.0%) | 27 (100.0%) |
Commute Time in Evan
The most frequently occuring commute durations in Evan are 20 to 24 minutes (13 commuters, 34.2%), 25 to 29 minutes (7 commuters, 18.4%), and 60 to 89 minutes (5 commuters, 13.2%).
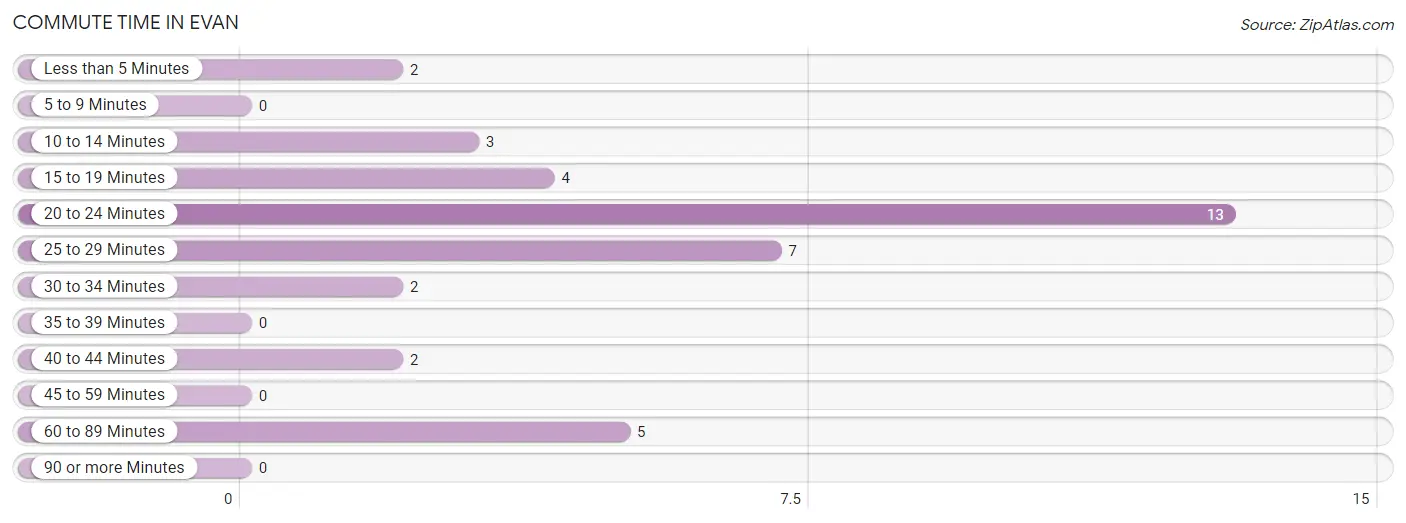
| Commute Time | # Commuters | % Commuters |
| Less than 5 Minutes | 2 | 5.3% |
| 5 to 9 Minutes | 0 | 0.0% |
| 10 to 14 Minutes | 3 | 7.9% |
| 15 to 19 Minutes | 4 | 10.5% |
| 20 to 24 Minutes | 13 | 34.2% |
| 25 to 29 Minutes | 7 | 18.4% |
| 30 to 34 Minutes | 2 | 5.3% |
| 35 to 39 Minutes | 0 | 0.0% |
| 40 to 44 Minutes | 2 | 5.3% |
| 45 to 59 Minutes | 0 | 0.0% |
| 60 to 89 Minutes | 5 | 13.2% |
| 90 or more Minutes | 0 | 0.0% |
Commute Time by Sex in Evan
The most common commute times in Evan are 10 to 14 minutes (3 commuters, 25.0%) for males and 20 to 24 minutes (12 commuters, 46.2%) for females.
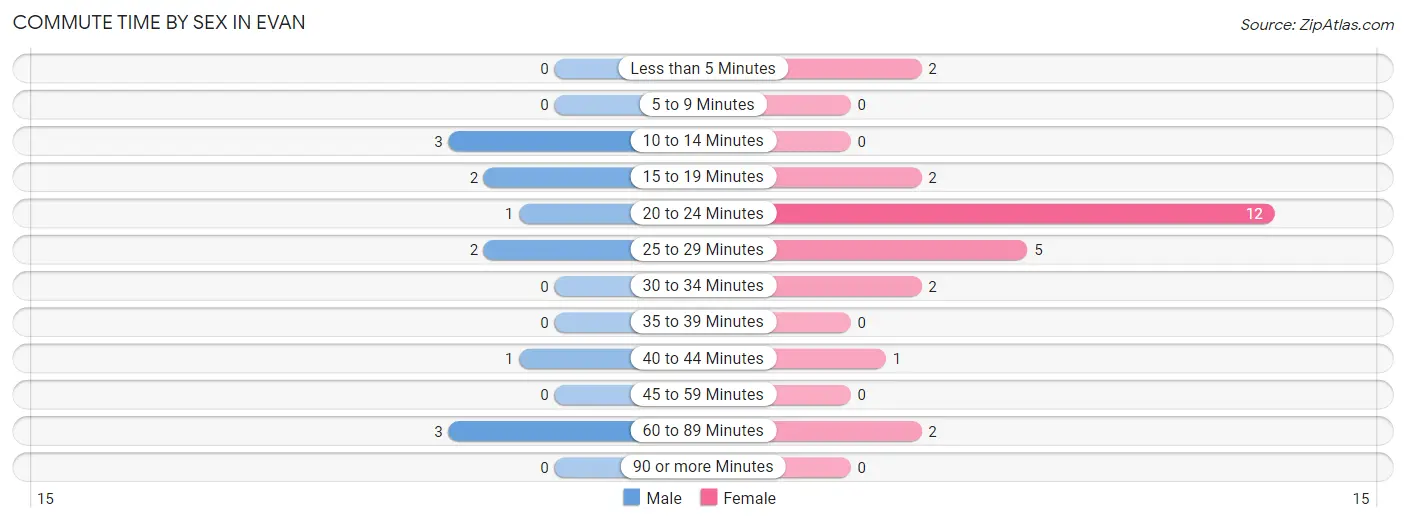
| Commute Time | Male | Female |
| Less than 5 Minutes | 0 (0.0%) | 2 (7.7%) |
| 5 to 9 Minutes | 0 (0.0%) | 0 (0.0%) |
| 10 to 14 Minutes | 3 (25.0%) | 0 (0.0%) |
| 15 to 19 Minutes | 2 (16.7%) | 2 (7.7%) |
| 20 to 24 Minutes | 1 (8.3%) | 12 (46.2%) |
| 25 to 29 Minutes | 2 (16.7%) | 5 (19.2%) |
| 30 to 34 Minutes | 0 (0.0%) | 2 (7.7%) |
| 35 to 39 Minutes | 0 (0.0%) | 0 (0.0%) |
| 40 to 44 Minutes | 1 (8.3%) | 1 (3.8%) |
| 45 to 59 Minutes | 0 (0.0%) | 0 (0.0%) |
| 60 to 89 Minutes | 3 (25.0%) | 2 (7.7%) |
| 90 or more Minutes | 0 (0.0%) | 0 (0.0%) |
Time of Departure to Work by Sex in Evan
The most frequent times of departure to work in Evan are 5:30 AM to 5:59 AM (3, 25.0%) for males and 9:00 AM to 9:59 AM (11, 42.3%) for females.
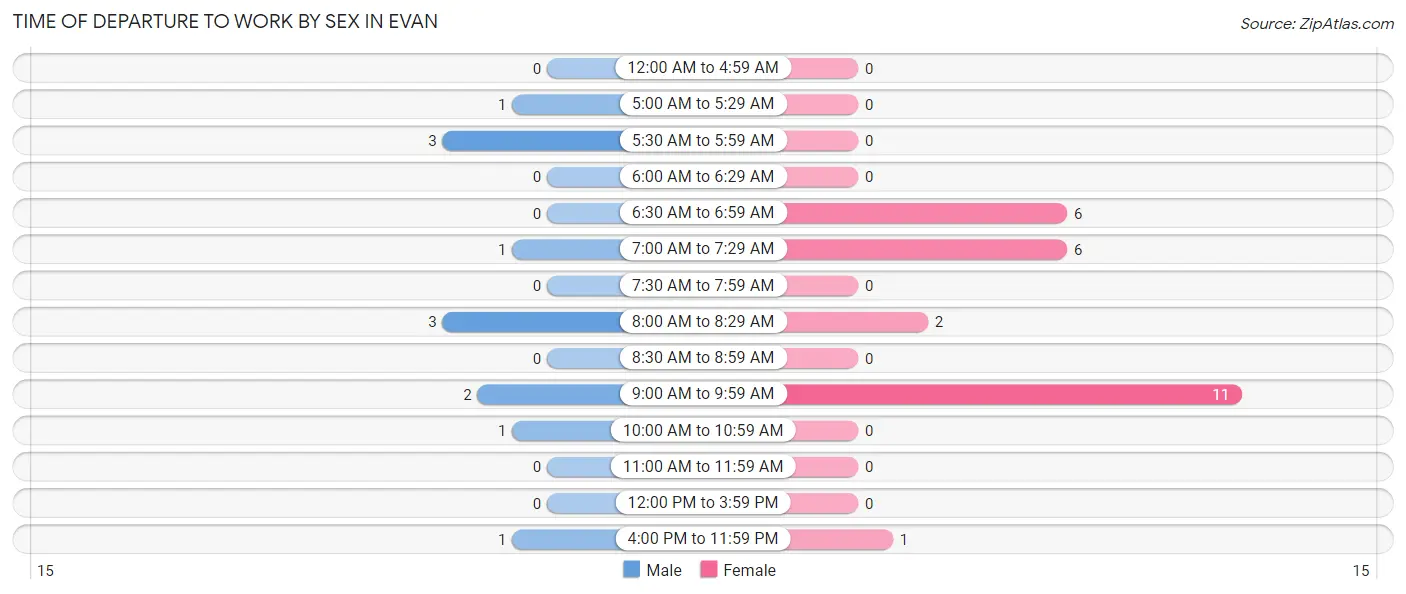
| Time of Departure | Male | Female |
| 12:00 AM to 4:59 AM | 0 (0.0%) | 0 (0.0%) |
| 5:00 AM to 5:29 AM | 1 (8.3%) | 0 (0.0%) |
| 5:30 AM to 5:59 AM | 3 (25.0%) | 0 (0.0%) |
| 6:00 AM to 6:29 AM | 0 (0.0%) | 0 (0.0%) |
| 6:30 AM to 6:59 AM | 0 (0.0%) | 6 (23.1%) |
| 7:00 AM to 7:29 AM | 1 (8.3%) | 6 (23.1%) |
| 7:30 AM to 7:59 AM | 0 (0.0%) | 0 (0.0%) |
| 8:00 AM to 8:29 AM | 3 (25.0%) | 2 (7.7%) |
| 8:30 AM to 8:59 AM | 0 (0.0%) | 0 (0.0%) |
| 9:00 AM to 9:59 AM | 2 (16.7%) | 11 (42.3%) |
| 10:00 AM to 10:59 AM | 1 (8.3%) | 0 (0.0%) |
| 11:00 AM to 11:59 AM | 0 (0.0%) | 0 (0.0%) |
| 12:00 PM to 3:59 PM | 0 (0.0%) | 0 (0.0%) |
| 4:00 PM to 11:59 PM | 1 (8.3%) | 1 (3.8%) |
| Total | 12 (100.0%) | 26 (100.0%) |
Housing Occupancy in Evan
Occupancy by Ownership in Evan
Of the total 29 dwellings in Evan, owner-occupied units account for 27 (93.1%), while renter-occupied units make up 2 (6.9%).
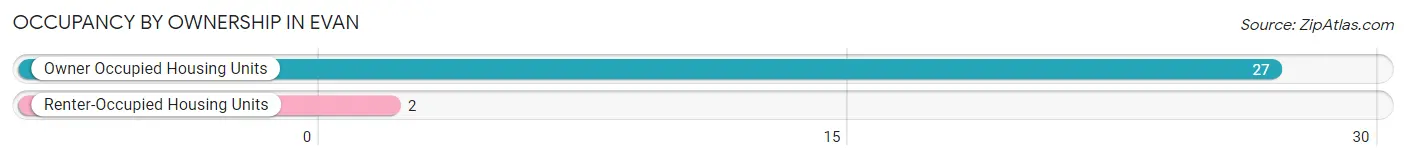
| Occupancy | # Housing Units | % Housing Units |
| Owner Occupied Housing Units | 27 | 93.1% |
| Renter-Occupied Housing Units | 2 | 6.9% |
| Total Occupied Housing Units | 29 | 100.0% |
Occupancy by Household Size in Evan
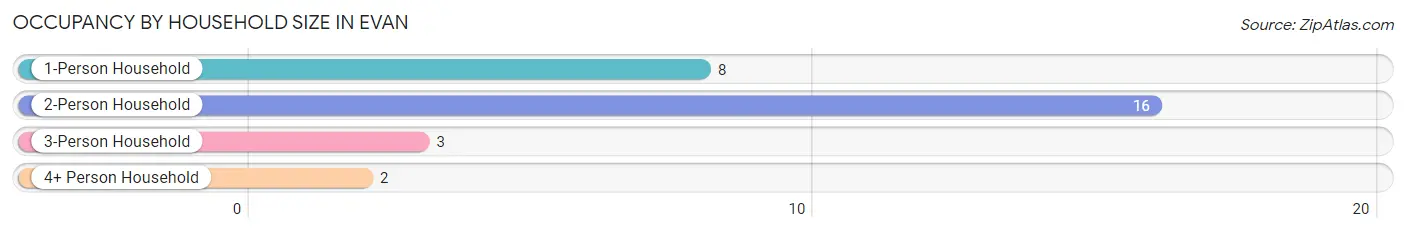
| Household Size | # Housing Units | % Housing Units |
| 1-Person Household | 8 | 27.6% |
| 2-Person Household | 16 | 55.2% |
| 3-Person Household | 3 | 10.3% |
| 4+ Person Household | 2 | 6.9% |
| Total Housing Units | 29 | 100.0% |
Occupancy by Ownership by Household Size in Evan
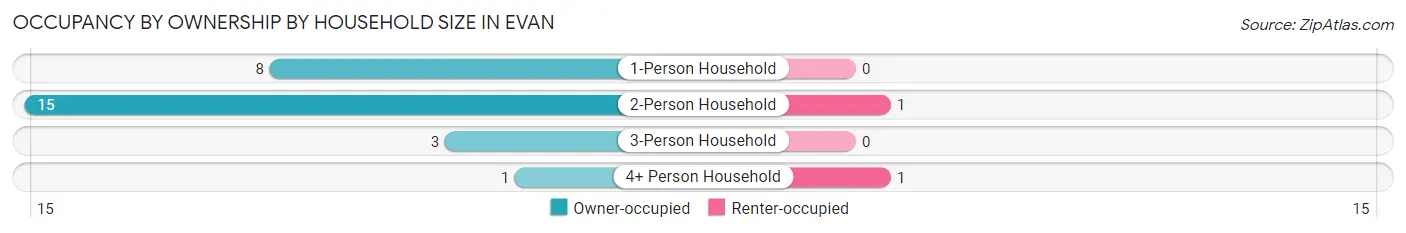
| Household Size | Owner-occupied | Renter-occupied |
| 1-Person Household | 8 (100.0%) | 0 (0.0%) |
| 2-Person Household | 15 (93.8%) | 1 (6.2%) |
| 3-Person Household | 3 (100.0%) | 0 (0.0%) |
| 4+ Person Household | 1 (50.0%) | 1 (50.0%) |
| Total Housing Units | 27 (93.1%) | 2 (6.9%) |
Occupancy by Educational Attainment in Evan
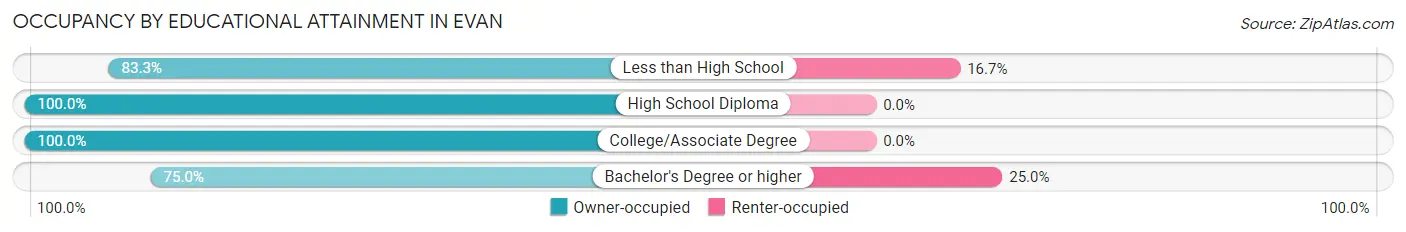
| Household Size | Owner-occupied | Renter-occupied |
| Less than High School | 5 (83.3%) | 1 (16.7%) |
| High School Diploma | 16 (100.0%) | 0 (0.0%) |
| College/Associate Degree | 3 (100.0%) | 0 (0.0%) |
| Bachelor's Degree or higher | 3 (75.0%) | 1 (25.0%) |
Occupancy by Age of Householder in Evan
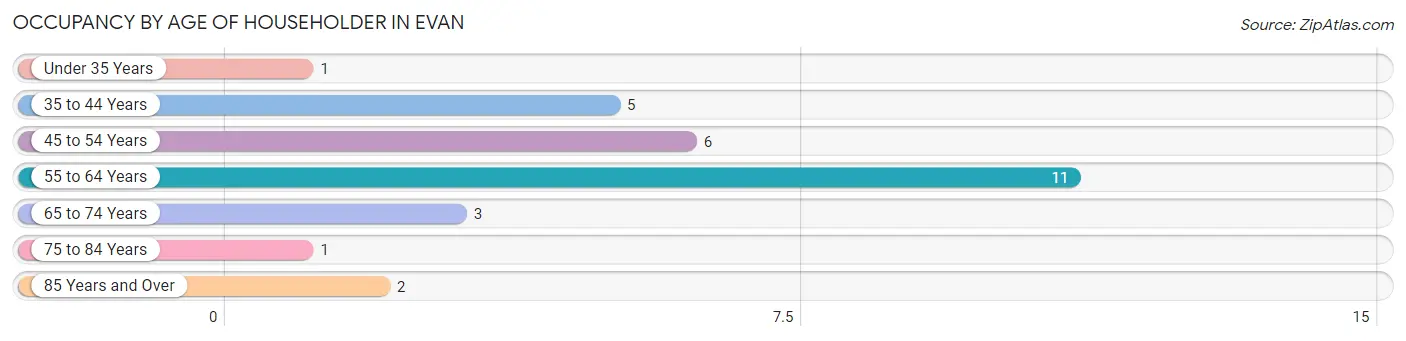
| Age Bracket | # Households | % Households |
| Under 35 Years | 1 | 3.5% |
| 35 to 44 Years | 5 | 17.2% |
| 45 to 54 Years | 6 | 20.7% |
| 55 to 64 Years | 11 | 37.9% |
| 65 to 74 Years | 3 | 10.3% |
| 75 to 84 Years | 1 | 3.5% |
| 85 Years and Over | 2 | 6.9% |
| Total | 29 | 100.0% |
Housing Finances in Evan
Median Income by Occupancy in Evan
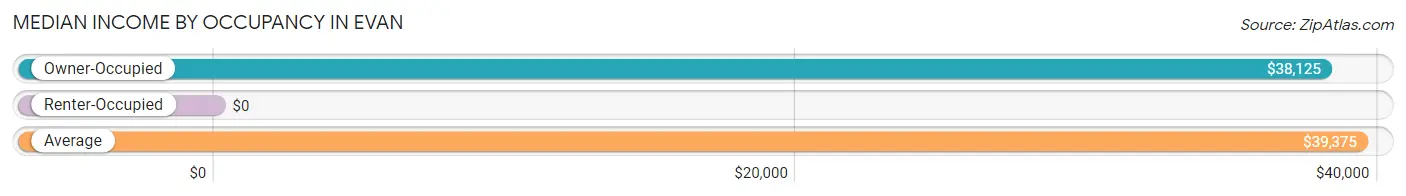
| Occupancy Type | # Households | Median Income |
| Owner-Occupied | 27 (93.1%) | $38,125 |
| Renter-Occupied | 2 (6.9%) | $0 |
| Average | 29 (100.0%) | $39,375 |
Occupancy by Householder Income Bracket in Evan
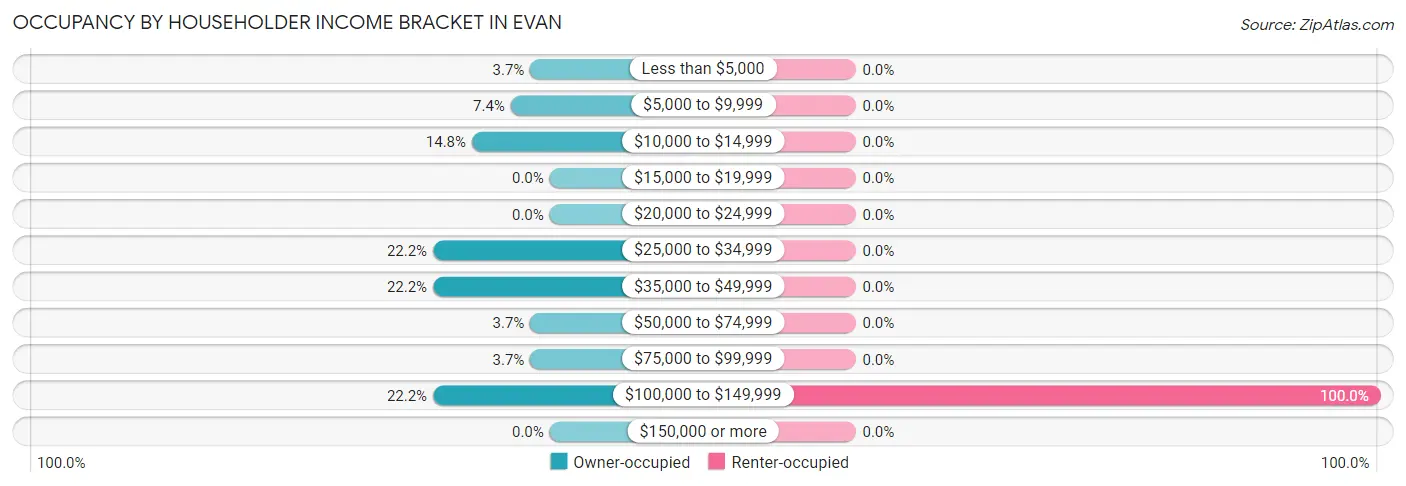
| Income Bracket | Owner-occupied | Renter-occupied |
| Less than $5,000 | 1 (3.7%) | 0 (0.0%) |
| $5,000 to $9,999 | 2 (7.4%) | 0 (0.0%) |
| $10,000 to $14,999 | 4 (14.8%) | 0 (0.0%) |
| $15,000 to $19,999 | 0 (0.0%) | 0 (0.0%) |
| $20,000 to $24,999 | 0 (0.0%) | 0 (0.0%) |
| $25,000 to $34,999 | 6 (22.2%) | 0 (0.0%) |
| $35,000 to $49,999 | 6 (22.2%) | 0 (0.0%) |
| $50,000 to $74,999 | 1 (3.7%) | 0 (0.0%) |
| $75,000 to $99,999 | 1 (3.7%) | 0 (0.0%) |
| $100,000 to $149,999 | 6 (22.2%) | 2 (100.0%) |
| $150,000 or more | 0 (0.0%) | 0 (0.0%) |
| Total | 27 (100.0%) | 2 (100.0%) |
Monthly Housing Cost Tiers in Evan
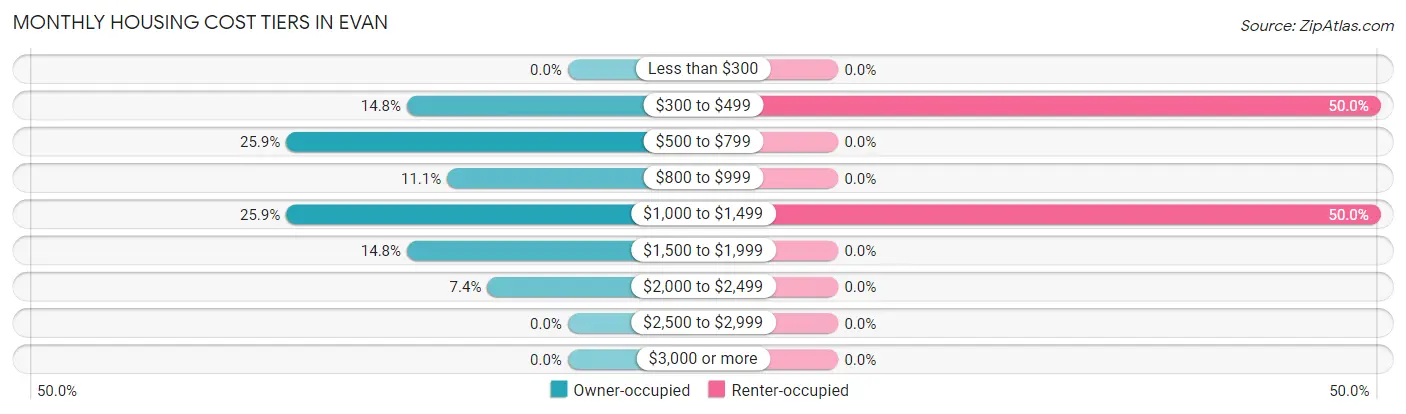
| Monthly Cost | Owner-occupied | Renter-occupied |
| Less than $300 | 0 (0.0%) | 0 (0.0%) |
| $300 to $499 | 4 (14.8%) | 1 (50.0%) |
| $500 to $799 | 7 (25.9%) | 0 (0.0%) |
| $800 to $999 | 3 (11.1%) | 0 (0.0%) |
| $1,000 to $1,499 | 7 (25.9%) | 1 (50.0%) |
| $1,500 to $1,999 | 4 (14.8%) | 0 (0.0%) |
| $2,000 to $2,499 | 2 (7.4%) | 0 (0.0%) |
| $2,500 to $2,999 | 0 (0.0%) | 0 (0.0%) |
| $3,000 or more | 0 (0.0%) | 0 (0.0%) |
| Total | 27 (100.0%) | 2 (100.0%) |
Physical Housing Characteristics in Evan
Housing Structures in Evan
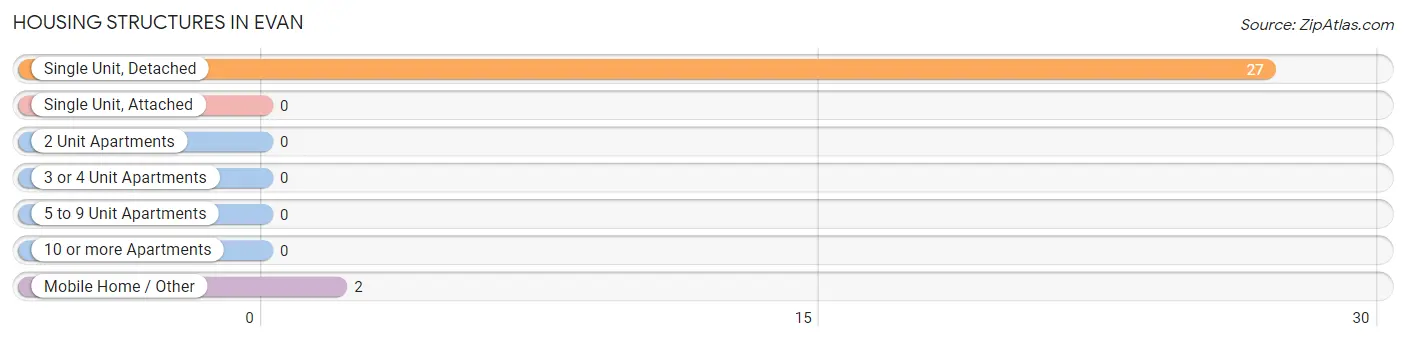
| Structure Type | # Housing Units | % Housing Units |
| Single Unit, Detached | 27 | 93.1% |
| Single Unit, Attached | 0 | 0.0% |
| 2 Unit Apartments | 0 | 0.0% |
| 3 or 4 Unit Apartments | 0 | 0.0% |
| 5 to 9 Unit Apartments | 0 | 0.0% |
| 10 or more Apartments | 0 | 0.0% |
| Mobile Home / Other | 2 | 6.9% |
| Total | 29 | 100.0% |
Housing Structures by Occupancy in Evan
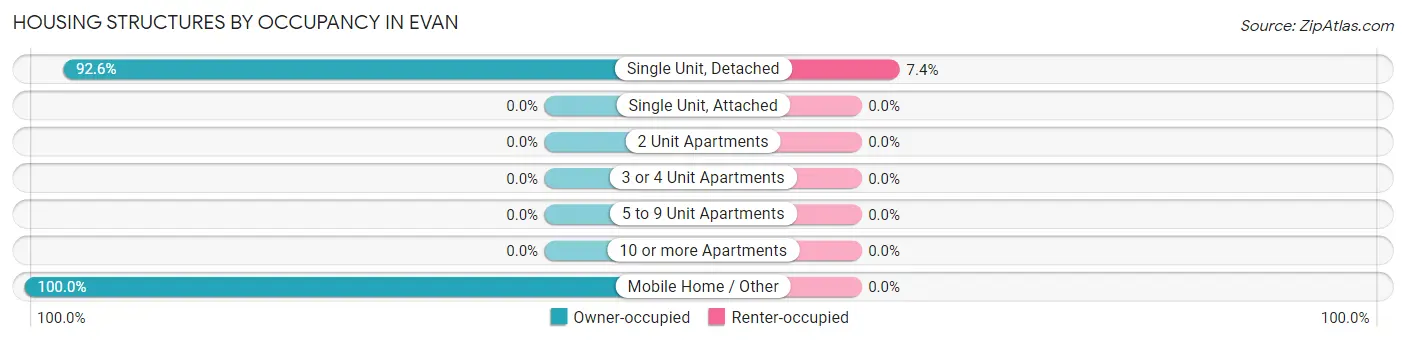
| Structure Type | Owner-occupied | Renter-occupied |
| Single Unit, Detached | 25 (92.6%) | 2 (7.4%) |
| Single Unit, Attached | 0 (0.0%) | 0 (0.0%) |
| 2 Unit Apartments | 0 (0.0%) | 0 (0.0%) |
| 3 or 4 Unit Apartments | 0 (0.0%) | 0 (0.0%) |
| 5 to 9 Unit Apartments | 0 (0.0%) | 0 (0.0%) |
| 10 or more Apartments | 0 (0.0%) | 0 (0.0%) |
| Mobile Home / Other | 2 (100.0%) | 0 (0.0%) |
| Total | 27 (93.1%) | 2 (6.9%) |
Housing Structures by Number of Rooms in Evan
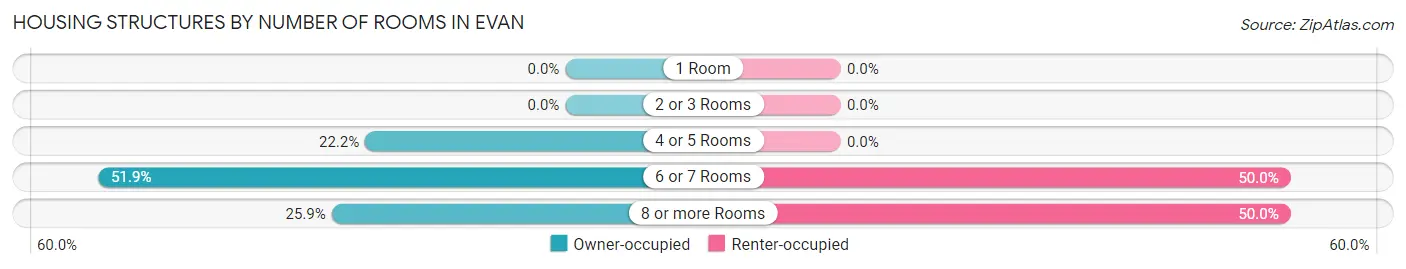
| Number of Rooms | Owner-occupied | Renter-occupied |
| 1 Room | 0 (0.0%) | 0 (0.0%) |
| 2 or 3 Rooms | 0 (0.0%) | 0 (0.0%) |
| 4 or 5 Rooms | 6 (22.2%) | 0 (0.0%) |
| 6 or 7 Rooms | 14 (51.8%) | 1 (50.0%) |
| 8 or more Rooms | 7 (25.9%) | 1 (50.0%) |
| Total | 27 (100.0%) | 2 (100.0%) |
Housing Structure by Heating Type in Evan
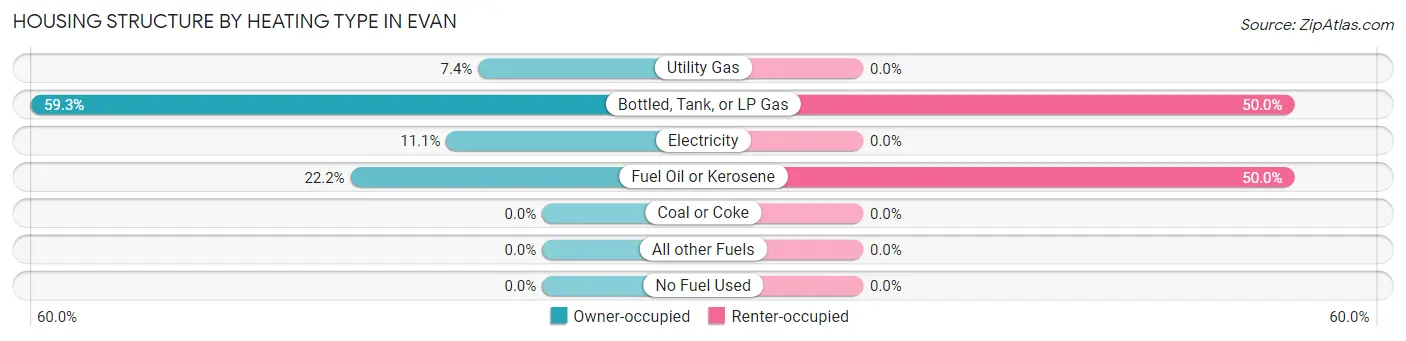
| Heating Type | Owner-occupied | Renter-occupied |
| Utility Gas | 2 (7.4%) | 0 (0.0%) |
| Bottled, Tank, or LP Gas | 16 (59.3%) | 1 (50.0%) |
| Electricity | 3 (11.1%) | 0 (0.0%) |
| Fuel Oil or Kerosene | 6 (22.2%) | 1 (50.0%) |
| Coal or Coke | 0 (0.0%) | 0 (0.0%) |
| All other Fuels | 0 (0.0%) | 0 (0.0%) |
| No Fuel Used | 0 (0.0%) | 0 (0.0%) |
| Total | 27 (100.0%) | 2 (100.0%) |
Household Vehicle Usage in Evan
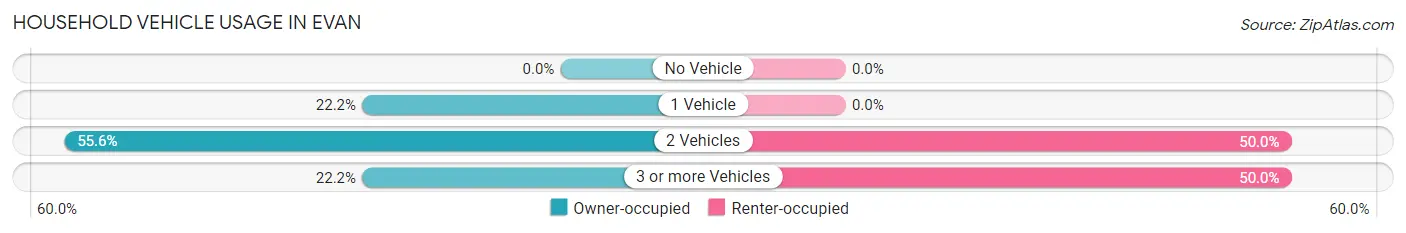
| Vehicles per Household | Owner-occupied | Renter-occupied |
| No Vehicle | 0 (0.0%) | 0 (0.0%) |
| 1 Vehicle | 6 (22.2%) | 0 (0.0%) |
| 2 Vehicles | 15 (55.6%) | 1 (50.0%) |
| 3 or more Vehicles | 6 (22.2%) | 1 (50.0%) |
| Total | 27 (100.0%) | 2 (100.0%) |
Real Estate & Mortgages in Evan
Real Estate and Mortgage Overview in Evan
| Characteristic | Without Mortgage | With Mortgage |
| Housing Units | 9 | 18 |
| Median Property Value | $77,500 | $56,000 |
| Median Household Income | $43,750 | $0 |
| Monthly Housing Costs | $650 | $0 |
| Real Estate Taxes | $550 | $0 |
Property Value by Mortgage Status in Evan
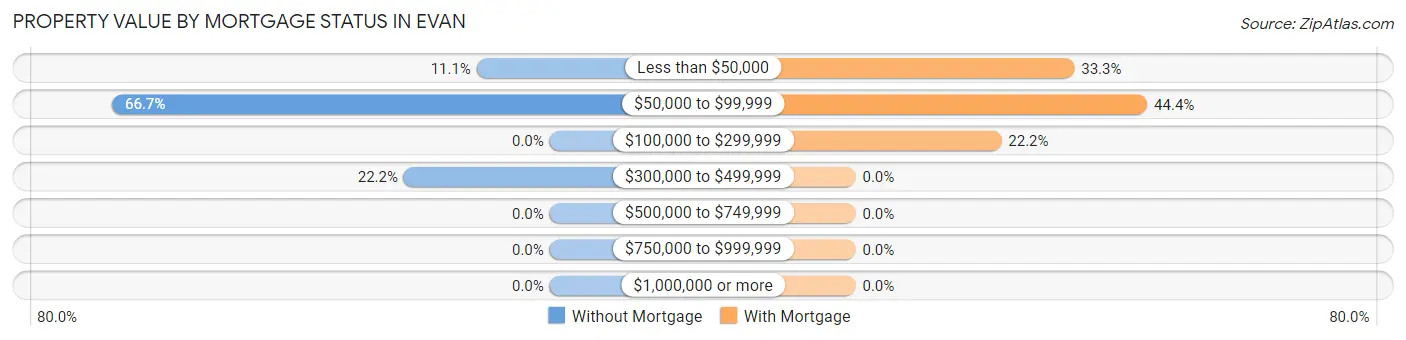
| Property Value | Without Mortgage | With Mortgage |
| Less than $50,000 | 1 (11.1%) | 6 (33.3%) |
| $50,000 to $99,999 | 6 (66.7%) | 8 (44.4%) |
| $100,000 to $299,999 | 0 (0.0%) | 4 (22.2%) |
| $300,000 to $499,999 | 2 (22.2%) | 0 (0.0%) |
| $500,000 to $749,999 | 0 (0.0%) | 0 (0.0%) |
| $750,000 to $999,999 | 0 (0.0%) | 0 (0.0%) |
| $1,000,000 or more | 0 (0.0%) | 0 (0.0%) |
| Total | 9 (100.0%) | 18 (100.0%) |
Household Income by Mortgage Status in Evan
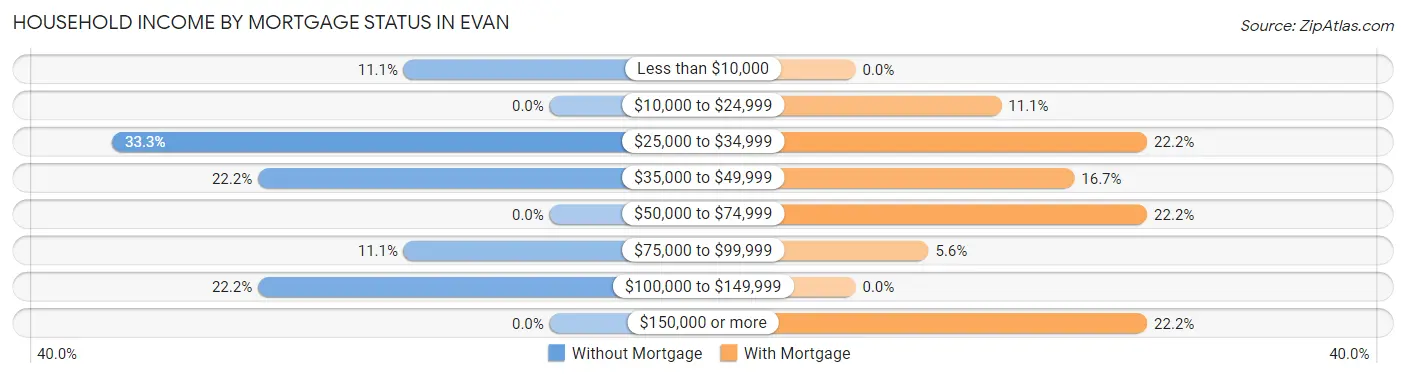
| Household Income | Without Mortgage | With Mortgage |
| Less than $10,000 | 1 (11.1%) | 0 (0.0%) |
| $10,000 to $24,999 | 0 (0.0%) | 2 (11.1%) |
| $25,000 to $34,999 | 3 (33.3%) | 4 (22.2%) |
| $35,000 to $49,999 | 2 (22.2%) | 3 (16.7%) |
| $50,000 to $74,999 | 0 (0.0%) | 4 (22.2%) |
| $75,000 to $99,999 | 1 (11.1%) | 1 (5.6%) |
| $100,000 to $149,999 | 2 (22.2%) | 0 (0.0%) |
| $150,000 or more | 0 (0.0%) | 4 (22.2%) |
| Total | 9 (100.0%) | 18 (100.0%) |
Property Value to Household Income Ratio in Evan
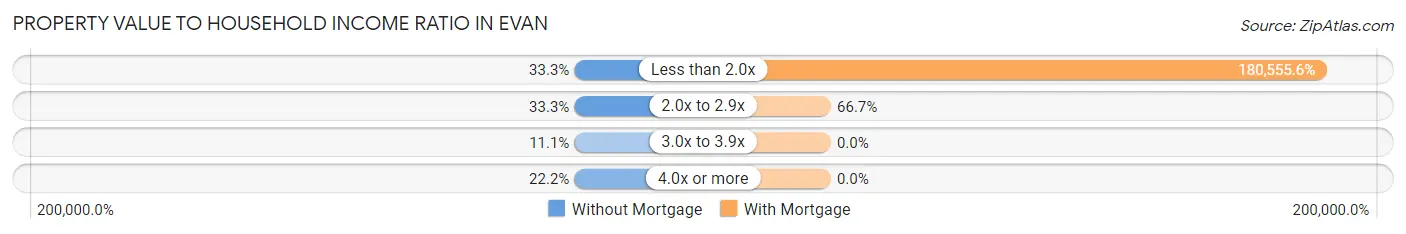
| Value-to-Income Ratio | Without Mortgage | With Mortgage |
| Less than 2.0x | 3 (33.3%) | 32,500 (180,555.6%) |
| 2.0x to 2.9x | 3 (33.3%) | 12 (66.7%) |
| 3.0x to 3.9x | 1 (11.1%) | 0 (0.0%) |
| 4.0x or more | 2 (22.2%) | 0 (0.0%) |
| Total | 9 (100.0%) | 18 (100.0%) |
Real Estate Taxes by Mortgage Status in Evan
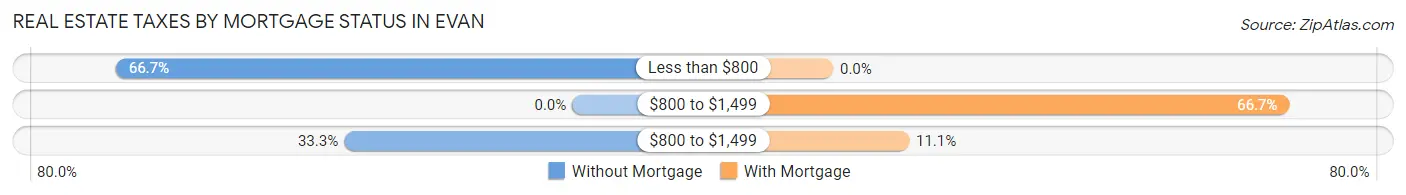
| Property Taxes | Without Mortgage | With Mortgage |
| Less than $800 | 6 (66.7%) | 0 (0.0%) |
| $800 to $1,499 | 0 (0.0%) | 12 (66.7%) |
| $800 to $1,499 | 3 (33.3%) | 2 (11.1%) |
| Total | 9 (100.0%) | 18 (100.0%) |
Health & Disability in Evan
Health Insurance Coverage by Age in Evan
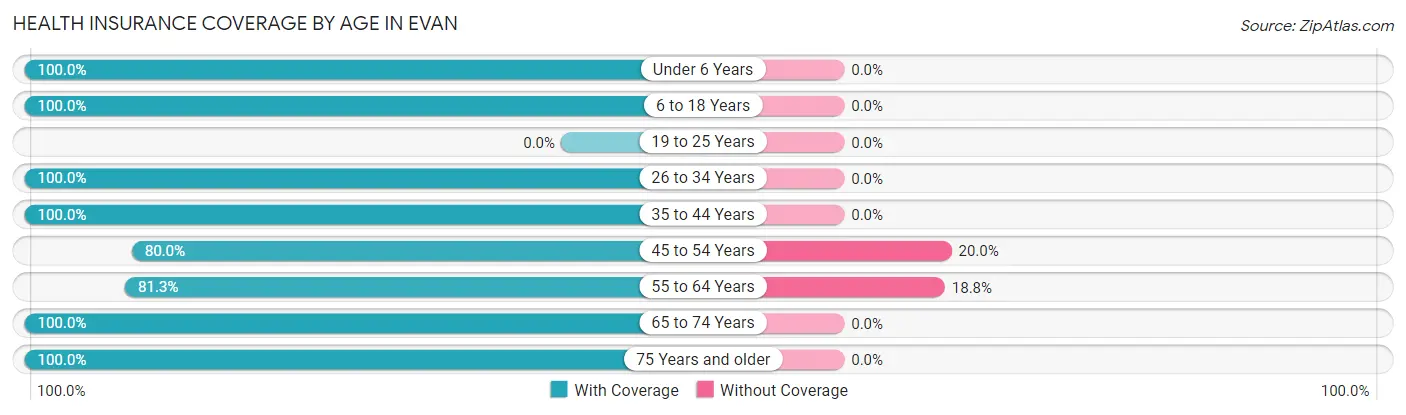
| Age Bracket | With Coverage | Without Coverage |
| Under 6 Years | 6 (100.0%) | 0 (0.0%) |
| 6 to 18 Years | 12 (100.0%) | 0 (0.0%) |
| 19 to 25 Years | 0 (0.0%) | 0 (0.0%) |
| 26 to 34 Years | 2 (100.0%) | 0 (0.0%) |
| 35 to 44 Years | 13 (100.0%) | 0 (0.0%) |
| 45 to 54 Years | 8 (80.0%) | 2 (20.0%) |
| 55 to 64 Years | 13 (81.2%) | 3 (18.8%) |
| 65 to 74 Years | 6 (100.0%) | 0 (0.0%) |
| 75 Years and older | 6 (100.0%) | 0 (0.0%) |
| Total | 66 (93.0%) | 5 (7.0%) |
Health Insurance Coverage by Citizenship Status in Evan
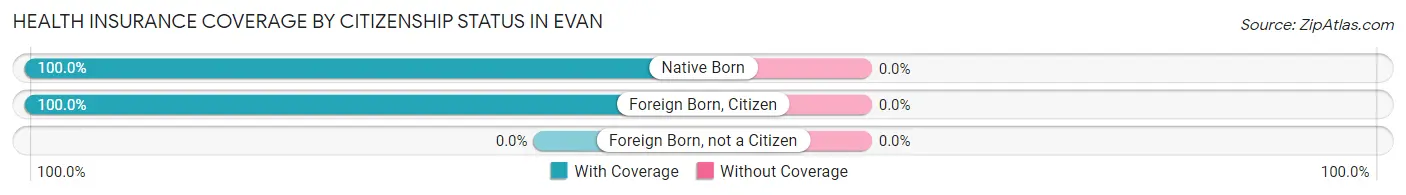
| Citizenship Status | With Coverage | Without Coverage |
| Native Born | 6 (100.0%) | 0 (0.0%) |
| Foreign Born, Citizen | 12 (100.0%) | 0 (0.0%) |
| Foreign Born, not a Citizen | 0 (0.0%) | 0 (0.0%) |
Health Insurance Coverage by Household Income in Evan
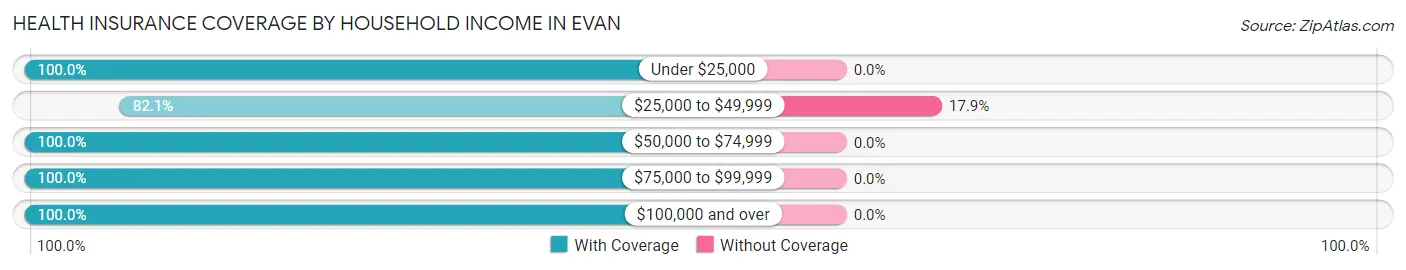
| Household Income | With Coverage | Without Coverage |
| Under $25,000 | 11 (100.0%) | 0 (0.0%) |
| $25,000 to $49,999 | 23 (82.1%) | 5 (17.9%) |
| $50,000 to $74,999 | 1 (100.0%) | 0 (0.0%) |
| $75,000 to $99,999 | 1 (100.0%) | 0 (0.0%) |
| $100,000 and over | 30 (100.0%) | 0 (0.0%) |
Public vs Private Health Insurance Coverage by Age in Evan
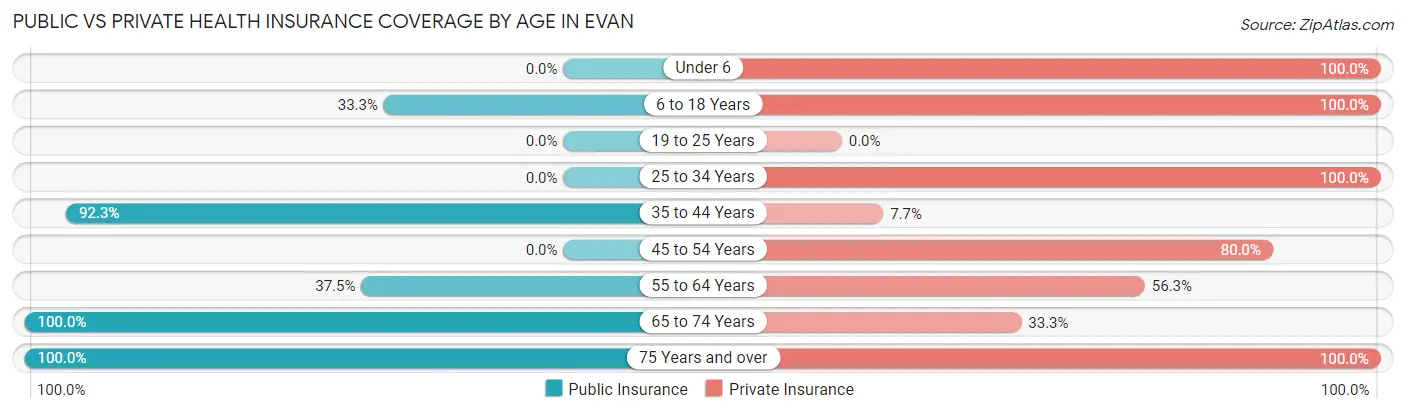
| Age Bracket | Public Insurance | Private Insurance |
| Under 6 | 0 (0.0%) | 6 (100.0%) |
| 6 to 18 Years | 4 (33.3%) | 12 (100.0%) |
| 19 to 25 Years | 0 (0.0%) | 0 (0.0%) |
| 25 to 34 Years | 0 (0.0%) | 2 (100.0%) |
| 35 to 44 Years | 12 (92.3%) | 1 (7.7%) |
| 45 to 54 Years | 0 (0.0%) | 8 (80.0%) |
| 55 to 64 Years | 6 (37.5%) | 9 (56.2%) |
| 65 to 74 Years | 6 (100.0%) | 2 (33.3%) |
| 75 Years and over | 6 (100.0%) | 6 (100.0%) |
| Total | 34 (47.9%) | 46 (64.8%) |
Disability Status by Sex by Age in Evan
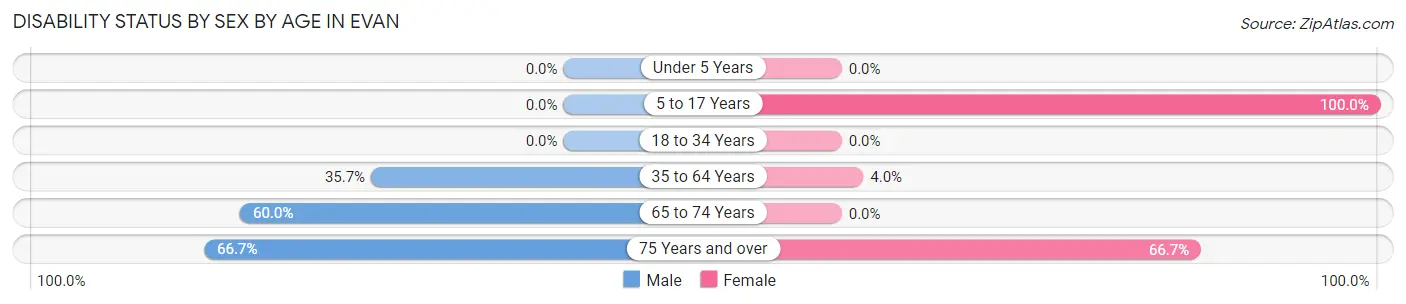
| Age Bracket | Male | Female |
| Under 5 Years | 0 (0.0%) | 0 (0.0%) |
| 5 to 17 Years | 0 (0.0%) | 4 (100.0%) |
| 18 to 34 Years | 0 (0.0%) | 0 (0.0%) |
| 35 to 64 Years | 5 (35.7%) | 1 (4.0%) |
| 65 to 74 Years | 3 (60.0%) | 0 (0.0%) |
| 75 Years and over | 2 (66.7%) | 2 (66.7%) |
Disability Class by Sex by Age in Evan
Disability Class: Hearing Difficulty
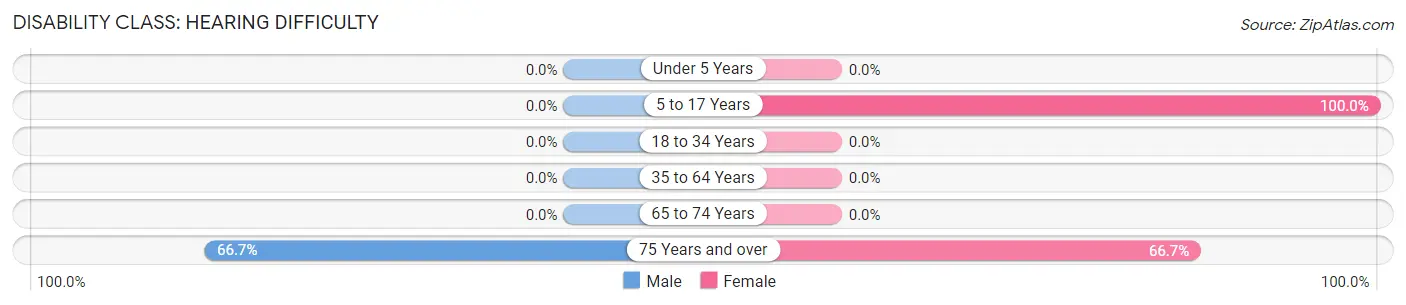
| Age Bracket | Male | Female |
| Under 5 Years | 0 (0.0%) | 0 (0.0%) |
| 5 to 17 Years | 0 (0.0%) | 4 (100.0%) |
| 18 to 34 Years | 0 (0.0%) | 0 (0.0%) |
| 35 to 64 Years | 0 (0.0%) | 0 (0.0%) |
| 65 to 74 Years | 0 (0.0%) | 0 (0.0%) |
| 75 Years and over | 2 (66.7%) | 2 (66.7%) |
Disability Class: Vision Difficulty
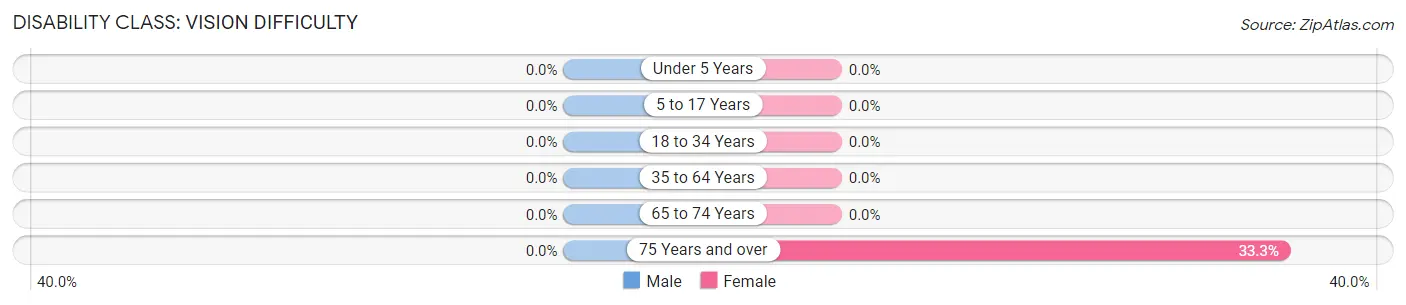
| Age Bracket | Male | Female |
| Under 5 Years | 0 (0.0%) | 0 (0.0%) |
| 5 to 17 Years | 0 (0.0%) | 0 (0.0%) |
| 18 to 34 Years | 0 (0.0%) | 0 (0.0%) |
| 35 to 64 Years | 0 (0.0%) | 0 (0.0%) |
| 65 to 74 Years | 0 (0.0%) | 0 (0.0%) |
| 75 Years and over | 0 (0.0%) | 1 (33.3%) |
Disability Class: Cognitive Difficulty
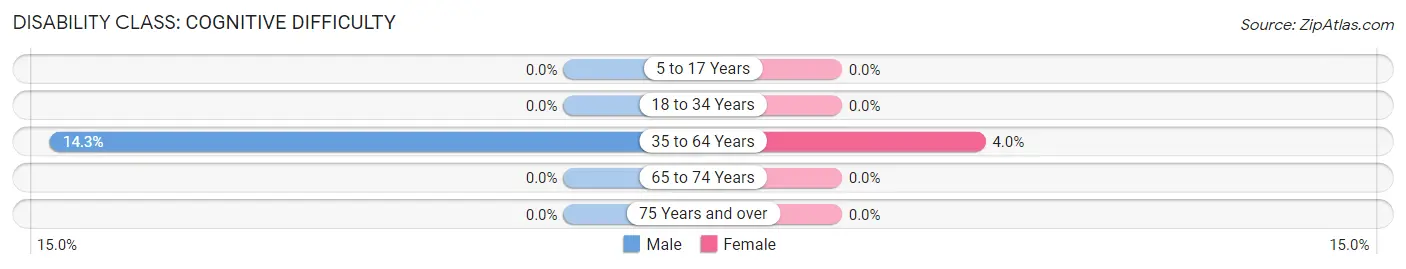
| Age Bracket | Male | Female |
| 5 to 17 Years | 0 (0.0%) | 0 (0.0%) |
| 18 to 34 Years | 0 (0.0%) | 0 (0.0%) |
| 35 to 64 Years | 2 (14.3%) | 1 (4.0%) |
| 65 to 74 Years | 0 (0.0%) | 0 (0.0%) |
| 75 Years and over | 0 (0.0%) | 0 (0.0%) |
Disability Class: Ambulatory Difficulty
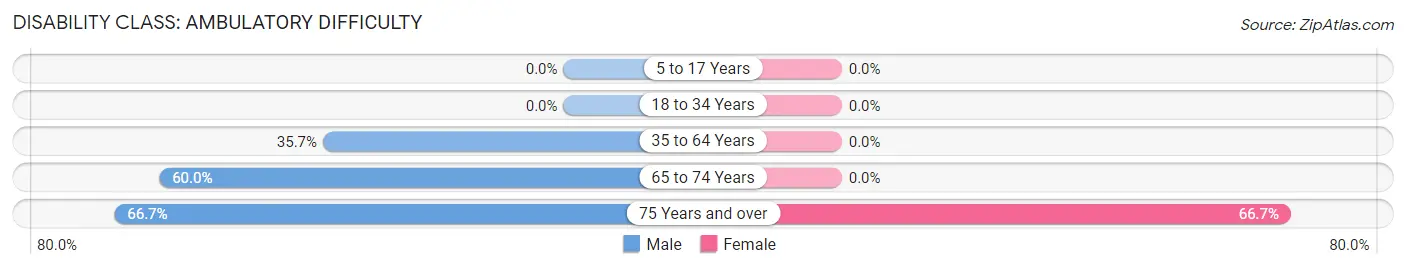
| Age Bracket | Male | Female |
| 5 to 17 Years | 0 (0.0%) | 0 (0.0%) |
| 18 to 34 Years | 0 (0.0%) | 0 (0.0%) |
| 35 to 64 Years | 5 (35.7%) | 0 (0.0%) |
| 65 to 74 Years | 3 (60.0%) | 0 (0.0%) |
| 75 Years and over | 2 (66.7%) | 2 (66.7%) |
Disability Class: Self-Care Difficulty
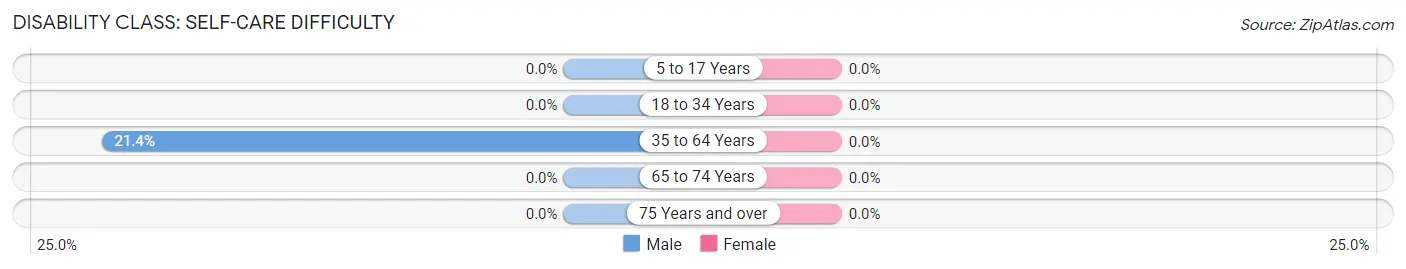
| Age Bracket | Male | Female |
| 5 to 17 Years | 0 (0.0%) | 0 (0.0%) |
| 18 to 34 Years | 0 (0.0%) | 0 (0.0%) |
| 35 to 64 Years | 3 (21.4%) | 0 (0.0%) |
| 65 to 74 Years | 0 (0.0%) | 0 (0.0%) |
| 75 Years and over | 0 (0.0%) | 0 (0.0%) |
Technology Access in Evan
Computing Device Access in Evan
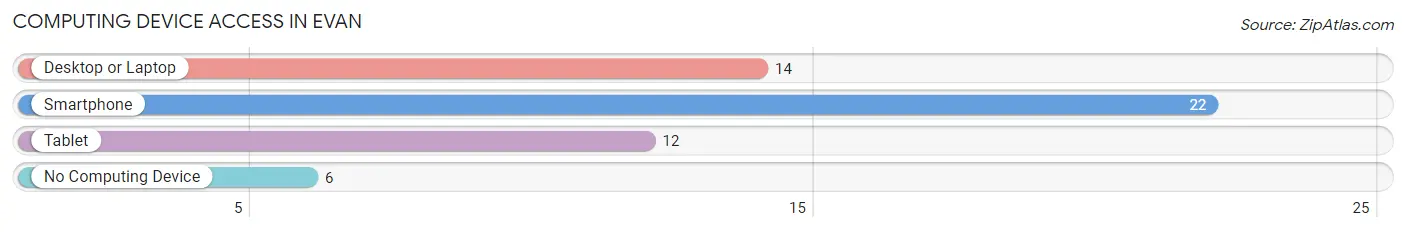
| Device Type | # Households | % Households |
| Desktop or Laptop | 14 | 48.3% |
| Smartphone | 22 | 75.9% |
| Tablet | 12 | 41.4% |
| No Computing Device | 6 | 20.7% |
| Total | 29 | 100.0% |
Internet Access in Evan
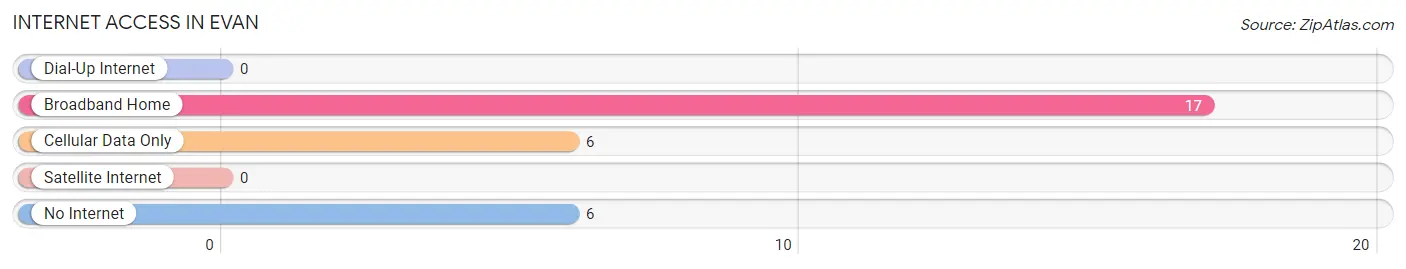
| Internet Type | # Households | % Households |
| Dial-Up Internet | 0 | 0.0% |
| Broadband Home | 17 | 58.6% |
| Cellular Data Only | 6 | 20.7% |
| Satellite Internet | 0 | 0.0% |
| No Internet | 6 | 20.7% |
| Total | 29 | 100.0% |
Evan Summary
Evan is a small city located in the state of Minnesota. It is situated in the southeastern corner of the state, near the border with Wisconsin. The city has a population of approximately 1,500 people and is part of the Minneapolis-St. Paul metropolitan area.
Geography
Evan is located in the southeastern corner of Minnesota, near the border with Wisconsin. The city is situated on the banks of the Mississippi River, and is surrounded by rolling hills and forests. The city is located in the St. Croix River Valley, which is known for its scenic beauty. The city is located approximately 25 miles from Minneapolis and St. Paul.
Climate
Evan has a humid continental climate, with cold winters and hot summers. The average temperature in the winter is around 20 degrees Fahrenheit, while the average temperature in the summer is around 75 degrees Fahrenheit. The city receives an average of 33 inches of precipitation per year, with most of it falling in the spring and summer months.
Demographics
As of the 2010 census, the population of Evan was 1,500 people. The racial makeup of the city was 95.3% White, 0.7% African American, 0.3% Native American, 0.7% Asian, 0.3% from other races, and 2.0% from two or more races. Hispanic or Latino of any race were 1.3% of the population.
Economy
Evan’s economy is largely based on agriculture and tourism. The city is home to several farms, which produce a variety of crops, including corn, soybeans, and wheat. The city is also home to several small businesses, including restaurants, retail stores, and service providers. Tourism is also an important part of the local economy, as the city is home to several attractions, including the St. Croix National Scenic Riverway, the Great River Road, and the Mississippi National River and Recreation Area.
History
Evan was founded in 1854 by settlers from New England. The city was named after Evan Jones, a local landowner. The city grew rapidly in the late 19th century, and by the early 20th century, it had become a major center for the lumber industry. The city was also home to several factories, which produced a variety of products, including furniture, clothing, and paper.
In the late 20th century, the city began to decline, as the lumber industry moved away and the factories closed. However, the city has since seen a resurgence, as it has become a popular tourist destination. The city is now home to several attractions, including the St. Croix National Scenic Riverway, the Great River Road, and the Mississippi National River and Recreation Area.
Conclusion
Evan is a small city located in the southeastern corner of Minnesota. It is situated on the banks of the Mississippi River, and is surrounded by rolling hills and forests. The city has a population of approximately 1,500 people and is part of the Minneapolis-St. Paul metropolitan area. The city’s economy is largely based on agriculture and tourism, and it is home to several attractions, including the St. Croix National Scenic Riverway, the Great River Road, and the Mississippi National River and Recreation Area. Evan has a long and rich history, and it is now a popular tourist destination.
Common Questions
What is the Total Population of Evan?
Total Population of Evan is 71.
What is the Total Male Population of Evan?
Total Male Population of Evan is 29.
What is the Total Female Population of Evan?
Total Female Population of Evan is 42.
What is the Ratio of Males per 100 Females in Evan?
There are 69.05 Males per 100 Females in Evan.
What is the Ratio of Females per 100 Males in Evan?
There are 144.83 Females per 100 Males in Evan.
What is the Median Population Age in Evan?
Median Population Age in Evan is 50.8 Years.
What is the Average Family Size in Evan
Average Family Size in Evan is 3.1 People.
What is the Average Household Size in Evan
Average Household Size in Evan is 2.5 People.
What is Per Capita Income in Evan?
Per Capita income in Evan is $25,387.
What is the Median Household income in Evan?
Median Household Income in Evan is $39,375.
What is Inequality or Gini Index in Evan?
Inequality or Gini Index in Evan is 0.45.
How Large is the Labor Force in Evan?
There are 44 People in the Labor Forcein in Evan.
What is the Percentage of People in the Labor Force in Evan?
72.1% of People are in the Labor Force in Evan.
What is the Unemployment Rate in Evan?
Unemployment Rate in Evan is 11.4%.