Clearbrook, MN
Clearbrook Map
Clearbrook Overview
689
TOTAL POPULATION
340
MALE POPULATION
349
FEMALE POPULATION
97.42
MALES / 100 FEMALES
102.65
FEMALES / 100 MALES
36.2
MEDIAN AGE
3.7
AVG FAMILY SIZE
2.9
AVG HOUSEHOLD SIZE
$27,641
PER CAPITA INCOME
$65,000
AVG FAMILY INCOME
$48,750
AVG HOUSEHOLD INCOME
61.5%
WAGE / INCOME GAP [ % ]
38.5¢/ $1
WAGE / INCOME GAP [ $ ]
0.53
INEQUALITY / GINI INDEX
264
LABOR FORCE [ PEOPLE ]
53.9%
PERCENT IN LABOR FORCE
4.5%
UNEMPLOYMENT RATE
Clearbrook Zip Codes
Clearbrook Area Codes
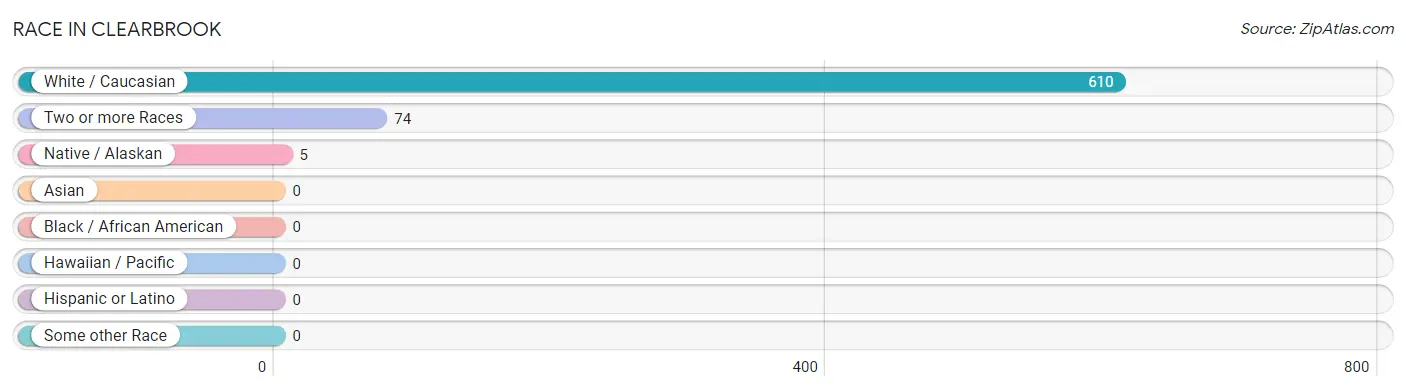
Race in Clearbrook
The most populous races in Clearbrook are White / Caucasian (610 | 88.5%), Two or more Races (74 | 10.7%), and Native / Alaskan (5 | 0.7%).
| Race | # Population | % Population |
| Asian | 0 | 0.0% |
| Black / African American | 0 | 0.0% |
| Hawaiian / Pacific | 0 | 0.0% |
| Hispanic or Latino | 0 | 0.0% |
| Native / Alaskan | 5 | 0.7% |
| White / Caucasian | 610 | 88.5% |
| Two or more Races | 74 | 10.7% |
| Some other Race | 0 | 0.0% |
| Total | 689 | 100.0% |
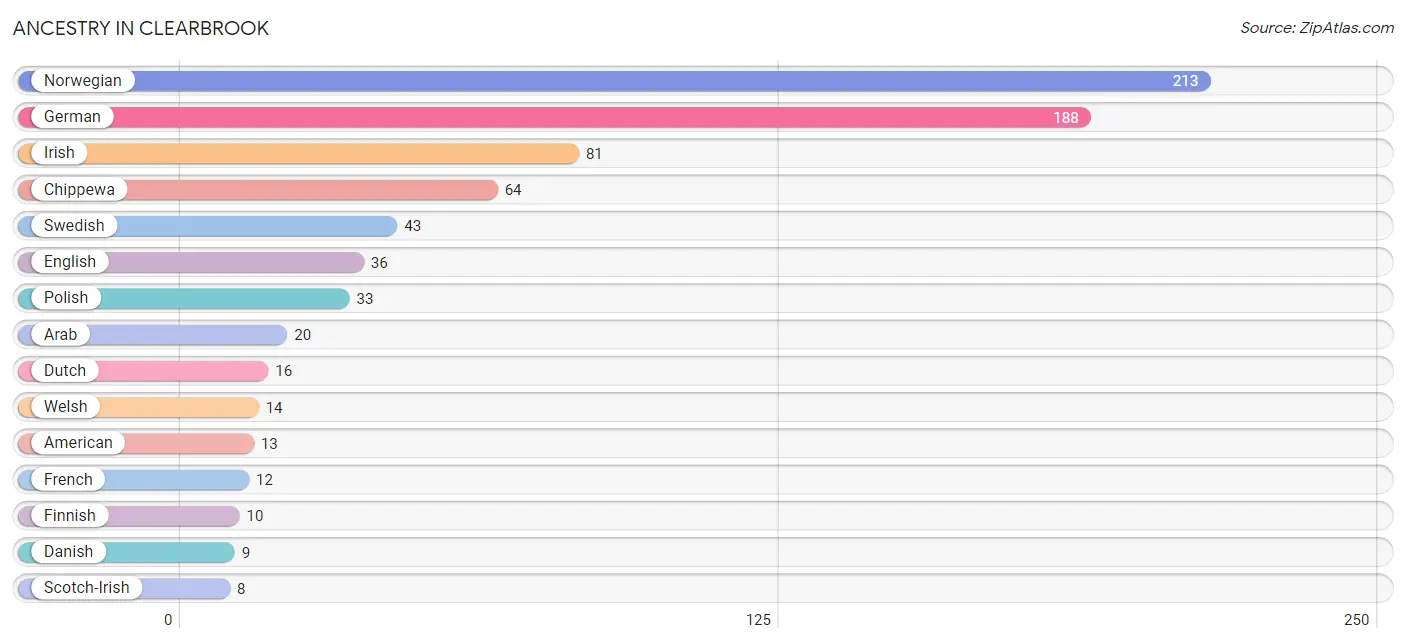
Ancestry in Clearbrook
The most populous ancestries reported in Clearbrook are Norwegian (213 | 30.9%), German (188 | 27.3%), Irish (81 | 11.8%), Chippewa (64 | 9.3%), and Swedish (43 | 6.2%), together accounting for 85.5% of all Clearbrook residents.
| Ancestry | # Population | % Population |
| American | 13 | 1.9% |
| Arab | 20 | 2.9% |
| British | 4 | 0.6% |
| Chippewa | 64 | 9.3% |
| Czech | 4 | 0.6% |
| Danish | 9 | 1.3% |
| Dutch | 16 | 2.3% |
| English | 36 | 5.2% |
| Finnish | 10 | 1.5% |
| French | 12 | 1.7% |
| German | 188 | 27.3% |
| Irish | 81 | 11.8% |
| Norwegian | 213 | 30.9% |
| Polish | 33 | 4.8% |
| Scandinavian | 4 | 0.6% |
| Scotch-Irish | 8 | 1.2% |
| Scottish | 2 | 0.3% |
| Swedish | 43 | 6.2% |
| Welsh | 14 | 2.0% | View All 19 Rows |
Immigrants in Clearbrook

| Immigration Origin | # Population | % Population | View All 0 Rows |
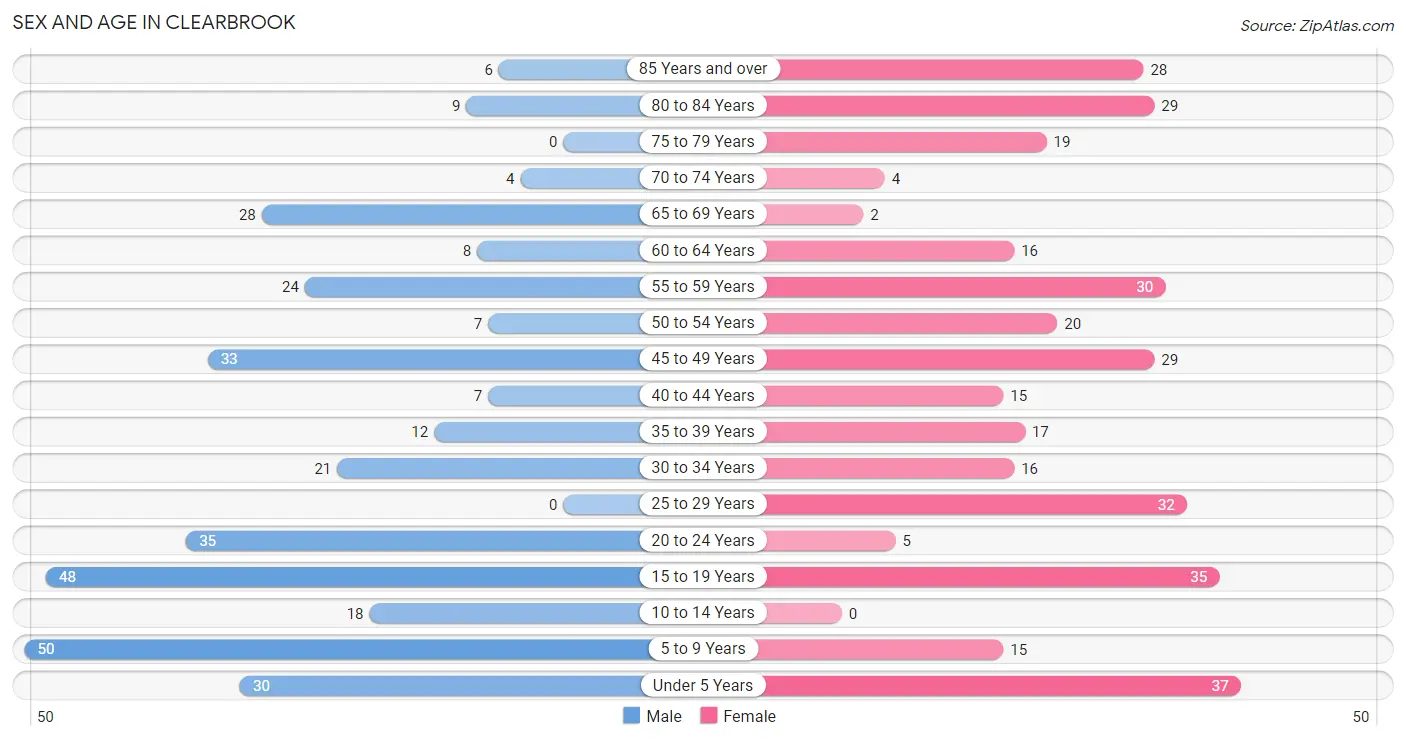
Sex and Age in Clearbrook
Sex and Age in Clearbrook
The most populous age groups in Clearbrook are 5 to 9 Years (50 | 14.7%) for men and Under 5 Years (37 | 10.6%) for women.
| Age Bracket | Male | Female |
| Under 5 Years | 30 (8.8%) | 37 (10.6%) |
| 5 to 9 Years | 50 (14.7%) | 15 (4.3%) |
| 10 to 14 Years | 18 (5.3%) | 0 (0.0%) |
| 15 to 19 Years | 48 (14.1%) | 35 (10.0%) |
| 20 to 24 Years | 35 (10.3%) | 5 (1.4%) |
| 25 to 29 Years | 0 (0.0%) | 32 (9.2%) |
| 30 to 34 Years | 21 (6.2%) | 16 (4.6%) |
| 35 to 39 Years | 12 (3.5%) | 17 (4.9%) |
| 40 to 44 Years | 7 (2.1%) | 15 (4.3%) |
| 45 to 49 Years | 33 (9.7%) | 29 (8.3%) |
| 50 to 54 Years | 7 (2.1%) | 20 (5.7%) |
| 55 to 59 Years | 24 (7.1%) | 30 (8.6%) |
| 60 to 64 Years | 8 (2.4%) | 16 (4.6%) |
| 65 to 69 Years | 28 (8.2%) | 2 (0.6%) |
| 70 to 74 Years | 4 (1.2%) | 4 (1.1%) |
| 75 to 79 Years | 0 (0.0%) | 19 (5.4%) |
| 80 to 84 Years | 9 (2.6%) | 29 (8.3%) |
| 85 Years and over | 6 (1.8%) | 28 (8.0%) |
| Total | 340 (100.0%) | 349 (100.0%) |
Families and Households in Clearbrook
Median Family Size in Clearbrook
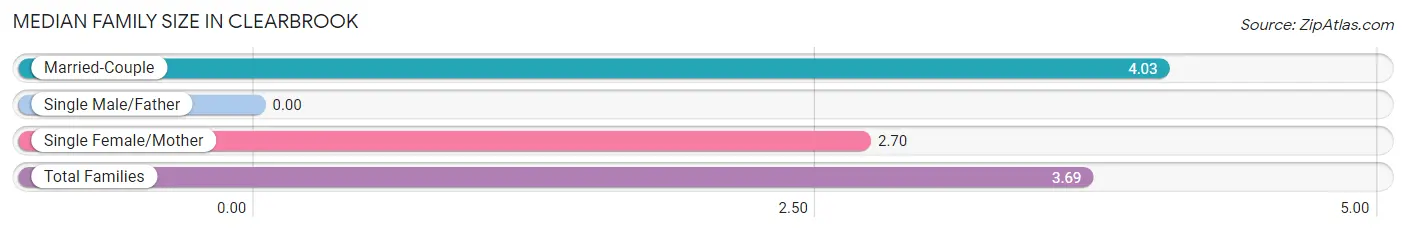
| Family Type | # Families | Family Size |
| Married-Couple | 107 (74.3%) | 4.03 |
| Single Male/Father | 0 (0.0%) | - |
| Single Female/Mother | 37 (25.7%) | 2.70 |
| Total Families | 144 (100.0%) | 3.69 |
Median Household Size in Clearbrook
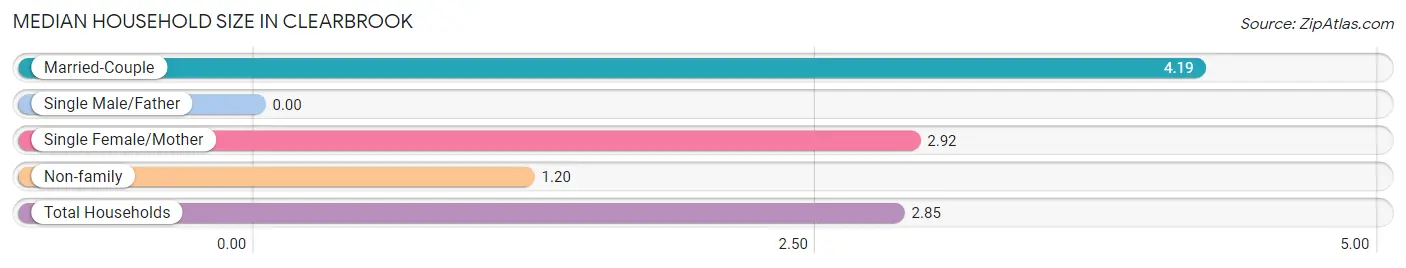
| Household Type | # Households | Household Size |
| Married-Couple | 107 (46.1%) | 4.19 |
| Single Male/Father | 0 (0.0%) | - |
| Single Female/Mother | 37 (16.0%) | 2.92 |
| Non-family | 88 (37.9%) | 1.20 |
| Total Households | 232 (100.0%) | 2.85 |
Household Size by Marriage Status in Clearbrook
Out of a total of 232 households in Clearbrook, 144 (62.1%) are family households, while 88 (37.9%) are nonfamily households. The most numerous type of family households are 2-person households, comprising 65, and the most common type of nonfamily households are 1-person households, comprising 74.
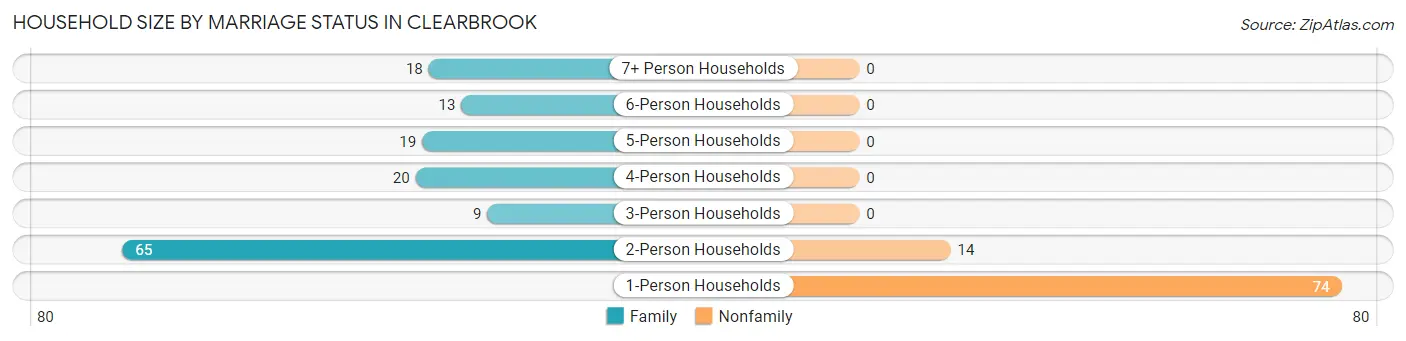
| Household Size | Family Households | Nonfamily Households |
| 1-Person Households | - | 74 (31.9%) |
| 2-Person Households | 65 (28.0%) | 14 (6.0%) |
| 3-Person Households | 9 (3.9%) | 0 (0.0%) |
| 4-Person Households | 20 (8.6%) | 0 (0.0%) |
| 5-Person Households | 19 (8.2%) | 0 (0.0%) |
| 6-Person Households | 13 (5.6%) | 0 (0.0%) |
| 7+ Person Households | 18 (7.8%) | 0 (0.0%) |
| Total | 144 (62.1%) | 88 (37.9%) |
Female Fertility in Clearbrook
Fertility by Age in Clearbrook
Average fertility rate in Clearbrook is 168.0 births per 1,000 women. Women in the age bracket of 20 to 34 years have the highest fertility rate with 472.0 births per 1,000 women. Women in the age bracket of 20 to 34 years acount for 100.0% of all women with births.
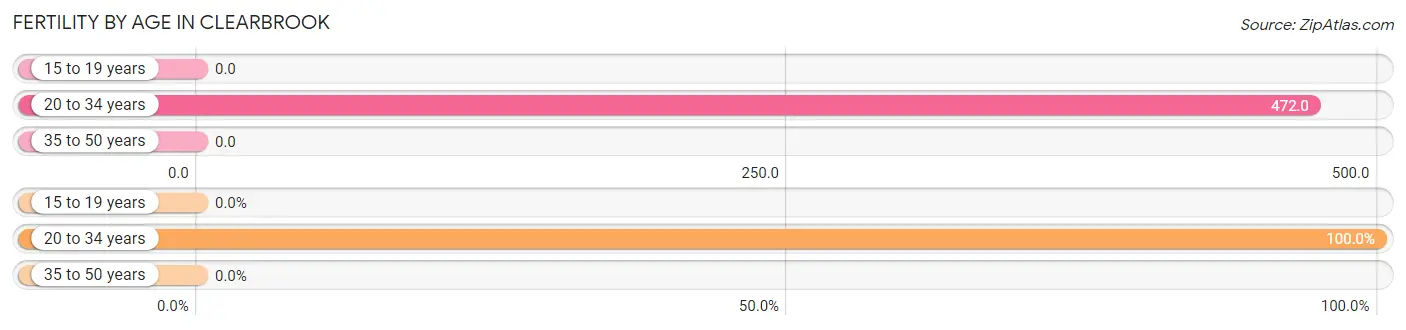
| Age Bracket | Women with Births | Births / 1,000 Women |
| 15 to 19 years | 0 (0.0%) | 0.0 |
| 20 to 34 years | 25 (100.0%) | 472.0 |
| 35 to 50 years | 0 (0.0%) | 0.0 |
| Total | 25 (100.0%) | 168.0 |
Fertility by Age by Marriage Status in Clearbrook
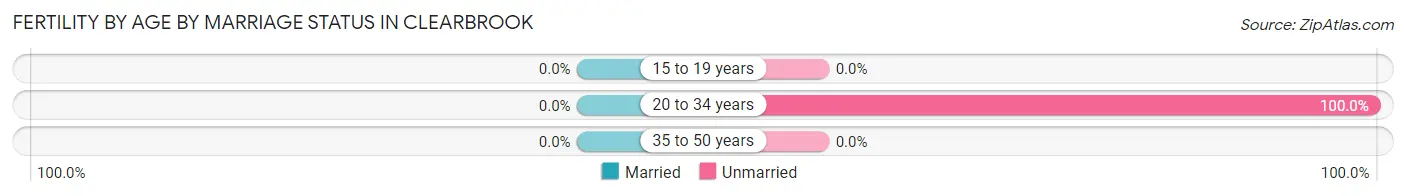
| Age Bracket | Married | Unmarried |
| 15 to 19 years | 0 (0.0%) | 0 (0.0%) |
| 20 to 34 years | 0 (0.0%) | 25 (100.0%) |
| 35 to 50 years | 0 (0.0%) | 0 (0.0%) |
| Total | 0 (0.0%) | 25 (100.0%) |
Fertility by Education in Clearbrook
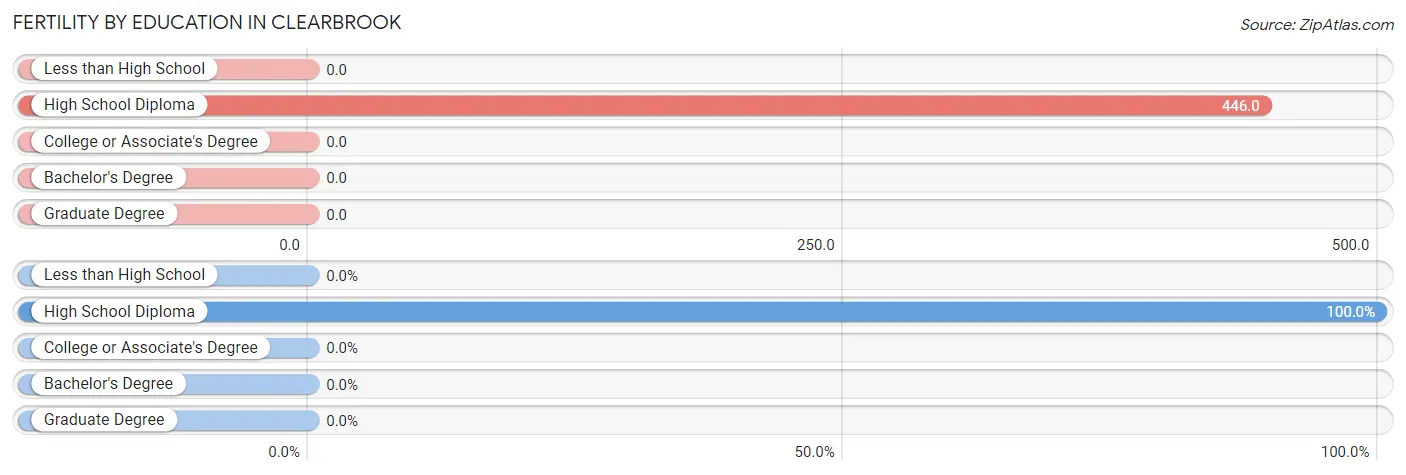
| Educational Attainment | Women with Births | Births / 1,000 Women |
| Less than High School | 0 (0.0%) | 0.0 |
| High School Diploma | 25 (100.0%) | 446.0 |
| College or Associate's Degree | 0 (0.0%) | 0.0 |
| Bachelor's Degree | 0 (0.0%) | 0.0 |
| Graduate Degree | 0 (0.0%) | 0.0 |
| Total | 25 (100.0%) | 168.0 |
Fertility by Education by Marriage Status in Clearbrook
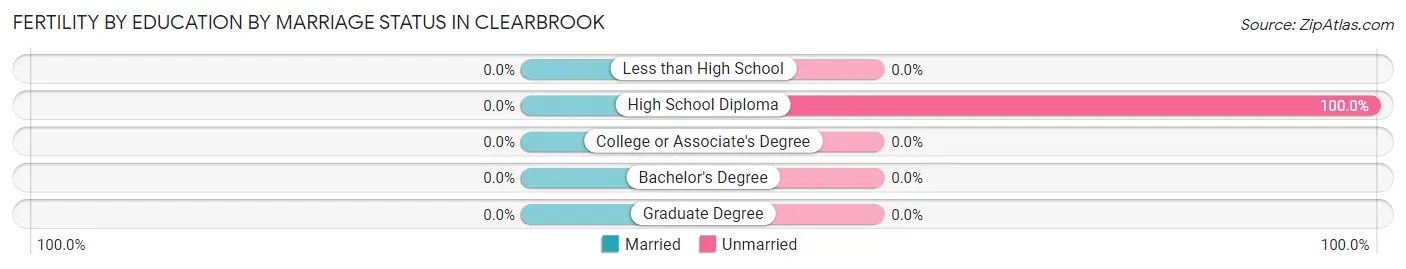
| Educational Attainment | Married | Unmarried |
| Less than High School | 0 (0.0%) | 0 (0.0%) |
| High School Diploma | 0 (0.0%) | 25 (100.0%) |
| College or Associate's Degree | 0 (0.0%) | 0 (0.0%) |
| Bachelor's Degree | 0 (0.0%) | 0 (0.0%) |
| Graduate Degree | 0 (0.0%) | 0 (0.0%) |
| Total | 0 (0.0%) | 25 (100.0%) |
Income in Clearbrook
Income Overview in Clearbrook
Per Capita Income in Clearbrook is $27,641, while median incomes of families and households are $65,000 and $48,750 respectively.
| Characteristic | Number | Measure |
| Per Capita Income | 689 | $27,641 |
| Median Family Income | 144 | $65,000 |
| Mean Family Income | 144 | $77,780 |
| Median Household Income | 232 | $48,750 |
| Mean Household Income | 232 | $78,037 |
| Income Deficit | 144 | $0 |
| Wage / Income Gap (%) | 689 | 61.50% |
| Wage / Income Gap ($) | 689 | 38.50¢ per $1 |
| Gini / Inequality Index | 689 | 0.53 |
Earnings by Sex in Clearbrook
Average Earnings in Clearbrook are $34,583, $43,224 for men and $16,641 for women, a difference of 61.5%.
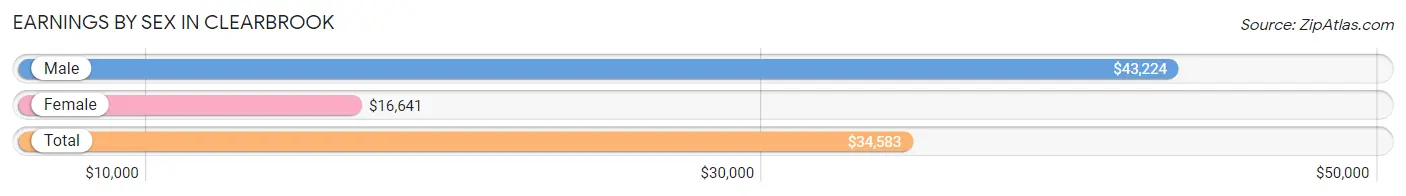
| Sex | Number | Average Earnings |
| Male | 157 (50.3%) | $43,224 |
| Female | 155 (49.7%) | $16,641 |
| Total | 312 (100.0%) | $34,583 |
Earnings by Sex by Income Bracket in Clearbrook
The most common earnings brackets in Clearbrook are $100,000+ for men (33 | 21.0%) and $2,499 or less for women (26 | 16.8%).
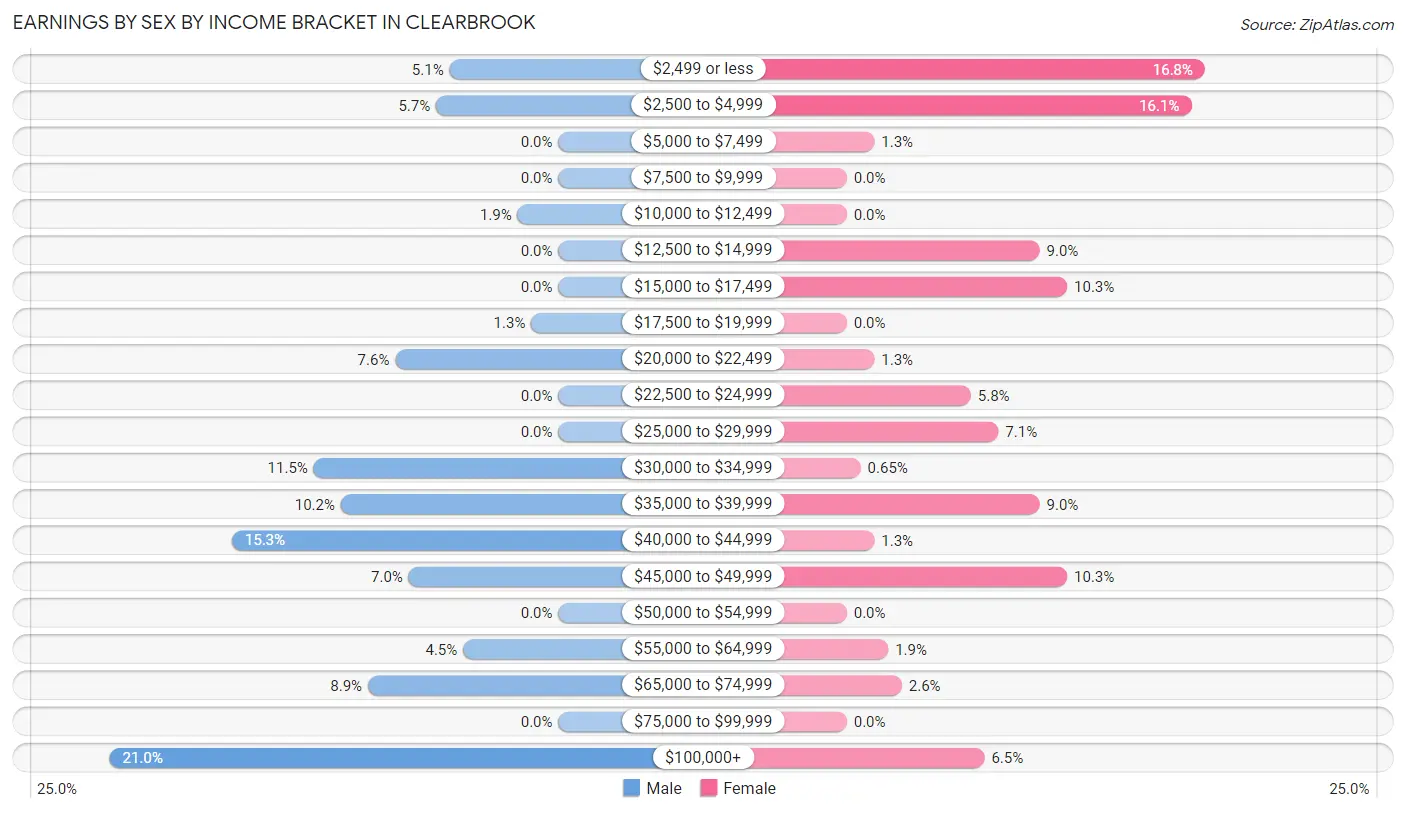
| Income | Male | Female |
| $2,499 or less | 8 (5.1%) | 26 (16.8%) |
| $2,500 to $4,999 | 9 (5.7%) | 25 (16.1%) |
| $5,000 to $7,499 | 0 (0.0%) | 2 (1.3%) |
| $7,500 to $9,999 | 0 (0.0%) | 0 (0.0%) |
| $10,000 to $12,499 | 3 (1.9%) | 0 (0.0%) |
| $12,500 to $14,999 | 0 (0.0%) | 14 (9.0%) |
| $15,000 to $17,499 | 0 (0.0%) | 16 (10.3%) |
| $17,500 to $19,999 | 2 (1.3%) | 0 (0.0%) |
| $20,000 to $22,499 | 12 (7.6%) | 2 (1.3%) |
| $22,500 to $24,999 | 0 (0.0%) | 9 (5.8%) |
| $25,000 to $29,999 | 0 (0.0%) | 11 (7.1%) |
| $30,000 to $34,999 | 18 (11.5%) | 1 (0.6%) |
| $35,000 to $39,999 | 16 (10.2%) | 14 (9.0%) |
| $40,000 to $44,999 | 24 (15.3%) | 2 (1.3%) |
| $45,000 to $49,999 | 11 (7.0%) | 16 (10.3%) |
| $50,000 to $54,999 | 0 (0.0%) | 0 (0.0%) |
| $55,000 to $64,999 | 7 (4.5%) | 3 (1.9%) |
| $65,000 to $74,999 | 14 (8.9%) | 4 (2.6%) |
| $75,000 to $99,999 | 0 (0.0%) | 0 (0.0%) |
| $100,000+ | 33 (21.0%) | 10 (6.5%) |
| Total | 157 (100.0%) | 155 (100.0%) |
Earnings by Sex by Educational Attainment in Clearbrook
Average earnings in Clearbrook are $48,864 for men and $22,639 for women, a difference of 53.7%. Men with an educational attainment of bachelor's degree enjoy the highest average annual earnings of $108,661, while those with graduate degree education earn the least with $36,964. Women with an educational attainment of college or associate's degree earn the most with the average annual earnings of $36,786, while those with bachelor's degree education have the smallest earnings of $24,028.
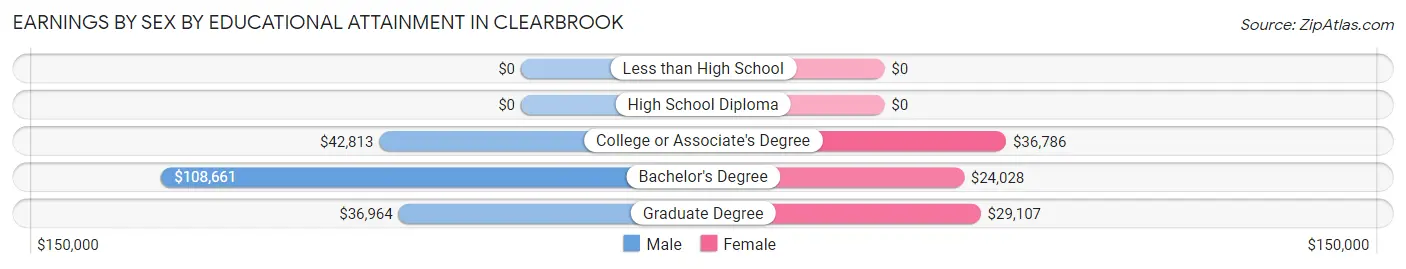
| Educational Attainment | Male Income | Female Income |
| Less than High School | - | - |
| High School Diploma | - | - |
| College or Associate's Degree | $42,813 | $36,786 |
| Bachelor's Degree | $108,661 | $24,028 |
| Graduate Degree | $36,964 | $29,107 |
| Total | $48,864 | $22,639 |
Family Income in Clearbrook
Family Income Brackets in Clearbrook
According to the Clearbrook family income data, there are 43 families falling into the $100,000 to $149,999 income range, which is the most common income bracket and makes up 29.9% of all families.
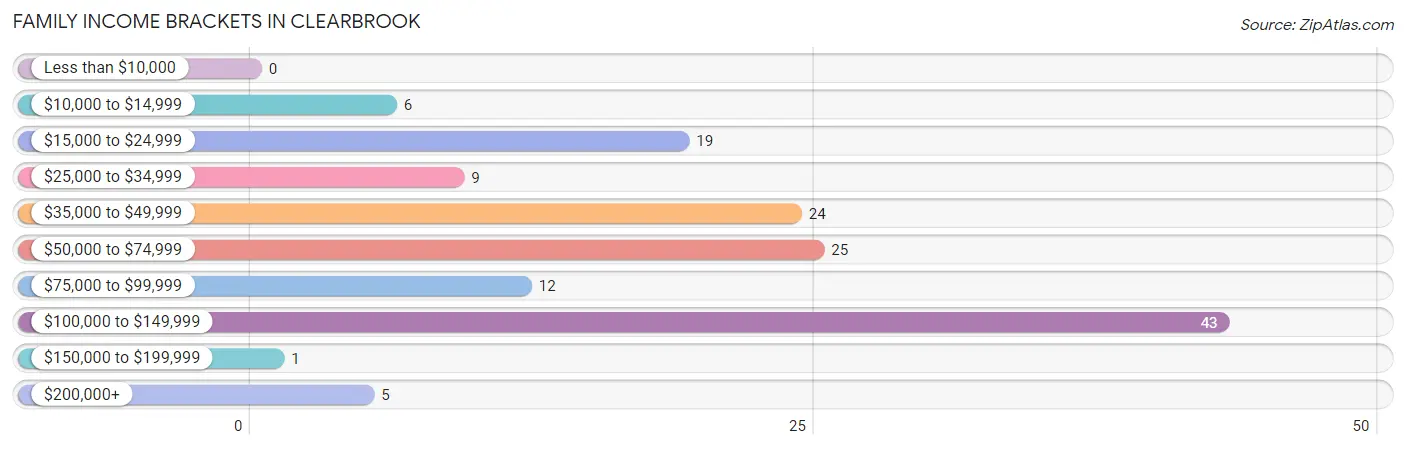
| Income Bracket | # Families | % Families |
| Less than $10,000 | 0 | 0.0% |
| $10,000 to $14,999 | 6 | 4.2% |
| $15,000 to $24,999 | 19 | 13.2% |
| $25,000 to $34,999 | 9 | 6.3% |
| $35,000 to $49,999 | 24 | 16.7% |
| $50,000 to $74,999 | 25 | 17.4% |
| $75,000 to $99,999 | 12 | 8.3% |
| $100,000 to $149,999 | 43 | 29.9% |
| $150,000 to $199,999 | 1 | 0.7% |
| $200,000+ | 5 | 3.5% |
Family Income by Famaliy Size in Clearbrook
6-person families (31 | 21.5%) account for the highest median family income in Clearbrook with $135,347 per family, while 4-person families (20 | 13.9%) have the highest median income of $27,322 per family member.
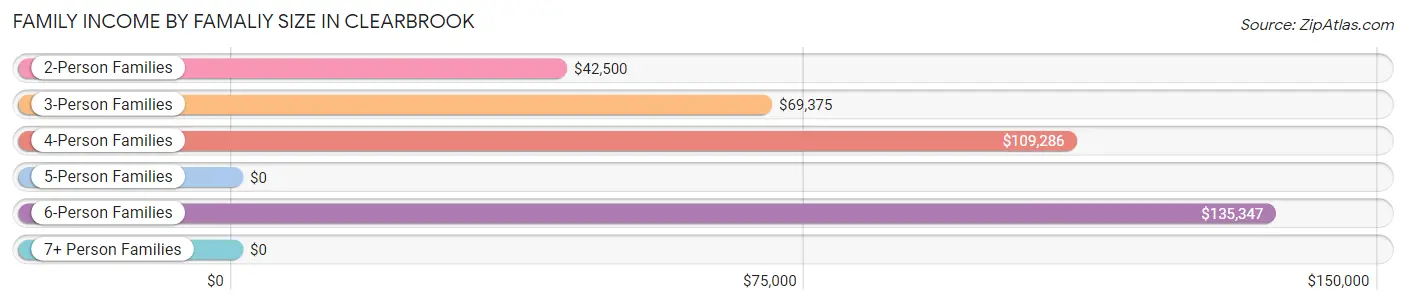
| Income Bracket | # Families | Median Income |
| 2-Person Families | 66 (45.8%) | $42,500 |
| 3-Person Families | 13 (9.0%) | $69,375 |
| 4-Person Families | 20 (13.9%) | $109,286 |
| 5-Person Families | 14 (9.7%) | $0 |
| 6-Person Families | 31 (21.5%) | $135,347 |
| 7+ Person Families | 0 (0.0%) | $0 |
| Total | 144 (100.0%) | $65,000 |
Family Income by Number of Earners in Clearbrook
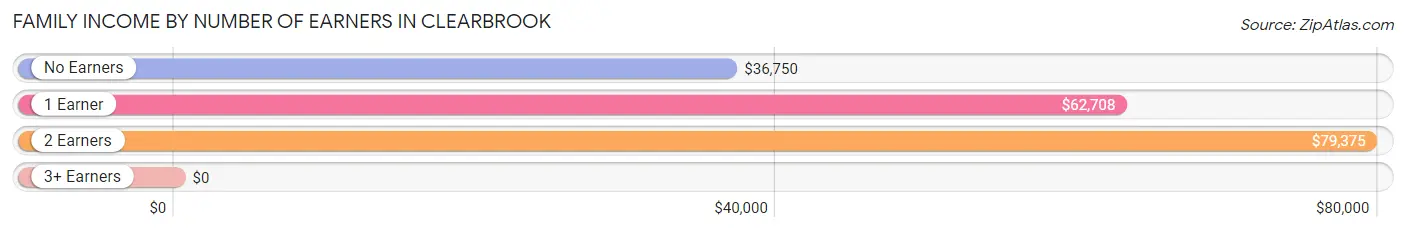
| Number of Earners | # Families | Median Income |
| No Earners | 19 (13.2%) | $36,750 |
| 1 Earner | 41 (28.5%) | $62,708 |
| 2 Earners | 67 (46.5%) | $79,375 |
| 3+ Earners | 17 (11.8%) | $0 |
| Total | 144 (100.0%) | $65,000 |
Household Income in Clearbrook
Household Income Brackets in Clearbrook
With 40 households falling in the category, the $50,000 to $74,999 income range is the most frequent in Clearbrook, accounting for 17.2% of all households. In contrast, only 7 households (3.0%) fall into the $200,000+ income bracket, making it the least populous group.
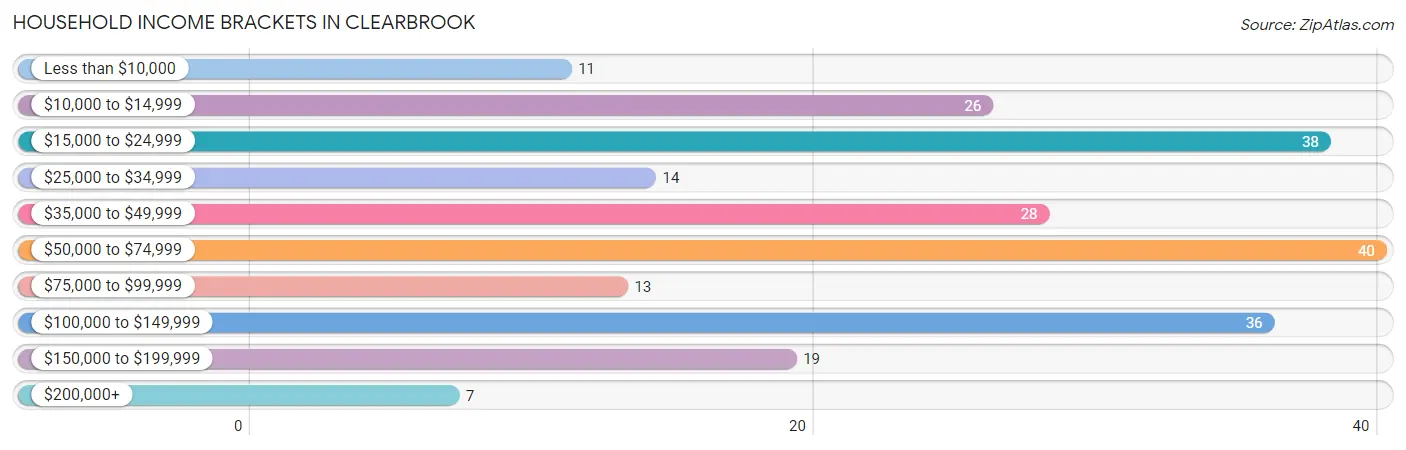
| Income Bracket | # Households | % Households |
| Less than $10,000 | 11 | 4.7% |
| $10,000 to $14,999 | 26 | 11.2% |
| $15,000 to $24,999 | 38 | 16.4% |
| $25,000 to $34,999 | 14 | 6.0% |
| $35,000 to $49,999 | 28 | 12.1% |
| $50,000 to $74,999 | 40 | 17.2% |
| $75,000 to $99,999 | 13 | 5.6% |
| $100,000 to $149,999 | 36 | 15.5% |
| $150,000 to $199,999 | 19 | 8.2% |
| $200,000+ | 7 | 3.0% |
Household Income by Householder Age in Clearbrook
The median household income in Clearbrook is $48,750, with the highest median household income of $107,500 found in the 25 to 44 years age bracket for the primary householder. A total of 50 households (21.5%) fall into this category. Meanwhile, the 65+ years age bracket for the primary householder has the lowest median household income of $17,361, with 73 households (31.5%) in this group.
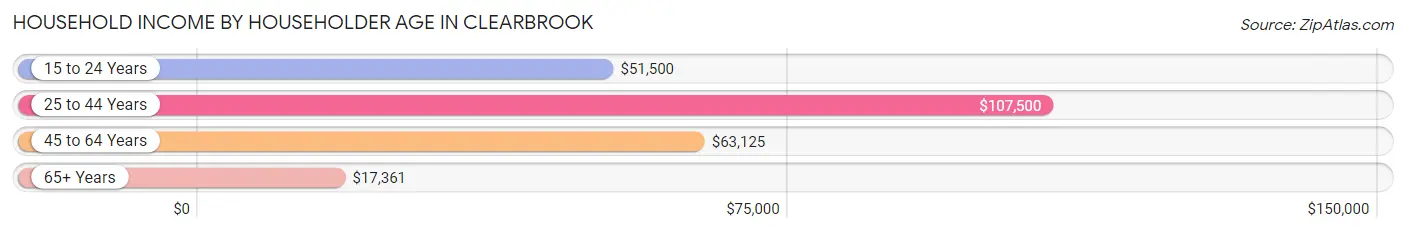
| Income Bracket | # Households | Median Income |
| 15 to 24 Years | 16 (6.9%) | $51,500 |
| 25 to 44 Years | 50 (21.5%) | $107,500 |
| 45 to 64 Years | 93 (40.1%) | $63,125 |
| 65+ Years | 73 (31.5%) | $17,361 |
| Total | 232 (100.0%) | $48,750 |
Poverty in Clearbrook
Income Below Poverty by Sex and Age in Clearbrook
With 15.3% poverty level for males and 9.7% for females among the residents of Clearbrook, 65 to 74 year old males and 18 to 24 year old females are the most vulnerable to poverty, with 22 males (68.8%) and 5 females (31.2%) in their respective age groups living below the poverty level.
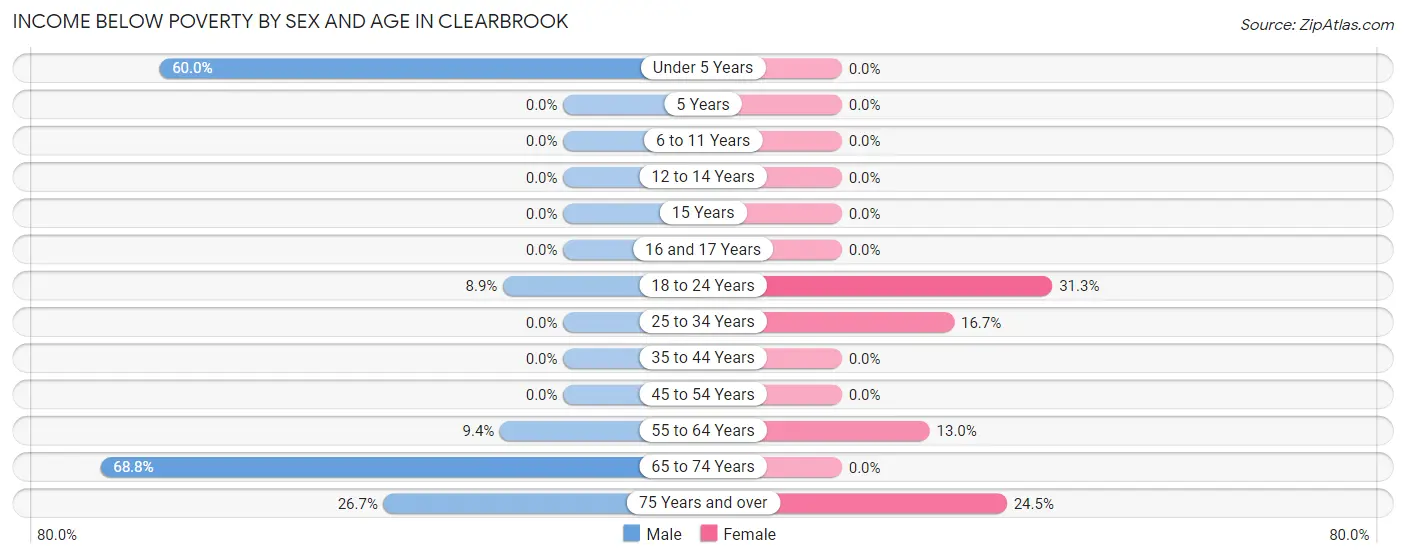
| Age Bracket | Male | Female |
| Under 5 Years | 18 (60.0%) | 0 (0.0%) |
| 5 Years | 0 (0.0%) | 0 (0.0%) |
| 6 to 11 Years | 0 (0.0%) | 0 (0.0%) |
| 12 to 14 Years | 0 (0.0%) | 0 (0.0%) |
| 15 Years | 0 (0.0%) | 0 (0.0%) |
| 16 and 17 Years | 0 (0.0%) | 0 (0.0%) |
| 18 to 24 Years | 5 (8.9%) | 5 (31.2%) |
| 25 to 34 Years | 0 (0.0%) | 8 (16.7%) |
| 35 to 44 Years | 0 (0.0%) | 0 (0.0%) |
| 45 to 54 Years | 0 (0.0%) | 0 (0.0%) |
| 55 to 64 Years | 3 (9.4%) | 6 (13.0%) |
| 65 to 74 Years | 22 (68.8%) | 0 (0.0%) |
| 75 Years and over | 4 (26.7%) | 12 (24.5%) |
| Total | 52 (15.3%) | 31 (9.7%) |
Income Above Poverty by Sex and Age in Clearbrook
According to the poverty statistics in Clearbrook, males aged 5 years and females aged under 5 years are the age groups that are most secure financially, with 100.0% of males and 100.0% of females in these age groups living above the poverty line.
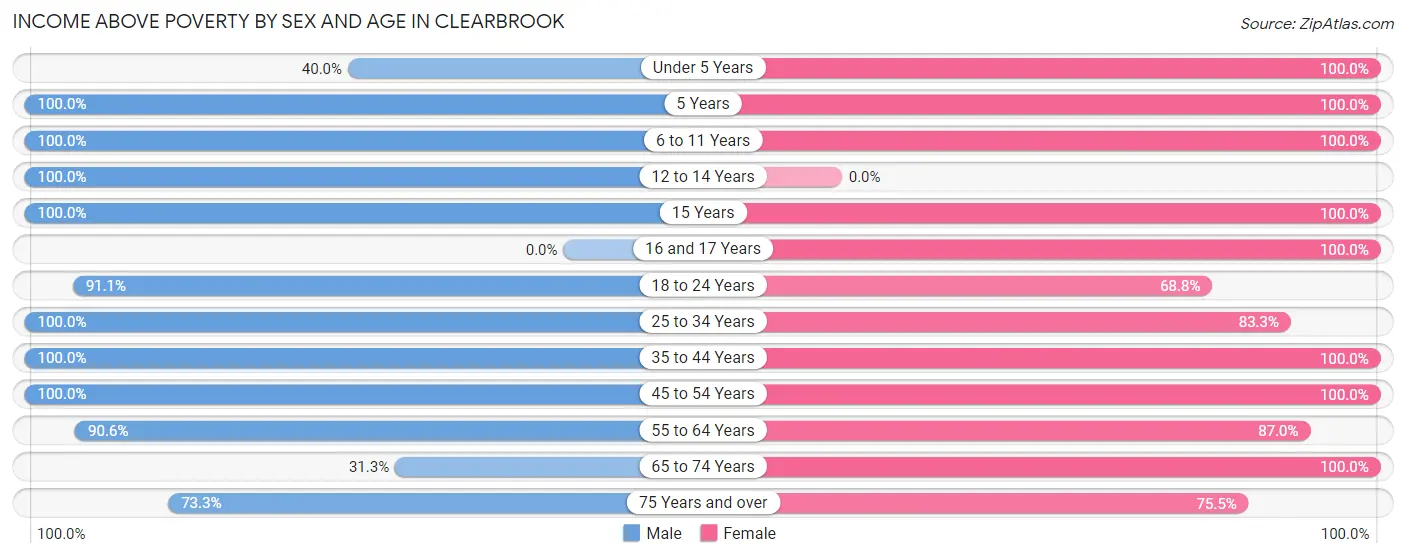
| Age Bracket | Male | Female |
| Under 5 Years | 12 (40.0%) | 37 (100.0%) |
| 5 Years | 20 (100.0%) | 6 (100.0%) |
| 6 to 11 Years | 35 (100.0%) | 7 (100.0%) |
| 12 to 14 Years | 13 (100.0%) | 0 (0.0%) |
| 15 Years | 27 (100.0%) | 22 (100.0%) |
| 16 and 17 Years | 0 (0.0%) | 2 (100.0%) |
| 18 to 24 Years | 51 (91.1%) | 11 (68.8%) |
| 25 to 34 Years | 21 (100.0%) | 40 (83.3%) |
| 35 to 44 Years | 19 (100.0%) | 32 (100.0%) |
| 45 to 54 Years | 40 (100.0%) | 49 (100.0%) |
| 55 to 64 Years | 29 (90.6%) | 40 (87.0%) |
| 65 to 74 Years | 10 (31.2%) | 6 (100.0%) |
| 75 Years and over | 11 (73.3%) | 37 (75.5%) |
| Total | 288 (84.7%) | 289 (90.3%) |
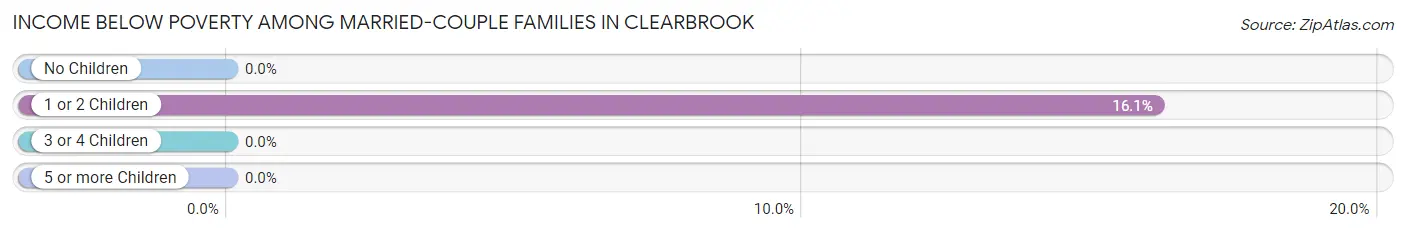
Income Below Poverty Among Married-Couple Families in Clearbrook
The poverty statistics for married-couple families in Clearbrook show that 4.7% or 5 of the total 107 families live below the poverty line. Families with 1 or 2 children have the highest poverty rate of 16.1%, comprising of 5 families. On the other hand, families with no children have the lowest poverty rate of 0.0%, which includes 0 families.
| Children | Above Poverty | Below Poverty |
| No Children | 45 (100.0%) | 0 (0.0%) |
| 1 or 2 Children | 26 (83.9%) | 5 (16.1%) |
| 3 or 4 Children | 31 (100.0%) | 0 (0.0%) |
| 5 or more Children | 0 (0.0%) | 0 (0.0%) |
| Total | 102 (95.3%) | 5 (4.7%) |
Income Below Poverty Among Single-Parent Households in Clearbrook
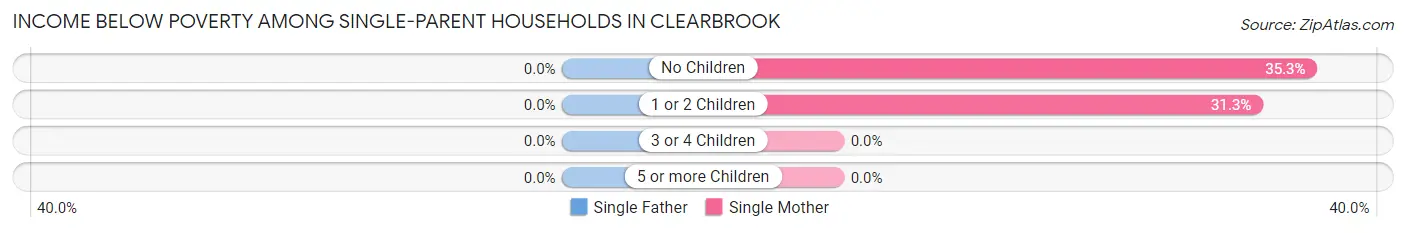
| Children | Single Father | Single Mother |
| No Children | 0 (0.0%) | 6 (35.3%) |
| 1 or 2 Children | 0 (0.0%) | 5 (31.2%) |
| 3 or 4 Children | 0 (0.0%) | 0 (0.0%) |
| 5 or more Children | 0 (0.0%) | 0 (0.0%) |
| Total | 0 (0.0%) | 11 (29.7%) |
Income Below Poverty Among Married-Couple vs Single-Parent Households in Clearbrook
The poverty data for Clearbrook shows that 5 of the married-couple family households (4.7%) and 11 of the single-parent households (29.7%) are living below the poverty level. Within the married-couple family households, those with 1 or 2 children have the highest poverty rate, with 5 households (16.1%) falling below the poverty line. Among the single-parent households, those with no children have the highest poverty rate, with 6 household (35.3%) living below poverty.
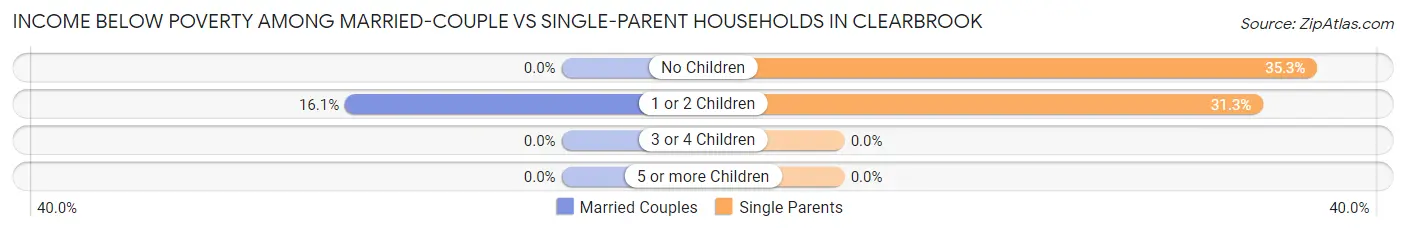
| Children | Married-Couple Families | Single-Parent Households |
| No Children | 0 (0.0%) | 6 (35.3%) |
| 1 or 2 Children | 5 (16.1%) | 5 (31.2%) |
| 3 or 4 Children | 0 (0.0%) | 0 (0.0%) |
| 5 or more Children | 0 (0.0%) | 0 (0.0%) |
| Total | 5 (4.7%) | 11 (29.7%) |
Employment Characteristics in Clearbrook
Employment by Class of Employer in Clearbrook
Among the 252 employed individuals in Clearbrook, private company employees (159 | 63.1%), not-for-profit organizations (46 | 18.2%), and local government employees (19 | 7.5%) make up the most common classes of employment.
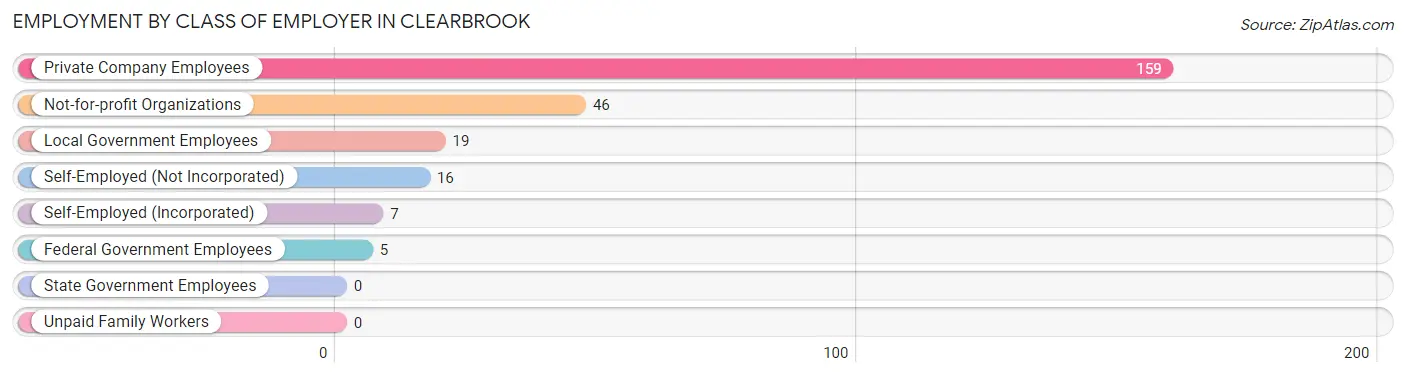
| Employer Class | # Employees | % Employees |
| Private Company Employees | 159 | 63.1% |
| Self-Employed (Incorporated) | 7 | 2.8% |
| Self-Employed (Not Incorporated) | 16 | 6.4% |
| Not-for-profit Organizations | 46 | 18.2% |
| Local Government Employees | 19 | 7.5% |
| State Government Employees | 0 | 0.0% |
| Federal Government Employees | 5 | 2.0% |
| Unpaid Family Workers | 0 | 0.0% |
| Total | 252 | 100.0% |
Employment Status by Age in Clearbrook
According to the labor force statistics for Clearbrook, out of the total population over 16 years of age (490), 53.9% or 264 individuals are in the labor force, with 4.5% or 12 of them unemployed. The age group with the highest labor force participation rate is 30 to 34 years, with 91.9% or 34 individuals in the labor force. Within the labor force, the 25 to 29 years age range has the highest percentage of unemployed individuals, with 14.3% or 1 of them being unemployed.
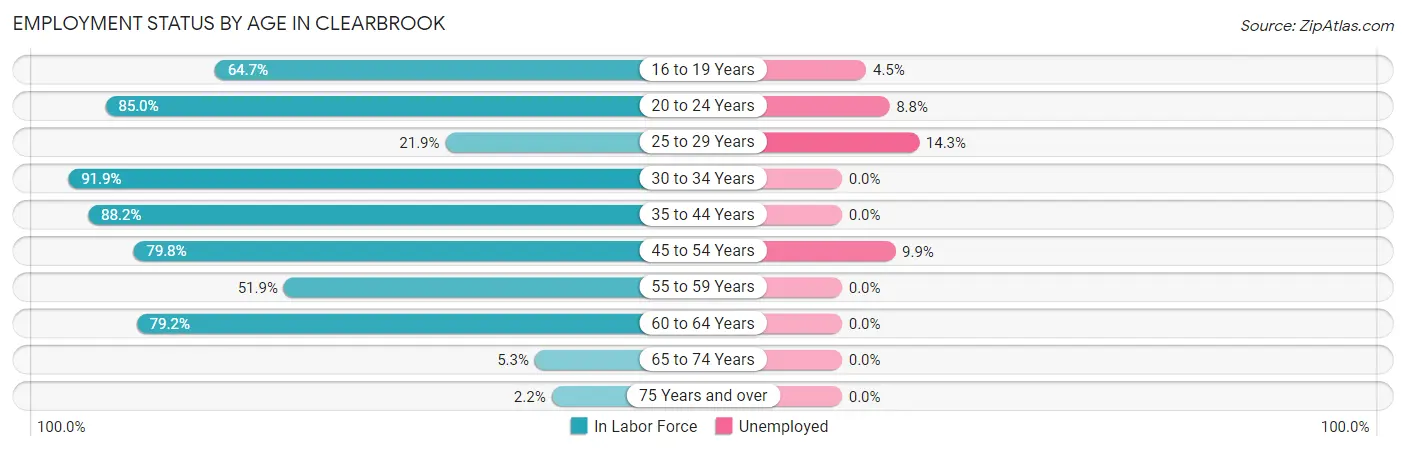
| Age Bracket | In Labor Force | Unemployed |
| 16 to 19 Years | 22 (64.7%) | 1 (4.5%) |
| 20 to 24 Years | 34 (85.0%) | 3 (8.8%) |
| 25 to 29 Years | 7 (21.9%) | 1 (14.3%) |
| 30 to 34 Years | 34 (91.9%) | 0 (0.0%) |
| 35 to 44 Years | 45 (88.2%) | 0 (0.0%) |
| 45 to 54 Years | 71 (79.8%) | 7 (9.9%) |
| 55 to 59 Years | 28 (51.9%) | 0 (0.0%) |
| 60 to 64 Years | 19 (79.2%) | 0 (0.0%) |
| 65 to 74 Years | 2 (5.3%) | 0 (0.0%) |
| 75 Years and over | 2 (2.2%) | 0 (0.0%) |
| Total | 264 (53.9%) | 12 (4.5%) |
Employment Status by Educational Attainment in Clearbrook
According to labor force statistics for Clearbrook, 71.1% of individuals (204) out of the total population between 25 and 64 years of age (287) are in the labor force, with 3.9% or 8 of them being unemployed. The group with the highest labor force participation rate are those with the educational attainment of college / associate degree, with 87.5% or 70 individuals in the labor force. Within the labor force, individuals with high school diploma education have the highest percentage of unemployment, with 10.8% or 7 of them being unemployed.
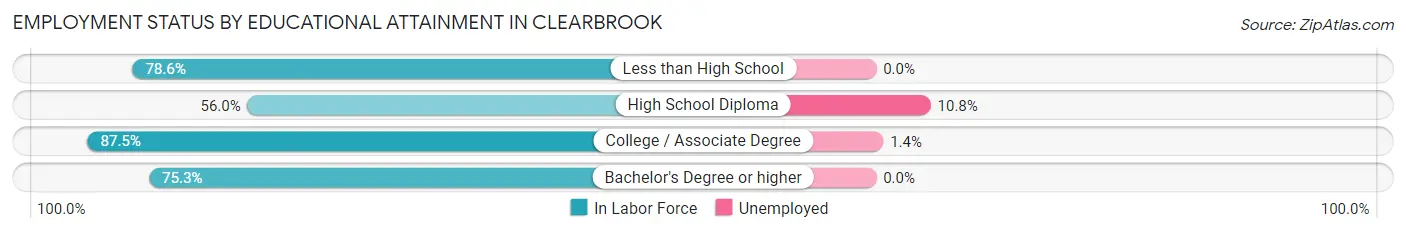
| Educational Attainment | In Labor Force | Unemployed |
| Less than High School | 11 (78.6%) | 0 (0.0%) |
| High School Diploma | 65 (56.0%) | 13 (10.8%) |
| College / Associate Degree | 70 (87.5%) | 1 (1.4%) |
| Bachelor's Degree or higher | 58 (75.3%) | 0 (0.0%) |
| Total | 204 (71.1%) | 11 (3.9%) |
Employment Occupations by Sex in Clearbrook
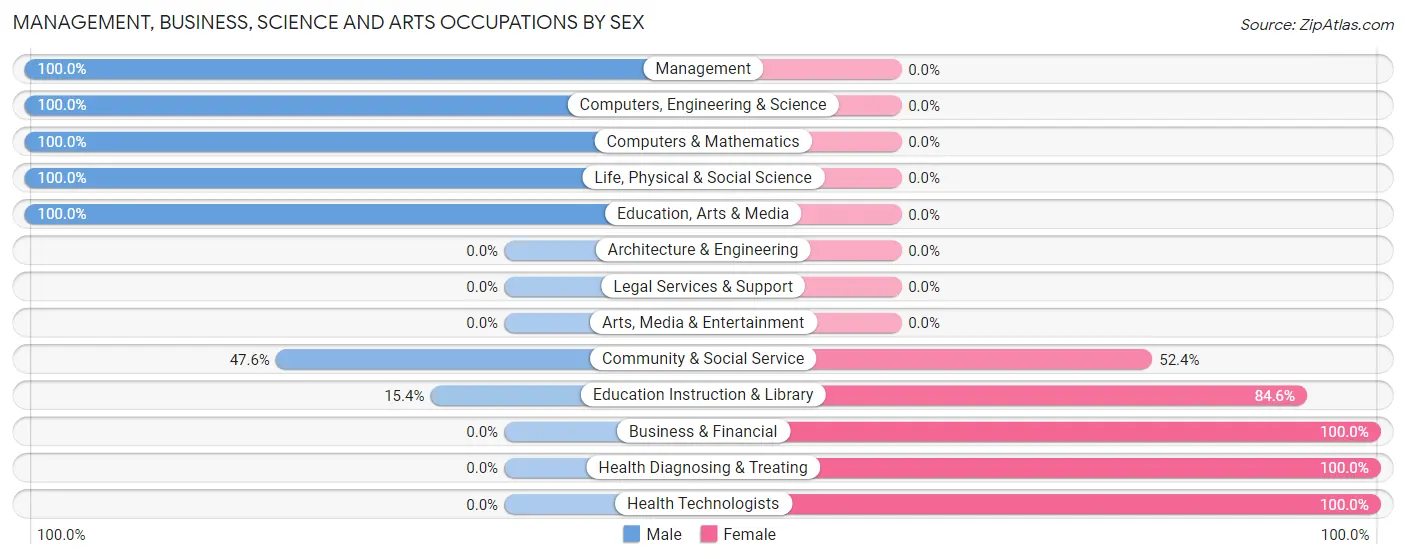
Management, Business, Science and Arts Occupations
The most common Management, Business, Science and Arts occupations in Clearbrook are Community & Social Service (21 | 8.3%), Computers, Engineering & Science (19 | 7.5%), Life, Physical & Social Science (14 | 5.6%), Education Instruction & Library (13 | 5.2%), and Education, Arts & Media (8 | 3.2%).
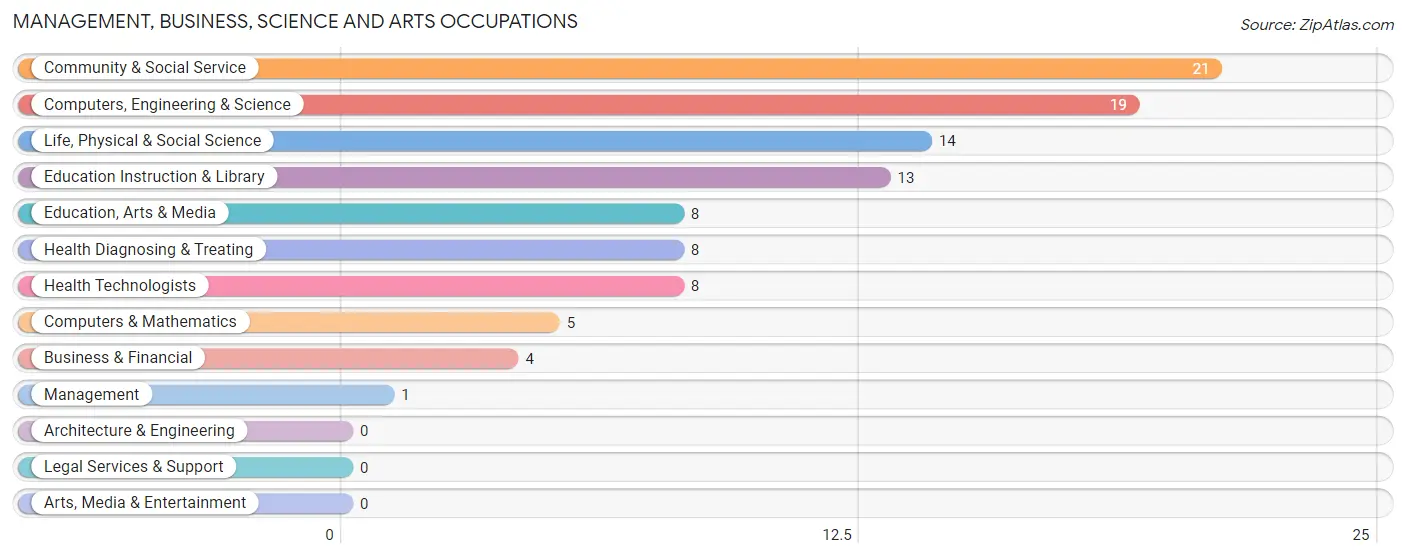
Management, Business, Science and Arts Occupations by Sex
Within the Management, Business, Science and Arts occupations in Clearbrook, the most male-oriented occupations are Management (100.0%), Computers, Engineering & Science (100.0%), and Computers & Mathematics (100.0%), while the most female-oriented occupations are Business & Financial (100.0%), Health Diagnosing & Treating (100.0%), and Health Technologists (100.0%).
| Occupation | Male | Female |
| Management | 1 (100.0%) | 0 (0.0%) |
| Business & Financial | 0 (0.0%) | 4 (100.0%) |
| Computers, Engineering & Science | 19 (100.0%) | 0 (0.0%) |
| Computers & Mathematics | 5 (100.0%) | 0 (0.0%) |
| Architecture & Engineering | 0 (0.0%) | 0 (0.0%) |
| Life, Physical & Social Science | 14 (100.0%) | 0 (0.0%) |
| Community & Social Service | 10 (47.6%) | 11 (52.4%) |
| Education, Arts & Media | 8 (100.0%) | 0 (0.0%) |
| Legal Services & Support | 0 (0.0%) | 0 (0.0%) |
| Education Instruction & Library | 2 (15.4%) | 11 (84.6%) |
| Arts, Media & Entertainment | 0 (0.0%) | 0 (0.0%) |
| Health Diagnosing & Treating | 0 (0.0%) | 8 (100.0%) |
| Health Technologists | 0 (0.0%) | 8 (100.0%) |
| Total (Category) | 30 (56.6%) | 23 (43.4%) |
| Total (Overall) | 137 (54.4%) | 115 (45.6%) |
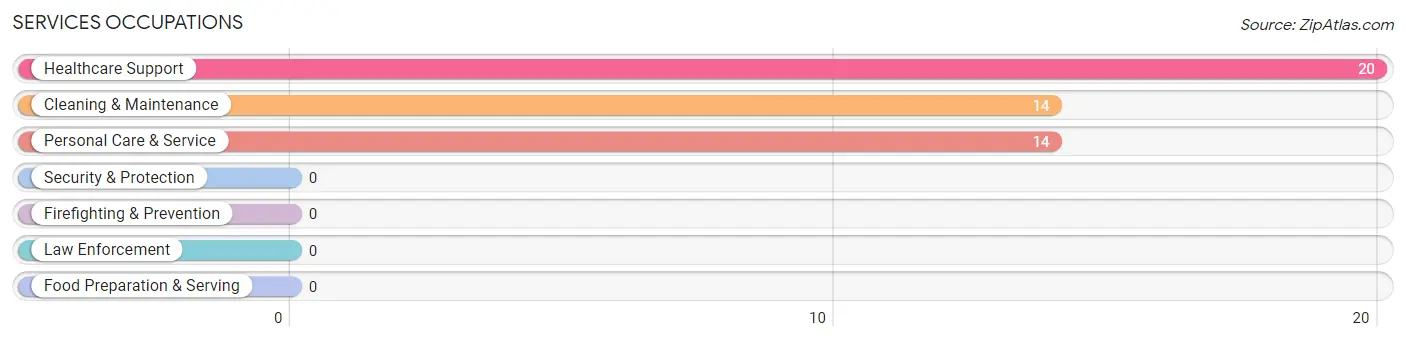
Services Occupations
The most common Services occupations in Clearbrook are Healthcare Support (20 | 7.9%), Cleaning & Maintenance (14 | 5.6%), and Personal Care & Service (14 | 5.6%).
Services Occupations by Sex
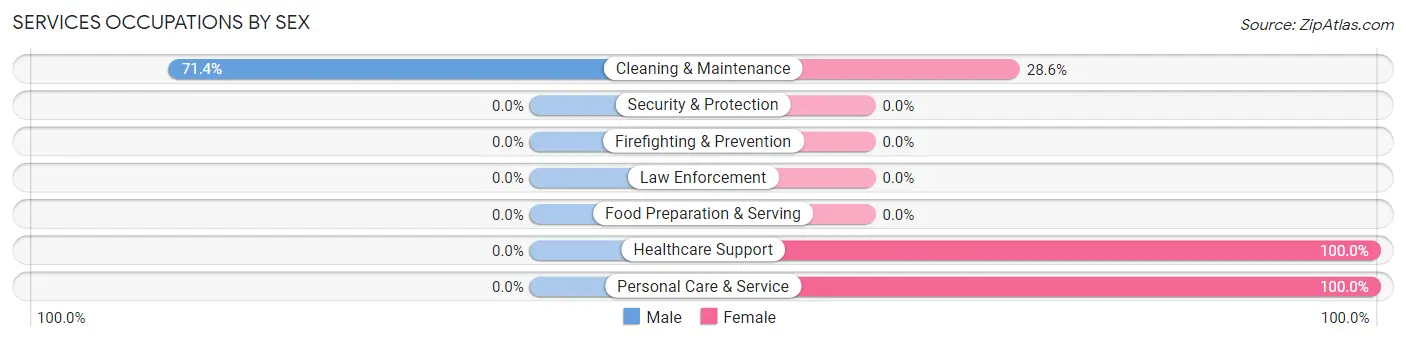
| Occupation | Male | Female |
| Healthcare Support | 0 (0.0%) | 20 (100.0%) |
| Security & Protection | 0 (0.0%) | 0 (0.0%) |
| Firefighting & Prevention | 0 (0.0%) | 0 (0.0%) |
| Law Enforcement | 0 (0.0%) | 0 (0.0%) |
| Food Preparation & Serving | 0 (0.0%) | 0 (0.0%) |
| Cleaning & Maintenance | 10 (71.4%) | 4 (28.6%) |
| Personal Care & Service | 0 (0.0%) | 14 (100.0%) |
| Total (Category) | 10 (20.8%) | 38 (79.2%) |
| Total (Overall) | 137 (54.4%) | 115 (45.6%) |
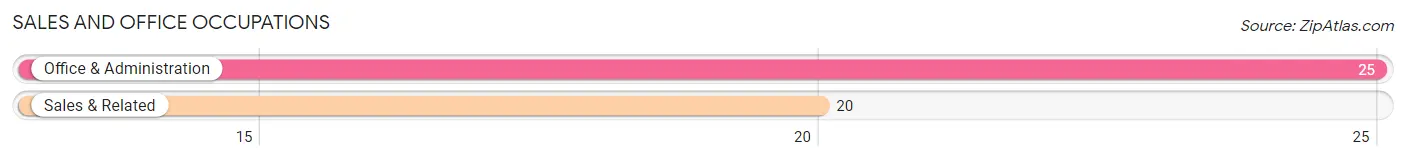
Sales and Office Occupations
The most common Sales and Office occupations in Clearbrook are Office & Administration (25 | 9.9%), and Sales & Related (20 | 7.9%).
Sales and Office Occupations by Sex
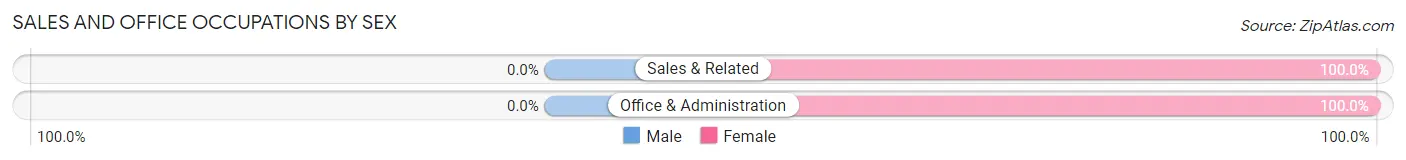
| Occupation | Male | Female |
| Sales & Related | 0 (0.0%) | 20 (100.0%) |
| Office & Administration | 0 (0.0%) | 25 (100.0%) |
| Total (Category) | 0 (0.0%) | 45 (100.0%) |
| Total (Overall) | 137 (54.4%) | 115 (45.6%) |
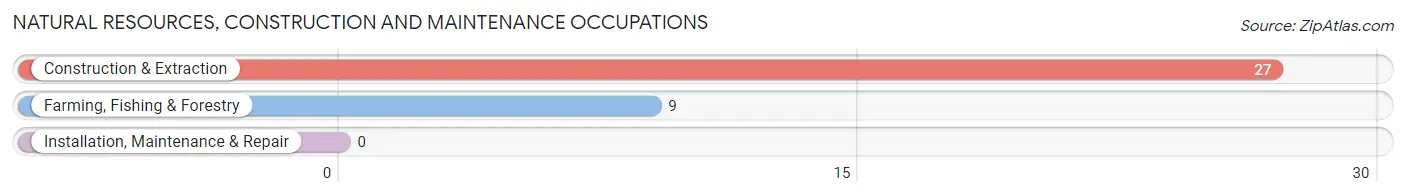
Natural Resources, Construction and Maintenance Occupations
The most common Natural Resources, Construction and Maintenance occupations in Clearbrook are Construction & Extraction (27 | 10.7%), and Farming, Fishing & Forestry (9 | 3.6%).
Natural Resources, Construction and Maintenance Occupations by Sex
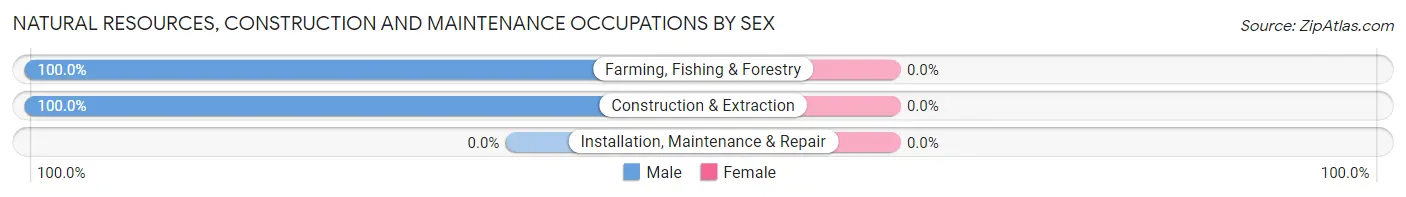
| Occupation | Male | Female |
| Farming, Fishing & Forestry | 9 (100.0%) | 0 (0.0%) |
| Construction & Extraction | 27 (100.0%) | 0 (0.0%) |
| Installation, Maintenance & Repair | 0 (0.0%) | 0 (0.0%) |
| Total (Category) | 36 (100.0%) | 0 (0.0%) |
| Total (Overall) | 137 (54.4%) | 115 (45.6%) |
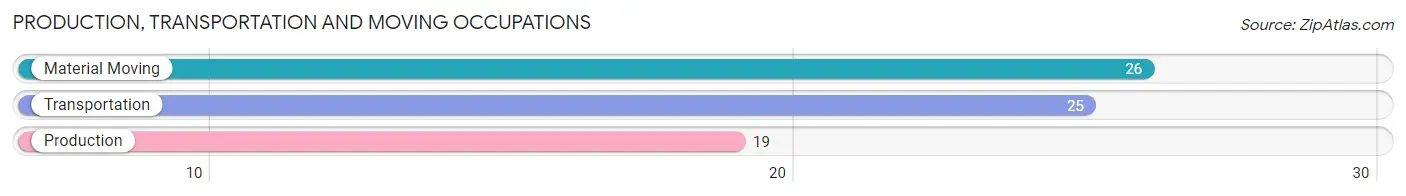
Production, Transportation and Moving Occupations
The most common Production, Transportation and Moving occupations in Clearbrook are Material Moving (26 | 10.3%), Transportation (25 | 9.9%), and Production (19 | 7.5%).
Production, Transportation and Moving Occupations by Sex
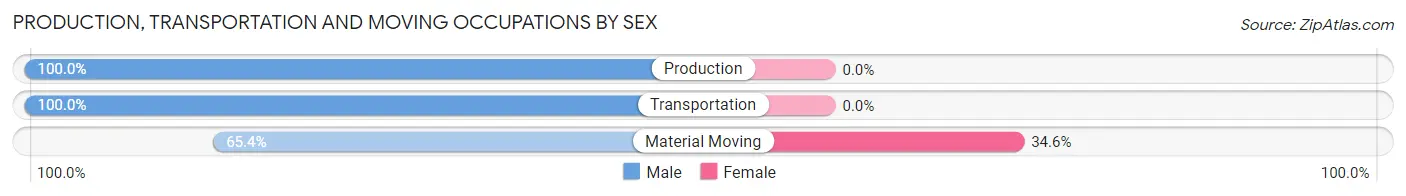
| Occupation | Male | Female |
| Production | 19 (100.0%) | 0 (0.0%) |
| Transportation | 25 (100.0%) | 0 (0.0%) |
| Material Moving | 17 (65.4%) | 9 (34.6%) |
| Total (Category) | 61 (87.1%) | 9 (12.9%) |
| Total (Overall) | 137 (54.4%) | 115 (45.6%) |
Employment Industries by Sex in Clearbrook
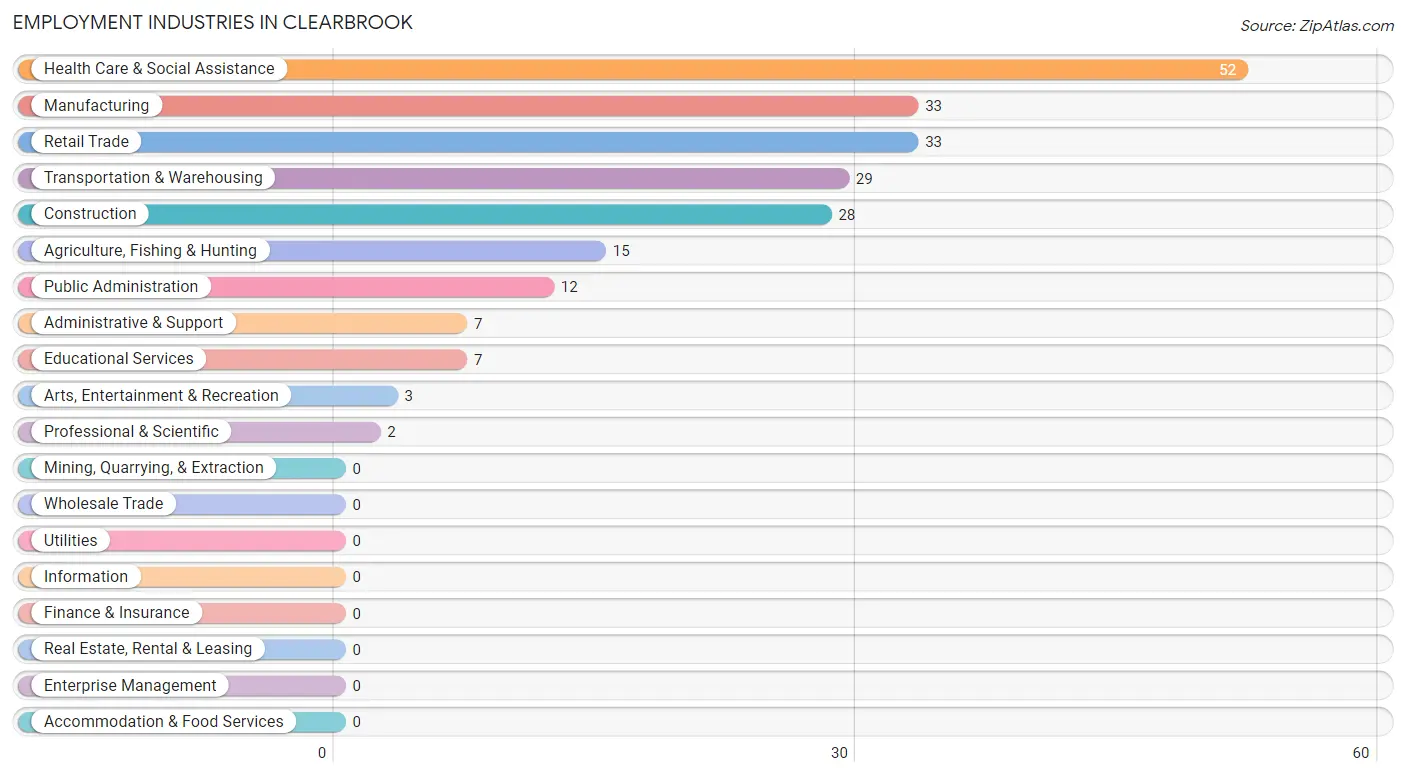
Employment Industries in Clearbrook
The major employment industries in Clearbrook include Health Care & Social Assistance (52 | 20.6%), Manufacturing (33 | 13.1%), Retail Trade (33 | 13.1%), Transportation & Warehousing (29 | 11.5%), and Construction (28 | 11.1%).
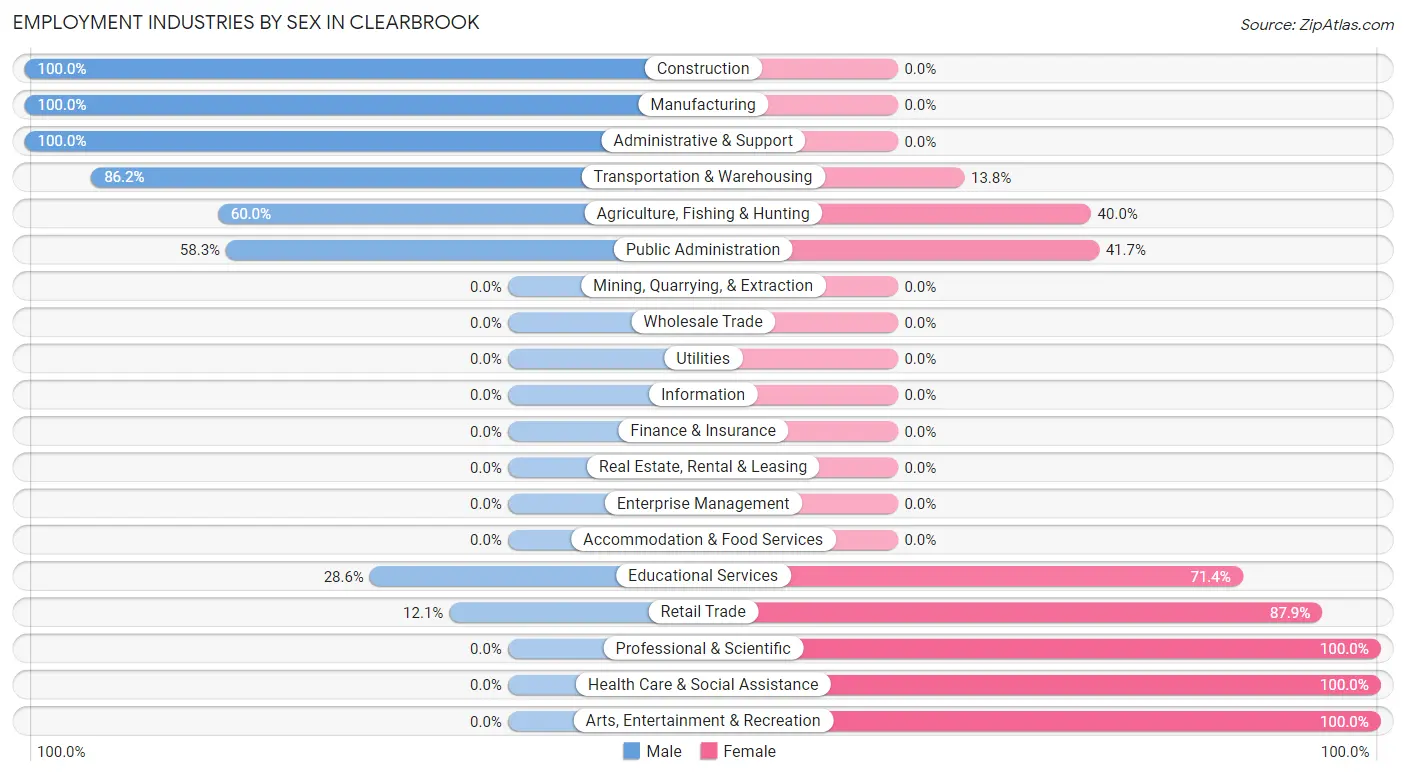
Employment Industries by Sex in Clearbrook
The Clearbrook industries that see more men than women are Construction (100.0%), Manufacturing (100.0%), and Administrative & Support (100.0%), whereas the industries that tend to have a higher number of women are Professional & Scientific (100.0%), Health Care & Social Assistance (100.0%), and Arts, Entertainment & Recreation (100.0%).
| Industry | Male | Female |
| Agriculture, Fishing & Hunting | 9 (60.0%) | 6 (40.0%) |
| Mining, Quarrying, & Extraction | 0 (0.0%) | 0 (0.0%) |
| Construction | 28 (100.0%) | 0 (0.0%) |
| Manufacturing | 33 (100.0%) | 0 (0.0%) |
| Wholesale Trade | 0 (0.0%) | 0 (0.0%) |
| Retail Trade | 4 (12.1%) | 29 (87.9%) |
| Transportation & Warehousing | 25 (86.2%) | 4 (13.8%) |
| Utilities | 0 (0.0%) | 0 (0.0%) |
| Information | 0 (0.0%) | 0 (0.0%) |
| Finance & Insurance | 0 (0.0%) | 0 (0.0%) |
| Real Estate, Rental & Leasing | 0 (0.0%) | 0 (0.0%) |
| Professional & Scientific | 0 (0.0%) | 2 (100.0%) |
| Enterprise Management | 0 (0.0%) | 0 (0.0%) |
| Administrative & Support | 7 (100.0%) | 0 (0.0%) |
| Educational Services | 2 (28.6%) | 5 (71.4%) |
| Health Care & Social Assistance | 0 (0.0%) | 52 (100.0%) |
| Arts, Entertainment & Recreation | 0 (0.0%) | 3 (100.0%) |
| Accommodation & Food Services | 0 (0.0%) | 0 (0.0%) |
| Public Administration | 7 (58.3%) | 5 (41.7%) |
| Total | 137 (54.4%) | 115 (45.6%) |
Education in Clearbrook
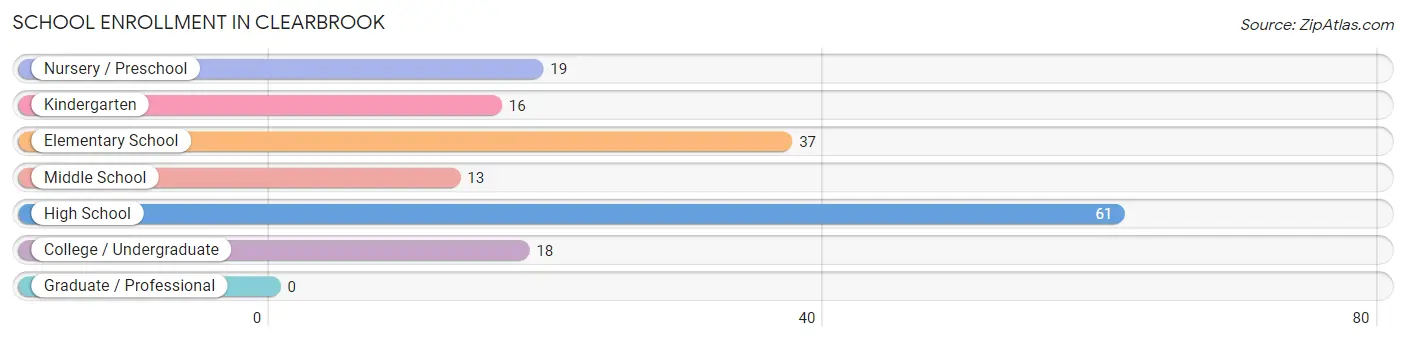
School Enrollment in Clearbrook
The most common levels of schooling among the 164 students in Clearbrook are high school (61 | 37.2%), elementary school (37 | 22.6%), and nursery / preschool (19 | 11.6%).
| School Level | # Students | % Students |
| Nursery / Preschool | 19 | 11.6% |
| Kindergarten | 16 | 9.8% |
| Elementary School | 37 | 22.6% |
| Middle School | 13 | 7.9% |
| High School | 61 | 37.2% |
| College / Undergraduate | 18 | 11.0% |
| Graduate / Professional | 0 | 0.0% |
| Total | 164 | 100.0% |
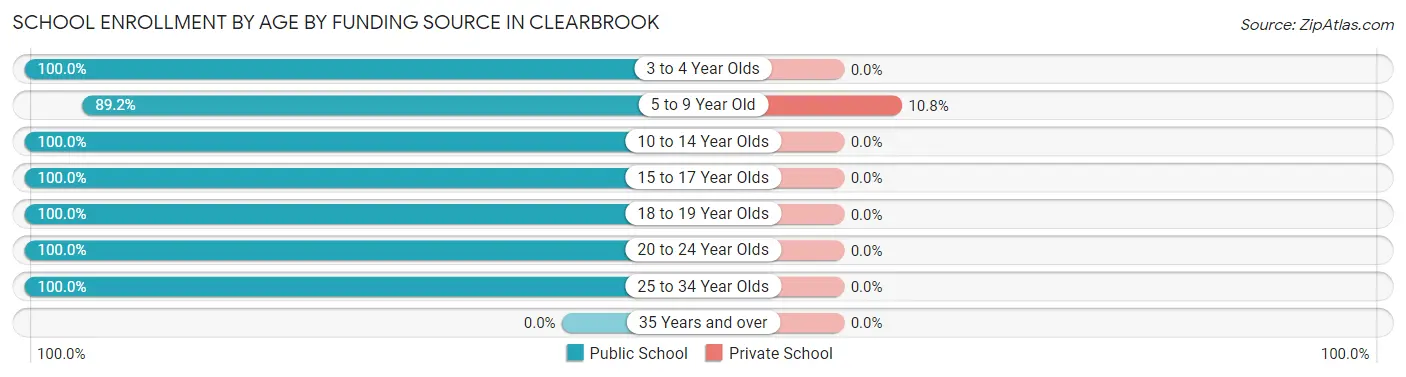
School Enrollment by Age by Funding Source in Clearbrook
Out of a total of 164 students who are enrolled in schools in Clearbrook, 7 (4.3%) attend a private institution, while the remaining 157 (95.7%) are enrolled in public schools. The age group of 5 to 9 year old has the highest likelihood of being enrolled in private schools, with 7 (10.8% in the age bracket) enrolled. Conversely, the age group of 3 to 4 year olds has the lowest likelihood of being enrolled in a private school, with 7 (100.0% in the age bracket) attending a public institution.
| Age Bracket | Public School | Private School |
| 3 to 4 Year Olds | 7 (100.0%) | 0 (0.0%) |
| 5 to 9 Year Old | 58 (89.2%) | 7 (10.8%) |
| 10 to 14 Year Olds | 18 (100.0%) | 0 (0.0%) |
| 15 to 17 Year Olds | 51 (100.0%) | 0 (0.0%) |
| 18 to 19 Year Olds | 10 (100.0%) | 0 (0.0%) |
| 20 to 24 Year Olds | 5 (100.0%) | 0 (0.0%) |
| 25 to 34 Year Olds | 8 (100.0%) | 0 (0.0%) |
| 35 Years and over | 0 (0.0%) | 0 (0.0%) |
| Total | 157 (95.7%) | 7 (4.3%) |
Educational Attainment by Field of Study in Clearbrook
Business (23 | 21.5%), engineering (19 | 17.8%), education (18 | 16.8%), arts & humanities (18 | 16.8%), and visual & performing arts (10 | 9.3%) are the most common fields of study among 107 individuals in Clearbrook who have obtained a bachelor's degree or higher.
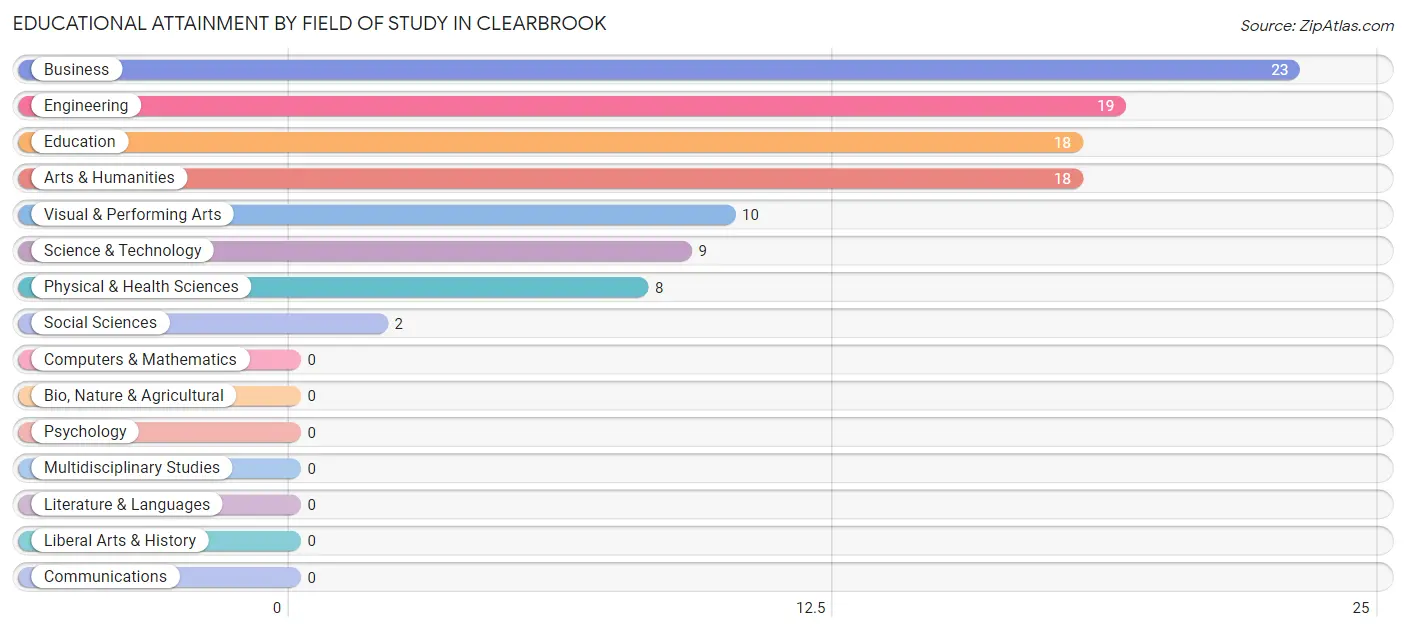
| Field of Study | # Graduates | % Graduates |
| Computers & Mathematics | 0 | 0.0% |
| Bio, Nature & Agricultural | 0 | 0.0% |
| Physical & Health Sciences | 8 | 7.5% |
| Psychology | 0 | 0.0% |
| Social Sciences | 2 | 1.9% |
| Engineering | 19 | 17.8% |
| Multidisciplinary Studies | 0 | 0.0% |
| Science & Technology | 9 | 8.4% |
| Business | 23 | 21.5% |
| Education | 18 | 16.8% |
| Literature & Languages | 0 | 0.0% |
| Liberal Arts & History | 0 | 0.0% |
| Visual & Performing Arts | 10 | 9.3% |
| Communications | 0 | 0.0% |
| Arts & Humanities | 18 | 16.8% |
| Total | 107 | 100.0% |
Transportation & Commute in Clearbrook
Vehicle Availability by Sex in Clearbrook
The most prevalent vehicle ownership categories in Clearbrook are males with 3 vehicles (58, accounting for 42.3%) and females with 3 vehicles (17, making up 50.4%).
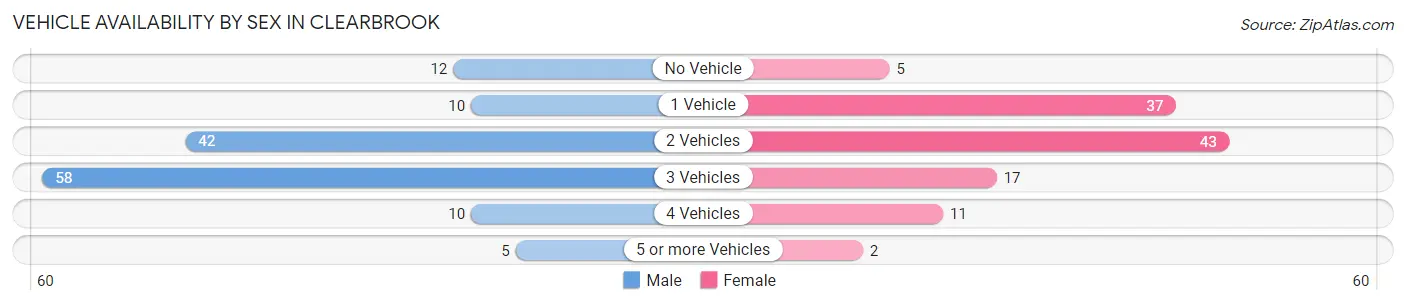
| Vehicles Available | Male | Female |
| No Vehicle | 12 (8.8%) | 5 (4.3%) |
| 1 Vehicle | 10 (7.3%) | 37 (32.2%) |
| 2 Vehicles | 42 (30.7%) | 43 (37.4%) |
| 3 Vehicles | 58 (42.3%) | 17 (14.8%) |
| 4 Vehicles | 10 (7.3%) | 11 (9.6%) |
| 5 or more Vehicles | 5 (3.6%) | 2 (1.7%) |
| Total | 137 (100.0%) | 115 (100.0%) |
Commute Time in Clearbrook
The most frequently occuring commute durations in Clearbrook are less than 5 minutes (34 commuters, 16.7%), 15 to 19 minutes (30 commuters, 14.7%), and 60 to 89 minutes (30 commuters, 14.7%).
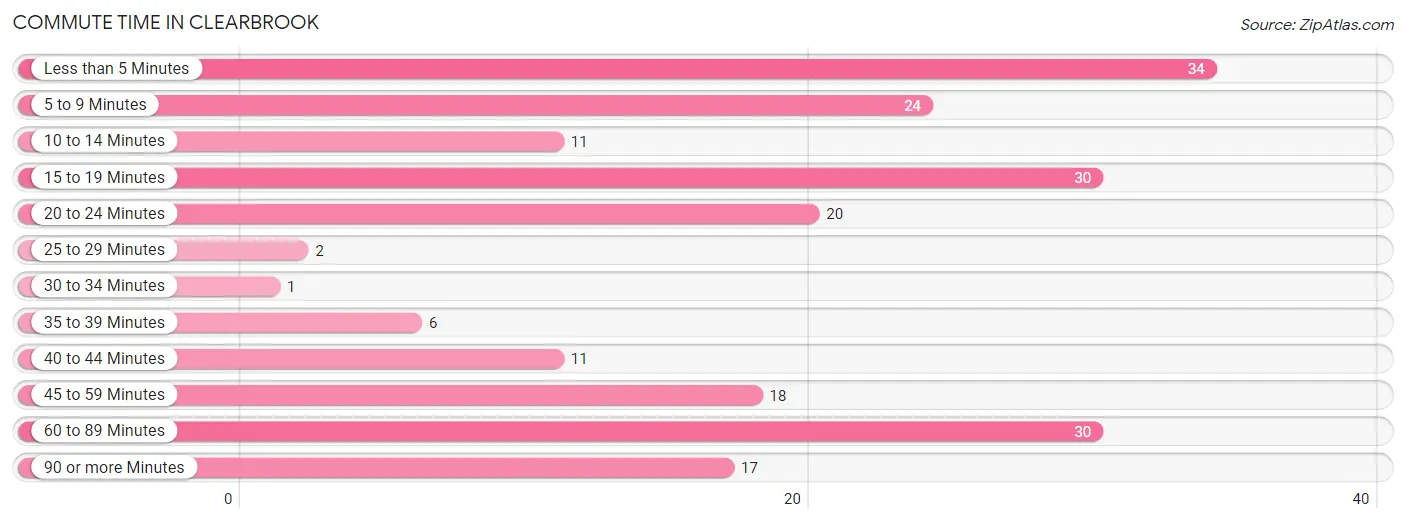
| Commute Time | # Commuters | % Commuters |
| Less than 5 Minutes | 34 | 16.7% |
| 5 to 9 Minutes | 24 | 11.8% |
| 10 to 14 Minutes | 11 | 5.4% |
| 15 to 19 Minutes | 30 | 14.7% |
| 20 to 24 Minutes | 20 | 9.8% |
| 25 to 29 Minutes | 2 | 1.0% |
| 30 to 34 Minutes | 1 | 0.5% |
| 35 to 39 Minutes | 6 | 2.9% |
| 40 to 44 Minutes | 11 | 5.4% |
| 45 to 59 Minutes | 18 | 8.8% |
| 60 to 89 Minutes | 30 | 14.7% |
| 90 or more Minutes | 17 | 8.3% |
Commute Time by Sex in Clearbrook
The most common commute times in Clearbrook are 60 to 89 minutes (27 commuters, 23.1%) for males and 15 to 19 minutes (22 commuters, 25.3%) for females.
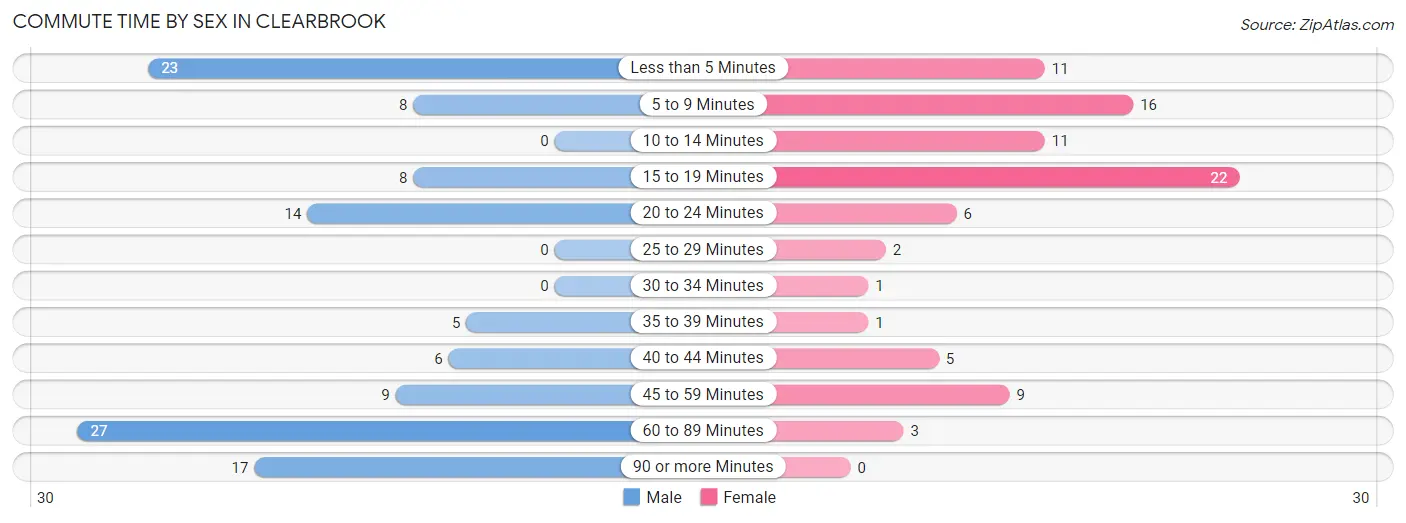
| Commute Time | Male | Female |
| Less than 5 Minutes | 23 (19.7%) | 11 (12.6%) |
| 5 to 9 Minutes | 8 (6.8%) | 16 (18.4%) |
| 10 to 14 Minutes | 0 (0.0%) | 11 (12.6%) |
| 15 to 19 Minutes | 8 (6.8%) | 22 (25.3%) |
| 20 to 24 Minutes | 14 (12.0%) | 6 (6.9%) |
| 25 to 29 Minutes | 0 (0.0%) | 2 (2.3%) |
| 30 to 34 Minutes | 0 (0.0%) | 1 (1.1%) |
| 35 to 39 Minutes | 5 (4.3%) | 1 (1.1%) |
| 40 to 44 Minutes | 6 (5.1%) | 5 (5.8%) |
| 45 to 59 Minutes | 9 (7.7%) | 9 (10.3%) |
| 60 to 89 Minutes | 27 (23.1%) | 3 (3.5%) |
| 90 or more Minutes | 17 (14.5%) | 0 (0.0%) |
Time of Departure to Work by Sex in Clearbrook
The most frequent times of departure to work in Clearbrook are 7:00 AM to 7:29 AM (33, 28.2%) for males and 7:30 AM to 7:59 AM (27, 31.0%) for females.
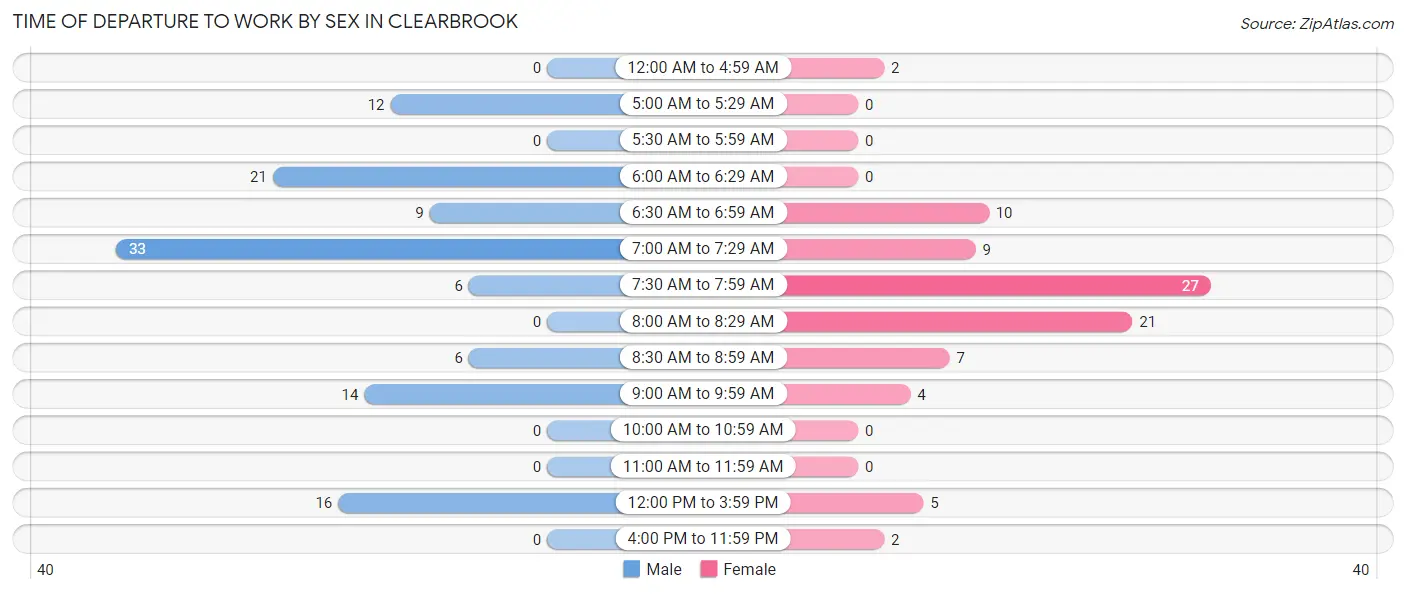
| Time of Departure | Male | Female |
| 12:00 AM to 4:59 AM | 0 (0.0%) | 2 (2.3%) |
| 5:00 AM to 5:29 AM | 12 (10.3%) | 0 (0.0%) |
| 5:30 AM to 5:59 AM | 0 (0.0%) | 0 (0.0%) |
| 6:00 AM to 6:29 AM | 21 (17.9%) | 0 (0.0%) |
| 6:30 AM to 6:59 AM | 9 (7.7%) | 10 (11.5%) |
| 7:00 AM to 7:29 AM | 33 (28.2%) | 9 (10.3%) |
| 7:30 AM to 7:59 AM | 6 (5.1%) | 27 (31.0%) |
| 8:00 AM to 8:29 AM | 0 (0.0%) | 21 (24.1%) |
| 8:30 AM to 8:59 AM | 6 (5.1%) | 7 (8.1%) |
| 9:00 AM to 9:59 AM | 14 (12.0%) | 4 (4.6%) |
| 10:00 AM to 10:59 AM | 0 (0.0%) | 0 (0.0%) |
| 11:00 AM to 11:59 AM | 0 (0.0%) | 0 (0.0%) |
| 12:00 PM to 3:59 PM | 16 (13.7%) | 5 (5.8%) |
| 4:00 PM to 11:59 PM | 0 (0.0%) | 2 (2.3%) |
| Total | 117 (100.0%) | 87 (100.0%) |
Housing Occupancy in Clearbrook
Occupancy by Ownership in Clearbrook
Of the total 232 dwellings in Clearbrook, owner-occupied units account for 129 (55.6%), while renter-occupied units make up 103 (44.4%).
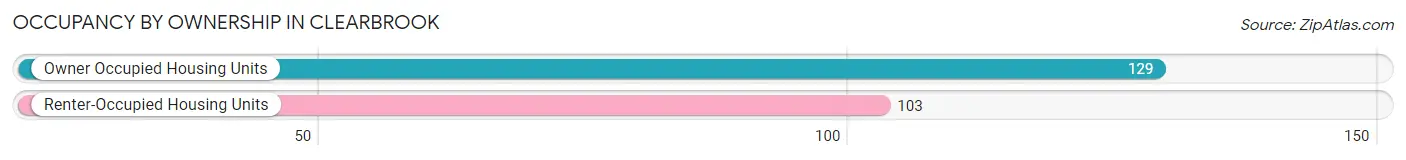
| Occupancy | # Housing Units | % Housing Units |
| Owner Occupied Housing Units | 129 | 55.6% |
| Renter-Occupied Housing Units | 103 | 44.4% |
| Total Occupied Housing Units | 232 | 100.0% |
Occupancy by Household Size in Clearbrook
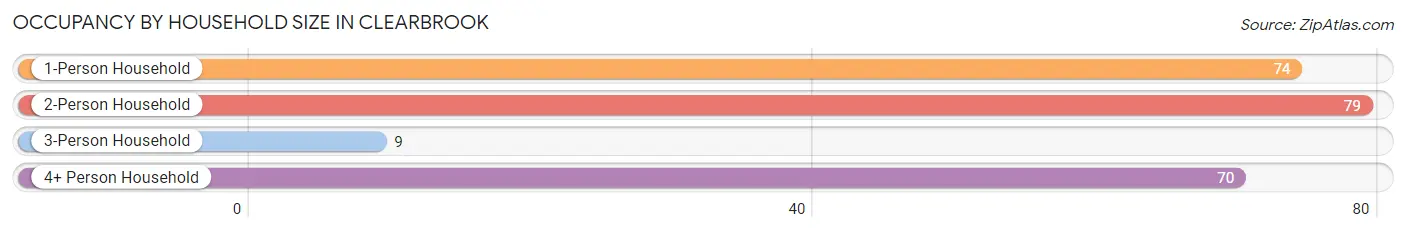
| Household Size | # Housing Units | % Housing Units |
| 1-Person Household | 74 | 31.9% |
| 2-Person Household | 79 | 34.1% |
| 3-Person Household | 9 | 3.9% |
| 4+ Person Household | 70 | 30.2% |
| Total Housing Units | 232 | 100.0% |
Occupancy by Ownership by Household Size in Clearbrook
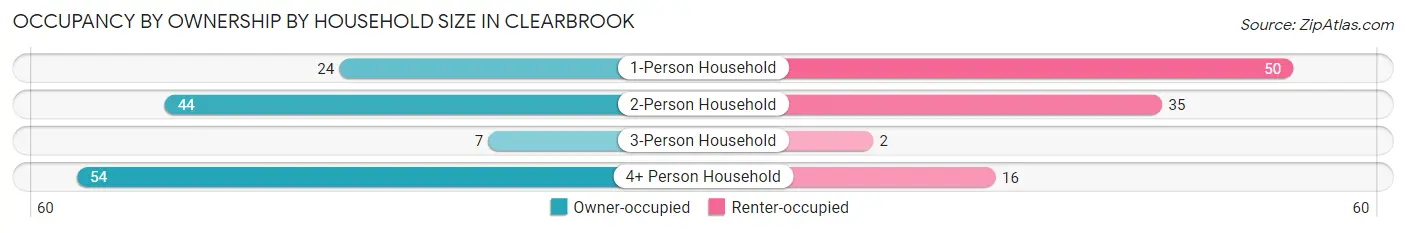
| Household Size | Owner-occupied | Renter-occupied |
| 1-Person Household | 24 (32.4%) | 50 (67.6%) |
| 2-Person Household | 44 (55.7%) | 35 (44.3%) |
| 3-Person Household | 7 (77.8%) | 2 (22.2%) |
| 4+ Person Household | 54 (77.1%) | 16 (22.9%) |
| Total Housing Units | 129 (55.6%) | 103 (44.4%) |
Occupancy by Educational Attainment in Clearbrook
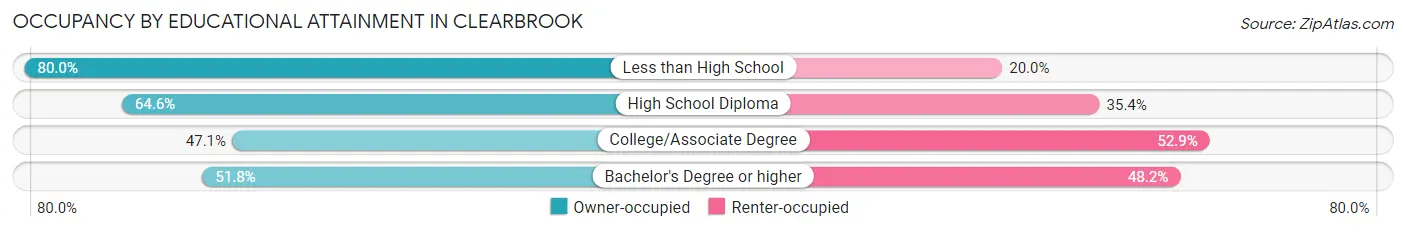
| Household Size | Owner-occupied | Renter-occupied |
| Less than High School | 8 (80.0%) | 2 (20.0%) |
| High School Diploma | 51 (64.6%) | 28 (35.4%) |
| College/Associate Degree | 41 (47.1%) | 46 (52.9%) |
| Bachelor's Degree or higher | 29 (51.8%) | 27 (48.2%) |
Occupancy by Age of Householder in Clearbrook
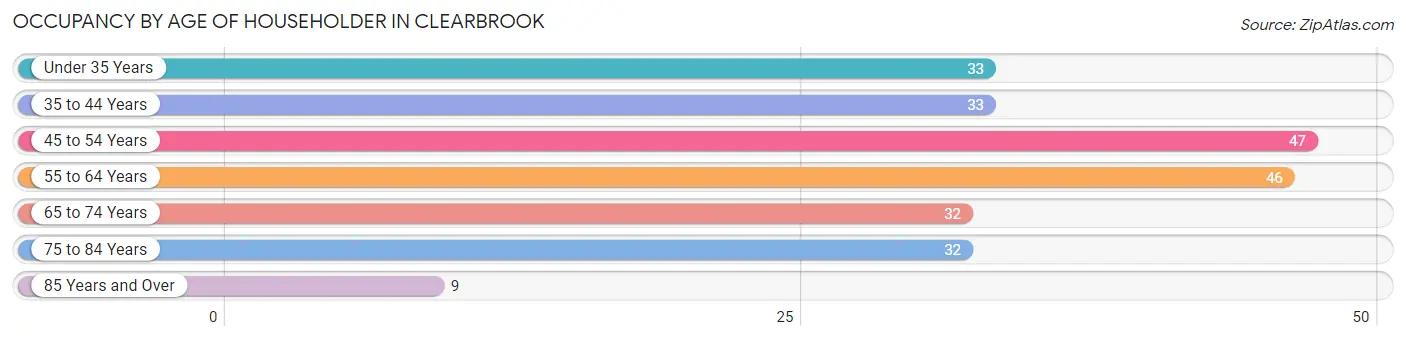
| Age Bracket | # Households | % Households |
| Under 35 Years | 33 | 14.2% |
| 35 to 44 Years | 33 | 14.2% |
| 45 to 54 Years | 47 | 20.3% |
| 55 to 64 Years | 46 | 19.8% |
| 65 to 74 Years | 32 | 13.8% |
| 75 to 84 Years | 32 | 13.8% |
| 85 Years and Over | 9 | 3.9% |
| Total | 232 | 100.0% |
Housing Finances in Clearbrook
Median Income by Occupancy in Clearbrook
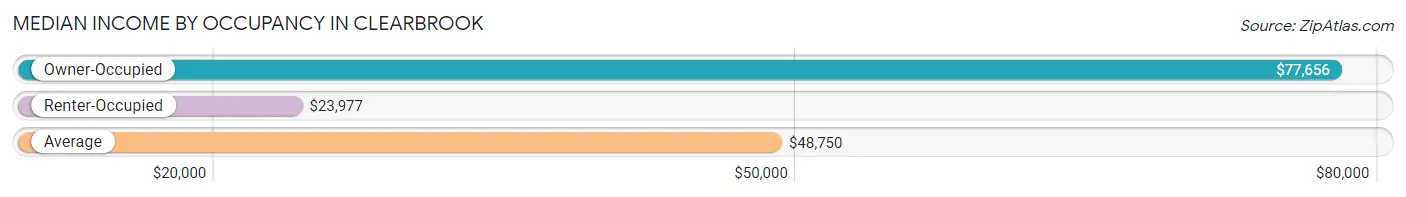
| Occupancy Type | # Households | Median Income |
| Owner-Occupied | 129 (55.6%) | $77,656 |
| Renter-Occupied | 103 (44.4%) | $23,977 |
| Average | 232 (100.0%) | $48,750 |
Occupancy by Householder Income Bracket in Clearbrook
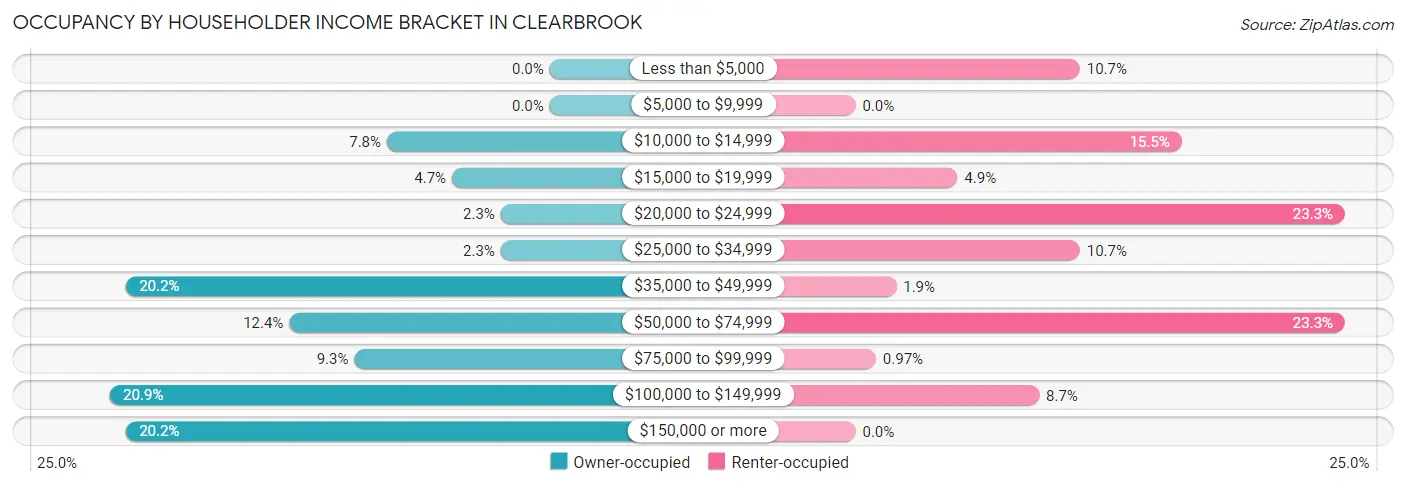
| Income Bracket | Owner-occupied | Renter-occupied |
| Less than $5,000 | 0 (0.0%) | 11 (10.7%) |
| $5,000 to $9,999 | 0 (0.0%) | 0 (0.0%) |
| $10,000 to $14,999 | 10 (7.7%) | 16 (15.5%) |
| $15,000 to $19,999 | 6 (4.6%) | 5 (4.9%) |
| $20,000 to $24,999 | 3 (2.3%) | 24 (23.3%) |
| $25,000 to $34,999 | 3 (2.3%) | 11 (10.7%) |
| $35,000 to $49,999 | 26 (20.2%) | 2 (1.9%) |
| $50,000 to $74,999 | 16 (12.4%) | 24 (23.3%) |
| $75,000 to $99,999 | 12 (9.3%) | 1 (1.0%) |
| $100,000 to $149,999 | 27 (20.9%) | 9 (8.7%) |
| $150,000 or more | 26 (20.2%) | 0 (0.0%) |
| Total | 129 (100.0%) | 103 (100.0%) |
Monthly Housing Cost Tiers in Clearbrook
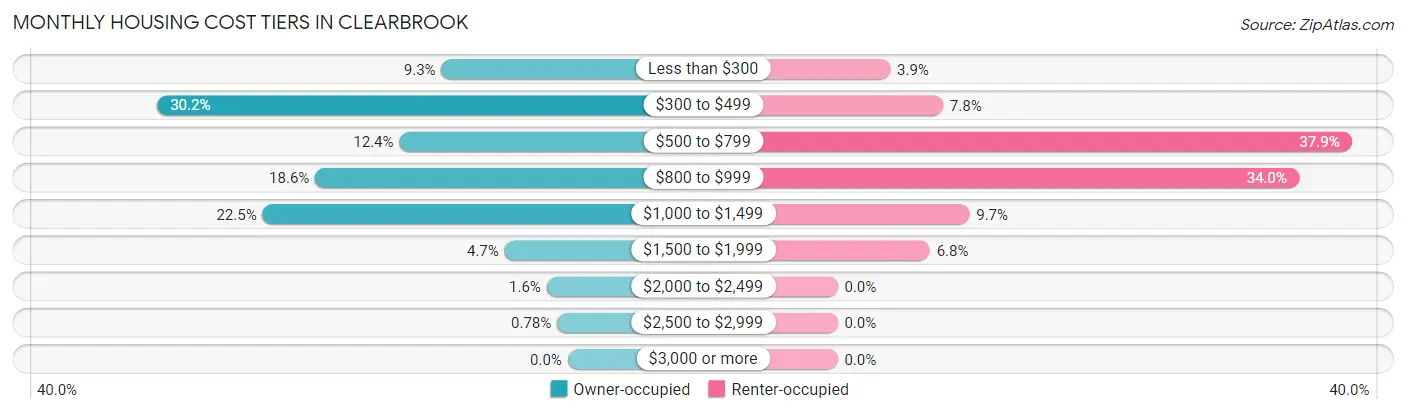
| Monthly Cost | Owner-occupied | Renter-occupied |
| Less than $300 | 12 (9.3%) | 4 (3.9%) |
| $300 to $499 | 39 (30.2%) | 8 (7.8%) |
| $500 to $799 | 16 (12.4%) | 39 (37.9%) |
| $800 to $999 | 24 (18.6%) | 35 (34.0%) |
| $1,000 to $1,499 | 29 (22.5%) | 10 (9.7%) |
| $1,500 to $1,999 | 6 (4.6%) | 7 (6.8%) |
| $2,000 to $2,499 | 2 (1.5%) | 0 (0.0%) |
| $2,500 to $2,999 | 1 (0.8%) | 0 (0.0%) |
| $3,000 or more | 0 (0.0%) | 0 (0.0%) |
| Total | 129 (100.0%) | 103 (100.0%) |
Physical Housing Characteristics in Clearbrook
Housing Structures in Clearbrook
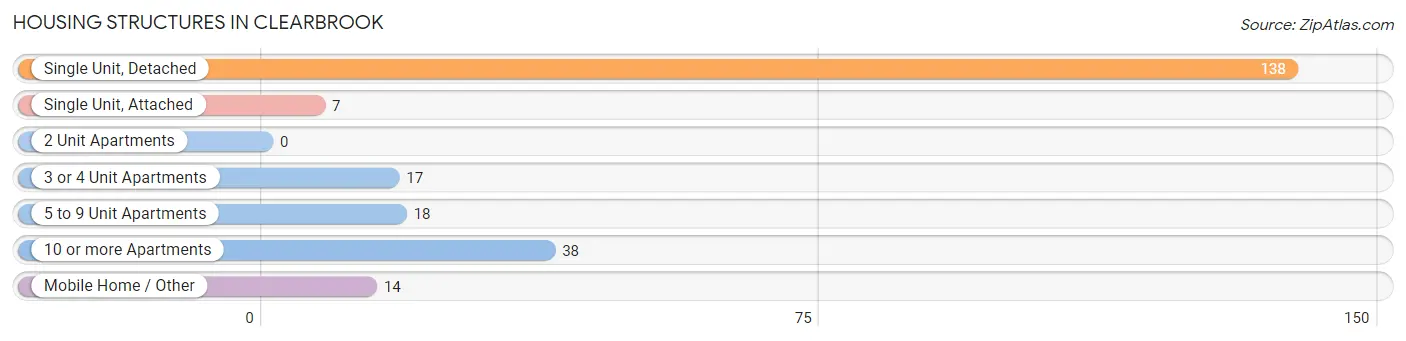
| Structure Type | # Housing Units | % Housing Units |
| Single Unit, Detached | 138 | 59.5% |
| Single Unit, Attached | 7 | 3.0% |
| 2 Unit Apartments | 0 | 0.0% |
| 3 or 4 Unit Apartments | 17 | 7.3% |
| 5 to 9 Unit Apartments | 18 | 7.8% |
| 10 or more Apartments | 38 | 16.4% |
| Mobile Home / Other | 14 | 6.0% |
| Total | 232 | 100.0% |
Housing Structures by Occupancy in Clearbrook
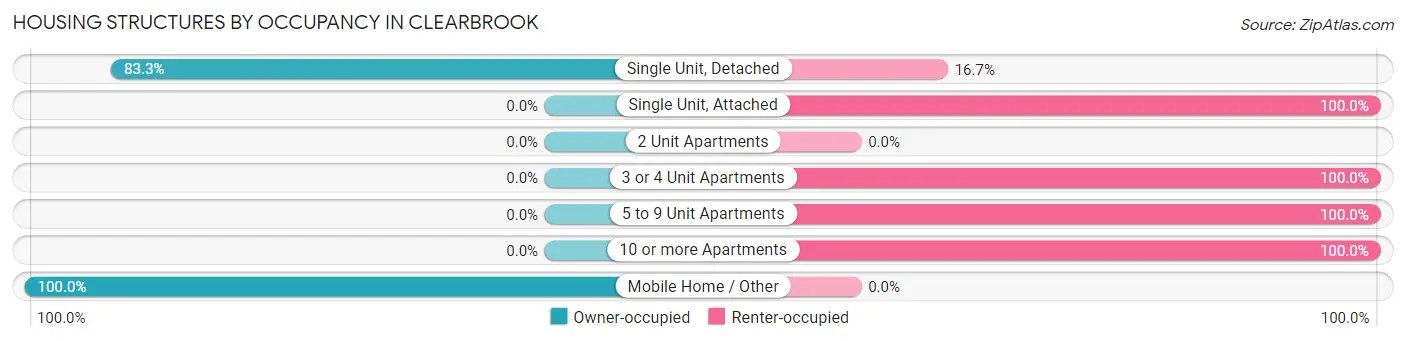
| Structure Type | Owner-occupied | Renter-occupied |
| Single Unit, Detached | 115 (83.3%) | 23 (16.7%) |
| Single Unit, Attached | 0 (0.0%) | 7 (100.0%) |
| 2 Unit Apartments | 0 (0.0%) | 0 (0.0%) |
| 3 or 4 Unit Apartments | 0 (0.0%) | 17 (100.0%) |
| 5 to 9 Unit Apartments | 0 (0.0%) | 18 (100.0%) |
| 10 or more Apartments | 0 (0.0%) | 38 (100.0%) |
| Mobile Home / Other | 14 (100.0%) | 0 (0.0%) |
| Total | 129 (55.6%) | 103 (44.4%) |
Housing Structures by Number of Rooms in Clearbrook
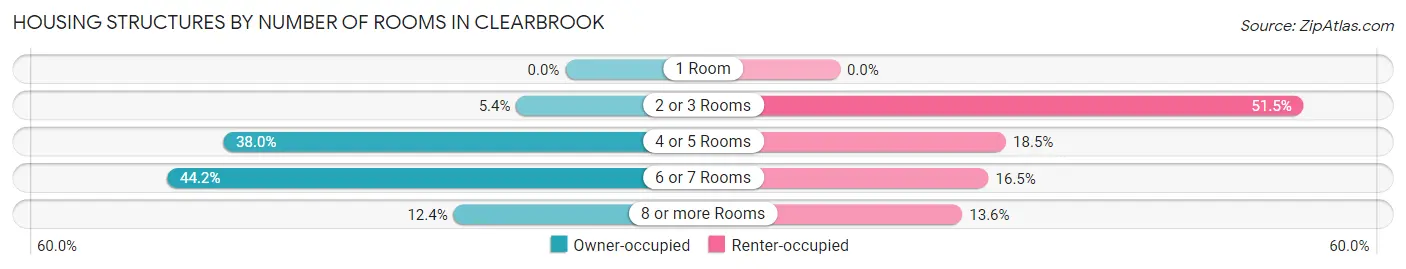
| Number of Rooms | Owner-occupied | Renter-occupied |
| 1 Room | 0 (0.0%) | 0 (0.0%) |
| 2 or 3 Rooms | 7 (5.4%) | 53 (51.5%) |
| 4 or 5 Rooms | 49 (38.0%) | 19 (18.4%) |
| 6 or 7 Rooms | 57 (44.2%) | 17 (16.5%) |
| 8 or more Rooms | 16 (12.4%) | 14 (13.6%) |
| Total | 129 (100.0%) | 103 (100.0%) |
Housing Structure by Heating Type in Clearbrook
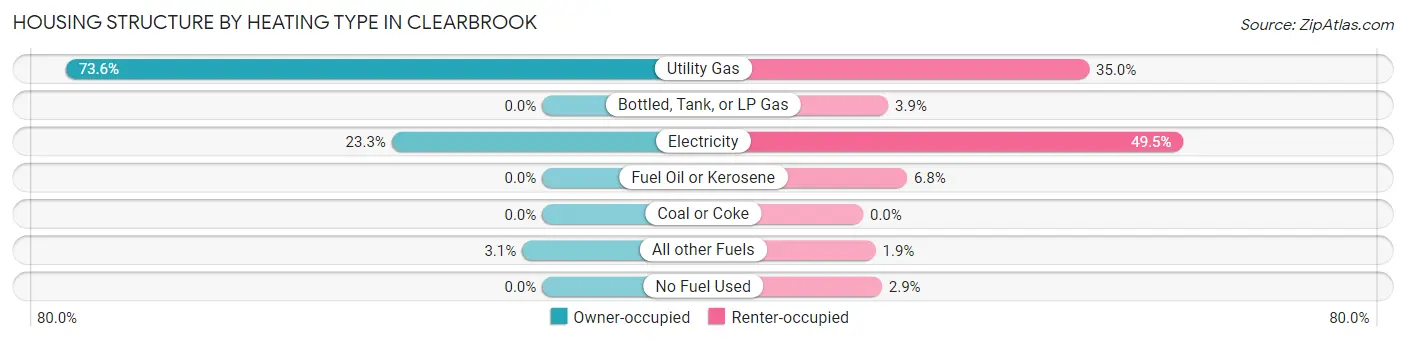
| Heating Type | Owner-occupied | Renter-occupied |
| Utility Gas | 95 (73.6%) | 36 (34.9%) |
| Bottled, Tank, or LP Gas | 0 (0.0%) | 4 (3.9%) |
| Electricity | 30 (23.3%) | 51 (49.5%) |
| Fuel Oil or Kerosene | 0 (0.0%) | 7 (6.8%) |
| Coal or Coke | 0 (0.0%) | 0 (0.0%) |
| All other Fuels | 4 (3.1%) | 2 (1.9%) |
| No Fuel Used | 0 (0.0%) | 3 (2.9%) |
| Total | 129 (100.0%) | 103 (100.0%) |
Household Vehicle Usage in Clearbrook
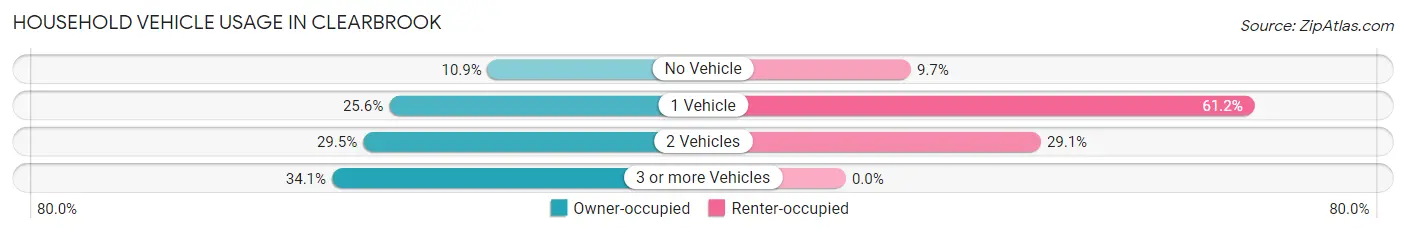
| Vehicles per Household | Owner-occupied | Renter-occupied |
| No Vehicle | 14 (10.8%) | 10 (9.7%) |
| 1 Vehicle | 33 (25.6%) | 63 (61.2%) |
| 2 Vehicles | 38 (29.5%) | 30 (29.1%) |
| 3 or more Vehicles | 44 (34.1%) | 0 (0.0%) |
| Total | 129 (100.0%) | 103 (100.0%) |
Real Estate & Mortgages in Clearbrook
Real Estate and Mortgage Overview in Clearbrook
| Characteristic | Without Mortgage | With Mortgage |
| Housing Units | 60 | 69 |
| Median Property Value | $85,000 | $114,700 |
| Median Household Income | $58,750 | $6 |
| Monthly Housing Costs | $429 | $0 |
| Real Estate Taxes | $1,118 | $0 |
Property Value by Mortgage Status in Clearbrook
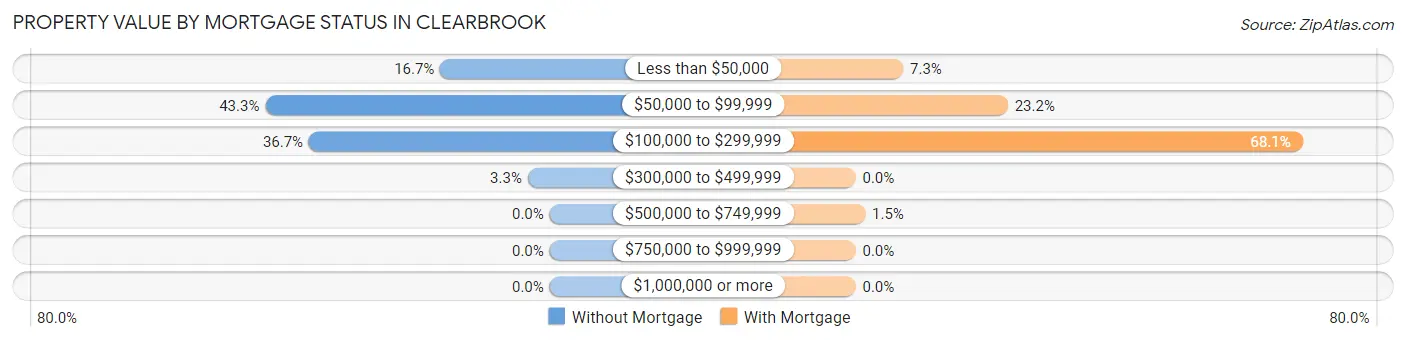
| Property Value | Without Mortgage | With Mortgage |
| Less than $50,000 | 10 (16.7%) | 5 (7.2%) |
| $50,000 to $99,999 | 26 (43.3%) | 16 (23.2%) |
| $100,000 to $299,999 | 22 (36.7%) | 47 (68.1%) |
| $300,000 to $499,999 | 2 (3.3%) | 0 (0.0%) |
| $500,000 to $749,999 | 0 (0.0%) | 1 (1.5%) |
| $750,000 to $999,999 | 0 (0.0%) | 0 (0.0%) |
| $1,000,000 or more | 0 (0.0%) | 0 (0.0%) |
| Total | 60 (100.0%) | 69 (100.0%) |
Household Income by Mortgage Status in Clearbrook
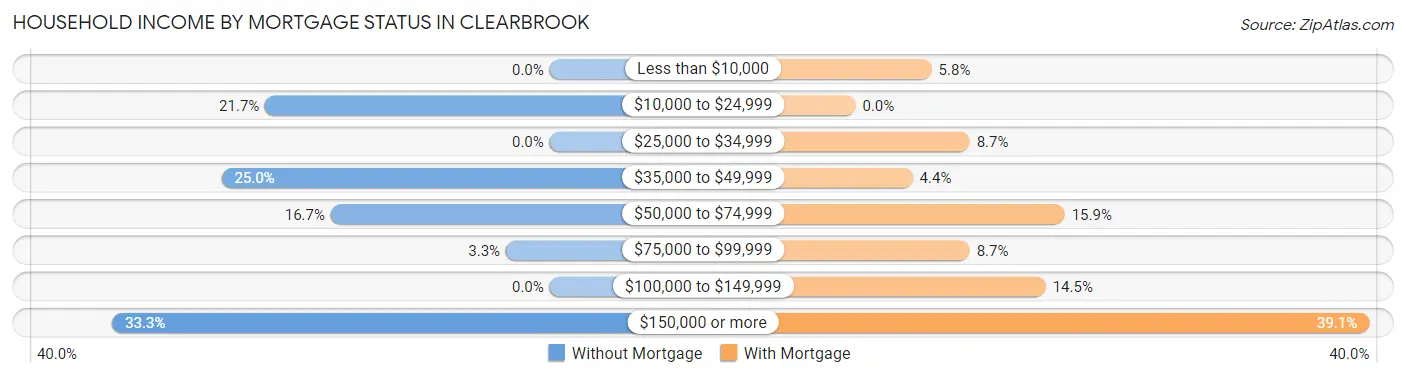
| Household Income | Without Mortgage | With Mortgage |
| Less than $10,000 | 0 (0.0%) | 4 (5.8%) |
| $10,000 to $24,999 | 13 (21.7%) | 0 (0.0%) |
| $25,000 to $34,999 | 0 (0.0%) | 6 (8.7%) |
| $35,000 to $49,999 | 15 (25.0%) | 3 (4.3%) |
| $50,000 to $74,999 | 10 (16.7%) | 11 (15.9%) |
| $75,000 to $99,999 | 2 (3.3%) | 6 (8.7%) |
| $100,000 to $149,999 | 0 (0.0%) | 10 (14.5%) |
| $150,000 or more | 20 (33.3%) | 27 (39.1%) |
| Total | 60 (100.0%) | 69 (100.0%) |
Property Value to Household Income Ratio in Clearbrook
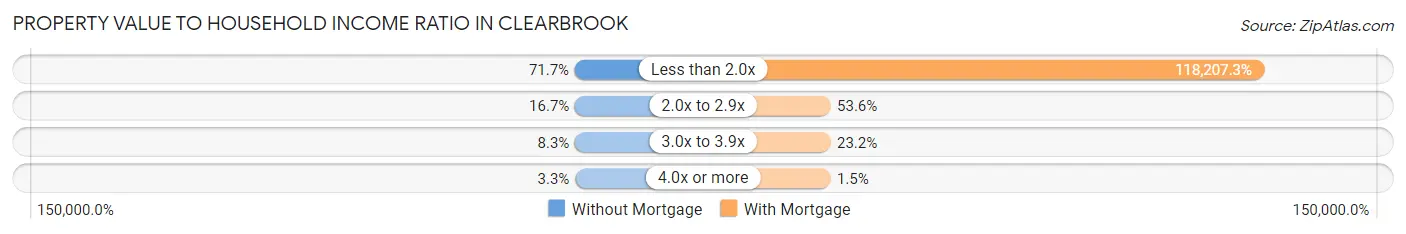
| Value-to-Income Ratio | Without Mortgage | With Mortgage |
| Less than 2.0x | 43 (71.7%) | 81,563 (118,207.2%) |
| 2.0x to 2.9x | 10 (16.7%) | 37 (53.6%) |
| 3.0x to 3.9x | 5 (8.3%) | 16 (23.2%) |
| 4.0x or more | 2 (3.3%) | 1 (1.5%) |
| Total | 60 (100.0%) | 69 (100.0%) |
Real Estate Taxes by Mortgage Status in Clearbrook
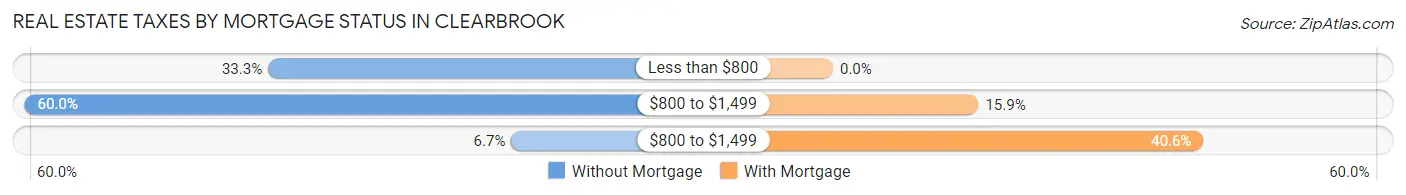
| Property Taxes | Without Mortgage | With Mortgage |
| Less than $800 | 20 (33.3%) | 0 (0.0%) |
| $800 to $1,499 | 36 (60.0%) | 11 (15.9%) |
| $800 to $1,499 | 4 (6.7%) | 28 (40.6%) |
| Total | 60 (100.0%) | 69 (100.0%) |
Health & Disability in Clearbrook
Health Insurance Coverage by Age in Clearbrook
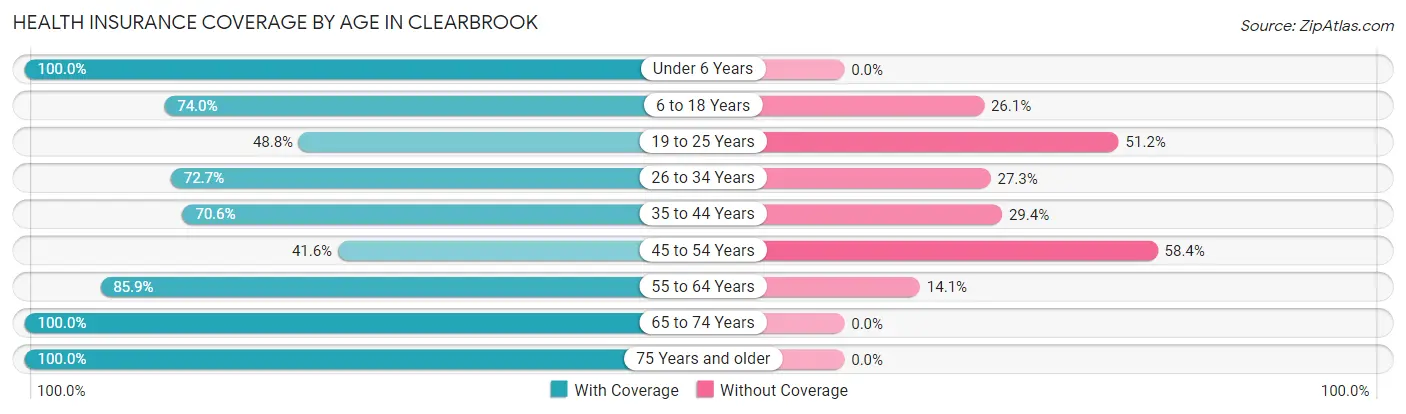
| Age Bracket | With Coverage | Without Coverage |
| Under 6 Years | 93 (100.0%) | 0 (0.0%) |
| 6 to 18 Years | 88 (74.0%) | 31 (26.1%) |
| 19 to 25 Years | 42 (48.8%) | 44 (51.2%) |
| 26 to 34 Years | 32 (72.7%) | 12 (27.3%) |
| 35 to 44 Years | 36 (70.6%) | 15 (29.4%) |
| 45 to 54 Years | 37 (41.6%) | 52 (58.4%) |
| 55 to 64 Years | 67 (85.9%) | 11 (14.1%) |
| 65 to 74 Years | 38 (100.0%) | 0 (0.0%) |
| 75 Years and older | 64 (100.0%) | 0 (0.0%) |
| Total | 497 (75.1%) | 165 (24.9%) |
Health Insurance Coverage by Citizenship Status in Clearbrook
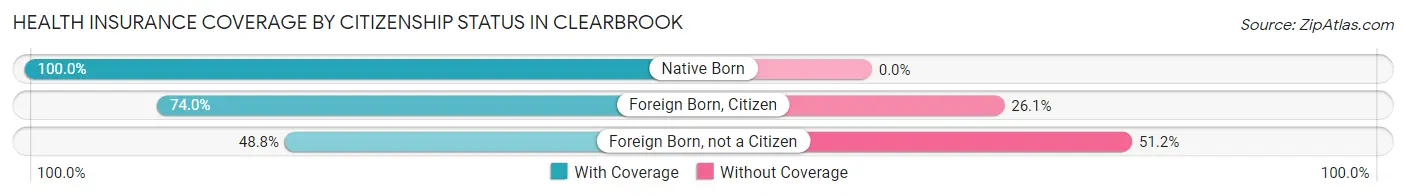
| Citizenship Status | With Coverage | Without Coverage |
| Native Born | 93 (100.0%) | 0 (0.0%) |
| Foreign Born, Citizen | 88 (74.0%) | 31 (26.1%) |
| Foreign Born, not a Citizen | 42 (48.8%) | 44 (51.2%) |
Health Insurance Coverage by Household Income in Clearbrook
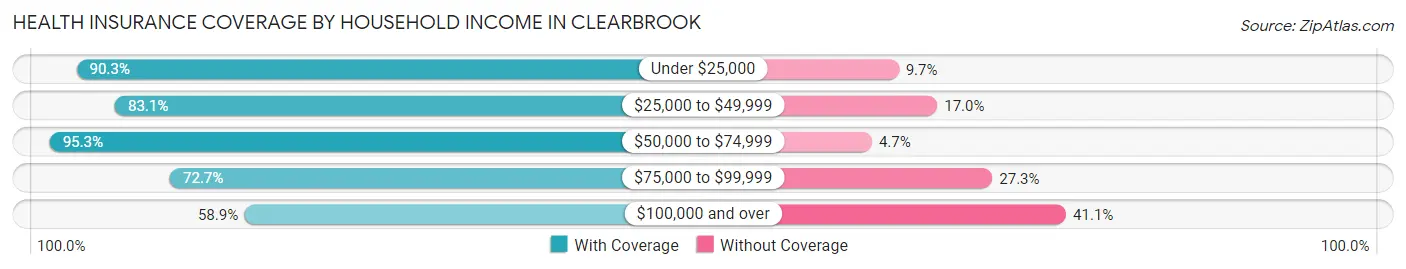
| Household Income | With Coverage | Without Coverage |
| Under $25,000 | 102 (90.3%) | 11 (9.7%) |
| $25,000 to $49,999 | 98 (83.1%) | 20 (17.0%) |
| $50,000 to $74,999 | 101 (95.3%) | 5 (4.7%) |
| $75,000 to $99,999 | 24 (72.7%) | 9 (27.3%) |
| $100,000 and over | 172 (58.9%) | 120 (41.1%) |
Public vs Private Health Insurance Coverage by Age in Clearbrook
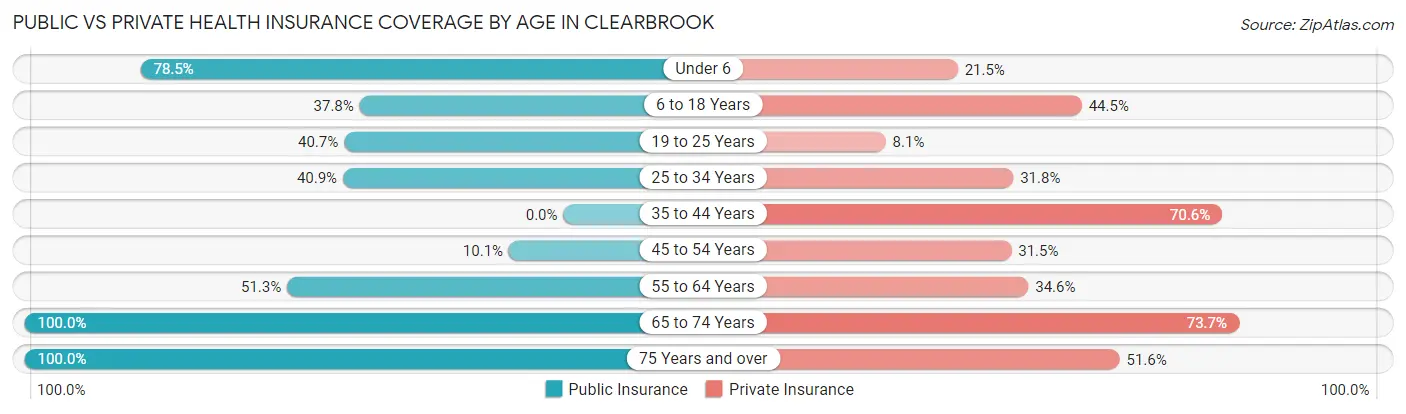
| Age Bracket | Public Insurance | Private Insurance |
| Under 6 | 73 (78.5%) | 20 (21.5%) |
| 6 to 18 Years | 45 (37.8%) | 53 (44.5%) |
| 19 to 25 Years | 35 (40.7%) | 7 (8.1%) |
| 25 to 34 Years | 18 (40.9%) | 14 (31.8%) |
| 35 to 44 Years | 0 (0.0%) | 36 (70.6%) |
| 45 to 54 Years | 9 (10.1%) | 28 (31.5%) |
| 55 to 64 Years | 40 (51.3%) | 27 (34.6%) |
| 65 to 74 Years | 38 (100.0%) | 28 (73.7%) |
| 75 Years and over | 64 (100.0%) | 33 (51.6%) |
| Total | 322 (48.6%) | 246 (37.2%) |
Disability Status by Sex by Age in Clearbrook
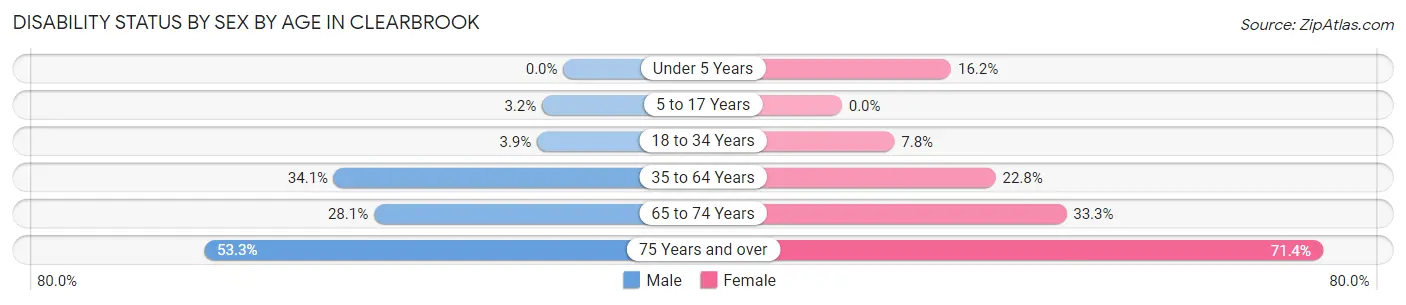
| Age Bracket | Male | Female |
| Under 5 Years | 0 (0.0%) | 6 (16.2%) |
| 5 to 17 Years | 3 (3.2%) | 0 (0.0%) |
| 18 to 34 Years | 3 (3.9%) | 5 (7.8%) |
| 35 to 64 Years | 31 (34.1%) | 29 (22.8%) |
| 65 to 74 Years | 9 (28.1%) | 2 (33.3%) |
| 75 Years and over | 8 (53.3%) | 35 (71.4%) |
Disability Class by Sex by Age in Clearbrook
Disability Class: Hearing Difficulty
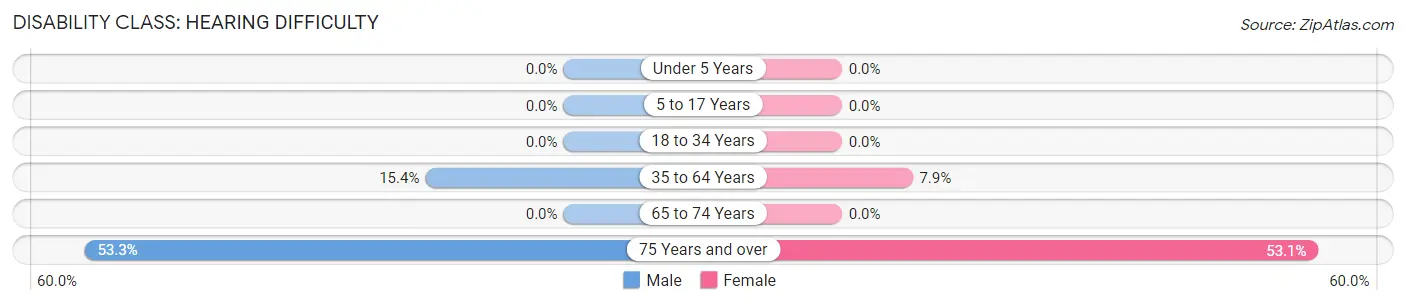
| Age Bracket | Male | Female |
| Under 5 Years | 0 (0.0%) | 0 (0.0%) |
| 5 to 17 Years | 0 (0.0%) | 0 (0.0%) |
| 18 to 34 Years | 0 (0.0%) | 0 (0.0%) |
| 35 to 64 Years | 14 (15.4%) | 10 (7.9%) |
| 65 to 74 Years | 0 (0.0%) | 0 (0.0%) |
| 75 Years and over | 8 (53.3%) | 26 (53.1%) |
Disability Class: Vision Difficulty
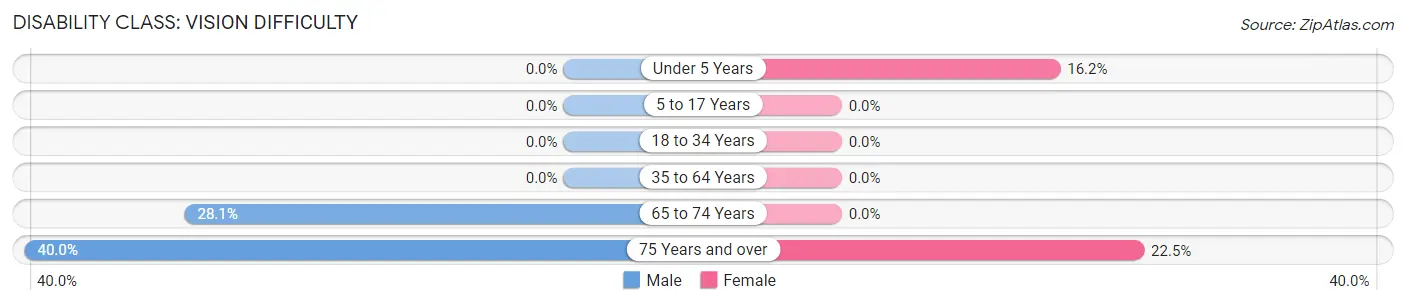
| Age Bracket | Male | Female |
| Under 5 Years | 0 (0.0%) | 6 (16.2%) |
| 5 to 17 Years | 0 (0.0%) | 0 (0.0%) |
| 18 to 34 Years | 0 (0.0%) | 0 (0.0%) |
| 35 to 64 Years | 0 (0.0%) | 0 (0.0%) |
| 65 to 74 Years | 9 (28.1%) | 0 (0.0%) |
| 75 Years and over | 6 (40.0%) | 11 (22.5%) |
Disability Class: Cognitive Difficulty
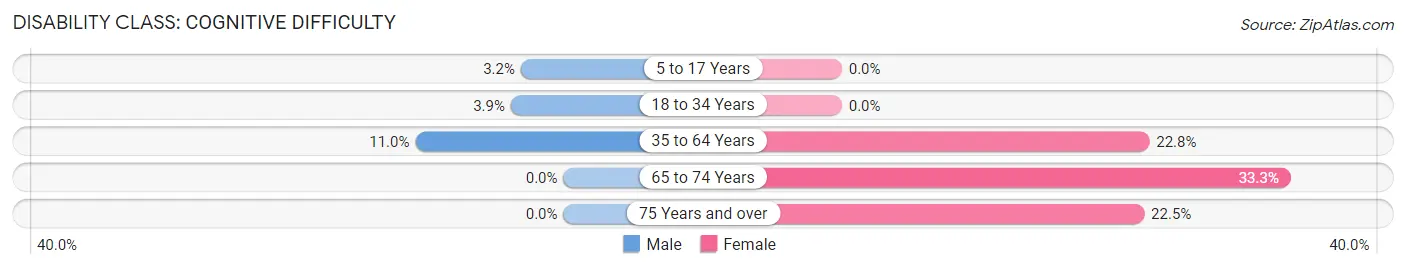
| Age Bracket | Male | Female |
| 5 to 17 Years | 3 (3.2%) | 0 (0.0%) |
| 18 to 34 Years | 3 (3.9%) | 0 (0.0%) |
| 35 to 64 Years | 10 (11.0%) | 29 (22.8%) |
| 65 to 74 Years | 0 (0.0%) | 2 (33.3%) |
| 75 Years and over | 0 (0.0%) | 11 (22.5%) |
Disability Class: Ambulatory Difficulty
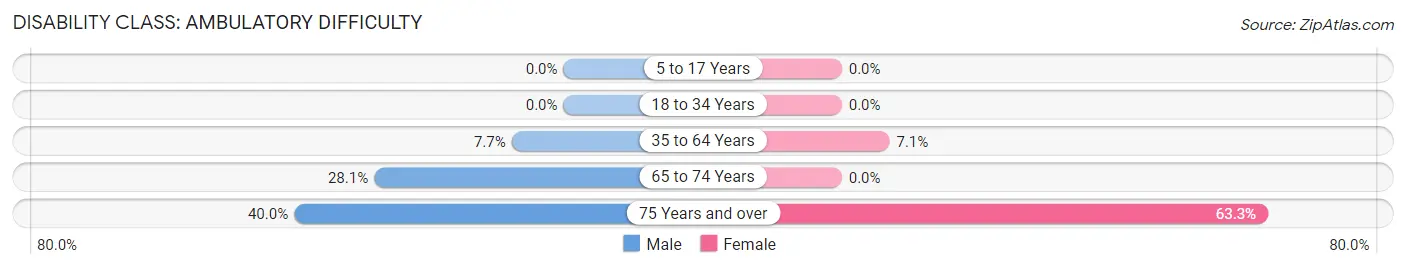
| Age Bracket | Male | Female |
| 5 to 17 Years | 0 (0.0%) | 0 (0.0%) |
| 18 to 34 Years | 0 (0.0%) | 0 (0.0%) |
| 35 to 64 Years | 7 (7.7%) | 9 (7.1%) |
| 65 to 74 Years | 9 (28.1%) | 0 (0.0%) |
| 75 Years and over | 6 (40.0%) | 31 (63.3%) |
Disability Class: Self-Care Difficulty
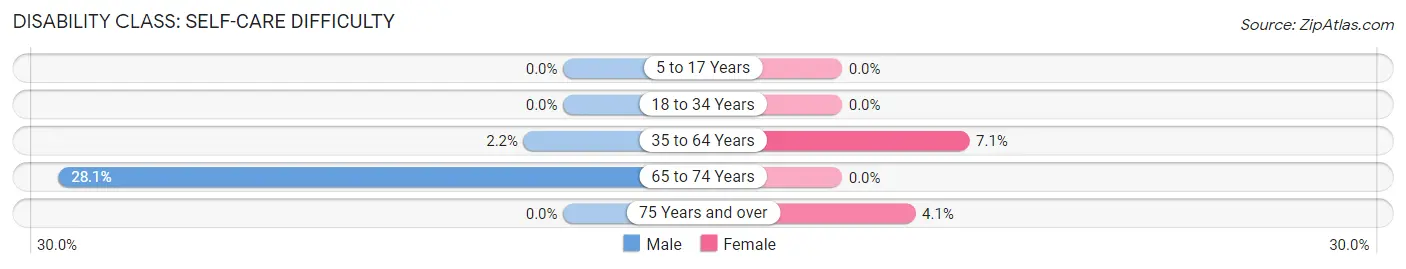
| Age Bracket | Male | Female |
| 5 to 17 Years | 0 (0.0%) | 0 (0.0%) |
| 18 to 34 Years | 0 (0.0%) | 0 (0.0%) |
| 35 to 64 Years | 2 (2.2%) | 9 (7.1%) |
| 65 to 74 Years | 9 (28.1%) | 0 (0.0%) |
| 75 Years and over | 0 (0.0%) | 2 (4.1%) |
Technology Access in Clearbrook
Computing Device Access in Clearbrook
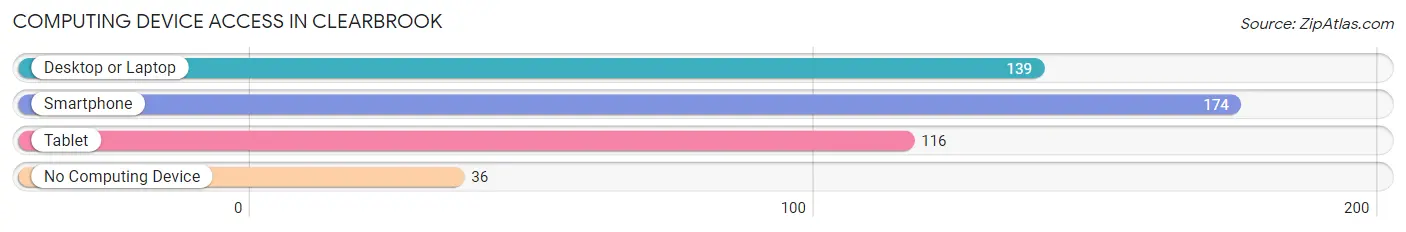
| Device Type | # Households | % Households |
| Desktop or Laptop | 139 | 59.9% |
| Smartphone | 174 | 75.0% |
| Tablet | 116 | 50.0% |
| No Computing Device | 36 | 15.5% |
| Total | 232 | 100.0% |
Internet Access in Clearbrook
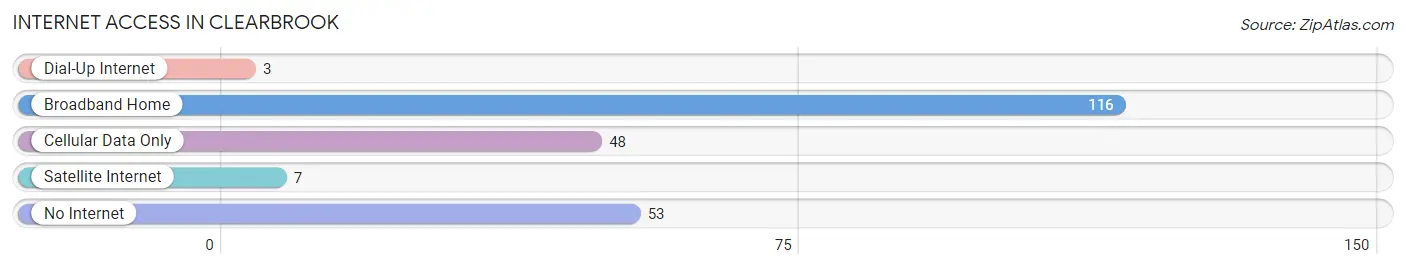
| Internet Type | # Households | % Households |
| Dial-Up Internet | 3 | 1.3% |
| Broadband Home | 116 | 50.0% |
| Cellular Data Only | 48 | 20.7% |
| Satellite Internet | 7 | 3.0% |
| No Internet | 53 | 22.8% |
| Total | 232 | 100.0% |
Clearbrook Summary
Introduction
Clearbrook is a small city located in Clearwater County, Minnesota. It is situated on the banks of the Clearwater River, and is part of the larger Grand Rapids-Bemidji metropolitan area. The city has a population of just over 500 people, and is known for its rural charm and natural beauty. Clearbrook is a popular destination for outdoor recreation, and is home to a variety of businesses and services.
History
Clearbrook was first settled in the late 1800s by a group of Scandinavian immigrants. The town was originally known as Clearwater, but was later changed to Clearbrook in honor of the nearby river. The town was incorporated in 1902, and the first post office was established in 1903.
The early years of Clearbrook were marked by a booming lumber industry, as the area was home to several sawmills. The town also had a thriving agricultural sector, and was home to several dairy farms. In the early 1900s, the town was home to a variety of businesses, including a hotel, a bank, a general store, and a blacksmith shop.
Geography
Clearbrook is located in Clearwater County, Minnesota, and is situated on the banks of the Clearwater River. The city is located in the northern part of the state, and is part of the larger Grand Rapids-Bemidji metropolitan area. The city is surrounded by forests and lakes, and is home to a variety of wildlife.
The city has a total area of 1.2 square miles, and has an elevation of 1,072 feet. The climate in Clearbrook is classified as humid continental, and the average temperature in the summer is around 70 degrees Fahrenheit.
Economy
Clearbrook’s economy is largely based on tourism and outdoor recreation. The city is home to several businesses, including restaurants, hotels, and retail stores. The city is also home to a variety of outdoor recreation activities, including fishing, hunting, and camping.
The city is also home to a variety of manufacturing and industrial businesses. The city is home to several sawmills, and is also home to a variety of agricultural businesses, including dairy farms and crop farms.
Demographics
As of the 2010 census, the population of Clearbrook was 514 people. The racial makeup of the city was 97.3% White, 0.6% African American, 0.2% Native American, 0.2% Asian, 0.4% from other races, and 1.3% from two or more races. The median household income in Clearbrook was $37,500, and the median age was 44.
Conclusion
Clearbrook is a small city located in Clearwater County, Minnesota. The city has a population of just over 500 people, and is known for its rural charm and natural beauty. The city is home to a variety of businesses and services, and is a popular destination for outdoor recreation. The city’s economy is largely based on tourism and outdoor recreation, and the city is home to a variety of manufacturing and industrial businesses. The population of Clearbrook is predominantly White, and the median household income is $37,500.
Common Questions
What is the Total Population of Clearbrook?
Total Population of Clearbrook is 689.
What is the Total Male Population of Clearbrook?
Total Male Population of Clearbrook is 340.
What is the Total Female Population of Clearbrook?
Total Female Population of Clearbrook is 349.
What is the Ratio of Males per 100 Females in Clearbrook?
There are 97.42 Males per 100 Females in Clearbrook.
What is the Ratio of Females per 100 Males in Clearbrook?
There are 102.65 Females per 100 Males in Clearbrook.
What is the Median Population Age in Clearbrook?
Median Population Age in Clearbrook is 36.2 Years.
What is the Average Family Size in Clearbrook
Average Family Size in Clearbrook is 3.7 People.
What is the Average Household Size in Clearbrook
Average Household Size in Clearbrook is 2.9 People.
What is Per Capita Income in Clearbrook?
Per Capita income in Clearbrook is $27,641.
What is the Median Family Income in Clearbrook?
Median Family Income in Clearbrook is $65,000.
What is the Median Household income in Clearbrook?
Median Household Income in Clearbrook is $48,750.
What is Income or Wage Gap in Clearbrook?
Income or Wage Gap in Clearbrook is 61.5%.
Women in Clearbrook earn 38.5 cents for every dollar earned by a man.
What is Inequality or Gini Index in Clearbrook?
Inequality or Gini Index in Clearbrook is 0.53.
How Large is the Labor Force in Clearbrook?
There are 264 People in the Labor Forcein in Clearbrook.
What is the Percentage of People in the Labor Force in Clearbrook?
53.9% of People are in the Labor Force in Clearbrook.
What is the Unemployment Rate in Clearbrook?
Unemployment Rate in Clearbrook is 4.5%.