Wright County, MN
Wright County Map
Wright County Overview
142,543
TOTAL POPULATION
72,791
MALE POPULATION
69,752
FEMALE POPULATION
104.36
MALES / 100 FEMALES
95.83
FEMALES / 100 MALES
37.4
MEDIAN AGE
3.2
AVG FAMILY SIZE
2.7
AVG HOUSEHOLD SIZE
$43,067
PER CAPITA INCOME
$118,209
AVG FAMILY INCOME
$102,980
AVG HOUSEHOLD INCOME
31.3%
WAGE / INCOME GAP [ % ]
68.7¢/ $1
WAGE / INCOME GAP [ $ ]
$11,075
FAMILY INCOME DEFICIT
0.38
INEQUALITY / GINI INDEX
78,784
LABOR FORCE [ PEOPLE ]
72.7%
PERCENT IN LABOR FORCE
2.2%
UNEMPLOYMENT RATE
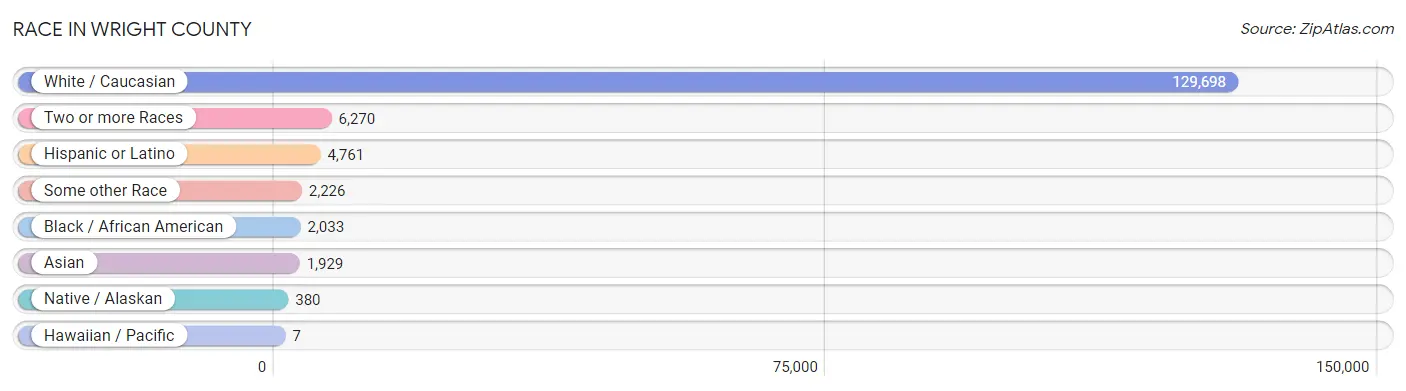
Race in Wright County
The most populous races in Wright County are White / Caucasian (129,698 | 91.0%), Two or more Races (6,270 | 4.4%), and Hispanic or Latino (4,761 | 3.3%).
| Race | # Population | % Population |
| Asian | 1,929 | 1.3% |
| Black / African American | 2,033 | 1.4% |
| Hawaiian / Pacific | 7 | 0.0% |
| Hispanic or Latino | 4,761 | 3.3% |
| Native / Alaskan | 380 | 0.3% |
| White / Caucasian | 129,698 | 91.0% |
| Two or more Races | 6,270 | 4.4% |
| Some other Race | 2,226 | 1.6% |
| Total | 142,543 | 100.0% |
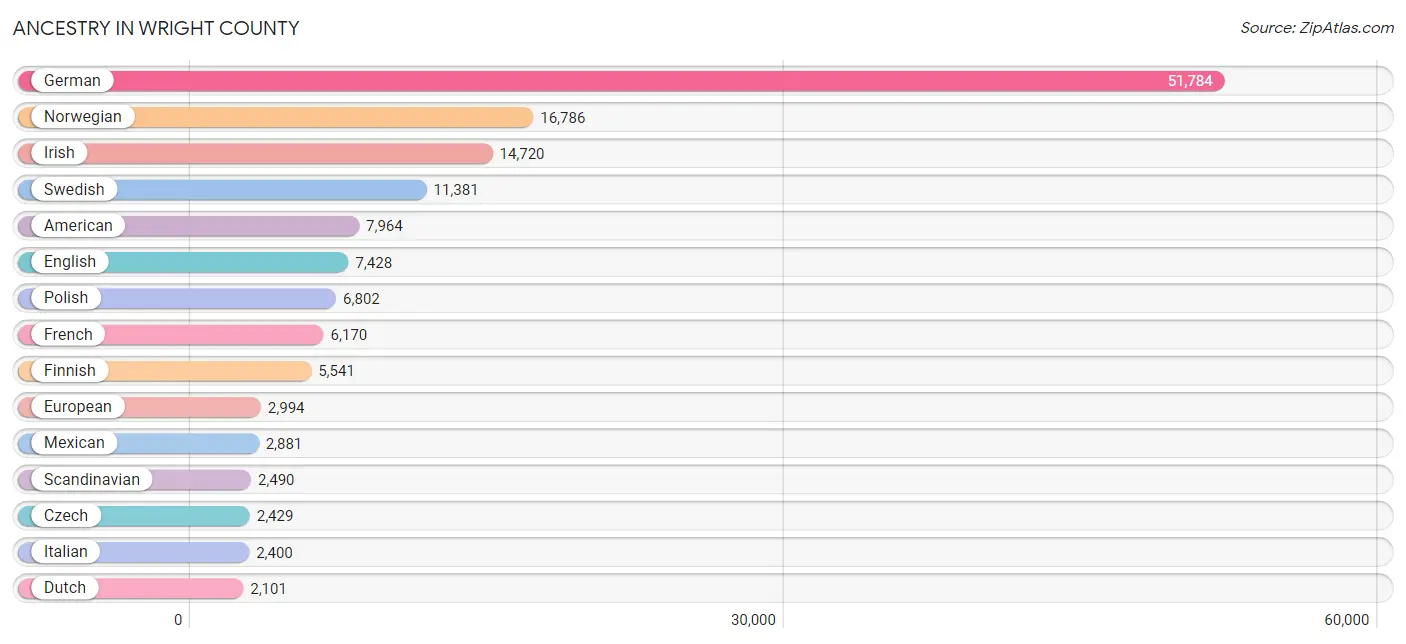
Ancestry in Wright County
The most populous ancestries reported in Wright County are German (51,784 | 36.3%), Norwegian (16,786 | 11.8%), Irish (14,720 | 10.3%), Swedish (11,381 | 8.0%), and American (7,964 | 5.6%), together accounting for 72.0% of all Wright County residents.
| Ancestry | # Population | % Population |
| African | 378 | 0.3% |
| Albanian | 12 | 0.0% |
| Aleut | 1 | 0.0% |
| American | 7,964 | 5.6% |
| Arab | 535 | 0.4% |
| Austrian | 277 | 0.2% |
| Bahamian | 3 | 0.0% |
| Bangladeshi | 473 | 0.3% |
| Belgian | 645 | 0.4% |
| Bhutanese | 89 | 0.1% |
| Blackfeet | 15 | 0.0% |
| Brazilian | 34 | 0.0% |
| British | 404 | 0.3% |
| Bulgarian | 31 | 0.0% |
| Burmese | 498 | 0.4% |
| Canadian | 103 | 0.1% |
| Central American | 526 | 0.4% |
| Central American Indian | 8 | 0.0% |
| Cherokee | 129 | 0.1% |
| Cheyenne | 73 | 0.1% |
| Chippewa | 325 | 0.2% |
| Colombian | 107 | 0.1% |
| Creek | 1 | 0.0% |
| Croatian | 75 | 0.1% |
| Crow | 2 | 0.0% |
| Cuban | 63 | 0.0% |
| Czech | 2,429 | 1.7% |
| Czechoslovakian | 293 | 0.2% |
| Danish | 1,181 | 0.8% |
| Dutch | 2,101 | 1.5% |
| Eastern European | 173 | 0.1% |
| Ecuadorian | 117 | 0.1% |
| Egyptian | 316 | 0.2% |
| English | 7,428 | 5.2% |
| Estonian | 4 | 0.0% |
| European | 2,994 | 2.1% |
| Fijian | 7 | 0.0% |
| Finnish | 5,541 | 3.9% |
| French | 6,170 | 4.3% |
| French Canadian | 1,705 | 1.2% |
| German | 51,784 | 36.3% |
| Ghanaian | 5 | 0.0% |
| Greek | 216 | 0.2% |
| Guatemalan | 468 | 0.3% |
| Guyanese | 32 | 0.0% |
| Honduran | 1 | 0.0% |
| Hungarian | 307 | 0.2% |
| Icelander | 130 | 0.1% |
| Indian (Asian) | 688 | 0.5% |
| Indonesian | 60 | 0.0% |
| Iranian | 18 | 0.0% |
| Irish | 14,720 | 10.3% |
| Italian | 2,400 | 1.7% |
| Japanese | 15 | 0.0% |
| Kenyan | 386 | 0.3% |
| Korean | 533 | 0.4% |
| Laotian | 30 | 0.0% |
| Latvian | 30 | 0.0% |
| Lebanese | 82 | 0.1% |
| Liberian | 109 | 0.1% |
| Lithuanian | 24 | 0.0% |
| Luxembourger | 60 | 0.0% |
| Malaysian | 150 | 0.1% |
| Mexican | 2,881 | 2.0% |
| Moroccan | 9 | 0.0% |
| Native Hawaiian | 31 | 0.0% |
| Nigerian | 53 | 0.0% |
| Northern European | 232 | 0.2% |
| Norwegian | 16,786 | 11.8% |
| Pakistani | 2 | 0.0% |
| Palestinian | 3 | 0.0% |
| Pennsylvania German | 6 | 0.0% |
| Peruvian | 194 | 0.1% |
| Polish | 6,802 | 4.8% |
| Portuguese | 6 | 0.0% |
| Pueblo | 9 | 0.0% |
| Puerto Rican | 384 | 0.3% |
| Romanian | 44 | 0.0% |
| Russian | 699 | 0.5% |
| Salvadoran | 57 | 0.0% |
| Samoan | 6 | 0.0% |
| Scandinavian | 2,490 | 1.8% |
| Scotch-Irish | 399 | 0.3% |
| Scottish | 1,334 | 0.9% |
| Serbian | 2 | 0.0% |
| Sioux | 86 | 0.1% |
| Slavic | 74 | 0.1% |
| Slovak | 143 | 0.1% |
| Slovene | 94 | 0.1% |
| South American | 418 | 0.3% |
| South American Indian | 10 | 0.0% |
| Spaniard | 97 | 0.1% |
| Spanish | 309 | 0.2% |
| Sri Lankan | 352 | 0.3% |
| Subsaharan African | 934 | 0.7% |
| Sudanese | 3 | 0.0% |
| Swedish | 11,381 | 8.0% |
| Swiss | 479 | 0.3% |
| Syrian | 55 | 0.0% |
| Thai | 252 | 0.2% |
| Ukrainian | 463 | 0.3% |
| Welsh | 253 | 0.2% |
| Yugoslavian | 60 | 0.0% |
| Yup'ik | 26 | 0.0% | View All 104 Rows |
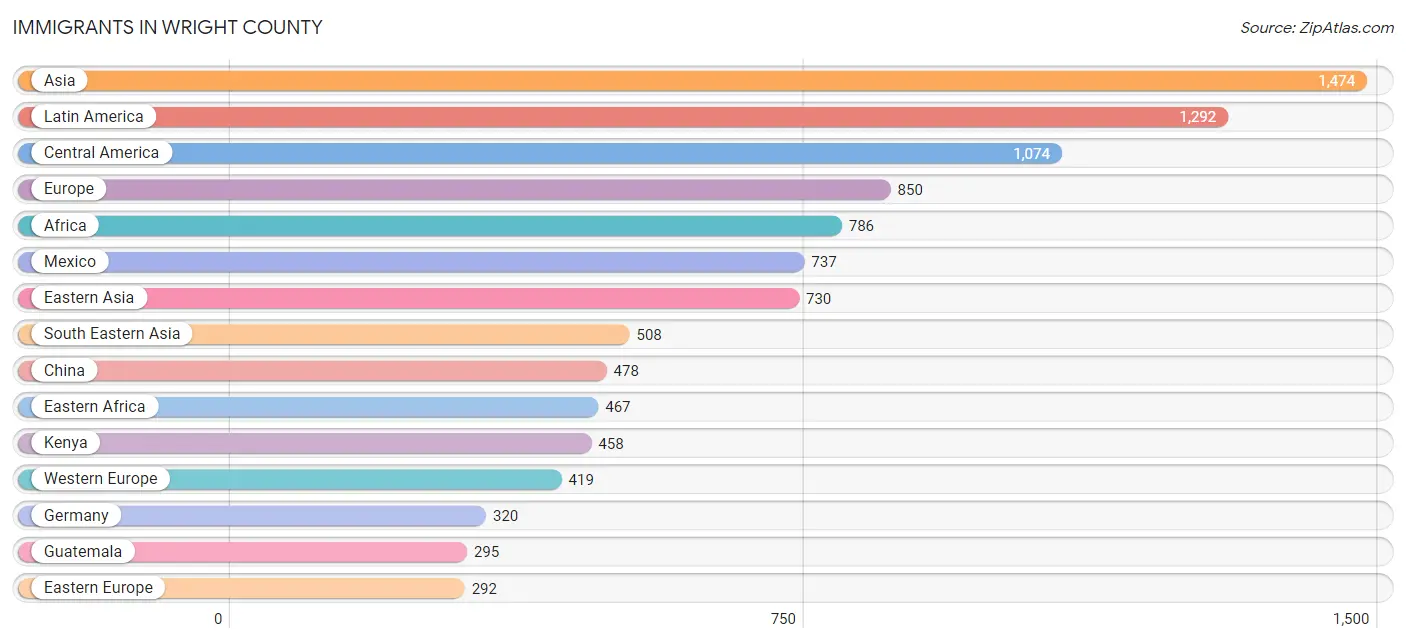
Immigrants in Wright County
The most numerous immigrant groups reported in Wright County came from Asia (1,474 | 1.0%), Latin America (1,292 | 0.9%), Central America (1,074 | 0.7%), Europe (850 | 0.6%), and Africa (786 | 0.5%), together accounting for 3.8% of all Wright County residents.
| Immigration Origin | # Population | % Population |
| Africa | 786 | 0.5% |
| Asia | 1,474 | 1.0% |
| Australia | 4 | 0.0% |
| Austria | 5 | 0.0% |
| Belarus | 13 | 0.0% |
| Brazil | 61 | 0.0% |
| Cambodia | 7 | 0.0% |
| Canada | 186 | 0.1% |
| Central America | 1,074 | 0.7% |
| China | 478 | 0.3% |
| Colombia | 13 | 0.0% |
| Eastern Africa | 467 | 0.3% |
| Eastern Asia | 730 | 0.5% |
| Eastern Europe | 292 | 0.2% |
| Egypt | 184 | 0.1% |
| El Salvador | 4 | 0.0% |
| England | 27 | 0.0% |
| Ethiopia | 9 | 0.0% |
| Europe | 850 | 0.6% |
| France | 8 | 0.0% |
| Germany | 320 | 0.2% |
| Ghana | 1 | 0.0% |
| Greece | 62 | 0.0% |
| Guatemala | 295 | 0.2% |
| Guyana | 12 | 0.0% |
| Hungary | 5 | 0.0% |
| India | 65 | 0.1% |
| Indonesia | 30 | 0.0% |
| Italy | 4 | 0.0% |
| Japan | 13 | 0.0% |
| Kenya | 458 | 0.3% |
| Korea | 239 | 0.2% |
| Laos | 180 | 0.1% |
| Latin America | 1,292 | 0.9% |
| Latvia | 5 | 0.0% |
| Liberia | 100 | 0.1% |
| Malaysia | 21 | 0.0% |
| Mexico | 737 | 0.5% |
| Moldova | 12 | 0.0% |
| Morocco | 4 | 0.0% |
| Netherlands | 6 | 0.0% |
| Nicaragua | 38 | 0.0% |
| Northern Africa | 208 | 0.2% |
| Northern Europe | 73 | 0.1% |
| Oceania | 25 | 0.0% |
| Pakistan | 13 | 0.0% |
| Peru | 132 | 0.1% |
| Philippines | 163 | 0.1% |
| Poland | 8 | 0.0% |
| Romania | 5 | 0.0% |
| Russia | 201 | 0.1% |
| South Africa | 4 | 0.0% |
| South America | 218 | 0.2% |
| South Central Asia | 189 | 0.1% |
| South Eastern Asia | 508 | 0.4% |
| Southern Europe | 66 | 0.1% |
| Sri Lanka | 37 | 0.0% |
| Sudan | 11 | 0.0% |
| Switzerland | 80 | 0.1% |
| Syria | 28 | 0.0% |
| Thailand | 42 | 0.0% |
| Ukraine | 27 | 0.0% |
| Uzbekistan | 5 | 0.0% |
| Vietnam | 65 | 0.1% |
| Western Africa | 101 | 0.1% |
| Western Asia | 47 | 0.0% |
| Western Europe | 419 | 0.3% | View All 67 Rows |
Sex and Age in Wright County
Sex and Age in Wright County
The most populous age groups in Wright County are 5 to 9 Years (5,911 | 8.1%) for men and 5 to 9 Years (5,653 | 8.1%) for women.
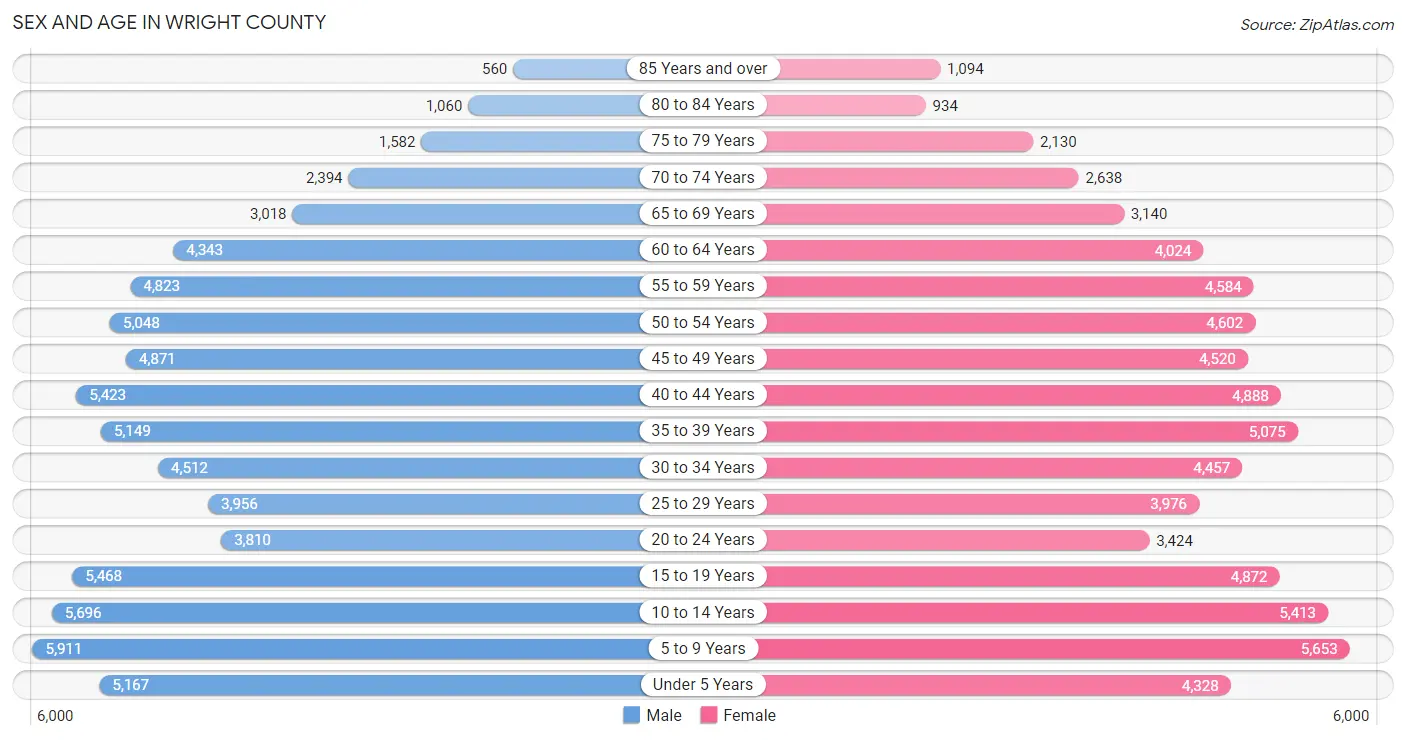
| Age Bracket | Male | Female |
| Under 5 Years | 5,167 (7.1%) | 4,328 (6.2%) |
| 5 to 9 Years | 5,911 (8.1%) | 5,653 (8.1%) |
| 10 to 14 Years | 5,696 (7.8%) | 5,413 (7.8%) |
| 15 to 19 Years | 5,468 (7.5%) | 4,872 (7.0%) |
| 20 to 24 Years | 3,810 (5.2%) | 3,424 (4.9%) |
| 25 to 29 Years | 3,956 (5.4%) | 3,976 (5.7%) |
| 30 to 34 Years | 4,512 (6.2%) | 4,457 (6.4%) |
| 35 to 39 Years | 5,149 (7.1%) | 5,075 (7.3%) |
| 40 to 44 Years | 5,423 (7.4%) | 4,888 (7.0%) |
| 45 to 49 Years | 4,871 (6.7%) | 4,520 (6.5%) |
| 50 to 54 Years | 5,048 (6.9%) | 4,602 (6.6%) |
| 55 to 59 Years | 4,823 (6.6%) | 4,584 (6.6%) |
| 60 to 64 Years | 4,343 (6.0%) | 4,024 (5.8%) |
| 65 to 69 Years | 3,018 (4.2%) | 3,140 (4.5%) |
| 70 to 74 Years | 2,394 (3.3%) | 2,638 (3.8%) |
| 75 to 79 Years | 1,582 (2.2%) | 2,130 (3.0%) |
| 80 to 84 Years | 1,060 (1.5%) | 934 (1.3%) |
| 85 Years and over | 560 (0.8%) | 1,094 (1.6%) |
| Total | 72,791 (100.0%) | 69,752 (100.0%) |
Families and Households in Wright County
Median Family Size in Wright County
The median family size in Wright County is 3.23 persons per family, with married-couple families (31,231 | 83.2%) accounting for the largest median family size of 3.31 persons per family. On the other hand, single male/father families (2,156 | 5.8%) represent the smallest median family size with 2.73 persons per family.
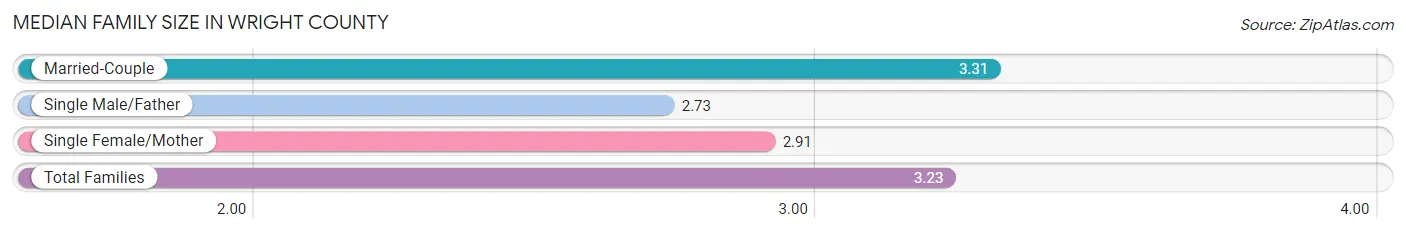
| Family Type | # Families | Family Size |
| Married-Couple | 31,231 (83.2%) | 3.31 |
| Single Male/Father | 2,156 (5.8%) | 2.73 |
| Single Female/Mother | 4,130 (11.0%) | 2.91 |
| Total Families | 37,517 (100.0%) | 3.23 |
Median Household Size in Wright County
The median household size in Wright County is 2.74 persons per household, with married-couple households (31,231 | 60.6%) accounting for the largest median household size of 3.33 persons per household. non-family households (14,006 | 27.2%) represent the smallest median household size with 1.23 persons per household.
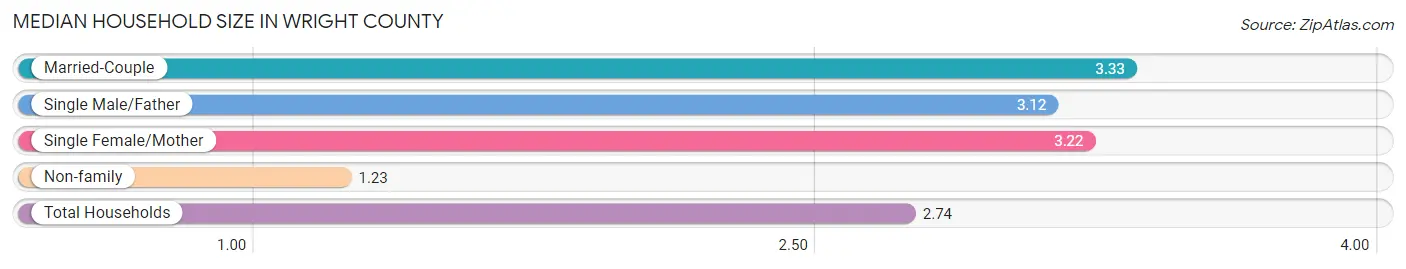
| Household Type | # Households | Household Size |
| Married-Couple | 31,231 (60.6%) | 3.33 |
| Single Male/Father | 2,156 (4.2%) | 3.12 |
| Single Female/Mother | 4,130 (8.0%) | 3.22 |
| Non-family | 14,006 (27.2%) | 1.23 |
| Total Households | 51,523 (100.0%) | 2.74 |
Household Size by Marriage Status in Wright County
Out of a total of 51,523 households in Wright County, 37,517 (72.8%) are family households, while 14,006 (27.2%) are nonfamily households. The most numerous type of family households are 2-person households, comprising 14,968, and the most common type of nonfamily households are 1-person households, comprising 11,241.
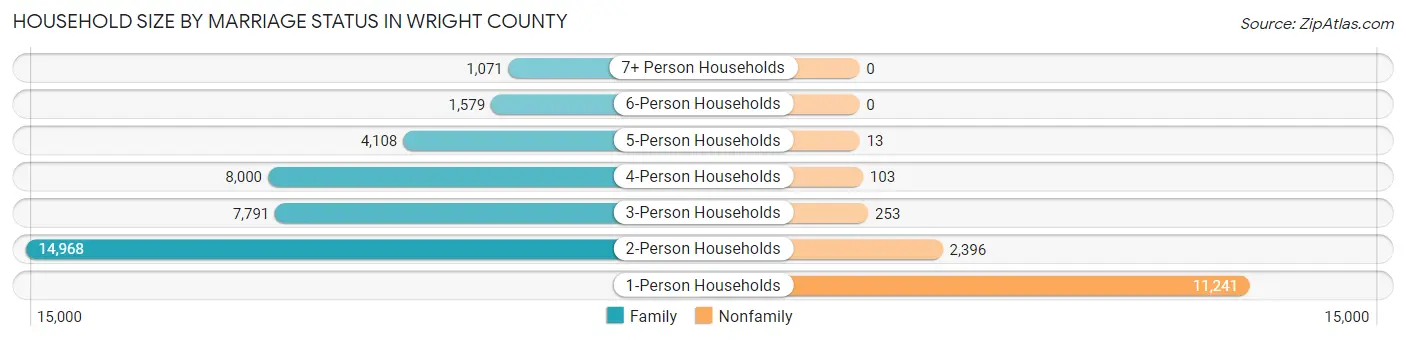
| Household Size | Family Households | Nonfamily Households |
| 1-Person Households | - | 11,241 (21.8%) |
| 2-Person Households | 14,968 (29.0%) | 2,396 (4.6%) |
| 3-Person Households | 7,791 (15.1%) | 253 (0.5%) |
| 4-Person Households | 8,000 (15.5%) | 103 (0.2%) |
| 5-Person Households | 4,108 (8.0%) | 13 (0.0%) |
| 6-Person Households | 1,579 (3.1%) | 0 (0.0%) |
| 7+ Person Households | 1,071 (2.1%) | 0 (0.0%) |
| Total | 37,517 (72.8%) | 14,006 (27.2%) |
Female Fertility in Wright County
Fertility by Age in Wright County
Average fertility rate in Wright County is 74.0 births per 1,000 women. Women in the age bracket of 20 to 34 years have the highest fertility rate with 144.0 births per 1,000 women. Women in the age bracket of 20 to 34 years acount for 71.6% of all women with births.
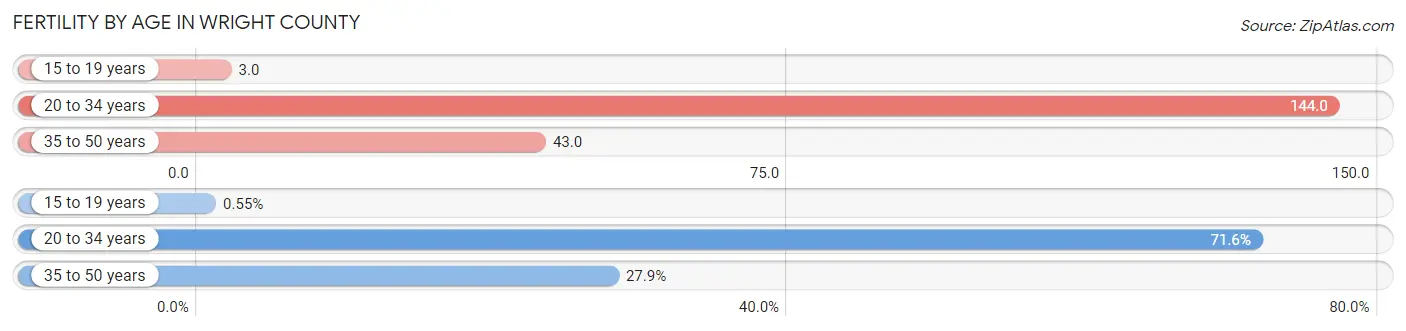
| Age Bracket | Women with Births | Births / 1,000 Women |
| 15 to 19 years | 13 (0.5%) | 3.0 |
| 20 to 34 years | 1,706 (71.6%) | 144.0 |
| 35 to 50 years | 665 (27.9%) | 43.0 |
| Total | 2,384 (100.0%) | 74.0 |
Fertility by Age by Marriage Status in Wright County
91.4% of women with births (2,384) in Wright County are married. The highest percentage of unmarried women with births falls into 15 to 19 years age bracket with 100.0% of them unmarried at the time of birth, while the lowest percentage of unmarried women with births belong to 35 to 50 years age bracket with 3.5% of them unmarried.
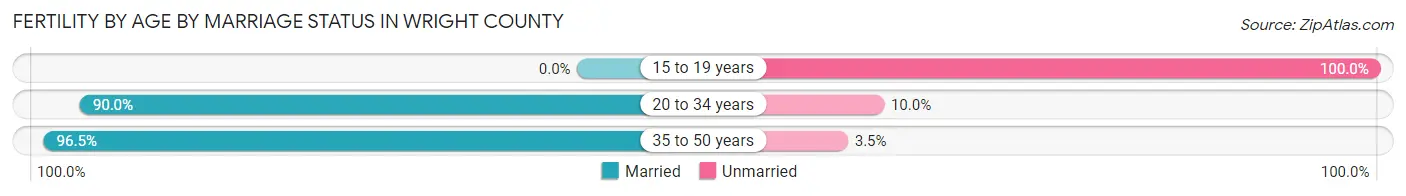
| Age Bracket | Married | Unmarried |
| 15 to 19 years | 0 (0.0%) | 13 (100.0%) |
| 20 to 34 years | 1,535 (90.0%) | 171 (10.0%) |
| 35 to 50 years | 642 (96.5%) | 23 (3.5%) |
| Total | 2,179 (91.4%) | 205 (8.6%) |
Fertility by Education in Wright County
Average fertility rate in Wright County is 74.0 births per 1,000 women. Women with the education attainment of graduate degree have the highest fertility rate of 124.0 births per 1,000 women, while women with the education attainment of less than high school have the lowest fertility at 11.0 births per 1,000 women. Women with the education attainment of bachelor's degree represent 37.0% of all women with births.
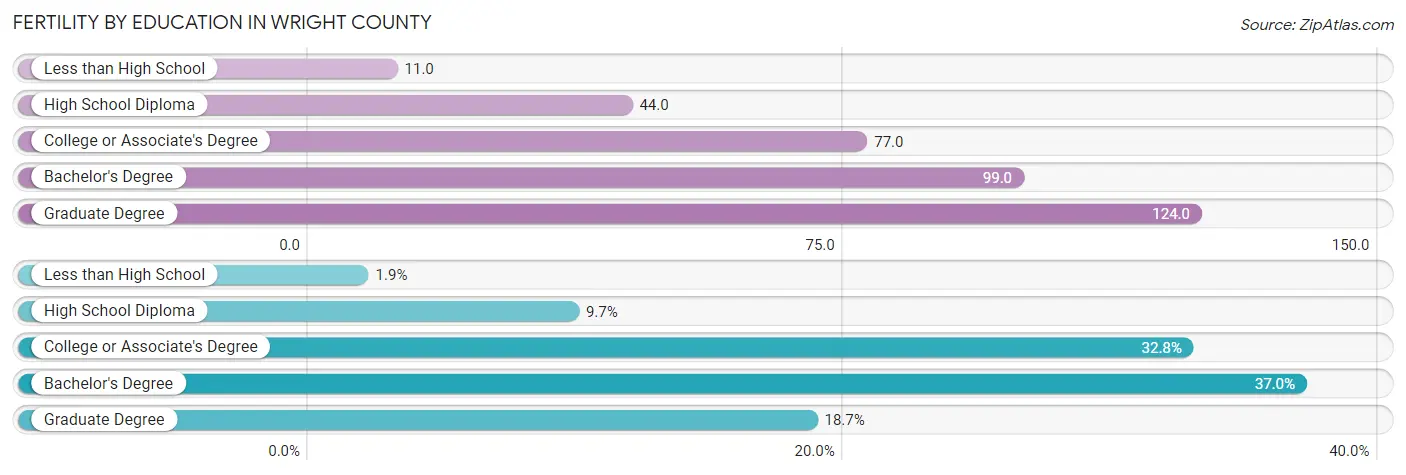
| Educational Attainment | Women with Births | Births / 1,000 Women |
| Less than High School | 44 (1.8%) | 11.0 |
| High School Diploma | 232 (9.7%) | 44.0 |
| College or Associate's Degree | 781 (32.8%) | 77.0 |
| Bachelor's Degree | 882 (37.0%) | 99.0 |
| Graduate Degree | 445 (18.7%) | 124.0 |
| Total | 2,384 (100.0%) | 74.0 |
Fertility by Education by Marriage Status in Wright County
8.6% of women with births in Wright County are unmarried. Women with the educational attainment of graduate degree are most likely to be married with 99.8% of them married at childbirth, while women with the educational attainment of less than high school are least likely to be married with 86.4% of them unmarried at childbirth.
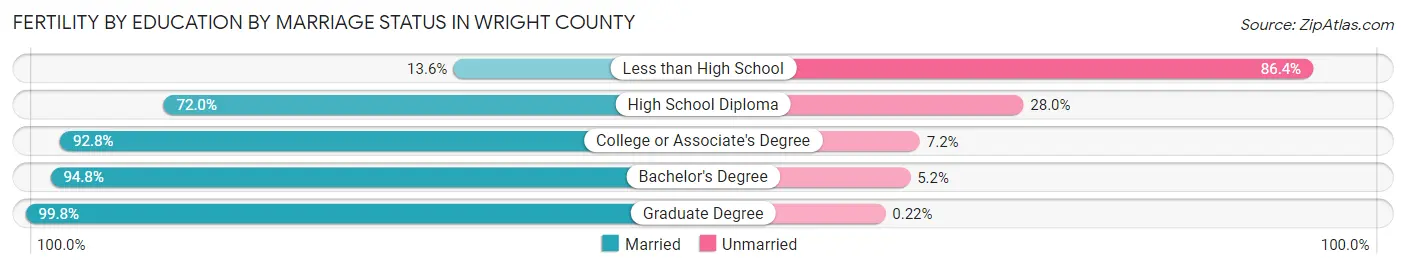
| Educational Attainment | Married | Unmarried |
| Less than High School | 6 (13.6%) | 38 (86.4%) |
| High School Diploma | 167 (72.0%) | 65 (28.0%) |
| College or Associate's Degree | 725 (92.8%) | 56 (7.2%) |
| Bachelor's Degree | 836 (94.8%) | 46 (5.2%) |
| Graduate Degree | 444 (99.8%) | 1 (0.2%) |
| Total | 2,179 (91.4%) | 205 (8.6%) |
Income in Wright County
Income Overview in Wright County
Per Capita Income in Wright County is $43,067, while median incomes of families and households are $118,209 and $102,980 respectively.
| Characteristic | Number | Measure |
| Per Capita Income | 142,543 | $43,067 |
| Median Family Income | 37,517 | $118,209 |
| Mean Family Income | 37,517 | $134,040 |
| Median Household Income | 51,523 | $102,980 |
| Mean Household Income | 51,523 | $117,983 |
| Income Deficit | 37,517 | $11,075 |
| Wage / Income Gap (%) | 142,543 | 31.29% |
| Wage / Income Gap ($) | 142,543 | 68.71¢ per $1 |
| Gini / Inequality Index | 142,543 | 0.38 |
Earnings by Sex in Wright County
Average Earnings in Wright County are $53,266, $62,589 for men and $43,008 for women, a difference of 31.3%.
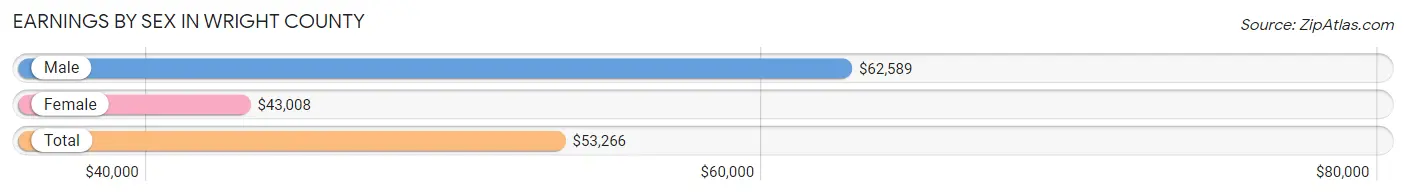
| Sex | Number | Average Earnings |
| Male | 44,320 (53.5%) | $62,589 |
| Female | 38,479 (46.5%) | $43,008 |
| Total | 82,799 (100.0%) | $53,266 |
Earnings by Sex by Income Bracket in Wright County
The most common earnings brackets in Wright County are $100,000+ for men (9,817 | 22.2%) and $75,000 to $99,999 for women (4,556 | 11.8%).
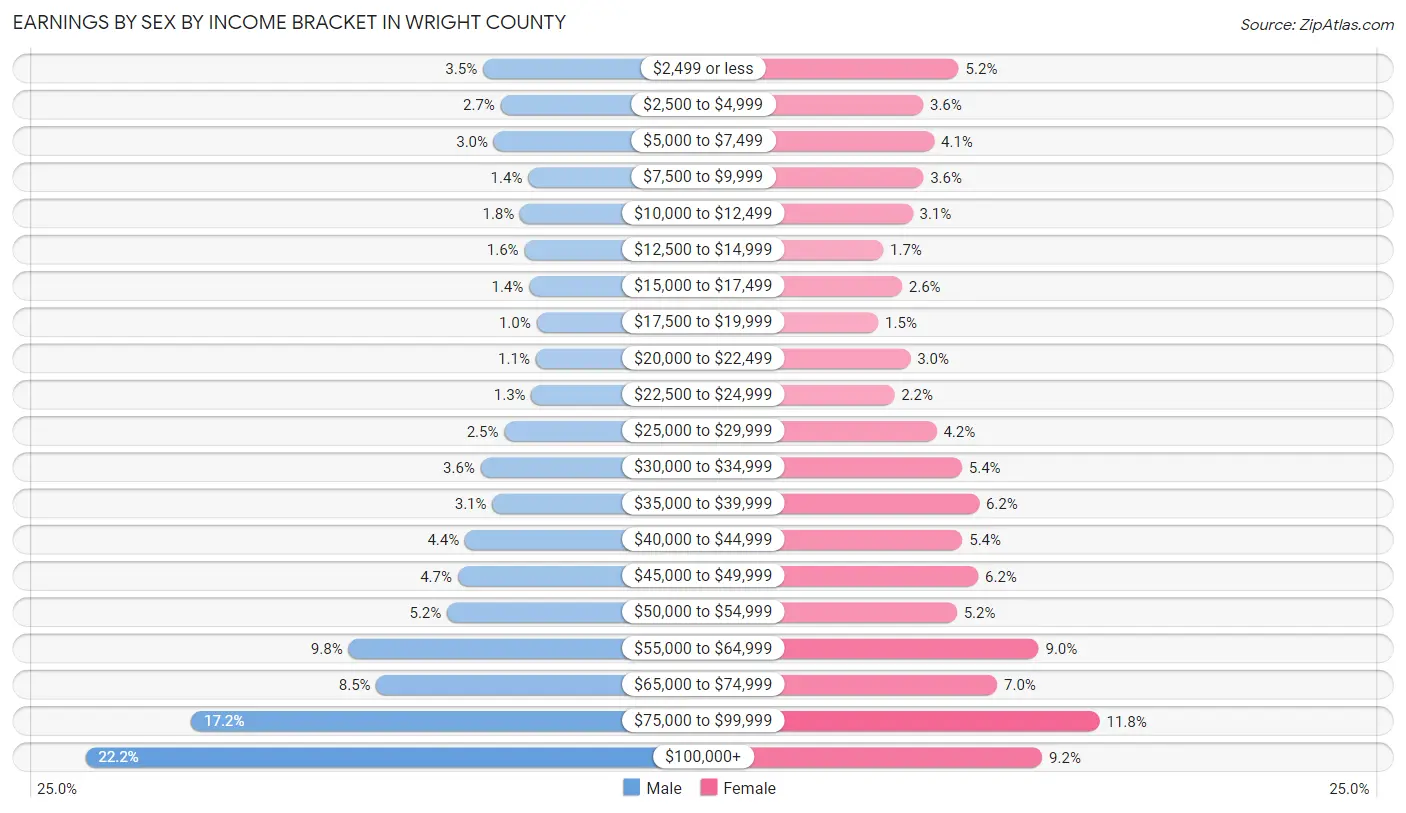
| Income | Male | Female |
| $2,499 or less | 1,564 (3.5%) | 2,018 (5.2%) |
| $2,500 to $4,999 | 1,195 (2.7%) | 1,372 (3.6%) |
| $5,000 to $7,499 | 1,337 (3.0%) | 1,575 (4.1%) |
| $7,500 to $9,999 | 625 (1.4%) | 1,377 (3.6%) |
| $10,000 to $12,499 | 794 (1.8%) | 1,185 (3.1%) |
| $12,500 to $14,999 | 706 (1.6%) | 655 (1.7%) |
| $15,000 to $17,499 | 608 (1.4%) | 992 (2.6%) |
| $17,500 to $19,999 | 454 (1.0%) | 566 (1.5%) |
| $20,000 to $22,499 | 470 (1.1%) | 1,142 (3.0%) |
| $22,500 to $24,999 | 560 (1.3%) | 853 (2.2%) |
| $25,000 to $29,999 | 1,121 (2.5%) | 1,618 (4.2%) |
| $30,000 to $34,999 | 1,612 (3.6%) | 2,073 (5.4%) |
| $35,000 to $39,999 | 1,369 (3.1%) | 2,381 (6.2%) |
| $40,000 to $44,999 | 1,935 (4.4%) | 2,082 (5.4%) |
| $45,000 to $49,999 | 2,088 (4.7%) | 2,368 (6.1%) |
| $50,000 to $54,999 | 2,309 (5.2%) | 1,980 (5.1%) |
| $55,000 to $64,999 | 4,356 (9.8%) | 3,457 (9.0%) |
| $65,000 to $74,999 | 3,778 (8.5%) | 2,709 (7.0%) |
| $75,000 to $99,999 | 7,622 (17.2%) | 4,556 (11.8%) |
| $100,000+ | 9,817 (22.2%) | 3,520 (9.1%) |
| Total | 44,320 (100.0%) | 38,479 (100.0%) |
Earnings by Sex by Educational Attainment in Wright County
Average earnings in Wright County are $70,208 for men and $48,391 for women, a difference of 31.1%. Men with an educational attainment of graduate degree enjoy the highest average annual earnings of $94,063, while those with high school diploma education earn the least with $54,271. Women with an educational attainment of graduate degree earn the most with the average annual earnings of $80,262, while those with less than high school education have the smallest earnings of $13,022.
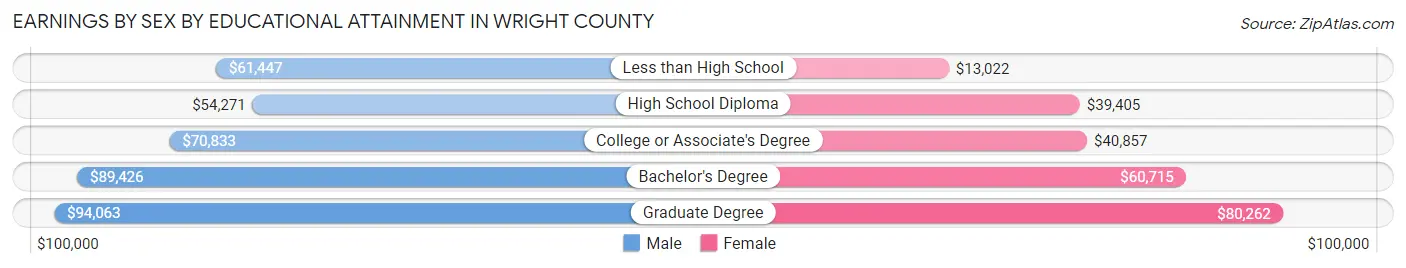
| Educational Attainment | Male Income | Female Income |
| Less than High School | $61,447 | $13,022 |
| High School Diploma | $54,271 | $39,405 |
| College or Associate's Degree | $70,833 | $40,857 |
| Bachelor's Degree | $89,426 | $60,715 |
| Graduate Degree | $94,063 | $80,262 |
| Total | $70,208 | $48,391 |
Family Income in Wright County
Family Income Brackets in Wright County
According to the Wright County family income data, there are 10,880 families falling into the $100,000 to $149,999 income range, which is the most common income bracket and makes up 29.0% of all families. Conversely, the $10,000 to $14,999 income bracket is the least frequent group with only 263 families (0.7%) belonging to this category.
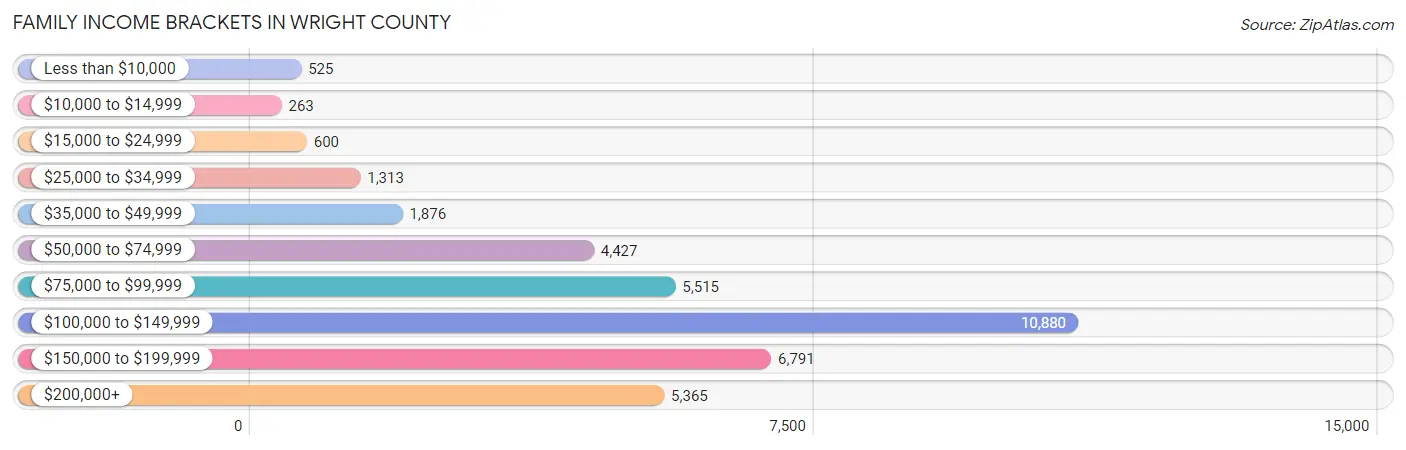
| Income Bracket | # Families | % Families |
| Less than $10,000 | 525 | 1.4% |
| $10,000 to $14,999 | 263 | 0.7% |
| $15,000 to $24,999 | 600 | 1.6% |
| $25,000 to $34,999 | 1,313 | 3.5% |
| $35,000 to $49,999 | 1,876 | 5.0% |
| $50,000 to $74,999 | 4,427 | 11.8% |
| $75,000 to $99,999 | 5,515 | 14.7% |
| $100,000 to $149,999 | 10,880 | 29.0% |
| $150,000 to $199,999 | 6,791 | 18.1% |
| $200,000+ | 5,365 | 14.3% |
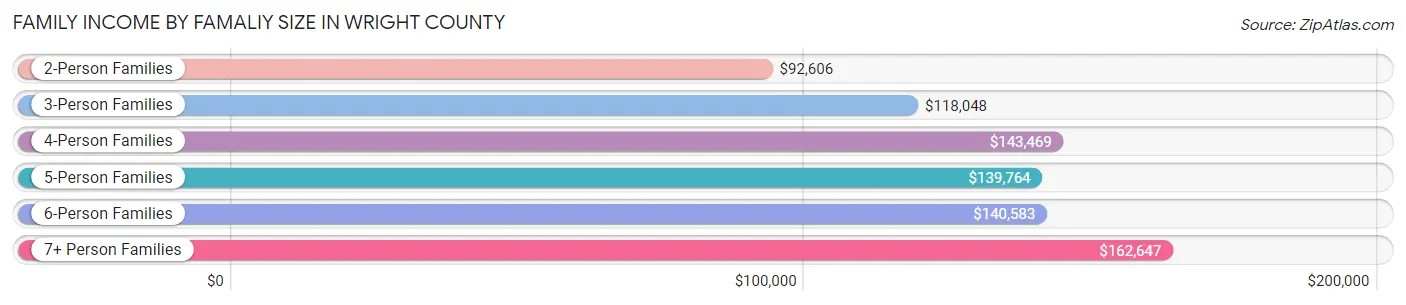
Family Income by Famaliy Size in Wright County
7+ person families (982 | 2.6%) account for the highest median family income in Wright County with $162,647 per family, while 2-person families (15,795 | 42.1%) have the highest median income of $46,303 per family member.
| Income Bracket | # Families | Median Income |
| 2-Person Families | 15,795 (42.1%) | $92,606 |
| 3-Person Families | 7,925 (21.1%) | $118,048 |
| 4-Person Families | 7,477 (19.9%) | $143,469 |
| 5-Person Families | 3,909 (10.4%) | $139,764 |
| 6-Person Families | 1,429 (3.8%) | $140,583 |
| 7+ Person Families | 982 (2.6%) | $162,647 |
| Total | 37,517 (100.0%) | $118,209 |
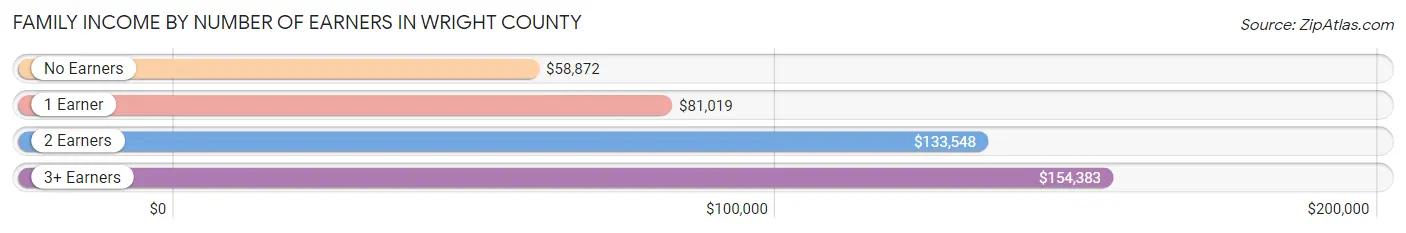
Family Income by Number of Earners in Wright County
The median family income in Wright County is $118,209, with families comprising 3+ earners (6,163) having the highest median family income of $154,383, while families with no earners (3,885) have the lowest median family income of $58,872, accounting for 16.4% and 10.4% of families, respectively.
| Number of Earners | # Families | Median Income |
| No Earners | 3,885 (10.4%) | $58,872 |
| 1 Earner | 8,440 (22.5%) | $81,019 |
| 2 Earners | 19,029 (50.7%) | $133,548 |
| 3+ Earners | 6,163 (16.4%) | $154,383 |
| Total | 37,517 (100.0%) | $118,209 |
Household Income in Wright County
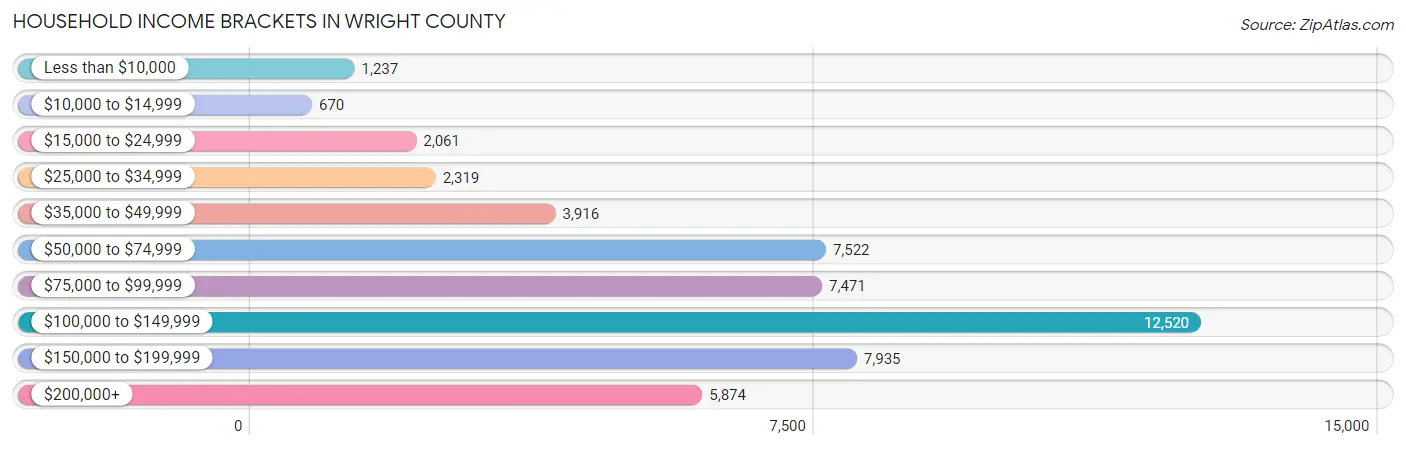
Household Income Brackets in Wright County
With 12,520 households falling in the category, the $100,000 to $149,999 income range is the most frequent in Wright County, accounting for 24.3% of all households. In contrast, only 670 households (1.3%) fall into the $10,000 to $14,999 income bracket, making it the least populous group.
| Income Bracket | # Households | % Households |
| Less than $10,000 | 1,237 | 2.4% |
| $10,000 to $14,999 | 670 | 1.3% |
| $15,000 to $24,999 | 2,061 | 4.0% |
| $25,000 to $34,999 | 2,319 | 4.5% |
| $35,000 to $49,999 | 3,916 | 7.6% |
| $50,000 to $74,999 | 7,522 | 14.6% |
| $75,000 to $99,999 | 7,471 | 14.5% |
| $100,000 to $149,999 | 12,520 | 24.3% |
| $150,000 to $199,999 | 7,935 | 15.4% |
| $200,000+ | 5,874 | 11.4% |
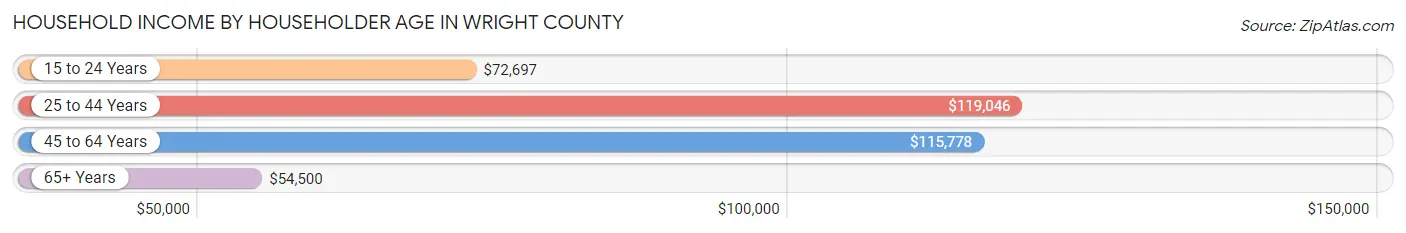
Household Income by Householder Age in Wright County
The median household income in Wright County is $102,980, with the highest median household income of $119,046 found in the 25 to 44 years age bracket for the primary householder. A total of 18,063 households (35.1%) fall into this category. Meanwhile, the 65+ years age bracket for the primary householder has the lowest median household income of $54,500, with 11,626 households (22.6%) in this group.
| Income Bracket | # Households | Median Income |
| 15 to 24 Years | 1,533 (3.0%) | $72,697 |
| 25 to 44 Years | 18,063 (35.1%) | $119,046 |
| 45 to 64 Years | 20,301 (39.4%) | $115,778 |
| 65+ Years | 11,626 (22.6%) | $54,500 |
| Total | 51,523 (100.0%) | $102,980 |
Poverty in Wright County
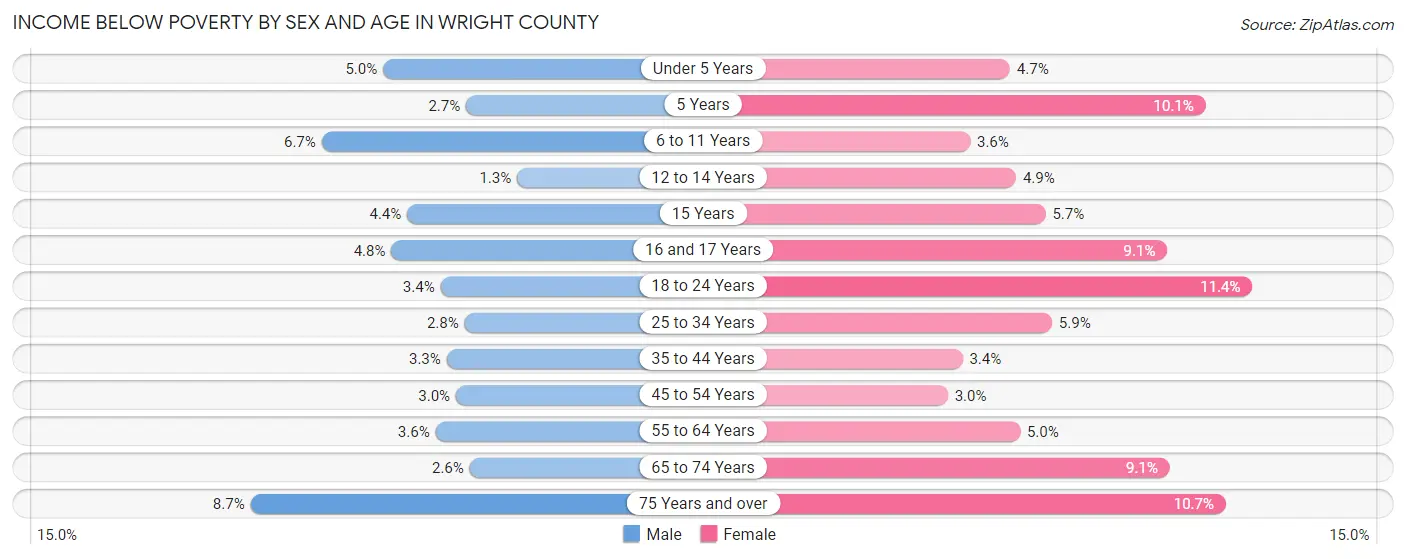
Income Below Poverty by Sex and Age in Wright County
With 3.8% poverty level for males and 5.8% for females among the residents of Wright County, 75 year old and over males and 18 to 24 year old females are the most vulnerable to poverty, with 275 males (8.7%) and 563 females (11.4%) in their respective age groups living below the poverty level.
| Age Bracket | Male | Female |
| Under 5 Years | 258 (5.0%) | 201 (4.7%) |
| 5 Years | 29 (2.7%) | 139 (10.1%) |
| 6 to 11 Years | 464 (6.7%) | 223 (3.6%) |
| 12 to 14 Years | 43 (1.3%) | 156 (4.9%) |
| 15 Years | 44 (4.3%) | 56 (5.7%) |
| 16 and 17 Years | 126 (4.8%) | 211 (9.1%) |
| 18 to 24 Years | 191 (3.4%) | 563 (11.4%) |
| 25 to 34 Years | 232 (2.8%) | 493 (5.9%) |
| 35 to 44 Years | 343 (3.3%) | 335 (3.4%) |
| 45 to 54 Years | 296 (3.0%) | 269 (2.9%) |
| 55 to 64 Years | 325 (3.6%) | 425 (5.0%) |
| 65 to 74 Years | 141 (2.6%) | 525 (9.1%) |
| 75 Years and over | 275 (8.7%) | 408 (10.7%) |
| Total | 2,767 (3.8%) | 4,004 (5.8%) |
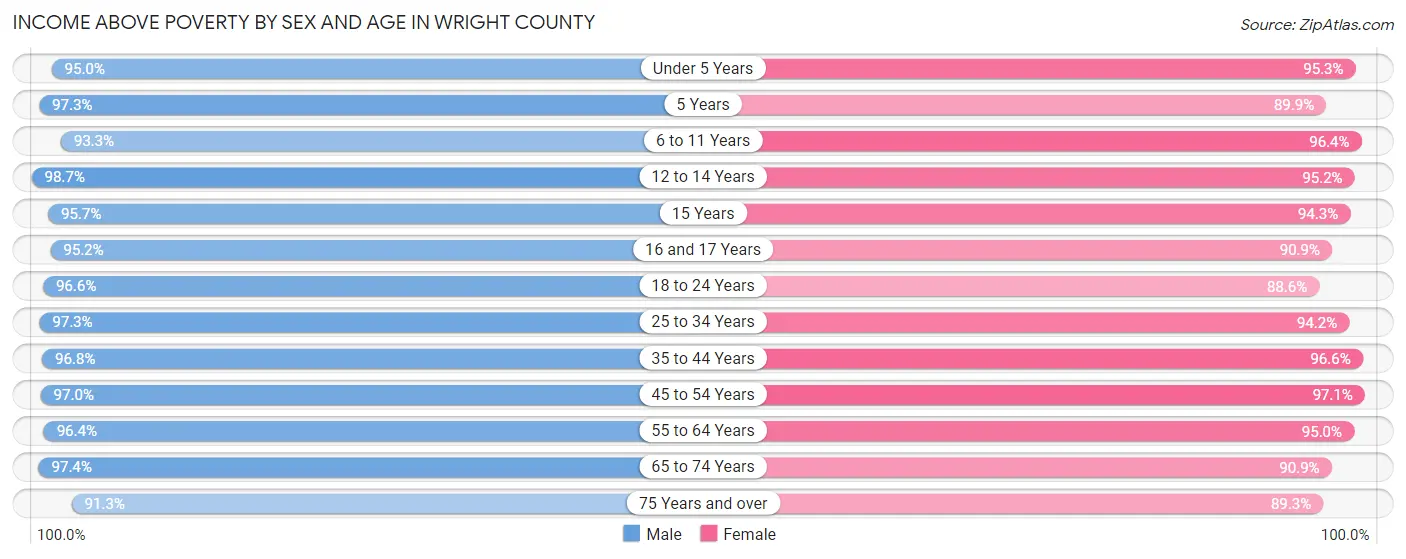
Income Above Poverty by Sex and Age in Wright County
According to the poverty statistics in Wright County, males aged 12 to 14 years and females aged 45 to 54 years are the age groups that are most secure financially, with 98.7% of males and 97.1% of females in these age groups living above the poverty line.
| Age Bracket | Male | Female |
| Under 5 Years | 4,879 (95.0%) | 4,098 (95.3%) |
| 5 Years | 1,041 (97.3%) | 1,233 (89.9%) |
| 6 to 11 Years | 6,429 (93.3%) | 6,032 (96.4%) |
| 12 to 14 Years | 3,302 (98.7%) | 3,062 (95.2%) |
| 15 Years | 968 (95.7%) | 932 (94.3%) |
| 16 and 17 Years | 2,506 (95.2%) | 2,118 (90.9%) |
| 18 to 24 Years | 5,392 (96.6%) | 4,364 (88.6%) |
| 25 to 34 Years | 8,192 (97.3%) | 7,930 (94.2%) |
| 35 to 44 Years | 10,209 (96.8%) | 9,622 (96.6%) |
| 45 to 54 Years | 9,610 (97.0%) | 8,848 (97.1%) |
| 55 to 64 Years | 8,807 (96.4%) | 8,147 (95.0%) |
| 65 to 74 Years | 5,266 (97.4%) | 5,223 (90.9%) |
| 75 Years and over | 2,882 (91.3%) | 3,407 (89.3%) |
| Total | 69,483 (96.2%) | 65,016 (94.2%) |
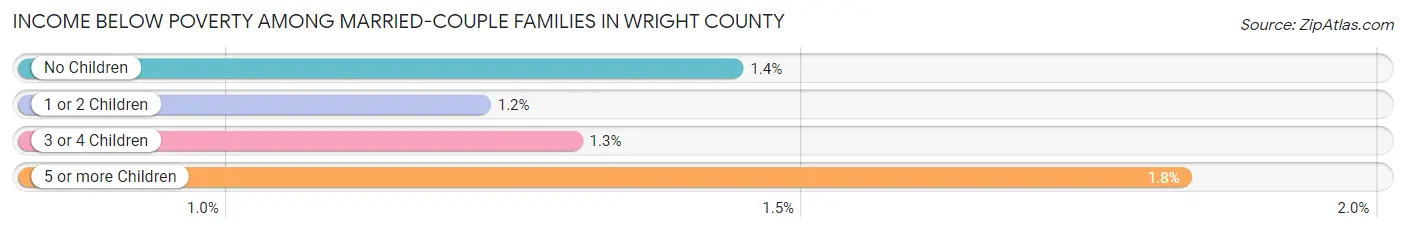
Income Below Poverty Among Married-Couple Families in Wright County
The poverty statistics for married-couple families in Wright County show that 1.3% or 423 of the total 31,231 families live below the poverty line. Families with 5 or more children have the highest poverty rate of 1.8%, comprising of 11 families. On the other hand, families with 1 or 2 children have the lowest poverty rate of 1.2%, which includes 137 families.
| Children | Above Poverty | Below Poverty |
| No Children | 15,486 (98.6%) | 227 (1.4%) |
| 1 or 2 Children | 11,075 (98.8%) | 137 (1.2%) |
| 3 or 4 Children | 3,656 (98.7%) | 48 (1.3%) |
| 5 or more Children | 591 (98.2%) | 11 (1.8%) |
| Total | 30,808 (98.7%) | 423 (1.3%) |
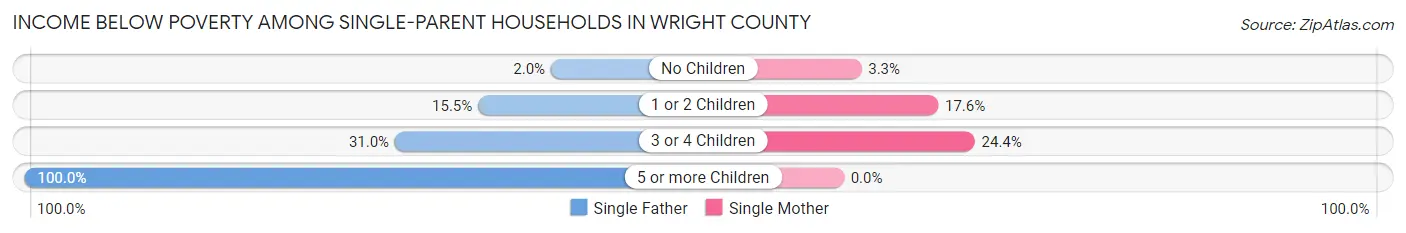
Income Below Poverty Among Single-Parent Households in Wright County
According to the poverty data in Wright County, 11.9% or 256 single-father households and 13.9% or 573 single-mother households are living below the poverty line. Among single-father households, those with 5 or more children have the highest poverty rate, with 6 households (100.0%) experiencing poverty. Likewise, among single-mother households, those with 3 or 4 children have the highest poverty rate, with 120 households (24.4%) falling below the poverty line.
| Children | Single Father | Single Mother |
| No Children | 17 (2.0%) | 41 (3.3%) |
| 1 or 2 Children | 166 (15.5%) | 412 (17.6%) |
| 3 or 4 Children | 67 (31.0%) | 120 (24.4%) |
| 5 or more Children | 6 (100.0%) | 0 (0.0%) |
| Total | 256 (11.9%) | 573 (13.9%) |
Income Below Poverty Among Married-Couple vs Single-Parent Households in Wright County
The poverty data for Wright County shows that 423 of the married-couple family households (1.3%) and 829 of the single-parent households (13.2%) are living below the poverty level. Within the married-couple family households, those with 5 or more children have the highest poverty rate, with 11 households (1.8%) falling below the poverty line. Among the single-parent households, those with 3 or 4 children have the highest poverty rate, with 187 household (26.4%) living below poverty.
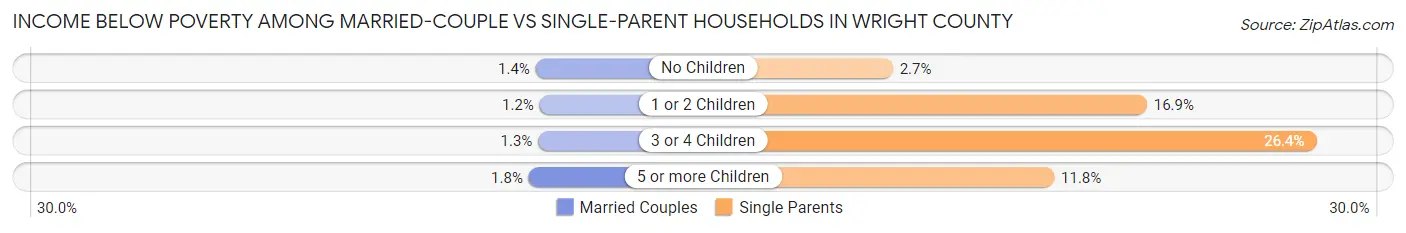
| Children | Married-Couple Families | Single-Parent Households |
| No Children | 227 (1.4%) | 58 (2.7%) |
| 1 or 2 Children | 137 (1.2%) | 578 (16.9%) |
| 3 or 4 Children | 48 (1.3%) | 187 (26.4%) |
| 5 or more Children | 11 (1.8%) | 6 (11.8%) |
| Total | 423 (1.3%) | 829 (13.2%) |
Employment Characteristics in Wright County
Employment by Class of Employer in Wright County
Among the 75,733 employed individuals in Wright County, private company employees (54,482 | 71.9%), not-for-profit organizations (6,003 | 7.9%), and local government employees (5,704 | 7.5%) make up the most common classes of employment.
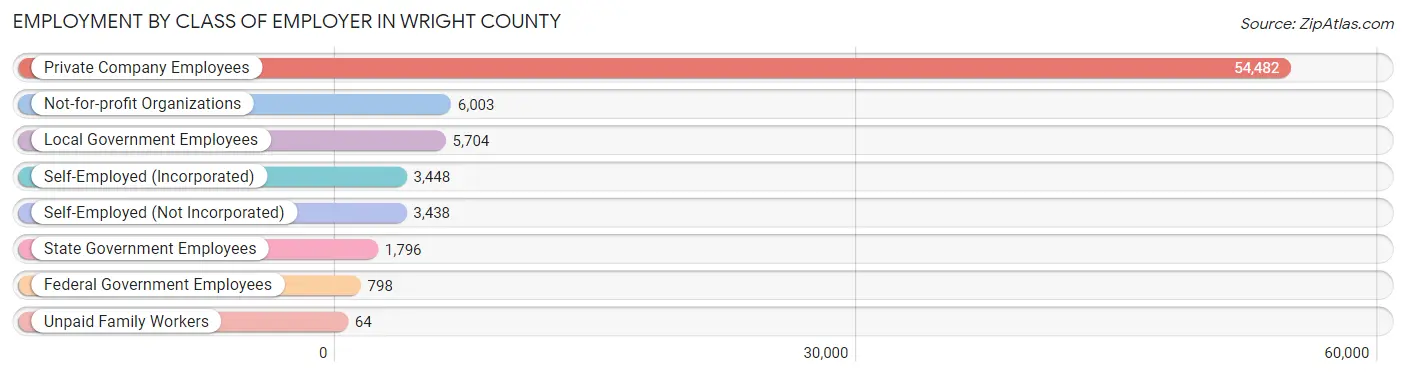
| Employer Class | # Employees | % Employees |
| Private Company Employees | 54,482 | 71.9% |
| Self-Employed (Incorporated) | 3,448 | 4.5% |
| Self-Employed (Not Incorporated) | 3,438 | 4.5% |
| Not-for-profit Organizations | 6,003 | 7.9% |
| Local Government Employees | 5,704 | 7.5% |
| State Government Employees | 1,796 | 2.4% |
| Federal Government Employees | 798 | 1.1% |
| Unpaid Family Workers | 64 | 0.1% |
| Total | 75,733 | 100.0% |
Employment Status by Age in Wright County
According to the labor force statistics for Wright County, out of the total population over 16 years of age (108,369), 72.7% or 78,784 individuals are in the labor force, with 2.2% or 1,733 of them unemployed. The age group with the highest labor force participation rate is 45 to 54 years, with 91.3% or 17,384 individuals in the labor force. Within the labor force, the 16 to 19 years age range has the highest percentage of unemployed individuals, with 4.2% or 186 of them being unemployed.
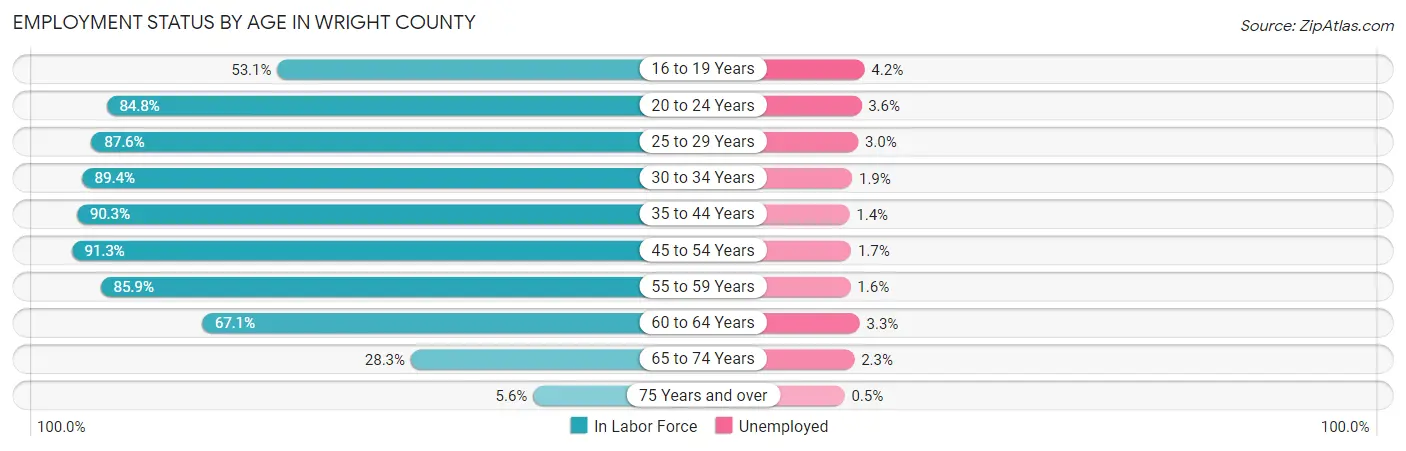
| Age Bracket | In Labor Force | Unemployed |
| 16 to 19 Years | 4,425 (53.1%) | 186 (4.2%) |
| 20 to 24 Years | 6,134 (84.8%) | 221 (3.6%) |
| 25 to 29 Years | 6,948 (87.6%) | 208 (3.0%) |
| 30 to 34 Years | 8,018 (89.4%) | 152 (1.9%) |
| 35 to 44 Years | 18,543 (90.3%) | 260 (1.4%) |
| 45 to 54 Years | 17,384 (91.3%) | 296 (1.7%) |
| 55 to 59 Years | 8,081 (85.9%) | 129 (1.6%) |
| 60 to 64 Years | 5,614 (67.1%) | 185 (3.3%) |
| 65 to 74 Years | 3,167 (28.3%) | 73 (2.3%) |
| 75 Years and over | 412 (5.6%) | 2 (0.5%) |
| Total | 78,784 (72.7%) | 1,733 (2.2%) |
Employment Status by Educational Attainment in Wright County
According to labor force statistics for Wright County, 87.0% of individuals (64,598) out of the total population between 25 and 64 years of age (74,251) are in the labor force, with 1.9% or 1,227 of them being unemployed. The group with the highest labor force participation rate are those with the educational attainment of bachelor's degree or higher, with 92.0% or 24,484 individuals in the labor force. Within the labor force, individuals with college / associate degree education have the highest percentage of unemployment, with 2.4% or 542 of them being unemployed.
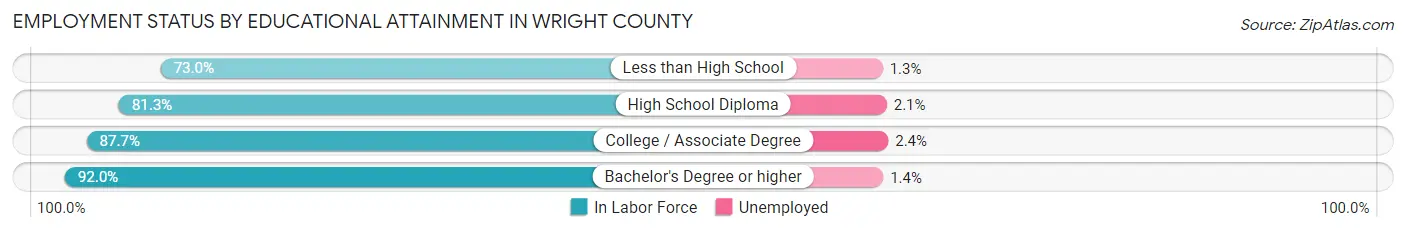
| Educational Attainment | In Labor Force | Unemployed |
| Less than High School | 2,440 (73.0%) | 43 (1.3%) |
| High School Diploma | 15,068 (81.3%) | 389 (2.1%) |
| College / Associate Degree | 22,593 (87.7%) | 618 (2.4%) |
| Bachelor's Degree or higher | 24,484 (92.0%) | 373 (1.4%) |
| Total | 64,598 (87.0%) | 1,411 (1.9%) |
Employment Occupations by Sex in Wright County
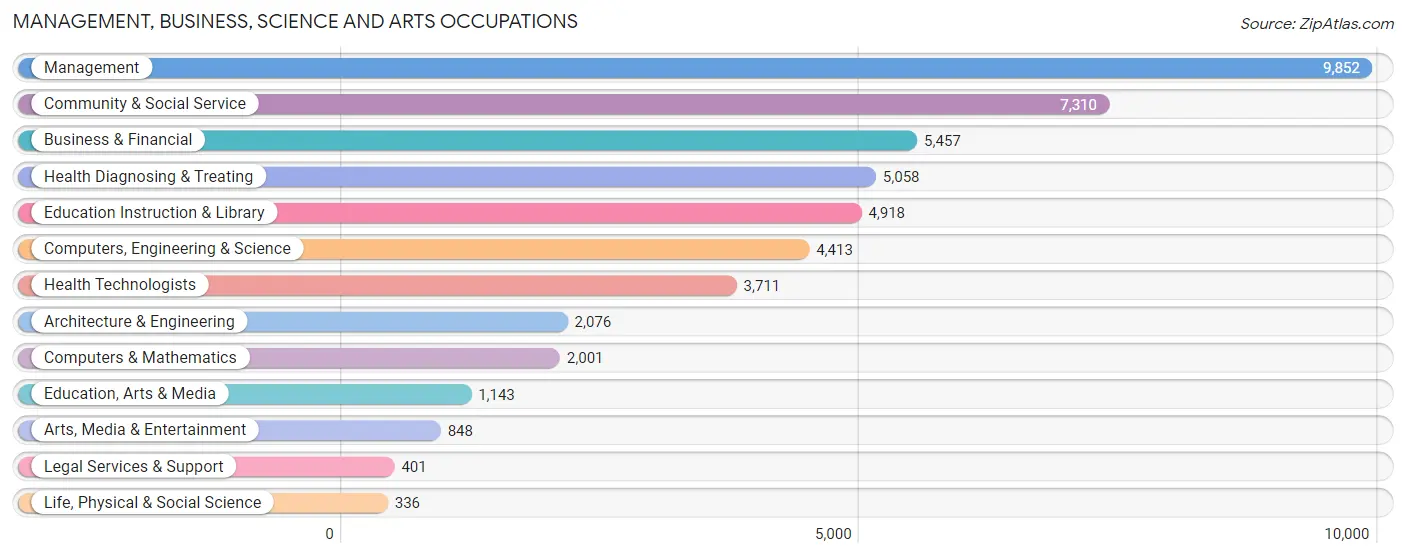
Management, Business, Science and Arts Occupations
The most common Management, Business, Science and Arts occupations in Wright County are Management (9,852 | 12.8%), Community & Social Service (7,310 | 9.5%), Business & Financial (5,457 | 7.1%), Health Diagnosing & Treating (5,058 | 6.6%), and Education Instruction & Library (4,918 | 6.4%).
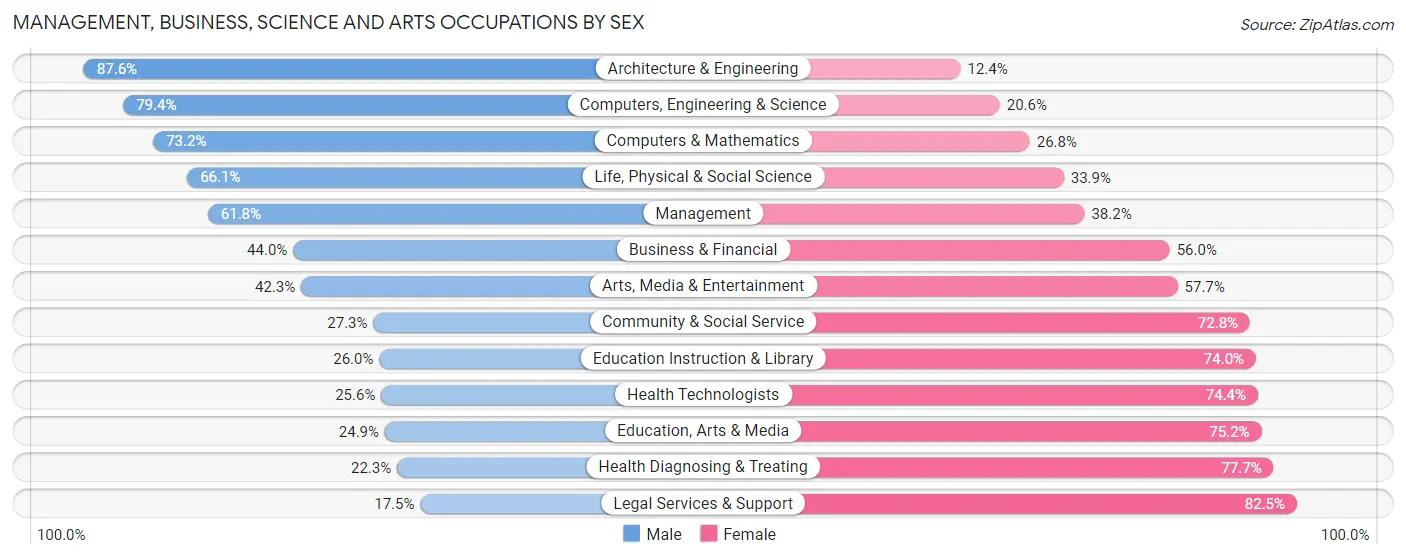
Management, Business, Science and Arts Occupations by Sex
Within the Management, Business, Science and Arts occupations in Wright County, the most male-oriented occupations are Architecture & Engineering (87.6%), Computers, Engineering & Science (79.4%), and Computers & Mathematics (73.2%), while the most female-oriented occupations are Legal Services & Support (82.5%), Health Diagnosing & Treating (77.7%), and Education, Arts & Media (75.1%).
| Occupation | Male | Female |
| Management | 6,085 (61.8%) | 3,767 (38.2%) |
| Business & Financial | 2,400 (44.0%) | 3,057 (56.0%) |
| Computers, Engineering & Science | 3,505 (79.4%) | 908 (20.6%) |
| Computers & Mathematics | 1,464 (73.2%) | 537 (26.8%) |
| Architecture & Engineering | 1,819 (87.6%) | 257 (12.4%) |
| Life, Physical & Social Science | 222 (66.1%) | 114 (33.9%) |
| Community & Social Service | 1,992 (27.3%) | 5,318 (72.8%) |
| Education, Arts & Media | 284 (24.8%) | 859 (75.1%) |
| Legal Services & Support | 70 (17.5%) | 331 (82.5%) |
| Education Instruction & Library | 1,279 (26.0%) | 3,639 (74.0%) |
| Arts, Media & Entertainment | 359 (42.3%) | 489 (57.7%) |
| Health Diagnosing & Treating | 1,128 (22.3%) | 3,930 (77.7%) |
| Health Technologists | 950 (25.6%) | 2,761 (74.4%) |
| Total (Category) | 15,110 (47.1%) | 16,980 (52.9%) |
| Total (Overall) | 41,604 (54.0%) | 35,377 (46.0%) |
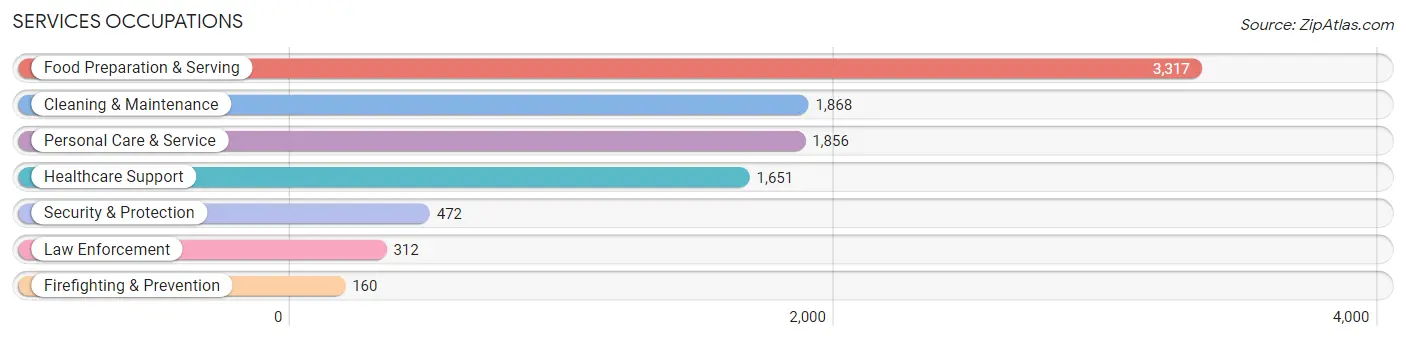
Services Occupations
The most common Services occupations in Wright County are Food Preparation & Serving (3,317 | 4.3%), Cleaning & Maintenance (1,868 | 2.4%), Personal Care & Service (1,856 | 2.4%), Healthcare Support (1,651 | 2.1%), and Security & Protection (472 | 0.6%).
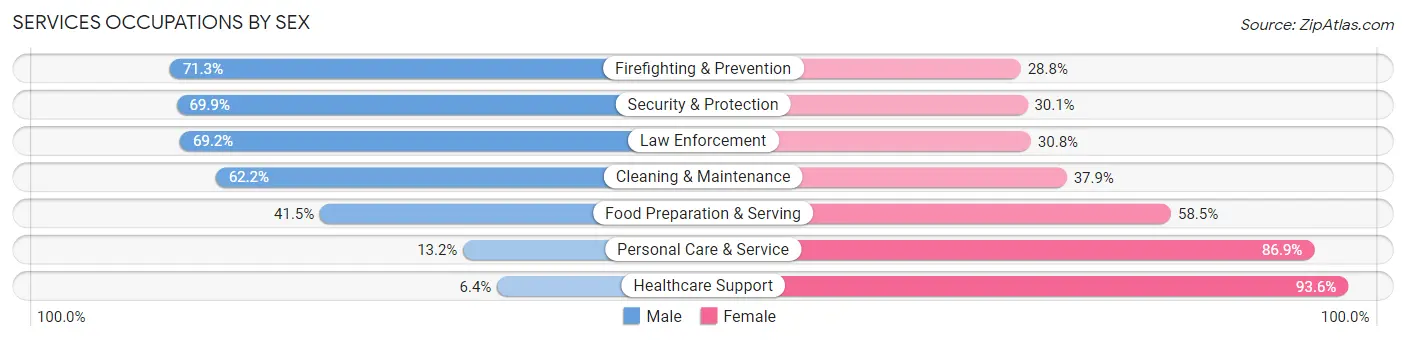
Services Occupations by Sex
Within the Services occupations in Wright County, the most male-oriented occupations are Firefighting & Prevention (71.3%), Security & Protection (69.9%), and Law Enforcement (69.2%), while the most female-oriented occupations are Healthcare Support (93.6%), Personal Care & Service (86.9%), and Food Preparation & Serving (58.5%).
| Occupation | Male | Female |
| Healthcare Support | 106 (6.4%) | 1,545 (93.6%) |
| Security & Protection | 330 (69.9%) | 142 (30.1%) |
| Firefighting & Prevention | 114 (71.3%) | 46 (28.7%) |
| Law Enforcement | 216 (69.2%) | 96 (30.8%) |
| Food Preparation & Serving | 1,376 (41.5%) | 1,941 (58.5%) |
| Cleaning & Maintenance | 1,161 (62.2%) | 707 (37.9%) |
| Personal Care & Service | 244 (13.2%) | 1,612 (86.9%) |
| Total (Category) | 3,217 (35.1%) | 5,947 (64.9%) |
| Total (Overall) | 41,604 (54.0%) | 35,377 (46.0%) |
Sales and Office Occupations
The most common Sales and Office occupations in Wright County are Office & Administration (8,835 | 11.5%), and Sales & Related (7,400 | 9.6%).

Sales and Office Occupations by Sex
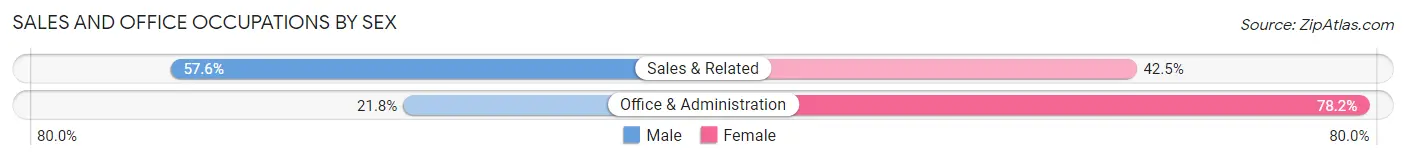
| Occupation | Male | Female |
| Sales & Related | 4,259 (57.6%) | 3,141 (42.4%) |
| Office & Administration | 1,923 (21.8%) | 6,912 (78.2%) |
| Total (Category) | 6,182 (38.1%) | 10,053 (61.9%) |
| Total (Overall) | 41,604 (54.0%) | 35,377 (46.0%) |
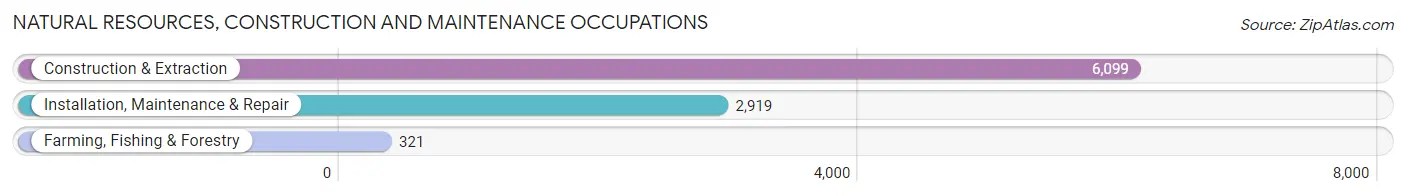
Natural Resources, Construction and Maintenance Occupations
The most common Natural Resources, Construction and Maintenance occupations in Wright County are Construction & Extraction (6,099 | 7.9%), Installation, Maintenance & Repair (2,919 | 3.8%), and Farming, Fishing & Forestry (321 | 0.4%).
Natural Resources, Construction and Maintenance Occupations by Sex
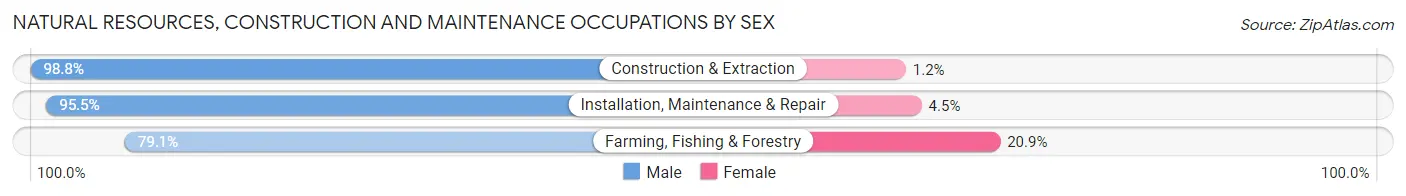
| Occupation | Male | Female |
| Farming, Fishing & Forestry | 254 (79.1%) | 67 (20.9%) |
| Construction & Extraction | 6,024 (98.8%) | 75 (1.2%) |
| Installation, Maintenance & Repair | 2,787 (95.5%) | 132 (4.5%) |
| Total (Category) | 9,065 (97.1%) | 274 (2.9%) |
| Total (Overall) | 41,604 (54.0%) | 35,377 (46.0%) |
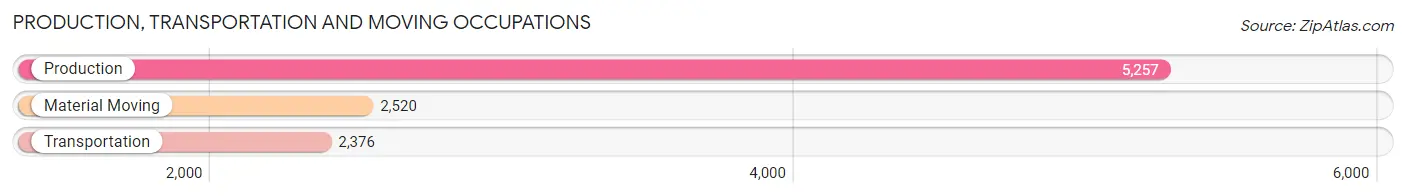
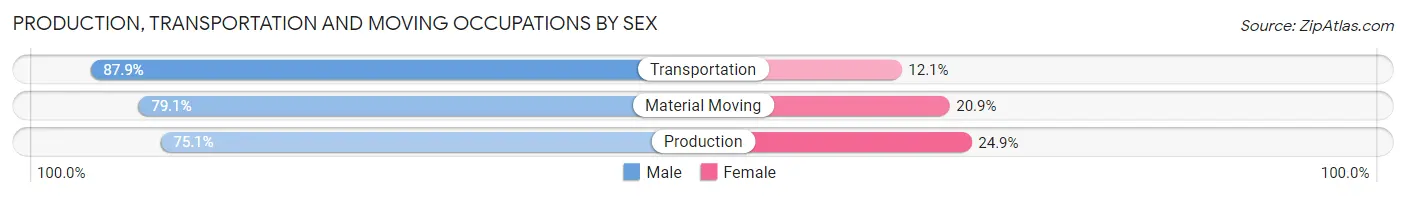
Production, Transportation and Moving Occupations
The most common Production, Transportation and Moving occupations in Wright County are Production (5,257 | 6.8%), Material Moving (2,520 | 3.3%), and Transportation (2,376 | 3.1%).
Production, Transportation and Moving Occupations by Sex
| Occupation | Male | Female |
| Production | 3,947 (75.1%) | 1,310 (24.9%) |
| Transportation | 2,089 (87.9%) | 287 (12.1%) |
| Material Moving | 1,994 (79.1%) | 526 (20.9%) |
| Total (Category) | 8,030 (79.1%) | 2,123 (20.9%) |
| Total (Overall) | 41,604 (54.0%) | 35,377 (46.0%) |
Employment Industries by Sex in Wright County
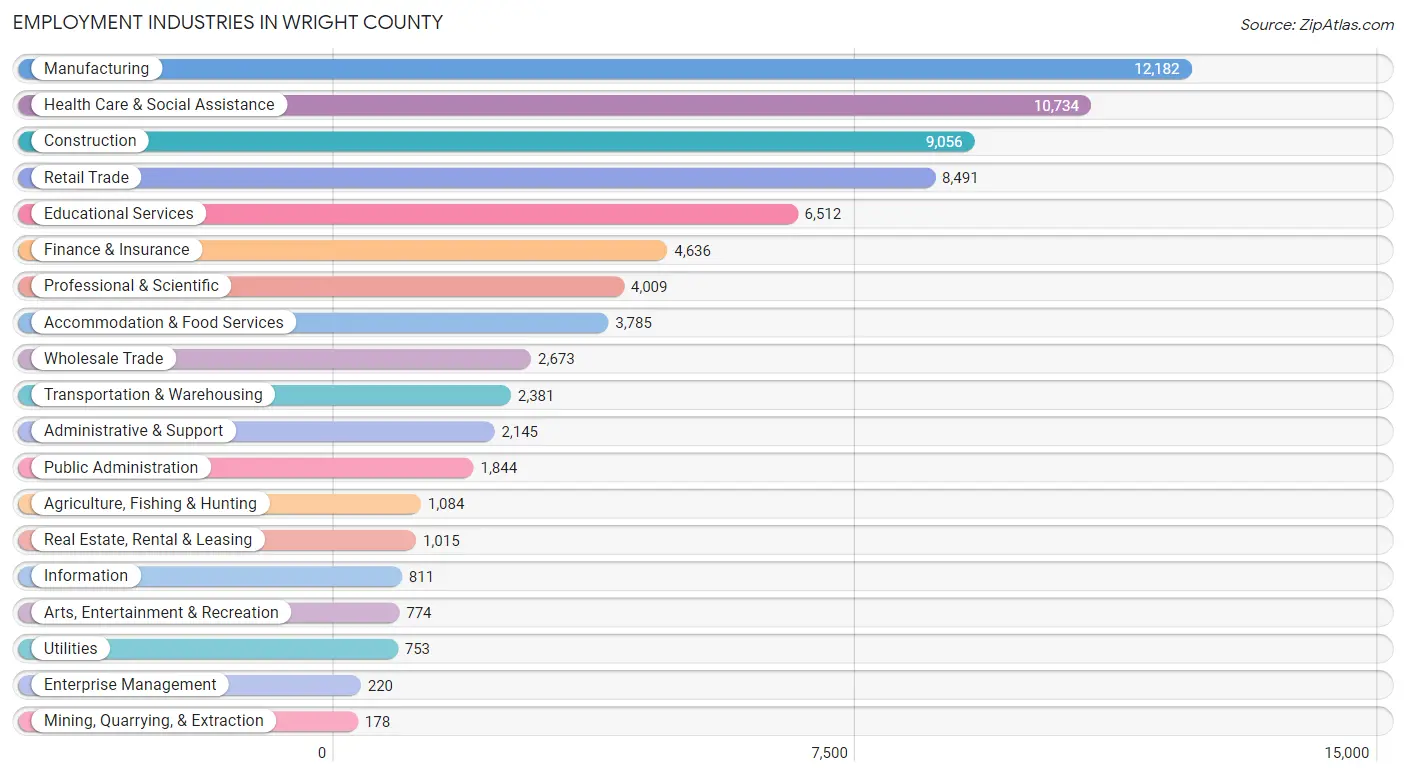
Employment Industries in Wright County
The major employment industries in Wright County include Manufacturing (12,182 | 15.8%), Health Care & Social Assistance (10,734 | 13.9%), Construction (9,056 | 11.8%), Retail Trade (8,491 | 11.0%), and Educational Services (6,512 | 8.5%).
Employment Industries by Sex in Wright County
The Wright County industries that see more men than women are Construction (91.3%), Mining, Quarrying, & Extraction (88.8%), and Utilities (77.3%), whereas the industries that tend to have a higher number of women are Health Care & Social Assistance (80.8%), Educational Services (69.6%), and Real Estate, Rental & Leasing (64.9%).

| Industry | Male | Female |
| Agriculture, Fishing & Hunting | 800 (73.8%) | 284 (26.2%) |
| Mining, Quarrying, & Extraction | 158 (88.8%) | 20 (11.2%) |
| Construction | 8,273 (91.3%) | 783 (8.6%) |
| Manufacturing | 8,309 (68.2%) | 3,873 (31.8%) |
| Wholesale Trade | 2,029 (75.9%) | 644 (24.1%) |
| Retail Trade | 4,493 (52.9%) | 3,998 (47.1%) |
| Transportation & Warehousing | 1,730 (72.7%) | 651 (27.3%) |
| Utilities | 582 (77.3%) | 171 (22.7%) |
| Information | 499 (61.5%) | 312 (38.5%) |
| Finance & Insurance | 1,921 (41.4%) | 2,715 (58.6%) |
| Real Estate, Rental & Leasing | 356 (35.1%) | 659 (64.9%) |
| Professional & Scientific | 2,264 (56.5%) | 1,745 (43.5%) |
| Enterprise Management | 121 (55.0%) | 99 (45.0%) |
| Administrative & Support | 1,154 (53.8%) | 991 (46.2%) |
| Educational Services | 1,979 (30.4%) | 4,533 (69.6%) |
| Health Care & Social Assistance | 2,058 (19.2%) | 8,676 (80.8%) |
| Arts, Entertainment & Recreation | 382 (49.3%) | 392 (50.6%) |
| Accommodation & Food Services | 1,892 (50.0%) | 1,893 (50.0%) |
| Public Administration | 738 (40.0%) | 1,106 (60.0%) |
| Total | 41,604 (54.0%) | 35,377 (46.0%) |
Education in Wright County
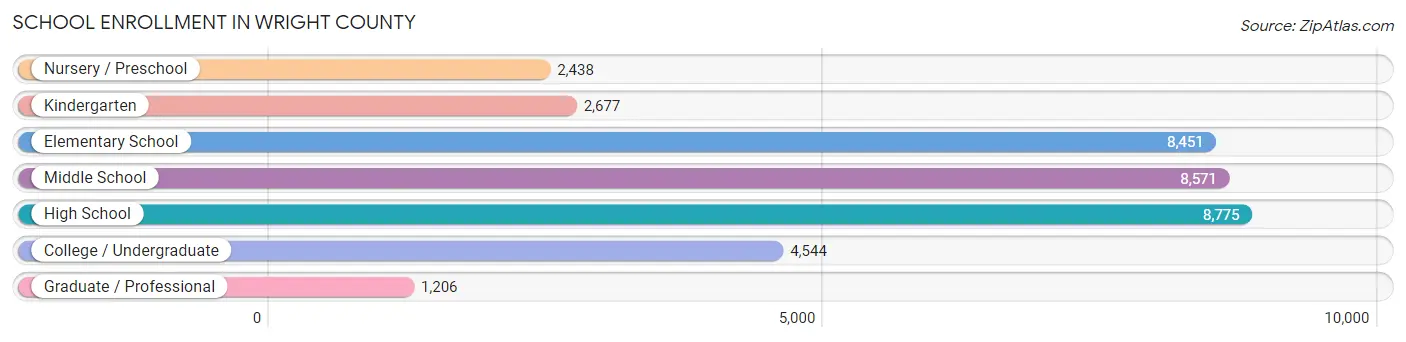
School Enrollment in Wright County
The most common levels of schooling among the 36,662 students in Wright County are high school (8,775 | 23.9%), middle school (8,571 | 23.4%), and elementary school (8,451 | 23.1%).
| School Level | # Students | % Students |
| Nursery / Preschool | 2,438 | 6.7% |
| Kindergarten | 2,677 | 7.3% |
| Elementary School | 8,451 | 23.1% |
| Middle School | 8,571 | 23.4% |
| High School | 8,775 | 23.9% |
| College / Undergraduate | 4,544 | 12.4% |
| Graduate / Professional | 1,206 | 3.3% |
| Total | 36,662 | 100.0% |
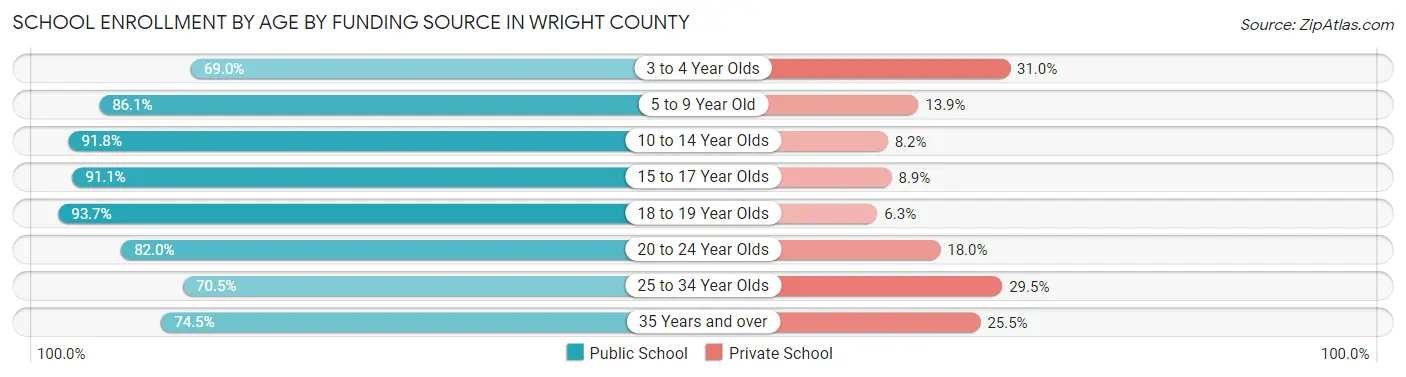
School Enrollment by Age by Funding Source in Wright County
Out of a total of 36,662 students who are enrolled in schools in Wright County, 4,693 (12.8%) attend a private institution, while the remaining 31,969 (87.2%) are enrolled in public schools. The age group of 3 to 4 year olds has the highest likelihood of being enrolled in private schools, with 481 (31.0% in the age bracket) enrolled. Conversely, the age group of 18 to 19 year olds has the lowest likelihood of being enrolled in a private school, with 2,031 (93.7% in the age bracket) attending a public institution.
| Age Bracket | Public School | Private School |
| 3 to 4 Year Olds | 1,071 (69.0%) | 481 (31.0%) |
| 5 to 9 Year Old | 9,246 (86.1%) | 1,494 (13.9%) |
| 10 to 14 Year Olds | 9,851 (91.8%) | 880 (8.2%) |
| 15 to 17 Year Olds | 6,128 (91.1%) | 600 (8.9%) |
| 18 to 19 Year Olds | 2,031 (93.7%) | 136 (6.3%) |
| 20 to 24 Year Olds | 1,759 (82.0%) | 386 (18.0%) |
| 25 to 34 Year Olds | 811 (70.5%) | 340 (29.5%) |
| 35 Years and over | 1,079 (74.5%) | 369 (25.5%) |
| Total | 31,969 (87.2%) | 4,693 (12.8%) |
Educational Attainment by Field of Study in Wright County
Business (8,716 | 26.3%), education (5,548 | 16.7%), science & technology (3,810 | 11.5%), arts & humanities (2,385 | 7.2%), and bio, nature & agricultural (2,127 | 6.4%) are the most common fields of study among 33,198 individuals in Wright County who have obtained a bachelor's degree or higher.
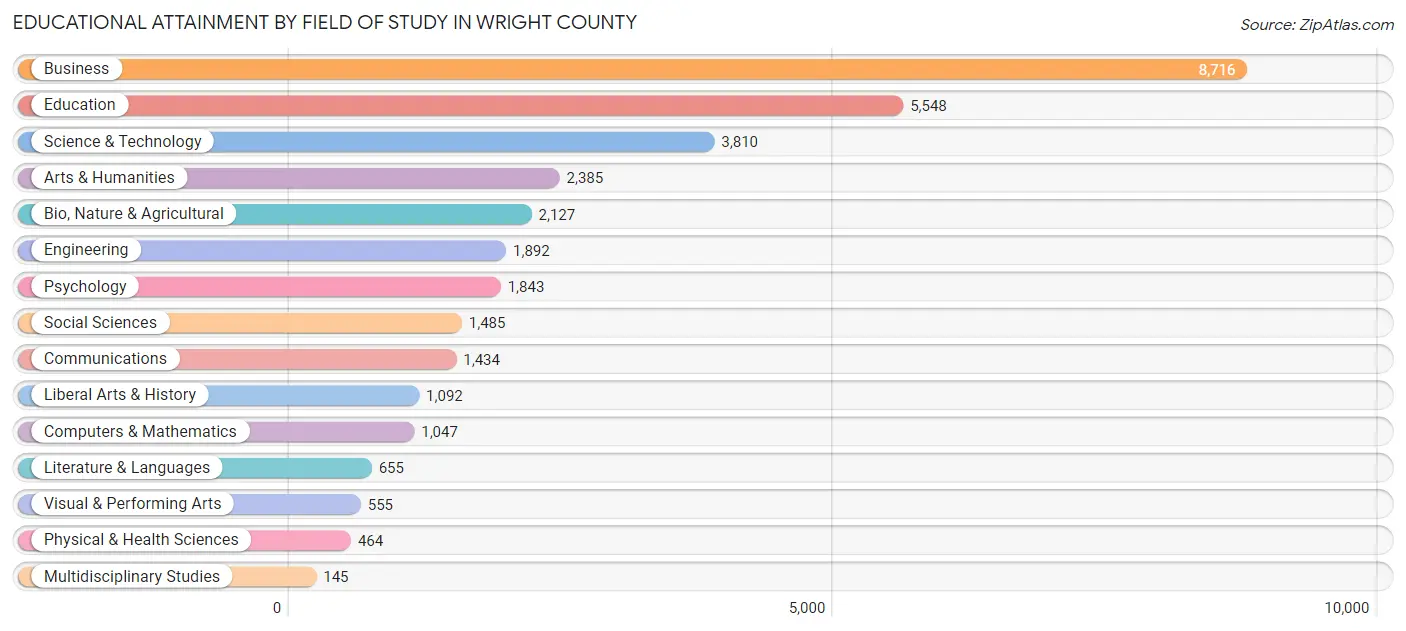
| Field of Study | # Graduates | % Graduates |
| Computers & Mathematics | 1,047 | 3.2% |
| Bio, Nature & Agricultural | 2,127 | 6.4% |
| Physical & Health Sciences | 464 | 1.4% |
| Psychology | 1,843 | 5.6% |
| Social Sciences | 1,485 | 4.5% |
| Engineering | 1,892 | 5.7% |
| Multidisciplinary Studies | 145 | 0.4% |
| Science & Technology | 3,810 | 11.5% |
| Business | 8,716 | 26.3% |
| Education | 5,548 | 16.7% |
| Literature & Languages | 655 | 2.0% |
| Liberal Arts & History | 1,092 | 3.3% |
| Visual & Performing Arts | 555 | 1.7% |
| Communications | 1,434 | 4.3% |
| Arts & Humanities | 2,385 | 7.2% |
| Total | 33,198 | 100.0% |
Transportation & Commute in Wright County
Vehicle Availability by Sex in Wright County
The most prevalent vehicle ownership categories in Wright County are males with 2 vehicles (16,987, accounting for 41.5%) and females with 2 vehicles (14,608, making up 49.0%).
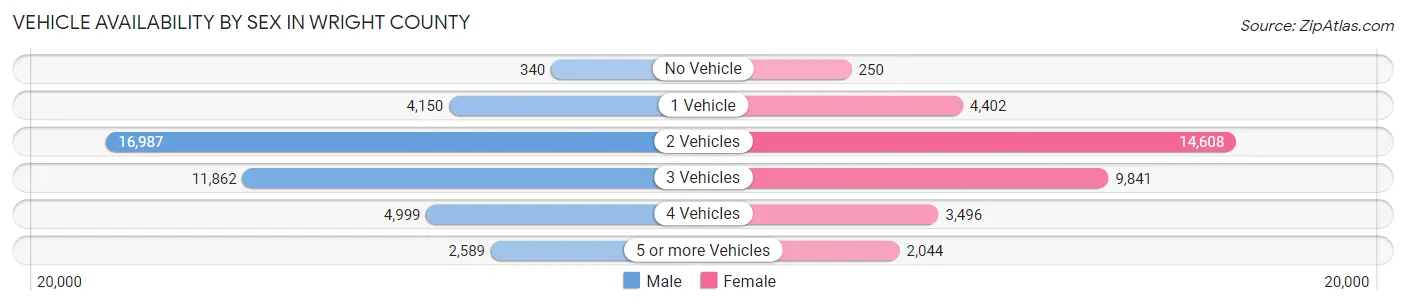
| Vehicles Available | Male | Female |
| No Vehicle | 340 (0.8%) | 250 (0.7%) |
| 1 Vehicle | 4,150 (10.1%) | 4,402 (12.7%) |
| 2 Vehicles | 16,987 (41.5%) | 14,608 (42.2%) |
| 3 Vehicles | 11,862 (29.0%) | 9,841 (28.4%) |
| 4 Vehicles | 4,999 (12.2%) | 3,496 (10.1%) |
| 5 or more Vehicles | 2,589 (6.3%) | 2,044 (5.9%) |
| Total | 40,927 (100.0%) | 34,641 (100.0%) |
Commute Time in Wright County
The most frequently occuring commute durations in Wright County are 45 to 59 minutes (8,933 commuters, 13.3%), 30 to 34 minutes (8,926 commuters, 13.3%), and 10 to 14 minutes (7,532 commuters, 11.2%).
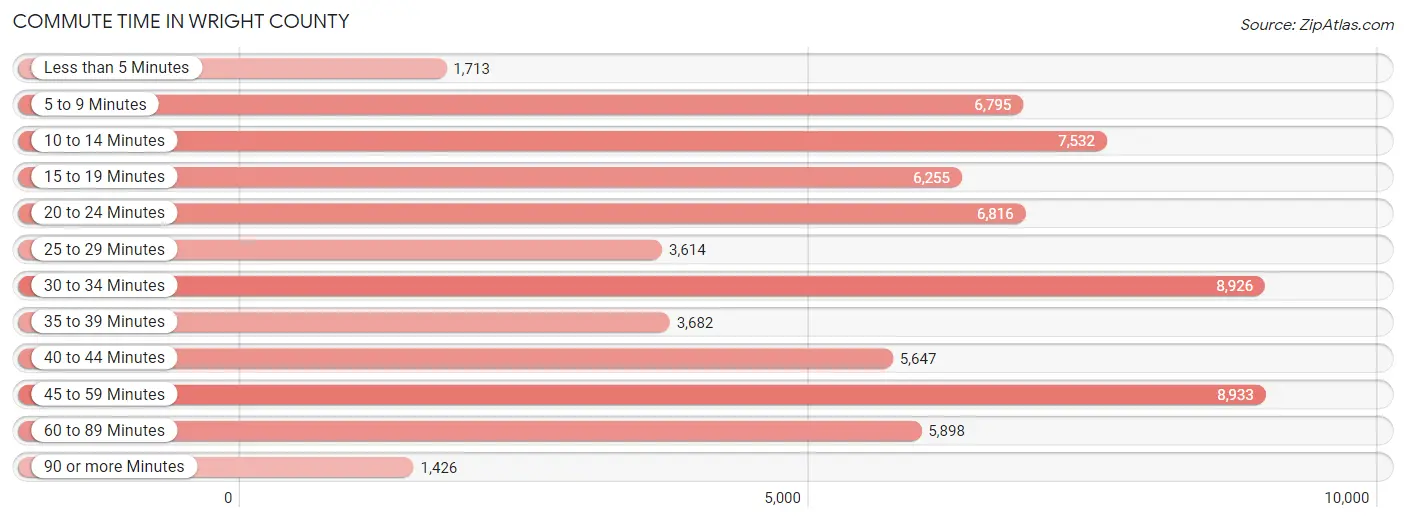
| Commute Time | # Commuters | % Commuters |
| Less than 5 Minutes | 1,713 | 2.5% |
| 5 to 9 Minutes | 6,795 | 10.1% |
| 10 to 14 Minutes | 7,532 | 11.2% |
| 15 to 19 Minutes | 6,255 | 9.3% |
| 20 to 24 Minutes | 6,816 | 10.1% |
| 25 to 29 Minutes | 3,614 | 5.4% |
| 30 to 34 Minutes | 8,926 | 13.3% |
| 35 to 39 Minutes | 3,682 | 5.5% |
| 40 to 44 Minutes | 5,647 | 8.4% |
| 45 to 59 Minutes | 8,933 | 13.3% |
| 60 to 89 Minutes | 5,898 | 8.8% |
| 90 or more Minutes | 1,426 | 2.1% |
Commute Time by Sex in Wright County
The most common commute times in Wright County are 45 to 59 minutes (5,190 commuters, 14.0%) for males and 30 to 34 minutes (3,837 commuters, 12.7%) for females.
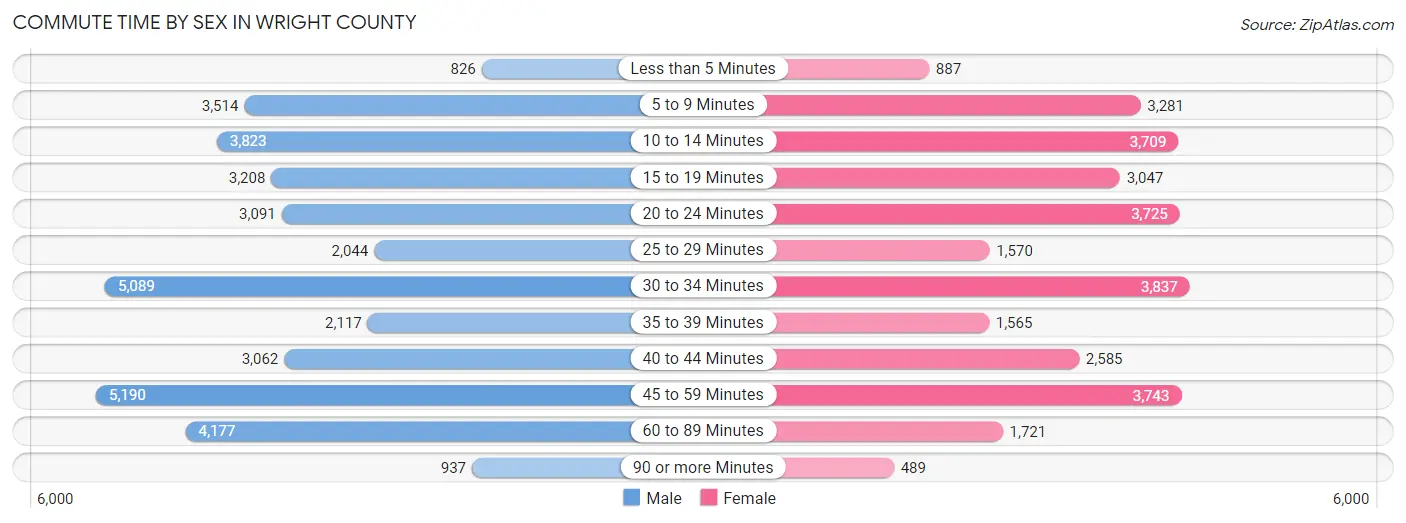
| Commute Time | Male | Female |
| Less than 5 Minutes | 826 (2.2%) | 887 (2.9%) |
| 5 to 9 Minutes | 3,514 (9.5%) | 3,281 (10.9%) |
| 10 to 14 Minutes | 3,823 (10.3%) | 3,709 (12.3%) |
| 15 to 19 Minutes | 3,208 (8.6%) | 3,047 (10.1%) |
| 20 to 24 Minutes | 3,091 (8.3%) | 3,725 (12.3%) |
| 25 to 29 Minutes | 2,044 (5.5%) | 1,570 (5.2%) |
| 30 to 34 Minutes | 5,089 (13.7%) | 3,837 (12.7%) |
| 35 to 39 Minutes | 2,117 (5.7%) | 1,565 (5.2%) |
| 40 to 44 Minutes | 3,062 (8.3%) | 2,585 (8.6%) |
| 45 to 59 Minutes | 5,190 (14.0%) | 3,743 (12.4%) |
| 60 to 89 Minutes | 4,177 (11.3%) | 1,721 (5.7%) |
| 90 or more Minutes | 937 (2.5%) | 489 (1.6%) |
Time of Departure to Work by Sex in Wright County
The most frequent times of departure to work in Wright County are 7:00 AM to 7:29 AM (5,585, 15.1%) for males and 7:00 AM to 7:29 AM (5,712, 18.9%) for females.
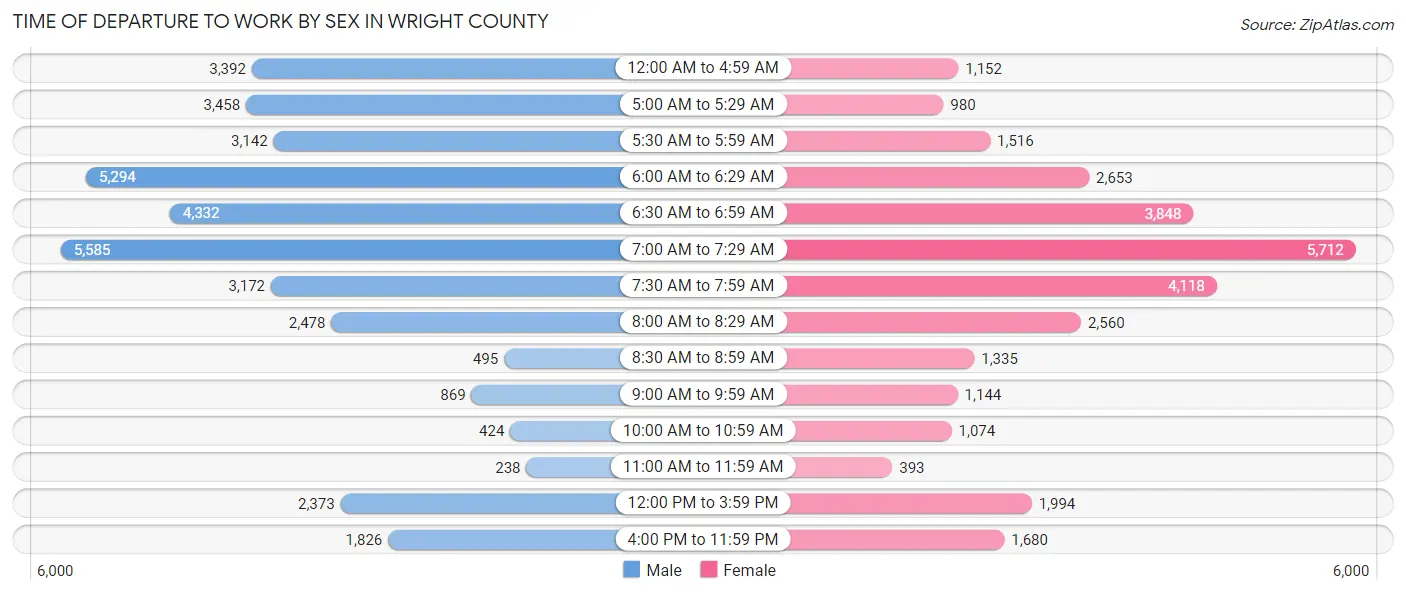
| Time of Departure | Male | Female |
| 12:00 AM to 4:59 AM | 3,392 (9.1%) | 1,152 (3.8%) |
| 5:00 AM to 5:29 AM | 3,458 (9.3%) | 980 (3.3%) |
| 5:30 AM to 5:59 AM | 3,142 (8.5%) | 1,516 (5.0%) |
| 6:00 AM to 6:29 AM | 5,294 (14.3%) | 2,653 (8.8%) |
| 6:30 AM to 6:59 AM | 4,332 (11.7%) | 3,848 (12.8%) |
| 7:00 AM to 7:29 AM | 5,585 (15.1%) | 5,712 (18.9%) |
| 7:30 AM to 7:59 AM | 3,172 (8.6%) | 4,118 (13.7%) |
| 8:00 AM to 8:29 AM | 2,478 (6.7%) | 2,560 (8.5%) |
| 8:30 AM to 8:59 AM | 495 (1.3%) | 1,335 (4.4%) |
| 9:00 AM to 9:59 AM | 869 (2.3%) | 1,144 (3.8%) |
| 10:00 AM to 10:59 AM | 424 (1.1%) | 1,074 (3.6%) |
| 11:00 AM to 11:59 AM | 238 (0.6%) | 393 (1.3%) |
| 12:00 PM to 3:59 PM | 2,373 (6.4%) | 1,994 (6.6%) |
| 4:00 PM to 11:59 PM | 1,826 (4.9%) | 1,680 (5.6%) |
| Total | 37,078 (100.0%) | 30,159 (100.0%) |
Housing Occupancy in Wright County
Occupancy by Ownership in Wright County
Of the total 51,523 dwellings in Wright County, owner-occupied units account for 42,848 (83.2%), while renter-occupied units make up 8,675 (16.8%).
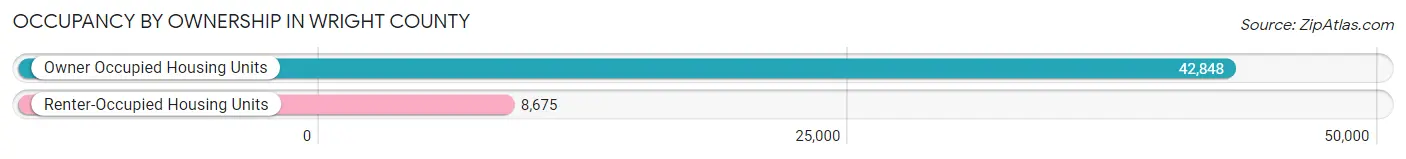
| Occupancy | # Housing Units | % Housing Units |
| Owner Occupied Housing Units | 42,848 | 83.2% |
| Renter-Occupied Housing Units | 8,675 | 16.8% |
| Total Occupied Housing Units | 51,523 | 100.0% |
Occupancy by Household Size in Wright County
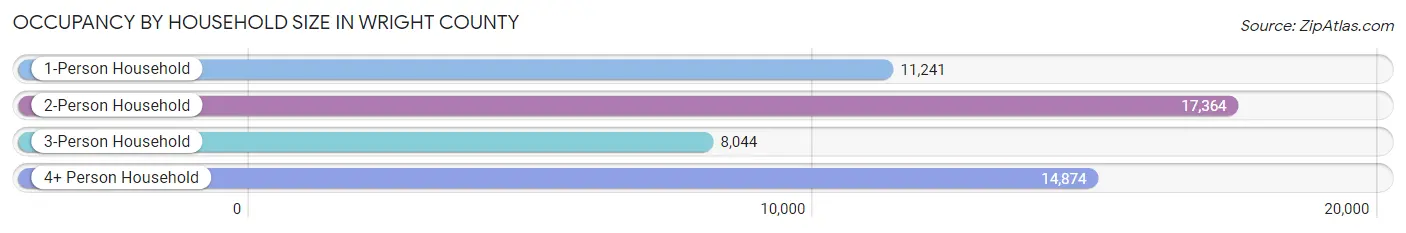
| Household Size | # Housing Units | % Housing Units |
| 1-Person Household | 11,241 | 21.8% |
| 2-Person Household | 17,364 | 33.7% |
| 3-Person Household | 8,044 | 15.6% |
| 4+ Person Household | 14,874 | 28.9% |
| Total Housing Units | 51,523 | 100.0% |
Occupancy by Ownership by Household Size in Wright County
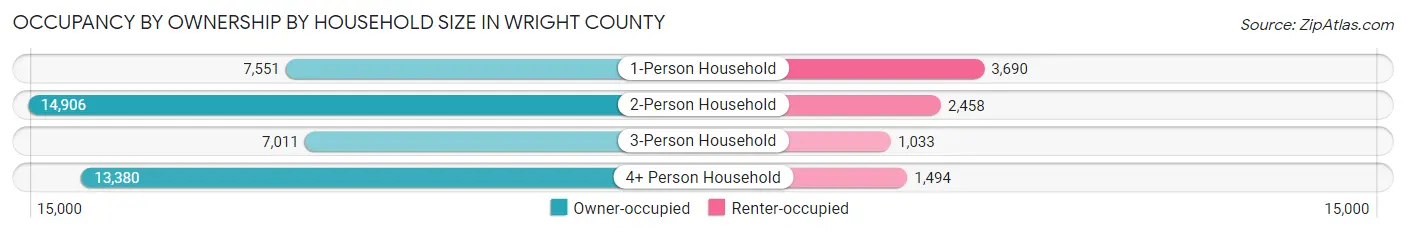
| Household Size | Owner-occupied | Renter-occupied |
| 1-Person Household | 7,551 (67.2%) | 3,690 (32.8%) |
| 2-Person Household | 14,906 (85.8%) | 2,458 (14.2%) |
| 3-Person Household | 7,011 (87.2%) | 1,033 (12.8%) |
| 4+ Person Household | 13,380 (90.0%) | 1,494 (10.0%) |
| Total Housing Units | 42,848 (83.2%) | 8,675 (16.8%) |
Occupancy by Educational Attainment in Wright County
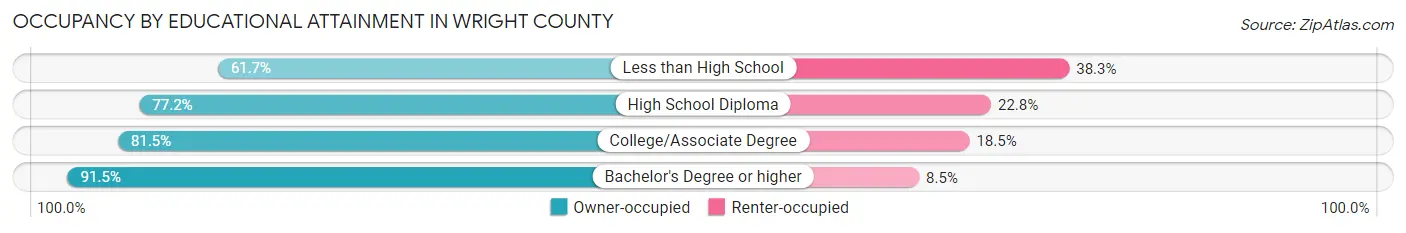
| Household Size | Owner-occupied | Renter-occupied |
| Less than High School | 1,381 (61.7%) | 857 (38.3%) |
| High School Diploma | 9,872 (77.2%) | 2,911 (22.8%) |
| College/Associate Degree | 14,676 (81.5%) | 3,331 (18.5%) |
| Bachelor's Degree or higher | 16,919 (91.5%) | 1,576 (8.5%) |
Occupancy by Age of Householder in Wright County
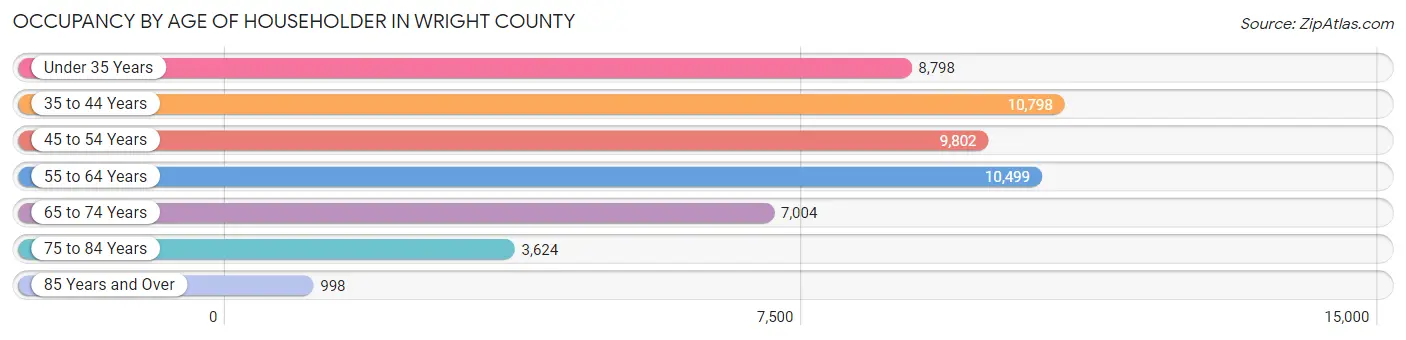
| Age Bracket | # Households | % Households |
| Under 35 Years | 8,798 | 17.1% |
| 35 to 44 Years | 10,798 | 21.0% |
| 45 to 54 Years | 9,802 | 19.0% |
| 55 to 64 Years | 10,499 | 20.4% |
| 65 to 74 Years | 7,004 | 13.6% |
| 75 to 84 Years | 3,624 | 7.0% |
| 85 Years and Over | 998 | 1.9% |
| Total | 51,523 | 100.0% |
Housing Finances in Wright County
Median Income by Occupancy in Wright County
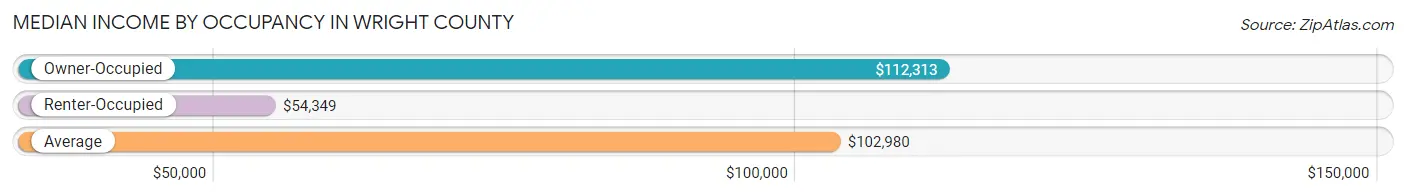
| Occupancy Type | # Households | Median Income |
| Owner-Occupied | 42,848 (83.2%) | $112,313 |
| Renter-Occupied | 8,675 (16.8%) | $54,349 |
| Average | 51,523 (100.0%) | $102,980 |
Occupancy by Householder Income Bracket in Wright County
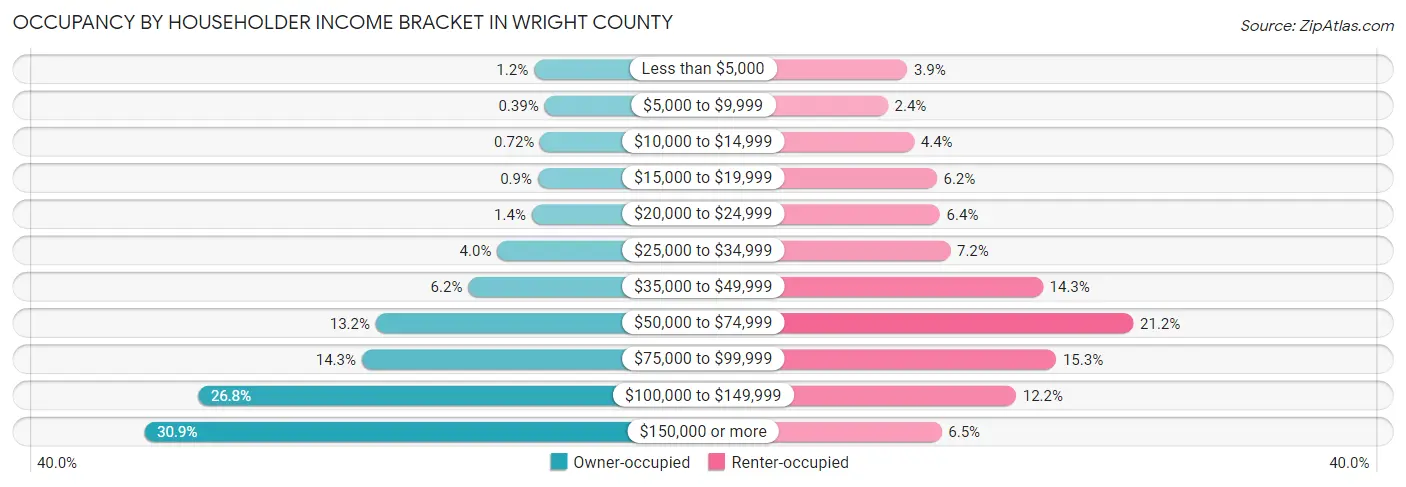
| Income Bracket | Owner-occupied | Renter-occupied |
| Less than $5,000 | 511 (1.2%) | 340 (3.9%) |
| $5,000 to $9,999 | 168 (0.4%) | 212 (2.4%) |
| $10,000 to $14,999 | 309 (0.7%) | 385 (4.4%) |
| $15,000 to $19,999 | 384 (0.9%) | 535 (6.2%) |
| $20,000 to $24,999 | 584 (1.4%) | 556 (6.4%) |
| $25,000 to $34,999 | 1,708 (4.0%) | 625 (7.2%) |
| $35,000 to $49,999 | 2,657 (6.2%) | 1,236 (14.2%) |
| $50,000 to $74,999 | 5,674 (13.2%) | 1,835 (21.1%) |
| $75,000 to $99,999 | 6,130 (14.3%) | 1,325 (15.3%) |
| $100,000 to $149,999 | 11,484 (26.8%) | 1,059 (12.2%) |
| $150,000 or more | 13,239 (30.9%) | 567 (6.5%) |
| Total | 42,848 (100.0%) | 8,675 (100.0%) |
Monthly Housing Cost Tiers in Wright County
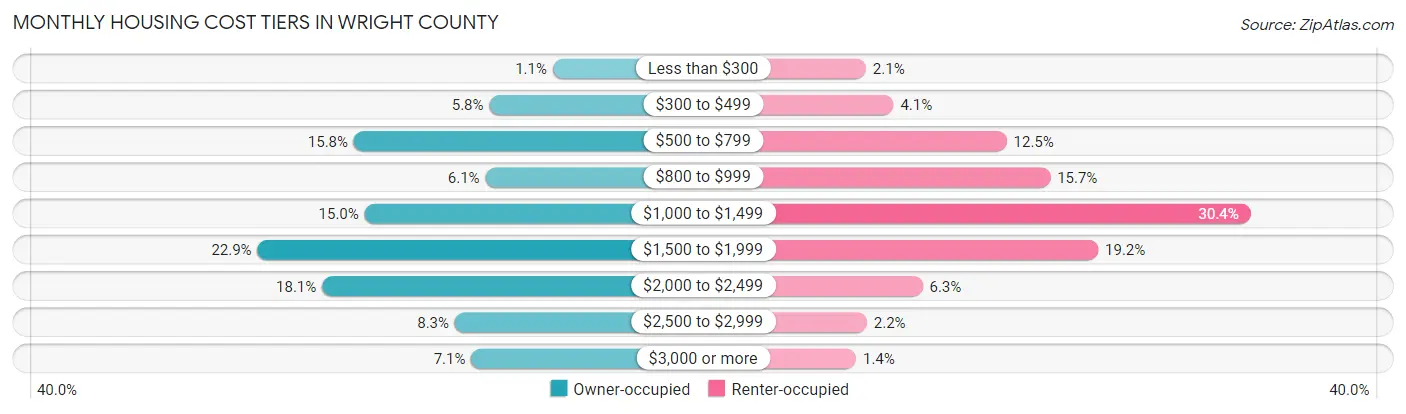
| Monthly Cost | Owner-occupied | Renter-occupied |
| Less than $300 | 471 (1.1%) | 182 (2.1%) |
| $300 to $499 | 2,472 (5.8%) | 358 (4.1%) |
| $500 to $799 | 6,750 (15.8%) | 1,081 (12.5%) |
| $800 to $999 | 2,595 (6.1%) | 1,359 (15.7%) |
| $1,000 to $1,499 | 6,411 (15.0%) | 2,640 (30.4%) |
| $1,500 to $1,999 | 9,791 (22.9%) | 1,666 (19.2%) |
| $2,000 to $2,499 | 7,752 (18.1%) | 544 (6.3%) |
| $2,500 to $2,999 | 3,562 (8.3%) | 188 (2.2%) |
| $3,000 or more | 3,044 (7.1%) | 119 (1.4%) |
| Total | 42,848 (100.0%) | 8,675 (100.0%) |
Physical Housing Characteristics in Wright County
Housing Structures in Wright County
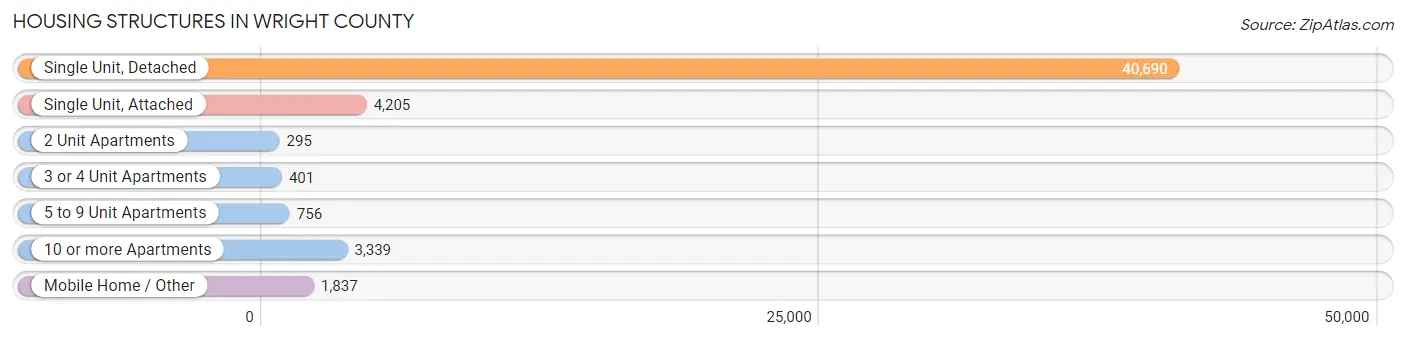
| Structure Type | # Housing Units | % Housing Units |
| Single Unit, Detached | 40,690 | 79.0% |
| Single Unit, Attached | 4,205 | 8.2% |
| 2 Unit Apartments | 295 | 0.6% |
| 3 or 4 Unit Apartments | 401 | 0.8% |
| 5 to 9 Unit Apartments | 756 | 1.5% |
| 10 or more Apartments | 3,339 | 6.5% |
| Mobile Home / Other | 1,837 | 3.6% |
| Total | 51,523 | 100.0% |
Housing Structures by Occupancy in Wright County
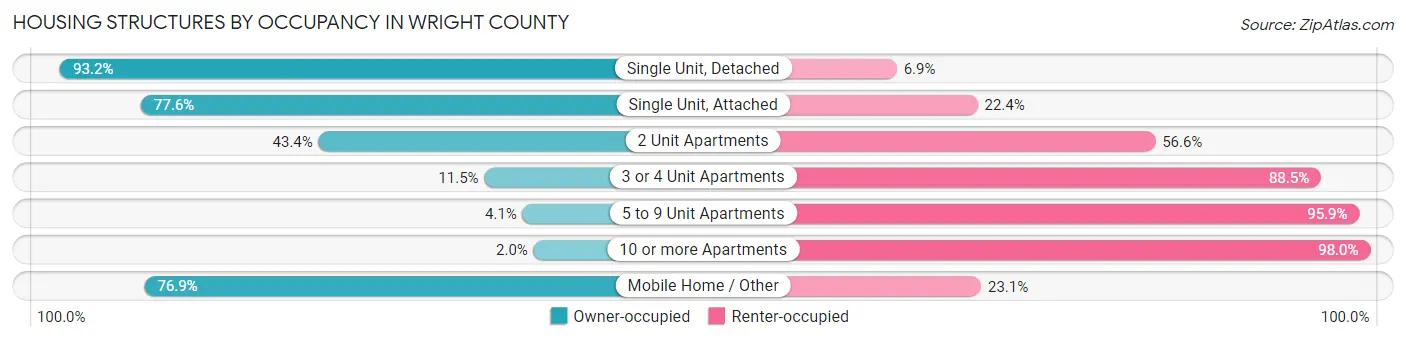
| Structure Type | Owner-occupied | Renter-occupied |
| Single Unit, Detached | 37,901 (93.1%) | 2,789 (6.9%) |
| Single Unit, Attached | 3,263 (77.6%) | 942 (22.4%) |
| 2 Unit Apartments | 128 (43.4%) | 167 (56.6%) |
| 3 or 4 Unit Apartments | 46 (11.5%) | 355 (88.5%) |
| 5 to 9 Unit Apartments | 31 (4.1%) | 725 (95.9%) |
| 10 or more Apartments | 66 (2.0%) | 3,273 (98.0%) |
| Mobile Home / Other | 1,413 (76.9%) | 424 (23.1%) |
| Total | 42,848 (83.2%) | 8,675 (16.8%) |
Housing Structures by Number of Rooms in Wright County
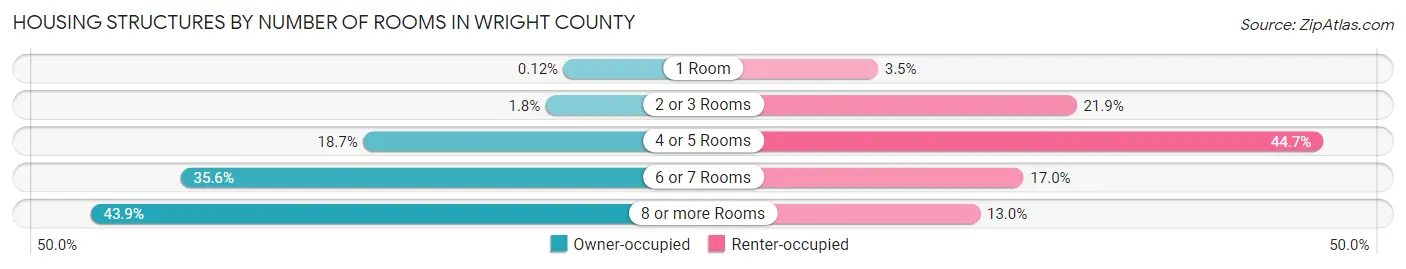
| Number of Rooms | Owner-occupied | Renter-occupied |
| 1 Room | 51 (0.1%) | 304 (3.5%) |
| 2 or 3 Rooms | 757 (1.8%) | 1,898 (21.9%) |
| 4 or 5 Rooms | 7,991 (18.6%) | 3,877 (44.7%) |
| 6 or 7 Rooms | 15,240 (35.6%) | 1,472 (17.0%) |
| 8 or more Rooms | 18,809 (43.9%) | 1,124 (13.0%) |
| Total | 42,848 (100.0%) | 8,675 (100.0%) |
Housing Structure by Heating Type in Wright County
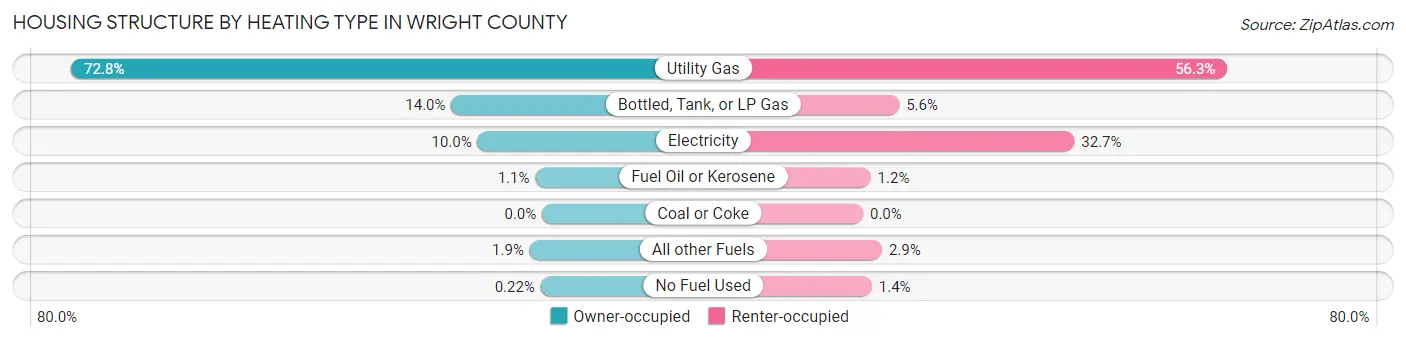
| Heating Type | Owner-occupied | Renter-occupied |
| Utility Gas | 31,198 (72.8%) | 4,883 (56.3%) |
| Bottled, Tank, or LP Gas | 6,012 (14.0%) | 485 (5.6%) |
| Electricity | 4,276 (10.0%) | 2,834 (32.7%) |
| Fuel Oil or Kerosene | 450 (1.1%) | 102 (1.2%) |
| Coal or Coke | 0 (0.0%) | 0 (0.0%) |
| All other Fuels | 817 (1.9%) | 253 (2.9%) |
| No Fuel Used | 95 (0.2%) | 118 (1.4%) |
| Total | 42,848 (100.0%) | 8,675 (100.0%) |
Household Vehicle Usage in Wright County
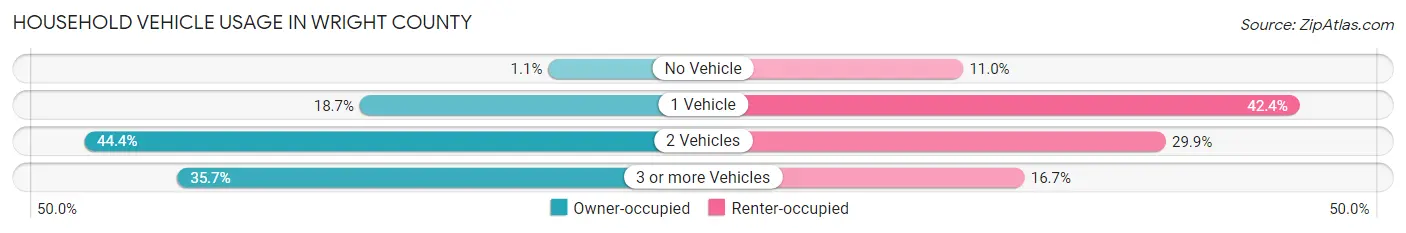
| Vehicles per Household | Owner-occupied | Renter-occupied |
| No Vehicle | 478 (1.1%) | 952 (11.0%) |
| 1 Vehicle | 8,015 (18.7%) | 3,682 (42.4%) |
| 2 Vehicles | 19,040 (44.4%) | 2,592 (29.9%) |
| 3 or more Vehicles | 15,315 (35.7%) | 1,449 (16.7%) |
| Total | 42,848 (100.0%) | 8,675 (100.0%) |
Real Estate & Mortgages in Wright County
Real Estate and Mortgage Overview in Wright County
| Characteristic | Without Mortgage | With Mortgage |
| Housing Units | 12,252 | 30,596 |
| Median Property Value | $291,600 | $318,300 |
| Median Household Income | $81,797 | $11,143 |
| Monthly Housing Costs | $648 | $2,980 |
| Real Estate Taxes | $2,921 | $350 |
Property Value by Mortgage Status in Wright County
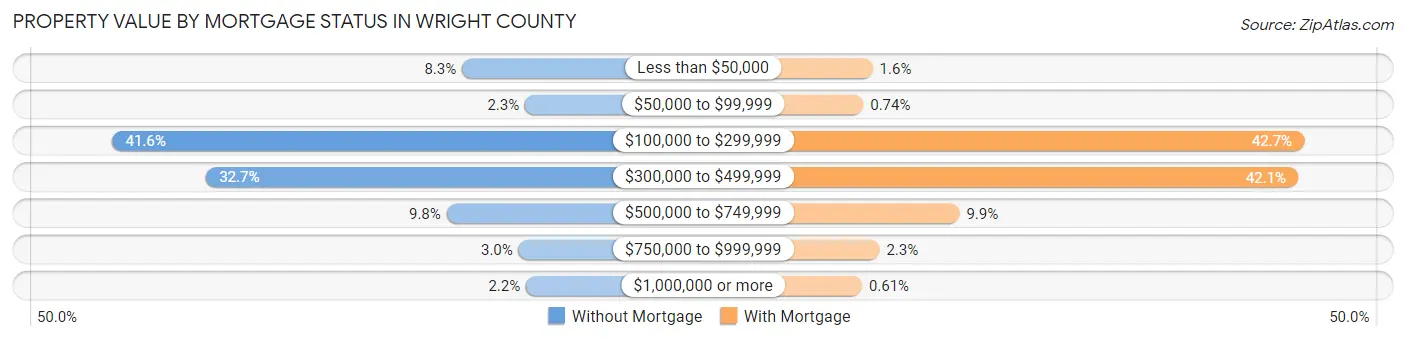
| Property Value | Without Mortgage | With Mortgage |
| Less than $50,000 | 1,022 (8.3%) | 500 (1.6%) |
| $50,000 to $99,999 | 287 (2.3%) | 225 (0.7%) |
| $100,000 to $299,999 | 5,099 (41.6%) | 13,063 (42.7%) |
| $300,000 to $499,999 | 4,006 (32.7%) | 12,891 (42.1%) |
| $500,000 to $749,999 | 1,202 (9.8%) | 3,030 (9.9%) |
| $750,000 to $999,999 | 361 (2.9%) | 699 (2.3%) |
| $1,000,000 or more | 275 (2.2%) | 188 (0.6%) |
| Total | 12,252 (100.0%) | 30,596 (100.0%) |
Household Income by Mortgage Status in Wright County
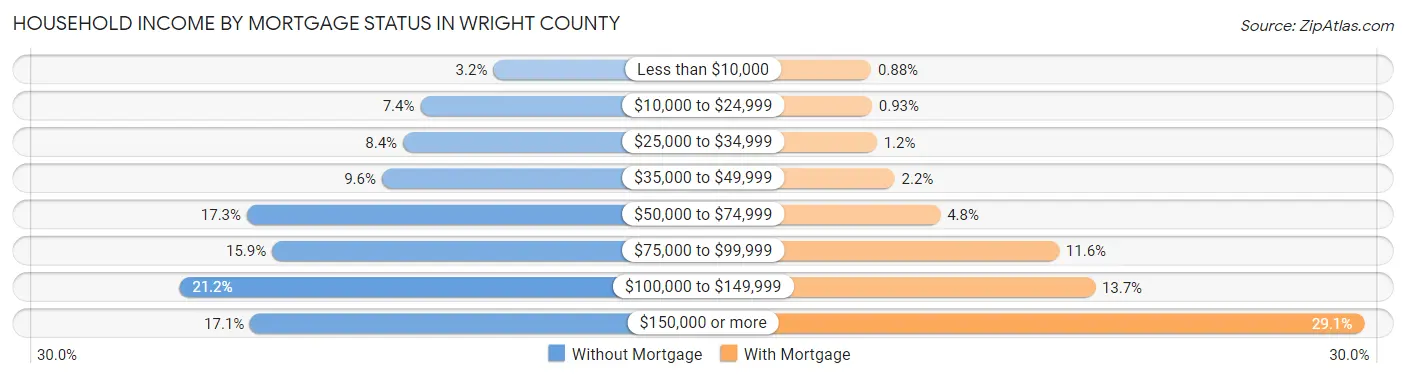
| Household Income | Without Mortgage | With Mortgage |
| Less than $10,000 | 394 (3.2%) | 268 (0.9%) |
| $10,000 to $24,999 | 906 (7.4%) | 285 (0.9%) |
| $25,000 to $34,999 | 1,027 (8.4%) | 371 (1.2%) |
| $35,000 to $49,999 | 1,175 (9.6%) | 681 (2.2%) |
| $50,000 to $74,999 | 2,119 (17.3%) | 1,482 (4.8%) |
| $75,000 to $99,999 | 1,943 (15.9%) | 3,555 (11.6%) |
| $100,000 to $149,999 | 2,592 (21.2%) | 4,187 (13.7%) |
| $150,000 or more | 2,096 (17.1%) | 8,892 (29.1%) |
| Total | 12,252 (100.0%) | 30,596 (100.0%) |
Property Value to Household Income Ratio in Wright County
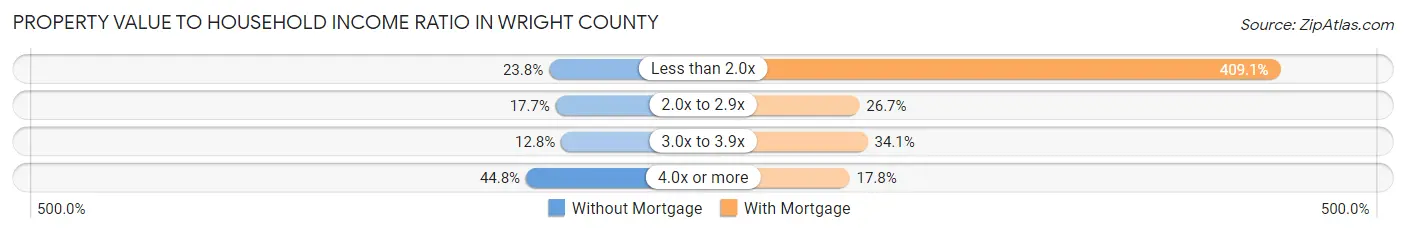
| Value-to-Income Ratio | Without Mortgage | With Mortgage |
| Less than 2.0x | 2,921 (23.8%) | 125,163 (409.1%) |
| 2.0x to 2.9x | 2,172 (17.7%) | 8,172 (26.7%) |
| 3.0x to 3.9x | 1,571 (12.8%) | 10,446 (34.1%) |
| 4.0x or more | 5,483 (44.8%) | 5,455 (17.8%) |
| Total | 12,252 (100.0%) | 30,596 (100.0%) |
Real Estate Taxes by Mortgage Status in Wright County

| Property Taxes | Without Mortgage | With Mortgage |
| Less than $800 | 1,087 (8.9%) | 48 (0.2%) |
| $800 to $1,499 | 574 (4.7%) | 682 (2.2%) |
| $800 to $1,499 | 10,377 (84.7%) | 1,639 (5.4%) |
| Total | 12,252 (100.0%) | 30,596 (100.0%) |
Health & Disability in Wright County
Health Insurance Coverage by Age in Wright County
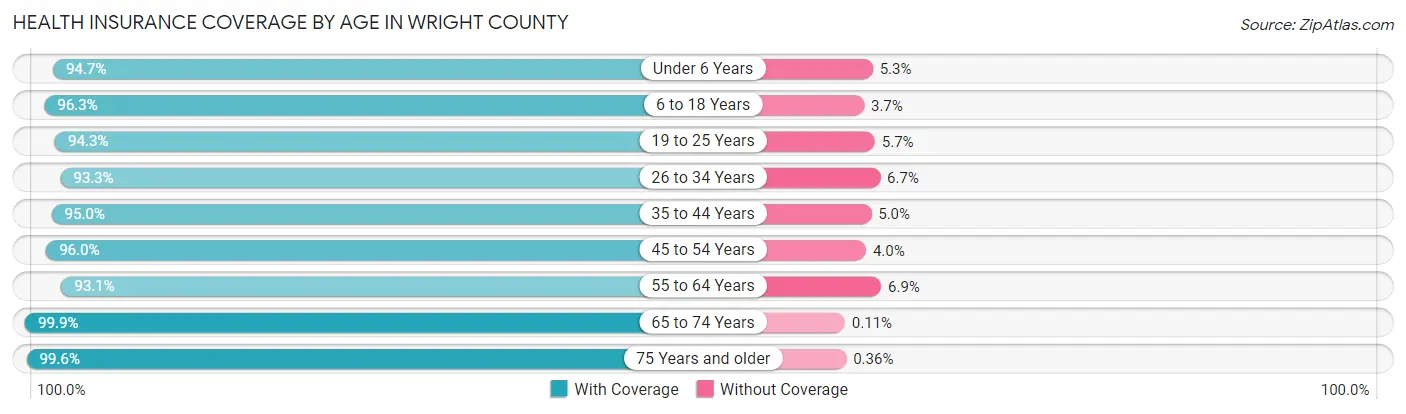
| Age Bracket | With Coverage | Without Coverage |
| Under 6 Years | 11,324 (94.7%) | 634 (5.3%) |
| 6 to 18 Years | 27,875 (96.3%) | 1,065 (3.7%) |
| 19 to 25 Years | 9,399 (94.3%) | 568 (5.7%) |
| 26 to 34 Years | 14,547 (93.3%) | 1,039 (6.7%) |
| 35 to 44 Years | 19,474 (95.0%) | 1,032 (5.0%) |
| 45 to 54 Years | 18,254 (96.0%) | 769 (4.0%) |
| 55 to 64 Years | 16,487 (93.1%) | 1,215 (6.9%) |
| 65 to 74 Years | 11,143 (99.9%) | 12 (0.1%) |
| 75 Years and older | 6,947 (99.6%) | 25 (0.4%) |
| Total | 135,450 (95.5%) | 6,359 (4.5%) |
Health Insurance Coverage by Citizenship Status in Wright County
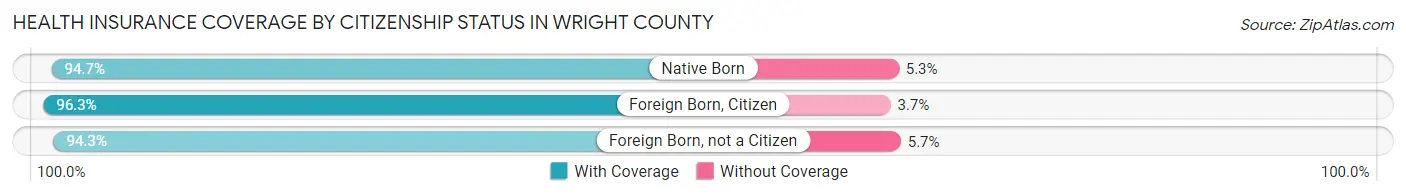
| Citizenship Status | With Coverage | Without Coverage |
| Native Born | 11,324 (94.7%) | 634 (5.3%) |
| Foreign Born, Citizen | 27,875 (96.3%) | 1,065 (3.7%) |
| Foreign Born, not a Citizen | 9,399 (94.3%) | 568 (5.7%) |
Health Insurance Coverage by Household Income in Wright County
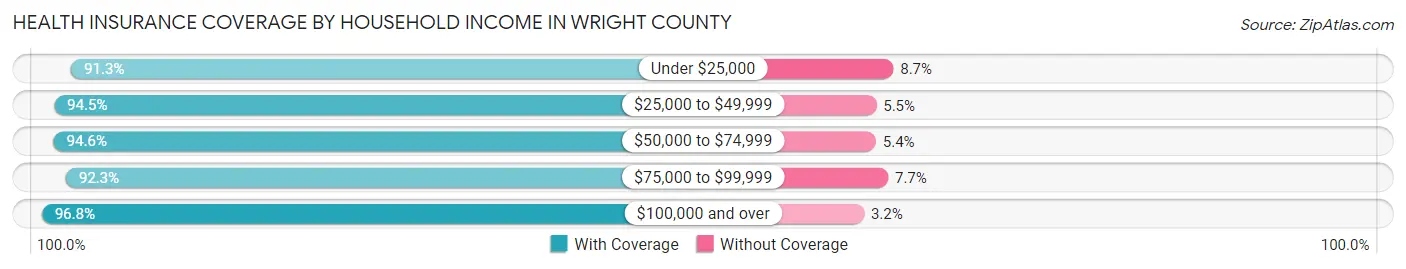
| Household Income | With Coverage | Without Coverage |
| Under $25,000 | 5,019 (91.3%) | 479 (8.7%) |
| $25,000 to $49,999 | 10,692 (94.5%) | 625 (5.5%) |
| $50,000 to $74,999 | 15,338 (94.6%) | 882 (5.4%) |
| $75,000 to $99,999 | 17,866 (92.3%) | 1,496 (7.7%) |
| $100,000 and over | 86,101 (96.8%) | 2,869 (3.2%) |
Public vs Private Health Insurance Coverage by Age in Wright County
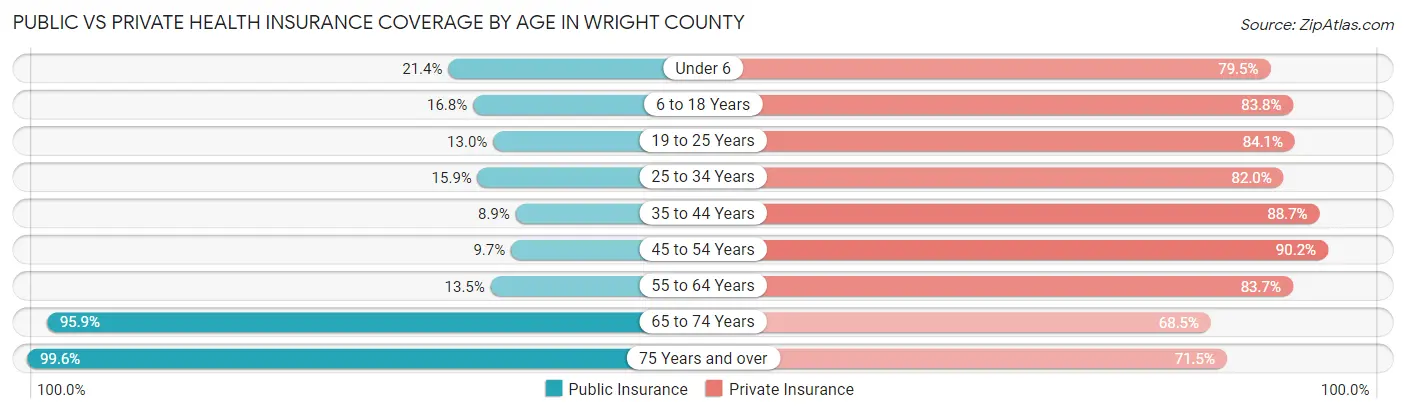
| Age Bracket | Public Insurance | Private Insurance |
| Under 6 | 2,553 (21.3%) | 9,510 (79.5%) |
| 6 to 18 Years | 4,849 (16.8%) | 24,254 (83.8%) |
| 19 to 25 Years | 1,299 (13.0%) | 8,381 (84.1%) |
| 25 to 34 Years | 2,480 (15.9%) | 12,780 (82.0%) |
| 35 to 44 Years | 1,817 (8.9%) | 18,178 (88.6%) |
| 45 to 54 Years | 1,847 (9.7%) | 17,163 (90.2%) |
| 55 to 64 Years | 2,390 (13.5%) | 14,815 (83.7%) |
| 65 to 74 Years | 10,696 (95.9%) | 7,641 (68.5%) |
| 75 Years and over | 6,941 (99.6%) | 4,982 (71.5%) |
| Total | 34,872 (24.6%) | 117,704 (83.0%) |
Disability Status by Sex by Age in Wright County
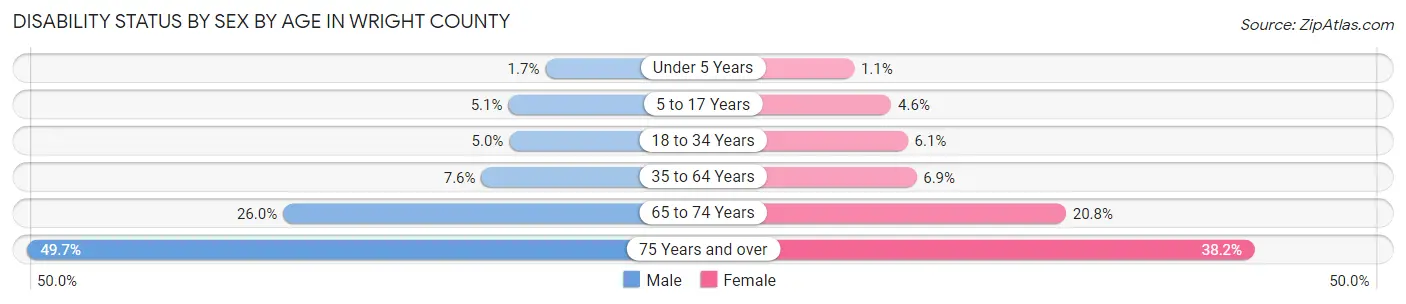
| Age Bracket | Male | Female |
| Under 5 Years | 87 (1.7%) | 49 (1.1%) |
| 5 to 17 Years | 779 (5.1%) | 659 (4.6%) |
| 18 to 34 Years | 703 (5.0%) | 816 (6.1%) |
| 35 to 64 Years | 2,252 (7.6%) | 1,911 (6.9%) |
| 65 to 74 Years | 1,407 (26.0%) | 1,195 (20.8%) |
| 75 Years and over | 1,570 (49.7%) | 1,459 (38.2%) |
Disability Class by Sex by Age in Wright County
Disability Class: Hearing Difficulty
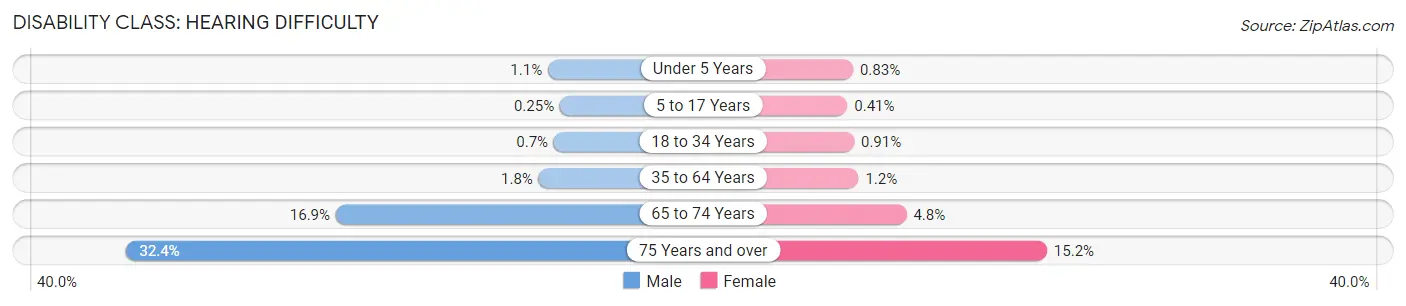
| Age Bracket | Male | Female |
| Under 5 Years | 59 (1.1%) | 36 (0.8%) |
| 5 to 17 Years | 38 (0.3%) | 59 (0.4%) |
| 18 to 34 Years | 98 (0.7%) | 121 (0.9%) |
| 35 to 64 Years | 541 (1.8%) | 343 (1.2%) |
| 65 to 74 Years | 913 (16.9%) | 276 (4.8%) |
| 75 Years and over | 1,024 (32.4%) | 581 (15.2%) |
Disability Class: Vision Difficulty
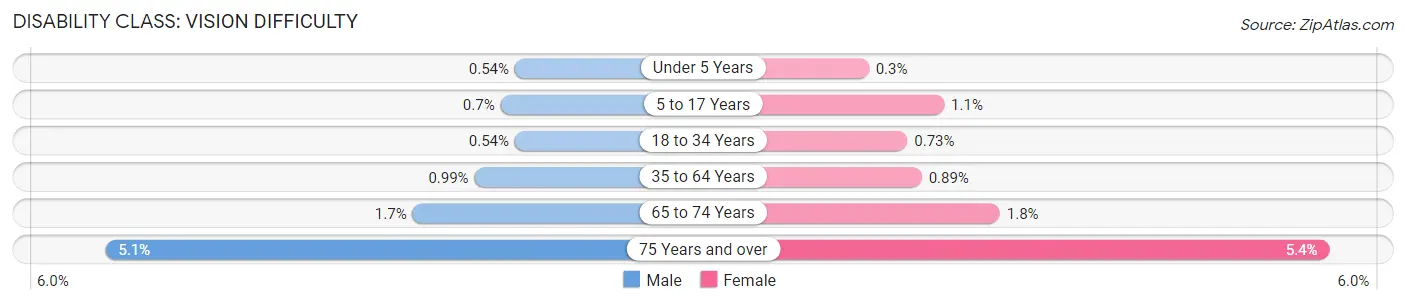
| Age Bracket | Male | Female |
| Under 5 Years | 28 (0.5%) | 13 (0.3%) |
| 5 to 17 Years | 107 (0.7%) | 164 (1.1%) |
| 18 to 34 Years | 76 (0.5%) | 98 (0.7%) |
| 35 to 64 Years | 294 (1.0%) | 245 (0.9%) |
| 65 to 74 Years | 91 (1.7%) | 101 (1.8%) |
| 75 Years and over | 161 (5.1%) | 207 (5.4%) |
Disability Class: Cognitive Difficulty
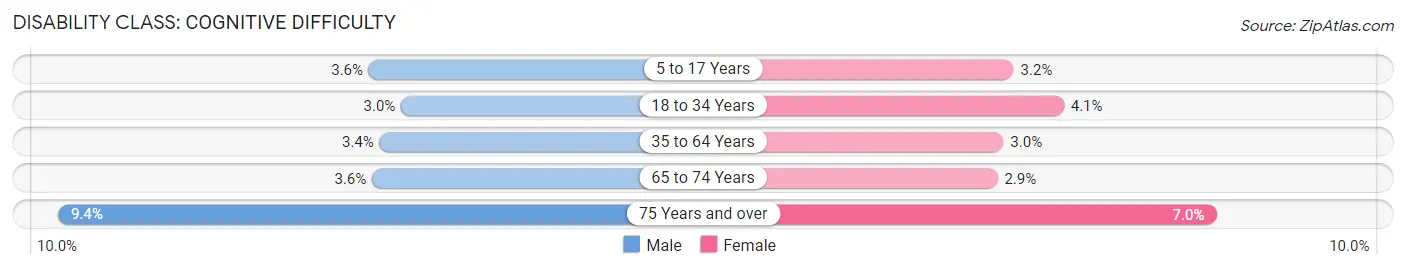
| Age Bracket | Male | Female |
| 5 to 17 Years | 550 (3.6%) | 459 (3.2%) |
| 18 to 34 Years | 421 (3.0%) | 551 (4.1%) |
| 35 to 64 Years | 1,010 (3.4%) | 828 (3.0%) |
| 65 to 74 Years | 192 (3.5%) | 166 (2.9%) |
| 75 Years and over | 296 (9.4%) | 265 (7.0%) |
Disability Class: Ambulatory Difficulty
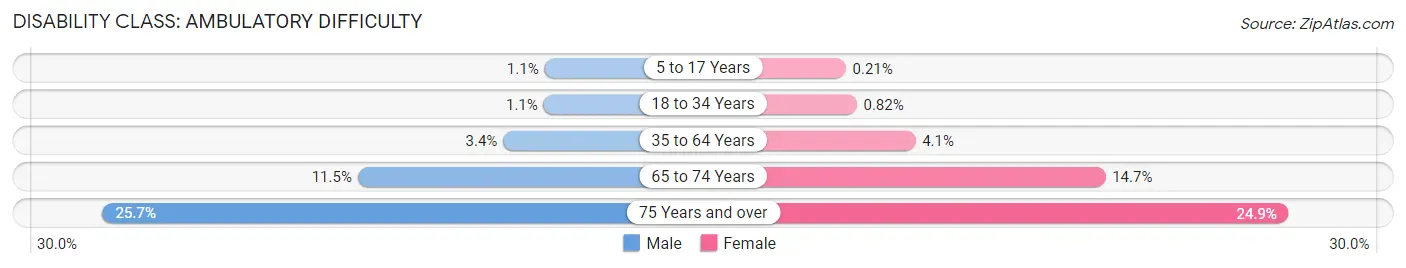
| Age Bracket | Male | Female |
| 5 to 17 Years | 160 (1.1%) | 30 (0.2%) |
| 18 to 34 Years | 154 (1.1%) | 110 (0.8%) |
| 35 to 64 Years | 991 (3.4%) | 1,131 (4.1%) |
| 65 to 74 Years | 619 (11.5%) | 843 (14.7%) |
| 75 Years and over | 810 (25.7%) | 949 (24.9%) |
Disability Class: Self-Care Difficulty
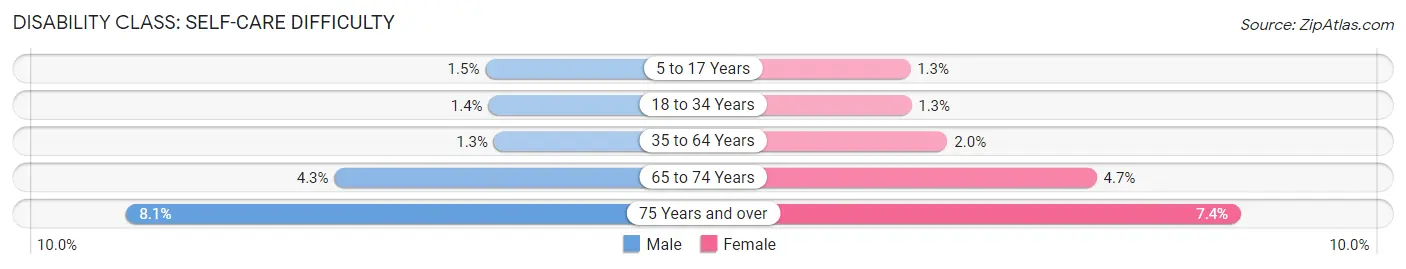
| Age Bracket | Male | Female |
| 5 to 17 Years | 221 (1.5%) | 183 (1.3%) |
| 18 to 34 Years | 194 (1.4%) | 173 (1.3%) |
| 35 to 64 Years | 382 (1.3%) | 541 (2.0%) |
| 65 to 74 Years | 230 (4.3%) | 272 (4.7%) |
| 75 Years and over | 256 (8.1%) | 282 (7.4%) |
Technology Access in Wright County
Computing Device Access in Wright County
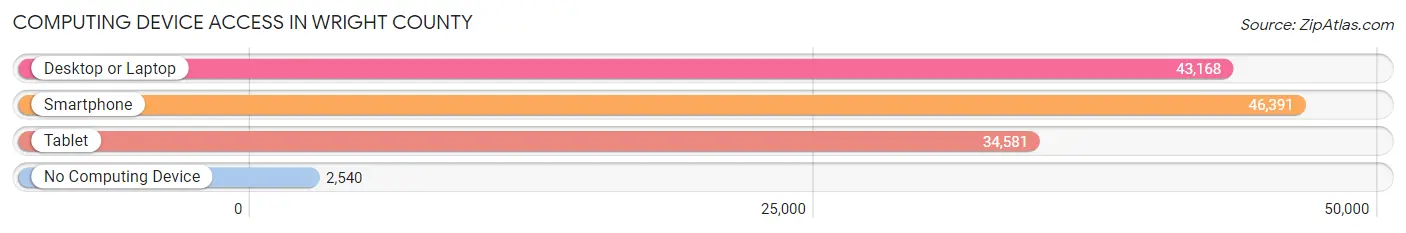
| Device Type | # Households | % Households |
| Desktop or Laptop | 43,168 | 83.8% |
| Smartphone | 46,391 | 90.0% |
| Tablet | 34,581 | 67.1% |
| No Computing Device | 2,540 | 4.9% |
| Total | 51,523 | 100.0% |
Internet Access in Wright County
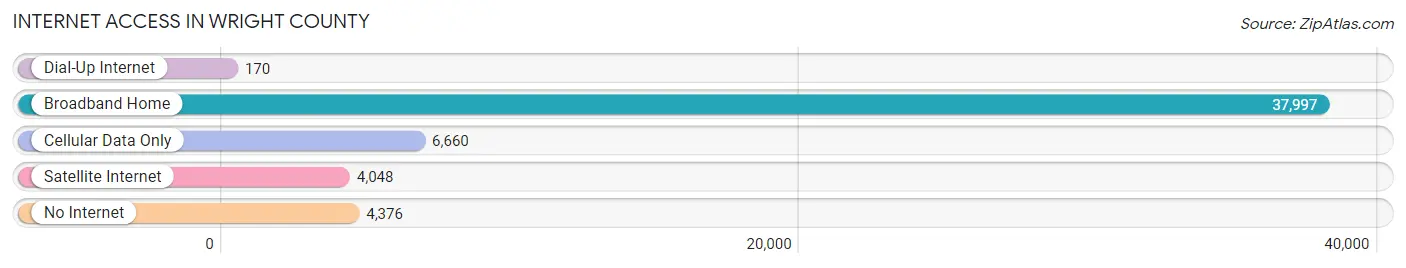
| Internet Type | # Households | % Households |
| Dial-Up Internet | 170 | 0.3% |
| Broadband Home | 37,997 | 73.8% |
| Cellular Data Only | 6,660 | 12.9% |
| Satellite Internet | 4,048 | 7.9% |
| No Internet | 4,376 | 8.5% |
| Total | 51,523 | 100.0% |
Wright County Summary
Wright County, Minnesota is located in the central part of the state, just west of the Twin Cities metropolitan area. It is bordered by Sherburne County to the north, Anoka County to the east, Hennepin County to the south, and McLeod County to the west. The county seat is Buffalo, and the largest city is St. Michael. The county was established in 1855 and named after Silas Wright, a former governor of New York.
Geography
Wright County covers an area of 576 square miles and is located in the Central Minnesota Lowlands region. The terrain is mostly flat, with some rolling hills in the northern part of the county. The county is drained by the Crow River, which flows through the center of the county. The county is also home to several lakes, including Lake Sylvia, Lake Charlotte, and Lake Mary.
The climate of Wright County is typical of the Upper Midwest, with cold winters and warm summers. The average annual temperature is around 40 degrees Fahrenheit, and the average annual precipitation is around 30 inches.
Demographics
As of the 2010 census, Wright County had a population of 124,700. The population was spread out, with 24.3% under the age of 18, 8.2% from 18 to 24, 28.2% from 25 to 44, 25.2% from 45 to 64, and 14.1% who were 65 years of age or older. The median age was 37.4 years.
The racial makeup of the county was 94.2% White, 1.3% African American, 0.7% Native American, 1.7% Asian, 0.1% Pacific Islander, 0.9% from other races, and 1.2% from two or more races. Hispanic or Latino of any race were 2.7% of the population.
Economy
Wright County is home to a diverse economy, with a mix of manufacturing, agriculture, and services. The county is home to several large employers, including the Buffalo Hospital, the St. Michael-Albertville School District, and the Buffalo-Hanover-Montrose School District.
Agriculture is an important part of the county's economy, with dairy farming being the most common type of farming. Other crops grown in the county include corn, soybeans, wheat, and hay.
Manufacturing is also an important part of the county's economy, with several large companies located in the county. These include the Buffalo-Hanover-Montrose School District, the St. Michael-Albertville School District, and the Buffalo Hospital.
The county also has a thriving tourism industry, with several popular attractions, including the Wright County Historical Society Museum, the Buffalo Speedway, and the Buffalo-Hanover-Montrose School District.
Conclusion
Wright County, Minnesota is a diverse county located in the Central Minnesota Lowlands region. It is home to a mix of manufacturing, agriculture, and services, and is a popular tourist destination. The county has a population of 124,700, and the median age is 37.4 years. The county is home to several large employers, and agriculture is an important part of the county's economy.
Common Questions
What is the Total Population of Wright County?
Total Population of Wright County is 142,543.
What is the Total Male Population of Wright County?
Total Male Population of Wright County is 72,791.
What is the Total Female Population of Wright County?
Total Female Population of Wright County is 69,752.
What is the Ratio of Males per 100 Females in Wright County?
There are 104.36 Males per 100 Females in Wright County.
What is the Ratio of Females per 100 Males in Wright County?
There are 95.83 Females per 100 Males in Wright County.
What is the Median Population Age in Wright County?
Median Population Age in Wright County is 37.4 Years.
What is the Average Family Size in Wright County
Average Family Size in Wright County is 3.2 People.
What is the Average Household Size in Wright County
Average Household Size in Wright County is 2.7 People.
What is Per Capita Income in Wright County?
Per Capita income in Wright County is $43,067.
What is the Median Family Income in Wright County?
Median Family Income in Wright County is $118,209.
What is the Median Household income in Wright County?
Median Household Income in Wright County is $102,980.
What is Income or Wage Gap in Wright County?
Income or Wage Gap in Wright County is 31.3%.
Women in Wright County earn 68.7 cents for every dollar earned by a man.
What is Family Income Deficit in Wright County?
Family Income Deficit in Wright County is $11,075.
Families that are below poverty line in Wright County earn $11,075 less on average than the poverty threshold level.
What is Inequality or Gini Index in Wright County?
Inequality or Gini Index in Wright County is 0.38.
How Large is the Labor Force in Wright County?
There are 78,784 People in the Labor Forcein in Wright County.
What is the Percentage of People in the Labor Force in Wright County?
72.7% of People are in the Labor Force in Wright County.
What is the Unemployment Rate in Wright County?
Unemployment Rate in Wright County is 2.2%.