Winona County, MN
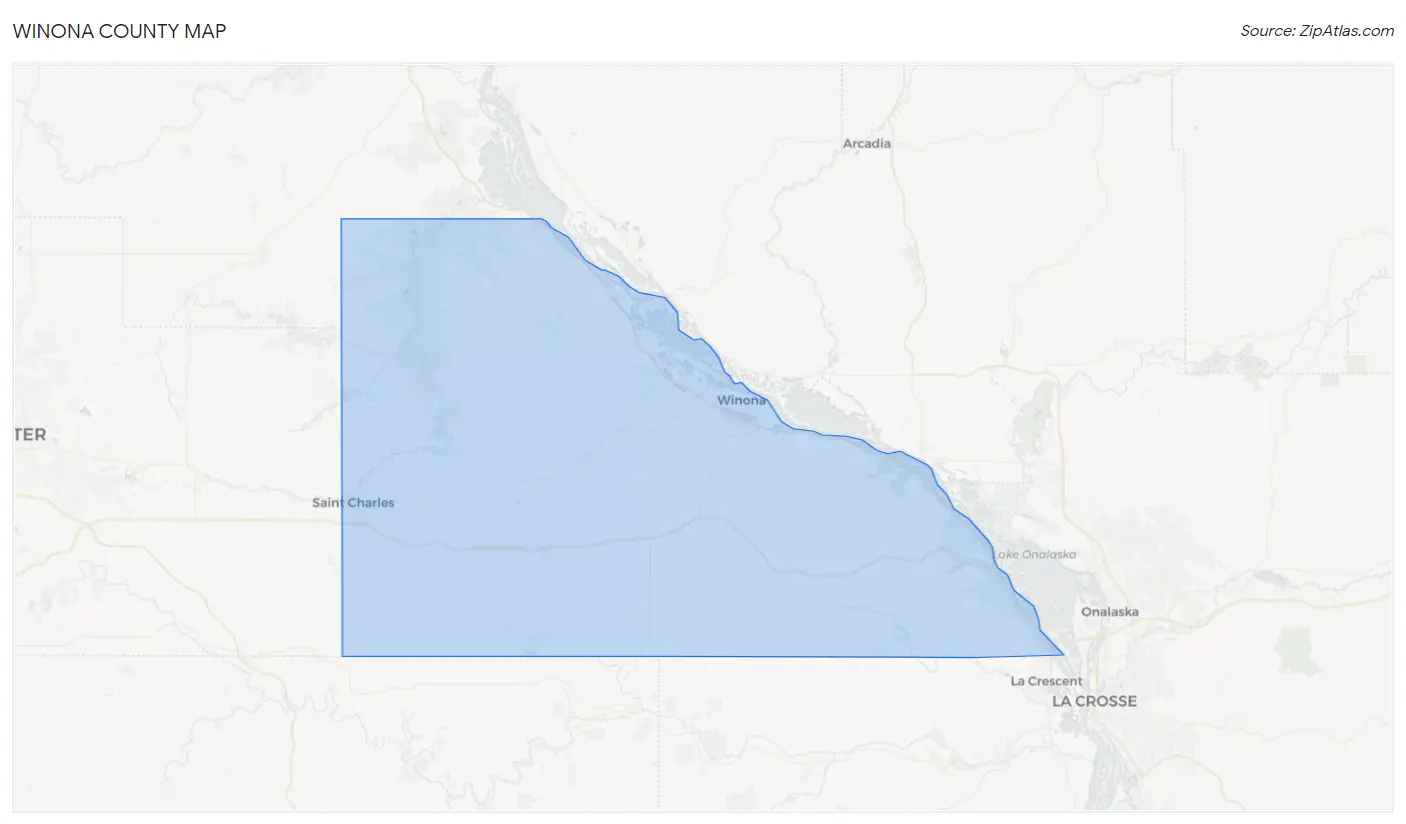
Winona County Map
Winona County Overview
49,792
TOTAL POPULATION
24,786
MALE POPULATION
25,006
FEMALE POPULATION
99.12
MALES / 100 FEMALES
100.89
FEMALES / 100 MALES
35.6
MEDIAN AGE
3.0
AVG FAMILY SIZE
2.3
AVG HOUSEHOLD SIZE
$34,889
PER CAPITA INCOME
$92,534
AVG FAMILY INCOME
$66,162
AVG HOUSEHOLD INCOME
28.4%
WAGE / INCOME GAP [ % ]
71.6¢/ $1
WAGE / INCOME GAP [ $ ]
$9,335
FAMILY INCOME DEFICIT
0.43
INEQUALITY / GINI INDEX
28,488
LABOR FORCE [ PEOPLE ]
68.1%
PERCENT IN LABOR FORCE
2.8%
UNEMPLOYMENT RATE
Winona County Area Codes
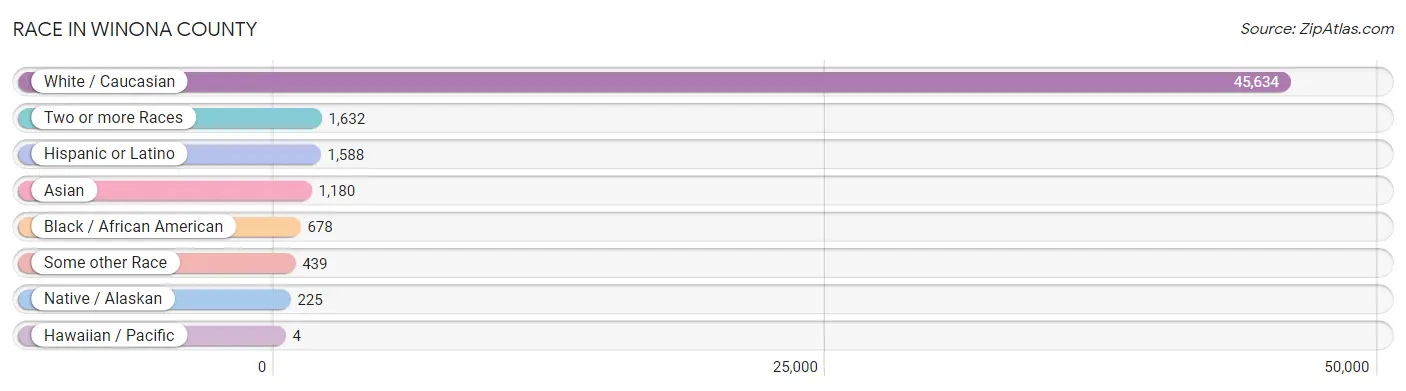
Race in Winona County
The most populous races in Winona County are White / Caucasian (45,634 | 91.6%), Two or more Races (1,632 | 3.3%), and Hispanic or Latino (1,588 | 3.2%).
| Race | # Population | % Population |
| Asian | 1,180 | 2.4% |
| Black / African American | 678 | 1.4% |
| Hawaiian / Pacific | 4 | 0.0% |
| Hispanic or Latino | 1,588 | 3.2% |
| Native / Alaskan | 225 | 0.4% |
| White / Caucasian | 45,634 | 91.6% |
| Two or more Races | 1,632 | 3.3% |
| Some other Race | 439 | 0.9% |
| Total | 49,792 | 100.0% |
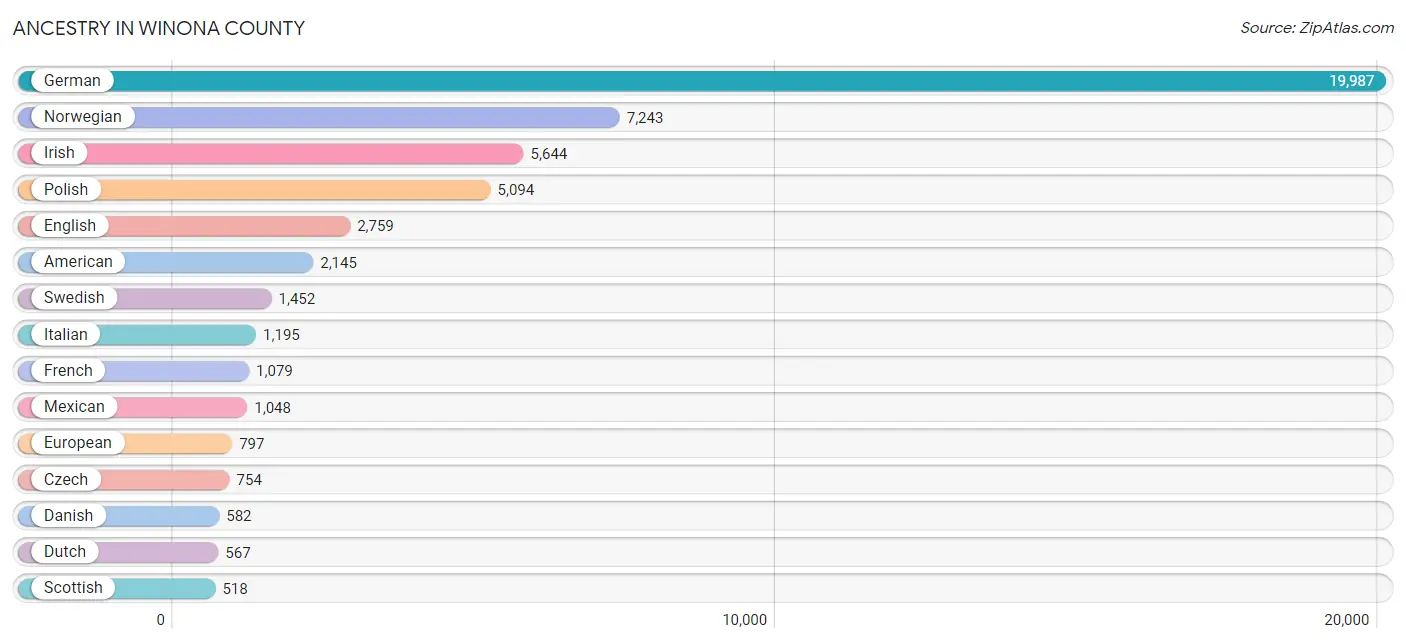
Ancestry in Winona County
The most populous ancestries reported in Winona County are German (19,987 | 40.1%), Norwegian (7,243 | 14.5%), Irish (5,644 | 11.3%), Polish (5,094 | 10.2%), and English (2,759 | 5.5%), together accounting for 81.8% of all Winona County residents.
| Ancestry | # Population | % Population |
| African | 20 | 0.0% |
| Albanian | 21 | 0.0% |
| American | 2,145 | 4.3% |
| Apache | 13 | 0.0% |
| Arab | 46 | 0.1% |
| Armenian | 28 | 0.1% |
| Australian | 1 | 0.0% |
| Austrian | 106 | 0.2% |
| Bangladeshi | 259 | 0.5% |
| Belgian | 3 | 0.0% |
| Bhutanese | 61 | 0.1% |
| Blackfeet | 7 | 0.0% |
| British | 82 | 0.2% |
| British West Indian | 13 | 0.0% |
| Bulgarian | 10 | 0.0% |
| Burmese | 100 | 0.2% |
| Cajun | 28 | 0.1% |
| Canadian | 38 | 0.1% |
| Central American | 98 | 0.2% |
| Cherokee | 76 | 0.2% |
| Chickasaw | 2 | 0.0% |
| Chilean | 27 | 0.1% |
| Chippewa | 105 | 0.2% |
| Choctaw | 4 | 0.0% |
| Colombian | 63 | 0.1% |
| Creek | 9 | 0.0% |
| Crow | 1 | 0.0% |
| Czech | 754 | 1.5% |
| Czechoslovakian | 27 | 0.1% |
| Danish | 582 | 1.2% |
| Dominican | 1 | 0.0% |
| Dutch | 567 | 1.1% |
| Eastern European | 74 | 0.2% |
| Ecuadorian | 7 | 0.0% |
| Egyptian | 19 | 0.0% |
| English | 2,759 | 5.5% |
| Ethiopian | 1 | 0.0% |
| European | 797 | 1.6% |
| Finnish | 339 | 0.7% |
| French | 1,079 | 2.2% |
| French American Indian | 18 | 0.0% |
| French Canadian | 195 | 0.4% |
| German | 19,987 | 40.1% |
| Greek | 34 | 0.1% |
| Guamanian / Chamorro | 27 | 0.1% |
| Guatemalan | 85 | 0.2% |
| Haitian | 64 | 0.1% |
| Hungarian | 152 | 0.3% |
| Icelander | 14 | 0.0% |
| Indian (Asian) | 270 | 0.5% |
| Irish | 5,644 | 11.3% |
| Italian | 1,195 | 2.4% |
| Japanese | 220 | 0.4% |
| Kenyan | 53 | 0.1% |
| Korean | 254 | 0.5% |
| Laotian | 2 | 0.0% |
| Latvian | 2 | 0.0% |
| Lebanese | 3 | 0.0% |
| Liberian | 23 | 0.1% |
| Lithuanian | 74 | 0.2% |
| Luxembourger | 402 | 0.8% |
| Malaysian | 201 | 0.4% |
| Menominee | 7 | 0.0% |
| Mexican | 1,048 | 2.1% |
| Mongolian | 43 | 0.1% |
| Native Hawaiian | 27 | 0.1% |
| Navajo | 59 | 0.1% |
| Northern European | 47 | 0.1% |
| Norwegian | 7,243 | 14.5% |
| Pakistani | 21 | 0.0% |
| Palestinian | 12 | 0.0% |
| Pennsylvania German | 63 | 0.1% |
| Peruvian | 66 | 0.1% |
| Polish | 5,094 | 10.2% |
| Portuguese | 56 | 0.1% |
| Puerto Rican | 148 | 0.3% |
| Romanian | 34 | 0.1% |
| Russian | 153 | 0.3% |
| Salvadoran | 13 | 0.0% |
| Scandinavian | 434 | 0.9% |
| Scotch-Irish | 316 | 0.6% |
| Scottish | 518 | 1.0% |
| Serbian | 3 | 0.0% |
| Sioux | 15 | 0.0% |
| Slavic | 18 | 0.0% |
| Slovak | 77 | 0.2% |
| Slovene | 8 | 0.0% |
| Somali | 41 | 0.1% |
| South African | 2 | 0.0% |
| South American | 187 | 0.4% |
| Spaniard | 50 | 0.1% |
| Spanish American | 3 | 0.0% |
| Sri Lankan | 113 | 0.2% |
| Subsaharan African | 188 | 0.4% |
| Swedish | 1,452 | 2.9% |
| Swiss | 324 | 0.6% |
| Syrian | 12 | 0.0% |
| Thai | 96 | 0.2% |
| Turkish | 166 | 0.3% |
| Ukrainian | 207 | 0.4% |
| Venezuelan | 24 | 0.1% |
| Welsh | 158 | 0.3% |
| Yugoslavian | 24 | 0.1% | View All 103 Rows |
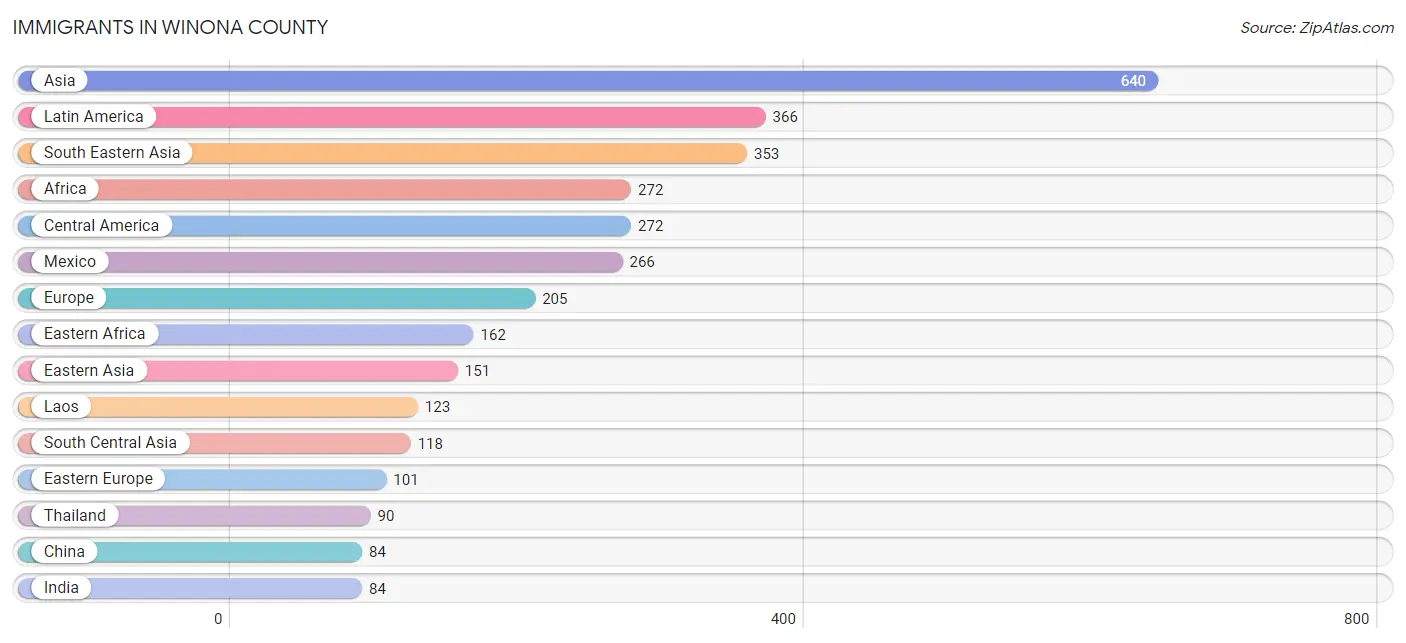
Immigrants in Winona County
The most numerous immigrant groups reported in Winona County came from Asia (640 | 1.3%), Latin America (366 | 0.7%), South Eastern Asia (353 | 0.7%), Africa (272 | 0.5%), and Central America (272 | 0.5%), together accounting for 3.8% of all Winona County residents.
| Immigration Origin | # Population | % Population |
| Africa | 272 | 0.5% |
| Asia | 640 | 1.3% |
| Bangladesh | 34 | 0.1% |
| Bosnia and Herzegovina | 21 | 0.0% |
| Brazil | 15 | 0.0% |
| Cambodia | 1 | 0.0% |
| Cameroon | 17 | 0.0% |
| Canada | 45 | 0.1% |
| Caribbean | 15 | 0.0% |
| Central America | 272 | 0.5% |
| China | 84 | 0.2% |
| Czechoslovakia | 2 | 0.0% |
| Eastern Africa | 162 | 0.3% |
| Eastern Asia | 151 | 0.3% |
| Eastern Europe | 101 | 0.2% |
| Egypt | 16 | 0.0% |
| El Salvador | 6 | 0.0% |
| England | 12 | 0.0% |
| Ethiopia | 16 | 0.0% |
| Europe | 205 | 0.4% |
| France | 4 | 0.0% |
| Germany | 22 | 0.0% |
| Haiti | 2 | 0.0% |
| India | 84 | 0.2% |
| Ireland | 15 | 0.0% |
| Italy | 32 | 0.1% |
| Japan | 17 | 0.0% |
| Kenya | 76 | 0.2% |
| Korea | 50 | 0.1% |
| Laos | 123 | 0.3% |
| Latin America | 366 | 0.7% |
| Malaysia | 62 | 0.1% |
| Mexico | 266 | 0.5% |
| Middle Africa | 17 | 0.0% |
| Nigeria | 15 | 0.0% |
| Northern Africa | 16 | 0.0% |
| Northern Europe | 30 | 0.1% |
| Oceania | 3 | 0.0% |
| Peru | 40 | 0.1% |
| Philippines | 53 | 0.1% |
| Poland | 3 | 0.0% |
| Romania | 22 | 0.0% |
| Russia | 11 | 0.0% |
| Scotland | 1 | 0.0% |
| Somalia | 30 | 0.1% |
| South Africa | 2 | 0.0% |
| South America | 79 | 0.2% |
| South Central Asia | 118 | 0.2% |
| South Eastern Asia | 353 | 0.7% |
| Southern Europe | 48 | 0.1% |
| Spain | 16 | 0.0% |
| Taiwan | 12 | 0.0% |
| Thailand | 90 | 0.2% |
| Turkey | 18 | 0.0% |
| Ukraine | 41 | 0.1% |
| Venezuela | 24 | 0.1% |
| Vietnam | 24 | 0.1% |
| Western Africa | 15 | 0.0% |
| Western Asia | 18 | 0.0% |
| Western Europe | 26 | 0.1% | View All 60 Rows |
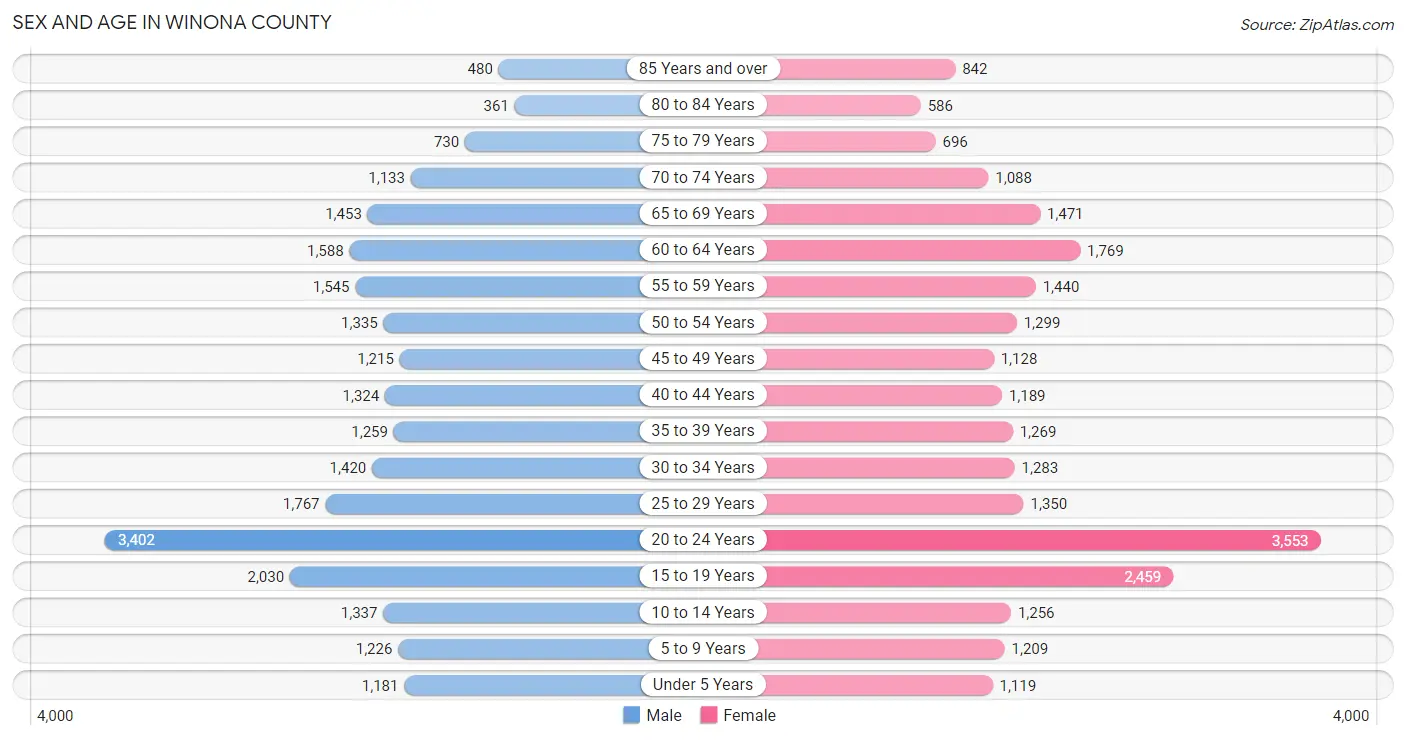
Sex and Age in Winona County
Sex and Age in Winona County
The most populous age groups in Winona County are 20 to 24 Years (3,402 | 13.7%) for men and 20 to 24 Years (3,553 | 14.2%) for women.
| Age Bracket | Male | Female |
| Under 5 Years | 1,181 (4.8%) | 1,119 (4.5%) |
| 5 to 9 Years | 1,226 (5.0%) | 1,209 (4.8%) |
| 10 to 14 Years | 1,337 (5.4%) | 1,256 (5.0%) |
| 15 to 19 Years | 2,030 (8.2%) | 2,459 (9.8%) |
| 20 to 24 Years | 3,402 (13.7%) | 3,553 (14.2%) |
| 25 to 29 Years | 1,767 (7.1%) | 1,350 (5.4%) |
| 30 to 34 Years | 1,420 (5.7%) | 1,283 (5.1%) |
| 35 to 39 Years | 1,259 (5.1%) | 1,269 (5.1%) |
| 40 to 44 Years | 1,324 (5.3%) | 1,189 (4.8%) |
| 45 to 49 Years | 1,215 (4.9%) | 1,128 (4.5%) |
| 50 to 54 Years | 1,335 (5.4%) | 1,299 (5.2%) |
| 55 to 59 Years | 1,545 (6.2%) | 1,440 (5.8%) |
| 60 to 64 Years | 1,588 (6.4%) | 1,769 (7.1%) |
| 65 to 69 Years | 1,453 (5.9%) | 1,471 (5.9%) |
| 70 to 74 Years | 1,133 (4.6%) | 1,088 (4.3%) |
| 75 to 79 Years | 730 (2.9%) | 696 (2.8%) |
| 80 to 84 Years | 361 (1.5%) | 586 (2.3%) |
| 85 Years and over | 480 (1.9%) | 842 (3.4%) |
| Total | 24,786 (100.0%) | 25,006 (100.0%) |
Families and Households in Winona County
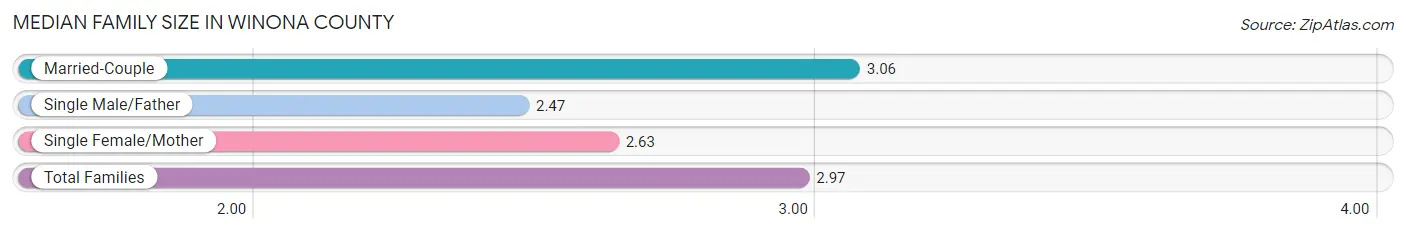
Median Family Size in Winona County
The median family size in Winona County is 2.97 persons per family, with married-couple families (8,695 | 81.0%) accounting for the largest median family size of 3.06 persons per family. On the other hand, single male/father families (721 | 6.7%) represent the smallest median family size with 2.47 persons per family.
| Family Type | # Families | Family Size |
| Married-Couple | 8,695 (81.0%) | 3.06 |
| Single Male/Father | 721 (6.7%) | 2.47 |
| Single Female/Mother | 1,324 (12.3%) | 2.63 |
| Total Families | 10,740 (100.0%) | 2.97 |
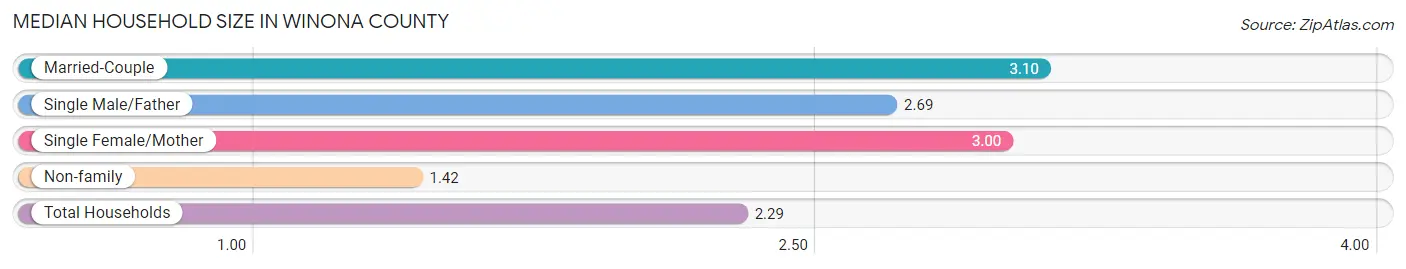
Median Household Size in Winona County
The median household size in Winona County is 2.29 persons per household, with married-couple households (8,695 | 43.0%) accounting for the largest median household size of 3.1 persons per household. non-family households (9,475 | 46.9%) represent the smallest median household size with 1.42 persons per household.
| Household Type | # Households | Household Size |
| Married-Couple | 8,695 (43.0%) | 3.10 |
| Single Male/Father | 721 (3.6%) | 2.69 |
| Single Female/Mother | 1,324 (6.6%) | 3.00 |
| Non-family | 9,475 (46.9%) | 1.42 |
| Total Households | 20,215 (100.0%) | 2.29 |
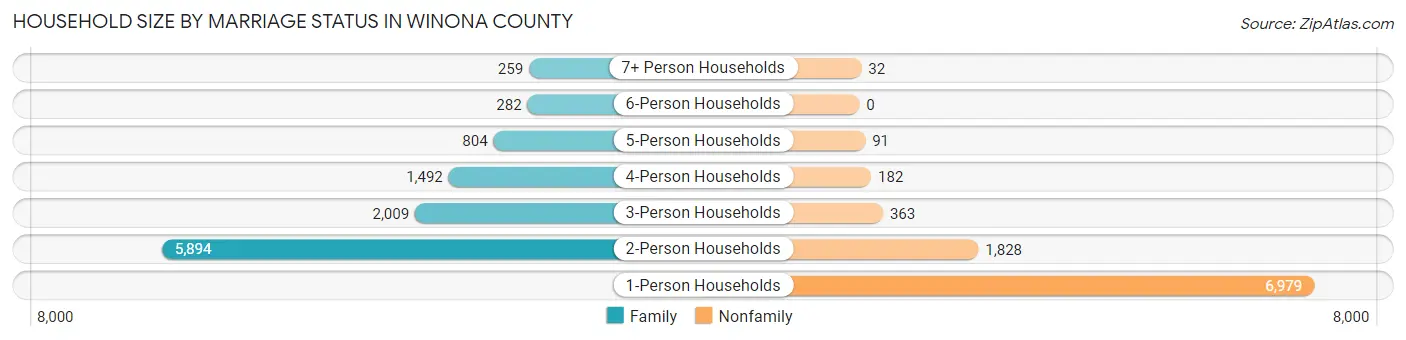
Household Size by Marriage Status in Winona County
Out of a total of 20,215 households in Winona County, 10,740 (53.1%) are family households, while 9,475 (46.9%) are nonfamily households. The most numerous type of family households are 2-person households, comprising 5,894, and the most common type of nonfamily households are 1-person households, comprising 6,979.
| Household Size | Family Households | Nonfamily Households |
| 1-Person Households | - | 6,979 (34.5%) |
| 2-Person Households | 5,894 (29.2%) | 1,828 (9.0%) |
| 3-Person Households | 2,009 (9.9%) | 363 (1.8%) |
| 4-Person Households | 1,492 (7.4%) | 182 (0.9%) |
| 5-Person Households | 804 (4.0%) | 91 (0.4%) |
| 6-Person Households | 282 (1.4%) | 0 (0.0%) |
| 7+ Person Households | 259 (1.3%) | 32 (0.2%) |
| Total | 10,740 (53.1%) | 9,475 (46.9%) |
Female Fertility in Winona County
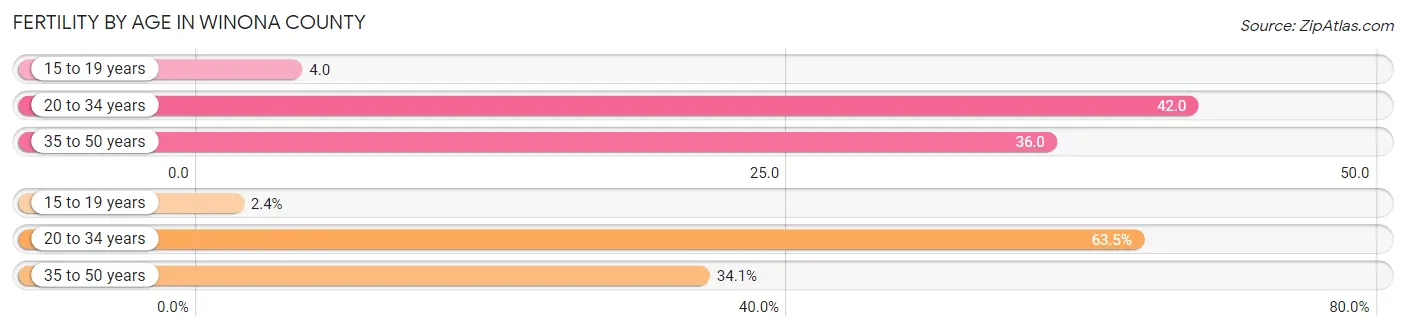
Fertility by Age in Winona County
Average fertility rate in Winona County is 33.0 births per 1,000 women. Women in the age bracket of 20 to 34 years have the highest fertility rate with 42.0 births per 1,000 women. Women in the age bracket of 20 to 34 years acount for 63.5% of all women with births.
| Age Bracket | Women with Births | Births / 1,000 Women |
| 15 to 19 years | 10 (2.4%) | 4.0 |
| 20 to 34 years | 261 (63.5%) | 42.0 |
| 35 to 50 years | 140 (34.1%) | 36.0 |
| Total | 411 (100.0%) | 33.0 |
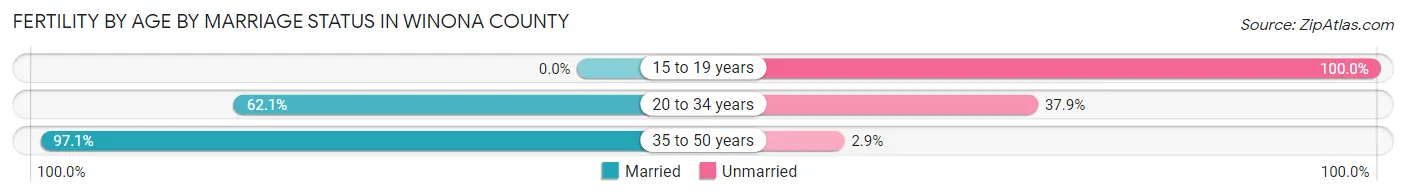
Fertility by Age by Marriage Status in Winona County
72.5% of women with births (411) in Winona County are married. The highest percentage of unmarried women with births falls into 15 to 19 years age bracket with 100.0% of them unmarried at the time of birth, while the lowest percentage of unmarried women with births belong to 35 to 50 years age bracket with 2.9% of them unmarried.
| Age Bracket | Married | Unmarried |
| 15 to 19 years | 0 (0.0%) | 10 (100.0%) |
| 20 to 34 years | 162 (62.1%) | 99 (37.9%) |
| 35 to 50 years | 136 (97.1%) | 4 (2.9%) |
| Total | 298 (72.5%) | 113 (27.5%) |
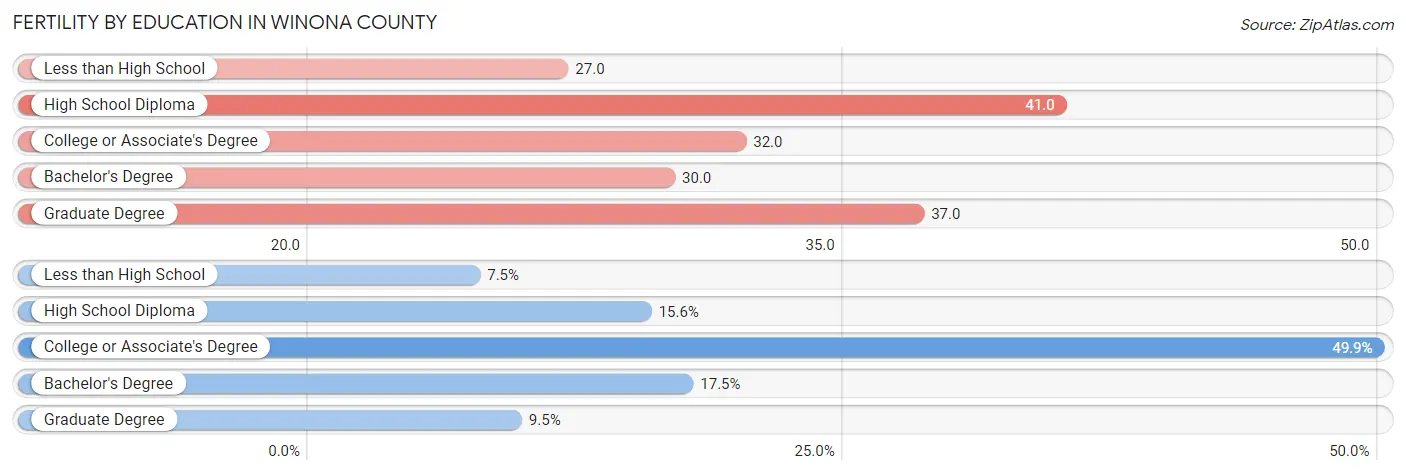
Fertility by Education in Winona County
Average fertility rate in Winona County is 33.0 births per 1,000 women. Women with the education attainment of high school diploma have the highest fertility rate of 41.0 births per 1,000 women, while women with the education attainment of less than high school have the lowest fertility at 27.0 births per 1,000 women. Women with the education attainment of college or associate's degree represent 49.9% of all women with births.
| Educational Attainment | Women with Births | Births / 1,000 Women |
| Less than High School | 31 (7.5%) | 27.0 |
| High School Diploma | 64 (15.6%) | 41.0 |
| College or Associate's Degree | 205 (49.9%) | 32.0 |
| Bachelor's Degree | 72 (17.5%) | 30.0 |
| Graduate Degree | 39 (9.5%) | 37.0 |
| Total | 411 (100.0%) | 33.0 |
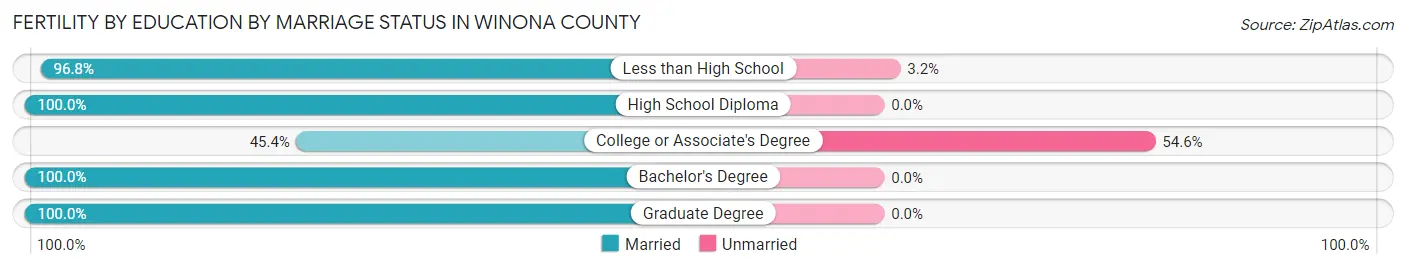
Fertility by Education by Marriage Status in Winona County
27.5% of women with births in Winona County are unmarried. Women with the educational attainment of high school diploma are most likely to be married with 100.0% of them married at childbirth, while women with the educational attainment of college or associate's degree are least likely to be married with 54.6% of them unmarried at childbirth.
| Educational Attainment | Married | Unmarried |
| Less than High School | 30 (96.8%) | 1 (3.2%) |
| High School Diploma | 64 (100.0%) | 0 (0.0%) |
| College or Associate's Degree | 93 (45.4%) | 112 (54.6%) |
| Bachelor's Degree | 72 (100.0%) | 0 (0.0%) |
| Graduate Degree | 39 (100.0%) | 0 (0.0%) |
| Total | 298 (72.5%) | 113 (27.5%) |
Income in Winona County
Income Overview in Winona County
Per Capita Income in Winona County is $34,889, while median incomes of families and households are $92,534 and $66,162 respectively.
| Characteristic | Number | Measure |
| Per Capita Income | 49,792 | $34,889 |
| Median Family Income | 10,740 | $92,534 |
| Mean Family Income | 10,740 | $107,510 |
| Median Household Income | 20,215 | $66,162 |
| Mean Household Income | 20,215 | $83,555 |
| Income Deficit | 10,740 | $9,335 |
| Wage / Income Gap (%) | 49,792 | 28.40% |
| Wage / Income Gap ($) | 49,792 | 71.60¢ per $1 |
| Gini / Inequality Index | 49,792 | 0.43 |
Earnings by Sex in Winona County
Average Earnings in Winona County are $33,289, $38,788 for men and $27,774 for women, a difference of 28.4%.
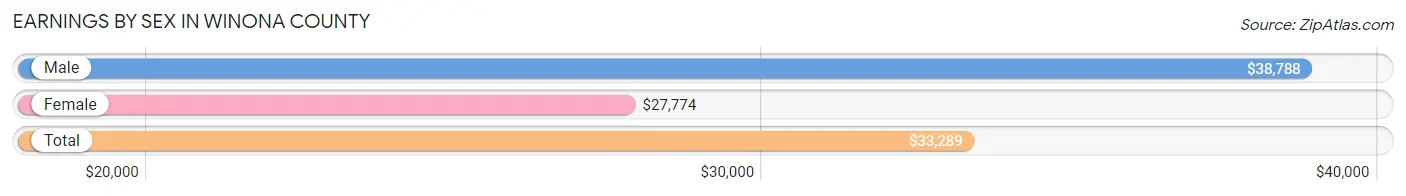
| Sex | Number | Average Earnings |
| Male | 16,225 (51.6%) | $38,788 |
| Female | 15,206 (48.4%) | $27,774 |
| Total | 31,431 (100.0%) | $33,289 |
Earnings by Sex by Income Bracket in Winona County
The most common earnings brackets in Winona County are $100,000+ for men (1,624 | 10.0%) and $5,000 to $7,499 for women (1,234 | 8.1%).
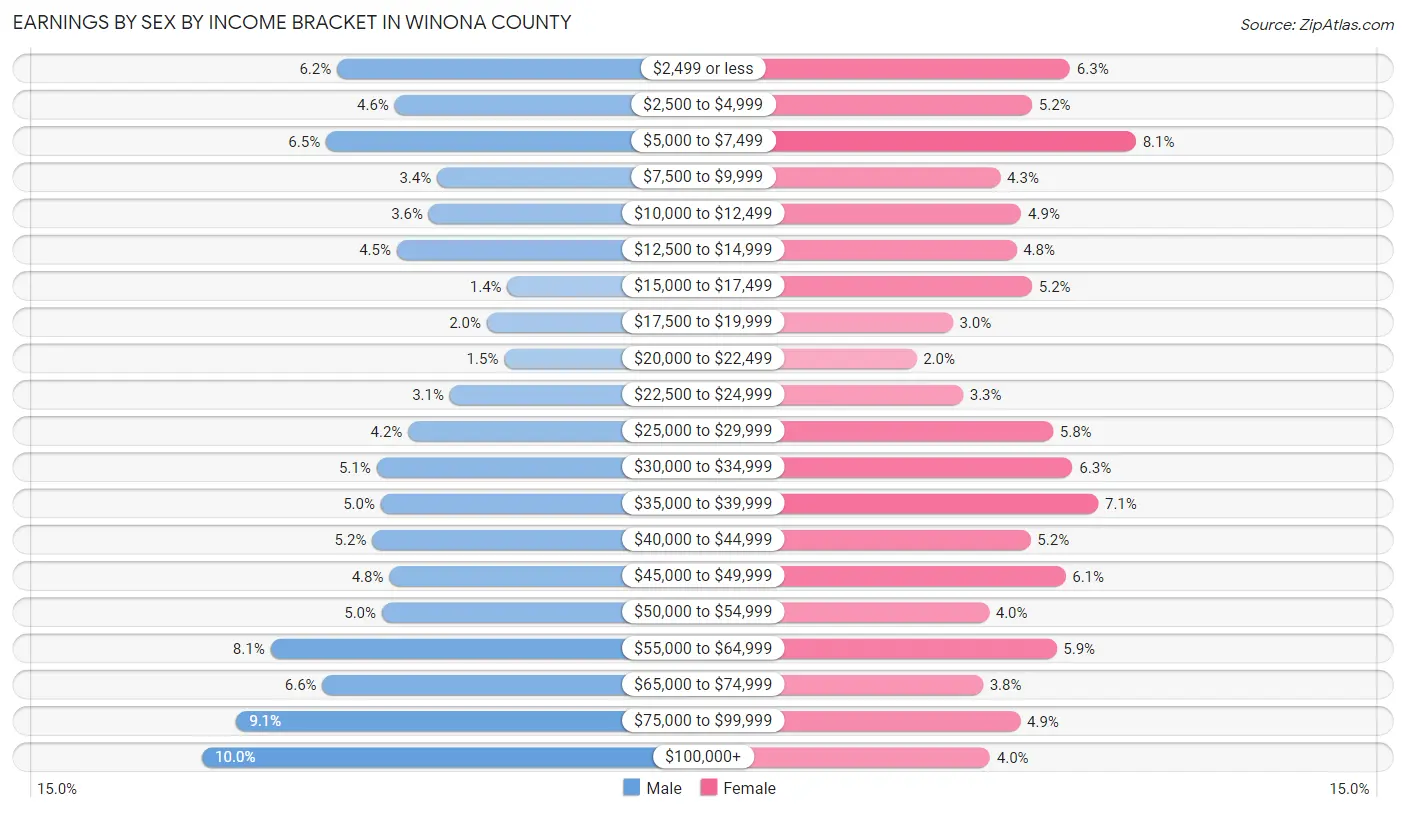
| Income | Male | Female |
| $2,499 or less | 1,010 (6.2%) | 953 (6.3%) |
| $2,500 to $4,999 | 746 (4.6%) | 791 (5.2%) |
| $5,000 to $7,499 | 1,060 (6.5%) | 1,234 (8.1%) |
| $7,500 to $9,999 | 553 (3.4%) | 655 (4.3%) |
| $10,000 to $12,499 | 591 (3.6%) | 745 (4.9%) |
| $12,500 to $14,999 | 736 (4.5%) | 724 (4.8%) |
| $15,000 to $17,499 | 232 (1.4%) | 790 (5.2%) |
| $17,500 to $19,999 | 326 (2.0%) | 452 (3.0%) |
| $20,000 to $22,499 | 247 (1.5%) | 296 (1.9%) |
| $22,500 to $24,999 | 495 (3.0%) | 496 (3.3%) |
| $25,000 to $29,999 | 685 (4.2%) | 881 (5.8%) |
| $30,000 to $34,999 | 829 (5.1%) | 964 (6.3%) |
| $35,000 to $39,999 | 809 (5.0%) | 1,074 (7.1%) |
| $40,000 to $44,999 | 848 (5.2%) | 784 (5.2%) |
| $45,000 to $49,999 | 771 (4.8%) | 934 (6.1%) |
| $50,000 to $54,999 | 805 (5.0%) | 606 (4.0%) |
| $55,000 to $64,999 | 1,313 (8.1%) | 895 (5.9%) |
| $65,000 to $74,999 | 1,076 (6.6%) | 581 (3.8%) |
| $75,000 to $99,999 | 1,469 (9.0%) | 740 (4.9%) |
| $100,000+ | 1,624 (10.0%) | 611 (4.0%) |
| Total | 16,225 (100.0%) | 15,206 (100.0%) |
Earnings by Sex by Educational Attainment in Winona County
Average earnings in Winona County are $51,290 for men and $39,318 for women, a difference of 23.3%. Men with an educational attainment of graduate degree enjoy the highest average annual earnings of $71,509, while those with less than high school education earn the least with $34,696. Women with an educational attainment of graduate degree earn the most with the average annual earnings of $63,750, while those with less than high school education have the smallest earnings of $22,692.
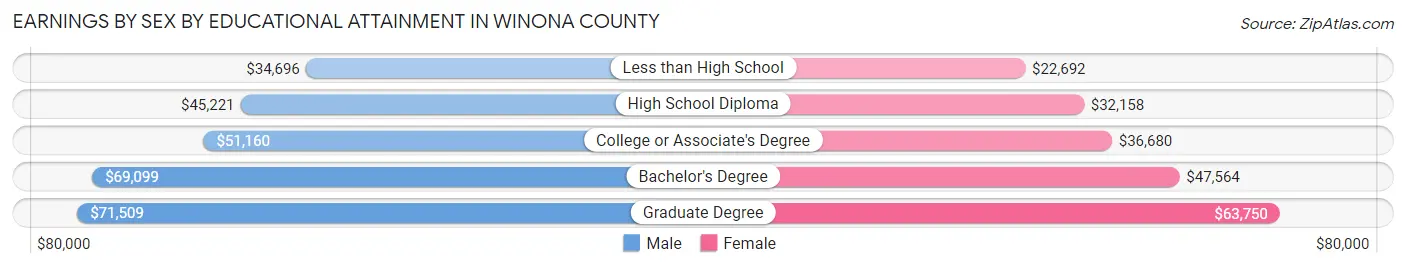
| Educational Attainment | Male Income | Female Income |
| Less than High School | $34,696 | $22,692 |
| High School Diploma | $45,221 | $32,158 |
| College or Associate's Degree | $51,160 | $36,680 |
| Bachelor's Degree | $69,099 | $47,564 |
| Graduate Degree | $71,509 | $63,750 |
| Total | $51,290 | $39,318 |
Family Income in Winona County
Family Income Brackets in Winona County
According to the Winona County family income data, there are 2,760 families falling into the $100,000 to $149,999 income range, which is the most common income bracket and makes up 25.7% of all families. Conversely, the $10,000 to $14,999 income bracket is the least frequent group with only 64 families (0.6%) belonging to this category.
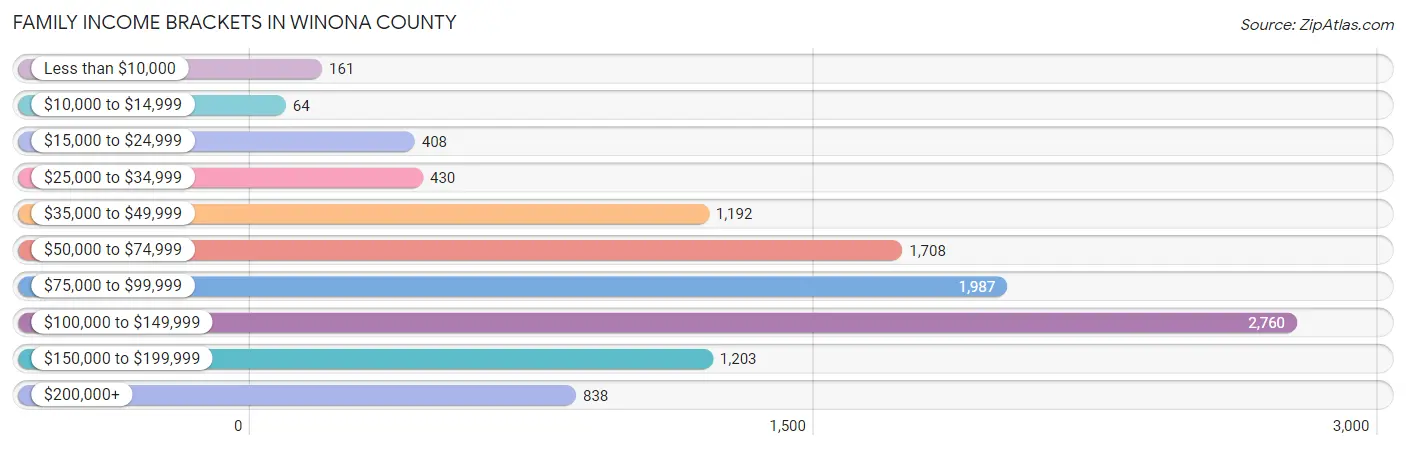
| Income Bracket | # Families | % Families |
| Less than $10,000 | 161 | 1.5% |
| $10,000 to $14,999 | 64 | 0.6% |
| $15,000 to $24,999 | 408 | 3.8% |
| $25,000 to $34,999 | 430 | 4.0% |
| $35,000 to $49,999 | 1,192 | 11.1% |
| $50,000 to $74,999 | 1,708 | 15.9% |
| $75,000 to $99,999 | 1,987 | 18.5% |
| $100,000 to $149,999 | 2,760 | 25.7% |
| $150,000 to $199,999 | 1,203 | 11.2% |
| $200,000+ | 838 | 7.8% |
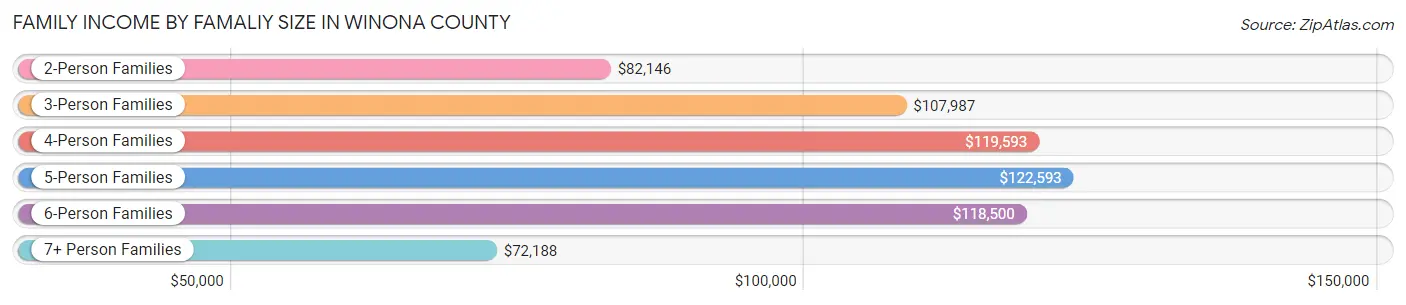
Family Income by Famaliy Size in Winona County
5-person families (750 | 7.0%) account for the highest median family income in Winona County with $122,593 per family, while 2-person families (6,183 | 57.6%) have the highest median income of $41,073 per family member.
| Income Bracket | # Families | Median Income |
| 2-Person Families | 6,183 (57.6%) | $82,146 |
| 3-Person Families | 2,019 (18.8%) | $107,987 |
| 4-Person Families | 1,304 (12.1%) | $119,593 |
| 5-Person Families | 750 (7.0%) | $122,593 |
| 6-Person Families | 242 (2.2%) | $118,500 |
| 7+ Person Families | 242 (2.2%) | $72,188 |
| Total | 10,740 (100.0%) | $92,534 |
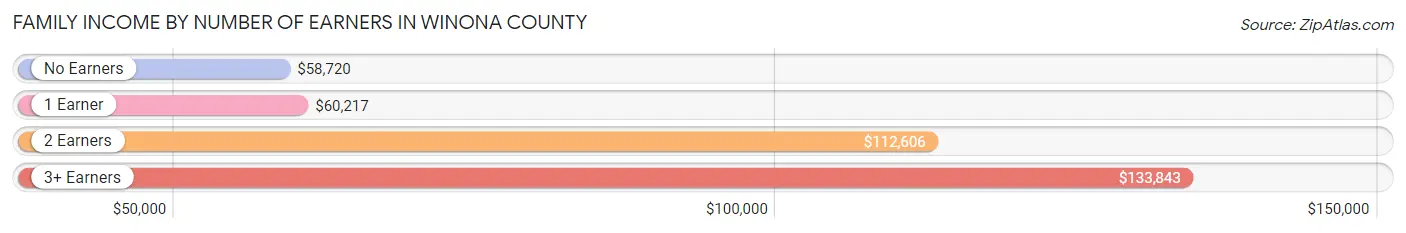
Family Income by Number of Earners in Winona County
The median family income in Winona County is $92,534, with families comprising 3+ earners (1,185) having the highest median family income of $133,843, while families with no earners (1,474) have the lowest median family income of $58,720, accounting for 11.0% and 13.7% of families, respectively.
| Number of Earners | # Families | Median Income |
| No Earners | 1,474 (13.7%) | $58,720 |
| 1 Earner | 3,035 (28.3%) | $60,217 |
| 2 Earners | 5,046 (47.0%) | $112,606 |
| 3+ Earners | 1,185 (11.0%) | $133,843 |
| Total | 10,740 (100.0%) | $92,534 |
Household Income in Winona County
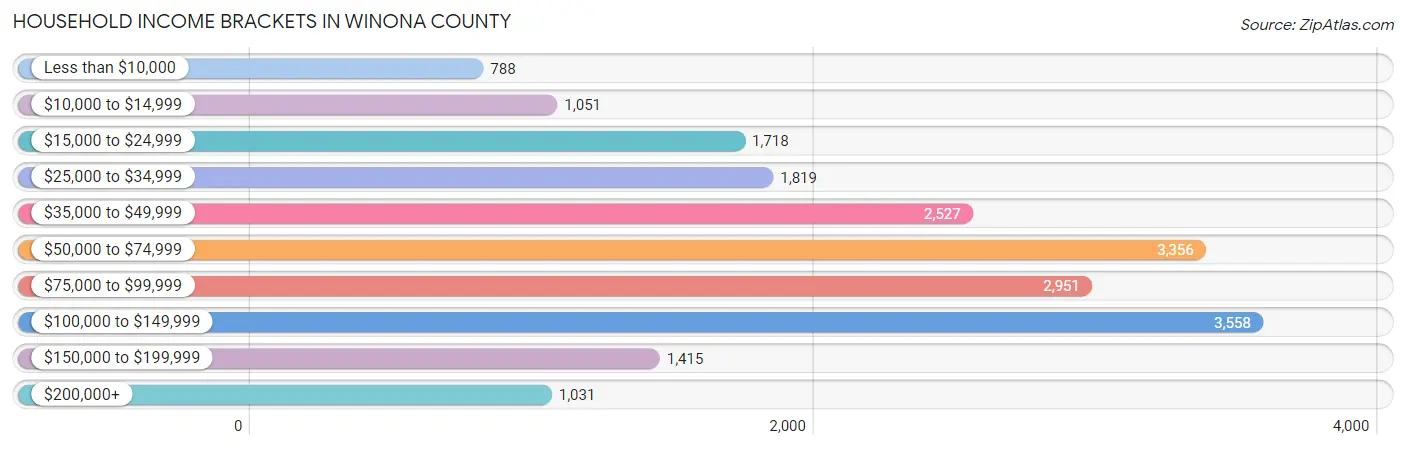
Household Income Brackets in Winona County
With 3,558 households falling in the category, the $100,000 to $149,999 income range is the most frequent in Winona County, accounting for 17.6% of all households. In contrast, only 788 households (3.9%) fall into the less than $10,000 income bracket, making it the least populous group.
| Income Bracket | # Households | % Households |
| Less than $10,000 | 788 | 3.9% |
| $10,000 to $14,999 | 1,051 | 5.2% |
| $15,000 to $24,999 | 1,718 | 8.5% |
| $25,000 to $34,999 | 1,819 | 9.0% |
| $35,000 to $49,999 | 2,527 | 12.5% |
| $50,000 to $74,999 | 3,356 | 16.6% |
| $75,000 to $99,999 | 2,951 | 14.6% |
| $100,000 to $149,999 | 3,558 | 17.6% |
| $150,000 to $199,999 | 1,415 | 7.0% |
| $200,000+ | 1,031 | 5.1% |
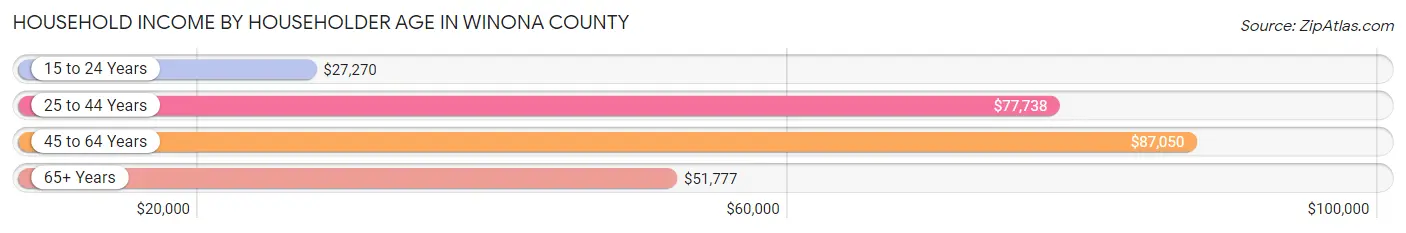
Household Income by Householder Age in Winona County
The median household income in Winona County is $66,162, with the highest median household income of $87,050 found in the 45 to 64 years age bracket for the primary householder. A total of 6,620 households (32.8%) fall into this category. Meanwhile, the 15 to 24 years age bracket for the primary householder has the lowest median household income of $27,270, with 2,451 households (12.1%) in this group.
| Income Bracket | # Households | Median Income |
| 15 to 24 Years | 2,451 (12.1%) | $27,270 |
| 25 to 44 Years | 5,770 (28.5%) | $77,738 |
| 45 to 64 Years | 6,620 (32.8%) | $87,050 |
| 65+ Years | 5,374 (26.6%) | $51,777 |
| Total | 20,215 (100.0%) | $66,162 |
Poverty in Winona County
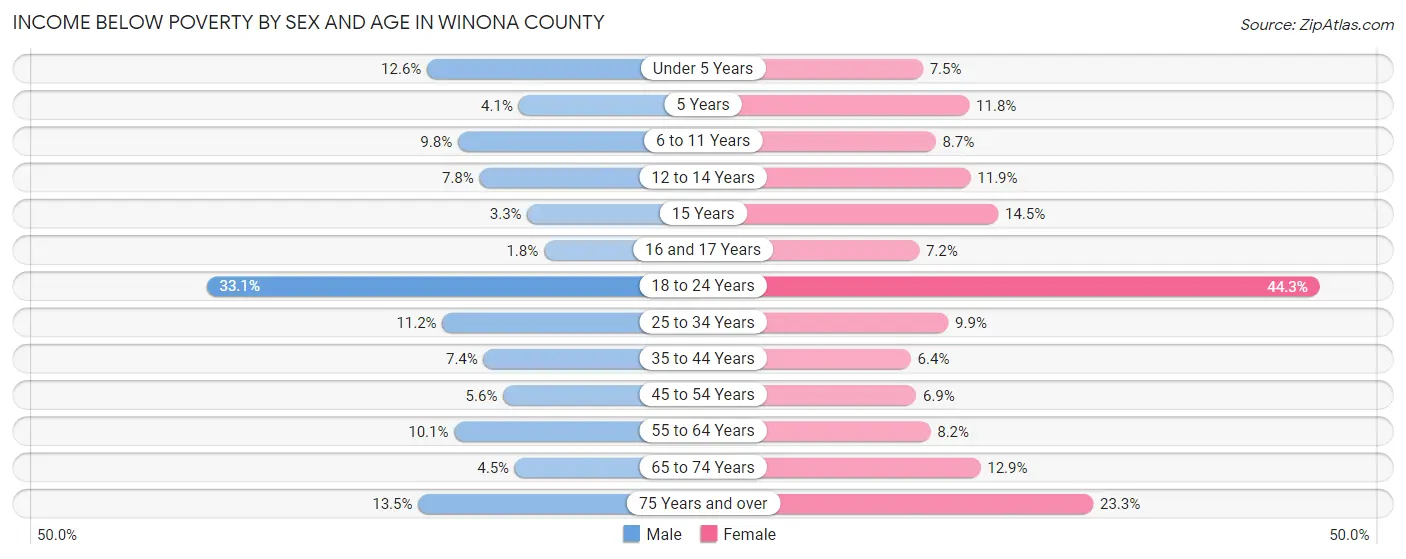
Income Below Poverty by Sex and Age in Winona County
With 12.4% poverty level for males and 15.7% for females among the residents of Winona County, 18 to 24 year old males and 18 to 24 year old females are the most vulnerable to poverty, with 1,234 males (33.1%) and 1,578 females (44.3%) in their respective age groups living below the poverty level.
| Age Bracket | Male | Female |
| Under 5 Years | 148 (12.6%) | 84 (7.5%) |
| 5 Years | 13 (4.1%) | 35 (11.8%) |
| 6 to 11 Years | 134 (9.8%) | 115 (8.7%) |
| 12 to 14 Years | 60 (7.8%) | 91 (11.9%) |
| 15 Years | 10 (3.3%) | 48 (14.5%) |
| 16 and 17 Years | 8 (1.8%) | 30 (7.2%) |
| 18 to 24 Years | 1,234 (33.1%) | 1,578 (44.3%) |
| 25 to 34 Years | 355 (11.2%) | 259 (9.9%) |
| 35 to 44 Years | 191 (7.4%) | 157 (6.4%) |
| 45 to 54 Years | 142 (5.6%) | 167 (6.9%) |
| 55 to 64 Years | 314 (10.1%) | 262 (8.2%) |
| 65 to 74 Years | 115 (4.5%) | 324 (12.9%) |
| 75 Years and over | 203 (13.5%) | 441 (23.3%) |
| Total | 2,927 (12.4%) | 3,591 (15.7%) |
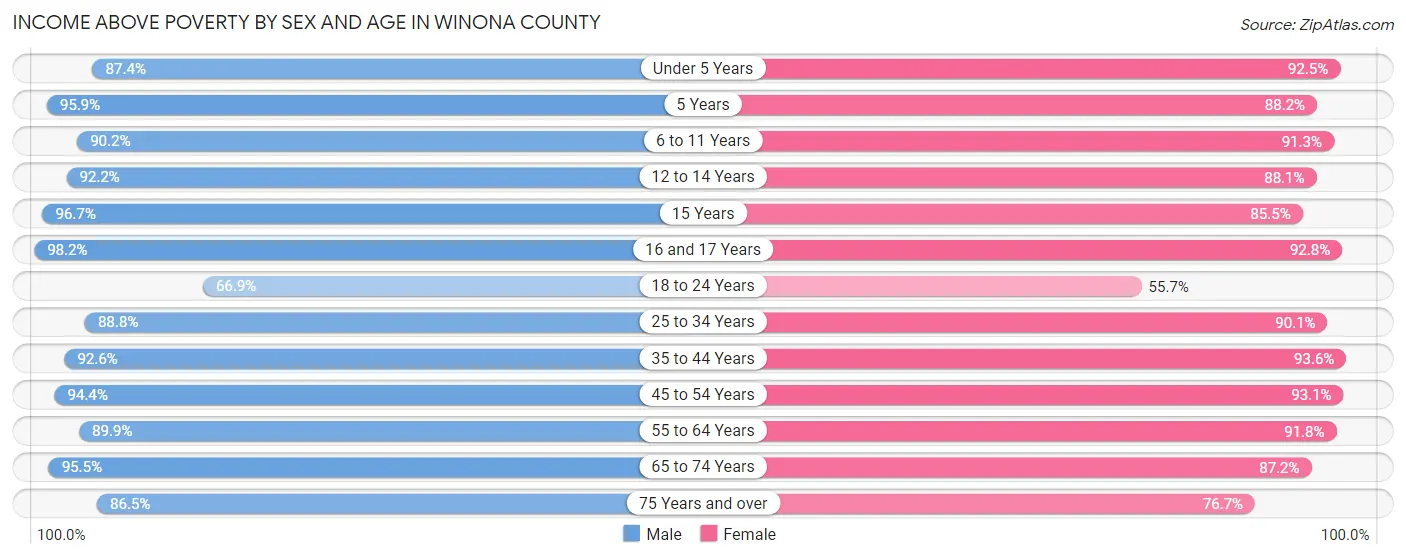
Income Above Poverty by Sex and Age in Winona County
According to the poverty statistics in Winona County, males aged 16 and 17 years and females aged 35 to 44 years are the age groups that are most secure financially, with 98.2% of males and 93.6% of females in these age groups living above the poverty line.
| Age Bracket | Male | Female |
| Under 5 Years | 1,023 (87.4%) | 1,035 (92.5%) |
| 5 Years | 301 (95.9%) | 261 (88.2%) |
| 6 to 11 Years | 1,236 (90.2%) | 1,208 (91.3%) |
| 12 to 14 Years | 712 (92.2%) | 672 (88.1%) |
| 15 Years | 290 (96.7%) | 283 (85.5%) |
| 16 and 17 Years | 438 (98.2%) | 389 (92.8%) |
| 18 to 24 Years | 2,493 (66.9%) | 1,981 (55.7%) |
| 25 to 34 Years | 2,809 (88.8%) | 2,365 (90.1%) |
| 35 to 44 Years | 2,391 (92.6%) | 2,301 (93.6%) |
| 45 to 54 Years | 2,403 (94.4%) | 2,256 (93.1%) |
| 55 to 64 Years | 2,790 (89.9%) | 2,930 (91.8%) |
| 65 to 74 Years | 2,448 (95.5%) | 2,197 (87.2%) |
| 75 Years and over | 1,305 (86.5%) | 1,450 (76.7%) |
| Total | 20,639 (87.6%) | 19,328 (84.3%) |
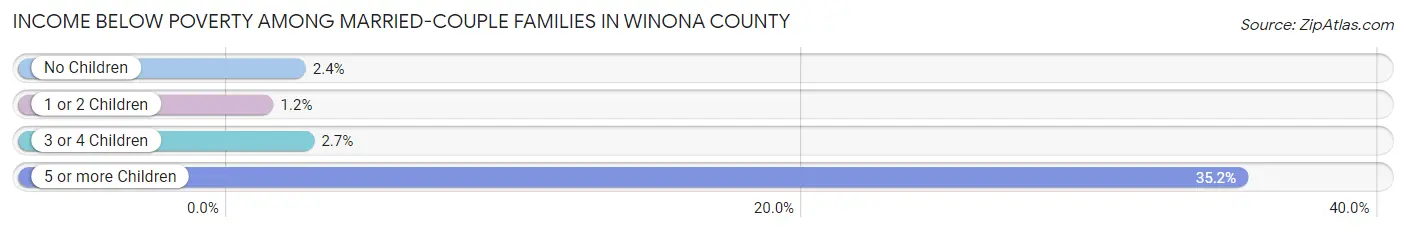
Income Below Poverty Among Married-Couple Families in Winona County
The poverty statistics for married-couple families in Winona County show that 2.8% or 246 of the total 8,695 families live below the poverty line. Families with 5 or more children have the highest poverty rate of 35.2%, comprising of 64 families. On the other hand, families with 1 or 2 children have the lowest poverty rate of 1.2%, which includes 24 families.
| Children | Above Poverty | Below Poverty |
| No Children | 5,659 (97.6%) | 137 (2.4%) |
| 1 or 2 Children | 1,904 (98.8%) | 24 (1.2%) |
| 3 or 4 Children | 768 (97.3%) | 21 (2.7%) |
| 5 or more Children | 118 (64.8%) | 64 (35.2%) |
| Total | 8,449 (97.2%) | 246 (2.8%) |
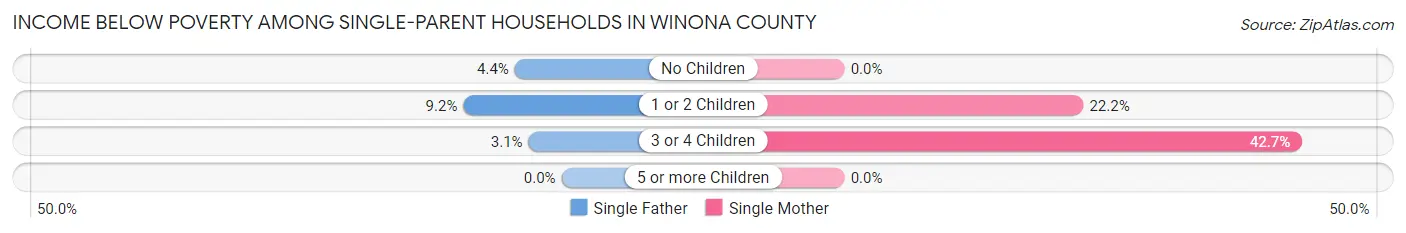
Income Below Poverty Among Single-Parent Households in Winona County
According to the poverty data in Winona County, 6.2% or 45 single-father households and 14.9% or 198 single-mother households are living below the poverty line. Among single-father households, those with 1 or 2 children have the highest poverty rate, with 28 households (9.1%) experiencing poverty. Likewise, among single-mother households, those with 3 or 4 children have the highest poverty rate, with 35 households (42.7%) falling below the poverty line.
| Children | Single Father | Single Mother |
| No Children | 15 (4.4%) | 0 (0.0%) |
| 1 or 2 Children | 28 (9.1%) | 163 (22.2%) |
| 3 or 4 Children | 2 (3.1%) | 35 (42.7%) |
| 5 or more Children | 0 (0.0%) | 0 (0.0%) |
| Total | 45 (6.2%) | 198 (14.9%) |
Income Below Poverty Among Married-Couple vs Single-Parent Households in Winona County
The poverty data for Winona County shows that 246 of the married-couple family households (2.8%) and 243 of the single-parent households (11.9%) are living below the poverty level. Within the married-couple family households, those with 5 or more children have the highest poverty rate, with 64 households (35.2%) falling below the poverty line. Among the single-parent households, those with 3 or 4 children have the highest poverty rate, with 37 household (25.2%) living below poverty.
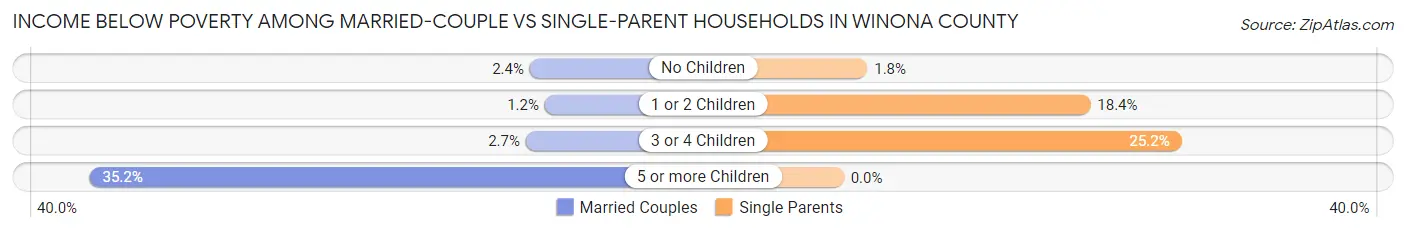
| Children | Married-Couple Families | Single-Parent Households |
| No Children | 137 (2.4%) | 15 (1.8%) |
| 1 or 2 Children | 24 (1.2%) | 191 (18.4%) |
| 3 or 4 Children | 21 (2.7%) | 37 (25.2%) |
| 5 or more Children | 64 (35.2%) | 0 (0.0%) |
| Total | 246 (2.8%) | 243 (11.9%) |
Employment Characteristics in Winona County
Employment by Class of Employer in Winona County
Among the 27,040 employed individuals in Winona County, private company employees (17,489 | 64.7%), not-for-profit organizations (3,923 | 14.5%), and self-employed (not incorporated) (1,503 | 5.6%) make up the most common classes of employment.
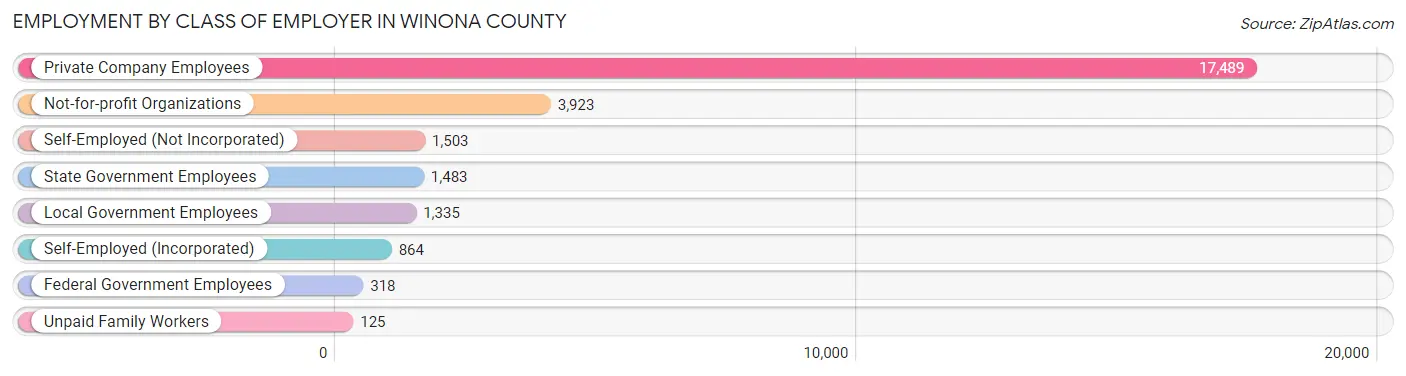
| Employer Class | # Employees | % Employees |
| Private Company Employees | 17,489 | 64.7% |
| Self-Employed (Incorporated) | 864 | 3.2% |
| Self-Employed (Not Incorporated) | 1,503 | 5.6% |
| Not-for-profit Organizations | 3,923 | 14.5% |
| Local Government Employees | 1,335 | 4.9% |
| State Government Employees | 1,483 | 5.5% |
| Federal Government Employees | 318 | 1.2% |
| Unpaid Family Workers | 125 | 0.5% |
| Total | 27,040 | 100.0% |
Employment Status by Age in Winona County
According to the labor force statistics for Winona County, out of the total population over 16 years of age (41,832), 68.1% or 28,488 individuals are in the labor force, with 2.8% or 798 of them unemployed. The age group with the highest labor force participation rate is 35 to 44 years, with 93.4% or 4,708 individuals in the labor force. Within the labor force, the 16 to 19 years age range has the highest percentage of unemployed individuals, with 6.6% or 144 of them being unemployed.
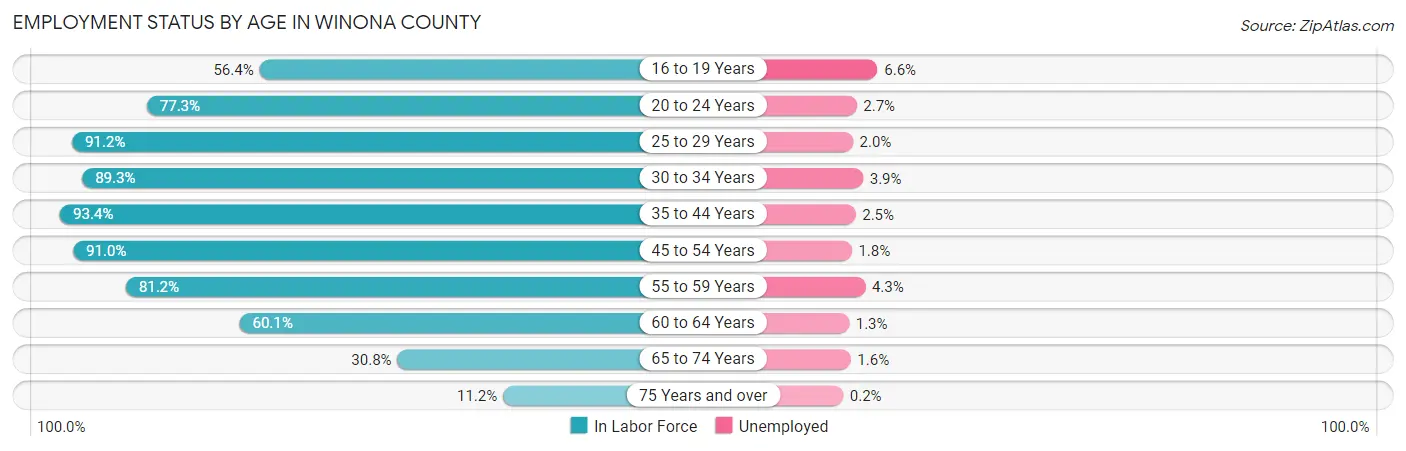
| Age Bracket | In Labor Force | Unemployed |
| 16 to 19 Years | 2,175 (56.4%) | 144 (6.6%) |
| 20 to 24 Years | 5,376 (77.3%) | 145 (2.7%) |
| 25 to 29 Years | 2,843 (91.2%) | 57 (2.0%) |
| 30 to 34 Years | 2,414 (89.3%) | 94 (3.9%) |
| 35 to 44 Years | 4,708 (93.4%) | 118 (2.5%) |
| 45 to 54 Years | 4,529 (91.0%) | 82 (1.8%) |
| 55 to 59 Years | 2,424 (81.2%) | 104 (4.3%) |
| 60 to 64 Years | 2,018 (60.1%) | 26 (1.3%) |
| 65 to 74 Years | 1,585 (30.8%) | 25 (1.6%) |
| 75 Years and over | 414 (11.2%) | 1 (0.2%) |
| Total | 28,488 (68.1%) | 798 (2.8%) |
Employment Status by Educational Attainment in Winona County
According to labor force statistics for Winona County, 85.4% of individuals (18,942) out of the total population between 25 and 64 years of age (22,180) are in the labor force, with 2.5% or 474 of them being unemployed. The group with the highest labor force participation rate are those with the educational attainment of bachelor's degree or higher, with 87.4% or 6,508 individuals in the labor force. Within the labor force, individuals with less than high school education have the highest percentage of unemployment, with 9.2% or 89 of them being unemployed.
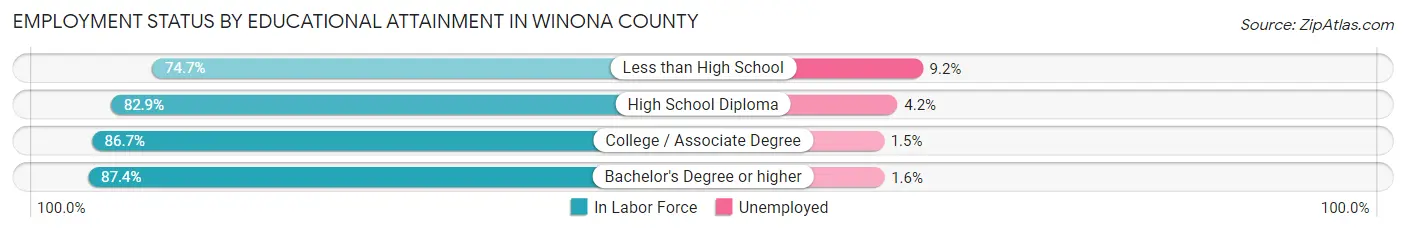
| Educational Attainment | In Labor Force | Unemployed |
| Less than High School | 964 (74.7%) | 119 (9.2%) |
| High School Diploma | 4,357 (82.9%) | 221 (4.2%) |
| College / Associate Degree | 7,098 (86.7%) | 123 (1.5%) |
| Bachelor's Degree or higher | 6,508 (87.4%) | 119 (1.6%) |
| Total | 18,942 (85.4%) | 554 (2.5%) |
Employment Occupations by Sex in Winona County
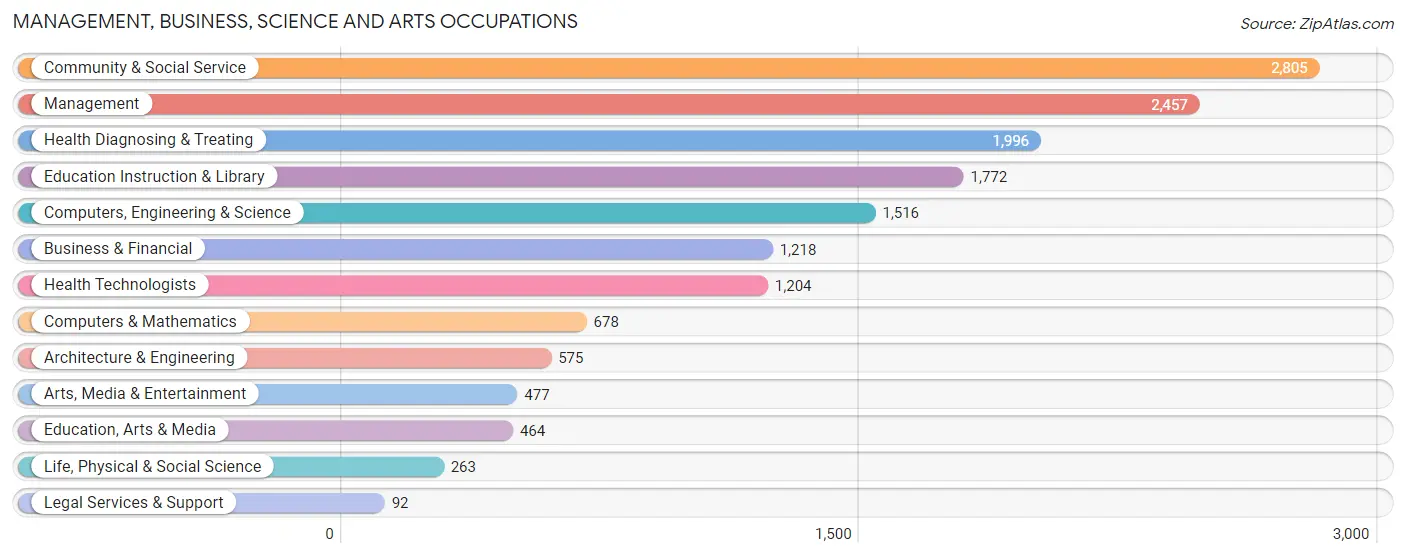
Management, Business, Science and Arts Occupations
The most common Management, Business, Science and Arts occupations in Winona County are Community & Social Service (2,805 | 10.1%), Management (2,457 | 8.9%), Health Diagnosing & Treating (1,996 | 7.2%), Education Instruction & Library (1,772 | 6.4%), and Computers, Engineering & Science (1,516 | 5.5%).
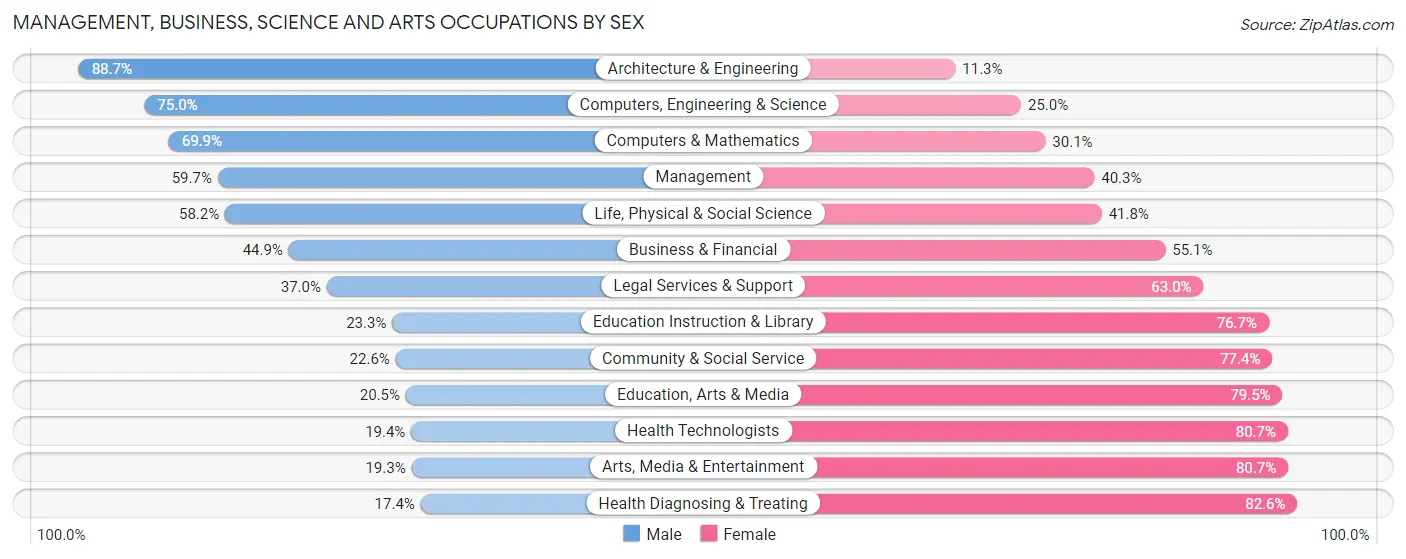
Management, Business, Science and Arts Occupations by Sex
Within the Management, Business, Science and Arts occupations in Winona County, the most male-oriented occupations are Architecture & Engineering (88.7%), Computers, Engineering & Science (75.0%), and Computers & Mathematics (69.9%), while the most female-oriented occupations are Health Diagnosing & Treating (82.6%), Arts, Media & Entertainment (80.7%), and Health Technologists (80.6%).
| Occupation | Male | Female |
| Management | 1,467 (59.7%) | 990 (40.3%) |
| Business & Financial | 547 (44.9%) | 671 (55.1%) |
| Computers, Engineering & Science | 1,137 (75.0%) | 379 (25.0%) |
| Computers & Mathematics | 474 (69.9%) | 204 (30.1%) |
| Architecture & Engineering | 510 (88.7%) | 65 (11.3%) |
| Life, Physical & Social Science | 153 (58.2%) | 110 (41.8%) |
| Community & Social Service | 634 (22.6%) | 2,171 (77.4%) |
| Education, Arts & Media | 95 (20.5%) | 369 (79.5%) |
| Legal Services & Support | 34 (37.0%) | 58 (63.0%) |
| Education Instruction & Library | 413 (23.3%) | 1,359 (76.7%) |
| Arts, Media & Entertainment | 92 (19.3%) | 385 (80.7%) |
| Health Diagnosing & Treating | 347 (17.4%) | 1,649 (82.6%) |
| Health Technologists | 233 (19.4%) | 971 (80.6%) |
| Total (Category) | 4,132 (41.3%) | 5,860 (58.7%) |
| Total (Overall) | 14,089 (50.9%) | 13,564 (49.0%) |
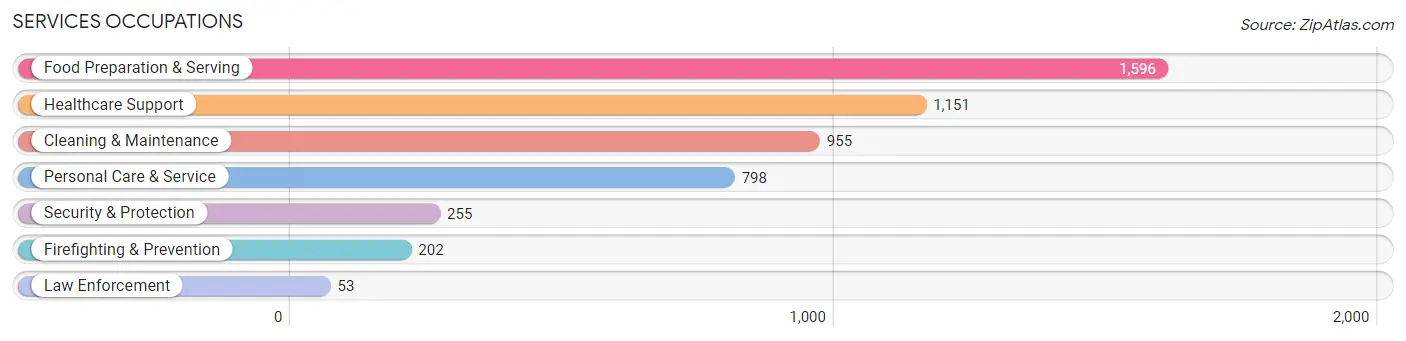
Services Occupations
The most common Services occupations in Winona County are Food Preparation & Serving (1,596 | 5.8%), Healthcare Support (1,151 | 4.2%), Cleaning & Maintenance (955 | 3.5%), Personal Care & Service (798 | 2.9%), and Security & Protection (255 | 0.9%).
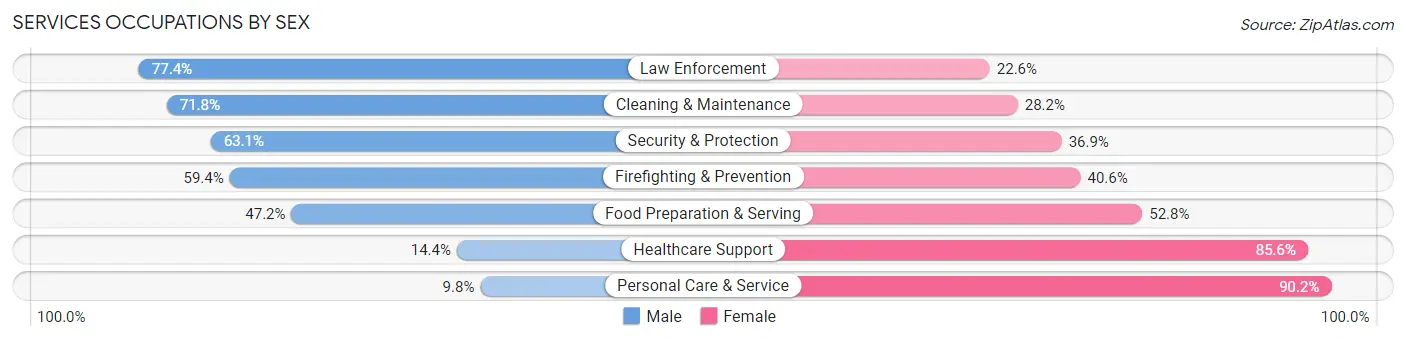
Services Occupations by Sex
Within the Services occupations in Winona County, the most male-oriented occupations are Law Enforcement (77.4%), Cleaning & Maintenance (71.8%), and Security & Protection (63.1%), while the most female-oriented occupations are Personal Care & Service (90.2%), Healthcare Support (85.6%), and Food Preparation & Serving (52.8%).
| Occupation | Male | Female |
| Healthcare Support | 166 (14.4%) | 985 (85.6%) |
| Security & Protection | 161 (63.1%) | 94 (36.9%) |
| Firefighting & Prevention | 120 (59.4%) | 82 (40.6%) |
| Law Enforcement | 41 (77.4%) | 12 (22.6%) |
| Food Preparation & Serving | 753 (47.2%) | 843 (52.8%) |
| Cleaning & Maintenance | 686 (71.8%) | 269 (28.2%) |
| Personal Care & Service | 78 (9.8%) | 720 (90.2%) |
| Total (Category) | 1,844 (38.8%) | 2,911 (61.2%) |
| Total (Overall) | 14,089 (50.9%) | 13,564 (49.0%) |
Sales and Office Occupations
The most common Sales and Office occupations in Winona County are Office & Administration (3,541 | 12.8%), and Sales & Related (2,211 | 8.0%).

Sales and Office Occupations by Sex

| Occupation | Male | Female |
| Sales & Related | 1,285 (58.1%) | 926 (41.9%) |
| Office & Administration | 883 (24.9%) | 2,658 (75.1%) |
| Total (Category) | 2,168 (37.7%) | 3,584 (62.3%) |
| Total (Overall) | 14,089 (50.9%) | 13,564 (49.0%) |
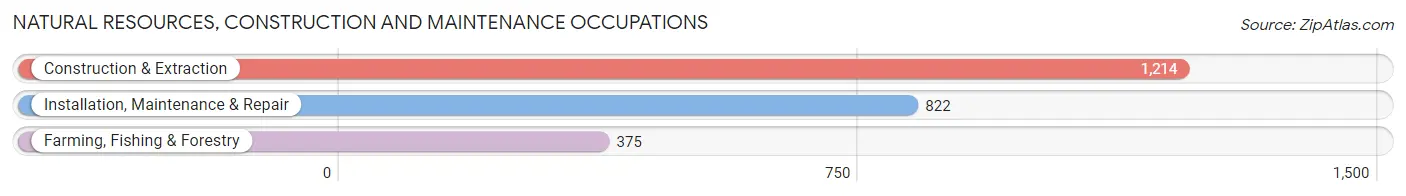
Natural Resources, Construction and Maintenance Occupations
The most common Natural Resources, Construction and Maintenance occupations in Winona County are Construction & Extraction (1,214 | 4.4%), Installation, Maintenance & Repair (822 | 3.0%), and Farming, Fishing & Forestry (375 | 1.4%).
Natural Resources, Construction and Maintenance Occupations by Sex
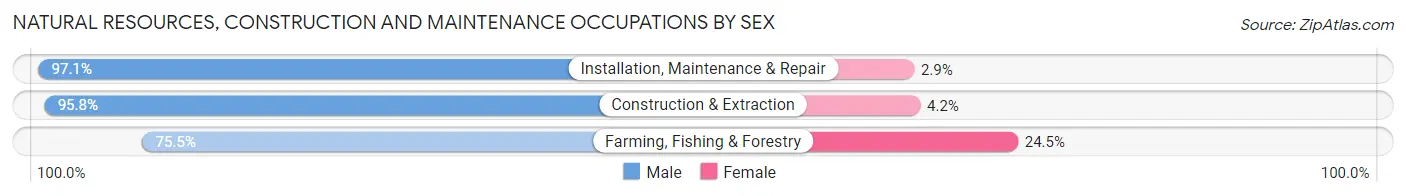
| Occupation | Male | Female |
| Farming, Fishing & Forestry | 283 (75.5%) | 92 (24.5%) |
| Construction & Extraction | 1,163 (95.8%) | 51 (4.2%) |
| Installation, Maintenance & Repair | 798 (97.1%) | 24 (2.9%) |
| Total (Category) | 2,244 (93.1%) | 167 (6.9%) |
| Total (Overall) | 14,089 (50.9%) | 13,564 (49.0%) |
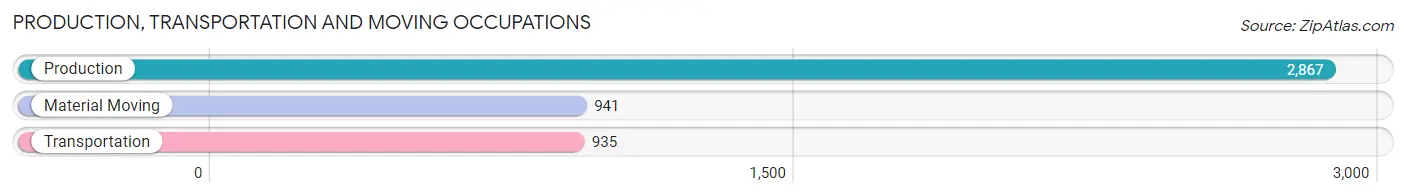
Production, Transportation and Moving Occupations
The most common Production, Transportation and Moving occupations in Winona County are Production (2,867 | 10.4%), Material Moving (941 | 3.4%), and Transportation (935 | 3.4%).
Production, Transportation and Moving Occupations by Sex
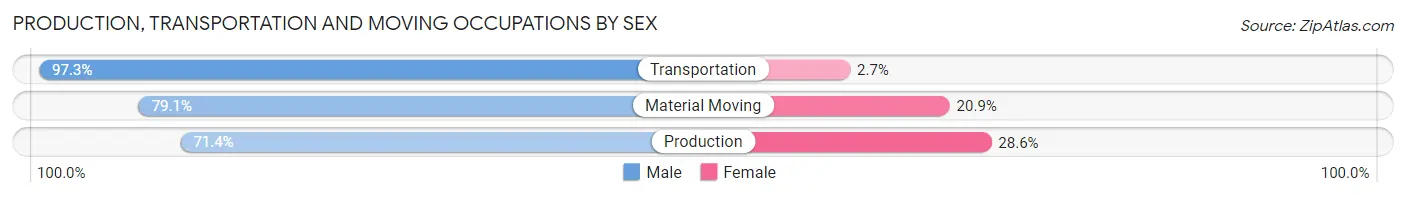
| Occupation | Male | Female |
| Production | 2,047 (71.4%) | 820 (28.6%) |
| Transportation | 910 (97.3%) | 25 (2.7%) |
| Material Moving | 744 (79.1%) | 197 (20.9%) |
| Total (Category) | 3,701 (78.0%) | 1,042 (22.0%) |
| Total (Overall) | 14,089 (50.9%) | 13,564 (49.0%) |
Employment Industries by Sex in Winona County
Employment Industries in Winona County
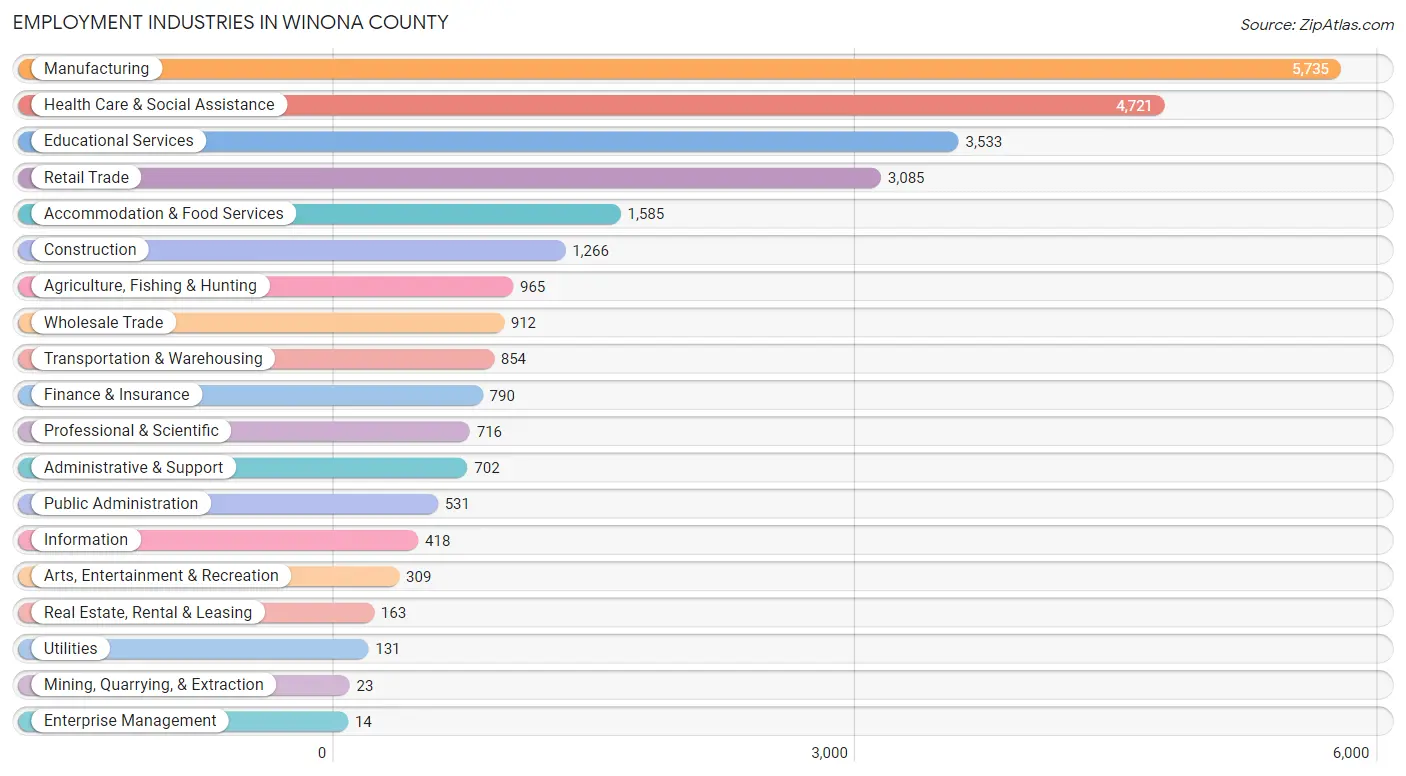
The major employment industries in Winona County include Manufacturing (5,735 | 20.7%), Health Care & Social Assistance (4,721 | 17.1%), Educational Services (3,533 | 12.8%), Retail Trade (3,085 | 11.2%), and Accommodation & Food Services (1,585 | 5.7%).
Employment Industries by Sex in Winona County
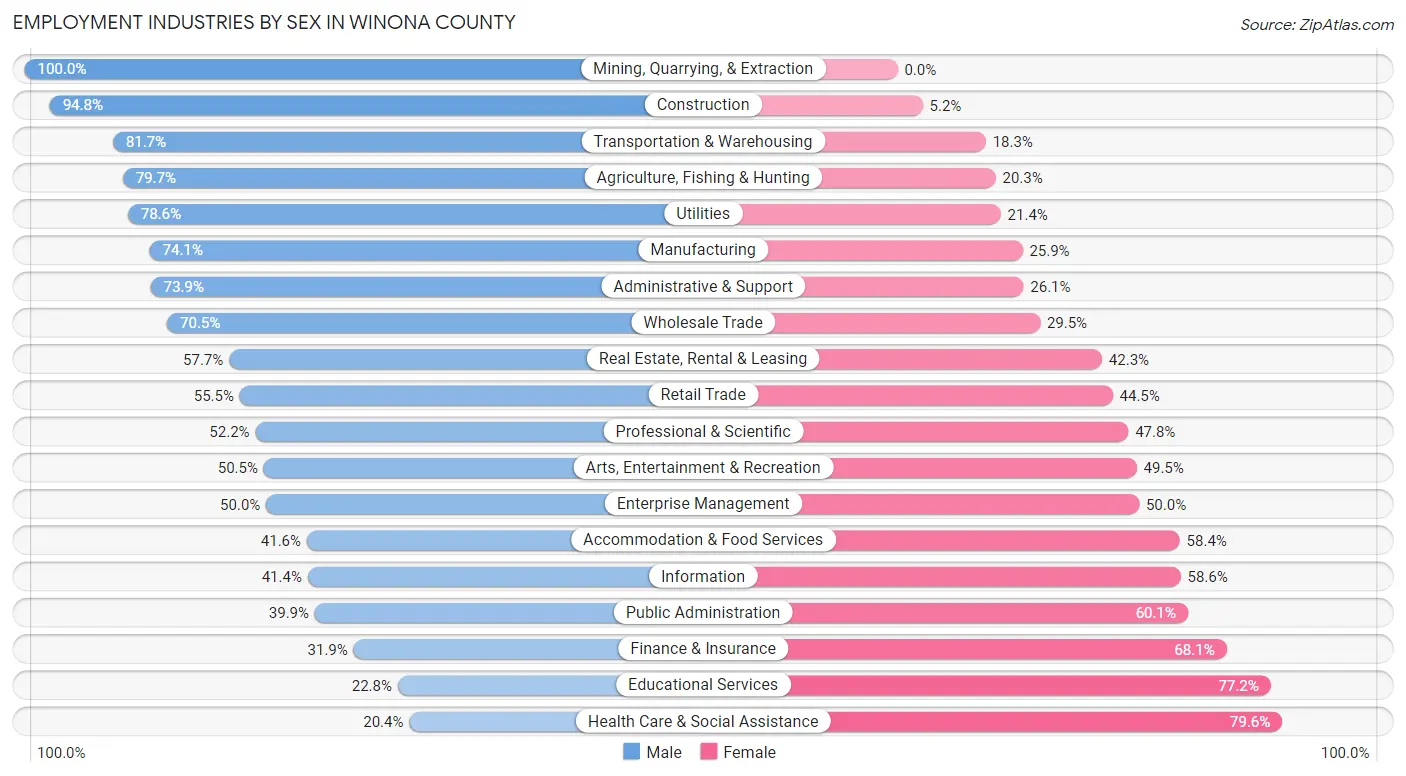
The Winona County industries that see more men than women are Mining, Quarrying, & Extraction (100.0%), Construction (94.8%), and Transportation & Warehousing (81.7%), whereas the industries that tend to have a higher number of women are Health Care & Social Assistance (79.6%), Educational Services (77.2%), and Finance & Insurance (68.1%).
| Industry | Male | Female |
| Agriculture, Fishing & Hunting | 769 (79.7%) | 196 (20.3%) |
| Mining, Quarrying, & Extraction | 23 (100.0%) | 0 (0.0%) |
| Construction | 1,200 (94.8%) | 66 (5.2%) |
| Manufacturing | 4,251 (74.1%) | 1,484 (25.9%) |
| Wholesale Trade | 643 (70.5%) | 269 (29.5%) |
| Retail Trade | 1,711 (55.5%) | 1,374 (44.5%) |
| Transportation & Warehousing | 698 (81.7%) | 156 (18.3%) |
| Utilities | 103 (78.6%) | 28 (21.4%) |
| Information | 173 (41.4%) | 245 (58.6%) |
| Finance & Insurance | 252 (31.9%) | 538 (68.1%) |
| Real Estate, Rental & Leasing | 94 (57.7%) | 69 (42.3%) |
| Professional & Scientific | 374 (52.2%) | 342 (47.8%) |
| Enterprise Management | 7 (50.0%) | 7 (50.0%) |
| Administrative & Support | 519 (73.9%) | 183 (26.1%) |
| Educational Services | 804 (22.8%) | 2,729 (77.2%) |
| Health Care & Social Assistance | 962 (20.4%) | 3,759 (79.6%) |
| Arts, Entertainment & Recreation | 156 (50.5%) | 153 (49.5%) |
| Accommodation & Food Services | 659 (41.6%) | 926 (58.4%) |
| Public Administration | 212 (39.9%) | 319 (60.1%) |
| Total | 14,089 (50.9%) | 13,564 (49.0%) |
Education in Winona County
School Enrollment in Winona County
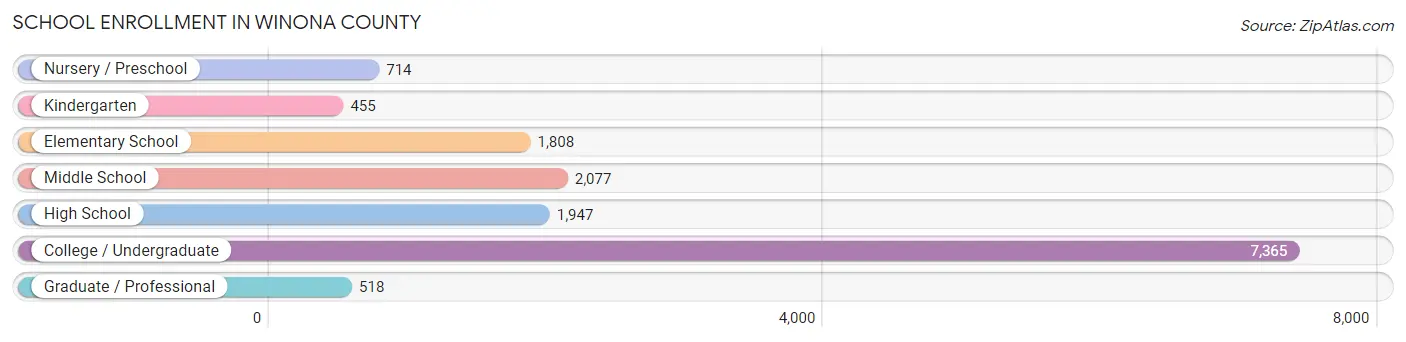
The most common levels of schooling among the 14,884 students in Winona County are college / undergraduate (7,365 | 49.5%), middle school (2,077 | 14.0%), and high school (1,947 | 13.1%).
| School Level | # Students | % Students |
| Nursery / Preschool | 714 | 4.8% |
| Kindergarten | 455 | 3.1% |
| Elementary School | 1,808 | 12.1% |
| Middle School | 2,077 | 14.0% |
| High School | 1,947 | 13.1% |
| College / Undergraduate | 7,365 | 49.5% |
| Graduate / Professional | 518 | 3.5% |
| Total | 14,884 | 100.0% |
School Enrollment by Age by Funding Source in Winona County
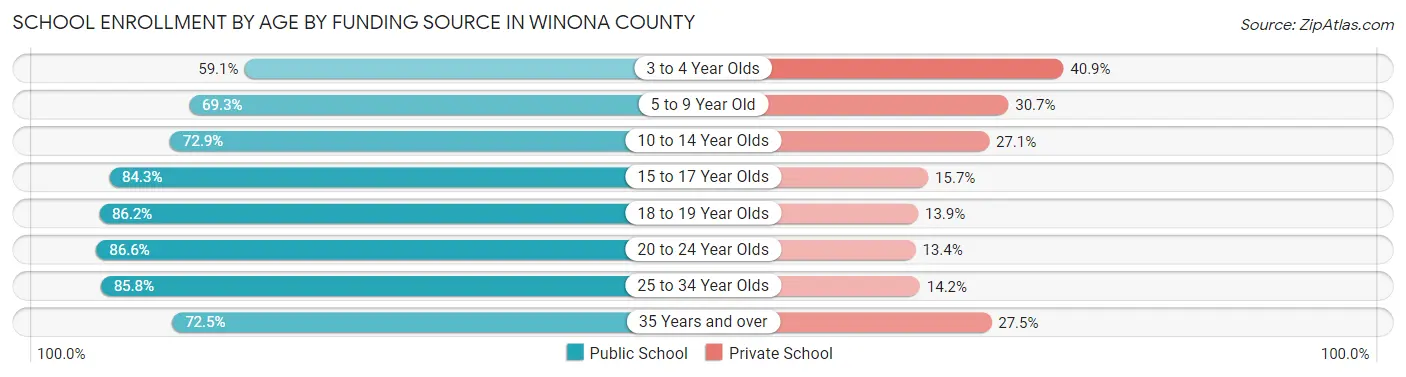
Out of a total of 14,884 students who are enrolled in schools in Winona County, 2,947 (19.8%) attend a private institution, while the remaining 11,937 (80.2%) are enrolled in public schools. The age group of 3 to 4 year olds has the highest likelihood of being enrolled in private schools, with 187 (40.9% in the age bracket) enrolled. Conversely, the age group of 20 to 24 year olds has the lowest likelihood of being enrolled in a private school, with 4,001 (86.6% in the age bracket) attending a public institution.
| Age Bracket | Public School | Private School |
| 3 to 4 Year Olds | 270 (59.1%) | 187 (40.9%) |
| 5 to 9 Year Old | 1,567 (69.3%) | 693 (30.7%) |
| 10 to 14 Year Olds | 1,862 (72.9%) | 691 (27.1%) |
| 15 to 17 Year Olds | 1,215 (84.3%) | 227 (15.7%) |
| 18 to 19 Year Olds | 2,245 (86.2%) | 361 (13.9%) |
| 20 to 24 Year Olds | 4,001 (86.6%) | 618 (13.4%) |
| 25 to 34 Year Olds | 538 (85.8%) | 89 (14.2%) |
| 35 Years and over | 232 (72.5%) | 88 (27.5%) |
| Total | 11,937 (80.2%) | 2,947 (19.8%) |
Educational Attainment by Field of Study in Winona County
Business (1,773 | 16.7%), education (1,740 | 16.4%), science & technology (1,181 | 11.1%), bio, nature & agricultural (867 | 8.2%), and arts & humanities (801 | 7.5%) are the most common fields of study among 10,634 individuals in Winona County who have obtained a bachelor's degree or higher.
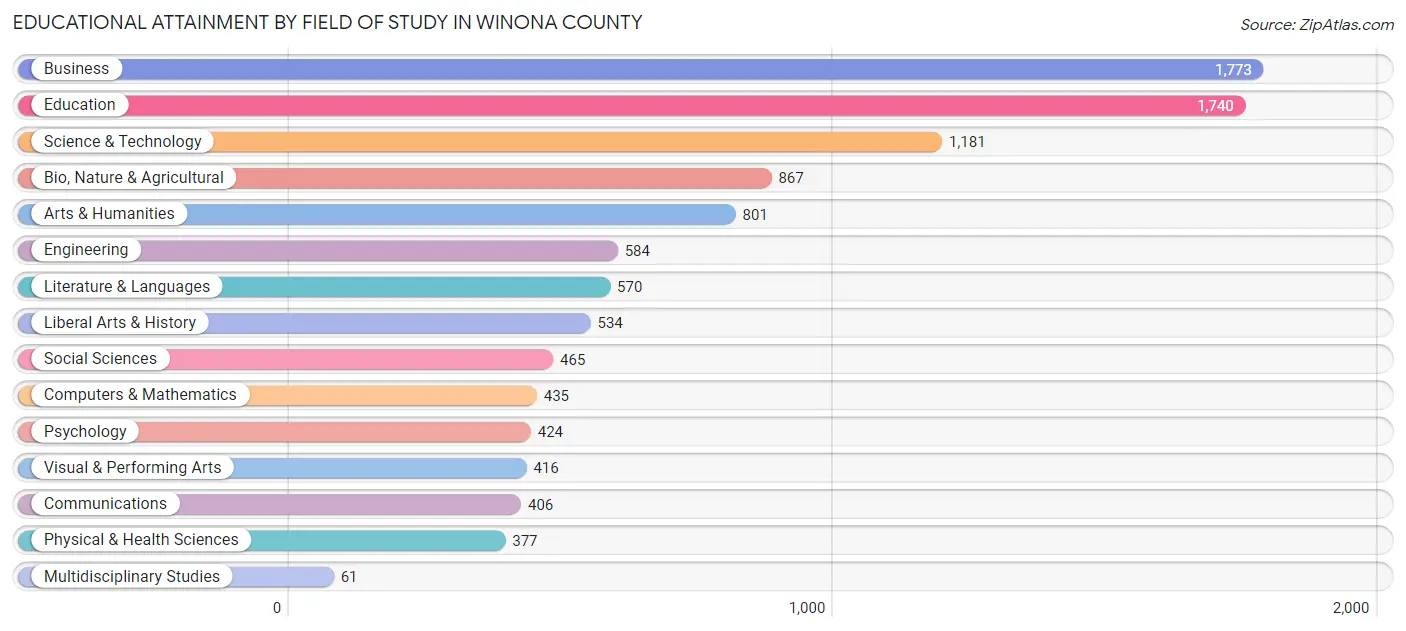
| Field of Study | # Graduates | % Graduates |
| Computers & Mathematics | 435 | 4.1% |
| Bio, Nature & Agricultural | 867 | 8.2% |
| Physical & Health Sciences | 377 | 3.5% |
| Psychology | 424 | 4.0% |
| Social Sciences | 465 | 4.4% |
| Engineering | 584 | 5.5% |
| Multidisciplinary Studies | 61 | 0.6% |
| Science & Technology | 1,181 | 11.1% |
| Business | 1,773 | 16.7% |
| Education | 1,740 | 16.4% |
| Literature & Languages | 570 | 5.4% |
| Liberal Arts & History | 534 | 5.0% |
| Visual & Performing Arts | 416 | 3.9% |
| Communications | 406 | 3.8% |
| Arts & Humanities | 801 | 7.5% |
| Total | 10,634 | 100.0% |
Transportation & Commute in Winona County
Vehicle Availability by Sex in Winona County
The most prevalent vehicle ownership categories in Winona County are males with 2 vehicles (5,806, accounting for 43.5%) and females with 2 vehicles (5,440, making up 46.9%).
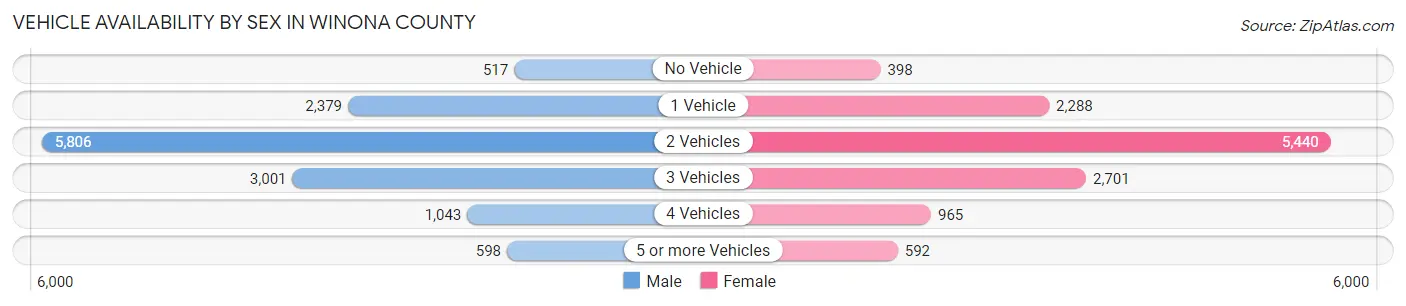
| Vehicles Available | Male | Female |
| No Vehicle | 517 (3.9%) | 398 (3.2%) |
| 1 Vehicle | 2,379 (17.8%) | 2,288 (18.5%) |
| 2 Vehicles | 5,806 (43.5%) | 5,440 (43.9%) |
| 3 Vehicles | 3,001 (22.5%) | 2,701 (21.8%) |
| 4 Vehicles | 1,043 (7.8%) | 965 (7.8%) |
| 5 or more Vehicles | 598 (4.5%) | 592 (4.8%) |
| Total | 13,344 (100.0%) | 12,384 (100.0%) |
Commute Time in Winona County
The most frequently occuring commute durations in Winona County are 5 to 9 minutes (5,887 commuters, 23.7%), 10 to 14 minutes (5,774 commuters, 23.3%), and 15 to 19 minutes (3,592 commuters, 14.5%).
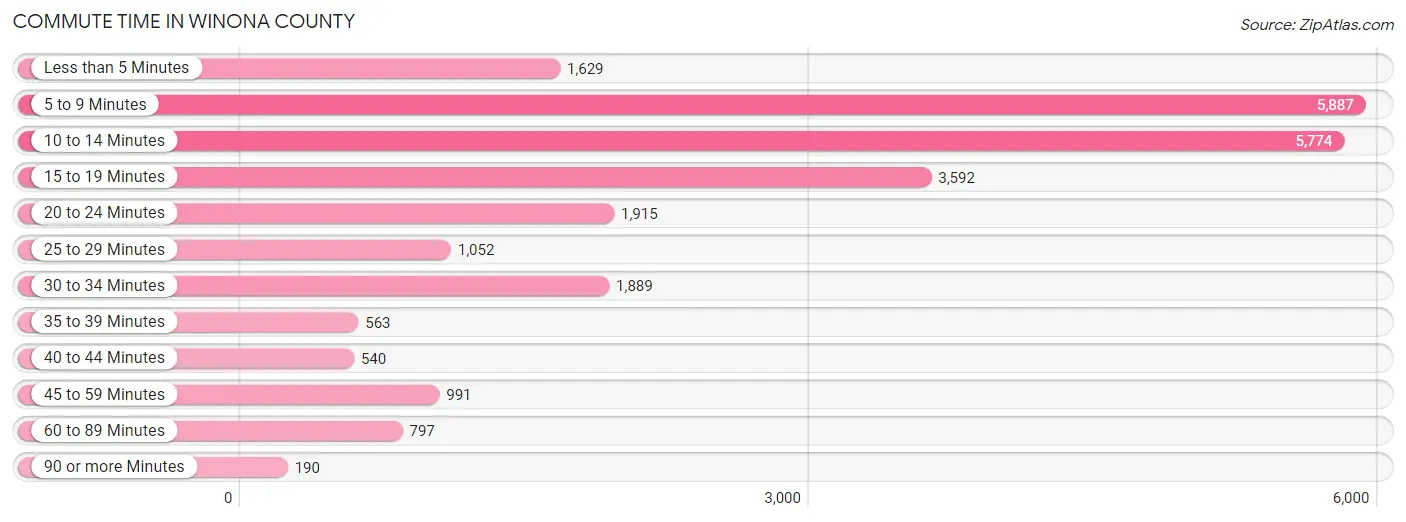
| Commute Time | # Commuters | % Commuters |
| Less than 5 Minutes | 1,629 | 6.6% |
| 5 to 9 Minutes | 5,887 | 23.7% |
| 10 to 14 Minutes | 5,774 | 23.3% |
| 15 to 19 Minutes | 3,592 | 14.5% |
| 20 to 24 Minutes | 1,915 | 7.7% |
| 25 to 29 Minutes | 1,052 | 4.2% |
| 30 to 34 Minutes | 1,889 | 7.6% |
| 35 to 39 Minutes | 563 | 2.3% |
| 40 to 44 Minutes | 540 | 2.2% |
| 45 to 59 Minutes | 991 | 4.0% |
| 60 to 89 Minutes | 797 | 3.2% |
| 90 or more Minutes | 190 | 0.8% |
Commute Time by Sex in Winona County
The most common commute times in Winona County are 5 to 9 minutes (3,062 commuters, 23.9%) for males and 10 to 14 minutes (2,922 commuters, 24.3%) for females.
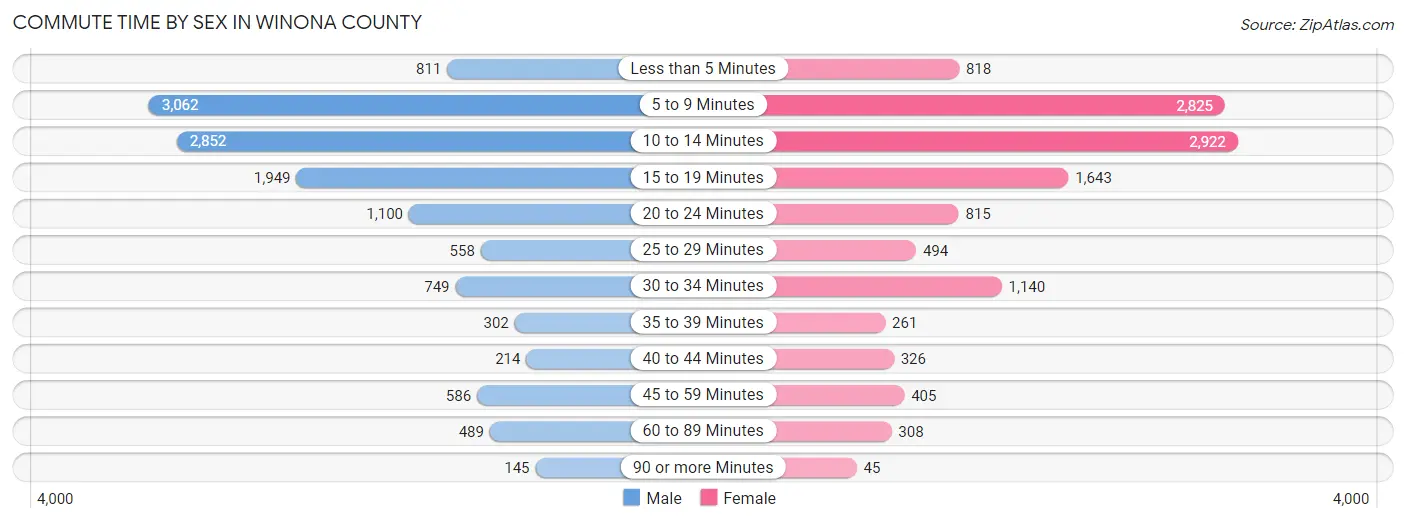
| Commute Time | Male | Female |
| Less than 5 Minutes | 811 (6.3%) | 818 (6.8%) |
| 5 to 9 Minutes | 3,062 (23.9%) | 2,825 (23.5%) |
| 10 to 14 Minutes | 2,852 (22.3%) | 2,922 (24.3%) |
| 15 to 19 Minutes | 1,949 (15.2%) | 1,643 (13.7%) |
| 20 to 24 Minutes | 1,100 (8.6%) | 815 (6.8%) |
| 25 to 29 Minutes | 558 (4.3%) | 494 (4.1%) |
| 30 to 34 Minutes | 749 (5.8%) | 1,140 (9.5%) |
| 35 to 39 Minutes | 302 (2.4%) | 261 (2.2%) |
| 40 to 44 Minutes | 214 (1.7%) | 326 (2.7%) |
| 45 to 59 Minutes | 586 (4.6%) | 405 (3.4%) |
| 60 to 89 Minutes | 489 (3.8%) | 308 (2.6%) |
| 90 or more Minutes | 145 (1.1%) | 45 (0.4%) |
Time of Departure to Work by Sex in Winona County
The most frequent times of departure to work in Winona County are 6:30 AM to 6:59 AM (1,761, 13.7%) for males and 7:00 AM to 7:29 AM (2,089, 17.4%) for females.
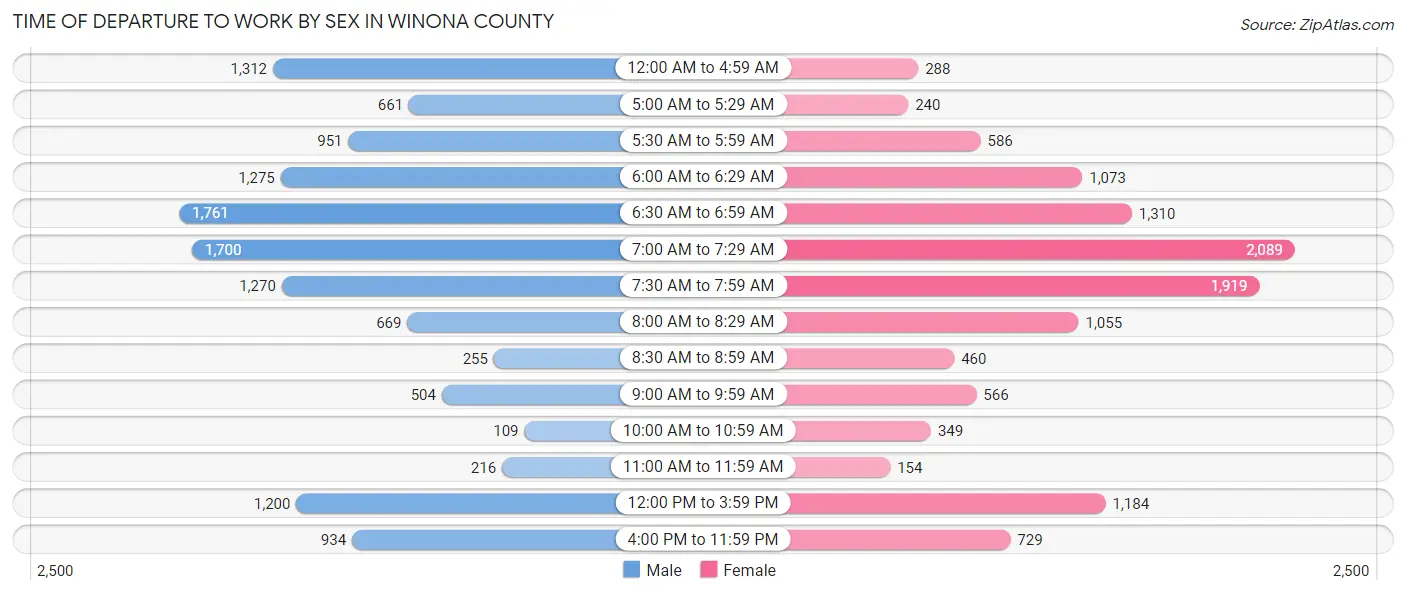
| Time of Departure | Male | Female |
| 12:00 AM to 4:59 AM | 1,312 (10.2%) | 288 (2.4%) |
| 5:00 AM to 5:29 AM | 661 (5.2%) | 240 (2.0%) |
| 5:30 AM to 5:59 AM | 951 (7.4%) | 586 (4.9%) |
| 6:00 AM to 6:29 AM | 1,275 (10.0%) | 1,073 (8.9%) |
| 6:30 AM to 6:59 AM | 1,761 (13.7%) | 1,310 (10.9%) |
| 7:00 AM to 7:29 AM | 1,700 (13.3%) | 2,089 (17.4%) |
| 7:30 AM to 7:59 AM | 1,270 (9.9%) | 1,919 (16.0%) |
| 8:00 AM to 8:29 AM | 669 (5.2%) | 1,055 (8.8%) |
| 8:30 AM to 8:59 AM | 255 (2.0%) | 460 (3.8%) |
| 9:00 AM to 9:59 AM | 504 (3.9%) | 566 (4.7%) |
| 10:00 AM to 10:59 AM | 109 (0.9%) | 349 (2.9%) |
| 11:00 AM to 11:59 AM | 216 (1.7%) | 154 (1.3%) |
| 12:00 PM to 3:59 PM | 1,200 (9.4%) | 1,184 (9.9%) |
| 4:00 PM to 11:59 PM | 934 (7.3%) | 729 (6.1%) |
| Total | 12,817 (100.0%) | 12,002 (100.0%) |
Housing Occupancy in Winona County
Occupancy by Ownership in Winona County
Of the total 20,215 dwellings in Winona County, owner-occupied units account for 13,891 (68.7%), while renter-occupied units make up 6,324 (31.3%).
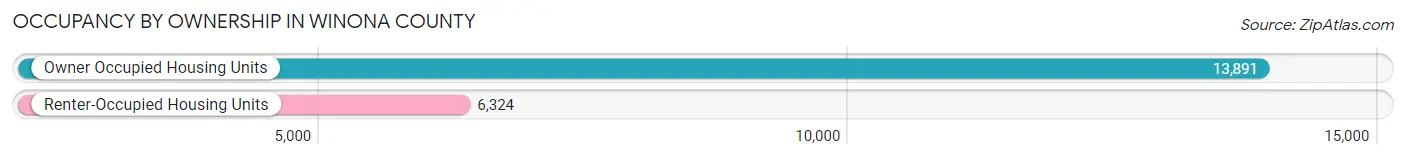
| Occupancy | # Housing Units | % Housing Units |
| Owner Occupied Housing Units | 13,891 | 68.7% |
| Renter-Occupied Housing Units | 6,324 | 31.3% |
| Total Occupied Housing Units | 20,215 | 100.0% |
Occupancy by Household Size in Winona County
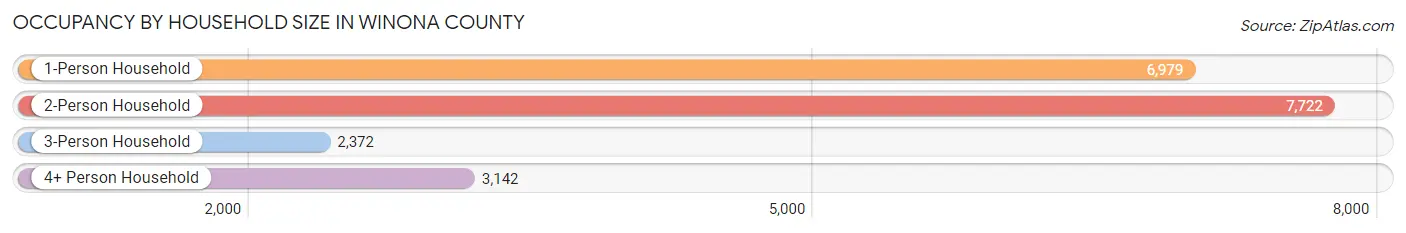
| Household Size | # Housing Units | % Housing Units |
| 1-Person Household | 6,979 | 34.5% |
| 2-Person Household | 7,722 | 38.2% |
| 3-Person Household | 2,372 | 11.7% |
| 4+ Person Household | 3,142 | 15.5% |
| Total Housing Units | 20,215 | 100.0% |
Occupancy by Ownership by Household Size in Winona County
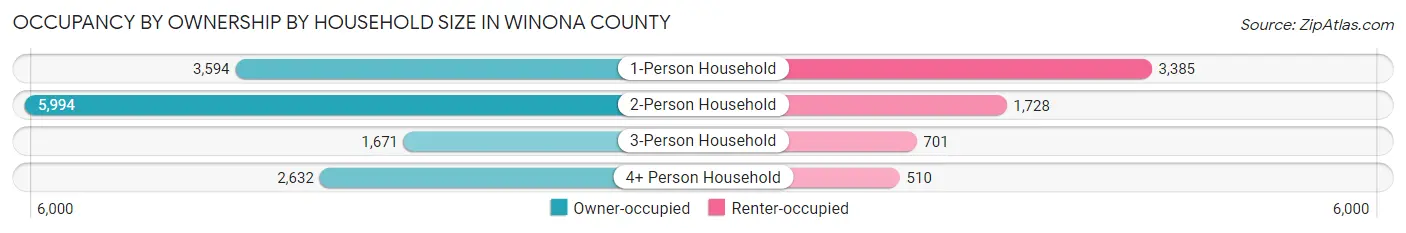
| Household Size | Owner-occupied | Renter-occupied |
| 1-Person Household | 3,594 (51.5%) | 3,385 (48.5%) |
| 2-Person Household | 5,994 (77.6%) | 1,728 (22.4%) |
| 3-Person Household | 1,671 (70.5%) | 701 (29.5%) |
| 4+ Person Household | 2,632 (83.8%) | 510 (16.2%) |
| Total Housing Units | 13,891 (68.7%) | 6,324 (31.3%) |
Occupancy by Educational Attainment in Winona County
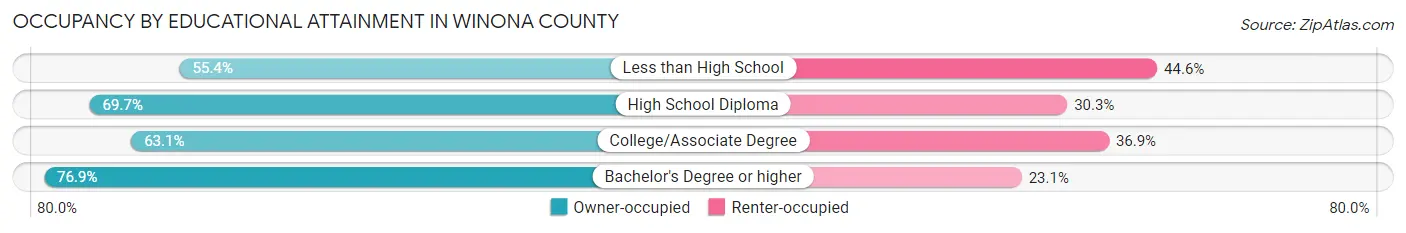
| Household Size | Owner-occupied | Renter-occupied |
| Less than High School | 633 (55.4%) | 509 (44.6%) |
| High School Diploma | 3,317 (69.7%) | 1,442 (30.3%) |
| College/Associate Degree | 4,871 (63.1%) | 2,851 (36.9%) |
| Bachelor's Degree or higher | 5,070 (76.9%) | 1,522 (23.1%) |
Occupancy by Age of Householder in Winona County
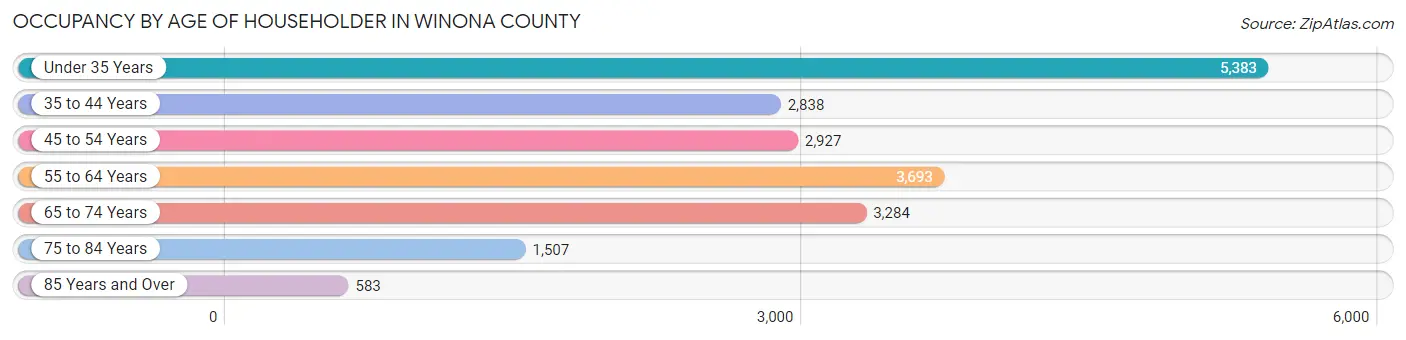
| Age Bracket | # Households | % Households |
| Under 35 Years | 5,383 | 26.6% |
| 35 to 44 Years | 2,838 | 14.0% |
| 45 to 54 Years | 2,927 | 14.5% |
| 55 to 64 Years | 3,693 | 18.3% |
| 65 to 74 Years | 3,284 | 16.3% |
| 75 to 84 Years | 1,507 | 7.4% |
| 85 Years and Over | 583 | 2.9% |
| Total | 20,215 | 100.0% |
Housing Finances in Winona County
Median Income by Occupancy in Winona County
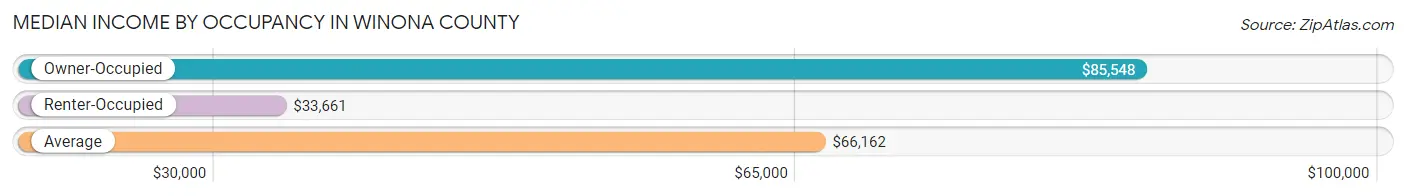
| Occupancy Type | # Households | Median Income |
| Owner-Occupied | 13,891 (68.7%) | $85,548 |
| Renter-Occupied | 6,324 (31.3%) | $33,661 |
| Average | 20,215 (100.0%) | $66,162 |
Occupancy by Householder Income Bracket in Winona County
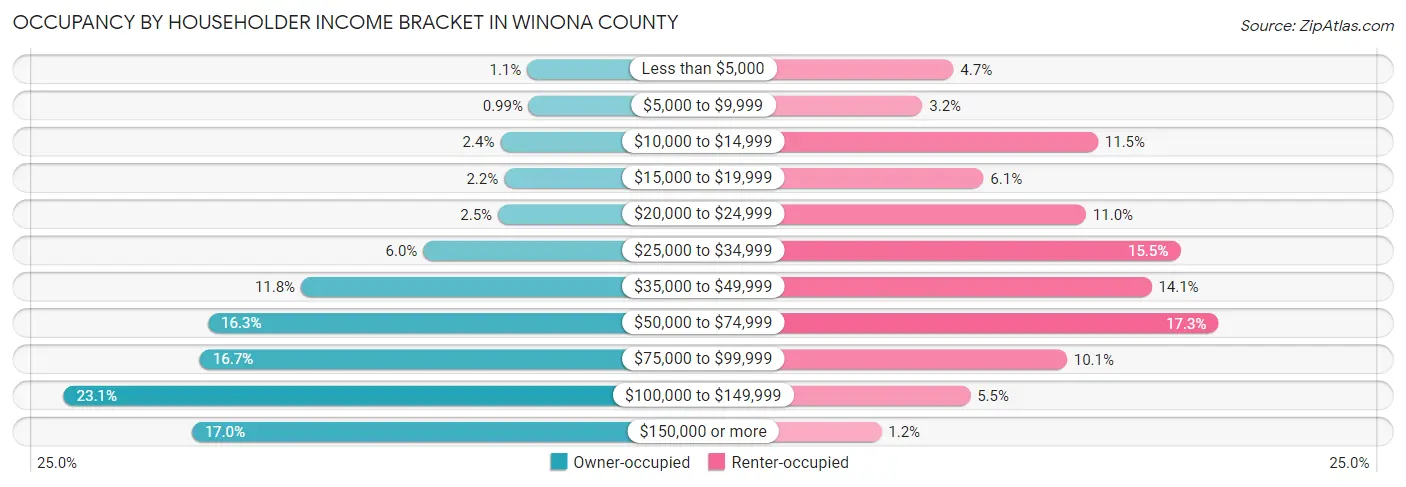
| Income Bracket | Owner-occupied | Renter-occupied |
| Less than $5,000 | 149 (1.1%) | 295 (4.7%) |
| $5,000 to $9,999 | 137 (1.0%) | 201 (3.2%) |
| $10,000 to $14,999 | 327 (2.4%) | 730 (11.5%) |
| $15,000 to $19,999 | 302 (2.2%) | 385 (6.1%) |
| $20,000 to $24,999 | 342 (2.5%) | 694 (11.0%) |
| $25,000 to $34,999 | 836 (6.0%) | 977 (15.4%) |
| $35,000 to $49,999 | 1,645 (11.8%) | 891 (14.1%) |
| $50,000 to $74,999 | 2,259 (16.3%) | 1,092 (17.3%) |
| $75,000 to $99,999 | 2,313 (16.7%) | 636 (10.1%) |
| $100,000 to $149,999 | 3,214 (23.1%) | 345 (5.5%) |
| $150,000 or more | 2,367 (17.0%) | 78 (1.2%) |
| Total | 13,891 (100.0%) | 6,324 (100.0%) |
Monthly Housing Cost Tiers in Winona County
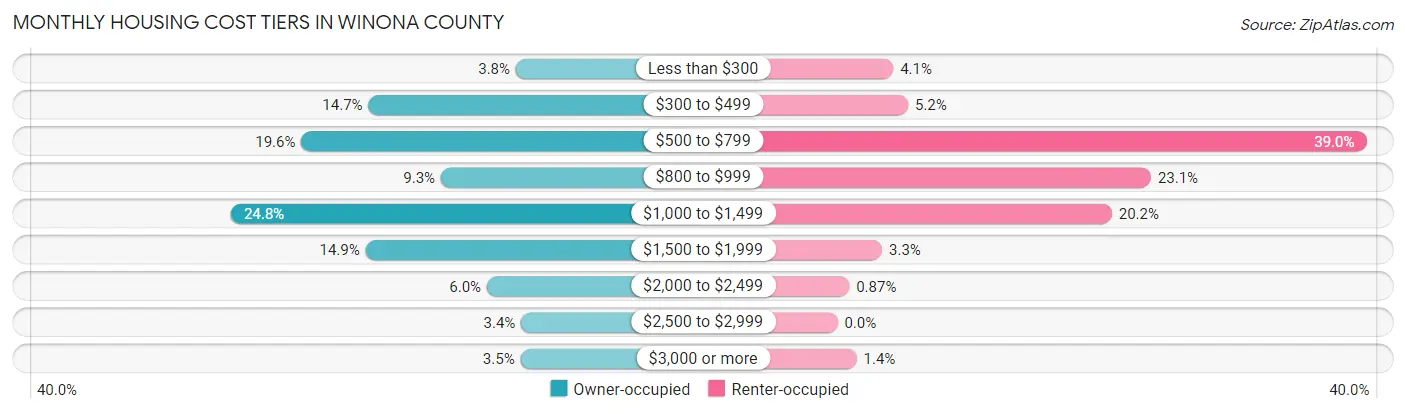
| Monthly Cost | Owner-occupied | Renter-occupied |
| Less than $300 | 530 (3.8%) | 260 (4.1%) |
| $300 to $499 | 2,039 (14.7%) | 329 (5.2%) |
| $500 to $799 | 2,725 (19.6%) | 2,463 (39.0%) |
| $800 to $999 | 1,297 (9.3%) | 1,460 (23.1%) |
| $1,000 to $1,499 | 3,445 (24.8%) | 1,278 (20.2%) |
| $1,500 to $1,999 | 2,068 (14.9%) | 208 (3.3%) |
| $2,000 to $2,499 | 827 (5.9%) | 55 (0.9%) |
| $2,500 to $2,999 | 477 (3.4%) | 0 (0.0%) |
| $3,000 or more | 483 (3.5%) | 89 (1.4%) |
| Total | 13,891 (100.0%) | 6,324 (100.0%) |
Physical Housing Characteristics in Winona County
Housing Structures in Winona County
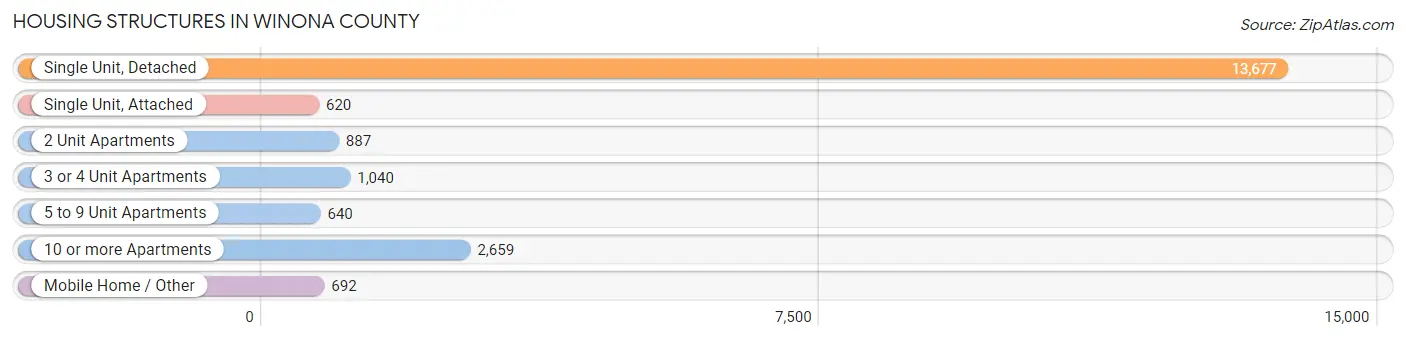
| Structure Type | # Housing Units | % Housing Units |
| Single Unit, Detached | 13,677 | 67.7% |
| Single Unit, Attached | 620 | 3.1% |
| 2 Unit Apartments | 887 | 4.4% |
| 3 or 4 Unit Apartments | 1,040 | 5.1% |
| 5 to 9 Unit Apartments | 640 | 3.2% |
| 10 or more Apartments | 2,659 | 13.2% |
| Mobile Home / Other | 692 | 3.4% |
| Total | 20,215 | 100.0% |
Housing Structures by Occupancy in Winona County
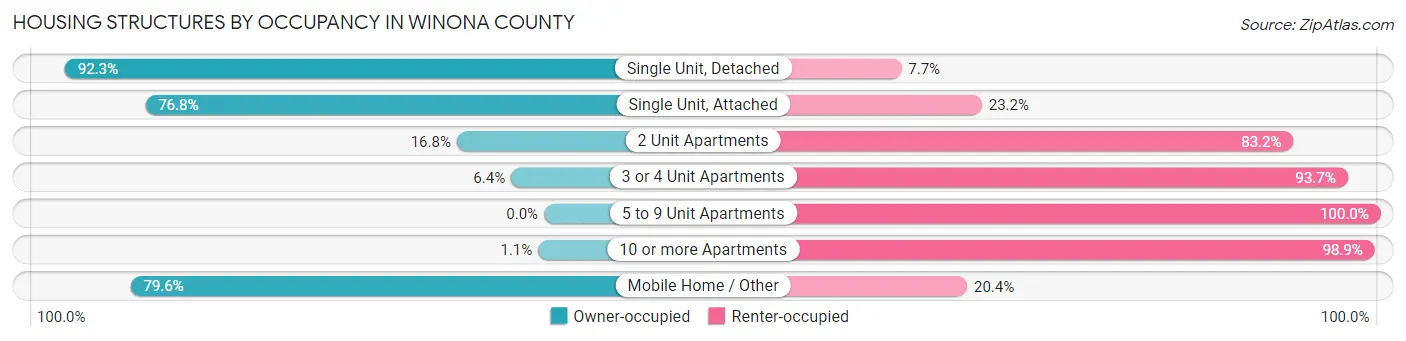
| Structure Type | Owner-occupied | Renter-occupied |
| Single Unit, Detached | 12,619 (92.3%) | 1,058 (7.7%) |
| Single Unit, Attached | 476 (76.8%) | 144 (23.2%) |
| 2 Unit Apartments | 149 (16.8%) | 738 (83.2%) |
| 3 or 4 Unit Apartments | 66 (6.4%) | 974 (93.6%) |
| 5 to 9 Unit Apartments | 0 (0.0%) | 640 (100.0%) |
| 10 or more Apartments | 30 (1.1%) | 2,629 (98.9%) |
| Mobile Home / Other | 551 (79.6%) | 141 (20.4%) |
| Total | 13,891 (68.7%) | 6,324 (31.3%) |
Housing Structures by Number of Rooms in Winona County
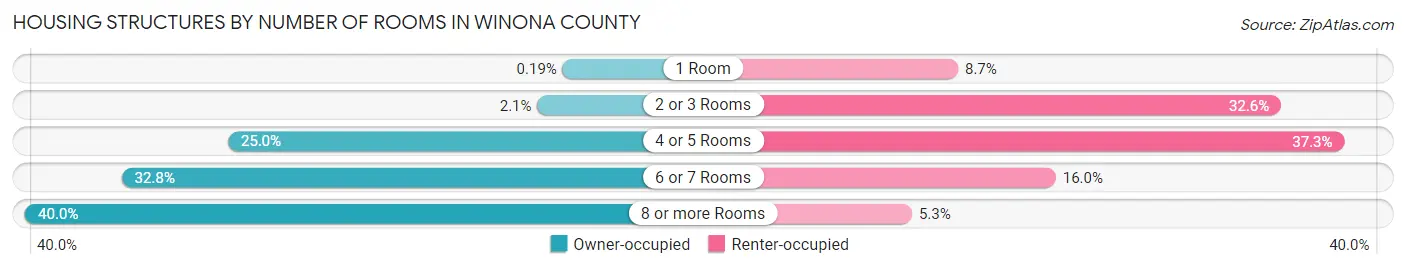
| Number of Rooms | Owner-occupied | Renter-occupied |
| 1 Room | 27 (0.2%) | 553 (8.7%) |
| 2 or 3 Rooms | 286 (2.1%) | 2,064 (32.6%) |
| 4 or 5 Rooms | 3,467 (25.0%) | 2,360 (37.3%) |
| 6 or 7 Rooms | 4,560 (32.8%) | 1,010 (16.0%) |
| 8 or more Rooms | 5,551 (40.0%) | 337 (5.3%) |
| Total | 13,891 (100.0%) | 6,324 (100.0%) |
Housing Structure by Heating Type in Winona County
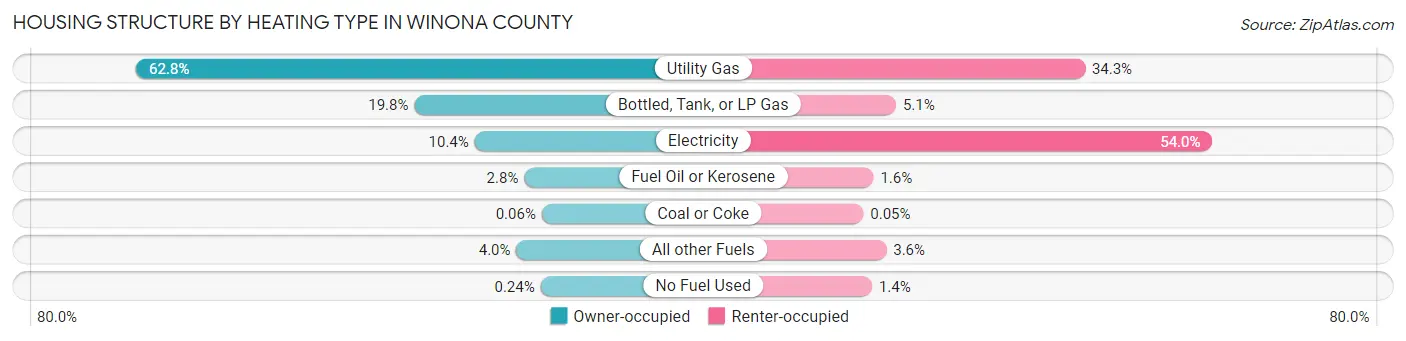
| Heating Type | Owner-occupied | Renter-occupied |
| Utility Gas | 8,720 (62.8%) | 2,169 (34.3%) |
| Bottled, Tank, or LP Gas | 2,745 (19.8%) | 322 (5.1%) |
| Electricity | 1,449 (10.4%) | 3,414 (54.0%) |
| Fuel Oil or Kerosene | 383 (2.8%) | 102 (1.6%) |
| Coal or Coke | 8 (0.1%) | 3 (0.1%) |
| All other Fuels | 553 (4.0%) | 227 (3.6%) |
| No Fuel Used | 33 (0.2%) | 87 (1.4%) |
| Total | 13,891 (100.0%) | 6,324 (100.0%) |
Household Vehicle Usage in Winona County
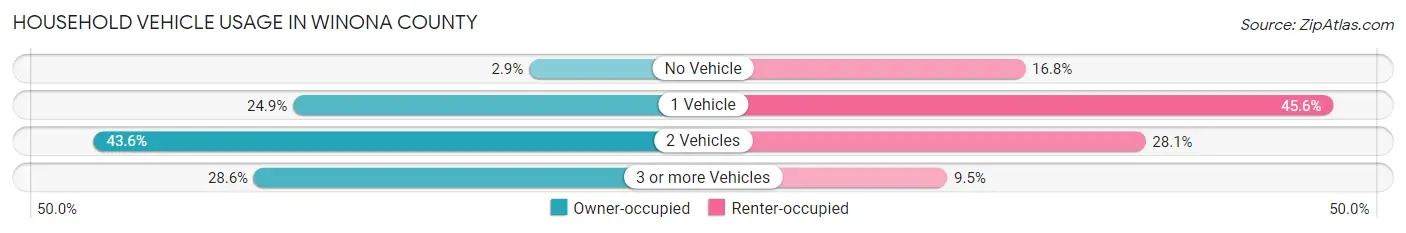
| Vehicles per Household | Owner-occupied | Renter-occupied |
| No Vehicle | 404 (2.9%) | 1,064 (16.8%) |
| 1 Vehicle | 3,465 (24.9%) | 2,883 (45.6%) |
| 2 Vehicles | 6,051 (43.6%) | 1,774 (28.1%) |
| 3 or more Vehicles | 3,971 (28.6%) | 603 (9.5%) |
| Total | 13,891 (100.0%) | 6,324 (100.0%) |
Real Estate & Mortgages in Winona County
Real Estate and Mortgage Overview in Winona County
| Characteristic | Without Mortgage | With Mortgage |
| Housing Units | 5,270 | 8,621 |
| Median Property Value | $196,800 | $207,300 |
| Median Household Income | $67,833 | $1,710 |
| Monthly Housing Costs | $523 | $467 |
| Real Estate Taxes | $1,999 | $103 |
Property Value by Mortgage Status in Winona County
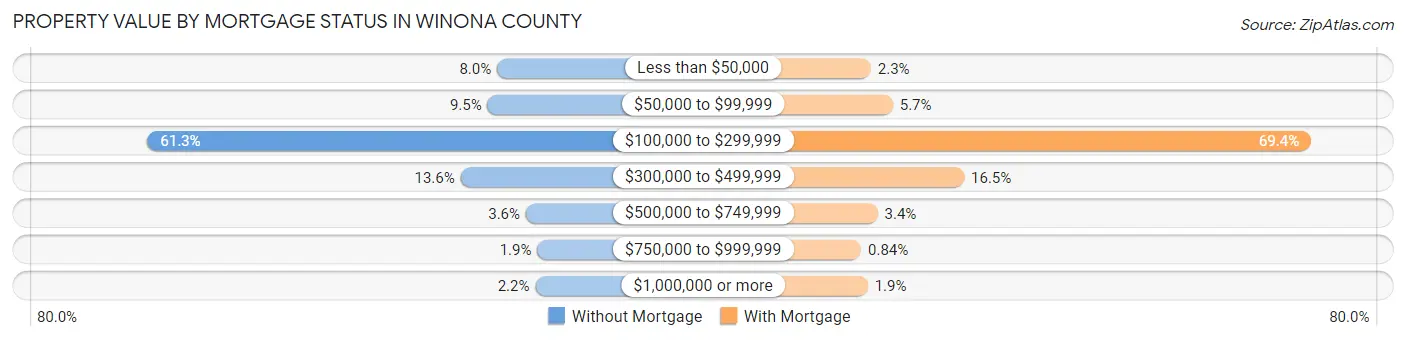
| Property Value | Without Mortgage | With Mortgage |
| Less than $50,000 | 422 (8.0%) | 201 (2.3%) |
| $50,000 to $99,999 | 498 (9.5%) | 489 (5.7%) |
| $100,000 to $299,999 | 3,230 (61.3%) | 5,983 (69.4%) |
| $300,000 to $499,999 | 715 (13.6%) | 1,426 (16.5%) |
| $500,000 to $749,999 | 191 (3.6%) | 290 (3.4%) |
| $750,000 to $999,999 | 99 (1.9%) | 72 (0.8%) |
| $1,000,000 or more | 115 (2.2%) | 160 (1.9%) |
| Total | 5,270 (100.0%) | 8,621 (100.0%) |
Household Income by Mortgage Status in Winona County
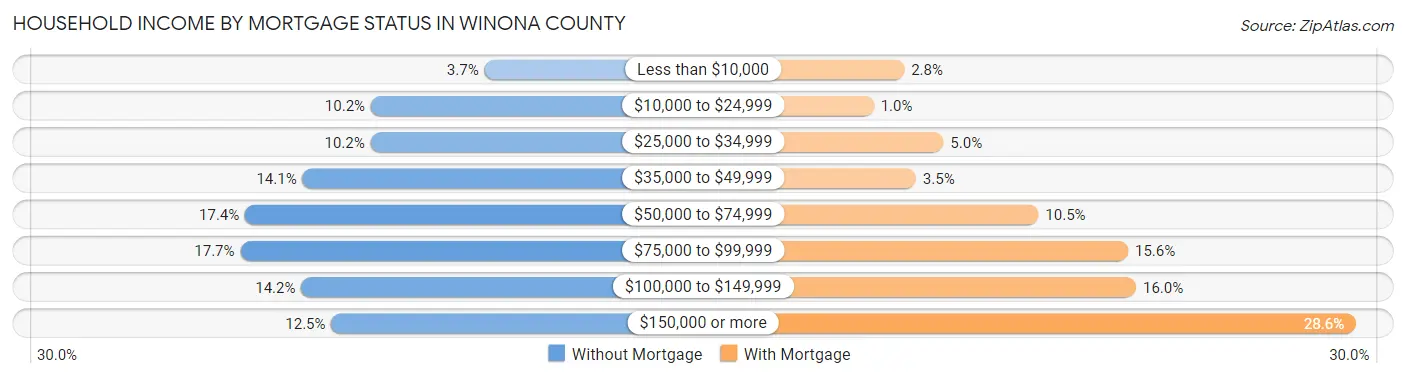
| Household Income | Without Mortgage | With Mortgage |
| Less than $10,000 | 196 (3.7%) | 240 (2.8%) |
| $10,000 to $24,999 | 538 (10.2%) | 90 (1.0%) |
| $25,000 to $34,999 | 539 (10.2%) | 433 (5.0%) |
| $35,000 to $49,999 | 744 (14.1%) | 297 (3.5%) |
| $50,000 to $74,999 | 917 (17.4%) | 901 (10.4%) |
| $75,000 to $99,999 | 931 (17.7%) | 1,342 (15.6%) |
| $100,000 to $149,999 | 748 (14.2%) | 1,382 (16.0%) |
| $150,000 or more | 657 (12.5%) | 2,466 (28.6%) |
| Total | 5,270 (100.0%) | 8,621 (100.0%) |
Property Value to Household Income Ratio in Winona County
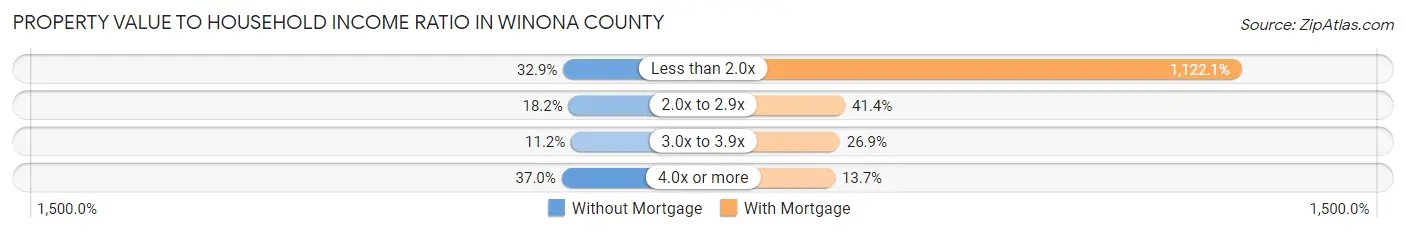
| Value-to-Income Ratio | Without Mortgage | With Mortgage |
| Less than 2.0x | 1,735 (32.9%) | 96,739 (1,122.1%) |
| 2.0x to 2.9x | 961 (18.2%) | 3,570 (41.4%) |
| 3.0x to 3.9x | 588 (11.2%) | 2,320 (26.9%) |
| 4.0x or more | 1,952 (37.0%) | 1,178 (13.7%) |
| Total | 5,270 (100.0%) | 8,621 (100.0%) |
Real Estate Taxes by Mortgage Status in Winona County

| Property Taxes | Without Mortgage | With Mortgage |
| Less than $800 | 806 (15.3%) | 9 (0.1%) |
| $800 to $1,499 | 955 (18.1%) | 615 (7.1%) |
| $800 to $1,499 | 3,391 (64.3%) | 2,366 (27.4%) |
| Total | 5,270 (100.0%) | 8,621 (100.0%) |
Health & Disability in Winona County
Health Insurance Coverage by Age in Winona County
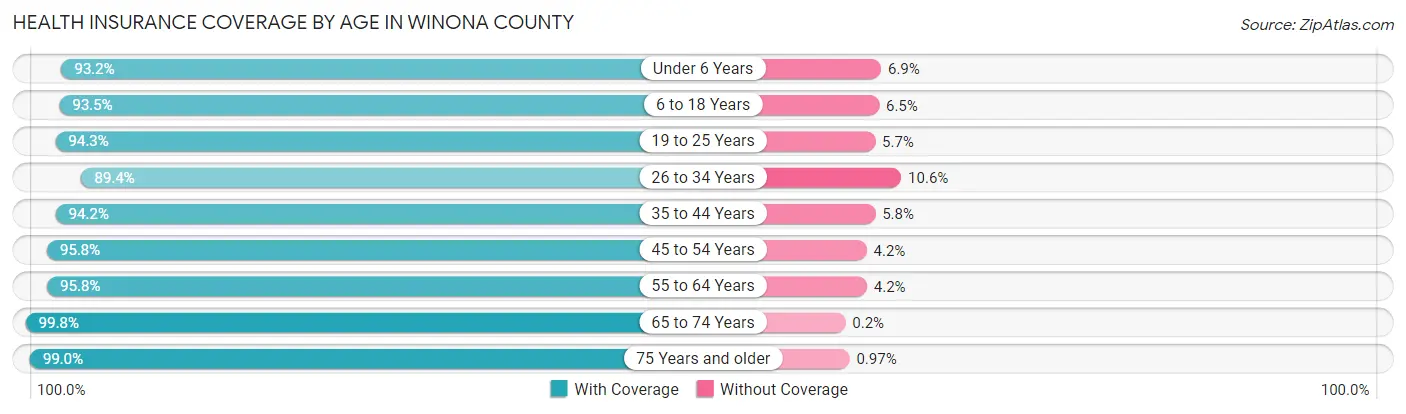
| Age Bracket | With Coverage | Without Coverage |
| Under 6 Years | 2,720 (93.1%) | 200 (6.9%) |
| 6 to 18 Years | 6,840 (93.5%) | 474 (6.5%) |
| 19 to 25 Years | 8,523 (94.3%) | 519 (5.7%) |
| 26 to 34 Years | 4,704 (89.4%) | 558 (10.6%) |
| 35 to 44 Years | 4,749 (94.2%) | 291 (5.8%) |
| 45 to 54 Years | 4,764 (95.8%) | 207 (4.2%) |
| 55 to 64 Years | 6,031 (95.8%) | 265 (4.2%) |
| 65 to 74 Years | 5,074 (99.8%) | 10 (0.2%) |
| 75 Years and older | 3,366 (99.0%) | 33 (1.0%) |
| Total | 46,771 (94.8%) | 2,557 (5.2%) |
Health Insurance Coverage by Citizenship Status in Winona County

| Citizenship Status | With Coverage | Without Coverage |
| Native Born | 2,720 (93.1%) | 200 (6.9%) |
| Foreign Born, Citizen | 6,840 (93.5%) | 474 (6.5%) |
| Foreign Born, not a Citizen | 8,523 (94.3%) | 519 (5.7%) |
Health Insurance Coverage by Household Income in Winona County
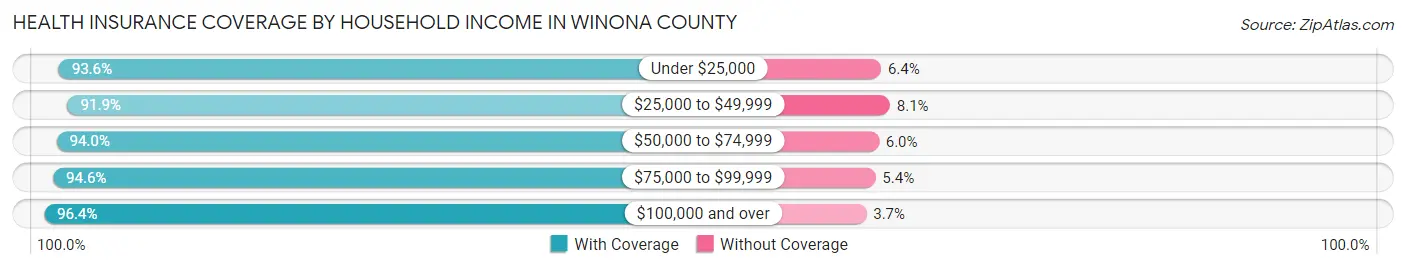
| Household Income | With Coverage | Without Coverage |
| Under $25,000 | 4,655 (93.6%) | 319 (6.4%) |
| $25,000 to $49,999 | 7,071 (91.9%) | 621 (8.1%) |
| $50,000 to $74,999 | 6,782 (94.0%) | 432 (6.0%) |
| $75,000 to $99,999 | 7,280 (94.6%) | 412 (5.4%) |
| $100,000 and over | 18,034 (96.4%) | 683 (3.6%) |
Public vs Private Health Insurance Coverage by Age in Winona County
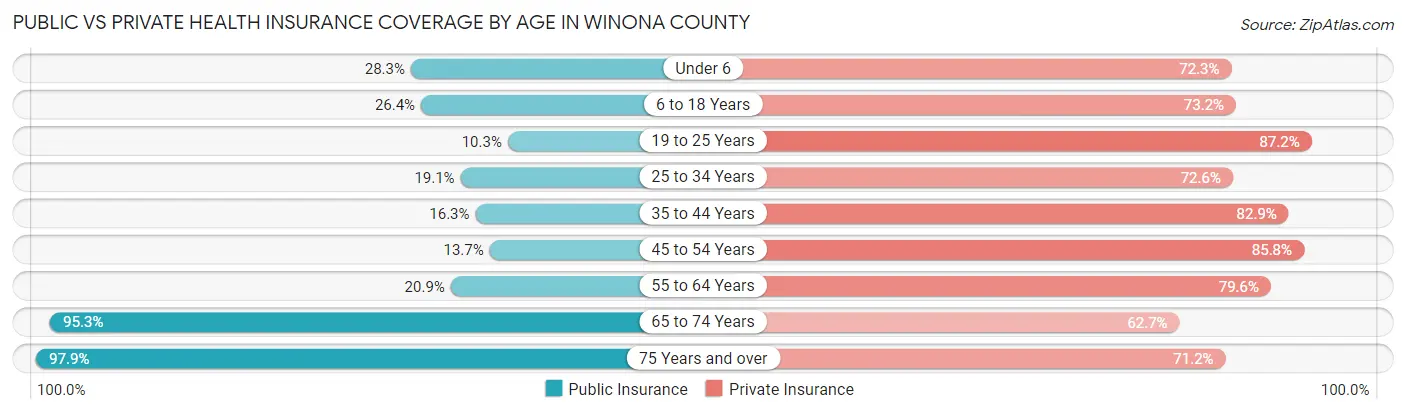
| Age Bracket | Public Insurance | Private Insurance |
| Under 6 | 827 (28.3%) | 2,111 (72.3%) |
| 6 to 18 Years | 1,933 (26.4%) | 5,350 (73.2%) |
| 19 to 25 Years | 933 (10.3%) | 7,885 (87.2%) |
| 25 to 34 Years | 1,005 (19.1%) | 3,818 (72.6%) |
| 35 to 44 Years | 823 (16.3%) | 4,180 (82.9%) |
| 45 to 54 Years | 681 (13.7%) | 4,263 (85.8%) |
| 55 to 64 Years | 1,317 (20.9%) | 5,013 (79.6%) |
| 65 to 74 Years | 4,843 (95.3%) | 3,186 (62.7%) |
| 75 Years and over | 3,326 (97.9%) | 2,420 (71.2%) |
| Total | 15,688 (31.8%) | 38,226 (77.5%) |
Disability Status by Sex by Age in Winona County
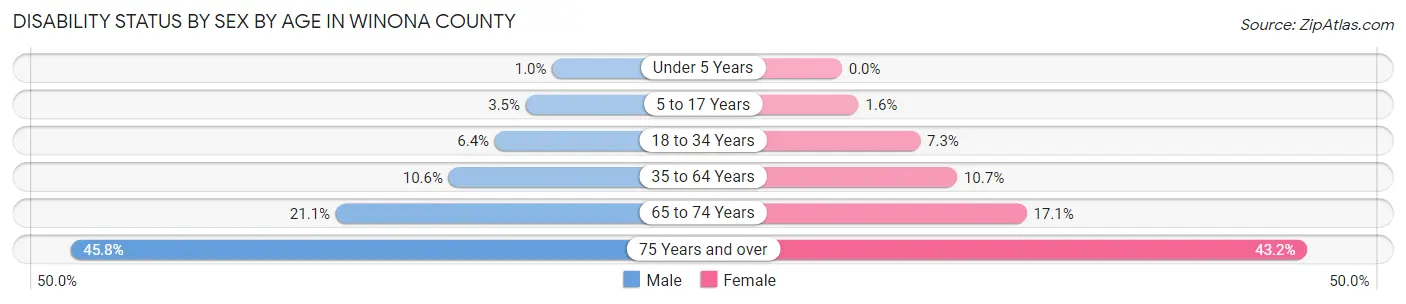
| Age Bracket | Male | Female |
| Under 5 Years | 12 (1.0%) | 0 (0.0%) |
| 5 to 17 Years | 115 (3.5%) | 50 (1.6%) |
| 18 to 34 Years | 497 (6.4%) | 574 (7.3%) |
| 35 to 64 Years | 875 (10.6%) | 863 (10.7%) |
| 65 to 74 Years | 541 (21.1%) | 432 (17.1%) |
| 75 Years and over | 690 (45.8%) | 817 (43.2%) |
Disability Class by Sex by Age in Winona County
Disability Class: Hearing Difficulty
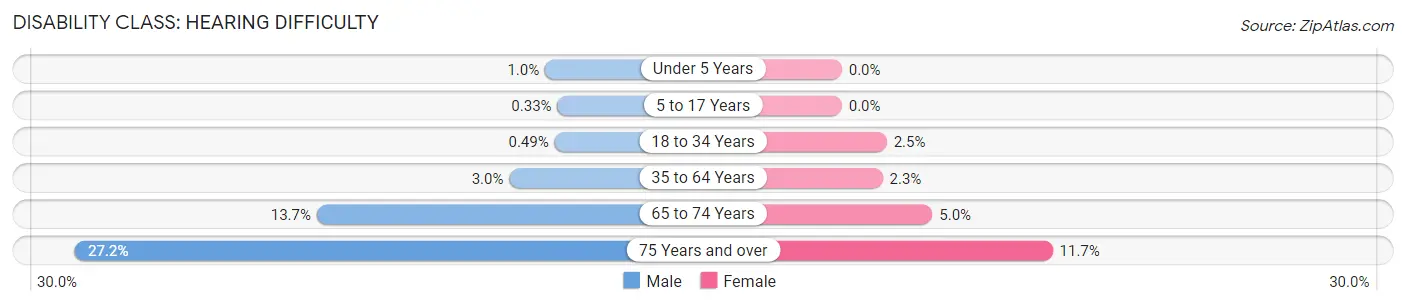
| Age Bracket | Male | Female |
| Under 5 Years | 12 (1.0%) | 0 (0.0%) |
| 5 to 17 Years | 11 (0.3%) | 0 (0.0%) |
| 18 to 34 Years | 38 (0.5%) | 197 (2.5%) |
| 35 to 64 Years | 248 (3.0%) | 183 (2.3%) |
| 65 to 74 Years | 352 (13.7%) | 127 (5.0%) |
| 75 Years and over | 410 (27.2%) | 222 (11.7%) |
Disability Class: Vision Difficulty
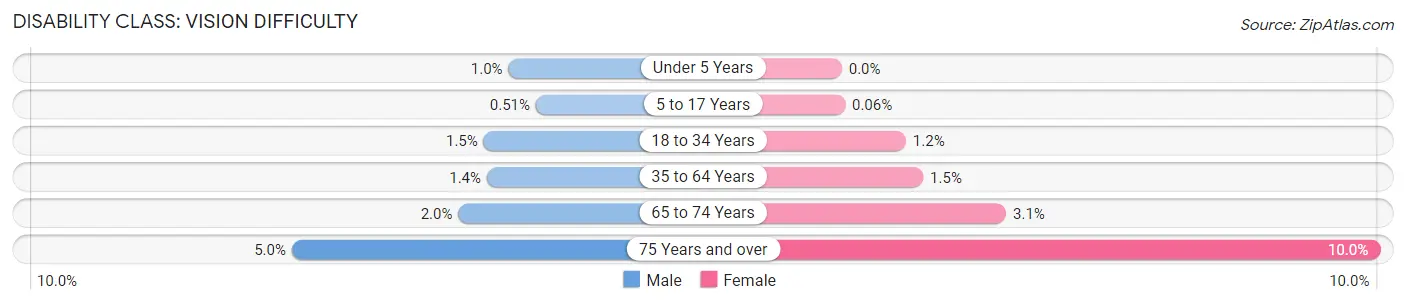
| Age Bracket | Male | Female |
| Under 5 Years | 12 (1.0%) | 0 (0.0%) |
| 5 to 17 Years | 17 (0.5%) | 2 (0.1%) |
| 18 to 34 Years | 116 (1.5%) | 94 (1.2%) |
| 35 to 64 Years | 117 (1.4%) | 122 (1.5%) |
| 65 to 74 Years | 50 (1.9%) | 77 (3.0%) |
| 75 Years and over | 76 (5.0%) | 189 (10.0%) |
Disability Class: Cognitive Difficulty
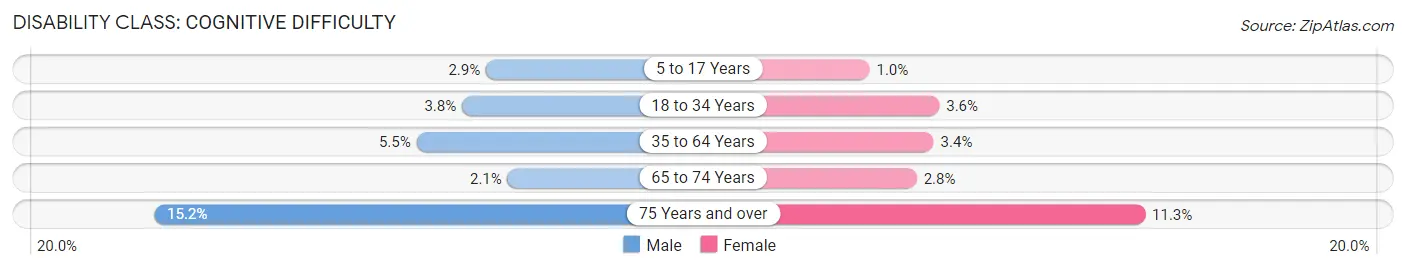
| Age Bracket | Male | Female |
| 5 to 17 Years | 95 (2.9%) | 33 (1.0%) |
| 18 to 34 Years | 294 (3.8%) | 286 (3.6%) |
| 35 to 64 Years | 449 (5.4%) | 275 (3.4%) |
| 65 to 74 Years | 53 (2.1%) | 70 (2.8%) |
| 75 Years and over | 229 (15.2%) | 213 (11.3%) |
Disability Class: Ambulatory Difficulty
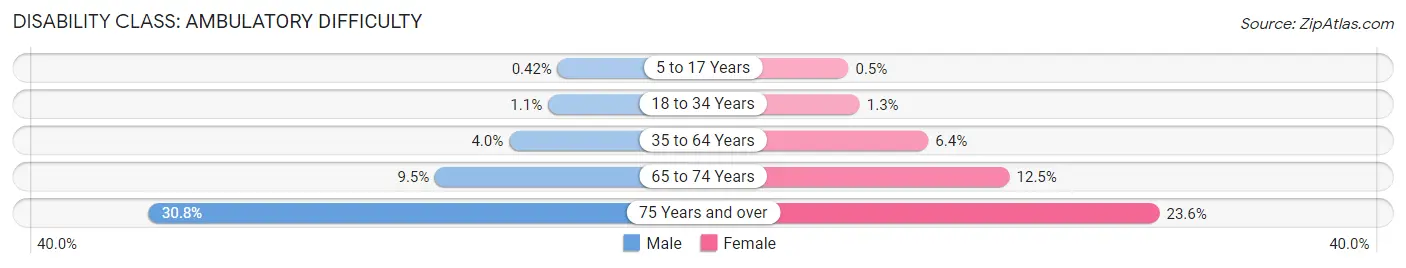
| Age Bracket | Male | Female |
| 5 to 17 Years | 14 (0.4%) | 16 (0.5%) |
| 18 to 34 Years | 89 (1.1%) | 106 (1.3%) |
| 35 to 64 Years | 332 (4.0%) | 519 (6.4%) |
| 65 to 74 Years | 244 (9.5%) | 314 (12.5%) |
| 75 Years and over | 464 (30.8%) | 446 (23.6%) |
Disability Class: Self-Care Difficulty
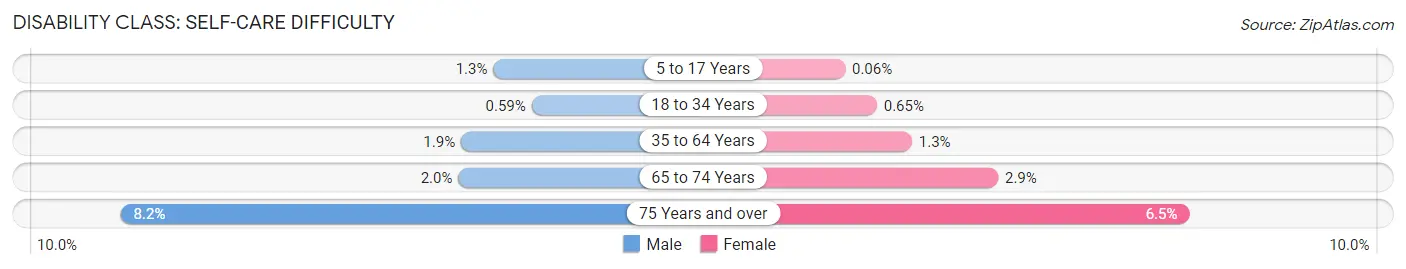
| Age Bracket | Male | Female |
| 5 to 17 Years | 43 (1.3%) | 2 (0.1%) |
| 18 to 34 Years | 46 (0.6%) | 51 (0.6%) |
| 35 to 64 Years | 156 (1.9%) | 105 (1.3%) |
| 65 to 74 Years | 50 (1.9%) | 73 (2.9%) |
| 75 Years and over | 124 (8.2%) | 122 (6.5%) |
Technology Access in Winona County
Computing Device Access in Winona County
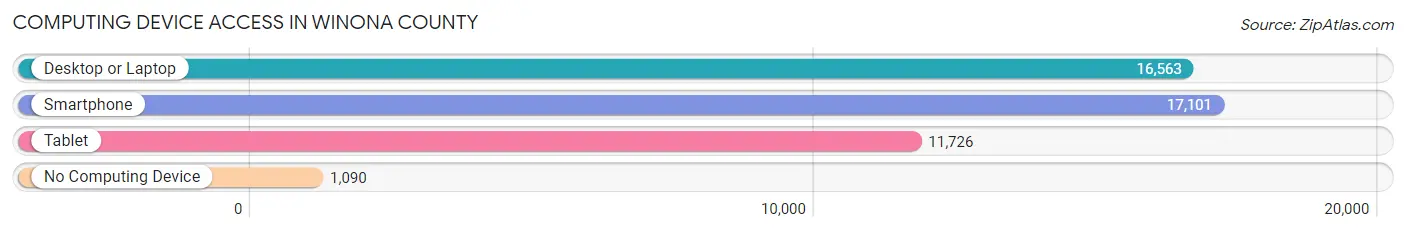
| Device Type | # Households | % Households |
| Desktop or Laptop | 16,563 | 81.9% |
| Smartphone | 17,101 | 84.6% |
| Tablet | 11,726 | 58.0% |
| No Computing Device | 1,090 | 5.4% |
| Total | 20,215 | 100.0% |
Internet Access in Winona County
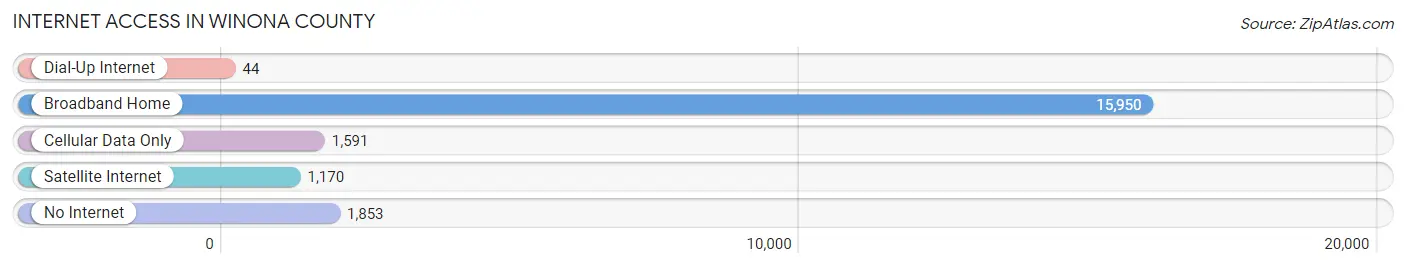
| Internet Type | # Households | % Households |
| Dial-Up Internet | 44 | 0.2% |
| Broadband Home | 15,950 | 78.9% |
| Cellular Data Only | 1,591 | 7.9% |
| Satellite Internet | 1,170 | 5.8% |
| No Internet | 1,853 | 9.2% |
| Total | 20,215 | 100.0% |
Winona County Summary
Winona County is located in southeastern Minnesota, along the Mississippi River. It is bordered by Wabasha County to the north, Houston County to the east, Fillmore County to the south, and La Crosse County, Wisconsin to the west. The county seat is Winona, and the county has a total area of 576 square miles.
History
Winona County was established in 1854, and was named after the Dakota Sioux word for “first-born daughter.” The county was originally part of the Minnesota Territory, and was one of the original nine counties established in the state. The county was originally home to the Dakota Sioux, and the first white settlers arrived in the area in the early 1800s. The county was home to several Native American tribes, including the Dakota Sioux, Ojibwe, and Winnebago.
The county was home to several important historical events, including the Battle of Whitewater in 1855, which was the first battle of the Dakota War of 1862. The county was also home to the Winona State Normal School, which was established in 1858 and is now known as Winona State University.
Geography
Winona County is located in southeastern Minnesota, along the Mississippi River. The county is bordered by Wabasha County to the north, Houston County to the east, Fillmore County to the south, and La Crosse County, Wisconsin to the west. The county has a total area of 576 square miles, and is mostly flat with rolling hills. The county is home to several rivers, including the Mississippi, Root, and Whitewater Rivers. The county is also home to several lakes, including Lake Winona, Lake Onalaska, and Lake Pepin.
Economy
The economy of Winona County is largely based on agriculture, manufacturing, and tourism. The county is home to several large agricultural operations, including dairy farms, beef farms, and vegetable farms. The county is also home to several manufacturing companies, including Winona Foods, Winona Manufacturing, and Winona Plastics. Tourism is also an important part of the county’s economy, with several popular attractions, including the Winona County Historical Society, the Winona County Fair, and the Winona County Museum.
Demographics
As of the 2010 census, Winona County had a population of 51,461. The population was spread out, with 24.7% under the age of 18, 11.2% from 18 to 24, 25.2% from 25 to 44, 24.2% from 45 to 64, and 14.7% who were 65 years of age or older. The median age was 37.4 years. The gender makeup of the county was 49.3% male and 50.7% female.
The median income for a household in the county was $45,945, and the median income for a family was $56,945. The per capita income for the county was $22,945. About 8.2% of families and 11.2% of the population were below the poverty line, including 15.2% of those under age 18 and 8.2% of those age 65 or over.
Common Questions
What is the Total Population of Winona County?
Total Population of Winona County is 49,792.
What is the Total Male Population of Winona County?
Total Male Population of Winona County is 24,786.
What is the Total Female Population of Winona County?
Total Female Population of Winona County is 25,006.
What is the Ratio of Males per 100 Females in Winona County?
There are 99.12 Males per 100 Females in Winona County.
What is the Ratio of Females per 100 Males in Winona County?
There are 100.89 Females per 100 Males in Winona County.
What is the Median Population Age in Winona County?
Median Population Age in Winona County is 35.6 Years.
What is the Average Family Size in Winona County
Average Family Size in Winona County is 3.0 People.
What is the Average Household Size in Winona County
Average Household Size in Winona County is 2.3 People.
What is Per Capita Income in Winona County?
Per Capita income in Winona County is $34,889.
What is the Median Family Income in Winona County?
Median Family Income in Winona County is $92,534.
What is the Median Household income in Winona County?
Median Household Income in Winona County is $66,162.
What is Income or Wage Gap in Winona County?
Income or Wage Gap in Winona County is 28.4%.
Women in Winona County earn 71.6 cents for every dollar earned by a man.
What is Family Income Deficit in Winona County?
Family Income Deficit in Winona County is $9,335.
Families that are below poverty line in Winona County earn $9,335 less on average than the poverty threshold level.
What is Inequality or Gini Index in Winona County?
Inequality or Gini Index in Winona County is 0.43.
How Large is the Labor Force in Winona County?
There are 28,488 People in the Labor Forcein in Winona County.
What is the Percentage of People in the Labor Force in Winona County?
68.1% of People are in the Labor Force in Winona County.
What is the Unemployment Rate in Winona County?
Unemployment Rate in Winona County is 2.8%.