Wadena County, MN
Wadena County Map

Wadena County Overview
14,108
TOTAL POPULATION
6,998
MALE POPULATION
7,110
FEMALE POPULATION
98.42
MALES / 100 FEMALES
101.60
FEMALES / 100 MALES
40.0
MEDIAN AGE
3.0
AVG FAMILY SIZE
2.4
AVG HOUSEHOLD SIZE
$28,011
PER CAPITA INCOME
$75,333
AVG FAMILY INCOME
$54,747
AVG HOUSEHOLD INCOME
26.1%
WAGE / INCOME GAP [ % ]
73.9¢/ $1
WAGE / INCOME GAP [ $ ]
$8,259
FAMILY INCOME DEFICIT
0.41
INEQUALITY / GINI INDEX
6,687
LABOR FORCE [ PEOPLE ]
61.7%
PERCENT IN LABOR FORCE
6.1%
UNEMPLOYMENT RATE
Wadena County Area Codes
Race in Wadena County
The most populous races in Wadena County are White / Caucasian (12,999 | 92.1%), Two or more Races (852 | 6.0%), and Hispanic or Latino (311 | 2.2%).

| Race | # Population | % Population |
| Asian | 71 | 0.5% |
| Black / African American | 76 | 0.5% |
| Hawaiian / Pacific | 0 | 0.0% |
| Hispanic or Latino | 311 | 2.2% |
| Native / Alaskan | 43 | 0.3% |
| White / Caucasian | 12,999 | 92.1% |
| Two or more Races | 852 | 6.0% |
| Some other Race | 67 | 0.5% |
| Total | 14,108 | 100.0% |
Ancestry in Wadena County
The most populous ancestries reported in Wadena County are German (4,815 | 34.1%), Norwegian (1,813 | 12.9%), Finnish (1,697 | 12.0%), Irish (994 | 7.0%), and Swedish (928 | 6.6%), together accounting for 72.6% of all Wadena County residents.

| Ancestry | # Population | % Population |
| African | 139 | 1.0% |
| American | 547 | 3.9% |
| Austrian | 7 | 0.1% |
| Belgian | 9 | 0.1% |
| Blackfeet | 1 | 0.0% |
| Brazilian | 26 | 0.2% |
| British | 6 | 0.0% |
| Burmese | 43 | 0.3% |
| Celtic | 1 | 0.0% |
| Central American | 9 | 0.1% |
| Central American Indian | 11 | 0.1% |
| Cherokee | 20 | 0.1% |
| Cheyenne | 1 | 0.0% |
| Chippewa | 101 | 0.7% |
| Choctaw | 35 | 0.3% |
| Cree | 1 | 0.0% |
| Croatian | 11 | 0.1% |
| Crow | 3 | 0.0% |
| Czech | 89 | 0.6% |
| Czechoslovakian | 10 | 0.1% |
| Danish | 154 | 1.1% |
| Dutch | 179 | 1.3% |
| Eastern European | 24 | 0.2% |
| English | 731 | 5.2% |
| European | 116 | 0.8% |
| Finnish | 1,697 | 12.0% |
| French | 217 | 1.5% |
| French Canadian | 235 | 1.7% |
| German | 4,815 | 34.1% |
| Greek | 8 | 0.1% |
| Guatemalan | 9 | 0.1% |
| Hungarian | 16 | 0.1% |
| Icelander | 34 | 0.2% |
| Indian (Asian) | 3 | 0.0% |
| Inupiat | 23 | 0.2% |
| Iranian | 17 | 0.1% |
| Irish | 994 | 7.0% |
| Italian | 168 | 1.2% |
| Jamaican | 11 | 0.1% |
| Korean | 32 | 0.2% |
| Luxembourger | 2 | 0.0% |
| Malaysian | 14 | 0.1% |
| Mexican | 254 | 1.8% |
| Northern European | 2 | 0.0% |
| Norwegian | 1,813 | 12.9% |
| Pakistani | 5 | 0.0% |
| Pennsylvania German | 4 | 0.0% |
| Polish | 361 | 2.6% |
| Portuguese | 12 | 0.1% |
| Puerto Rican | 28 | 0.2% |
| Russian | 29 | 0.2% |
| Scandinavian | 178 | 1.3% |
| Scotch-Irish | 95 | 0.7% |
| Scottish | 62 | 0.4% |
| Serbian | 1 | 0.0% |
| Sioux | 8 | 0.1% |
| Slavic | 1 | 0.0% |
| South American | 10 | 0.1% |
| Soviet Union | 1 | 0.0% |
| Spanish | 2 | 0.0% |
| Subsaharan African | 139 | 1.0% |
| Swedish | 928 | 6.6% |
| Swiss | 30 | 0.2% |
| Ukrainian | 14 | 0.1% |
| Uruguayan | 10 | 0.1% |
| Welsh | 61 | 0.4% |
| Yugoslavian | 1 | 0.0% | View All 67 Rows |
Immigrants in Wadena County
The most numerous immigrant groups reported in Wadena County came from Africa (123 | 0.9%), Asia (57 | 0.4%), Latin America (50 | 0.4%), South America (30 | 0.2%), and South Eastern Asia (29 | 0.2%), together accounting for 2.0% of all Wadena County residents.

| Immigration Origin | # Population | % Population |
| Africa | 123 | 0.9% |
| Asia | 57 | 0.4% |
| Brazil | 26 | 0.2% |
| Canada | 17 | 0.1% |
| Caribbean | 2 | 0.0% |
| Central America | 18 | 0.1% |
| China | 3 | 0.0% |
| Eastern Asia | 27 | 0.2% |
| Europe | 4 | 0.0% |
| Germany | 4 | 0.0% |
| Guatemala | 9 | 0.1% |
| Jamaica | 2 | 0.0% |
| Korea | 24 | 0.2% |
| Latin America | 50 | 0.4% |
| Mexico | 9 | 0.1% |
| Philippines | 17 | 0.1% |
| South America | 30 | 0.2% |
| South Central Asia | 1 | 0.0% |
| South Eastern Asia | 29 | 0.2% |
| Sri Lanka | 1 | 0.0% |
| Thailand | 12 | 0.1% |
| Uruguay | 3 | 0.0% |
| Venezuela | 1 | 0.0% |
| Western Africa | 2 | 0.0% |
| Western Europe | 4 | 0.0% | View All 25 Rows |
Sex and Age in Wadena County
Sex and Age in Wadena County
The most populous age groups in Wadena County are 60 to 64 Years (647 | 9.2%) for men and 5 to 9 Years (600 | 8.4%) for women.

| Age Bracket | Male | Female |
| Under 5 Years | 504 (7.2%) | 427 (6.0%) |
| 5 to 9 Years | 517 (7.4%) | 600 (8.4%) |
| 10 to 14 Years | 523 (7.5%) | 449 (6.3%) |
| 15 to 19 Years | 474 (6.8%) | 581 (8.2%) |
| 20 to 24 Years | 336 (4.8%) | 325 (4.6%) |
| 25 to 29 Years | 364 (5.2%) | 427 (6.0%) |
| 30 to 34 Years | 360 (5.1%) | 377 (5.3%) |
| 35 to 39 Years | 458 (6.5%) | 329 (4.6%) |
| 40 to 44 Years | 328 (4.7%) | 412 (5.8%) |
| 45 to 49 Years | 423 (6.0%) | 349 (4.9%) |
| 50 to 54 Years | 454 (6.5%) | 358 (5.0%) |
| 55 to 59 Years | 318 (4.5%) | 462 (6.5%) |
| 60 to 64 Years | 647 (9.2%) | 470 (6.6%) |
| 65 to 69 Years | 436 (6.2%) | 507 (7.1%) |
| 70 to 74 Years | 333 (4.8%) | 286 (4.0%) |
| 75 to 79 Years | 222 (3.2%) | 207 (2.9%) |
| 80 to 84 Years | 208 (3.0%) | 160 (2.2%) |
| 85 Years and over | 93 (1.3%) | 384 (5.4%) |
| Total | 6,998 (100.0%) | 7,110 (100.0%) |
Families and Households in Wadena County
Median Family Size in Wadena County
The median family size in Wadena County is 3.01 persons per family, with married-couple families (2,741 | 75.5%) accounting for the largest median family size of 3.19 persons per family. On the other hand, single male/father families (342 | 9.4%) represent the smallest median family size with 2.34 persons per family.

| Family Type | # Families | Family Size |
| Married-Couple | 2,741 (75.5%) | 3.19 |
| Single Male/Father | 342 (9.4%) | 2.34 |
| Single Female/Mother | 549 (15.1%) | 2.52 |
| Total Families | 3,632 (100.0%) | 3.01 |
Median Household Size in Wadena County
The median household size in Wadena County is 2.38 persons per household, with married-couple households (2,741 | 47.8%) accounting for the largest median household size of 3.2 persons per household. non-family households (2,102 | 36.7%) represent the smallest median household size with 1.21 persons per household.

| Household Type | # Households | Household Size |
| Married-Couple | 2,741 (47.8%) | 3.20 |
| Single Male/Father | 342 (6.0%) | 2.53 |
| Single Female/Mother | 549 (9.6%) | 2.69 |
| Non-family | 2,102 (36.7%) | 1.21 |
| Total Households | 5,734 (100.0%) | 2.38 |
Household Size by Marriage Status in Wadena County
Out of a total of 5,734 households in Wadena County, 3,632 (63.3%) are family households, while 2,102 (36.7%) are nonfamily households. The most numerous type of family households are 2-person households, comprising 1,801, and the most common type of nonfamily households are 1-person households, comprising 1,657.

| Household Size | Family Households | Nonfamily Households |
| 1-Person Households | - | 1,657 (28.9%) |
| 2-Person Households | 1,801 (31.4%) | 417 (7.3%) |
| 3-Person Households | 767 (13.4%) | 22 (0.4%) |
| 4-Person Households | 496 (8.6%) | 4 (0.1%) |
| 5-Person Households | 334 (5.8%) | 0 (0.0%) |
| 6-Person Households | 122 (2.1%) | 2 (0.0%) |
| 7+ Person Households | 112 (1.9%) | 0 (0.0%) |
| Total | 3,632 (63.3%) | 2,102 (36.7%) |
Female Fertility in Wadena County
Fertility by Age in Wadena County
Average fertility rate in Wadena County is 47.0 births per 1,000 women. Women in the age bracket of 20 to 34 years have the highest fertility rate with 115.0 births per 1,000 women. Women in the age bracket of 20 to 34 years acount for 95.6% of all women with births.

| Age Bracket | Women with Births | Births / 1,000 Women |
| 15 to 19 years | 0 (0.0%) | 0.0 |
| 20 to 34 years | 130 (95.6%) | 115.0 |
| 35 to 50 years | 6 (4.4%) | 5.0 |
| Total | 136 (100.0%) | 47.0 |
Fertility by Age by Marriage Status in Wadena County
66.9% of women with births (136) in Wadena County are married. The highest percentage of unmarried women with births falls into 20 to 34 years age bracket with 34.6% of them unmarried at the time of birth, while the lowest percentage of unmarried women with births belong to 35 to 50 years age bracket with 0.0% of them unmarried.

| Age Bracket | Married | Unmarried |
| 15 to 19 years | 0 (0.0%) | 0 (0.0%) |
| 20 to 34 years | 85 (65.4%) | 45 (34.6%) |
| 35 to 50 years | 6 (100.0%) | 0 (0.0%) |
| Total | 91 (66.9%) | 45 (33.1%) |
Fertility by Education in Wadena County

| Educational Attainment | Women with Births | Births / 1,000 Women |
| Less than High School | 4 (2.9%) | 7.0 |
| High School Diploma | 52 (38.2%) | 73.0 |
| College or Associate's Degree | 48 (35.3%) | 42.0 |
| Bachelor's Degree | 32 (23.5%) | 79.0 |
| Graduate Degree | 0 (0.0%) | 0.0 |
| Total | 136 (100.0%) | 47.0 |
Fertility by Education by Marriage Status in Wadena County
33.1% of women with births in Wadena County are unmarried. Women with the educational attainment of less than high school are most likely to be married with 100.0% of them married at childbirth, while women with the educational attainment of high school diploma are least likely to be married with 76.9% of them unmarried at childbirth.

| Educational Attainment | Married | Unmarried |
| Less than High School | 4 (100.0%) | 0 (0.0%) |
| High School Diploma | 12 (23.1%) | 40 (76.9%) |
| College or Associate's Degree | 43 (89.6%) | 5 (10.4%) |
| Bachelor's Degree | 32 (100.0%) | 0 (0.0%) |
| Graduate Degree | 0 (0.0%) | 0 (0.0%) |
| Total | 91 (66.9%) | 45 (33.1%) |
Income in Wadena County
Income Overview in Wadena County
Per Capita Income in Wadena County is $28,011, while median incomes of families and households are $75,333 and $54,747 respectively.
| Characteristic | Number | Measure |
| Per Capita Income | 14,108 | $28,011 |
| Median Family Income | 3,632 | $75,333 |
| Mean Family Income | 3,632 | $84,239 |
| Median Household Income | 5,734 | $54,747 |
| Mean Household Income | 5,734 | $68,445 |
| Income Deficit | 3,632 | $8,259 |
| Wage / Income Gap (%) | 14,108 | 26.13% |
| Wage / Income Gap ($) | 14,108 | 73.87¢ per $1 |
| Gini / Inequality Index | 14,108 | 0.41 |
Earnings by Sex in Wadena County
Average Earnings in Wadena County are $34,481, $39,468 for men and $29,154 for women, a difference of 26.1%.

| Sex | Number | Average Earnings |
| Male | 3,477 (49.6%) | $39,468 |
| Female | 3,535 (50.4%) | $29,154 |
| Total | 7,012 (100.0%) | $34,481 |
Earnings by Sex by Income Bracket in Wadena County
The most common earnings brackets in Wadena County are $75,000 to $99,999 for men (386 | 11.1%) and $55,000 to $64,999 for women (315 | 8.9%).

| Income | Male | Female |
| $2,499 or less | 207 (5.9%) | 195 (5.5%) |
| $2,500 to $4,999 | 114 (3.3%) | 168 (4.8%) |
| $5,000 to $7,499 | 93 (2.7%) | 241 (6.8%) |
| $7,500 to $9,999 | 65 (1.9%) | 63 (1.8%) |
| $10,000 to $12,499 | 62 (1.8%) | 187 (5.3%) |
| $12,500 to $14,999 | 51 (1.5%) | 137 (3.9%) |
| $15,000 to $17,499 | 124 (3.6%) | 148 (4.2%) |
| $17,500 to $19,999 | 44 (1.3%) | 42 (1.2%) |
| $20,000 to $22,499 | 263 (7.6%) | 160 (4.5%) |
| $22,500 to $24,999 | 41 (1.2%) | 207 (5.9%) |
| $25,000 to $29,999 | 208 (6.0%) | 275 (7.8%) |
| $30,000 to $34,999 | 244 (7.0%) | 228 (6.5%) |
| $35,000 to $39,999 | 244 (7.0%) | 250 (7.1%) |
| $40,000 to $44,999 | 153 (4.4%) | 308 (8.7%) |
| $45,000 to $49,999 | 194 (5.6%) | 135 (3.8%) |
| $50,000 to $54,999 | 224 (6.4%) | 105 (3.0%) |
| $55,000 to $64,999 | 282 (8.1%) | 315 (8.9%) |
| $65,000 to $74,999 | 271 (7.8%) | 154 (4.4%) |
| $75,000 to $99,999 | 386 (11.1%) | 132 (3.7%) |
| $100,000+ | 207 (5.9%) | 85 (2.4%) |
| Total | 3,477 (100.0%) | 3,535 (100.0%) |
Earnings by Sex by Educational Attainment in Wadena County
Average earnings in Wadena County are $45,956 for men and $32,861 for women, a difference of 28.5%. Men with an educational attainment of bachelor's degree enjoy the highest average annual earnings of $54,511, while those with high school diploma education earn the least with $37,253. Women with an educational attainment of graduate degree earn the most with the average annual earnings of $60,417, while those with less than high school education have the smallest earnings of $20,455.

| Educational Attainment | Male Income | Female Income |
| Less than High School | $44,000 | $20,455 |
| High School Diploma | $37,253 | $29,831 |
| College or Associate's Degree | $49,219 | $31,372 |
| Bachelor's Degree | $54,511 | $43,465 |
| Graduate Degree | - | - |
| Total | $45,956 | $32,861 |
Family Income in Wadena County
Family Income Brackets in Wadena County
According to the Wadena County family income data, there are 803 families falling into the $100,000 to $149,999 income range, which is the most common income bracket and makes up 22.1% of all families. Conversely, the $10,000 to $14,999 income bracket is the least frequent group with only 40 families (1.1%) belonging to this category.

| Income Bracket | # Families | % Families |
| Less than $10,000 | 76 | 2.1% |
| $10,000 to $14,999 | 40 | 1.1% |
| $15,000 to $24,999 | 294 | 8.1% |
| $25,000 to $34,999 | 232 | 6.4% |
| $35,000 to $49,999 | 400 | 11.0% |
| $50,000 to $74,999 | 763 | 21.0% |
| $75,000 to $99,999 | 686 | 18.9% |
| $100,000 to $149,999 | 803 | 22.1% |
| $150,000 to $199,999 | 211 | 5.8% |
| $200,000+ | 120 | 3.3% |
Family Income by Famaliy Size in Wadena County
6-person families (110 | 3.0%) account for the highest median family income in Wadena County with $109,167 per family, while 2-person families (1,895 | 52.2%) have the highest median income of $30,675 per family member.

| Income Bracket | # Families | Median Income |
| 2-Person Families | 1,895 (52.2%) | $61,350 |
| 3-Person Families | 709 (19.5%) | $89,205 |
| 4-Person Families | 500 (13.8%) | $80,395 |
| 5-Person Families | 320 (8.8%) | $92,132 |
| 6-Person Families | 110 (3.0%) | $109,167 |
| 7+ Person Families | 98 (2.7%) | $68,333 |
| Total | 3,632 (100.0%) | $75,333 |
Family Income by Number of Earners in Wadena County
The median family income in Wadena County is $75,333, with families comprising 3+ earners (416) having the highest median family income of $135,000, while families with no earners (592) have the lowest median family income of $41,944, accounting for 11.5% and 16.3% of families, respectively.

| Number of Earners | # Families | Median Income |
| No Earners | 592 (16.3%) | $41,944 |
| 1 Earner | 1,123 (30.9%) | $51,647 |
| 2 Earners | 1,501 (41.3%) | $91,715 |
| 3+ Earners | 416 (11.5%) | $135,000 |
| Total | 3,632 (100.0%) | $75,333 |
Household Income in Wadena County
Household Income Brackets in Wadena County
With 1,067 households falling in the category, the $50,000 to $74,999 income range is the most frequent in Wadena County, accounting for 18.6% of all households. In contrast, only 126 households (2.2%) fall into the $200,000+ income bracket, making it the least populous group.

| Income Bracket | # Households | % Households |
| Less than $10,000 | 206 | 3.6% |
| $10,000 to $14,999 | 298 | 5.2% |
| $15,000 to $24,999 | 791 | 13.8% |
| $25,000 to $34,999 | 499 | 8.7% |
| $35,000 to $49,999 | 751 | 13.1% |
| $50,000 to $74,999 | 1,067 | 18.6% |
| $75,000 to $99,999 | 854 | 14.9% |
| $100,000 to $149,999 | 912 | 15.9% |
| $150,000 to $199,999 | 224 | 3.9% |
| $200,000+ | 126 | 2.2% |
Household Income by Householder Age in Wadena County
The median household income in Wadena County is $54,747, with the highest median household income of $71,898 found in the 25 to 44 years age bracket for the primary householder. A total of 1,643 households (28.6%) fall into this category. Meanwhile, the 65+ years age bracket for the primary householder has the lowest median household income of $42,034, with 1,773 households (30.9%) in this group.

| Income Bracket | # Households | Median Income |
| 15 to 24 Years | 360 (6.3%) | $44,094 |
| 25 to 44 Years | 1,643 (28.6%) | $71,898 |
| 45 to 64 Years | 1,958 (34.2%) | $63,231 |
| 65+ Years | 1,773 (30.9%) | $42,034 |
| Total | 5,734 (100.0%) | $54,747 |
Poverty in Wadena County
Income Below Poverty by Sex and Age in Wadena County
With 12.5% poverty level for males and 11.4% for females among the residents of Wadena County, 45 to 54 year old males and 15 year old females are the most vulnerable to poverty, with 170 males (19.4%) and 27 females (28.4%) in their respective age groups living below the poverty level.

| Age Bracket | Male | Female |
| Under 5 Years | 69 (13.9%) | 86 (20.2%) |
| 5 Years | 1 (0.7%) | 6 (4.4%) |
| 6 to 11 Years | 113 (19.3%) | 62 (10.8%) |
| 12 to 14 Years | 38 (12.3%) | 19 (5.7%) |
| 15 Years | 0 (0.0%) | 27 (28.4%) |
| 16 and 17 Years | 31 (18.3%) | 20 (7.4%) |
| 18 to 24 Years | 30 (6.2%) | 43 (7.9%) |
| 25 to 34 Years | 38 (5.3%) | 130 (16.2%) |
| 35 to 44 Years | 123 (16.0%) | 34 (4.6%) |
| 45 to 54 Years | 170 (19.4%) | 100 (14.6%) |
| 55 to 64 Years | 123 (12.8%) | 106 (11.4%) |
| 65 to 74 Years | 43 (5.6%) | 54 (6.9%) |
| 75 Years and over | 82 (17.2%) | 94 (17.5%) |
| Total | 861 (12.5%) | 781 (11.4%) |
Income Above Poverty by Sex and Age in Wadena County
According to the poverty statistics in Wadena County, males aged 15 years and females aged 5 years are the age groups that are most secure financially, with 100.0% of males and 95.6% of females in these age groups living above the poverty line.

| Age Bracket | Male | Female |
| Under 5 Years | 427 (86.1%) | 339 (79.8%) |
| 5 Years | 135 (99.3%) | 129 (95.6%) |
| 6 to 11 Years | 473 (80.7%) | 510 (89.2%) |
| 12 to 14 Years | 271 (87.7%) | 313 (94.3%) |
| 15 Years | 155 (100.0%) | 68 (71.6%) |
| 16 and 17 Years | 138 (81.7%) | 249 (92.6%) |
| 18 to 24 Years | 456 (93.8%) | 499 (92.1%) |
| 25 to 34 Years | 678 (94.7%) | 674 (83.8%) |
| 35 to 44 Years | 645 (84.0%) | 707 (95.4%) |
| 45 to 54 Years | 705 (80.6%) | 585 (85.4%) |
| 55 to 64 Years | 842 (87.3%) | 826 (88.6%) |
| 65 to 74 Years | 726 (94.4%) | 731 (93.1%) |
| 75 Years and over | 394 (82.8%) | 444 (82.5%) |
| Total | 6,045 (87.5%) | 6,074 (88.6%) |
Income Below Poverty Among Married-Couple Families in Wadena County
The poverty statistics for married-couple families in Wadena County show that 4.6% or 126 of the total 2,741 families live below the poverty line. Families with 5 or more children have the highest poverty rate of 29.7%, comprising of 27 families. On the other hand, families with no children have the lowest poverty rate of 2.9%, which includes 48 families.

| Children | Above Poverty | Below Poverty |
| No Children | 1,613 (97.1%) | 48 (2.9%) |
| 1 or 2 Children | 653 (95.2%) | 33 (4.8%) |
| 3 or 4 Children | 285 (94.1%) | 18 (5.9%) |
| 5 or more Children | 64 (70.3%) | 27 (29.7%) |
| Total | 2,615 (95.4%) | 126 (4.6%) |
Income Below Poverty Among Single-Parent Households in Wadena County
According to the poverty data in Wadena County, 21.6% or 74 single-father households and 15.9% or 87 single-mother households are living below the poverty line. Among single-father households, those with 1 or 2 children have the highest poverty rate, with 72 households (42.3%) experiencing poverty. Likewise, among single-mother households, those with 3 or 4 children have the highest poverty rate, with 20 households (32.8%) falling below the poverty line.

| Children | Single Father | Single Mother |
| No Children | 0 (0.0%) | 11 (7.6%) |
| 1 or 2 Children | 72 (42.3%) | 56 (16.3%) |
| 3 or 4 Children | 2 (6.5%) | 20 (32.8%) |
| 5 or more Children | 0 (0.0%) | 0 (0.0%) |
| Total | 74 (21.6%) | 87 (15.9%) |
Income Below Poverty Among Married-Couple vs Single-Parent Households in Wadena County
The poverty data for Wadena County shows that 126 of the married-couple family households (4.6%) and 161 of the single-parent households (18.1%) are living below the poverty level. Within the married-couple family households, those with 5 or more children have the highest poverty rate, with 27 households (29.7%) falling below the poverty line. Among the single-parent households, those with 1 or 2 children have the highest poverty rate, with 128 household (24.9%) living below poverty.

| Children | Married-Couple Families | Single-Parent Households |
| No Children | 48 (2.9%) | 11 (3.9%) |
| 1 or 2 Children | 33 (4.8%) | 128 (24.9%) |
| 3 or 4 Children | 18 (5.9%) | 22 (23.9%) |
| 5 or more Children | 27 (29.7%) | 0 (0.0%) |
| Total | 126 (4.6%) | 161 (18.1%) |
Employment Characteristics in Wadena County
Employment by Class of Employer in Wadena County
Among the 6,104 employed individuals in Wadena County, private company employees (3,828 | 62.7%), self-employed (not incorporated) (626 | 10.3%), and not-for-profit organizations (623 | 10.2%) make up the most common classes of employment.

| Employer Class | # Employees | % Employees |
| Private Company Employees | 3,828 | 62.7% |
| Self-Employed (Incorporated) | 236 | 3.9% |
| Self-Employed (Not Incorporated) | 626 | 10.3% |
| Not-for-profit Organizations | 623 | 10.2% |
| Local Government Employees | 428 | 7.0% |
| State Government Employees | 224 | 3.7% |
| Federal Government Employees | 130 | 2.1% |
| Unpaid Family Workers | 9 | 0.2% |
| Total | 6,104 | 100.0% |
Employment Status by Age in Wadena County
According to the labor force statistics for Wadena County, out of the total population over 16 years of age (10,838), 61.7% or 6,687 individuals are in the labor force, with 6.1% or 408 of them unemployed. The age group with the highest labor force participation rate is 30 to 34 years, with 89.4% or 659 individuals in the labor force. Within the labor force, the 60 to 64 years age range has the highest percentage of unemployed individuals, with 13.8% or 89 of them being unemployed.

| Age Bracket | In Labor Force | Unemployed |
| 16 to 19 Years | 481 (59.8%) | 6 (1.2%) |
| 20 to 24 Years | 578 (87.4%) | 50 (8.7%) |
| 25 to 29 Years | 680 (86.0%) | 7 (1.0%) |
| 30 to 34 Years | 659 (89.4%) | 77 (11.7%) |
| 35 to 44 Years | 1,299 (85.1%) | 19 (1.5%) |
| 45 to 54 Years | 1,272 (80.3%) | 123 (9.7%) |
| 55 to 59 Years | 606 (77.7%) | 10 (1.7%) |
| 60 to 64 Years | 643 (57.6%) | 89 (13.8%) |
| 65 to 74 Years | 426 (27.3%) | 27 (6.3%) |
| 75 Years and over | 46 (3.6%) | 0 (0.0%) |
| Total | 6,687 (61.7%) | 408 (6.1%) |
Employment Status by Educational Attainment in Wadena County
According to labor force statistics for Wadena County, 78.9% of individuals (5,157) out of the total population between 25 and 64 years of age (6,536) are in the labor force, with 6.3% or 325 of them being unemployed. The group with the highest labor force participation rate are those with the educational attainment of bachelor's degree or higher, with 82.9% or 989 individuals in the labor force. Within the labor force, individuals with less than high school education have the highest percentage of unemployment, with 35.6% or 94 of them being unemployed.

| Educational Attainment | In Labor Force | Unemployed |
| Less than High School | 264 (67.9%) | 138 (35.6%) |
| High School Diploma | 1,499 (74.0%) | 154 (7.6%) |
| College / Associate Degree | 2,407 (82.2%) | 117 (4.0%) |
| Bachelor's Degree or higher | 989 (82.9%) | 25 (2.1%) |
| Total | 5,157 (78.9%) | 412 (6.3%) |
Employment Occupations by Sex in Wadena County
Management, Business, Science and Arts Occupations
The most common Management, Business, Science and Arts occupations in Wadena County are Management (571 | 9.1%), Community & Social Service (545 | 8.7%), Education Instruction & Library (379 | 6.1%), Health Diagnosing & Treating (354 | 5.7%), and Health Technologists (203 | 3.3%).

Management, Business, Science and Arts Occupations by Sex
Within the Management, Business, Science and Arts occupations in Wadena County, the most male-oriented occupations are Architecture & Engineering (88.7%), Computers, Engineering & Science (70.9%), and Computers & Mathematics (70.4%), while the most female-oriented occupations are Legal Services & Support (100.0%), Education, Arts & Media (86.8%), and Health Diagnosing & Treating (85.3%).

| Occupation | Male | Female |
| Management | 370 (64.8%) | 201 (35.2%) |
| Business & Financial | 81 (51.9%) | 75 (48.1%) |
| Computers, Engineering & Science | 112 (70.9%) | 46 (29.1%) |
| Computers & Mathematics | 19 (70.4%) | 8 (29.6%) |
| Architecture & Engineering | 71 (88.7%) | 9 (11.3%) |
| Life, Physical & Social Science | 22 (43.1%) | 29 (56.9%) |
| Community & Social Service | 118 (21.6%) | 427 (78.3%) |
| Education, Arts & Media | 15 (13.2%) | 99 (86.8%) |
| Legal Services & Support | 0 (0.0%) | 3 (100.0%) |
| Education Instruction & Library | 75 (19.8%) | 304 (80.2%) |
| Arts, Media & Entertainment | 28 (57.1%) | 21 (42.9%) |
| Health Diagnosing & Treating | 52 (14.7%) | 302 (85.3%) |
| Health Technologists | 32 (15.8%) | 171 (84.2%) |
| Total (Category) | 733 (41.1%) | 1,051 (58.9%) |
| Total (Overall) | 3,077 (49.3%) | 3,168 (50.7%) |
Services Occupations
The most common Services occupations in Wadena County are Healthcare Support (451 | 7.2%), Food Preparation & Serving (249 | 4.0%), Cleaning & Maintenance (209 | 3.4%), Personal Care & Service (155 | 2.5%), and Security & Protection (71 | 1.1%).

Services Occupations by Sex
Within the Services occupations in Wadena County, the most male-oriented occupations are Firefighting & Prevention (100.0%), Security & Protection (95.8%), and Law Enforcement (88.5%), while the most female-oriented occupations are Healthcare Support (98.5%), Personal Care & Service (86.5%), and Food Preparation & Serving (75.9%).

| Occupation | Male | Female |
| Healthcare Support | 7 (1.5%) | 444 (98.5%) |
| Security & Protection | 68 (95.8%) | 3 (4.2%) |
| Firefighting & Prevention | 45 (100.0%) | 0 (0.0%) |
| Law Enforcement | 23 (88.5%) | 3 (11.5%) |
| Food Preparation & Serving | 60 (24.1%) | 189 (75.9%) |
| Cleaning & Maintenance | 70 (33.5%) | 139 (66.5%) |
| Personal Care & Service | 21 (13.6%) | 134 (86.5%) |
| Total (Category) | 226 (19.9%) | 909 (80.1%) |
| Total (Overall) | 3,077 (49.3%) | 3,168 (50.7%) |
Sales and Office Occupations
The most common Sales and Office occupations in Wadena County are Office & Administration (575 | 9.2%), and Sales & Related (547 | 8.8%).

Sales and Office Occupations by Sex

| Occupation | Male | Female |
| Sales & Related | 208 (38.0%) | 339 (62.0%) |
| Office & Administration | 73 (12.7%) | 502 (87.3%) |
| Total (Category) | 281 (25.0%) | 841 (75.0%) |
| Total (Overall) | 3,077 (49.3%) | 3,168 (50.7%) |
Natural Resources, Construction and Maintenance Occupations
The most common Natural Resources, Construction and Maintenance occupations in Wadena County are Construction & Extraction (413 | 6.6%), Farming, Fishing & Forestry (267 | 4.3%), and Installation, Maintenance & Repair (261 | 4.2%).

Natural Resources, Construction and Maintenance Occupations by Sex

| Occupation | Male | Female |
| Farming, Fishing & Forestry | 247 (92.5%) | 20 (7.5%) |
| Construction & Extraction | 390 (94.4%) | 23 (5.6%) |
| Installation, Maintenance & Repair | 261 (100.0%) | 0 (0.0%) |
| Total (Category) | 898 (95.4%) | 43 (4.6%) |
| Total (Overall) | 3,077 (49.3%) | 3,168 (50.7%) |
Production, Transportation and Moving Occupations
The most common Production, Transportation and Moving occupations in Wadena County are Production (692 | 11.1%), Material Moving (286 | 4.6%), and Transportation (285 | 4.6%).

Production, Transportation and Moving Occupations by Sex

| Occupation | Male | Female |
| Production | 495 (71.5%) | 197 (28.5%) |
| Transportation | 256 (89.8%) | 29 (10.2%) |
| Material Moving | 188 (65.7%) | 98 (34.3%) |
| Total (Category) | 939 (74.4%) | 324 (25.7%) |
| Total (Overall) | 3,077 (49.3%) | 3,168 (50.7%) |
Employment Industries by Sex in Wadena County
Employment Industries in Wadena County
The major employment industries in Wadena County include Health Care & Social Assistance (1,166 | 18.7%), Manufacturing (989 | 15.8%), Retail Trade (686 | 11.0%), Construction (541 | 8.7%), and Educational Services (455 | 7.3%).

Employment Industries by Sex in Wadena County
The Wadena County industries that see more men than women are Mining, Quarrying, & Extraction (100.0%), Arts, Entertainment & Recreation (100.0%), and Construction (92.8%), whereas the industries that tend to have a higher number of women are Health Care & Social Assistance (85.8%), Accommodation & Food Services (78.9%), and Educational Services (75.6%).

| Industry | Male | Female |
| Agriculture, Fishing & Hunting | 386 (86.0%) | 63 (14.0%) |
| Mining, Quarrying, & Extraction | 26 (100.0%) | 0 (0.0%) |
| Construction | 502 (92.8%) | 39 (7.2%) |
| Manufacturing | 672 (67.9%) | 317 (32.1%) |
| Wholesale Trade | 129 (43.0%) | 171 (57.0%) |
| Retail Trade | 284 (41.4%) | 402 (58.6%) |
| Transportation & Warehousing | 199 (70.3%) | 84 (29.7%) |
| Utilities | 47 (81.0%) | 11 (19.0%) |
| Information | 28 (50.0%) | 28 (50.0%) |
| Finance & Insurance | 97 (52.7%) | 87 (47.3%) |
| Real Estate, Rental & Leasing | 3 (37.5%) | 5 (62.5%) |
| Professional & Scientific | 59 (50.4%) | 58 (49.6%) |
| Enterprise Management | 4 (40.0%) | 6 (60.0%) |
| Administrative & Support | 78 (58.2%) | 56 (41.8%) |
| Educational Services | 111 (24.4%) | 344 (75.6%) |
| Health Care & Social Assistance | 166 (14.2%) | 1,000 (85.8%) |
| Arts, Entertainment & Recreation | 41 (100.0%) | 0 (0.0%) |
| Accommodation & Food Services | 49 (21.1%) | 183 (78.9%) |
| Public Administration | 91 (57.2%) | 68 (42.8%) |
| Total | 3,077 (49.3%) | 3,168 (50.7%) |
Education in Wadena County
School Enrollment in Wadena County
The most common levels of schooling among the 3,434 students in Wadena County are elementary school (889 | 25.9%), high school (807 | 23.5%), and middle school (720 | 21.0%).
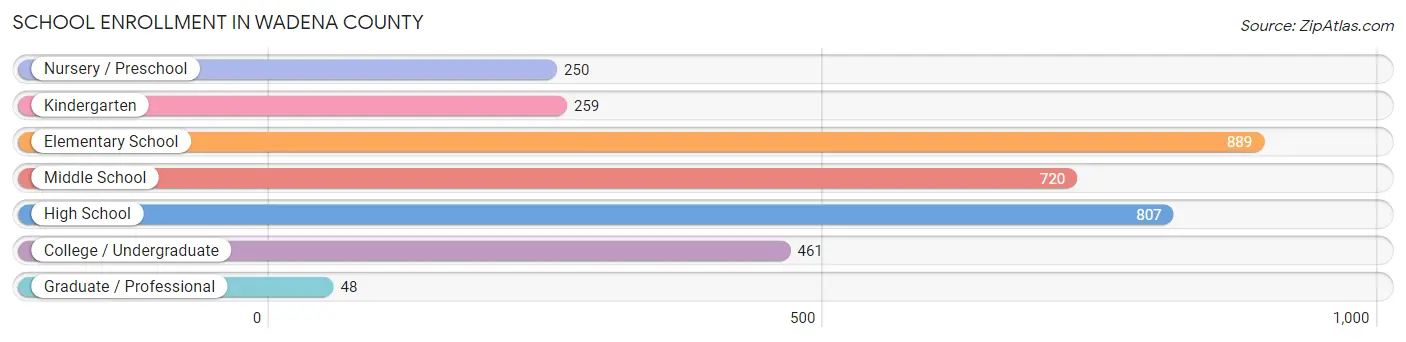
| School Level | # Students | % Students |
| Nursery / Preschool | 250 | 7.3% |
| Kindergarten | 259 | 7.5% |
| Elementary School | 889 | 25.9% |
| Middle School | 720 | 21.0% |
| High School | 807 | 23.5% |
| College / Undergraduate | 461 | 13.4% |
| Graduate / Professional | 48 | 1.4% |
| Total | 3,434 | 100.0% |
School Enrollment by Age by Funding Source in Wadena County
Out of a total of 3,434 students who are enrolled in schools in Wadena County, 237 (6.9%) attend a private institution, while the remaining 3,197 (93.1%) are enrolled in public schools. The age group of 10 to 14 year olds has the highest likelihood of being enrolled in private schools, with 102 (11.0% in the age bracket) enrolled. Conversely, the age group of 20 to 24 year olds has the lowest likelihood of being enrolled in a private school, with 102 (98.1% in the age bracket) attending a public institution.

| Age Bracket | Public School | Private School |
| 3 to 4 Year Olds | 152 (95.0%) | 8 (5.0%) |
| 5 to 9 Year Old | 1,029 (92.7%) | 81 (7.3%) |
| 10 to 14 Year Olds | 822 (89.0%) | 102 (11.0%) |
| 15 to 17 Year Olds | 644 (97.0%) | 20 (3.0%) |
| 18 to 19 Year Olds | 104 (94.6%) | 6 (5.4%) |
| 20 to 24 Year Olds | 102 (98.1%) | 2 (1.9%) |
| 25 to 34 Year Olds | 133 (97.1%) | 4 (2.9%) |
| 35 Years and over | 212 (94.2%) | 13 (5.8%) |
| Total | 3,197 (93.1%) | 237 (6.9%) |
Educational Attainment by Field of Study in Wadena County
Education (620 | 34.1%), bio, nature & agricultural (203 | 11.2%), business (182 | 10.0%), arts & humanities (182 | 10.0%), and science & technology (164 | 9.0%) are the most common fields of study among 1,818 individuals in Wadena County who have obtained a bachelor's degree or higher.

| Field of Study | # Graduates | % Graduates |
| Computers & Mathematics | 39 | 2.1% |
| Bio, Nature & Agricultural | 203 | 11.2% |
| Physical & Health Sciences | 56 | 3.1% |
| Psychology | 64 | 3.5% |
| Social Sciences | 21 | 1.2% |
| Engineering | 61 | 3.4% |
| Multidisciplinary Studies | 2 | 0.1% |
| Science & Technology | 164 | 9.0% |
| Business | 182 | 10.0% |
| Education | 620 | 34.1% |
| Literature & Languages | 39 | 2.1% |
| Liberal Arts & History | 59 | 3.3% |
| Visual & Performing Arts | 59 | 3.3% |
| Communications | 67 | 3.7% |
| Arts & Humanities | 182 | 10.0% |
| Total | 1,818 | 100.0% |
Transportation & Commute in Wadena County
Vehicle Availability by Sex in Wadena County
The most prevalent vehicle ownership categories in Wadena County are males with 2 vehicles (1,143, accounting for 38.5%) and females with 2 vehicles (992, making up 37.2%).

| Vehicles Available | Male | Female |
| No Vehicle | 52 (1.8%) | 64 (2.1%) |
| 1 Vehicle | 262 (8.8%) | 605 (19.7%) |
| 2 Vehicles | 1,143 (38.5%) | 992 (32.3%) |
| 3 Vehicles | 837 (28.1%) | 770 (25.0%) |
| 4 Vehicles | 466 (15.7%) | 455 (14.8%) |
| 5 or more Vehicles | 213 (7.2%) | 189 (6.1%) |
| Total | 2,973 (100.0%) | 3,075 (100.0%) |
Commute Time in Wadena County
The most frequently occuring commute durations in Wadena County are 10 to 14 minutes (1,073 commuters, 19.2%), 5 to 9 minutes (1,071 commuters, 19.2%), and 20 to 24 minutes (690 commuters, 12.3%).

| Commute Time | # Commuters | % Commuters |
| Less than 5 Minutes | 401 | 7.2% |
| 5 to 9 Minutes | 1,071 | 19.2% |
| 10 to 14 Minutes | 1,073 | 19.2% |
| 15 to 19 Minutes | 643 | 11.5% |
| 20 to 24 Minutes | 690 | 12.3% |
| 25 to 29 Minutes | 248 | 4.4% |
| 30 to 34 Minutes | 560 | 10.0% |
| 35 to 39 Minutes | 100 | 1.8% |
| 40 to 44 Minutes | 180 | 3.2% |
| 45 to 59 Minutes | 338 | 6.0% |
| 60 to 89 Minutes | 152 | 2.7% |
| 90 or more Minutes | 138 | 2.5% |
Commute Time by Sex in Wadena County
The most common commute times in Wadena County are 10 to 14 minutes (463 commuters, 16.7%) for males and 5 to 9 minutes (614 commuters, 21.8%) for females.

| Commute Time | Male | Female |
| Less than 5 Minutes | 235 (8.5%) | 166 (5.9%) |
| 5 to 9 Minutes | 457 (16.5%) | 614 (21.8%) |
| 10 to 14 Minutes | 463 (16.7%) | 610 (21.6%) |
| 15 to 19 Minutes | 302 (10.9%) | 341 (12.1%) |
| 20 to 24 Minutes | 306 (11.0%) | 384 (13.6%) |
| 25 to 29 Minutes | 111 (4.0%) | 137 (4.9%) |
| 30 to 34 Minutes | 317 (11.4%) | 243 (8.6%) |
| 35 to 39 Minutes | 67 (2.4%) | 33 (1.2%) |
| 40 to 44 Minutes | 113 (4.1%) | 67 (2.4%) |
| 45 to 59 Minutes | 210 (7.6%) | 128 (4.5%) |
| 60 to 89 Minutes | 85 (3.1%) | 67 (2.4%) |
| 90 or more Minutes | 107 (3.9%) | 31 (1.1%) |
Time of Departure to Work by Sex in Wadena County
The most frequent times of departure to work in Wadena County are 6:30 AM to 6:59 AM (417, 15.0%) for males and 7:30 AM to 7:59 AM (412, 14.6%) for females.

| Time of Departure | Male | Female |
| 12:00 AM to 4:59 AM | 357 (12.9%) | 145 (5.1%) |
| 5:00 AM to 5:29 AM | 121 (4.4%) | 76 (2.7%) |
| 5:30 AM to 5:59 AM | 279 (10.1%) | 126 (4.5%) |
| 6:00 AM to 6:29 AM | 336 (12.1%) | 255 (9.0%) |
| 6:30 AM to 6:59 AM | 417 (15.0%) | 182 (6.5%) |
| 7:00 AM to 7:29 AM | 278 (10.0%) | 403 (14.3%) |
| 7:30 AM to 7:59 AM | 368 (13.3%) | 412 (14.6%) |
| 8:00 AM to 8:29 AM | 114 (4.1%) | 314 (11.1%) |
| 8:30 AM to 8:59 AM | 28 (1.0%) | 169 (6.0%) |
| 9:00 AM to 9:59 AM | 76 (2.7%) | 111 (3.9%) |
| 10:00 AM to 10:59 AM | 13 (0.5%) | 38 (1.3%) |
| 11:00 AM to 11:59 AM | 29 (1.1%) | 28 (1.0%) |
| 12:00 PM to 3:59 PM | 160 (5.8%) | 326 (11.6%) |
| 4:00 PM to 11:59 PM | 197 (7.1%) | 236 (8.4%) |
| Total | 2,773 (100.0%) | 2,821 (100.0%) |
Housing Occupancy in Wadena County
Occupancy by Ownership in Wadena County
Of the total 5,734 dwellings in Wadena County, owner-occupied units account for 4,144 (72.3%), while renter-occupied units make up 1,590 (27.7%).

| Occupancy | # Housing Units | % Housing Units |
| Owner Occupied Housing Units | 4,144 | 72.3% |
| Renter-Occupied Housing Units | 1,590 | 27.7% |
| Total Occupied Housing Units | 5,734 | 100.0% |
Occupancy by Household Size in Wadena County

| Household Size | # Housing Units | % Housing Units |
| 1-Person Household | 1,657 | 28.9% |
| 2-Person Household | 2,218 | 38.7% |
| 3-Person Household | 789 | 13.8% |
| 4+ Person Household | 1,070 | 18.7% |
| Total Housing Units | 5,734 | 100.0% |
Occupancy by Ownership by Household Size in Wadena County

| Household Size | Owner-occupied | Renter-occupied |
| 1-Person Household | 940 (56.7%) | 717 (43.3%) |
| 2-Person Household | 1,567 (70.7%) | 651 (29.3%) |
| 3-Person Household | 708 (89.7%) | 81 (10.3%) |
| 4+ Person Household | 929 (86.8%) | 141 (13.2%) |
| Total Housing Units | 4,144 (72.3%) | 1,590 (27.7%) |
Occupancy by Educational Attainment in Wadena County

| Household Size | Owner-occupied | Renter-occupied |
| Less than High School | 243 (55.7%) | 193 (44.3%) |
| High School Diploma | 1,287 (68.2%) | 600 (31.8%) |
| College/Associate Degree | 1,813 (76.2%) | 565 (23.8%) |
| Bachelor's Degree or higher | 801 (77.5%) | 232 (22.5%) |
Occupancy by Age of Householder in Wadena County

| Age Bracket | # Households | % Households |
| Under 35 Years | 1,135 | 19.8% |
| 35 to 44 Years | 868 | 15.1% |
| 45 to 54 Years | 857 | 14.9% |
| 55 to 64 Years | 1,101 | 19.2% |
| 65 to 74 Years | 1,013 | 17.7% |
| 75 to 84 Years | 495 | 8.6% |
| 85 Years and Over | 265 | 4.6% |
| Total | 5,734 | 100.0% |
Housing Finances in Wadena County
Median Income by Occupancy in Wadena County

| Occupancy Type | # Households | Median Income |
| Owner-Occupied | 4,144 (72.3%) | $70,857 |
| Renter-Occupied | 1,590 (27.7%) | $31,442 |
| Average | 5,734 (100.0%) | $54,747 |
Occupancy by Householder Income Bracket in Wadena County

| Income Bracket | Owner-occupied | Renter-occupied |
| Less than $5,000 | 70 (1.7%) | 51 (3.2%) |
| $5,000 to $9,999 | 55 (1.3%) | 32 (2.0%) |
| $10,000 to $14,999 | 109 (2.6%) | 189 (11.9%) |
| $15,000 to $19,999 | 222 (5.4%) | 170 (10.7%) |
| $20,000 to $24,999 | 144 (3.5%) | 257 (16.2%) |
| $25,000 to $34,999 | 299 (7.2%) | 200 (12.6%) |
| $35,000 to $49,999 | 494 (11.9%) | 255 (16.0%) |
| $50,000 to $74,999 | 792 (19.1%) | 276 (17.4%) |
| $75,000 to $99,999 | 763 (18.4%) | 93 (5.9%) |
| $100,000 to $149,999 | 850 (20.5%) | 63 (4.0%) |
| $150,000 or more | 346 (8.4%) | 4 (0.3%) |
| Total | 4,144 (100.0%) | 1,590 (100.0%) |
Monthly Housing Cost Tiers in Wadena County

| Monthly Cost | Owner-occupied | Renter-occupied |
| Less than $300 | 284 (6.9%) | 201 (12.6%) |
| $300 to $499 | 789 (19.0%) | 239 (15.0%) |
| $500 to $799 | 948 (22.9%) | 539 (33.9%) |
| $800 to $999 | 534 (12.9%) | 191 (12.0%) |
| $1,000 to $1,499 | 842 (20.3%) | 190 (11.9%) |
| $1,500 to $1,999 | 425 (10.3%) | 25 (1.6%) |
| $2,000 to $2,499 | 240 (5.8%) | 19 (1.2%) |
| $2,500 to $2,999 | 30 (0.7%) | 0 (0.0%) |
| $3,000 or more | 52 (1.3%) | 0 (0.0%) |
| Total | 4,144 (100.0%) | 1,590 (100.0%) |
Physical Housing Characteristics in Wadena County
Housing Structures in Wadena County

| Structure Type | # Housing Units | % Housing Units |
| Single Unit, Detached | 4,419 | 77.1% |
| Single Unit, Attached | 30 | 0.5% |
| 2 Unit Apartments | 55 | 1.0% |
| 3 or 4 Unit Apartments | 169 | 2.9% |
| 5 to 9 Unit Apartments | 218 | 3.8% |
| 10 or more Apartments | 538 | 9.4% |
| Mobile Home / Other | 305 | 5.3% |
| Total | 5,734 | 100.0% |
Housing Structures by Occupancy in Wadena County

| Structure Type | Owner-occupied | Renter-occupied |
| Single Unit, Detached | 3,903 (88.3%) | 516 (11.7%) |
| Single Unit, Attached | 28 (93.3%) | 2 (6.7%) |
| 2 Unit Apartments | 0 (0.0%) | 55 (100.0%) |
| 3 or 4 Unit Apartments | 0 (0.0%) | 169 (100.0%) |
| 5 to 9 Unit Apartments | 0 (0.0%) | 218 (100.0%) |
| 10 or more Apartments | 0 (0.0%) | 538 (100.0%) |
| Mobile Home / Other | 213 (69.8%) | 92 (30.2%) |
| Total | 4,144 (72.3%) | 1,590 (27.7%) |
Housing Structures by Number of Rooms in Wadena County

| Number of Rooms | Owner-occupied | Renter-occupied |
| 1 Room | 6 (0.1%) | 393 (24.7%) |
| 2 or 3 Rooms | 114 (2.8%) | 250 (15.7%) |
| 4 or 5 Rooms | 1,092 (26.4%) | 686 (43.1%) |
| 6 or 7 Rooms | 1,374 (33.2%) | 206 (13.0%) |
| 8 or more Rooms | 1,558 (37.6%) | 55 (3.5%) |
| Total | 4,144 (100.0%) | 1,590 (100.0%) |
Housing Structure by Heating Type in Wadena County

| Heating Type | Owner-occupied | Renter-occupied |
| Utility Gas | 1,319 (31.8%) | 558 (35.1%) |
| Bottled, Tank, or LP Gas | 1,012 (24.4%) | 140 (8.8%) |
| Electricity | 870 (21.0%) | 795 (50.0%) |
| Fuel Oil or Kerosene | 309 (7.5%) | 32 (2.0%) |
| Coal or Coke | 0 (0.0%) | 0 (0.0%) |
| All other Fuels | 628 (15.1%) | 58 (3.6%) |
| No Fuel Used | 6 (0.1%) | 7 (0.4%) |
| Total | 4,144 (100.0%) | 1,590 (100.0%) |
Household Vehicle Usage in Wadena County

| Vehicles per Household | Owner-occupied | Renter-occupied |
| No Vehicle | 148 (3.6%) | 374 (23.5%) |
| 1 Vehicle | 773 (18.6%) | 711 (44.7%) |
| 2 Vehicles | 1,477 (35.6%) | 354 (22.3%) |
| 3 or more Vehicles | 1,746 (42.1%) | 151 (9.5%) |
| Total | 4,144 (100.0%) | 1,590 (100.0%) |
Real Estate & Mortgages in Wadena County
Real Estate and Mortgage Overview in Wadena County
| Characteristic | Without Mortgage | With Mortgage |
| Housing Units | 1,836 | 2,308 |
| Median Property Value | $159,600 | $165,900 |
| Median Household Income | $52,760 | $252 |
| Monthly Housing Costs | $482 | $51 |
| Real Estate Taxes | $1,766 | $39 |
Property Value by Mortgage Status in Wadena County

| Property Value | Without Mortgage | With Mortgage |
| Less than $50,000 | 160 (8.7%) | 120 (5.2%) |
| $50,000 to $99,999 | 377 (20.5%) | 358 (15.5%) |
| $100,000 to $299,999 | 1,019 (55.5%) | 1,462 (63.3%) |
| $300,000 to $499,999 | 214 (11.7%) | 326 (14.1%) |
| $500,000 to $749,999 | 57 (3.1%) | 35 (1.5%) |
| $750,000 to $999,999 | 4 (0.2%) | 1 (0.0%) |
| $1,000,000 or more | 5 (0.3%) | 6 (0.3%) |
| Total | 1,836 (100.0%) | 2,308 (100.0%) |
Household Income by Mortgage Status in Wadena County

| Household Income | Without Mortgage | With Mortgage |
| Less than $10,000 | 104 (5.7%) | 26 (1.1%) |
| $10,000 to $24,999 | 333 (18.1%) | 21 (0.9%) |
| $25,000 to $34,999 | 153 (8.3%) | 142 (6.1%) |
| $35,000 to $49,999 | 251 (13.7%) | 146 (6.3%) |
| $50,000 to $74,999 | 410 (22.3%) | 243 (10.5%) |
| $75,000 to $99,999 | 204 (11.1%) | 382 (16.6%) |
| $100,000 to $149,999 | 287 (15.6%) | 559 (24.2%) |
| $150,000 or more | 94 (5.1%) | 563 (24.4%) |
| Total | 1,836 (100.0%) | 2,308 (100.0%) |
Property Value to Household Income Ratio in Wadena County

| Value-to-Income Ratio | Without Mortgage | With Mortgage |
| Less than 2.0x | 570 (31.0%) | 82,500 (3,574.5%) |
| 2.0x to 2.9x | 354 (19.3%) | 1,057 (45.8%) |
| 3.0x to 3.9x | 171 (9.3%) | 598 (25.9%) |
| 4.0x or more | 728 (39.7%) | 270 (11.7%) |
| Total | 1,836 (100.0%) | 2,308 (100.0%) |
Real Estate Taxes by Mortgage Status in Wadena County

| Property Taxes | Without Mortgage | With Mortgage |
| Less than $800 | 285 (15.5%) | 4 (0.2%) |
| $800 to $1,499 | 423 (23.0%) | 286 (12.4%) |
| $800 to $1,499 | 1,103 (60.1%) | 723 (31.3%) |
| Total | 1,836 (100.0%) | 2,308 (100.0%) |
Health & Disability in Wadena County
Health Insurance Coverage by Age in Wadena County

| Age Bracket | With Coverage | Without Coverage |
| Under 6 Years | 1,190 (99.0%) | 12 (1.0%) |
| 6 to 18 Years | 2,548 (97.3%) | 72 (2.8%) |
| 19 to 25 Years | 773 (75.8%) | 247 (24.2%) |
| 26 to 34 Years | 1,237 (89.6%) | 143 (10.4%) |
| 35 to 44 Years | 1,418 (94.3%) | 85 (5.7%) |
| 45 to 54 Years | 1,468 (94.1%) | 92 (5.9%) |
| 55 to 64 Years | 1,720 (90.7%) | 177 (9.3%) |
| 65 to 74 Years | 1,554 (100.0%) | 0 (0.0%) |
| 75 Years and older | 998 (98.4%) | 16 (1.6%) |
| Total | 12,906 (93.9%) | 844 (6.1%) |
Health Insurance Coverage by Citizenship Status in Wadena County

| Citizenship Status | With Coverage | Without Coverage |
| Native Born | 1,190 (99.0%) | 12 (1.0%) |
| Foreign Born, Citizen | 2,548 (97.3%) | 72 (2.8%) |
| Foreign Born, not a Citizen | 773 (75.8%) | 247 (24.2%) |
Health Insurance Coverage by Household Income in Wadena County

| Household Income | With Coverage | Without Coverage |
| Under $25,000 | 1,775 (92.6%) | 142 (7.4%) |
| $25,000 to $49,999 | 2,242 (89.4%) | 265 (10.6%) |
| $50,000 to $74,999 | 2,220 (92.7%) | 174 (7.3%) |
| $75,000 to $99,999 | 2,486 (95.3%) | 123 (4.7%) |
| $100,000 and over | 4,042 (96.7%) | 140 (3.4%) |
Public vs Private Health Insurance Coverage by Age in Wadena County

| Age Bracket | Public Insurance | Private Insurance |
| Under 6 | 718 (59.7%) | 624 (51.9%) |
| 6 to 18 Years | 1,455 (55.5%) | 1,489 (56.8%) |
| 19 to 25 Years | 264 (25.9%) | 530 (52.0%) |
| 25 to 34 Years | 474 (34.4%) | 804 (58.3%) |
| 35 to 44 Years | 572 (38.1%) | 959 (63.8%) |
| 45 to 54 Years | 627 (40.2%) | 912 (58.5%) |
| 55 to 64 Years | 684 (36.1%) | 1,119 (59.0%) |
| 65 to 74 Years | 1,543 (99.3%) | 970 (62.4%) |
| 75 Years and over | 991 (97.7%) | 596 (58.8%) |
| Total | 7,328 (53.3%) | 8,003 (58.2%) |
Disability Status by Sex by Age in Wadena County
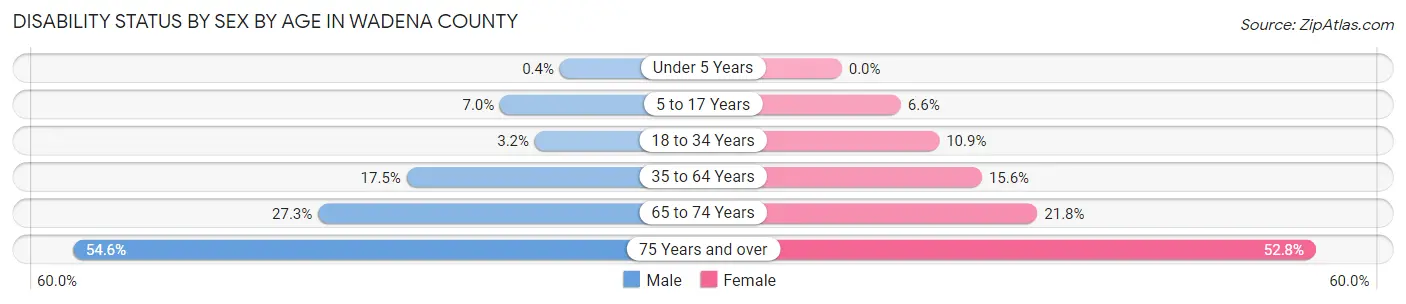
| Age Bracket | Male | Female |
| Under 5 Years | 2 (0.4%) | 0 (0.0%) |
| 5 to 17 Years | 96 (7.0%) | 93 (6.6%) |
| 18 to 34 Years | 37 (3.2%) | 146 (10.8%) |
| 35 to 64 Years | 454 (17.4%) | 368 (15.6%) |
| 65 to 74 Years | 210 (27.3%) | 171 (21.8%) |
| 75 Years and over | 260 (54.6%) | 284 (52.8%) |
Disability Class by Sex by Age in Wadena County
Disability Class: Hearing Difficulty

| Age Bracket | Male | Female |
| Under 5 Years | 0 (0.0%) | 0 (0.0%) |
| 5 to 17 Years | 0 (0.0%) | 0 (0.0%) |
| 18 to 34 Years | 0 (0.0%) | 3 (0.2%) |
| 35 to 64 Years | 91 (3.5%) | 44 (1.9%) |
| 65 to 74 Years | 125 (16.3%) | 45 (5.7%) |
| 75 Years and over | 162 (34.0%) | 62 (11.5%) |
Disability Class: Vision Difficulty

| Age Bracket | Male | Female |
| Under 5 Years | 2 (0.4%) | 0 (0.0%) |
| 5 to 17 Years | 7 (0.5%) | 11 (0.8%) |
| 18 to 34 Years | 16 (1.4%) | 8 (0.6%) |
| 35 to 64 Years | 48 (1.8%) | 38 (1.6%) |
| 65 to 74 Years | 8 (1.0%) | 6 (0.8%) |
| 75 Years and over | 33 (6.9%) | 49 (9.1%) |
Disability Class: Cognitive Difficulty

| Age Bracket | Male | Female |
| 5 to 17 Years | 80 (5.9%) | 85 (6.0%) |
| 18 to 34 Years | 20 (1.7%) | 131 (9.7%) |
| 35 to 64 Years | 264 (10.2%) | 185 (7.9%) |
| 65 to 74 Years | 14 (1.8%) | 14 (1.8%) |
| 75 Years and over | 26 (5.5%) | 53 (9.9%) |
Disability Class: Ambulatory Difficulty

| Age Bracket | Male | Female |
| 5 to 17 Years | 0 (0.0%) | 22 (1.6%) |
| 18 to 34 Years | 0 (0.0%) | 5 (0.4%) |
| 35 to 64 Years | 212 (8.2%) | 200 (8.5%) |
| 65 to 74 Years | 63 (8.2%) | 127 (16.2%) |
| 75 Years and over | 146 (30.7%) | 210 (39.0%) |
Disability Class: Self-Care Difficulty

| Age Bracket | Male | Female |
| 5 to 17 Years | 49 (3.6%) | 27 (1.9%) |
| 18 to 34 Years | 1 (0.1%) | 3 (0.2%) |
| 35 to 64 Years | 78 (3.0%) | 109 (4.6%) |
| 65 to 74 Years | 38 (4.9%) | 12 (1.5%) |
| 75 Years and over | 40 (8.4%) | 94 (17.5%) |
Technology Access in Wadena County
Computing Device Access in Wadena County

| Device Type | # Households | % Households |
| Desktop or Laptop | 3,959 | 69.0% |
| Smartphone | 4,591 | 80.1% |
| Tablet | 2,820 | 49.2% |
| No Computing Device | 538 | 9.4% |
| Total | 5,734 | 100.0% |
Internet Access in Wadena County
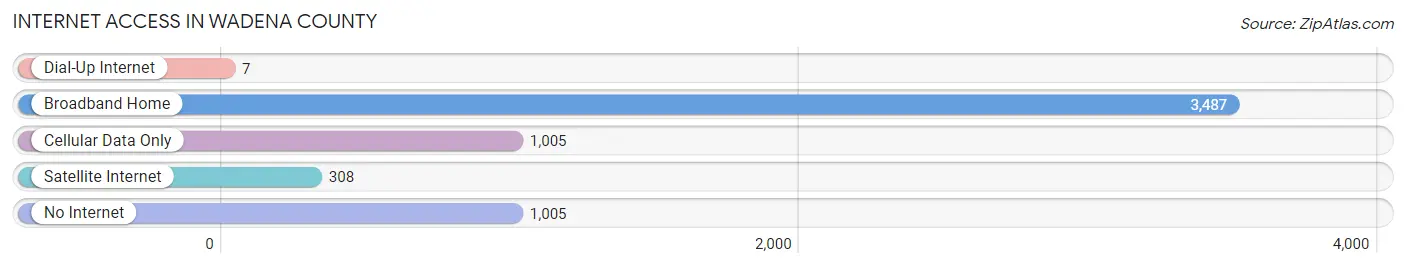
| Internet Type | # Households | % Households |
| Dial-Up Internet | 7 | 0.1% |
| Broadband Home | 3,487 | 60.8% |
| Cellular Data Only | 1,005 | 17.5% |
| Satellite Internet | 308 | 5.4% |
| No Internet | 1,005 | 17.5% |
| Total | 5,734 | 100.0% |
Wadena County Summary
Wadena County is located in the central part of Minnesota, in the United States. It is bordered by Otter Tail County to the north, Todd County to the east, Morrison County to the south, and Cass County to the west. The county seat is Wadena, and the county has a total area of 576 square miles.
History
The area that is now Wadena County was first inhabited by the Ojibwe people. The first European settlers arrived in the area in the late 1800s, and the county was officially organized in 1872. The county was named after the Ojibwe word for “birch bark”, which was used by the Ojibwe to make canoes.
The county was initially an agricultural area, with the main crops being wheat, oats, and potatoes. In the early 1900s, the county began to diversify its economy, with the development of the lumber industry and the establishment of several small manufacturing businesses.
Geography
Wadena County is located in the central part of Minnesota, in the United States. It is bordered by Otter Tail County to the north, Todd County to the east, Morrison County to the south, and Cass County to the west. The county has a total area of 576 square miles, and is mostly covered by forests and wetlands. The county is home to several lakes, including Wadena Lake, which is the largest lake in the county.
The county is located in the Central Lakes region of Minnesota, and is part of the Red River Valley. The county is mostly flat, with some rolling hills in the northern part of the county. The highest point in the county is located in the northern part of the county, at an elevation of 1,541 feet.
Economy
The economy of Wadena County is largely based on agriculture and manufacturing. The county is home to several large farms, which produce a variety of crops, including wheat, oats, and potatoes. The county is also home to several small manufacturing businesses, which produce a variety of products, including furniture, clothing, and electronics.
The county is also home to several tourist attractions, including the Wadena County Historical Museum, the Wadena County Fairgrounds, and the Wadena County Park. The county is also home to several recreational areas, including several state parks and wildlife areas.
Demographics
As of the 2010 census, the population of Wadena County was 13,719. The population is mostly white (96.2%), with small percentages of Native American (1.2%), African American (0.7%), Asian (0.3%), and Hispanic or Latino (1.2%) populations. The median household income in the county is $45,845, and the median age is 43.7 years.
Conclusion
Wadena County is located in the central part of Minnesota, in the United States. It is bordered by Otter Tail County to the north, Todd County to the east, Morrison County to the south, and Cass County to the west. The county has a total area of 576 square miles, and is mostly covered by forests and wetlands. The county has a largely agricultural and manufacturing-based economy, and the population is mostly white. The county is home to several tourist attractions, recreational areas, and state parks.
Common Questions
What is the Total Population of Wadena County?
Total Population of Wadena County is 14,108.
What is the Total Male Population of Wadena County?
Total Male Population of Wadena County is 6,998.
What is the Total Female Population of Wadena County?
Total Female Population of Wadena County is 7,110.
What is the Ratio of Males per 100 Females in Wadena County?
There are 98.42 Males per 100 Females in Wadena County.
What is the Ratio of Females per 100 Males in Wadena County?
There are 101.60 Females per 100 Males in Wadena County.
What is the Median Population Age in Wadena County?
Median Population Age in Wadena County is 40.0 Years.
What is the Average Family Size in Wadena County
Average Family Size in Wadena County is 3.0 People.
What is the Average Household Size in Wadena County
Average Household Size in Wadena County is 2.4 People.
What is Per Capita Income in Wadena County?
Per Capita income in Wadena County is $28,011.
What is the Median Family Income in Wadena County?
Median Family Income in Wadena County is $75,333.
What is the Median Household income in Wadena County?
Median Household Income in Wadena County is $54,747.
What is Income or Wage Gap in Wadena County?
Income or Wage Gap in Wadena County is 26.1%.
Women in Wadena County earn 73.9 cents for every dollar earned by a man.
What is Family Income Deficit in Wadena County?
Family Income Deficit in Wadena County is $8,259.
Families that are below poverty line in Wadena County earn $8,259 less on average than the poverty threshold level.
What is Inequality or Gini Index in Wadena County?
Inequality or Gini Index in Wadena County is 0.41.
How Large is the Labor Force in Wadena County?
There are 6,687 People in the Labor Forcein in Wadena County.
What is the Percentage of People in the Labor Force in Wadena County?
61.7% of People are in the Labor Force in Wadena County.
What is the Unemployment Rate in Wadena County?
Unemployment Rate in Wadena County is 6.1%.