Swift County, MN
Swift County Map

Swift County Overview
9,806
TOTAL POPULATION
5,031
MALE POPULATION
4,775
FEMALE POPULATION
105.36
MALES / 100 FEMALES
94.91
FEMALES / 100 MALES
43.8
MEDIAN AGE
2.9
AVG FAMILY SIZE
2.3
AVG HOUSEHOLD SIZE
$35,595
PER CAPITA INCOME
$76,050
AVG FAMILY INCOME
$58,362
AVG HOUSEHOLD INCOME
40.9%
WAGE / INCOME GAP [ % ]
59.1¢/ $1
WAGE / INCOME GAP [ $ ]
$9,544
FAMILY INCOME DEFICIT
0.46
INEQUALITY / GINI INDEX
4,849
LABOR FORCE [ PEOPLE ]
61.8%
PERCENT IN LABOR FORCE
3.7%
UNEMPLOYMENT RATE
Swift County Area Codes
Race in Swift County
The most populous races in Swift County are White / Caucasian (9,009 | 91.9%), Hispanic or Latino (558 | 5.7%), and Two or more Races (440 | 4.5%).

| Race | # Population | % Population |
| Asian | 0 | 0.0% |
| Black / African American | 86 | 0.9% |
| Hawaiian / Pacific | 78 | 0.8% |
| Hispanic or Latino | 558 | 5.7% |
| Native / Alaskan | 44 | 0.4% |
| White / Caucasian | 9,009 | 91.9% |
| Two or more Races | 440 | 4.5% |
| Some other Race | 149 | 1.5% |
| Total | 9,806 | 100.0% |
Ancestry in Swift County
The most populous ancestries reported in Swift County are German (3,712 | 37.9%), Norwegian (2,912 | 29.7%), Irish (1,001 | 10.2%), Swedish (901 | 9.2%), and English (496 | 5.1%), together accounting for 92.0% of all Swift County residents.

| Ancestry | # Population | % Population |
| African | 70 | 0.7% |
| American | 377 | 3.8% |
| Arab | 8 | 0.1% |
| Austrian | 21 | 0.2% |
| Barbadian | 12 | 0.1% |
| Belgian | 36 | 0.4% |
| Blackfeet | 1 | 0.0% |
| Bolivian | 4 | 0.0% |
| Brazilian | 18 | 0.2% |
| British | 1 | 0.0% |
| Central American | 109 | 1.1% |
| Chippewa | 10 | 0.1% |
| Costa Rican | 15 | 0.2% |
| Creek | 4 | 0.0% |
| Cuban | 2 | 0.0% |
| Czech | 48 | 0.5% |
| Czechoslovakian | 4 | 0.0% |
| Danish | 88 | 0.9% |
| Dutch | 173 | 1.8% |
| Eastern European | 5 | 0.1% |
| English | 496 | 5.1% |
| European | 186 | 1.9% |
| Finnish | 73 | 0.7% |
| French | 180 | 1.8% |
| French Canadian | 25 | 0.3% |
| German | 3,712 | 37.9% |
| Greek | 12 | 0.1% |
| Guatemalan | 72 | 0.7% |
| Honduran | 22 | 0.2% |
| Hungarian | 15 | 0.2% |
| Irish | 1,001 | 10.2% |
| Italian | 39 | 0.4% |
| Korean | 6 | 0.1% |
| Lebanese | 8 | 0.1% |
| Luxembourger | 15 | 0.2% |
| Mexican | 418 | 4.3% |
| Northern European | 13 | 0.1% |
| Norwegian | 2,912 | 29.7% |
| Polish | 366 | 3.7% |
| Romanian | 6 | 0.1% |
| Russian | 49 | 0.5% |
| Scandinavian | 266 | 2.7% |
| Scotch-Irish | 49 | 0.5% |
| Scottish | 40 | 0.4% |
| Serbian | 23 | 0.2% |
| Sioux | 4 | 0.0% |
| Slavic | 6 | 0.1% |
| Slovak | 3 | 0.0% |
| South African | 34 | 0.4% |
| South American | 4 | 0.0% |
| Spaniard | 8 | 0.1% |
| Spanish | 8 | 0.1% |
| Sri Lankan | 2 | 0.0% |
| Subsaharan African | 104 | 1.1% |
| Swedish | 901 | 9.2% |
| Swiss | 24 | 0.2% |
| Turkish | 3 | 0.0% |
| Welsh | 8 | 0.1% |
| Yugoslavian | 3 | 0.0% | View All 59 Rows |
Immigrants in Swift County
The most numerous immigrant groups reported in Swift County came from Latin America (205 | 2.1%), Central America (190 | 1.9%), Mexico (157 | 1.6%), Micronesia (39 | 0.4%), and Oceania (39 | 0.4%), together accounting for 6.4% of all Swift County residents.

| Immigration Origin | # Population | % Population |
| Africa | 34 | 0.4% |
| Bolivia | 4 | 0.0% |
| Brazil | 11 | 0.1% |
| Canada | 8 | 0.1% |
| Central America | 190 | 1.9% |
| Costa Rica | 15 | 0.2% |
| Eastern Europe | 2 | 0.0% |
| Europe | 8 | 0.1% |
| Germany | 5 | 0.1% |
| Honduras | 18 | 0.2% |
| Latin America | 205 | 2.1% |
| Mexico | 157 | 1.6% |
| Micronesia | 39 | 0.4% |
| Northern Europe | 1 | 0.0% |
| Norway | 1 | 0.0% |
| Oceania | 39 | 0.4% |
| Romania | 2 | 0.0% |
| South Africa | 34 | 0.4% |
| South America | 15 | 0.2% |
| Western Europe | 5 | 0.1% | View All 20 Rows |
Sex and Age in Swift County
Sex and Age in Swift County
The most populous age groups in Swift County are 55 to 59 Years (384 | 7.6%) for men and 10 to 14 Years (352 | 7.4%) for women.

| Age Bracket | Male | Female |
| Under 5 Years | 285 (5.7%) | 282 (5.9%) |
| 5 to 9 Years | 289 (5.7%) | 206 (4.3%) |
| 10 to 14 Years | 375 (7.4%) | 352 (7.4%) |
| 15 to 19 Years | 371 (7.4%) | 264 (5.5%) |
| 20 to 24 Years | 288 (5.7%) | 267 (5.6%) |
| 25 to 29 Years | 244 (4.9%) | 244 (5.1%) |
| 30 to 34 Years | 273 (5.4%) | 221 (4.6%) |
| 35 to 39 Years | 273 (5.4%) | 269 (5.6%) |
| 40 to 44 Years | 328 (6.5%) | 232 (4.9%) |
| 45 to 49 Years | 274 (5.4%) | 226 (4.7%) |
| 50 to 54 Years | 304 (6.0%) | 273 (5.7%) |
| 55 to 59 Years | 384 (7.6%) | 330 (6.9%) |
| 60 to 64 Years | 346 (6.9%) | 343 (7.2%) |
| 65 to 69 Years | 329 (6.5%) | 289 (6.0%) |
| 70 to 74 Years | 252 (5.0%) | 276 (5.8%) |
| 75 to 79 Years | 176 (3.5%) | 173 (3.6%) |
| 80 to 84 Years | 103 (2.1%) | 261 (5.5%) |
| 85 Years and over | 137 (2.7%) | 267 (5.6%) |
| Total | 5,031 (100.0%) | 4,775 (100.0%) |
Families and Households in Swift County
Median Family Size in Swift County
The median family size in Swift County is 2.85 persons per family, with married-couple families (1,998 | 73.5%) accounting for the largest median family size of 2.92 persons per family. On the other hand, single male/father families (301 | 11.1%) represent the smallest median family size with 2.36 persons per family.

| Family Type | # Families | Family Size |
| Married-Couple | 1,998 (73.5%) | 2.92 |
| Single Male/Father | 301 (11.1%) | 2.36 |
| Single Female/Mother | 420 (15.4%) | 2.90 |
| Total Families | 2,719 (100.0%) | 2.85 |
Median Household Size in Swift County
The median household size in Swift County is 2.31 persons per household, with single female/mother households (420 | 10.1%) accounting for the largest median household size of 3.17 persons per household. non-family households (1,435 | 34.5%) represent the smallest median household size with 1.15 persons per household.

| Household Type | # Households | Household Size |
| Married-Couple | 1,998 (48.1%) | 2.93 |
| Single Male/Father | 301 (7.2%) | 2.57 |
| Single Female/Mother | 420 (10.1%) | 3.17 |
| Non-family | 1,435 (34.5%) | 1.15 |
| Total Households | 4,154 (100.0%) | 2.31 |
Household Size by Marriage Status in Swift County
Out of a total of 4,154 households in Swift County, 2,719 (65.4%) are family households, while 1,435 (34.5%) are nonfamily households. The most numerous type of family households are 2-person households, comprising 1,386, and the most common type of nonfamily households are 1-person households, comprising 1,286.

| Household Size | Family Households | Nonfamily Households |
| 1-Person Households | - | 1,286 (31.0%) |
| 2-Person Households | 1,386 (33.4%) | 124 (3.0%) |
| 3-Person Households | 611 (14.7%) | 5 (0.1%) |
| 4-Person Households | 433 (10.4%) | 9 (0.2%) |
| 5-Person Households | 208 (5.0%) | 0 (0.0%) |
| 6-Person Households | 51 (1.2%) | 11 (0.3%) |
| 7+ Person Households | 30 (0.7%) | 0 (0.0%) |
| Total | 2,719 (65.4%) | 1,435 (34.5%) |
Female Fertility in Swift County
Fertility by Age in Swift County
Average fertility rate in Swift County is 93.0 births per 1,000 women. Women in the age bracket of 20 to 34 years have the highest fertility rate with 171.0 births per 1,000 women. Women in the age bracket of 20 to 34 years acount for 75.8% of all women with births.

| Age Bracket | Women with Births | Births / 1,000 Women |
| 15 to 19 years | 0 (0.0%) | 0.0 |
| 20 to 34 years | 125 (75.8%) | 171.0 |
| 35 to 50 years | 40 (24.2%) | 51.0 |
| Total | 165 (100.0%) | 93.0 |
Fertility by Age by Marriage Status in Swift County
78.2% of women with births (165) in Swift County are married. The highest percentage of unmarried women with births falls into 35 to 50 years age bracket with 40.0% of them unmarried at the time of birth, while the lowest percentage of unmarried women with births belong to 20 to 34 years age bracket with 16.0% of them unmarried.

| Age Bracket | Married | Unmarried |
| 15 to 19 years | 0 (0.0%) | 0 (0.0%) |
| 20 to 34 years | 105 (84.0%) | 20 (16.0%) |
| 35 to 50 years | 24 (60.0%) | 16 (40.0%) |
| Total | 129 (78.2%) | 36 (21.8%) |
Fertility by Education in Swift County
Average fertility rate in Swift County is 93.0 births per 1,000 women. Women with the education attainment of high school diploma have the highest fertility rate of 149.0 births per 1,000 women, while women with the education attainment of graduate degree have the lowest fertility at 11.0 births per 1,000 women. Women with the education attainment of college or associate's degree represent 37.6% of all women with births.

| Educational Attainment | Women with Births | Births / 1,000 Women |
| Less than High School | 6 (3.6%) | 22.0 |
| High School Diploma | 59 (35.8%) | 149.0 |
| College or Associate's Degree | 62 (37.6%) | 93.0 |
| Bachelor's Degree | 37 (22.4%) | 102.0 |
| Graduate Degree | 1 (0.6%) | 11.0 |
| Total | 165 (100.0%) | 93.0 |
Fertility by Education by Marriage Status in Swift County
21.8% of women with births in Swift County are unmarried. Women with the educational attainment of graduate degree are most likely to be married with 100.0% of them married at childbirth, while women with the educational attainment of less than high school are least likely to be married with 83.3% of them unmarried at childbirth.

| Educational Attainment | Married | Unmarried |
| Less than High School | 1 (16.7%) | 5 (83.3%) |
| High School Diploma | 53 (89.8%) | 6 (10.2%) |
| College or Associate's Degree | 46 (74.2%) | 16 (25.8%) |
| Bachelor's Degree | 28 (75.7%) | 9 (24.3%) |
| Graduate Degree | 1 (100.0%) | 0 (0.0%) |
| Total | 129 (78.2%) | 36 (21.8%) |
Income in Swift County
Income Overview in Swift County
Per Capita Income in Swift County is $35,595, while median incomes of families and households are $76,050 and $58,362 respectively.
| Characteristic | Number | Measure |
| Per Capita Income | 9,806 | $35,595 |
| Median Family Income | 2,719 | $76,050 |
| Mean Family Income | 2,719 | $95,985 |
| Median Household Income | 4,154 | $58,362 |
| Mean Household Income | 4,154 | $81,827 |
| Income Deficit | 2,719 | $9,544 |
| Wage / Income Gap (%) | 9,806 | 40.90% |
| Wage / Income Gap ($) | 9,806 | 59.10¢ per $1 |
| Gini / Inequality Index | 9,806 | 0.46 |
Earnings by Sex in Swift County
Average Earnings in Swift County are $40,306, $49,799 for men and $29,433 for women, a difference of 40.9%.

| Sex | Number | Average Earnings |
| Male | 2,887 (54.9%) | $49,799 |
| Female | 2,368 (45.1%) | $29,433 |
| Total | 5,255 (100.0%) | $40,306 |
Earnings by Sex by Income Bracket in Swift County
The most common earnings brackets in Swift County are $75,000 to $99,999 for men (397 | 13.8%) and $75,000 to $99,999 for women (201 | 8.5%).

| Income | Male | Female |
| $2,499 or less | 123 (4.3%) | 163 (6.9%) |
| $2,500 to $4,999 | 120 (4.2%) | 106 (4.5%) |
| $5,000 to $7,499 | 41 (1.4%) | 103 (4.3%) |
| $7,500 to $9,999 | 67 (2.3%) | 105 (4.4%) |
| $10,000 to $12,499 | 129 (4.5%) | 124 (5.2%) |
| $12,500 to $14,999 | 42 (1.5%) | 81 (3.4%) |
| $15,000 to $17,499 | 78 (2.7%) | 98 (4.1%) |
| $17,500 to $19,999 | 34 (1.2%) | 81 (3.4%) |
| $20,000 to $22,499 | 110 (3.8%) | 37 (1.6%) |
| $22,500 to $24,999 | 64 (2.2%) | 125 (5.3%) |
| $25,000 to $29,999 | 81 (2.8%) | 183 (7.7%) |
| $30,000 to $34,999 | 126 (4.4%) | 130 (5.5%) |
| $35,000 to $39,999 | 117 (4.1%) | 129 (5.4%) |
| $40,000 to $44,999 | 183 (6.3%) | 188 (7.9%) |
| $45,000 to $49,999 | 133 (4.6%) | 159 (6.7%) |
| $50,000 to $54,999 | 228 (7.9%) | 60 (2.5%) |
| $55,000 to $64,999 | 297 (10.3%) | 132 (5.6%) |
| $65,000 to $74,999 | 265 (9.2%) | 97 (4.1%) |
| $75,000 to $99,999 | 397 (13.8%) | 201 (8.5%) |
| $100,000+ | 252 (8.7%) | 66 (2.8%) |
| Total | 2,887 (100.0%) | 2,368 (100.0%) |
Earnings by Sex by Educational Attainment in Swift County
Average earnings in Swift County are $52,490 for men and $35,625 for women, a difference of 32.1%. Men with an educational attainment of graduate degree enjoy the highest average annual earnings of $71,016, while those with less than high school education earn the least with $34,554. Women with an educational attainment of graduate degree earn the most with the average annual earnings of $80,500, while those with high school diploma education have the smallest earnings of $24,286.

| Educational Attainment | Male Income | Female Income |
| Less than High School | $34,554 | $0 |
| High School Diploma | $45,054 | $24,286 |
| College or Associate's Degree | $52,522 | $33,750 |
| Bachelor's Degree | $62,426 | $46,793 |
| Graduate Degree | $71,016 | $80,500 |
| Total | $52,490 | $35,625 |
Family Income in Swift County
Family Income Brackets in Swift County
According to the Swift County family income data, there are 590 families falling into the $50,000 to $74,999 income range, which is the most common income bracket and makes up 21.7% of all families. Conversely, the less than $10,000 income bracket is the least frequent group with only 41 families (1.5%) belonging to this category.

| Income Bracket | # Families | % Families |
| Less than $10,000 | 41 | 1.5% |
| $10,000 to $14,999 | 79 | 2.9% |
| $15,000 to $24,999 | 79 | 2.9% |
| $25,000 to $34,999 | 242 | 8.9% |
| $35,000 to $49,999 | 318 | 11.7% |
| $50,000 to $74,999 | 590 | 21.7% |
| $75,000 to $99,999 | 364 | 13.4% |
| $100,000 to $149,999 | 538 | 19.8% |
| $150,000 to $199,999 | 245 | 9.0% |
| $200,000+ | 226 | 8.3% |
Family Income by Famaliy Size in Swift County
6-person families (40 | 1.5%) account for the highest median family income in Swift County with $118,333 per family, while 2-person families (1,477 | 54.3%) have the highest median income of $38,646 per family member.

| Income Bracket | # Families | Median Income |
| 2-Person Families | 1,477 (54.3%) | $77,292 |
| 3-Person Families | 640 (23.5%) | $55,500 |
| 4-Person Families | 333 (12.2%) | $115,766 |
| 5-Person Families | 199 (7.3%) | $81,563 |
| 6-Person Families | 40 (1.5%) | $118,333 |
| 7+ Person Families | 30 (1.1%) | $61,667 |
| Total | 2,719 (100.0%) | $76,050 |
Family Income by Number of Earners in Swift County
The median family income in Swift County is $76,050, with families comprising 3+ earners (258) having the highest median family income of $128,500, while families with no earners (323) have the lowest median family income of $49,896, accounting for 9.5% and 11.9% of families, respectively.

| Number of Earners | # Families | Median Income |
| No Earners | 323 (11.9%) | $49,896 |
| 1 Earner | 1,021 (37.6%) | $50,318 |
| 2 Earners | 1,117 (41.1%) | $109,566 |
| 3+ Earners | 258 (9.5%) | $128,500 |
| Total | 2,719 (100.0%) | $76,050 |
Household Income in Swift County
Household Income Brackets in Swift County
With 773 households falling in the category, the $50,000 to $74,999 income range is the most frequent in Swift County, accounting for 18.6% of all households. In contrast, only 158 households (3.8%) fall into the less than $10,000 income bracket, making it the least populous group.
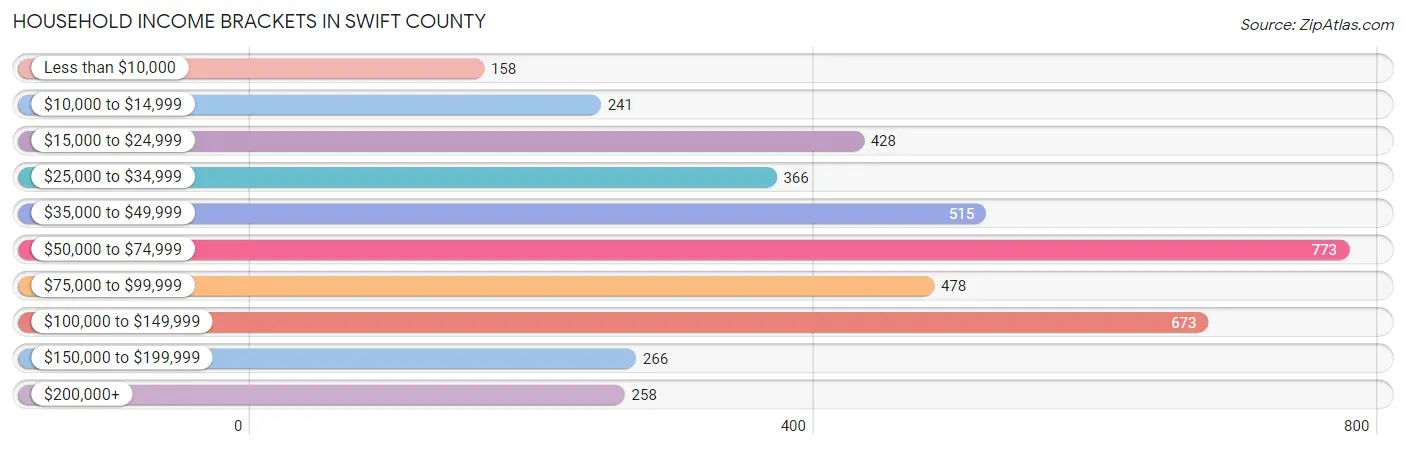
| Income Bracket | # Households | % Households |
| Less than $10,000 | 158 | 3.8% |
| $10,000 to $14,999 | 241 | 5.8% |
| $15,000 to $24,999 | 428 | 10.3% |
| $25,000 to $34,999 | 366 | 8.8% |
| $35,000 to $49,999 | 515 | 12.4% |
| $50,000 to $74,999 | 773 | 18.6% |
| $75,000 to $99,999 | 478 | 11.5% |
| $100,000 to $149,999 | 673 | 16.2% |
| $150,000 to $199,999 | 266 | 6.4% |
| $200,000+ | 258 | 6.2% |
Household Income by Householder Age in Swift County
The median household income in Swift County is $58,362, with the highest median household income of $81,938 found in the 45 to 64 years age bracket for the primary householder. A total of 1,415 households (34.1%) fall into this category. Meanwhile, the 15 to 24 years age bracket for the primary householder has the lowest median household income of $28,906, with 144 households (3.5%) in this group.

| Income Bracket | # Households | Median Income |
| 15 to 24 Years | 144 (3.5%) | $28,906 |
| 25 to 44 Years | 1,132 (27.3%) | $70,000 |
| 45 to 64 Years | 1,415 (34.1%) | $81,938 |
| 65+ Years | 1,463 (35.2%) | $41,991 |
| Total | 4,154 (100.0%) | $58,362 |
Poverty in Swift County
Income Below Poverty by Sex and Age in Swift County
With 11.1% poverty level for males and 10.3% for females among the residents of Swift County, 18 to 24 year old males and 5 year old females are the most vulnerable to poverty, with 114 males (29.6%) and 11 females (32.4%) in their respective age groups living below the poverty level.

| Age Bracket | Male | Female |
| Under 5 Years | 59 (20.7%) | 21 (7.4%) |
| 5 Years | 15 (28.3%) | 11 (32.4%) |
| 6 to 11 Years | 42 (11.4%) | 44 (12.8%) |
| 12 to 14 Years | 41 (18.4%) | 26 (14.4%) |
| 15 Years | 16 (13.5%) | 3 (5.9%) |
| 16 and 17 Years | 1 (0.7%) | 10 (7.4%) |
| 18 to 24 Years | 114 (29.6%) | 57 (16.5%) |
| 25 to 34 Years | 61 (11.8%) | 68 (14.7%) |
| 35 to 44 Years | 45 (7.5%) | 65 (13.1%) |
| 45 to 54 Years | 25 (4.5%) | 35 (7.2%) |
| 55 to 64 Years | 60 (8.3%) | 67 (10.0%) |
| 65 to 74 Years | 38 (6.6%) | 24 (4.7%) |
| 75 Years and over | 33 (8.1%) | 53 (7.8%) |
| Total | 550 (11.1%) | 484 (10.3%) |
Income Above Poverty by Sex and Age in Swift County
According to the poverty statistics in Swift County, males aged 16 and 17 years and females aged 65 to 74 years are the age groups that are most secure financially, with 99.3% of males and 95.3% of females in these age groups living above the poverty line.

| Age Bracket | Male | Female |
| Under 5 Years | 226 (79.3%) | 261 (92.5%) |
| 5 Years | 38 (71.7%) | 23 (67.6%) |
| 6 to 11 Years | 326 (88.6%) | 299 (87.2%) |
| 12 to 14 Years | 182 (81.6%) | 154 (85.6%) |
| 15 Years | 103 (86.6%) | 48 (94.1%) |
| 16 and 17 Years | 151 (99.3%) | 125 (92.6%) |
| 18 to 24 Years | 271 (70.4%) | 288 (83.5%) |
| 25 to 34 Years | 454 (88.2%) | 395 (85.3%) |
| 35 to 44 Years | 555 (92.5%) | 433 (87.0%) |
| 45 to 54 Years | 536 (95.5%) | 454 (92.8%) |
| 55 to 64 Years | 662 (91.7%) | 606 (90.0%) |
| 65 to 74 Years | 534 (93.4%) | 487 (95.3%) |
| 75 Years and over | 373 (91.9%) | 626 (92.2%) |
| Total | 4,411 (88.9%) | 4,199 (89.7%) |
Income Below Poverty Among Married-Couple Families in Swift County
The poverty statistics for married-couple families in Swift County show that 2.4% or 47 of the total 1,998 families live below the poverty line. Families with 5 or more children have the highest poverty rate of 50.0%, comprising of 8 families. On the other hand, families with no children have the lowest poverty rate of 1.9%, which includes 25 families.

| Children | Above Poverty | Below Poverty |
| No Children | 1,289 (98.1%) | 25 (1.9%) |
| 1 or 2 Children | 480 (98.0%) | 10 (2.0%) |
| 3 or 4 Children | 174 (97.8%) | 4 (2.2%) |
| 5 or more Children | 8 (50.0%) | 8 (50.0%) |
| Total | 1,951 (97.7%) | 47 (2.4%) |
Income Below Poverty Among Single-Parent Households in Swift County
According to the poverty data in Swift County, 17.6% or 53 single-father households and 22.6% or 95 single-mother households are living below the poverty line. Among single-father households, those with 1 or 2 children have the highest poverty rate, with 52 households (27.2%) experiencing poverty. Likewise, among single-mother households, those with 3 or 4 children have the highest poverty rate, with 32 households (80.0%) falling below the poverty line.

| Children | Single Father | Single Mother |
| No Children | 1 (1.0%) | 25 (19.5%) |
| 1 or 2 Children | 52 (27.2%) | 38 (15.1%) |
| 3 or 4 Children | 0 (0.0%) | 32 (80.0%) |
| 5 or more Children | 0 (0.0%) | 0 (0.0%) |
| Total | 53 (17.6%) | 95 (22.6%) |
Income Below Poverty Among Married-Couple vs Single-Parent Households in Swift County
The poverty data for Swift County shows that 47 of the married-couple family households (2.4%) and 148 of the single-parent households (20.5%) are living below the poverty level. Within the married-couple family households, those with 5 or more children have the highest poverty rate, with 8 households (50.0%) falling below the poverty line. Among the single-parent households, those with 3 or 4 children have the highest poverty rate, with 32 household (64.0%) living below poverty.

| Children | Married-Couple Families | Single-Parent Households |
| No Children | 25 (1.9%) | 26 (11.4%) |
| 1 or 2 Children | 10 (2.0%) | 90 (20.3%) |
| 3 or 4 Children | 4 (2.2%) | 32 (64.0%) |
| 5 or more Children | 8 (50.0%) | 0 (0.0%) |
| Total | 47 (2.4%) | 148 (20.5%) |
Employment Characteristics in Swift County
Employment by Class of Employer in Swift County
Among the 4,576 employed individuals in Swift County, private company employees (2,462 | 53.8%), not-for-profit organizations (538 | 11.8%), and local government employees (500 | 10.9%) make up the most common classes of employment.

| Employer Class | # Employees | % Employees |
| Private Company Employees | 2,462 | 53.8% |
| Self-Employed (Incorporated) | 294 | 6.4% |
| Self-Employed (Not Incorporated) | 484 | 10.6% |
| Not-for-profit Organizations | 538 | 11.8% |
| Local Government Employees | 500 | 10.9% |
| State Government Employees | 114 | 2.5% |
| Federal Government Employees | 175 | 3.8% |
| Unpaid Family Workers | 9 | 0.2% |
| Total | 4,576 | 100.0% |
Employment Status by Age in Swift County
According to the labor force statistics for Swift County, out of the total population over 16 years of age (7,847), 61.8% or 4,849 individuals are in the labor force, with 3.7% or 179 of them unemployed. The age group with the highest labor force participation rate is 35 to 44 years, with 90.0% or 992 individuals in the labor force. Within the labor force, the 20 to 24 years age range has the highest percentage of unemployed individuals, with 11.4% or 46 of them being unemployed.

| Age Bracket | In Labor Force | Unemployed |
| 16 to 19 Years | 184 (39.6%) | 4 (2.2%) |
| 20 to 24 Years | 404 (72.8%) | 46 (11.4%) |
| 25 to 29 Years | 346 (70.9%) | 11 (3.2%) |
| 30 to 34 Years | 434 (87.9%) | 13 (3.1%) |
| 35 to 44 Years | 992 (90.0%) | 32 (3.2%) |
| 45 to 54 Years | 912 (84.7%) | 32 (3.5%) |
| 55 to 59 Years | 606 (84.9%) | 23 (3.8%) |
| 60 to 64 Years | 494 (71.7%) | 11 (2.2%) |
| 65 to 74 Years | 386 (33.7%) | 2 (0.5%) |
| 75 Years and over | 95 (8.5%) | 5 (5.3%) |
| Total | 4,849 (61.8%) | 179 (3.7%) |
Employment Status by Educational Attainment in Swift County
According to labor force statistics for Swift County, 82.9% of individuals (3,784) out of the total population between 25 and 64 years of age (4,564) are in the labor force, with 3.2% or 121 of them being unemployed. The group with the highest labor force participation rate are those with the educational attainment of bachelor's degree or higher, with 89.3% or 1,068 individuals in the labor force. Within the labor force, individuals with less than high school education have the highest percentage of unemployment, with 22.0% or 42 of them being unemployed.

| Educational Attainment | In Labor Force | Unemployed |
| Less than High School | 191 (65.6%) | 64 (22.0%) |
| High School Diploma | 907 (74.6%) | 35 (2.9%) |
| College / Associate Degree | 1,617 (86.9%) | 54 (2.9%) |
| Bachelor's Degree or higher | 1,068 (89.3%) | 10 (0.8%) |
| Total | 3,784 (82.9%) | 146 (3.2%) |
Employment Occupations by Sex in Swift County
Management, Business, Science and Arts Occupations
The most common Management, Business, Science and Arts occupations in Swift County are Management (701 | 15.0%), Community & Social Service (472 | 10.1%), Health Diagnosing & Treating (304 | 6.5%), Education Instruction & Library (280 | 6.0%), and Computers, Engineering & Science (191 | 4.1%).

Management, Business, Science and Arts Occupations by Sex
Within the Management, Business, Science and Arts occupations in Swift County, the most male-oriented occupations are Management (78.6%), Architecture & Engineering (69.3%), and Arts, Media & Entertainment (46.9%), while the most female-oriented occupations are Health Diagnosing & Treating (89.5%), Life, Physical & Social Science (81.3%), and Health Technologists (79.5%).

| Occupation | Male | Female |
| Management | 551 (78.6%) | 150 (21.4%) |
| Business & Financial | 47 (36.1%) | 83 (63.8%) |
| Computers, Engineering & Science | 76 (39.8%) | 115 (60.2%) |
| Computers & Mathematics | 7 (28.0%) | 18 (72.0%) |
| Architecture & Engineering | 52 (69.3%) | 23 (30.7%) |
| Life, Physical & Social Science | 17 (18.7%) | 74 (81.3%) |
| Community & Social Service | 148 (31.4%) | 324 (68.6%) |
| Education, Arts & Media | 34 (31.2%) | 75 (68.8%) |
| Legal Services & Support | 7 (20.6%) | 27 (79.4%) |
| Education Instruction & Library | 84 (30.0%) | 196 (70.0%) |
| Arts, Media & Entertainment | 23 (46.9%) | 26 (53.1%) |
| Health Diagnosing & Treating | 32 (10.5%) | 272 (89.5%) |
| Health Technologists | 27 (20.4%) | 105 (79.5%) |
| Total (Category) | 854 (47.5%) | 944 (52.5%) |
| Total (Overall) | 2,540 (54.5%) | 2,118 (45.5%) |
Services Occupations
The most common Services occupations in Swift County are Healthcare Support (230 | 4.9%), Food Preparation & Serving (153 | 3.3%), Personal Care & Service (149 | 3.2%), Cleaning & Maintenance (134 | 2.9%), and Security & Protection (60 | 1.3%).

Services Occupations by Sex
Within the Services occupations in Swift County, the most male-oriented occupations are Law Enforcement (90.5%), Security & Protection (63.3%), and Personal Care & Service (50.3%), while the most female-oriented occupations are Firefighting & Prevention (100.0%), Healthcare Support (96.1%), and Food Preparation & Serving (66.7%).

| Occupation | Male | Female |
| Healthcare Support | 9 (3.9%) | 221 (96.1%) |
| Security & Protection | 38 (63.3%) | 22 (36.7%) |
| Firefighting & Prevention | 0 (0.0%) | 18 (100.0%) |
| Law Enforcement | 38 (90.5%) | 4 (9.5%) |
| Food Preparation & Serving | 51 (33.3%) | 102 (66.7%) |
| Cleaning & Maintenance | 66 (49.2%) | 68 (50.7%) |
| Personal Care & Service | 75 (50.3%) | 74 (49.7%) |
| Total (Category) | 239 (32.9%) | 487 (67.1%) |
| Total (Overall) | 2,540 (54.5%) | 2,118 (45.5%) |
Sales and Office Occupations
The most common Sales and Office occupations in Swift County are Office & Administration (521 | 11.2%), and Sales & Related (268 | 5.8%).

Sales and Office Occupations by Sex

| Occupation | Male | Female |
| Sales & Related | 100 (37.3%) | 168 (62.7%) |
| Office & Administration | 139 (26.7%) | 382 (73.3%) |
| Total (Category) | 239 (30.3%) | 550 (69.7%) |
| Total (Overall) | 2,540 (54.5%) | 2,118 (45.5%) |
Natural Resources, Construction and Maintenance Occupations
The most common Natural Resources, Construction and Maintenance occupations in Swift County are Farming, Fishing & Forestry (239 | 5.1%), Construction & Extraction (174 | 3.7%), and Installation, Maintenance & Repair (164 | 3.5%).

Natural Resources, Construction and Maintenance Occupations by Sex

| Occupation | Male | Female |
| Farming, Fishing & Forestry | 206 (86.2%) | 33 (13.8%) |
| Construction & Extraction | 159 (91.4%) | 15 (8.6%) |
| Installation, Maintenance & Repair | 152 (92.7%) | 12 (7.3%) |
| Total (Category) | 517 (89.6%) | 60 (10.4%) |
| Total (Overall) | 2,540 (54.5%) | 2,118 (45.5%) |
Production, Transportation and Moving Occupations
The most common Production, Transportation and Moving occupations in Swift County are Production (390 | 8.4%), Transportation (258 | 5.5%), and Material Moving (120 | 2.6%).
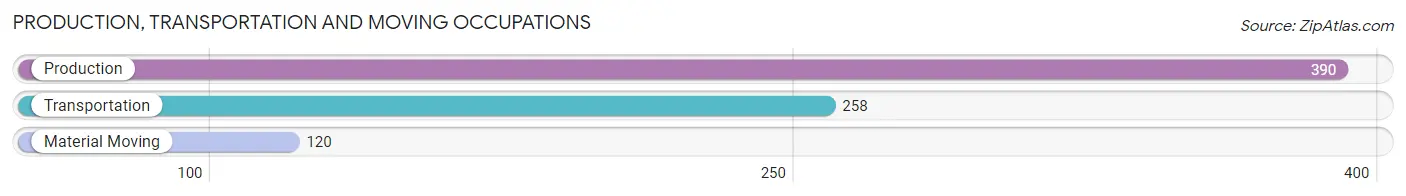
Production, Transportation and Moving Occupations by Sex

| Occupation | Male | Female |
| Production | 363 (93.1%) | 27 (6.9%) |
| Transportation | 225 (87.2%) | 33 (12.8%) |
| Material Moving | 103 (85.8%) | 17 (14.2%) |
| Total (Category) | 691 (90.0%) | 77 (10.0%) |
| Total (Overall) | 2,540 (54.5%) | 2,118 (45.5%) |
Employment Industries by Sex in Swift County
Employment Industries in Swift County
The major employment industries in Swift County include Health Care & Social Assistance (832 | 17.9%), Agriculture, Fishing & Hunting (683 | 14.7%), Manufacturing (629 | 13.5%), Retail Trade (397 | 8.5%), and Educational Services (373 | 8.0%).

Employment Industries by Sex in Swift County
The Swift County industries that see more men than women are Mining, Quarrying, & Extraction (100.0%), Construction (89.4%), and Agriculture, Fishing & Hunting (88.3%), whereas the industries that tend to have a higher number of women are Real Estate, Rental & Leasing (92.9%), Health Care & Social Assistance (92.1%), and Professional & Scientific (70.1%).

| Industry | Male | Female |
| Agriculture, Fishing & Hunting | 603 (88.3%) | 80 (11.7%) |
| Mining, Quarrying, & Extraction | 8 (100.0%) | 0 (0.0%) |
| Construction | 219 (89.4%) | 26 (10.6%) |
| Manufacturing | 485 (77.1%) | 144 (22.9%) |
| Wholesale Trade | 80 (76.2%) | 25 (23.8%) |
| Retail Trade | 168 (42.3%) | 229 (57.7%) |
| Transportation & Warehousing | 246 (84.8%) | 44 (15.2%) |
| Utilities | 17 (40.5%) | 25 (59.5%) |
| Information | 43 (81.1%) | 10 (18.9%) |
| Finance & Insurance | 34 (44.2%) | 43 (55.8%) |
| Real Estate, Rental & Leasing | 1 (7.1%) | 13 (92.9%) |
| Professional & Scientific | 46 (29.9%) | 108 (70.1%) |
| Enterprise Management | 0 (0.0%) | 0 (0.0%) |
| Administrative & Support | 34 (52.3%) | 31 (47.7%) |
| Educational Services | 119 (31.9%) | 254 (68.1%) |
| Health Care & Social Assistance | 66 (7.9%) | 766 (92.1%) |
| Arts, Entertainment & Recreation | 53 (61.6%) | 33 (38.4%) |
| Accommodation & Food Services | 81 (49.4%) | 83 (50.6%) |
| Public Administration | 104 (52.3%) | 95 (47.7%) |
| Total | 2,540 (54.5%) | 2,118 (45.5%) |
Education in Swift County
School Enrollment in Swift County
The most common levels of schooling among the 2,173 students in Swift County are middle school (535 | 24.6%), high school (534 | 24.6%), and elementary school (413 | 19.0%).

| School Level | # Students | % Students |
| Nursery / Preschool | 167 | 7.7% |
| Kindergarten | 126 | 5.8% |
| Elementary School | 413 | 19.0% |
| Middle School | 535 | 24.6% |
| High School | 534 | 24.6% |
| College / Undergraduate | 303 | 13.9% |
| Graduate / Professional | 95 | 4.4% |
| Total | 2,173 | 100.0% |
School Enrollment by Age by Funding Source in Swift County
Out of a total of 2,173 students who are enrolled in schools in Swift County, 104 (4.8%) attend a private institution, while the remaining 2,069 (95.2%) are enrolled in public schools. The age group of 35 years and over has the highest likelihood of being enrolled in private schools, with 27 (29.0% in the age bracket) enrolled. Conversely, the age group of 18 to 19 year olds has the lowest likelihood of being enrolled in a private school, with 126 (100.0% in the age bracket) attending a public institution.

| Age Bracket | Public School | Private School |
| 3 to 4 Year Olds | 137 (99.3%) | 1 (0.7%) |
| 5 to 9 Year Old | 436 (96.9%) | 14 (3.1%) |
| 10 to 14 Year Olds | 673 (98.7%) | 9 (1.3%) |
| 15 to 17 Year Olds | 435 (96.5%) | 16 (3.5%) |
| 18 to 19 Year Olds | 126 (100.0%) | 0 (0.0%) |
| 20 to 24 Year Olds | 124 (91.8%) | 11 (8.2%) |
| 25 to 34 Year Olds | 71 (72.5%) | 27 (27.6%) |
| 35 Years and over | 66 (71.0%) | 27 (29.0%) |
| Total | 2,069 (95.2%) | 104 (4.8%) |
Educational Attainment by Field of Study in Swift County
Education (375 | 22.9%), bio, nature & agricultural (304 | 18.5%), business (270 | 16.5%), science & technology (236 | 14.4%), and arts & humanities (84 | 5.1%) are the most common fields of study among 1,640 individuals in Swift County who have obtained a bachelor's degree or higher.

| Field of Study | # Graduates | % Graduates |
| Computers & Mathematics | 22 | 1.3% |
| Bio, Nature & Agricultural | 304 | 18.5% |
| Physical & Health Sciences | 21 | 1.3% |
| Psychology | 33 | 2.0% |
| Social Sciences | 32 | 1.9% |
| Engineering | 66 | 4.0% |
| Multidisciplinary Studies | 2 | 0.1% |
| Science & Technology | 236 | 14.4% |
| Business | 270 | 16.5% |
| Education | 375 | 22.9% |
| Literature & Languages | 50 | 3.0% |
| Liberal Arts & History | 39 | 2.4% |
| Visual & Performing Arts | 23 | 1.4% |
| Communications | 83 | 5.1% |
| Arts & Humanities | 84 | 5.1% |
| Total | 1,640 | 100.0% |
Transportation & Commute in Swift County
Vehicle Availability by Sex in Swift County
The most prevalent vehicle ownership categories in Swift County are males with 2 vehicles (1,114, accounting for 45.0%) and females with 2 vehicles (780, making up 53.5%).

| Vehicles Available | Male | Female |
| No Vehicle | 26 (1.1%) | 40 (1.9%) |
| 1 Vehicle | 383 (15.5%) | 403 (19.4%) |
| 2 Vehicles | 1,114 (45.0%) | 780 (37.5%) |
| 3 Vehicles | 538 (21.7%) | 504 (24.2%) |
| 4 Vehicles | 246 (9.9%) | 180 (8.6%) |
| 5 or more Vehicles | 167 (6.8%) | 174 (8.4%) |
| Total | 2,474 (100.0%) | 2,081 (100.0%) |
Commute Time in Swift County
The most frequently occuring commute durations in Swift County are 5 to 9 minutes (890 commuters, 20.8%), less than 5 minutes (725 commuters, 16.9%), and 10 to 14 minutes (560 commuters, 13.1%).

| Commute Time | # Commuters | % Commuters |
| Less than 5 Minutes | 725 | 16.9% |
| 5 to 9 Minutes | 890 | 20.8% |
| 10 to 14 Minutes | 560 | 13.1% |
| 15 to 19 Minutes | 453 | 10.6% |
| 20 to 24 Minutes | 343 | 8.0% |
| 25 to 29 Minutes | 183 | 4.3% |
| 30 to 34 Minutes | 544 | 12.7% |
| 35 to 39 Minutes | 129 | 3.0% |
| 40 to 44 Minutes | 50 | 1.2% |
| 45 to 59 Minutes | 159 | 3.7% |
| 60 to 89 Minutes | 85 | 2.0% |
| 90 or more Minutes | 158 | 3.7% |
Commute Time by Sex in Swift County
The most common commute times in Swift County are 5 to 9 minutes (471 commuters, 20.2%) for males and 5 to 9 minutes (419 commuters, 21.6%) for females.

| Commute Time | Male | Female |
| Less than 5 Minutes | 433 (18.5%) | 292 (15.0%) |
| 5 to 9 Minutes | 471 (20.2%) | 419 (21.6%) |
| 10 to 14 Minutes | 327 (14.0%) | 233 (12.0%) |
| 15 to 19 Minutes | 227 (9.7%) | 226 (11.6%) |
| 20 to 24 Minutes | 168 (7.2%) | 175 (9.0%) |
| 25 to 29 Minutes | 110 (4.7%) | 73 (3.8%) |
| 30 to 34 Minutes | 291 (12.5%) | 253 (13.0%) |
| 35 to 39 Minutes | 62 (2.6%) | 67 (3.5%) |
| 40 to 44 Minutes | 12 (0.5%) | 38 (2.0%) |
| 45 to 59 Minutes | 67 (2.9%) | 92 (4.7%) |
| 60 to 89 Minutes | 54 (2.3%) | 31 (1.6%) |
| 90 or more Minutes | 114 (4.9%) | 44 (2.3%) |
Time of Departure to Work by Sex in Swift County
The most frequent times of departure to work in Swift County are 7:30 AM to 7:59 AM (379, 16.2%) for males and 7:30 AM to 7:59 AM (447, 23.0%) for females.

| Time of Departure | Male | Female |
| 12:00 AM to 4:59 AM | 137 (5.9%) | 27 (1.4%) |
| 5:00 AM to 5:29 AM | 171 (7.3%) | 52 (2.7%) |
| 5:30 AM to 5:59 AM | 189 (8.1%) | 62 (3.2%) |
| 6:00 AM to 6:29 AM | 217 (9.3%) | 133 (6.9%) |
| 6:30 AM to 6:59 AM | 270 (11.6%) | 264 (13.6%) |
| 7:00 AM to 7:29 AM | 363 (15.5%) | 326 (16.8%) |
| 7:30 AM to 7:59 AM | 379 (16.2%) | 447 (23.0%) |
| 8:00 AM to 8:29 AM | 174 (7.4%) | 159 (8.2%) |
| 8:30 AM to 8:59 AM | 45 (1.9%) | 60 (3.1%) |
| 9:00 AM to 9:59 AM | 91 (3.9%) | 157 (8.1%) |
| 10:00 AM to 10:59 AM | 12 (0.5%) | 35 (1.8%) |
| 11:00 AM to 11:59 AM | 1 (0.0%) | 17 (0.9%) |
| 12:00 PM to 3:59 PM | 173 (7.4%) | 132 (6.8%) |
| 4:00 PM to 11:59 PM | 114 (4.9%) | 72 (3.7%) |
| Total | 2,336 (100.0%) | 1,943 (100.0%) |
Housing Occupancy in Swift County
Occupancy by Ownership in Swift County
Of the total 4,154 dwellings in Swift County, owner-occupied units account for 3,063 (73.7%), while renter-occupied units make up 1,091 (26.3%).

| Occupancy | # Housing Units | % Housing Units |
| Owner Occupied Housing Units | 3,063 | 73.7% |
| Renter-Occupied Housing Units | 1,091 | 26.3% |
| Total Occupied Housing Units | 4,154 | 100.0% |
Occupancy by Household Size in Swift County

| Household Size | # Housing Units | % Housing Units |
| 1-Person Household | 1,286 | 31.0% |
| 2-Person Household | 1,510 | 36.3% |
| 3-Person Household | 616 | 14.8% |
| 4+ Person Household | 742 | 17.9% |
| Total Housing Units | 4,154 | 100.0% |
Occupancy by Ownership by Household Size in Swift County

| Household Size | Owner-occupied | Renter-occupied |
| 1-Person Household | 778 (60.5%) | 508 (39.5%) |
| 2-Person Household | 1,255 (83.1%) | 255 (16.9%) |
| 3-Person Household | 502 (81.5%) | 114 (18.5%) |
| 4+ Person Household | 528 (71.2%) | 214 (28.8%) |
| Total Housing Units | 3,063 (73.7%) | 1,091 (26.3%) |
Occupancy by Educational Attainment in Swift County

| Household Size | Owner-occupied | Renter-occupied |
| Less than High School | 209 (59.9%) | 140 (40.1%) |
| High School Diploma | 988 (73.5%) | 356 (26.5%) |
| College/Associate Degree | 1,087 (70.9%) | 447 (29.1%) |
| Bachelor's Degree or higher | 779 (84.0%) | 148 (16.0%) |
Occupancy by Age of Householder in Swift County

| Age Bracket | # Households | % Households |
| Under 35 Years | 598 | 14.4% |
| 35 to 44 Years | 678 | 16.3% |
| 45 to 54 Years | 551 | 13.3% |
| 55 to 64 Years | 864 | 20.8% |
| 65 to 74 Years | 669 | 16.1% |
| 75 to 84 Years | 507 | 12.2% |
| 85 Years and Over | 287 | 6.9% |
| Total | 4,154 | 100.0% |
Housing Finances in Swift County
Median Income by Occupancy in Swift County

| Occupancy Type | # Households | Median Income |
| Owner-Occupied | 3,063 (73.7%) | $69,081 |
| Renter-Occupied | 1,091 (26.3%) | $35,060 |
| Average | 4,154 (100.0%) | $58,362 |
Occupancy by Householder Income Bracket in Swift County

| Income Bracket | Owner-occupied | Renter-occupied |
| Less than $5,000 | 60 (2.0%) | 63 (5.8%) |
| $5,000 to $9,999 | 20 (0.6%) | 14 (1.3%) |
| $10,000 to $14,999 | 86 (2.8%) | 156 (14.3%) |
| $15,000 to $19,999 | 112 (3.7%) | 110 (10.1%) |
| $20,000 to $24,999 | 98 (3.2%) | 108 (9.9%) |
| $25,000 to $34,999 | 271 (8.8%) | 94 (8.6%) |
| $35,000 to $49,999 | 342 (11.2%) | 175 (16.0%) |
| $50,000 to $74,999 | 648 (21.2%) | 125 (11.5%) |
| $75,000 to $99,999 | 388 (12.7%) | 89 (8.2%) |
| $100,000 to $149,999 | 578 (18.9%) | 95 (8.7%) |
| $150,000 or more | 460 (15.0%) | 62 (5.7%) |
| Total | 3,063 (100.0%) | 1,091 (100.0%) |
Monthly Housing Cost Tiers in Swift County

| Monthly Cost | Owner-occupied | Renter-occupied |
| Less than $300 | 253 (8.3%) | 51 (4.7%) |
| $300 to $499 | 713 (23.3%) | 117 (10.7%) |
| $500 to $799 | 695 (22.7%) | 288 (26.4%) |
| $800 to $999 | 304 (9.9%) | 252 (23.1%) |
| $1,000 to $1,499 | 582 (19.0%) | 211 (19.3%) |
| $1,500 to $1,999 | 277 (9.0%) | 31 (2.8%) |
| $2,000 to $2,499 | 102 (3.3%) | 14 (1.3%) |
| $2,500 to $2,999 | 80 (2.6%) | 0 (0.0%) |
| $3,000 or more | 57 (1.9%) | 0 (0.0%) |
| Total | 3,063 (100.0%) | 1,091 (100.0%) |
Physical Housing Characteristics in Swift County
Housing Structures in Swift County

| Structure Type | # Housing Units | % Housing Units |
| Single Unit, Detached | 3,367 | 81.0% |
| Single Unit, Attached | 104 | 2.5% |
| 2 Unit Apartments | 35 | 0.8% |
| 3 or 4 Unit Apartments | 91 | 2.2% |
| 5 to 9 Unit Apartments | 141 | 3.4% |
| 10 or more Apartments | 320 | 7.7% |
| Mobile Home / Other | 96 | 2.3% |
| Total | 4,154 | 100.0% |
Housing Structures by Occupancy in Swift County

| Structure Type | Owner-occupied | Renter-occupied |
| Single Unit, Detached | 2,944 (87.4%) | 423 (12.6%) |
| Single Unit, Attached | 13 (12.5%) | 91 (87.5%) |
| 2 Unit Apartments | 12 (34.3%) | 23 (65.7%) |
| 3 or 4 Unit Apartments | 0 (0.0%) | 91 (100.0%) |
| 5 to 9 Unit Apartments | 0 (0.0%) | 141 (100.0%) |
| 10 or more Apartments | 3 (0.9%) | 317 (99.1%) |
| Mobile Home / Other | 91 (94.8%) | 5 (5.2%) |
| Total | 3,063 (73.7%) | 1,091 (26.3%) |
Housing Structures by Number of Rooms in Swift County

| Number of Rooms | Owner-occupied | Renter-occupied |
| 1 Room | 0 (0.0%) | 5 (0.5%) |
| 2 or 3 Rooms | 63 (2.1%) | 232 (21.3%) |
| 4 or 5 Rooms | 502 (16.4%) | 520 (47.7%) |
| 6 or 7 Rooms | 1,145 (37.4%) | 234 (21.4%) |
| 8 or more Rooms | 1,353 (44.2%) | 100 (9.2%) |
| Total | 3,063 (100.0%) | 1,091 (100.0%) |
Housing Structure by Heating Type in Swift County

| Heating Type | Owner-occupied | Renter-occupied |
| Utility Gas | 1,220 (39.8%) | 393 (36.0%) |
| Bottled, Tank, or LP Gas | 1,080 (35.3%) | 207 (19.0%) |
| Electricity | 482 (15.7%) | 432 (39.6%) |
| Fuel Oil or Kerosene | 204 (6.7%) | 30 (2.8%) |
| Coal or Coke | 0 (0.0%) | 1 (0.1%) |
| All other Fuels | 67 (2.2%) | 18 (1.7%) |
| No Fuel Used | 10 (0.3%) | 10 (0.9%) |
| Total | 3,063 (100.0%) | 1,091 (100.0%) |
Household Vehicle Usage in Swift County

| Vehicles per Household | Owner-occupied | Renter-occupied |
| No Vehicle | 43 (1.4%) | 148 (13.6%) |
| 1 Vehicle | 773 (25.2%) | 515 (47.2%) |
| 2 Vehicles | 1,250 (40.8%) | 336 (30.8%) |
| 3 or more Vehicles | 997 (32.6%) | 92 (8.4%) |
| Total | 3,063 (100.0%) | 1,091 (100.0%) |
Real Estate & Mortgages in Swift County
Real Estate and Mortgage Overview in Swift County
| Characteristic | Without Mortgage | With Mortgage |
| Housing Units | 1,703 | 1,360 |
| Median Property Value | $118,300 | $154,500 |
| Median Household Income | $55,871 | $246 |
| Monthly Housing Costs | $474 | $57 |
| Real Estate Taxes | $1,105 | $10 |
Property Value by Mortgage Status in Swift County

| Property Value | Without Mortgage | With Mortgage |
| Less than $50,000 | 297 (17.4%) | 90 (6.6%) |
| $50,000 to $99,999 | 429 (25.2%) | 369 (27.1%) |
| $100,000 to $299,999 | 747 (43.9%) | 718 (52.8%) |
| $300,000 to $499,999 | 175 (10.3%) | 104 (7.6%) |
| $500,000 to $749,999 | 28 (1.6%) | 22 (1.6%) |
| $750,000 to $999,999 | 7 (0.4%) | 16 (1.2%) |
| $1,000,000 or more | 20 (1.2%) | 41 (3.0%) |
| Total | 1,703 (100.0%) | 1,360 (100.0%) |
Household Income by Mortgage Status in Swift County

| Household Income | Without Mortgage | With Mortgage |
| Less than $10,000 | 63 (3.7%) | 23 (1.7%) |
| $10,000 to $24,999 | 231 (13.6%) | 17 (1.3%) |
| $25,000 to $34,999 | 175 (10.3%) | 65 (4.8%) |
| $35,000 to $49,999 | 204 (12.0%) | 96 (7.1%) |
| $50,000 to $74,999 | 430 (25.3%) | 138 (10.2%) |
| $75,000 to $99,999 | 180 (10.6%) | 218 (16.0%) |
| $100,000 to $149,999 | 206 (12.1%) | 208 (15.3%) |
| $150,000 or more | 214 (12.6%) | 372 (27.4%) |
| Total | 1,703 (100.0%) | 1,360 (100.0%) |
Property Value to Household Income Ratio in Swift County

| Value-to-Income Ratio | Without Mortgage | With Mortgage |
| Less than 2.0x | 804 (47.2%) | 93,426 (6,869.6%) |
| 2.0x to 2.9x | 276 (16.2%) | 802 (59.0%) |
| 3.0x to 3.9x | 238 (14.0%) | 216 (15.9%) |
| 4.0x or more | 354 (20.8%) | 107 (7.9%) |
| Total | 1,703 (100.0%) | 1,360 (100.0%) |
Real Estate Taxes by Mortgage Status in Swift County

| Property Taxes | Without Mortgage | With Mortgage |
| Less than $800 | 481 (28.2%) | 0 (0.0%) |
| $800 to $1,499 | 670 (39.3%) | 332 (24.4%) |
| $800 to $1,499 | 526 (30.9%) | 523 (38.5%) |
| Total | 1,703 (100.0%) | 1,360 (100.0%) |
Health & Disability in Swift County
Health Insurance Coverage by Age in Swift County

| Age Bracket | With Coverage | Without Coverage |
| Under 6 Years | 626 (95.7%) | 28 (4.3%) |
| 6 to 18 Years | 1,642 (97.6%) | 40 (2.4%) |
| 19 to 25 Years | 621 (85.8%) | 103 (14.2%) |
| 26 to 34 Years | 707 (80.1%) | 176 (19.9%) |
| 35 to 44 Years | 1,033 (94.6%) | 59 (5.4%) |
| 45 to 54 Years | 972 (92.6%) | 78 (7.4%) |
| 55 to 64 Years | 1,316 (94.3%) | 79 (5.7%) |
| 65 to 74 Years | 1,083 (100.0%) | 0 (0.0%) |
| 75 Years and older | 1,083 (99.8%) | 2 (0.2%) |
| Total | 9,083 (94.1%) | 565 (5.9%) |
Health Insurance Coverage by Citizenship Status in Swift County

| Citizenship Status | With Coverage | Without Coverage |
| Native Born | 626 (95.7%) | 28 (4.3%) |
| Foreign Born, Citizen | 1,642 (97.6%) | 40 (2.4%) |
| Foreign Born, not a Citizen | 621 (85.8%) | 103 (14.2%) |
Health Insurance Coverage by Household Income in Swift County

| Household Income | With Coverage | Without Coverage |
| Under $25,000 | 1,032 (87.8%) | 144 (12.2%) |
| $25,000 to $49,999 | 1,870 (95.8%) | 83 (4.3%) |
| $50,000 to $74,999 | 1,702 (92.7%) | 133 (7.2%) |
| $75,000 to $99,999 | 1,147 (94.6%) | 66 (5.4%) |
| $100,000 and over | 3,278 (95.9%) | 139 (4.1%) |
Public vs Private Health Insurance Coverage by Age in Swift County

| Age Bracket | Public Insurance | Private Insurance |
| Under 6 | 384 (58.7%) | 262 (40.1%) |
| 6 to 18 Years | 912 (54.2%) | 980 (58.3%) |
| 19 to 25 Years | 174 (24.0%) | 449 (62.0%) |
| 25 to 34 Years | 143 (16.2%) | 593 (67.2%) |
| 35 to 44 Years | 255 (23.4%) | 849 (77.7%) |
| 45 to 54 Years | 176 (16.8%) | 822 (78.3%) |
| 55 to 64 Years | 218 (15.6%) | 1,136 (81.4%) |
| 65 to 74 Years | 1,046 (96.6%) | 706 (65.2%) |
| 75 Years and over | 1,078 (99.4%) | 798 (73.6%) |
| Total | 4,386 (45.5%) | 6,595 (68.4%) |
Disability Status by Sex by Age in Swift County

| Age Bracket | Male | Female |
| Under 5 Years | 0 (0.0%) | 1 (0.4%) |
| 5 to 17 Years | 61 (6.5%) | 55 (7.4%) |
| 18 to 34 Years | 159 (17.9%) | 118 (14.6%) |
| 35 to 64 Years | 278 (14.8%) | 116 (7.0%) |
| 65 to 74 Years | 166 (29.0%) | 144 (28.2%) |
| 75 Years and over | 189 (46.6%) | 314 (46.2%) |
Disability Class by Sex by Age in Swift County
Disability Class: Hearing Difficulty
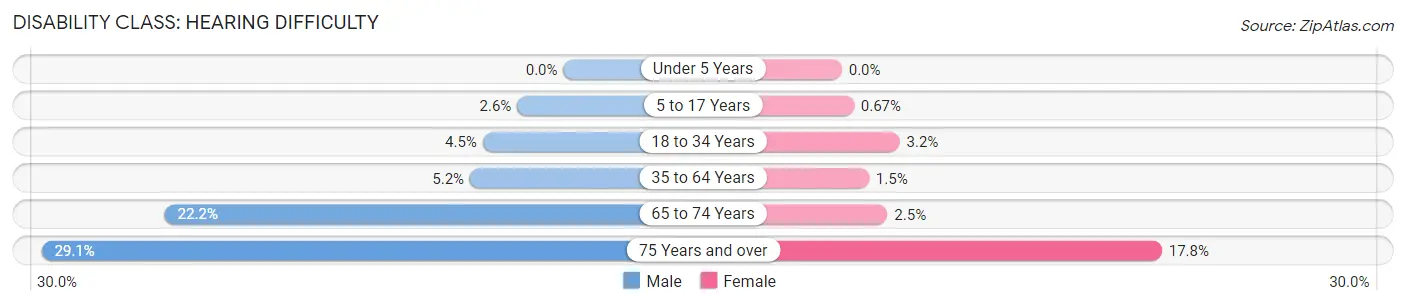
| Age Bracket | Male | Female |
| Under 5 Years | 0 (0.0%) | 0 (0.0%) |
| 5 to 17 Years | 24 (2.6%) | 5 (0.7%) |
| 18 to 34 Years | 40 (4.5%) | 26 (3.2%) |
| 35 to 64 Years | 98 (5.2%) | 25 (1.5%) |
| 65 to 74 Years | 127 (22.2%) | 13 (2.5%) |
| 75 Years and over | 118 (29.1%) | 121 (17.8%) |
Disability Class: Vision Difficulty

| Age Bracket | Male | Female |
| Under 5 Years | 0 (0.0%) | 1 (0.4%) |
| 5 to 17 Years | 0 (0.0%) | 16 (2.1%) |
| 18 to 34 Years | 34 (3.8%) | 1 (0.1%) |
| 35 to 64 Years | 72 (3.8%) | 7 (0.4%) |
| 65 to 74 Years | 2 (0.4%) | 15 (2.9%) |
| 75 Years and over | 38 (9.4%) | 91 (13.4%) |
Disability Class: Cognitive Difficulty

| Age Bracket | Male | Female |
| 5 to 17 Years | 39 (4.2%) | 50 (6.7%) |
| 18 to 34 Years | 142 (16.0%) | 59 (7.3%) |
| 35 to 64 Years | 173 (9.2%) | 19 (1.1%) |
| 65 to 74 Years | 4 (0.7%) | 10 (2.0%) |
| 75 Years and over | 50 (12.3%) | 48 (7.1%) |
Disability Class: Ambulatory Difficulty

| Age Bracket | Male | Female |
| 5 to 17 Years | 2 (0.2%) | 0 (0.0%) |
| 18 to 34 Years | 16 (1.8%) | 34 (4.2%) |
| 35 to 64 Years | 159 (8.4%) | 77 (4.7%) |
| 65 to 74 Years | 40 (7.0%) | 128 (25.1%) |
| 75 Years and over | 104 (25.6%) | 255 (37.6%) |
Disability Class: Self-Care Difficulty

| Age Bracket | Male | Female |
| 5 to 17 Years | 6 (0.6%) | 0 (0.0%) |
| 18 to 34 Years | 11 (1.2%) | 6 (0.7%) |
| 35 to 64 Years | 40 (2.1%) | 16 (1.0%) |
| 65 to 74 Years | 10 (1.8%) | 34 (6.7%) |
| 75 Years and over | 31 (7.6%) | 84 (12.4%) |
Technology Access in Swift County
Computing Device Access in Swift County

| Device Type | # Households | % Households |
| Desktop or Laptop | 3,021 | 72.7% |
| Smartphone | 3,256 | 78.4% |
| Tablet | 2,413 | 58.1% |
| No Computing Device | 526 | 12.7% |
| Total | 4,154 | 100.0% |
Internet Access in Swift County

| Internet Type | # Households | % Households |
| Dial-Up Internet | 4 | 0.1% |
| Broadband Home | 2,683 | 64.6% |
| Cellular Data Only | 457 | 11.0% |
| Satellite Internet | 297 | 7.1% |
| No Internet | 830 | 20.0% |
| Total | 4,154 | 100.0% |
Swift County Summary
Swift County, Minnesota is located in the west-central part of the state, and is bordered by Chippewa County to the north, Kandiyohi County to the east, Meeker County to the south, and Big Stone County to the west. The county seat is Benson, and the county has a total area of 576 square miles. As of the 2010 census, the population was 9,783.
History
Swift County was established in 1862 and was named after Henry Adoniram Swift, a Minnesota politician and Civil War veteran. The county was originally part of Stearns County, and was organized in 1864. The first settlers arrived in the area in the late 1850s, and the county was officially organized in 1864.
The first county seat was located in the town of Appleton, but it was moved to Benson in 1872. The county was largely agricultural, and the main crops were wheat, oats, and barley. The county also had a thriving dairy industry, and the first creamery was established in 1872.
Geography
Swift County is located in the west-central part of Minnesota, and is bordered by Chippewa County to the north, Kandiyohi County to the east, Meeker County to the south, and Big Stone County to the west. The county has a total area of 576 square miles, and is mostly flat with some rolling hills. The highest point in the county is located in the town of Appleton, and is 1,068 feet above sea level.
The county is drained by the Chippewa River, which flows through the county from north to south. The county also contains several small lakes, including Lake Benson, Lake Lillian, and Lake Florida.
Economy
Agriculture is the main economic driver in Swift County, and the main crops are wheat, oats, and barley. The county also has a thriving dairy industry, and the first creamery was established in 1872.
The county also has a strong manufacturing sector, with several companies located in the county. The largest employer in the county is the Swift County-Benson Hospital, which employs over 500 people. Other major employers include the Swift County-Benson Public Schools, the Swift County-Benson Nursing Home, and the Swift County-Benson Medical Center.
Demographics
As of the 2010 census, there were 9,783 people, 3,845 households, and 2,541 families living in the county. The population density was 17.1 people per square mile. The racial makeup of the county was 97.2% White, 0.4% African American, 0.3% Native American, 0.3% Asian, 0.1% Pacific Islander, 0.7% from other races, and 0.9% from two or more races. Hispanic or Latino of any race were 1.7% of the population.
The median income for a household in the county was $45,945, and the median income for a family was $54,945. The per capita income for the county was $21,945. About 8.2% of families and 11.2% of the population were below the poverty line, including 14.2% of those under age 18 and 8.2% of those age 65 or over.
Common Questions
What is the Total Population of Swift County?
Total Population of Swift County is 9,806.
What is the Total Male Population of Swift County?
Total Male Population of Swift County is 5,031.
What is the Total Female Population of Swift County?
Total Female Population of Swift County is 4,775.
What is the Ratio of Males per 100 Females in Swift County?
There are 105.36 Males per 100 Females in Swift County.
What is the Ratio of Females per 100 Males in Swift County?
There are 94.91 Females per 100 Males in Swift County.
What is the Median Population Age in Swift County?
Median Population Age in Swift County is 43.8 Years.
What is the Average Family Size in Swift County
Average Family Size in Swift County is 2.9 People.
What is the Average Household Size in Swift County
Average Household Size in Swift County is 2.3 People.
What is Per Capita Income in Swift County?
Per Capita income in Swift County is $35,595.
What is the Median Family Income in Swift County?
Median Family Income in Swift County is $76,050.
What is the Median Household income in Swift County?
Median Household Income in Swift County is $58,362.
What is Income or Wage Gap in Swift County?
Income or Wage Gap in Swift County is 40.9%.
Women in Swift County earn 59.1 cents for every dollar earned by a man.
What is Family Income Deficit in Swift County?
Family Income Deficit in Swift County is $9,544.
Families that are below poverty line in Swift County earn $9,544 less on average than the poverty threshold level.
What is Inequality or Gini Index in Swift County?
Inequality or Gini Index in Swift County is 0.46.
How Large is the Labor Force in Swift County?
There are 4,849 People in the Labor Forcein in Swift County.
What is the Percentage of People in the Labor Force in Swift County?
61.8% of People are in the Labor Force in Swift County.
What is the Unemployment Rate in Swift County?
Unemployment Rate in Swift County is 3.7%.