Stevens County, MN
Stevens County Map

Stevens County Overview
9,682
TOTAL POPULATION
4,977
MALE POPULATION
4,705
FEMALE POPULATION
105.78
MALES / 100 FEMALES
94.53
FEMALES / 100 MALES
33.8
MEDIAN AGE
3.1
AVG FAMILY SIZE
2.4
AVG HOUSEHOLD SIZE
$38,425
PER CAPITA INCOME
$95,129
AVG FAMILY INCOME
$69,737
AVG HOUSEHOLD INCOME
52.1%
WAGE / INCOME GAP [ % ]
47.9¢/ $1
WAGE / INCOME GAP [ $ ]
$14,065
FAMILY INCOME DEFICIT
0.48
INEQUALITY / GINI INDEX
5,213
LABOR FORCE [ PEOPLE ]
66.9%
PERCENT IN LABOR FORCE
1.4%
UNEMPLOYMENT RATE
Stevens County Area Codes
Race in Stevens County
The most populous races in Stevens County are White / Caucasian (8,346 | 86.2%), Hispanic or Latino (768 | 7.9%), and Two or more Races (493 | 5.1%).

| Race | # Population | % Population |
| Asian | 103 | 1.1% |
| Black / African American | 179 | 1.8% |
| Hawaiian / Pacific | 39 | 0.4% |
| Hispanic or Latino | 768 | 7.9% |
| Native / Alaskan | 158 | 1.6% |
| White / Caucasian | 8,346 | 86.2% |
| Two or more Races | 493 | 5.1% |
| Some other Race | 364 | 3.8% |
| Total | 9,682 | 100.0% |
Ancestry in Stevens County
The most populous ancestries reported in Stevens County are German (4,024 | 41.6%), Norwegian (2,028 | 20.9%), Irish (797 | 8.2%), Mexican (594 | 6.1%), and Swedish (511 | 5.3%), together accounting for 82.2% of all Stevens County residents.

| Ancestry | # Population | % Population |
| Alsatian | 1 | 0.0% |
| American | 293 | 3.0% |
| Apache | 1 | 0.0% |
| Arab | 6 | 0.1% |
| Austrian | 10 | 0.1% |
| Bangladeshi | 54 | 0.6% |
| Belgian | 9 | 0.1% |
| Bhutanese | 2 | 0.0% |
| Blackfeet | 15 | 0.2% |
| Brazilian | 2 | 0.0% |
| British | 7 | 0.1% |
| Cajun | 8 | 0.1% |
| Canadian | 7 | 0.1% |
| Central American | 39 | 0.4% |
| Central American Indian | 10 | 0.1% |
| Chippewa | 135 | 1.4% |
| Colombian | 51 | 0.5% |
| Costa Rican | 3 | 0.0% |
| Cree | 7 | 0.1% |
| Creek | 45 | 0.5% |
| Cuban | 17 | 0.2% |
| Czech | 78 | 0.8% |
| Danish | 104 | 1.1% |
| Dutch | 152 | 1.6% |
| Eastern European | 1 | 0.0% |
| English | 492 | 5.1% |
| Ethiopian | 57 | 0.6% |
| European | 116 | 1.2% |
| Finnish | 40 | 0.4% |
| French | 244 | 2.5% |
| French American Indian | 8 | 0.1% |
| French Canadian | 11 | 0.1% |
| German | 4,024 | 41.6% |
| Greek | 21 | 0.2% |
| Guamanian / Chamorro | 21 | 0.2% |
| Guatemalan | 24 | 0.3% |
| Haitian | 5 | 0.1% |
| Hungarian | 1 | 0.0% |
| Indian (Asian) | 36 | 0.4% |
| Indonesian | 11 | 0.1% |
| Irish | 797 | 8.2% |
| Italian | 75 | 0.8% |
| Jamaican | 2 | 0.0% |
| Jordanian | 2 | 0.0% |
| Korean | 6 | 0.1% |
| Lebanese | 3 | 0.0% |
| Liberian | 2 | 0.0% |
| Lithuanian | 1 | 0.0% |
| Luxembourger | 7 | 0.1% |
| Malaysian | 1 | 0.0% |
| Menominee | 2 | 0.0% |
| Mexican | 594 | 6.1% |
| Mexican American Indian | 3 | 0.0% |
| Mongolian | 1 | 0.0% |
| Native Hawaiian | 9 | 0.1% |
| Nicaraguan | 12 | 0.1% |
| Northern European | 54 | 0.6% |
| Norwegian | 2,028 | 20.9% |
| Polish | 223 | 2.3% |
| Pueblo | 1 | 0.0% |
| Puerto Rican | 36 | 0.4% |
| Russian | 66 | 0.7% |
| Scandinavian | 153 | 1.6% |
| Scotch-Irish | 17 | 0.2% |
| Scottish | 136 | 1.4% |
| Serbian | 7 | 0.1% |
| Sioux | 29 | 0.3% |
| Slovak | 2 | 0.0% |
| Slovene | 21 | 0.2% |
| South American | 60 | 0.6% |
| Spaniard | 5 | 0.1% |
| Spanish | 1 | 0.0% |
| Sri Lankan | 3 | 0.0% |
| Subsaharan African | 59 | 0.6% |
| Swedish | 511 | 5.3% |
| Swiss | 201 | 2.1% |
| Syrian | 1 | 0.0% |
| Turkish | 21 | 0.2% |
| Venezuelan | 9 | 0.1% |
| Welsh | 12 | 0.1% | View All 80 Rows |
Immigrants in Stevens County
The most numerous immigrant groups reported in Stevens County came from Latin America (340 | 3.5%), Central America (313 | 3.2%), Mexico (275 | 2.8%), Asia (84 | 0.9%), and South Eastern Asia (49 | 0.5%), together accounting for 11.0% of all Stevens County residents.

| Immigration Origin | # Population | % Population |
| Africa | 20 | 0.2% |
| Asia | 84 | 0.9% |
| Brazil | 2 | 0.0% |
| Canada | 4 | 0.0% |
| Caribbean | 4 | 0.0% |
| Central America | 313 | 3.2% |
| China | 10 | 0.1% |
| Colombia | 12 | 0.1% |
| Costa Rica | 3 | 0.0% |
| Eastern Africa | 18 | 0.2% |
| Eastern Asia | 12 | 0.1% |
| Eastern Europe | 4 | 0.0% |
| England | 1 | 0.0% |
| Ethiopia | 18 | 0.2% |
| Europe | 16 | 0.2% |
| Germany | 1 | 0.0% |
| Guatemala | 23 | 0.2% |
| Haiti | 2 | 0.0% |
| Jamaica | 2 | 0.0% |
| Japan | 2 | 0.0% |
| Jordan | 2 | 0.0% |
| Laos | 36 | 0.4% |
| Latin America | 340 | 3.5% |
| Liberia | 2 | 0.0% |
| Mexico | 275 | 2.8% |
| Nicaragua | 12 | 0.1% |
| Northern Europe | 11 | 0.1% |
| Norway | 9 | 0.1% |
| Philippines | 2 | 0.0% |
| Romania | 2 | 0.0% |
| Russia | 2 | 0.0% |
| South America | 23 | 0.2% |
| South Eastern Asia | 49 | 0.5% |
| Sweden | 1 | 0.0% |
| Thailand | 11 | 0.1% |
| Turkey | 21 | 0.2% |
| Venezuela | 9 | 0.1% |
| Western Africa | 2 | 0.0% |
| Western Asia | 23 | 0.2% |
| Western Europe | 1 | 0.0% | View All 40 Rows |
Sex and Age in Stevens County
Sex and Age in Stevens County
The most populous age groups in Stevens County are 20 to 24 Years (580 | 11.7%) for men and 20 to 24 Years (593 | 12.6%) for women.

| Age Bracket | Male | Female |
| Under 5 Years | 314 (6.3%) | 263 (5.6%) |
| 5 to 9 Years | 244 (4.9%) | 262 (5.6%) |
| 10 to 14 Years | 359 (7.2%) | 311 (6.6%) |
| 15 to 19 Years | 507 (10.2%) | 465 (9.9%) |
| 20 to 24 Years | 580 (11.7%) | 593 (12.6%) |
| 25 to 29 Years | 296 (5.9%) | 247 (5.2%) |
| 30 to 34 Years | 285 (5.7%) | 240 (5.1%) |
| 35 to 39 Years | 264 (5.3%) | 231 (4.9%) |
| 40 to 44 Years | 398 (8.0%) | 243 (5.2%) |
| 45 to 49 Years | 206 (4.1%) | 189 (4.0%) |
| 50 to 54 Years | 219 (4.4%) | 220 (4.7%) |
| 55 to 59 Years | 260 (5.2%) | 215 (4.6%) |
| 60 to 64 Years | 276 (5.6%) | 320 (6.8%) |
| 65 to 69 Years | 264 (5.3%) | 248 (5.3%) |
| 70 to 74 Years | 175 (3.5%) | 192 (4.1%) |
| 75 to 79 Years | 138 (2.8%) | 138 (2.9%) |
| 80 to 84 Years | 122 (2.5%) | 147 (3.1%) |
| 85 Years and over | 70 (1.4%) | 181 (3.8%) |
| Total | 4,977 (100.0%) | 4,705 (100.0%) |
Families and Households in Stevens County
Median Family Size in Stevens County
The median family size in Stevens County is 3.14 persons per family, with single female/mother families (226 | 10.0%) accounting for the largest median family size of 3.28 persons per family. On the other hand, single male/father families (91 | 4.0%) represent the smallest median family size with 2.81 persons per family.

| Family Type | # Families | Family Size |
| Married-Couple | 1,938 (85.9%) | 3.14 |
| Single Male/Father | 91 (4.0%) | 2.81 |
| Single Female/Mother | 226 (10.0%) | 3.28 |
| Total Families | 2,255 (100.0%) | 3.14 |
Median Household Size in Stevens County
The median household size in Stevens County is 2.44 persons per household, with single female/mother households (226 | 5.9%) accounting for the largest median household size of 3.56 persons per household. non-family households (1,543 | 40.6%) represent the smallest median household size with 1.34 persons per household.

| Household Type | # Households | Household Size |
| Married-Couple | 1,938 (51.0%) | 3.15 |
| Single Male/Father | 91 (2.4%) | 3.09 |
| Single Female/Mother | 226 (5.9%) | 3.56 |
| Non-family | 1,543 (40.6%) | 1.34 |
| Total Households | 3,798 (100.0%) | 2.44 |
Household Size by Marriage Status in Stevens County
Out of a total of 3,798 households in Stevens County, 2,255 (59.4%) are family households, while 1,543 (40.6%) are nonfamily households. The most numerous type of family households are 2-person households, comprising 1,084, and the most common type of nonfamily households are 1-person households, comprising 1,162.

| Household Size | Family Households | Nonfamily Households |
| 1-Person Households | - | 1,162 (30.6%) |
| 2-Person Households | 1,084 (28.5%) | 264 (7.0%) |
| 3-Person Households | 362 (9.5%) | 41 (1.1%) |
| 4-Person Households | 405 (10.7%) | 43 (1.1%) |
| 5-Person Households | 291 (7.7%) | 2 (0.1%) |
| 6-Person Households | 42 (1.1%) | 18 (0.5%) |
| 7+ Person Households | 71 (1.9%) | 13 (0.3%) |
| Total | 2,255 (59.4%) | 1,543 (40.6%) |
Female Fertility in Stevens County
Fertility by Age in Stevens County
Average fertility rate in Stevens County is 82.0 births per 1,000 women. Women in the age bracket of 20 to 34 years have the highest fertility rate with 124.0 births per 1,000 women. Women in the age bracket of 20 to 34 years acount for 72.4% of all women with births.

| Age Bracket | Women with Births | Births / 1,000 Women |
| 15 to 19 years | 0 (0.0%) | 0.0 |
| 20 to 34 years | 134 (72.4%) | 124.0 |
| 35 to 50 years | 51 (27.6%) | 73.0 |
| Total | 185 (100.0%) | 82.0 |
Fertility by Age by Marriage Status in Stevens County
93.0% of women with births (185) in Stevens County are married. The highest percentage of unmarried women with births falls into 20 to 34 years age bracket with 9.7% of them unmarried at the time of birth, while the lowest percentage of unmarried women with births belong to 35 to 50 years age bracket with 0.0% of them unmarried.

| Age Bracket | Married | Unmarried |
| 15 to 19 years | 0 (0.0%) | 0 (0.0%) |
| 20 to 34 years | 121 (90.3%) | 13 (9.7%) |
| 35 to 50 years | 51 (100.0%) | 0 (0.0%) |
| Total | 172 (93.0%) | 13 (7.0%) |
Fertility by Education in Stevens County
Average fertility rate in Stevens County is 82.0 births per 1,000 women. Women with the education attainment of bachelor's degree have the highest fertility rate of 110.0 births per 1,000 women, while women with the education attainment of less than high school have the lowest fertility at 16.0 births per 1,000 women. Women with the education attainment of college or associate's degree represent 53.0% of all women with births.

| Educational Attainment | Women with Births | Births / 1,000 Women |
| Less than High School | 4 (2.2%) | 16.0 |
| High School Diploma | 8 (4.3%) | 29.0 |
| College or Associate's Degree | 98 (53.0%) | 94.0 |
| Bachelor's Degree | 64 (34.6%) | 110.0 |
| Graduate Degree | 11 (5.9%) | 107.0 |
| Total | 185 (100.0%) | 82.0 |
Fertility by Education by Marriage Status in Stevens County
7.0% of women with births in Stevens County are unmarried. Women with the educational attainment of less than high school are most likely to be married with 100.0% of them married at childbirth, while women with the educational attainment of high school diploma are least likely to be married with 12.5% of them unmarried at childbirth.

| Educational Attainment | Married | Unmarried |
| Less than High School | 4 (100.0%) | 0 (0.0%) |
| High School Diploma | 7 (87.5%) | 1 (12.5%) |
| College or Associate's Degree | 86 (87.8%) | 12 (12.2%) |
| Bachelor's Degree | 64 (100.0%) | 0 (0.0%) |
| Graduate Degree | 11 (100.0%) | 0 (0.0%) |
| Total | 172 (93.0%) | 13 (7.0%) |
Income in Stevens County
Income Overview in Stevens County
Per Capita Income in Stevens County is $38,425, while median incomes of families and households are $95,129 and $69,737 respectively.
| Characteristic | Number | Measure |
| Per Capita Income | 9,682 | $38,425 |
| Median Family Income | 2,255 | $95,129 |
| Mean Family Income | 2,255 | $125,659 |
| Median Household Income | 3,798 | $69,737 |
| Mean Household Income | 3,798 | $97,998 |
| Income Deficit | 2,255 | $14,065 |
| Wage / Income Gap (%) | 9,682 | 52.07% |
| Wage / Income Gap ($) | 9,682 | 47.93¢ per $1 |
| Gini / Inequality Index | 9,682 | 0.48 |
Earnings by Sex in Stevens County
Average Earnings in Stevens County are $35,486, $46,233 for men and $22,161 for women, a difference of 52.1%.

| Sex | Number | Average Earnings |
| Male | 3,183 (55.1%) | $46,233 |
| Female | 2,592 (44.9%) | $22,161 |
| Total | 5,775 (100.0%) | $35,486 |
Earnings by Sex by Income Bracket in Stevens County
The most common earnings brackets in Stevens County are $100,000+ for men (433 | 13.6%) and $2,499 or less for women (250 | 9.7%).

| Income | Male | Female |
| $2,499 or less | 117 (3.7%) | 250 (9.7%) |
| $2,500 to $4,999 | 115 (3.6%) | 184 (7.1%) |
| $5,000 to $7,499 | 123 (3.9%) | 211 (8.1%) |
| $7,500 to $9,999 | 122 (3.8%) | 178 (6.9%) |
| $10,000 to $12,499 | 218 (6.9%) | 130 (5.0%) |
| $12,500 to $14,999 | 67 (2.1%) | 136 (5.2%) |
| $15,000 to $17,499 | 86 (2.7%) | 69 (2.7%) |
| $17,500 to $19,999 | 62 (1.9%) | 87 (3.4%) |
| $20,000 to $22,499 | 50 (1.6%) | 59 (2.3%) |
| $22,500 to $24,999 | 84 (2.6%) | 84 (3.2%) |
| $25,000 to $29,999 | 59 (1.8%) | 90 (3.5%) |
| $30,000 to $34,999 | 123 (3.9%) | 159 (6.1%) |
| $35,000 to $39,999 | 112 (3.5%) | 104 (4.0%) |
| $40,000 to $44,999 | 144 (4.5%) | 109 (4.2%) |
| $45,000 to $49,999 | 319 (10.0%) | 124 (4.8%) |
| $50,000 to $54,999 | 141 (4.4%) | 135 (5.2%) |
| $55,000 to $64,999 | 242 (7.6%) | 179 (6.9%) |
| $65,000 to $74,999 | 182 (5.7%) | 73 (2.8%) |
| $75,000 to $99,999 | 384 (12.1%) | 148 (5.7%) |
| $100,000+ | 433 (13.6%) | 83 (3.2%) |
| Total | 3,183 (100.0%) | 2,592 (100.0%) |
Earnings by Sex by Educational Attainment in Stevens County
Average earnings in Stevens County are $56,824 for men and $35,616 for women, a difference of 37.3%. Men with an educational attainment of graduate degree enjoy the highest average annual earnings of $82,500, while those with less than high school education earn the least with $47,907. Women with an educational attainment of graduate degree earn the most with the average annual earnings of $63,958, while those with less than high school education have the smallest earnings of $12,292.

| Educational Attainment | Male Income | Female Income |
| Less than High School | $47,907 | $12,292 |
| High School Diploma | $48,333 | $28,906 |
| College or Associate's Degree | $62,045 | $32,250 |
| Bachelor's Degree | $70,227 | $45,347 |
| Graduate Degree | $82,500 | $63,958 |
| Total | $56,824 | $35,616 |
Family Income in Stevens County
Family Income Brackets in Stevens County
According to the Stevens County family income data, there are 503 families falling into the $75,000 to $99,999 income range, which is the most common income bracket and makes up 22.3% of all families. Conversely, the $10,000 to $14,999 income bracket is the least frequent group with only 20 families (0.9%) belonging to this category.

| Income Bracket | # Families | % Families |
| Less than $10,000 | 61 | 2.7% |
| $10,000 to $14,999 | 20 | 0.9% |
| $15,000 to $24,999 | 41 | 1.8% |
| $25,000 to $34,999 | 97 | 4.3% |
| $35,000 to $49,999 | 169 | 7.5% |
| $50,000 to $74,999 | 347 | 15.4% |
| $75,000 to $99,999 | 503 | 22.3% |
| $100,000 to $149,999 | 496 | 22.0% |
| $150,000 to $199,999 | 244 | 10.8% |
| $200,000+ | 280 | 12.4% |
Family Income by Famaliy Size in Stevens County
6-person families (38 | 1.7%) account for the highest median family income in Stevens County with $150,000 per family, while 2-person families (1,102 | 48.9%) have the highest median income of $45,416 per family member.

| Income Bracket | # Families | Median Income |
| 2-Person Families | 1,102 (48.9%) | $90,833 |
| 3-Person Families | 388 (17.2%) | $106,667 |
| 4-Person Families | 380 (16.9%) | $94,306 |
| 5-Person Families | 276 (12.2%) | $84,808 |
| 6-Person Families | 38 (1.7%) | $150,000 |
| 7+ Person Families | 71 (3.2%) | $83,125 |
| Total | 2,255 (100.0%) | $95,129 |
Family Income by Number of Earners in Stevens County
The median family income in Stevens County is $95,129, with families comprising 3+ earners (206) having the highest median family income of $129,545, while families with no earners (278) have the lowest median family income of $65,536, accounting for 9.1% and 12.3% of families, respectively.
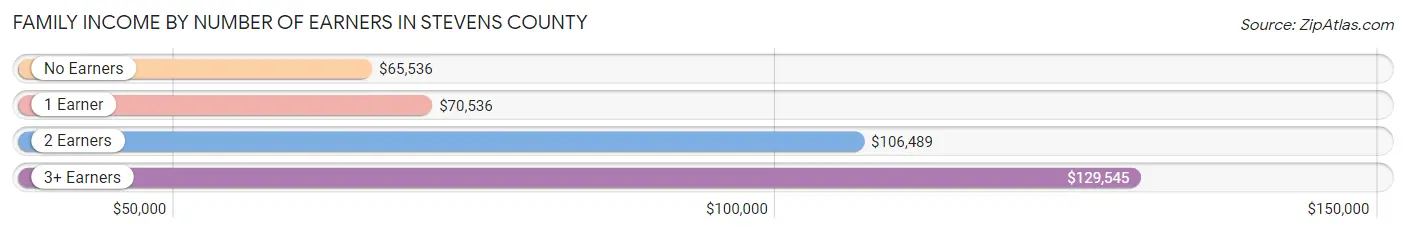
| Number of Earners | # Families | Median Income |
| No Earners | 278 (12.3%) | $65,536 |
| 1 Earner | 587 (26.0%) | $70,536 |
| 2 Earners | 1,184 (52.5%) | $106,489 |
| 3+ Earners | 206 (9.1%) | $129,545 |
| Total | 2,255 (100.0%) | $95,129 |
Household Income in Stevens County
Household Income Brackets in Stevens County
With 646 households falling in the category, the $75,000 to $99,999 income range is the most frequent in Stevens County, accounting for 17.0% of all households. In contrast, only 163 households (4.3%) fall into the $10,000 to $14,999 income bracket, making it the least populous group.

| Income Bracket | # Households | % Households |
| Less than $10,000 | 182 | 4.8% |
| $10,000 to $14,999 | 163 | 4.3% |
| $15,000 to $24,999 | 273 | 7.2% |
| $25,000 to $34,999 | 285 | 7.5% |
| $35,000 to $49,999 | 467 | 12.3% |
| $50,000 to $74,999 | 600 | 15.8% |
| $75,000 to $99,999 | 646 | 17.0% |
| $100,000 to $149,999 | 611 | 16.1% |
| $150,000 to $199,999 | 262 | 6.9% |
| $200,000+ | 311 | 8.2% |
Household Income by Householder Age in Stevens County
The median household income in Stevens County is $69,737, with the highest median household income of $89,583 found in the 25 to 44 years age bracket for the primary householder. A total of 1,126 households (29.6%) fall into this category. Meanwhile, the 15 to 24 years age bracket for the primary householder has the lowest median household income of $36,667, with 522 households (13.7%) in this group.

| Income Bracket | # Households | Median Income |
| 15 to 24 Years | 522 (13.7%) | $36,667 |
| 25 to 44 Years | 1,126 (29.6%) | $89,583 |
| 45 to 64 Years | 1,147 (30.2%) | $89,554 |
| 65+ Years | 1,003 (26.4%) | $57,135 |
| Total | 3,798 (100.0%) | $69,737 |
Poverty in Stevens County
Income Below Poverty by Sex and Age in Stevens County
With 10.6% poverty level for males and 12.9% for females among the residents of Stevens County, 12 to 14 year old males and 18 to 24 year old females are the most vulnerable to poverty, with 74 males (30.0%) and 273 females (35.4%) in their respective age groups living below the poverty level.

| Age Bracket | Male | Female |
| Under 5 Years | 22 (7.0%) | 24 (9.1%) |
| 5 Years | 0 (0.0%) | 2 (2.9%) |
| 6 to 11 Years | 16 (5.1%) | 16 (5.4%) |
| 12 to 14 Years | 74 (30.0%) | 2 (1.0%) |
| 15 Years | 15 (17.9%) | 0 (0.0%) |
| 16 and 17 Years | 1 (0.8%) | 0 (0.0%) |
| 18 to 24 Years | 155 (20.1%) | 273 (35.4%) |
| 25 to 34 Years | 26 (4.5%) | 69 (14.2%) |
| 35 to 44 Years | 77 (11.6%) | 45 (9.5%) |
| 45 to 54 Years | 56 (13.2%) | 32 (7.8%) |
| 55 to 64 Years | 45 (8.4%) | 72 (13.5%) |
| 65 to 74 Years | 2 (0.5%) | 16 (3.7%) |
| 75 Years and over | 24 (7.7%) | 31 (7.5%) |
| Total | 513 (10.6%) | 582 (12.9%) |
Income Above Poverty by Sex and Age in Stevens County
According to the poverty statistics in Stevens County, males aged 5 years and females aged 15 years are the age groups that are most secure financially, with 100.0% of males and 100.0% of females in these age groups living above the poverty line.

| Age Bracket | Male | Female |
| Under 5 Years | 291 (93.0%) | 239 (90.9%) |
| 5 Years | 35 (100.0%) | 67 (97.1%) |
| 6 to 11 Years | 295 (94.9%) | 282 (94.6%) |
| 12 to 14 Years | 173 (70.0%) | 202 (99.0%) |
| 15 Years | 69 (82.1%) | 53 (100.0%) |
| 16 and 17 Years | 124 (99.2%) | 106 (100.0%) |
| 18 to 24 Years | 617 (79.9%) | 499 (64.6%) |
| 25 to 34 Years | 555 (95.5%) | 418 (85.8%) |
| 35 to 44 Years | 585 (88.4%) | 429 (90.5%) |
| 45 to 54 Years | 369 (86.8%) | 377 (92.2%) |
| 55 to 64 Years | 491 (91.6%) | 462 (86.5%) |
| 65 to 74 Years | 433 (99.5%) | 413 (96.3%) |
| 75 Years and over | 287 (92.3%) | 383 (92.5%) |
| Total | 4,324 (89.4%) | 3,930 (87.1%) |
Income Below Poverty Among Married-Couple Families in Stevens County
The poverty statistics for married-couple families in Stevens County show that 3.3% or 63 of the total 1,938 families live below the poverty line. Families with 5 or more children have the highest poverty rate of 11.9%, comprising of 5 families. On the other hand, families with no children have the lowest poverty rate of 1.8%, which includes 20 families.

| Children | Above Poverty | Below Poverty |
| No Children | 1,059 (98.2%) | 20 (1.8%) |
| 1 or 2 Children | 511 (95.2%) | 26 (4.8%) |
| 3 or 4 Children | 268 (95.7%) | 12 (4.3%) |
| 5 or more Children | 37 (88.1%) | 5 (11.9%) |
| Total | 1,875 (96.8%) | 63 (3.3%) |
Income Below Poverty Among Single-Parent Households in Stevens County

| Children | Single Father | Single Mother |
| No Children | 0 (0.0%) | 3 (4.1%) |
| 1 or 2 Children | 0 (0.0%) | 37 (42.0%) |
| 3 or 4 Children | 0 (0.0%) | 7 (10.8%) |
| 5 or more Children | 0 (0.0%) | 0 (0.0%) |
| Total | 0 (0.0%) | 47 (20.8%) |
Income Below Poverty Among Married-Couple vs Single-Parent Households in Stevens County
The poverty data for Stevens County shows that 63 of the married-couple family households (3.3%) and 47 of the single-parent households (14.8%) are living below the poverty level. Within the married-couple family households, those with 5 or more children have the highest poverty rate, with 5 households (11.9%) falling below the poverty line. Among the single-parent households, those with 1 or 2 children have the highest poverty rate, with 37 household (28.7%) living below poverty.

| Children | Married-Couple Families | Single-Parent Households |
| No Children | 20 (1.8%) | 3 (2.5%) |
| 1 or 2 Children | 26 (4.8%) | 37 (28.7%) |
| 3 or 4 Children | 12 (4.3%) | 7 (10.3%) |
| 5 or more Children | 5 (11.9%) | 0 (0.0%) |
| Total | 63 (3.3%) | 47 (14.8%) |
Employment Characteristics in Stevens County
Employment by Class of Employer in Stevens County
Among the 4,965 employed individuals in Stevens County, private company employees (2,857 | 57.5%), not-for-profit organizations (551 | 11.1%), and local government employees (477 | 9.6%) make up the most common classes of employment.

| Employer Class | # Employees | % Employees |
| Private Company Employees | 2,857 | 57.5% |
| Self-Employed (Incorporated) | 247 | 5.0% |
| Self-Employed (Not Incorporated) | 361 | 7.3% |
| Not-for-profit Organizations | 551 | 11.1% |
| Local Government Employees | 477 | 9.6% |
| State Government Employees | 353 | 7.1% |
| Federal Government Employees | 118 | 2.4% |
| Unpaid Family Workers | 1 | 0.0% |
| Total | 4,965 | 100.0% |
Employment Status by Age in Stevens County
According to the labor force statistics for Stevens County, out of the total population over 16 years of age (7,792), 66.9% or 5,213 individuals are in the labor force, with 1.4% or 73 of them unemployed. The age group with the highest labor force participation rate is 30 to 34 years, with 89.3% or 469 individuals in the labor force. Within the labor force, the 16 to 19 years age range has the highest percentage of unemployed individuals, with 4.0% or 17 of them being unemployed.

| Age Bracket | In Labor Force | Unemployed |
| 16 to 19 Years | 428 (51.3%) | 17 (4.0%) |
| 20 to 24 Years | 1,012 (86.3%) | 8 (0.8%) |
| 25 to 29 Years | 474 (87.3%) | 1 (0.2%) |
| 30 to 34 Years | 469 (89.3%) | 17 (3.6%) |
| 35 to 44 Years | 964 (84.9%) | 8 (0.8%) |
| 45 to 54 Years | 648 (77.7%) | 17 (2.6%) |
| 55 to 59 Years | 364 (76.6%) | 2 (0.5%) |
| 60 to 64 Years | 469 (78.7%) | 0 (0.0%) |
| 65 to 74 Years | 314 (35.7%) | 1 (0.3%) |
| 75 Years and over | 69 (8.7%) | 0 (0.0%) |
| Total | 5,213 (66.9%) | 73 (1.4%) |
Employment Status by Educational Attainment in Stevens County
According to labor force statistics for Stevens County, 82.5% of individuals (3,390) out of the total population between 25 and 64 years of age (4,109) are in the labor force, with 1.3% or 44 of them being unemployed. The group with the highest labor force participation rate are those with the educational attainment of bachelor's degree or higher, with 89.3% or 1,156 individuals in the labor force. Within the labor force, individuals with high school diploma education have the highest percentage of unemployment, with 2.3% or 19 of them being unemployed.

| Educational Attainment | In Labor Force | Unemployed |
| Less than High School | 134 (58.0%) | 0 (0.0%) |
| High School Diploma | 837 (78.7%) | 24 (2.3%) |
| College / Associate Degree | 1,262 (83.1%) | 26 (1.7%) |
| Bachelor's Degree or higher | 1,156 (89.3%) | 5 (0.4%) |
| Total | 3,390 (82.5%) | 53 (1.3%) |
Employment Occupations by Sex in Stevens County
Management, Business, Science and Arts Occupations
The most common Management, Business, Science and Arts occupations in Stevens County are Management (621 | 12.1%), Community & Social Service (514 | 10.0%), Education Instruction & Library (353 | 6.9%), Health Diagnosing & Treating (254 | 5.0%), and Computers, Engineering & Science (228 | 4.4%).

Management, Business, Science and Arts Occupations by Sex
Within the Management, Business, Science and Arts occupations in Stevens County, the most male-oriented occupations are Architecture & Engineering (89.7%), Legal Services & Support (88.9%), and Life, Physical & Social Science (83.8%), while the most female-oriented occupations are Arts, Media & Entertainment (94.6%), Health Diagnosing & Treating (89.4%), and Health Technologists (84.8%).

| Occupation | Male | Female |
| Management | 480 (77.3%) | 141 (22.7%) |
| Business & Financial | 64 (52.5%) | 58 (47.5%) |
| Computers, Engineering & Science | 185 (81.1%) | 43 (18.9%) |
| Computers & Mathematics | 32 (60.4%) | 21 (39.6%) |
| Architecture & Engineering | 96 (89.7%) | 11 (10.3%) |
| Life, Physical & Social Science | 57 (83.8%) | 11 (16.2%) |
| Community & Social Service | 175 (34.1%) | 339 (65.9%) |
| Education, Arts & Media | 19 (21.6%) | 69 (78.4%) |
| Legal Services & Support | 32 (88.9%) | 4 (11.1%) |
| Education Instruction & Library | 122 (34.6%) | 231 (65.4%) |
| Arts, Media & Entertainment | 2 (5.4%) | 35 (94.6%) |
| Health Diagnosing & Treating | 27 (10.6%) | 227 (89.4%) |
| Health Technologists | 24 (15.2%) | 134 (84.8%) |
| Total (Category) | 931 (53.5%) | 808 (46.5%) |
| Total (Overall) | 2,827 (55.1%) | 2,307 (44.9%) |
Services Occupations
The most common Services occupations in Stevens County are Food Preparation & Serving (398 | 7.7%), Healthcare Support (239 | 4.7%), Cleaning & Maintenance (162 | 3.2%), Personal Care & Service (113 | 2.2%), and Security & Protection (55 | 1.1%).

Services Occupations by Sex
Within the Services occupations in Stevens County, the most male-oriented occupations are Law Enforcement (100.0%), Security & Protection (98.2%), and Firefighting & Prevention (92.9%), while the most female-oriented occupations are Personal Care & Service (76.1%), Healthcare Support (69.9%), and Food Preparation & Serving (68.1%).

| Occupation | Male | Female |
| Healthcare Support | 72 (30.1%) | 167 (69.9%) |
| Security & Protection | 54 (98.2%) | 1 (1.8%) |
| Firefighting & Prevention | 13 (92.9%) | 1 (7.1%) |
| Law Enforcement | 41 (100.0%) | 0 (0.0%) |
| Food Preparation & Serving | 127 (31.9%) | 271 (68.1%) |
| Cleaning & Maintenance | 99 (61.1%) | 63 (38.9%) |
| Personal Care & Service | 27 (23.9%) | 86 (76.1%) |
| Total (Category) | 379 (39.2%) | 588 (60.8%) |
| Total (Overall) | 2,827 (55.1%) | 2,307 (44.9%) |
Sales and Office Occupations
The most common Sales and Office occupations in Stevens County are Office & Administration (538 | 10.5%), and Sales & Related (444 | 8.6%).

Sales and Office Occupations by Sex

| Occupation | Male | Female |
| Sales & Related | 193 (43.5%) | 251 (56.5%) |
| Office & Administration | 87 (16.2%) | 451 (83.8%) |
| Total (Category) | 280 (28.5%) | 702 (71.5%) |
| Total (Overall) | 2,827 (55.1%) | 2,307 (44.9%) |
Natural Resources, Construction and Maintenance Occupations
The most common Natural Resources, Construction and Maintenance occupations in Stevens County are Farming, Fishing & Forestry (291 | 5.7%), Construction & Extraction (263 | 5.1%), and Installation, Maintenance & Repair (147 | 2.9%).

Natural Resources, Construction and Maintenance Occupations by Sex

| Occupation | Male | Female |
| Farming, Fishing & Forestry | 249 (85.6%) | 42 (14.4%) |
| Construction & Extraction | 263 (100.0%) | 0 (0.0%) |
| Installation, Maintenance & Repair | 147 (100.0%) | 0 (0.0%) |
| Total (Category) | 659 (94.0%) | 42 (6.0%) |
| Total (Overall) | 2,827 (55.1%) | 2,307 (44.9%) |
Production, Transportation and Moving Occupations
The most common Production, Transportation and Moving occupations in Stevens County are Production (340 | 6.6%), Transportation (235 | 4.6%), and Material Moving (170 | 3.3%).

Production, Transportation and Moving Occupations by Sex

| Occupation | Male | Female |
| Production | 258 (75.9%) | 82 (24.1%) |
| Transportation | 191 (81.3%) | 44 (18.7%) |
| Material Moving | 129 (75.9%) | 41 (24.1%) |
| Total (Category) | 578 (77.6%) | 167 (22.4%) |
| Total (Overall) | 2,827 (55.1%) | 2,307 (44.9%) |
Employment Industries by Sex in Stevens County
Employment Industries in Stevens County
The major employment industries in Stevens County include Health Care & Social Assistance (825 | 16.1%), Agriculture, Fishing & Hunting (813 | 15.8%), Educational Services (619 | 12.1%), Manufacturing (602 | 11.7%), and Retail Trade (472 | 9.2%).

Employment Industries by Sex in Stevens County
The Stevens County industries that see more men than women are Construction (97.4%), Mining, Quarrying, & Extraction (83.3%), and Wholesale Trade (82.5%), whereas the industries that tend to have a higher number of women are Information (84.6%), Arts, Entertainment & Recreation (80.0%), and Health Care & Social Assistance (77.3%).

| Industry | Male | Female |
| Agriculture, Fishing & Hunting | 629 (77.4%) | 184 (22.6%) |
| Mining, Quarrying, & Extraction | 10 (83.3%) | 2 (16.7%) |
| Construction | 369 (97.4%) | 10 (2.6%) |
| Manufacturing | 468 (77.7%) | 134 (22.3%) |
| Wholesale Trade | 47 (82.5%) | 10 (17.5%) |
| Retail Trade | 227 (48.1%) | 245 (51.9%) |
| Transportation & Warehousing | 129 (76.8%) | 39 (23.2%) |
| Utilities | 22 (75.9%) | 7 (24.1%) |
| Information | 4 (15.4%) | 22 (84.6%) |
| Finance & Insurance | 37 (28.2%) | 94 (71.8%) |
| Real Estate, Rental & Leasing | 34 (69.4%) | 15 (30.6%) |
| Professional & Scientific | 32 (47.1%) | 36 (52.9%) |
| Enterprise Management | 0 (0.0%) | 0 (0.0%) |
| Administrative & Support | 72 (59.0%) | 50 (41.0%) |
| Educational Services | 237 (38.3%) | 382 (61.7%) |
| Health Care & Social Assistance | 187 (22.7%) | 638 (77.3%) |
| Arts, Entertainment & Recreation | 7 (20.0%) | 28 (80.0%) |
| Accommodation & Food Services | 89 (24.0%) | 281 (75.9%) |
| Public Administration | 133 (59.9%) | 89 (40.1%) |
| Total | 2,827 (55.1%) | 2,307 (44.9%) |
Education in Stevens County
School Enrollment in Stevens County
The most common levels of schooling among the 2,982 students in Stevens County are college / undergraduate (1,157 | 38.8%), high school (545 | 18.3%), and middle school (512 | 17.2%).

| School Level | # Students | % Students |
| Nursery / Preschool | 189 | 6.3% |
| Kindergarten | 108 | 3.6% |
| Elementary School | 423 | 14.2% |
| Middle School | 512 | 17.2% |
| High School | 545 | 18.3% |
| College / Undergraduate | 1,157 | 38.8% |
| Graduate / Professional | 48 | 1.6% |
| Total | 2,982 | 100.0% |
School Enrollment by Age by Funding Source in Stevens County
Out of a total of 2,982 students who are enrolled in schools in Stevens County, 221 (7.4%) attend a private institution, while the remaining 2,761 (92.6%) are enrolled in public schools. The age group of 5 to 9 year old has the highest likelihood of being enrolled in private schools, with 102 (20.5% in the age bracket) enrolled. Conversely, the age group of 18 to 19 year olds has the lowest likelihood of being enrolled in a private school, with 522 (100.0% in the age bracket) attending a public institution.

| Age Bracket | Public School | Private School |
| 3 to 4 Year Olds | 110 (85.9%) | 18 (14.1%) |
| 5 to 9 Year Old | 395 (79.5%) | 102 (20.5%) |
| 10 to 14 Year Olds | 596 (90.3%) | 64 (9.7%) |
| 15 to 17 Year Olds | 348 (98.3%) | 6 (1.7%) |
| 18 to 19 Year Olds | 522 (100.0%) | 0 (0.0%) |
| 20 to 24 Year Olds | 678 (98.4%) | 11 (1.6%) |
| 25 to 34 Year Olds | 59 (83.1%) | 12 (16.9%) |
| 35 Years and over | 53 (86.9%) | 8 (13.1%) |
| Total | 2,761 (92.6%) | 221 (7.4%) |
Educational Attainment by Field of Study in Stevens County
Education (295 | 16.2%), business (236 | 13.0%), science & technology (217 | 11.9%), bio, nature & agricultural (207 | 11.4%), and engineering (156 | 8.6%) are the most common fields of study among 1,823 individuals in Stevens County who have obtained a bachelor's degree or higher.

| Field of Study | # Graduates | % Graduates |
| Computers & Mathematics | 40 | 2.2% |
| Bio, Nature & Agricultural | 207 | 11.4% |
| Physical & Health Sciences | 43 | 2.4% |
| Psychology | 104 | 5.7% |
| Social Sciences | 88 | 4.8% |
| Engineering | 156 | 8.6% |
| Multidisciplinary Studies | 2 | 0.1% |
| Science & Technology | 217 | 11.9% |
| Business | 236 | 13.0% |
| Education | 295 | 16.2% |
| Literature & Languages | 136 | 7.5% |
| Liberal Arts & History | 102 | 5.6% |
| Visual & Performing Arts | 41 | 2.2% |
| Communications | 60 | 3.3% |
| Arts & Humanities | 96 | 5.3% |
| Total | 1,823 | 100.0% |
Transportation & Commute in Stevens County
Vehicle Availability by Sex in Stevens County
The most prevalent vehicle ownership categories in Stevens County are males with 2 vehicles (1,102, accounting for 40.1%) and females with 2 vehicles (738, making up 52.1%).

| Vehicles Available | Male | Female |
| No Vehicle | 63 (2.3%) | 50 (2.4%) |
| 1 Vehicle | 408 (14.8%) | 335 (15.8%) |
| 2 Vehicles | 1,102 (40.1%) | 738 (34.9%) |
| 3 Vehicles | 642 (23.4%) | 562 (26.6%) |
| 4 Vehicles | 248 (9.0%) | 307 (14.5%) |
| 5 or more Vehicles | 284 (10.3%) | 124 (5.9%) |
| Total | 2,747 (100.0%) | 2,116 (100.0%) |
Commute Time in Stevens County
The most frequently occuring commute durations in Stevens County are 5 to 9 minutes (1,364 commuters, 29.4%), 10 to 14 minutes (993 commuters, 21.4%), and less than 5 minutes (789 commuters, 17.0%).

| Commute Time | # Commuters | % Commuters |
| Less than 5 Minutes | 789 | 17.0% |
| 5 to 9 Minutes | 1,364 | 29.4% |
| 10 to 14 Minutes | 993 | 21.4% |
| 15 to 19 Minutes | 532 | 11.5% |
| 20 to 24 Minutes | 437 | 9.4% |
| 25 to 29 Minutes | 71 | 1.5% |
| 30 to 34 Minutes | 163 | 3.5% |
| 35 to 39 Minutes | 21 | 0.4% |
| 40 to 44 Minutes | 62 | 1.3% |
| 45 to 59 Minutes | 37 | 0.8% |
| 60 to 89 Minutes | 112 | 2.4% |
| 90 or more Minutes | 64 | 1.4% |
Commute Time by Sex in Stevens County
The most common commute times in Stevens County are 5 to 9 minutes (804 commuters, 30.5%) for males and 5 to 9 minutes (560 commuters, 27.9%) for females.

| Commute Time | Male | Female |
| Less than 5 Minutes | 455 (17.3%) | 334 (16.6%) |
| 5 to 9 Minutes | 804 (30.5%) | 560 (27.9%) |
| 10 to 14 Minutes | 518 (19.7%) | 475 (23.6%) |
| 15 to 19 Minutes | 257 (9.8%) | 275 (13.7%) |
| 20 to 24 Minutes | 263 (10.0%) | 174 (8.7%) |
| 25 to 29 Minutes | 35 (1.3%) | 36 (1.8%) |
| 30 to 34 Minutes | 119 (4.5%) | 44 (2.2%) |
| 35 to 39 Minutes | 16 (0.6%) | 5 (0.3%) |
| 40 to 44 Minutes | 38 (1.4%) | 24 (1.2%) |
| 45 to 59 Minutes | 24 (0.9%) | 13 (0.6%) |
| 60 to 89 Minutes | 84 (3.2%) | 28 (1.4%) |
| 90 or more Minutes | 23 (0.9%) | 41 (2.0%) |
Time of Departure to Work by Sex in Stevens County
The most frequent times of departure to work in Stevens County are 7:00 AM to 7:29 AM (357, 13.5%) for males and 7:30 AM to 7:59 AM (467, 23.3%) for females.

| Time of Departure | Male | Female |
| 12:00 AM to 4:59 AM | 120 (4.5%) | 43 (2.1%) |
| 5:00 AM to 5:29 AM | 127 (4.8%) | 28 (1.4%) |
| 5:30 AM to 5:59 AM | 345 (13.1%) | 87 (4.3%) |
| 6:00 AM to 6:29 AM | 276 (10.5%) | 59 (2.9%) |
| 6:30 AM to 6:59 AM | 327 (12.4%) | 104 (5.2%) |
| 7:00 AM to 7:29 AM | 357 (13.5%) | 194 (9.7%) |
| 7:30 AM to 7:59 AM | 349 (13.2%) | 467 (23.3%) |
| 8:00 AM to 8:29 AM | 196 (7.4%) | 328 (16.3%) |
| 8:30 AM to 8:59 AM | 118 (4.5%) | 135 (6.7%) |
| 9:00 AM to 9:59 AM | 70 (2.7%) | 80 (4.0%) |
| 10:00 AM to 10:59 AM | 30 (1.1%) | 53 (2.6%) |
| 11:00 AM to 11:59 AM | 17 (0.6%) | 8 (0.4%) |
| 12:00 PM to 3:59 PM | 110 (4.2%) | 227 (11.3%) |
| 4:00 PM to 11:59 PM | 194 (7.4%) | 196 (9.8%) |
| Total | 2,636 (100.0%) | 2,009 (100.0%) |
Housing Occupancy in Stevens County
Occupancy by Ownership in Stevens County
Of the total 3,798 dwellings in Stevens County, owner-occupied units account for 2,575 (67.8%), while renter-occupied units make up 1,223 (32.2%).

| Occupancy | # Housing Units | % Housing Units |
| Owner Occupied Housing Units | 2,575 | 67.8% |
| Renter-Occupied Housing Units | 1,223 | 32.2% |
| Total Occupied Housing Units | 3,798 | 100.0% |
Occupancy by Household Size in Stevens County

| Household Size | # Housing Units | % Housing Units |
| 1-Person Household | 1,162 | 30.6% |
| 2-Person Household | 1,348 | 35.5% |
| 3-Person Household | 403 | 10.6% |
| 4+ Person Household | 885 | 23.3% |
| Total Housing Units | 3,798 | 100.0% |
Occupancy by Ownership by Household Size in Stevens County

| Household Size | Owner-occupied | Renter-occupied |
| 1-Person Household | 593 (51.0%) | 569 (49.0%) |
| 2-Person Household | 1,061 (78.7%) | 287 (21.3%) |
| 3-Person Household | 312 (77.4%) | 91 (22.6%) |
| 4+ Person Household | 609 (68.8%) | 276 (31.2%) |
| Total Housing Units | 2,575 (67.8%) | 1,223 (32.2%) |
Occupancy by Educational Attainment in Stevens County

| Household Size | Owner-occupied | Renter-occupied |
| Less than High School | 81 (44.8%) | 100 (55.2%) |
| High School Diploma | 761 (73.5%) | 274 (26.5%) |
| College/Associate Degree | 940 (65.0%) | 507 (35.0%) |
| Bachelor's Degree or higher | 793 (69.9%) | 342 (30.1%) |
Occupancy by Age of Householder in Stevens County

| Age Bracket | # Households | % Households |
| Under 35 Years | 1,072 | 28.2% |
| 35 to 44 Years | 576 | 15.2% |
| 45 to 54 Years | 489 | 12.9% |
| 55 to 64 Years | 658 | 17.3% |
| 65 to 74 Years | 499 | 13.1% |
| 75 to 84 Years | 326 | 8.6% |
| 85 Years and Over | 178 | 4.7% |
| Total | 3,798 | 100.0% |
Housing Finances in Stevens County
Median Income by Occupancy in Stevens County

| Occupancy Type | # Households | Median Income |
| Owner-Occupied | 2,575 (67.8%) | $88,149 |
| Renter-Occupied | 1,223 (32.2%) | $36,049 |
| Average | 3,798 (100.0%) | $69,737 |
Occupancy by Householder Income Bracket in Stevens County

| Income Bracket | Owner-occupied | Renter-occupied |
| Less than $5,000 | 19 (0.7%) | 20 (1.6%) |
| $5,000 to $9,999 | 10 (0.4%) | 133 (10.9%) |
| $10,000 to $14,999 | 23 (0.9%) | 140 (11.5%) |
| $15,000 to $19,999 | 30 (1.2%) | 99 (8.1%) |
| $20,000 to $24,999 | 50 (1.9%) | 93 (7.6%) |
| $25,000 to $34,999 | 183 (7.1%) | 103 (8.4%) |
| $35,000 to $49,999 | 277 (10.8%) | 190 (15.5%) |
| $50,000 to $74,999 | 394 (15.3%) | 205 (16.8%) |
| $75,000 to $99,999 | 531 (20.6%) | 113 (9.2%) |
| $100,000 to $149,999 | 546 (21.2%) | 64 (5.2%) |
| $150,000 or more | 512 (19.9%) | 63 (5.1%) |
| Total | 2,575 (100.0%) | 1,223 (100.0%) |
Monthly Housing Cost Tiers in Stevens County

| Monthly Cost | Owner-occupied | Renter-occupied |
| Less than $300 | 131 (5.1%) | 112 (9.2%) |
| $300 to $499 | 419 (16.3%) | 173 (14.1%) |
| $500 to $799 | 666 (25.9%) | 252 (20.6%) |
| $800 to $999 | 316 (12.3%) | 287 (23.5%) |
| $1,000 to $1,499 | 539 (20.9%) | 195 (15.9%) |
| $1,500 to $1,999 | 248 (9.6%) | 73 (6.0%) |
| $2,000 to $2,499 | 138 (5.4%) | 19 (1.5%) |
| $2,500 to $2,999 | 75 (2.9%) | 3 (0.3%) |
| $3,000 or more | 43 (1.7%) | 20 (1.6%) |
| Total | 2,575 (100.0%) | 1,223 (100.0%) |
Physical Housing Characteristics in Stevens County
Housing Structures in Stevens County

| Structure Type | # Housing Units | % Housing Units |
| Single Unit, Detached | 2,926 | 77.0% |
| Single Unit, Attached | 112 | 2.9% |
| 2 Unit Apartments | 53 | 1.4% |
| 3 or 4 Unit Apartments | 33 | 0.9% |
| 5 to 9 Unit Apartments | 89 | 2.3% |
| 10 or more Apartments | 481 | 12.7% |
| Mobile Home / Other | 104 | 2.7% |
| Total | 3,798 | 100.0% |
Housing Structures by Occupancy in Stevens County

| Structure Type | Owner-occupied | Renter-occupied |
| Single Unit, Detached | 2,424 (82.8%) | 502 (17.2%) |
| Single Unit, Attached | 48 (42.9%) | 64 (57.1%) |
| 2 Unit Apartments | 17 (32.1%) | 36 (67.9%) |
| 3 or 4 Unit Apartments | 0 (0.0%) | 33 (100.0%) |
| 5 to 9 Unit Apartments | 0 (0.0%) | 89 (100.0%) |
| 10 or more Apartments | 0 (0.0%) | 481 (100.0%) |
| Mobile Home / Other | 86 (82.7%) | 18 (17.3%) |
| Total | 2,575 (67.8%) | 1,223 (32.2%) |
Housing Structures by Number of Rooms in Stevens County

| Number of Rooms | Owner-occupied | Renter-occupied |
| 1 Room | 8 (0.3%) | 43 (3.5%) |
| 2 or 3 Rooms | 68 (2.6%) | 375 (30.7%) |
| 4 or 5 Rooms | 484 (18.8%) | 388 (31.7%) |
| 6 or 7 Rooms | 746 (29.0%) | 232 (19.0%) |
| 8 or more Rooms | 1,269 (49.3%) | 185 (15.1%) |
| Total | 2,575 (100.0%) | 1,223 (100.0%) |
Housing Structure by Heating Type in Stevens County

| Heating Type | Owner-occupied | Renter-occupied |
| Utility Gas | 1,212 (47.1%) | 410 (33.5%) |
| Bottled, Tank, or LP Gas | 792 (30.8%) | 127 (10.4%) |
| Electricity | 338 (13.1%) | 604 (49.4%) |
| Fuel Oil or Kerosene | 106 (4.1%) | 35 (2.9%) |
| Coal or Coke | 0 (0.0%) | 0 (0.0%) |
| All other Fuels | 118 (4.6%) | 44 (3.6%) |
| No Fuel Used | 9 (0.4%) | 3 (0.3%) |
| Total | 2,575 (100.0%) | 1,223 (100.0%) |
Household Vehicle Usage in Stevens County

| Vehicles per Household | Owner-occupied | Renter-occupied |
| No Vehicle | 18 (0.7%) | 146 (11.9%) |
| 1 Vehicle | 551 (21.4%) | 584 (47.7%) |
| 2 Vehicles | 1,212 (47.1%) | 277 (22.7%) |
| 3 or more Vehicles | 794 (30.8%) | 216 (17.7%) |
| Total | 2,575 (100.0%) | 1,223 (100.0%) |
Real Estate & Mortgages in Stevens County
Real Estate and Mortgage Overview in Stevens County
| Characteristic | Without Mortgage | With Mortgage |
| Housing Units | 1,275 | 1,300 |
| Median Property Value | $165,500 | $174,400 |
| Median Household Income | $81,250 | $239 |
| Monthly Housing Costs | $560 | $43 |
| Real Estate Taxes | $1,499 | $24 |
Property Value by Mortgage Status in Stevens County

| Property Value | Without Mortgage | With Mortgage |
| Less than $50,000 | 162 (12.7%) | 91 (7.0%) |
| $50,000 to $99,999 | 206 (16.2%) | 212 (16.3%) |
| $100,000 to $299,999 | 668 (52.4%) | 764 (58.8%) |
| $300,000 to $499,999 | 138 (10.8%) | 178 (13.7%) |
| $500,000 to $749,999 | 80 (6.3%) | 40 (3.1%) |
| $750,000 to $999,999 | 15 (1.2%) | 7 (0.5%) |
| $1,000,000 or more | 6 (0.5%) | 8 (0.6%) |
| Total | 1,275 (100.0%) | 1,300 (100.0%) |
Household Income by Mortgage Status in Stevens County

| Household Income | Without Mortgage | With Mortgage |
| Less than $10,000 | 25 (2.0%) | 1 (0.1%) |
| $10,000 to $24,999 | 84 (6.6%) | 4 (0.3%) |
| $25,000 to $34,999 | 95 (7.4%) | 19 (1.5%) |
| $35,000 to $49,999 | 154 (12.1%) | 88 (6.8%) |
| $50,000 to $74,999 | 224 (17.6%) | 123 (9.5%) |
| $75,000 to $99,999 | 237 (18.6%) | 170 (13.1%) |
| $100,000 to $149,999 | 183 (14.3%) | 294 (22.6%) |
| $150,000 or more | 273 (21.4%) | 363 (27.9%) |
| Total | 1,275 (100.0%) | 1,300 (100.0%) |
Property Value to Household Income Ratio in Stevens County

| Value-to-Income Ratio | Without Mortgage | With Mortgage |
| Less than 2.0x | 695 (54.5%) | 95,385 (7,337.3%) |
| 2.0x to 2.9x | 210 (16.5%) | 742 (57.1%) |
| 3.0x to 3.9x | 118 (9.2%) | 280 (21.5%) |
| 4.0x or more | 243 (19.1%) | 97 (7.5%) |
| Total | 1,275 (100.0%) | 1,300 (100.0%) |
Real Estate Taxes by Mortgage Status in Stevens County

| Property Taxes | Without Mortgage | With Mortgage |
| Less than $800 | 269 (21.1%) | 0 (0.0%) |
| $800 to $1,499 | 352 (27.6%) | 247 (19.0%) |
| $800 to $1,499 | 620 (48.6%) | 400 (30.8%) |
| Total | 1,275 (100.0%) | 1,300 (100.0%) |
Health & Disability in Stevens County
Health Insurance Coverage by Age in Stevens County

| Age Bracket | With Coverage | Without Coverage |
| Under 6 Years | 659 (96.8%) | 22 (3.2%) |
| 6 to 18 Years | 1,762 (94.8%) | 96 (5.2%) |
| 19 to 25 Years | 1,373 (94.2%) | 85 (5.8%) |
| 26 to 34 Years | 938 (97.5%) | 24 (2.5%) |
| 35 to 44 Years | 1,043 (91.8%) | 93 (8.2%) |
| 45 to 54 Years | 745 (89.3%) | 89 (10.7%) |
| 55 to 64 Years | 1,000 (93.5%) | 70 (6.5%) |
| 65 to 74 Years | 864 (100.0%) | 0 (0.0%) |
| 75 Years and older | 725 (100.0%) | 0 (0.0%) |
| Total | 9,109 (95.0%) | 479 (5.0%) |
Health Insurance Coverage by Citizenship Status in Stevens County

| Citizenship Status | With Coverage | Without Coverage |
| Native Born | 659 (96.8%) | 22 (3.2%) |
| Foreign Born, Citizen | 1,762 (94.8%) | 96 (5.2%) |
| Foreign Born, not a Citizen | 1,373 (94.2%) | 85 (5.8%) |
Health Insurance Coverage by Household Income in Stevens County

| Household Income | With Coverage | Without Coverage |
| Under $25,000 | 861 (96.2%) | 34 (3.8%) |
| $25,000 to $49,999 | 1,282 (94.6%) | 73 (5.4%) |
| $50,000 to $74,999 | 1,235 (96.3%) | 48 (3.7%) |
| $75,000 to $99,999 | 1,690 (98.0%) | 34 (2.0%) |
| $100,000 and over | 3,772 (94.5%) | 221 (5.5%) |
Public vs Private Health Insurance Coverage by Age in Stevens County

| Age Bracket | Public Insurance | Private Insurance |
| Under 6 | 293 (43.0%) | 430 (63.1%) |
| 6 to 18 Years | 408 (22.0%) | 1,439 (77.4%) |
| 19 to 25 Years | 245 (16.8%) | 1,159 (79.5%) |
| 25 to 34 Years | 200 (20.8%) | 780 (81.1%) |
| 35 to 44 Years | 227 (20.0%) | 844 (74.3%) |
| 45 to 54 Years | 153 (18.3%) | 638 (76.5%) |
| 55 to 64 Years | 196 (18.3%) | 837 (78.2%) |
| 65 to 74 Years | 790 (91.4%) | 588 (68.1%) |
| 75 Years and over | 723 (99.7%) | 559 (77.1%) |
| Total | 3,235 (33.7%) | 7,274 (75.9%) |
Disability Status by Sex by Age in Stevens County

| Age Bracket | Male | Female |
| Under 5 Years | 0 (0.0%) | 0 (0.0%) |
| 5 to 17 Years | 16 (2.0%) | 16 (2.2%) |
| 18 to 34 Years | 118 (8.1%) | 118 (8.5%) |
| 35 to 64 Years | 230 (14.2%) | 141 (10.0%) |
| 65 to 74 Years | 71 (16.3%) | 132 (30.8%) |
| 75 Years and over | 73 (23.5%) | 166 (40.1%) |
Disability Class by Sex by Age in Stevens County
Disability Class: Hearing Difficulty

| Age Bracket | Male | Female |
| Under 5 Years | 0 (0.0%) | 0 (0.0%) |
| 5 to 17 Years | 1 (0.1%) | 2 (0.3%) |
| 18 to 34 Years | 0 (0.0%) | 11 (0.8%) |
| 35 to 64 Years | 58 (3.6%) | 46 (3.3%) |
| 65 to 74 Years | 42 (9.7%) | 21 (4.9%) |
| 75 Years and over | 44 (14.1%) | 54 (13.0%) |
Disability Class: Vision Difficulty

| Age Bracket | Male | Female |
| Under 5 Years | 0 (0.0%) | 0 (0.0%) |
| 5 to 17 Years | 0 (0.0%) | 3 (0.4%) |
| 18 to 34 Years | 11 (0.8%) | 2 (0.1%) |
| 35 to 64 Years | 13 (0.8%) | 30 (2.1%) |
| 65 to 74 Years | 3 (0.7%) | 7 (1.6%) |
| 75 Years and over | 5 (1.6%) | 15 (3.6%) |
Disability Class: Cognitive Difficulty

| Age Bracket | Male | Female |
| 5 to 17 Years | 15 (1.8%) | 11 (1.5%) |
| 18 to 34 Years | 112 (7.7%) | 97 (7.0%) |
| 35 to 64 Years | 93 (5.7%) | 78 (5.5%) |
| 65 to 74 Years | 23 (5.3%) | 22 (5.1%) |
| 75 Years and over | 7 (2.2%) | 66 (15.9%) |
Disability Class: Ambulatory Difficulty

| Age Bracket | Male | Female |
| 5 to 17 Years | 0 (0.0%) | 3 (0.4%) |
| 18 to 34 Years | 11 (0.8%) | 6 (0.4%) |
| 35 to 64 Years | 129 (8.0%) | 105 (7.4%) |
| 65 to 74 Years | 20 (4.6%) | 102 (23.8%) |
| 75 Years and over | 33 (10.6%) | 74 (17.9%) |
Disability Class: Self-Care Difficulty

| Age Bracket | Male | Female |
| 5 to 17 Years | 1 (0.1%) | 13 (1.8%) |
| 18 to 34 Years | 12 (0.8%) | 8 (0.6%) |
| 35 to 64 Years | 65 (4.0%) | 56 (4.0%) |
| 65 to 74 Years | 15 (3.5%) | 15 (3.5%) |
| 75 Years and over | 9 (2.9%) | 6 (1.5%) |
Technology Access in Stevens County
Computing Device Access in Stevens County

| Device Type | # Households | % Households |
| Desktop or Laptop | 2,859 | 75.3% |
| Smartphone | 3,285 | 86.5% |
| Tablet | 2,368 | 62.4% |
| No Computing Device | 220 | 5.8% |
| Total | 3,798 | 100.0% |
Internet Access in Stevens County

| Internet Type | # Households | % Households |
| Dial-Up Internet | 6 | 0.2% |
| Broadband Home | 2,811 | 74.0% |
| Cellular Data Only | 430 | 11.3% |
| Satellite Internet | 241 | 6.4% |
| No Internet | 416 | 11.0% |
| Total | 3,798 | 100.0% |
Stevens County Summary
Stevens County is located in the west-central part of Minnesota, and is bordered by Grant, Douglas, Pope, Stearns, Todd, and Traverse counties. It is part of the Central Minnesota region and is the second-largest county in the state. The county seat is Morris, and the largest city is Hancock.
Geography
Stevens County covers an area of 1,093 square miles, of which 1,082 square miles is land and 11 square miles is water. The county is located in the Central Minnesota region and is bordered by Grant, Douglas, Pope, Stearns, Todd, and Traverse counties. The terrain is mostly rolling hills and prairies, with some wooded areas. The highest point in the county is the summit of Big Stone Hill, which is 1,068 feet above sea level. The county is drained by the Chippewa River, which flows through the center of the county.
The county is home to several state parks, including Big Stone Lake State Park, Glacial Lakes State Park, and Sibley State Park. There are also several wildlife management areas, including the Big Stone National Wildlife Refuge, the Glacial Lakes Wildlife Management Area, and the Sibley Wildlife Management Area.
History
The area that is now Stevens County was first settled by European-Americans in the mid-1800s. The county was officially organized in 1862 and was named after Isaac Stevens, the first governor of Washington Territory.
The county was initially an agricultural area, with the main crops being wheat, oats, and barley. In the late 1800s, the county began to develop its timber industry, and by the early 1900s, it was one of the largest producers of lumber in the state.
The county also developed a strong manufacturing sector in the early 1900s, with several factories producing furniture, clothing, and other goods. The county also had a thriving dairy industry, with several creameries producing butter and cheese.
Economy
The economy of Stevens County is largely based on agriculture and manufacturing. The county is home to several large farms, which produce a variety of crops, including wheat, oats, barley, corn, soybeans, and hay. The county also has a strong manufacturing sector, with several factories producing furniture, clothing, and other goods.
The county is also home to several large businesses, including the Morris Hospital and Health Care Center, the Morris Manufacturing Company, and the Morris Dairy. The county is also home to several small businesses, including restaurants, retail stores, and service providers.
Demographics
As of the 2010 census, the population of Stevens County was 9,726. The population density was 8.9 people per square mile. The racial makeup of the county was 97.3% White, 0.4% African American, 0.3% Native American, 0.3% Asian, 0.1% Pacific Islander, 0.6% from other races, and 0.9% from two or more races. Hispanic or Latino of any race were 1.7% of the population.
The median income for a household in the county was $45,945, and the median income for a family was $54,945. The per capita income for the county was $21,945. About 8.3% of families and 11.2% of the population were below the poverty line, including 14.2% of those under age 18 and 8.2% of those age 65 or over.
Common Questions
What is the Total Population of Stevens County?
Total Population of Stevens County is 9,682.
What is the Total Male Population of Stevens County?
Total Male Population of Stevens County is 4,977.
What is the Total Female Population of Stevens County?
Total Female Population of Stevens County is 4,705.
What is the Ratio of Males per 100 Females in Stevens County?
There are 105.78 Males per 100 Females in Stevens County.
What is the Ratio of Females per 100 Males in Stevens County?
There are 94.53 Females per 100 Males in Stevens County.
What is the Median Population Age in Stevens County?
Median Population Age in Stevens County is 33.8 Years.
What is the Average Family Size in Stevens County
Average Family Size in Stevens County is 3.1 People.
What is the Average Household Size in Stevens County
Average Household Size in Stevens County is 2.4 People.
What is Per Capita Income in Stevens County?
Per Capita income in Stevens County is $38,425.
What is the Median Family Income in Stevens County?
Median Family Income in Stevens County is $95,129.
What is the Median Household income in Stevens County?
Median Household Income in Stevens County is $69,737.
What is Income or Wage Gap in Stevens County?
Income or Wage Gap in Stevens County is 52.1%.
Women in Stevens County earn 47.9 cents for every dollar earned by a man.
What is Family Income Deficit in Stevens County?
Family Income Deficit in Stevens County is $14,065.
Families that are below poverty line in Stevens County earn $14,065 less on average than the poverty threshold level.
What is Inequality or Gini Index in Stevens County?
Inequality or Gini Index in Stevens County is 0.48.
How Large is the Labor Force in Stevens County?
There are 5,213 People in the Labor Forcein in Stevens County.
What is the Percentage of People in the Labor Force in Stevens County?
66.9% of People are in the Labor Force in Stevens County.
What is the Unemployment Rate in Stevens County?
Unemployment Rate in Stevens County is 1.4%.