Steele County, MN
Steele County Map
Steele County Overview
37,396
TOTAL POPULATION
18,799
MALE POPULATION
18,597
FEMALE POPULATION
101.09
MALES / 100 FEMALES
98.93
FEMALES / 100 MALES
39.9
MEDIAN AGE
3.0
AVG FAMILY SIZE
2.5
AVG HOUSEHOLD SIZE
$40,146
PER CAPITA INCOME
$102,451
AVG FAMILY INCOME
$79,722
AVG HOUSEHOLD INCOME
30.6%
WAGE / INCOME GAP [ % ]
69.4¢/ $1
WAGE / INCOME GAP [ $ ]
$10,451
FAMILY INCOME DEFICIT
0.43
INEQUALITY / GINI INDEX
19,801
LABOR FORCE [ PEOPLE ]
67.8%
PERCENT IN LABOR FORCE
3.4%
UNEMPLOYMENT RATE
Steele County Area Codes
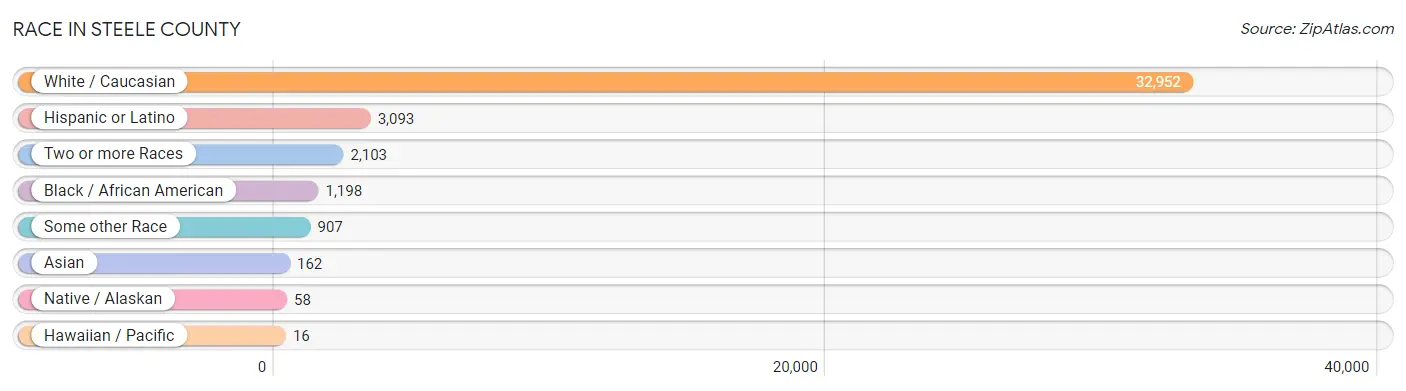
Race in Steele County
The most populous races in Steele County are White / Caucasian (32,952 | 88.1%), Hispanic or Latino (3,093 | 8.3%), and Two or more Races (2,103 | 5.6%).
| Race | # Population | % Population |
| Asian | 162 | 0.4% |
| Black / African American | 1,198 | 3.2% |
| Hawaiian / Pacific | 16 | 0.0% |
| Hispanic or Latino | 3,093 | 8.3% |
| Native / Alaskan | 58 | 0.2% |
| White / Caucasian | 32,952 | 88.1% |
| Two or more Races | 2,103 | 5.6% |
| Some other Race | 907 | 2.4% |
| Total | 37,396 | 100.0% |
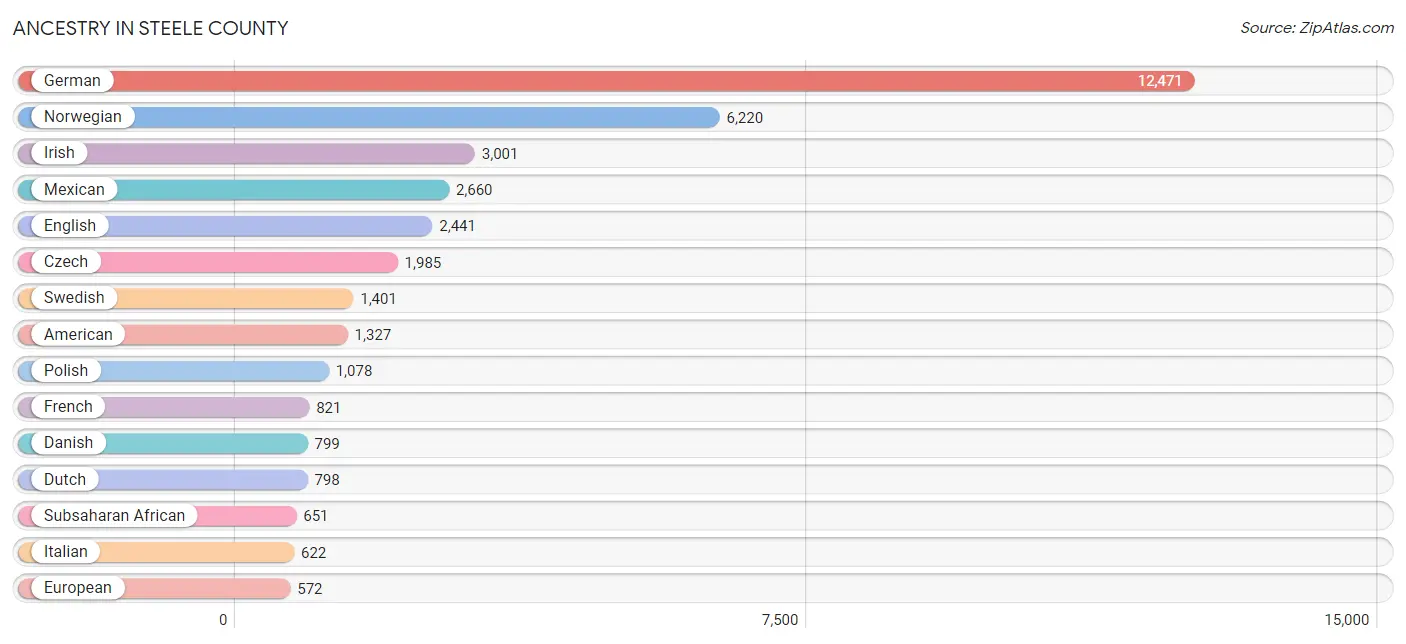
Ancestry in Steele County
The most populous ancestries reported in Steele County are German (12,471 | 33.4%), Norwegian (6,220 | 16.6%), Irish (3,001 | 8.0%), Mexican (2,660 | 7.1%), and English (2,441 | 6.5%), together accounting for 71.6% of all Steele County residents.
| Ancestry | # Population | % Population |
| African | 35 | 0.1% |
| Aleut | 3 | 0.0% |
| American | 1,327 | 3.5% |
| Arab | 148 | 0.4% |
| Austrian | 18 | 0.1% |
| Bangladeshi | 64 | 0.2% |
| Belgian | 22 | 0.1% |
| Bhutanese | 47 | 0.1% |
| Blackfeet | 2 | 0.0% |
| British | 137 | 0.4% |
| Burmese | 91 | 0.2% |
| Canadian | 35 | 0.1% |
| Central American | 143 | 0.4% |
| Cherokee | 2 | 0.0% |
| Chippewa | 53 | 0.1% |
| Colombian | 8 | 0.0% |
| Costa Rican | 14 | 0.0% |
| Croatian | 162 | 0.4% |
| Cuban | 6 | 0.0% |
| Czech | 1,985 | 5.3% |
| Czechoslovakian | 254 | 0.7% |
| Danish | 799 | 2.1% |
| Dutch | 798 | 2.1% |
| Eastern European | 3 | 0.0% |
| Egyptian | 37 | 0.1% |
| English | 2,441 | 6.5% |
| Ethiopian | 194 | 0.5% |
| European | 572 | 1.5% |
| Finnish | 274 | 0.7% |
| French | 821 | 2.2% |
| French Canadian | 151 | 0.4% |
| German | 12,471 | 33.4% |
| Greek | 103 | 0.3% |
| Guatemalan | 67 | 0.2% |
| Haitian | 25 | 0.1% |
| Honduran | 29 | 0.1% |
| Hungarian | 12 | 0.0% |
| Indian (Asian) | 18 | 0.1% |
| Irish | 3,001 | 8.0% |
| Iroquois | 7 | 0.0% |
| Italian | 622 | 1.7% |
| Jamaican | 28 | 0.1% |
| Kenyan | 22 | 0.1% |
| Korean | 170 | 0.4% |
| Lebanese | 29 | 0.1% |
| Liberian | 7 | 0.0% |
| Lithuanian | 12 | 0.0% |
| Luxembourger | 53 | 0.1% |
| Malaysian | 89 | 0.2% |
| Mexican | 2,660 | 7.1% |
| Native Hawaiian | 5 | 0.0% |
| Nicaraguan | 33 | 0.1% |
| Nigerian | 7 | 0.0% |
| Northern European | 166 | 0.4% |
| Norwegian | 6,220 | 16.6% |
| Pakistani | 11 | 0.0% |
| Peruvian | 19 | 0.1% |
| Polish | 1,078 | 2.9% |
| Portuguese | 18 | 0.1% |
| Puerto Rican | 93 | 0.3% |
| Romanian | 19 | 0.1% |
| Russian | 42 | 0.1% |
| Scandinavian | 461 | 1.2% |
| Scotch-Irish | 158 | 0.4% |
| Scottish | 540 | 1.4% |
| Sioux | 12 | 0.0% |
| Slavic | 17 | 0.1% |
| Slovak | 32 | 0.1% |
| Somali | 328 | 0.9% |
| South American | 27 | 0.1% |
| Spaniard | 68 | 0.2% |
| Spanish | 31 | 0.1% |
| Sri Lankan | 14 | 0.0% |
| Subsaharan African | 651 | 1.7% |
| Sudanese | 236 | 0.6% |
| Swedish | 1,401 | 3.7% |
| Swiss | 117 | 0.3% |
| Syrian | 18 | 0.1% |
| Thai | 9 | 0.0% |
| Tongan | 16 | 0.0% |
| Turkish | 5 | 0.0% |
| Ukrainian | 16 | 0.0% |
| Welsh | 216 | 0.6% |
| West Indian | 18 | 0.1% |
| Yugoslavian | 11 | 0.0% | View All 85 Rows |
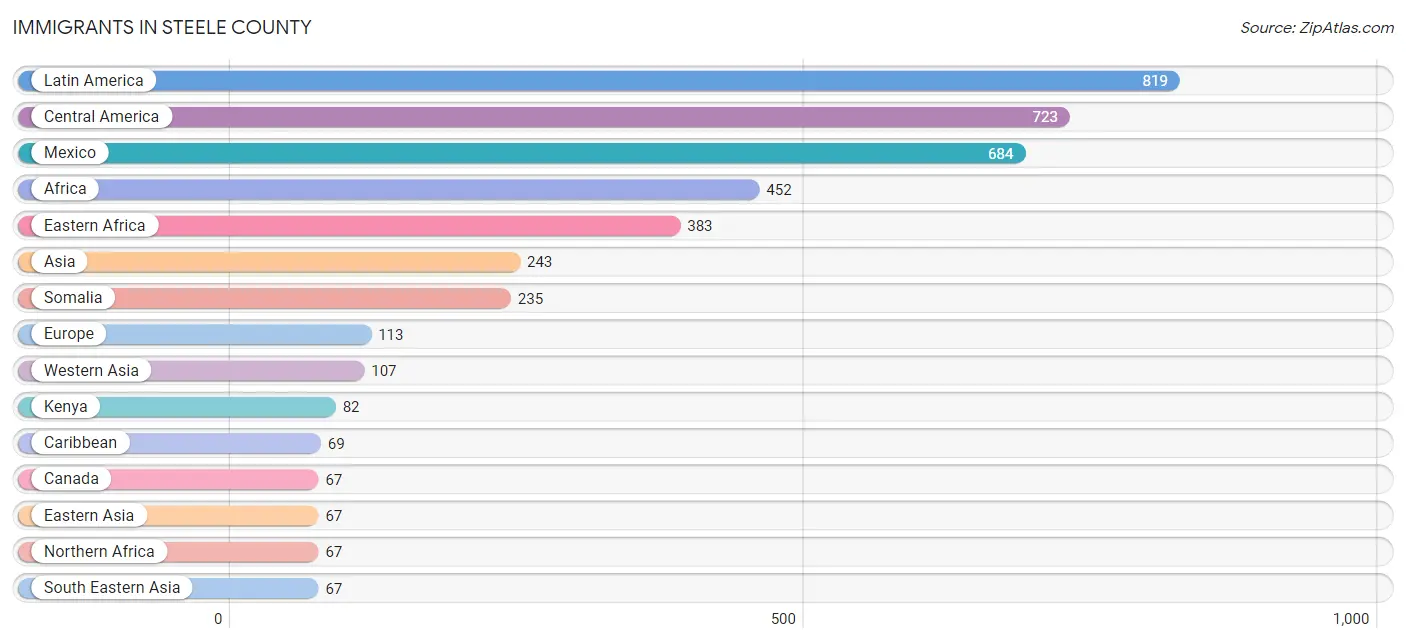
Immigrants in Steele County
The most numerous immigrant groups reported in Steele County came from Latin America (819 | 2.2%), Central America (723 | 1.9%), Mexico (684 | 1.8%), Africa (452 | 1.2%), and Eastern Africa (383 | 1.0%), together accounting for 8.2% of all Steele County residents.
| Immigration Origin | # Population | % Population |
| Africa | 452 | 1.2% |
| Asia | 243 | 0.6% |
| Australia | 14 | 0.0% |
| Bulgaria | 5 | 0.0% |
| Canada | 67 | 0.2% |
| Caribbean | 69 | 0.2% |
| Central America | 723 | 1.9% |
| China | 1 | 0.0% |
| Colombia | 8 | 0.0% |
| Croatia | 18 | 0.1% |
| Dominican Republic | 16 | 0.0% |
| Eastern Africa | 383 | 1.0% |
| Eastern Asia | 67 | 0.2% |
| Eastern Europe | 24 | 0.1% |
| Egypt | 21 | 0.1% |
| England | 3 | 0.0% |
| Ethiopia | 53 | 0.1% |
| Europe | 113 | 0.3% |
| Guatemala | 23 | 0.1% |
| Haiti | 25 | 0.1% |
| Honduras | 2 | 0.0% |
| Jamaica | 28 | 0.1% |
| Kenya | 82 | 0.2% |
| Korea | 66 | 0.2% |
| Laos | 26 | 0.1% |
| Latin America | 819 | 2.2% |
| Mexico | 684 | 1.8% |
| Netherlands | 44 | 0.1% |
| Nicaragua | 14 | 0.0% |
| Nigeria | 2 | 0.0% |
| Northern Africa | 67 | 0.2% |
| Northern Europe | 8 | 0.0% |
| Oceania | 14 | 0.0% |
| Peru | 19 | 0.1% |
| Philippines | 5 | 0.0% |
| Russia | 1 | 0.0% |
| Somalia | 235 | 0.6% |
| South America | 27 | 0.1% |
| South Central Asia | 2 | 0.0% |
| South Eastern Asia | 67 | 0.2% |
| Southern Europe | 37 | 0.1% |
| Spain | 37 | 0.1% |
| Sudan | 46 | 0.1% |
| Sweden | 5 | 0.0% |
| Thailand | 27 | 0.1% |
| Vietnam | 9 | 0.0% |
| Western Africa | 2 | 0.0% |
| Western Asia | 107 | 0.3% |
| Western Europe | 44 | 0.1% | View All 49 Rows |
Sex and Age in Steele County
Sex and Age in Steele County
The most populous age groups in Steele County are 55 to 59 Years (1,544 | 8.2%) for men and 10 to 14 Years (1,521 | 8.2%) for women.
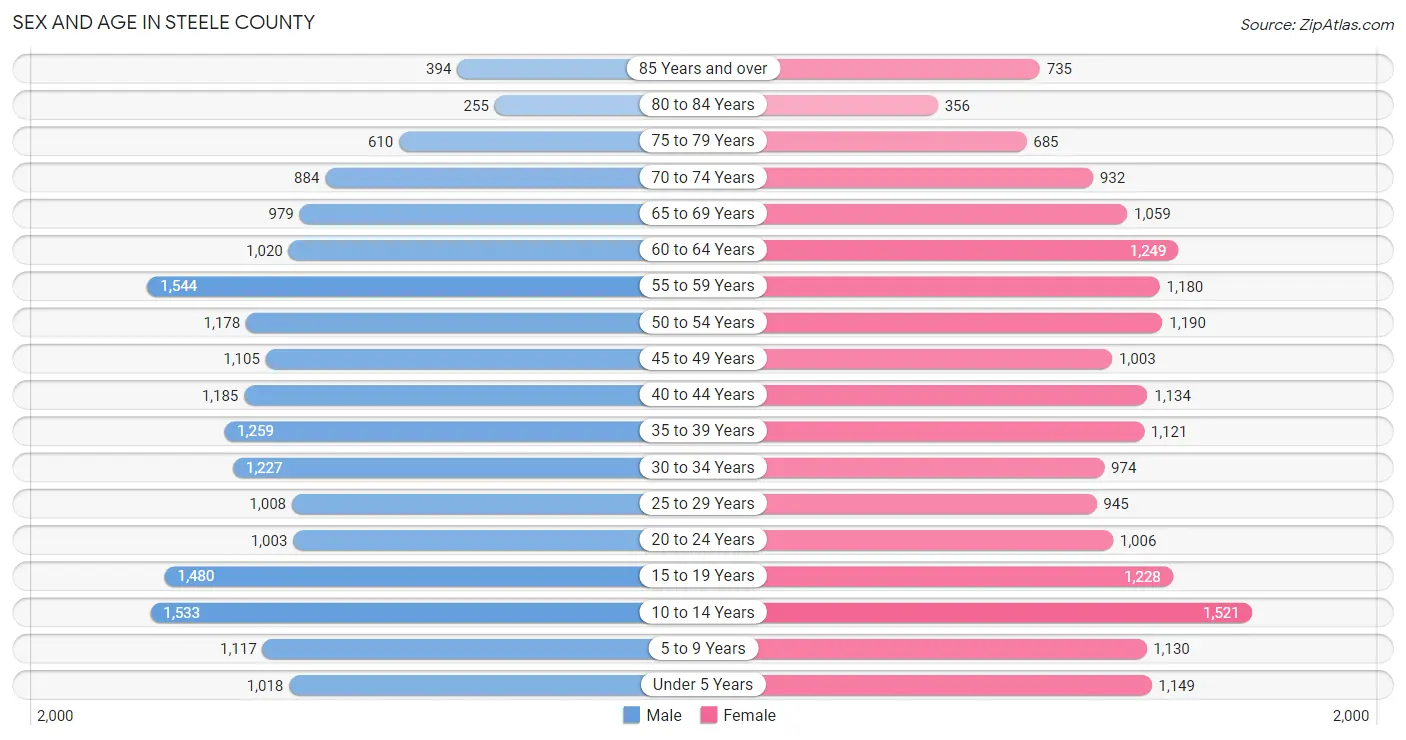
| Age Bracket | Male | Female |
| Under 5 Years | 1,018 (5.4%) | 1,149 (6.2%) |
| 5 to 9 Years | 1,117 (5.9%) | 1,130 (6.1%) |
| 10 to 14 Years | 1,533 (8.2%) | 1,521 (8.2%) |
| 15 to 19 Years | 1,480 (7.9%) | 1,228 (6.6%) |
| 20 to 24 Years | 1,003 (5.3%) | 1,006 (5.4%) |
| 25 to 29 Years | 1,008 (5.4%) | 945 (5.1%) |
| 30 to 34 Years | 1,227 (6.5%) | 974 (5.2%) |
| 35 to 39 Years | 1,259 (6.7%) | 1,121 (6.0%) |
| 40 to 44 Years | 1,185 (6.3%) | 1,134 (6.1%) |
| 45 to 49 Years | 1,105 (5.9%) | 1,003 (5.4%) |
| 50 to 54 Years | 1,178 (6.3%) | 1,190 (6.4%) |
| 55 to 59 Years | 1,544 (8.2%) | 1,180 (6.4%) |
| 60 to 64 Years | 1,020 (5.4%) | 1,249 (6.7%) |
| 65 to 69 Years | 979 (5.2%) | 1,059 (5.7%) |
| 70 to 74 Years | 884 (4.7%) | 932 (5.0%) |
| 75 to 79 Years | 610 (3.2%) | 685 (3.7%) |
| 80 to 84 Years | 255 (1.4%) | 356 (1.9%) |
| 85 Years and over | 394 (2.1%) | 735 (4.0%) |
| Total | 18,799 (100.0%) | 18,597 (100.0%) |
Families and Households in Steele County
Median Family Size in Steele County
The median family size in Steele County is 3.01 persons per family, with single female/mother families (1,303 | 13.3%) accounting for the largest median family size of 3.16 persons per family. On the other hand, single male/father families (466 | 4.7%) represent the smallest median family size with 2.50 persons per family.
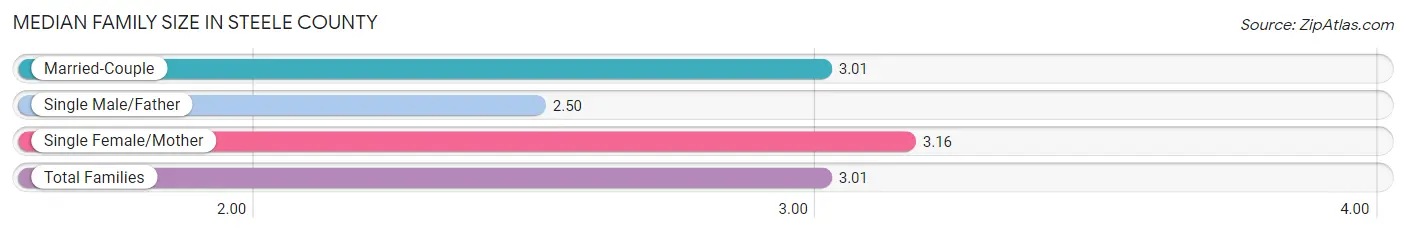
| Family Type | # Families | Family Size |
| Married-Couple | 8,061 (82.0%) | 3.01 |
| Single Male/Father | 466 (4.7%) | 2.50 |
| Single Female/Mother | 1,303 (13.3%) | 3.16 |
| Total Families | 9,830 (100.0%) | 3.01 |
Median Household Size in Steele County
The median household size in Steele County is 2.45 persons per household, with single female/mother households (1,303 | 8.7%) accounting for the largest median household size of 3.48 persons per household. non-family households (5,181 | 34.5%) represent the smallest median household size with 1.21 persons per household.
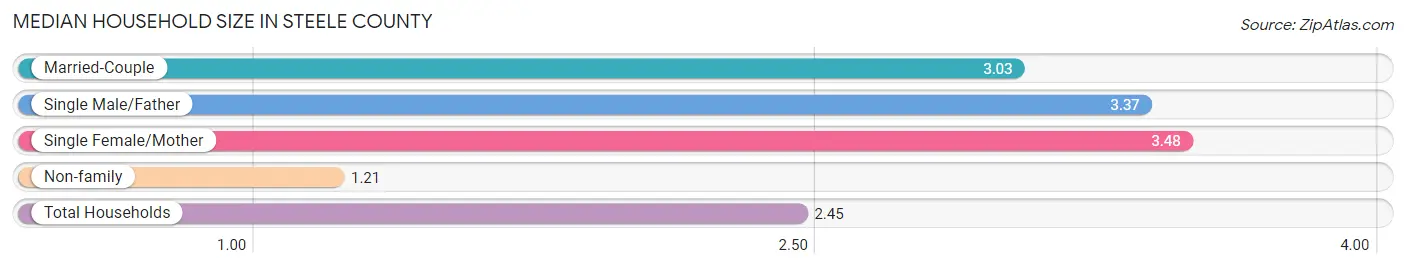
| Household Type | # Households | Household Size |
| Married-Couple | 8,061 (53.7%) | 3.03 |
| Single Male/Father | 466 (3.1%) | 3.37 |
| Single Female/Mother | 1,303 (8.7%) | 3.48 |
| Non-family | 5,181 (34.5%) | 1.21 |
| Total Households | 15,011 (100.0%) | 2.45 |
Household Size by Marriage Status in Steele County
Out of a total of 15,011 households in Steele County, 9,830 (65.5%) are family households, while 5,181 (34.5%) are nonfamily households. The most numerous type of family households are 2-person households, comprising 4,971, and the most common type of nonfamily households are 1-person households, comprising 4,430.
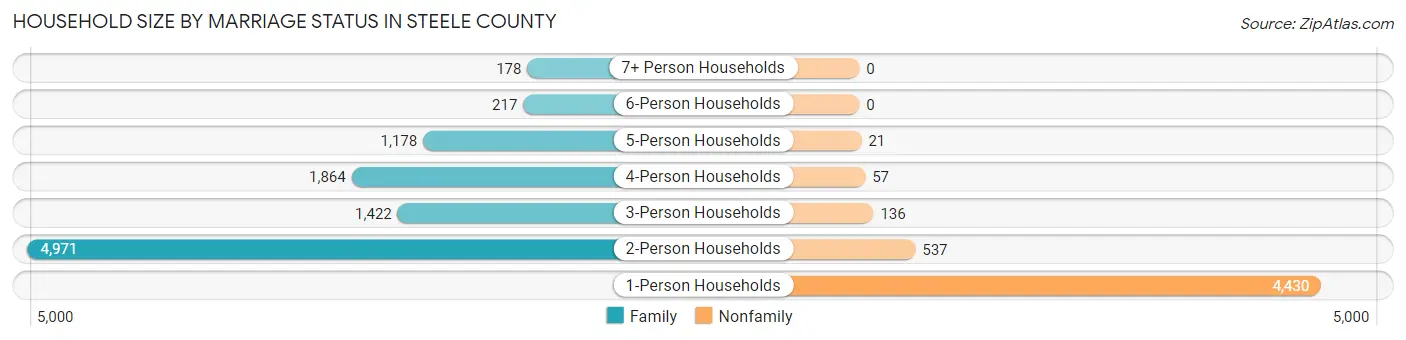
| Household Size | Family Households | Nonfamily Households |
| 1-Person Households | - | 4,430 (29.5%) |
| 2-Person Households | 4,971 (33.1%) | 537 (3.6%) |
| 3-Person Households | 1,422 (9.5%) | 136 (0.9%) |
| 4-Person Households | 1,864 (12.4%) | 57 (0.4%) |
| 5-Person Households | 1,178 (7.9%) | 21 (0.1%) |
| 6-Person Households | 217 (1.5%) | 0 (0.0%) |
| 7+ Person Households | 178 (1.2%) | 0 (0.0%) |
| Total | 9,830 (65.5%) | 5,181 (34.5%) |
Female Fertility in Steele County
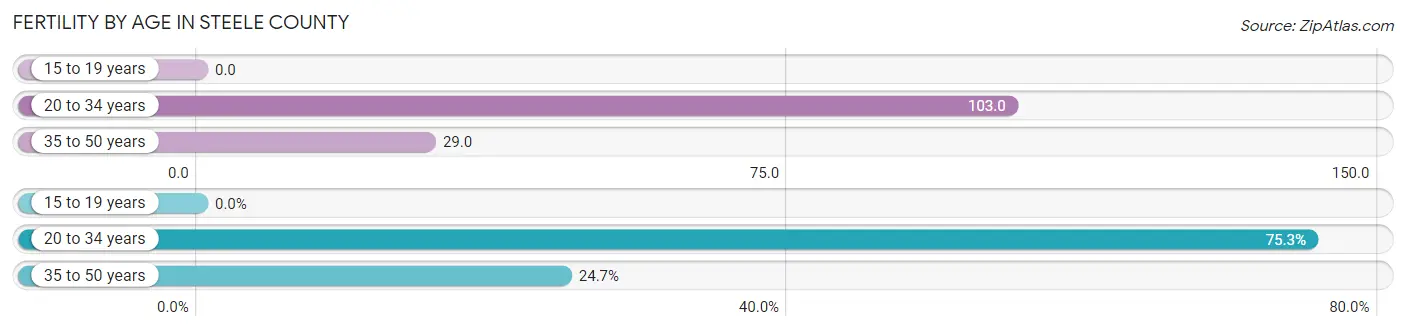
Fertility by Age in Steele County
Average fertility rate in Steele County is 53.0 births per 1,000 women. Women in the age bracket of 20 to 34 years have the highest fertility rate with 103.0 births per 1,000 women. Women in the age bracket of 20 to 34 years acount for 75.3% of all women with births.
| Age Bracket | Women with Births | Births / 1,000 Women |
| 15 to 19 years | 0 (0.0%) | 0.0 |
| 20 to 34 years | 302 (75.3%) | 103.0 |
| 35 to 50 years | 99 (24.7%) | 29.0 |
| Total | 401 (100.0%) | 53.0 |
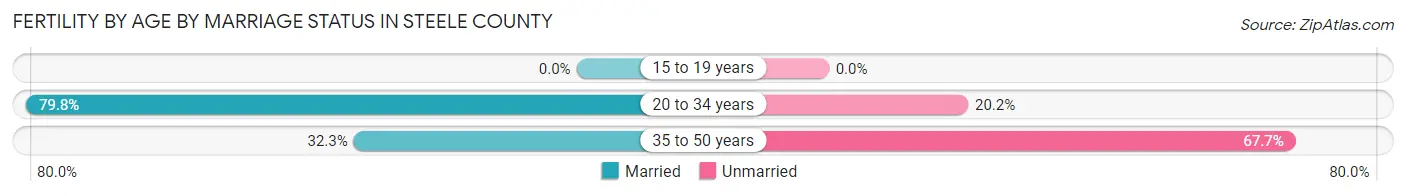
Fertility by Age by Marriage Status in Steele County
68.1% of women with births (401) in Steele County are married. The highest percentage of unmarried women with births falls into 35 to 50 years age bracket with 67.7% of them unmarried at the time of birth, while the lowest percentage of unmarried women with births belong to 20 to 34 years age bracket with 20.2% of them unmarried.
| Age Bracket | Married | Unmarried |
| 15 to 19 years | 0 (0.0%) | 0 (0.0%) |
| 20 to 34 years | 241 (79.8%) | 61 (20.2%) |
| 35 to 50 years | 32 (32.3%) | 67 (67.7%) |
| Total | 273 (68.1%) | 128 (31.9%) |
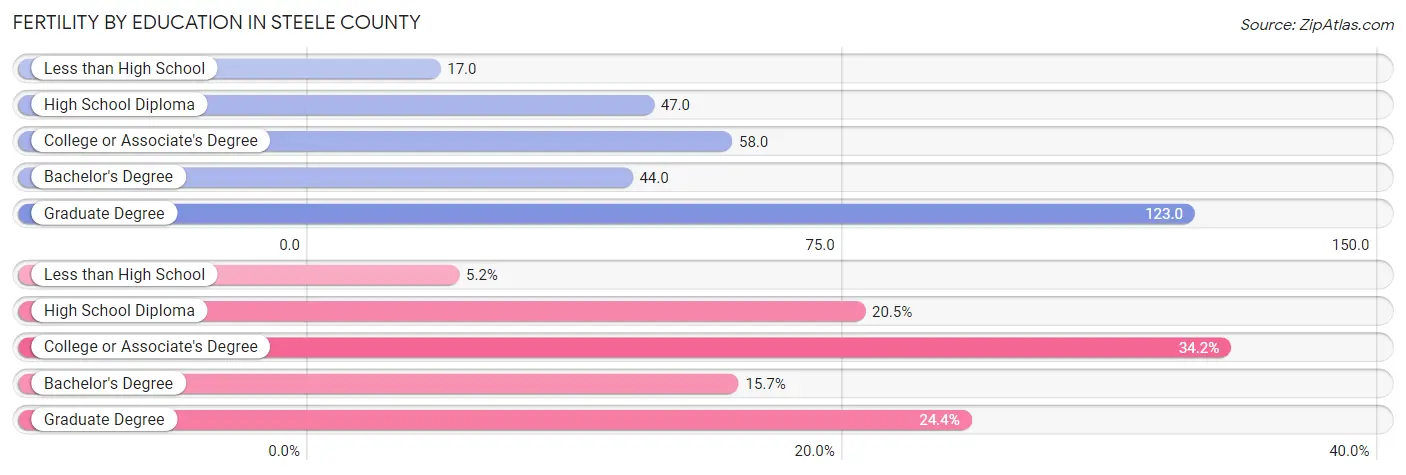
Fertility by Education in Steele County
Average fertility rate in Steele County is 53.0 births per 1,000 women. Women with the education attainment of graduate degree have the highest fertility rate of 123.0 births per 1,000 women, while women with the education attainment of less than high school have the lowest fertility at 17.0 births per 1,000 women. Women with the education attainment of college or associate's degree represent 34.2% of all women with births.
| Educational Attainment | Women with Births | Births / 1,000 Women |
| Less than High School | 21 (5.2%) | 17.0 |
| High School Diploma | 82 (20.4%) | 47.0 |
| College or Associate's Degree | 137 (34.2%) | 58.0 |
| Bachelor's Degree | 63 (15.7%) | 44.0 |
| Graduate Degree | 98 (24.4%) | 123.0 |
| Total | 401 (100.0%) | 53.0 |
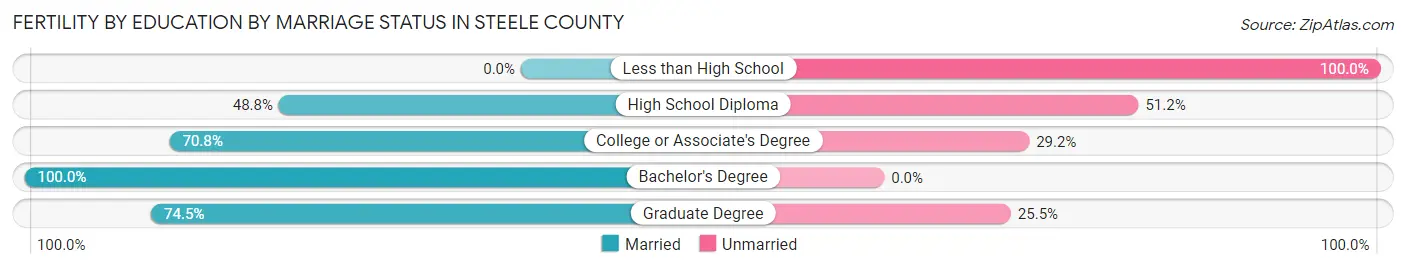
Fertility by Education by Marriage Status in Steele County
31.9% of women with births in Steele County are unmarried. Women with the educational attainment of bachelor's degree are most likely to be married with 100.0% of them married at childbirth, while women with the educational attainment of less than high school are least likely to be married with 100.0% of them unmarried at childbirth.
| Educational Attainment | Married | Unmarried |
| Less than High School | 0 (0.0%) | 21 (100.0%) |
| High School Diploma | 40 (48.8%) | 42 (51.2%) |
| College or Associate's Degree | 97 (70.8%) | 40 (29.2%) |
| Bachelor's Degree | 63 (100.0%) | 0 (0.0%) |
| Graduate Degree | 73 (74.5%) | 25 (25.5%) |
| Total | 273 (68.1%) | 128 (31.9%) |
Income in Steele County
Income Overview in Steele County
Per Capita Income in Steele County is $40,146, while median incomes of families and households are $102,451 and $79,722 respectively.
| Characteristic | Number | Measure |
| Per Capita Income | 37,396 | $40,146 |
| Median Family Income | 9,830 | $102,451 |
| Mean Family Income | 9,830 | $116,228 |
| Median Household Income | 15,011 | $79,722 |
| Mean Household Income | 15,011 | $97,853 |
| Income Deficit | 9,830 | $10,451 |
| Wage / Income Gap (%) | 37,396 | 30.55% |
| Wage / Income Gap ($) | 37,396 | 69.45¢ per $1 |
| Gini / Inequality Index | 37,396 | 0.43 |
Earnings by Sex in Steele County
Average Earnings in Steele County are $46,153, $53,962 for men and $37,475 for women, a difference of 30.5%.
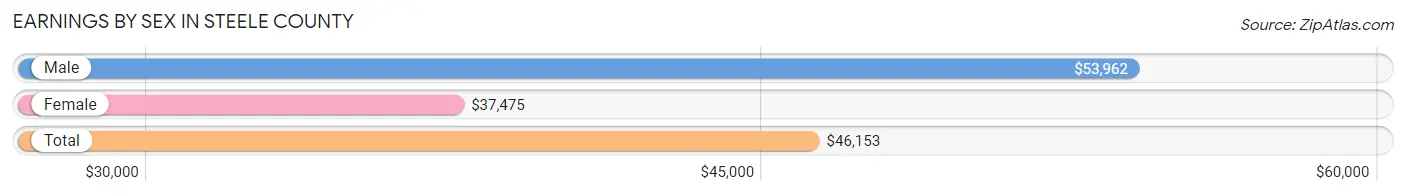
| Sex | Number | Average Earnings |
| Male | 11,368 (54.2%) | $53,962 |
| Female | 9,617 (45.8%) | $37,475 |
| Total | 20,985 (100.0%) | $46,153 |
Earnings by Sex by Income Bracket in Steele County
The most common earnings brackets in Steele County are $75,000 to $99,999 for men (1,816 | 16.0%) and $75,000 to $99,999 for women (839 | 8.7%).
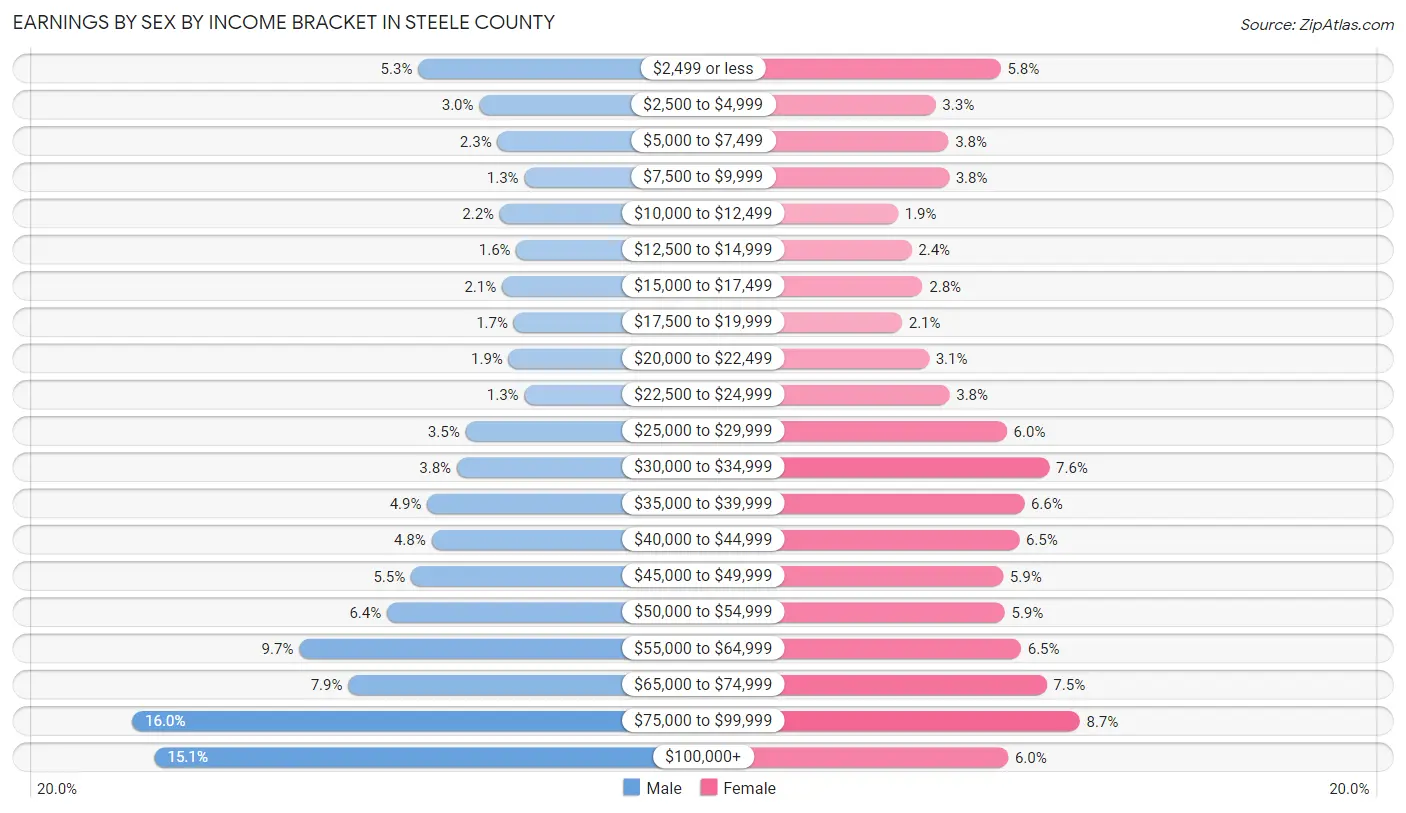
| Income | Male | Female |
| $2,499 or less | 597 (5.2%) | 554 (5.8%) |
| $2,500 to $4,999 | 337 (3.0%) | 319 (3.3%) |
| $5,000 to $7,499 | 259 (2.3%) | 365 (3.8%) |
| $7,500 to $9,999 | 144 (1.3%) | 367 (3.8%) |
| $10,000 to $12,499 | 249 (2.2%) | 184 (1.9%) |
| $12,500 to $14,999 | 178 (1.6%) | 233 (2.4%) |
| $15,000 to $17,499 | 240 (2.1%) | 272 (2.8%) |
| $17,500 to $19,999 | 190 (1.7%) | 198 (2.1%) |
| $20,000 to $22,499 | 211 (1.9%) | 295 (3.1%) |
| $22,500 to $24,999 | 144 (1.3%) | 369 (3.8%) |
| $25,000 to $29,999 | 396 (3.5%) | 576 (6.0%) |
| $30,000 to $34,999 | 432 (3.8%) | 729 (7.6%) |
| $35,000 to $39,999 | 558 (4.9%) | 639 (6.6%) |
| $40,000 to $44,999 | 540 (4.8%) | 620 (6.5%) |
| $45,000 to $49,999 | 628 (5.5%) | 563 (5.9%) |
| $50,000 to $54,999 | 730 (6.4%) | 568 (5.9%) |
| $55,000 to $64,999 | 1,104 (9.7%) | 627 (6.5%) |
| $65,000 to $74,999 | 895 (7.9%) | 719 (7.5%) |
| $75,000 to $99,999 | 1,816 (16.0%) | 839 (8.7%) |
| $100,000+ | 1,720 (15.1%) | 581 (6.0%) |
| Total | 11,368 (100.0%) | 9,617 (100.0%) |
Earnings by Sex by Educational Attainment in Steele County
Average earnings in Steele County are $60,427 for men and $43,645 for women, a difference of 27.8%. Men with an educational attainment of graduate degree enjoy the highest average annual earnings of $81,896, while those with high school diploma education earn the least with $46,808. Women with an educational attainment of graduate degree earn the most with the average annual earnings of $75,949, while those with less than high school education have the smallest earnings of $30,750.
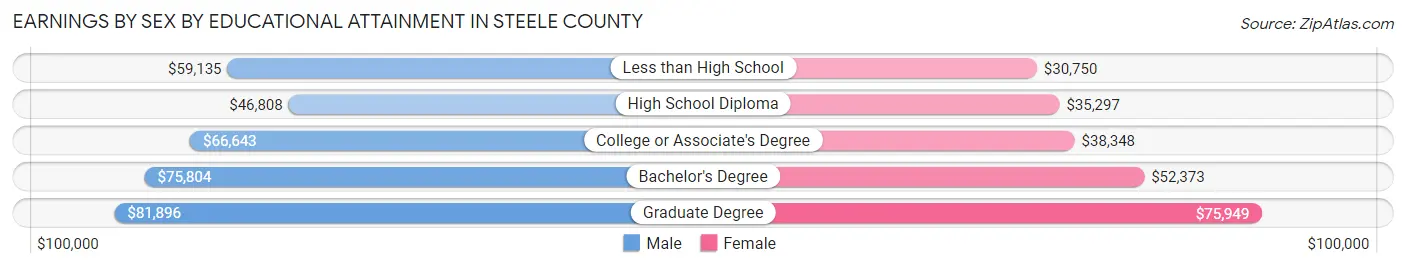
| Educational Attainment | Male Income | Female Income |
| Less than High School | $59,135 | $30,750 |
| High School Diploma | $46,808 | $35,297 |
| College or Associate's Degree | $66,643 | $38,348 |
| Bachelor's Degree | $75,804 | $52,373 |
| Graduate Degree | $81,896 | $75,949 |
| Total | $60,427 | $43,645 |
Family Income in Steele County
Family Income Brackets in Steele County
According to the Steele County family income data, there are 2,664 families falling into the $100,000 to $149,999 income range, which is the most common income bracket and makes up 27.1% of all families. Conversely, the $10,000 to $14,999 income bracket is the least frequent group with only 88 families (0.9%) belonging to this category.
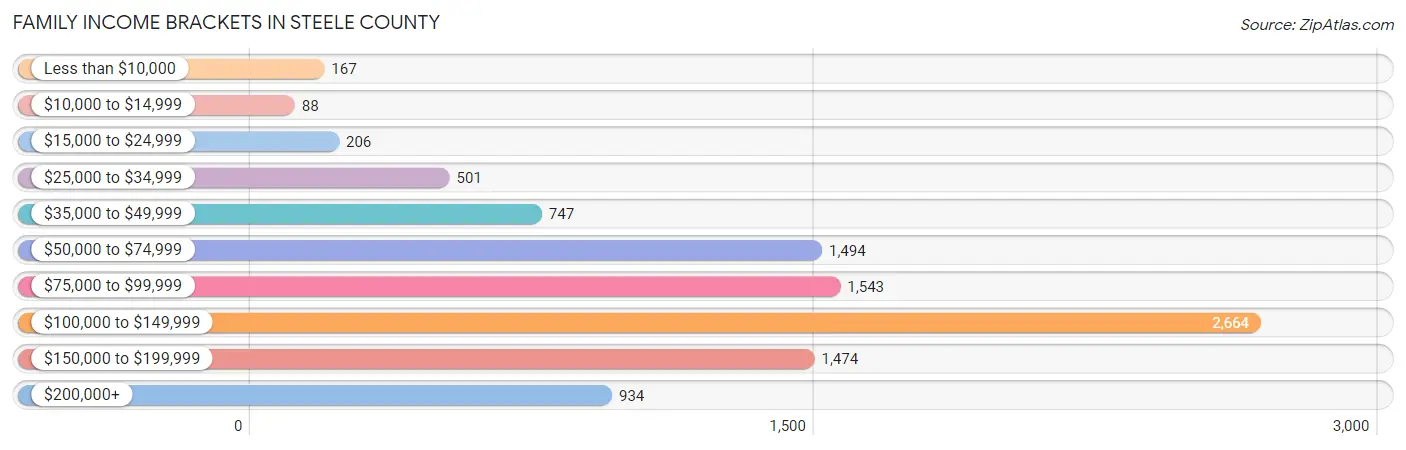
| Income Bracket | # Families | % Families |
| Less than $10,000 | 167 | 1.7% |
| $10,000 to $14,999 | 88 | 0.9% |
| $15,000 to $24,999 | 206 | 2.1% |
| $25,000 to $34,999 | 501 | 5.1% |
| $35,000 to $49,999 | 747 | 7.6% |
| $50,000 to $74,999 | 1,494 | 15.2% |
| $75,000 to $99,999 | 1,543 | 15.7% |
| $100,000 to $149,999 | 2,664 | 27.1% |
| $150,000 to $199,999 | 1,474 | 15.0% |
| $200,000+ | 934 | 9.5% |
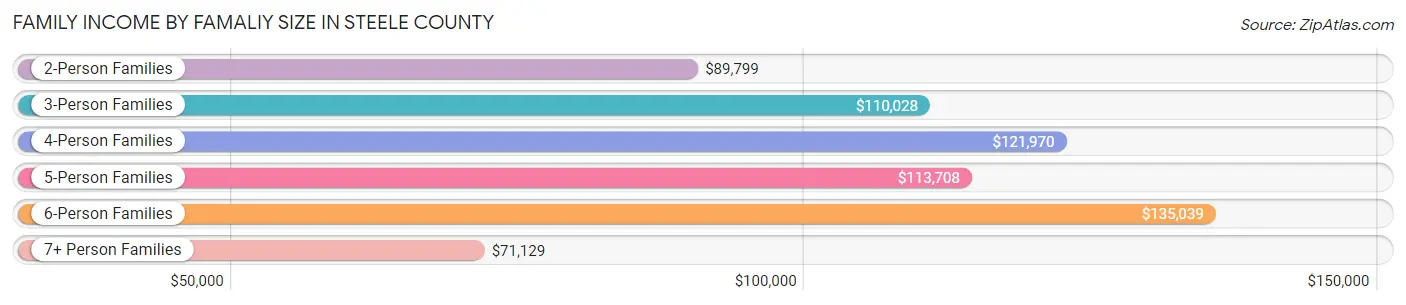
Family Income by Famaliy Size in Steele County
6-person families (231 | 2.4%) account for the highest median family income in Steele County with $135,039 per family, while 2-person families (5,207 | 53.0%) have the highest median income of $44,900 per family member.
| Income Bracket | # Families | Median Income |
| 2-Person Families | 5,207 (53.0%) | $89,799 |
| 3-Person Families | 1,487 (15.1%) | $110,028 |
| 4-Person Families | 1,781 (18.1%) | $121,970 |
| 5-Person Families | 988 (10.1%) | $113,708 |
| 6-Person Families | 231 (2.4%) | $135,039 |
| 7+ Person Families | 136 (1.4%) | $71,129 |
| Total | 9,830 (100.0%) | $102,451 |
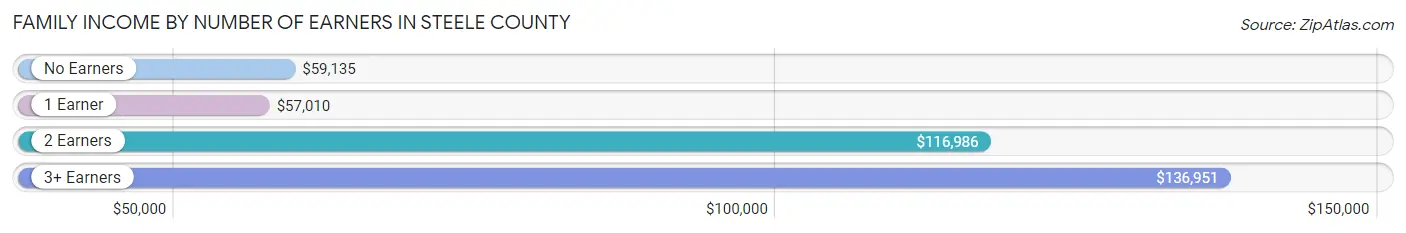
Family Income by Number of Earners in Steele County
The median family income in Steele County is $102,451, with families comprising 3+ earners (1,243) having the highest median family income of $136,951, while families with 1 earner (2,310) have the lowest median family income of $57,010, accounting for 12.6% and 23.5% of families, respectively.
| Number of Earners | # Families | Median Income |
| No Earners | 1,467 (14.9%) | $59,135 |
| 1 Earner | 2,310 (23.5%) | $57,010 |
| 2 Earners | 4,810 (48.9%) | $116,986 |
| 3+ Earners | 1,243 (12.6%) | $136,951 |
| Total | 9,830 (100.0%) | $102,451 |
Household Income in Steele County
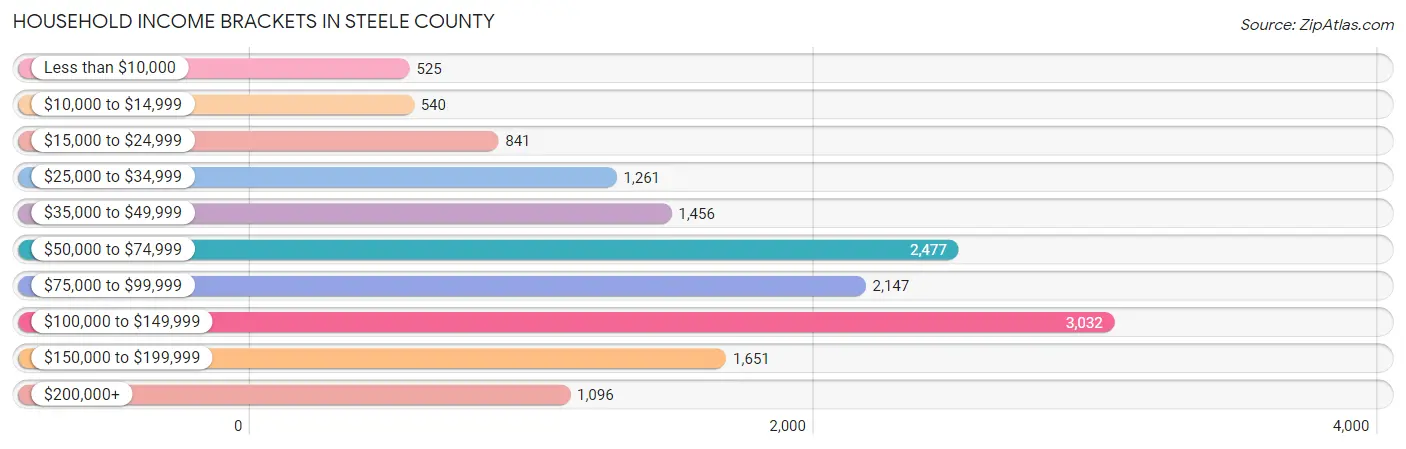
Household Income Brackets in Steele County
With 3,032 households falling in the category, the $100,000 to $149,999 income range is the most frequent in Steele County, accounting for 20.2% of all households. In contrast, only 525 households (3.5%) fall into the less than $10,000 income bracket, making it the least populous group.
| Income Bracket | # Households | % Households |
| Less than $10,000 | 525 | 3.5% |
| $10,000 to $14,999 | 540 | 3.6% |
| $15,000 to $24,999 | 841 | 5.6% |
| $25,000 to $34,999 | 1,261 | 8.4% |
| $35,000 to $49,999 | 1,456 | 9.7% |
| $50,000 to $74,999 | 2,477 | 16.5% |
| $75,000 to $99,999 | 2,147 | 14.3% |
| $100,000 to $149,999 | 3,032 | 20.2% |
| $150,000 to $199,999 | 1,651 | 11.0% |
| $200,000+ | 1,096 | 7.3% |
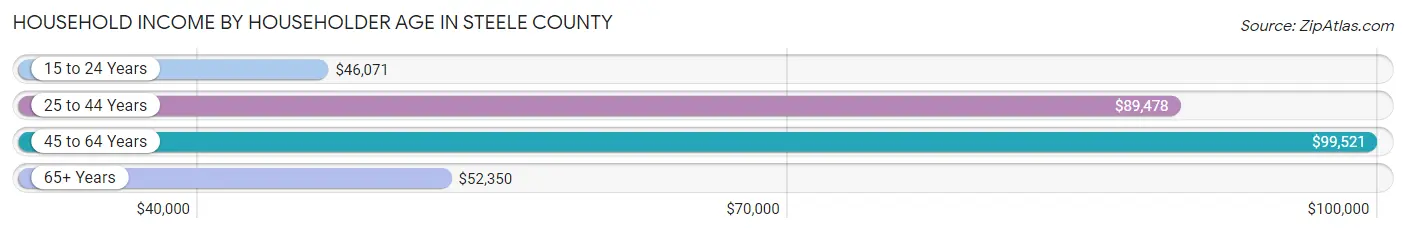
Household Income by Householder Age in Steele County
The median household income in Steele County is $79,722, with the highest median household income of $99,521 found in the 45 to 64 years age bracket for the primary householder. A total of 5,539 households (36.9%) fall into this category. Meanwhile, the 15 to 24 years age bracket for the primary householder has the lowest median household income of $46,071, with 532 households (3.5%) in this group.
| Income Bracket | # Households | Median Income |
| 15 to 24 Years | 532 (3.5%) | $46,071 |
| 25 to 44 Years | 4,608 (30.7%) | $89,478 |
| 45 to 64 Years | 5,539 (36.9%) | $99,521 |
| 65+ Years | 4,332 (28.9%) | $52,350 |
| Total | 15,011 (100.0%) | $79,722 |
Poverty in Steele County
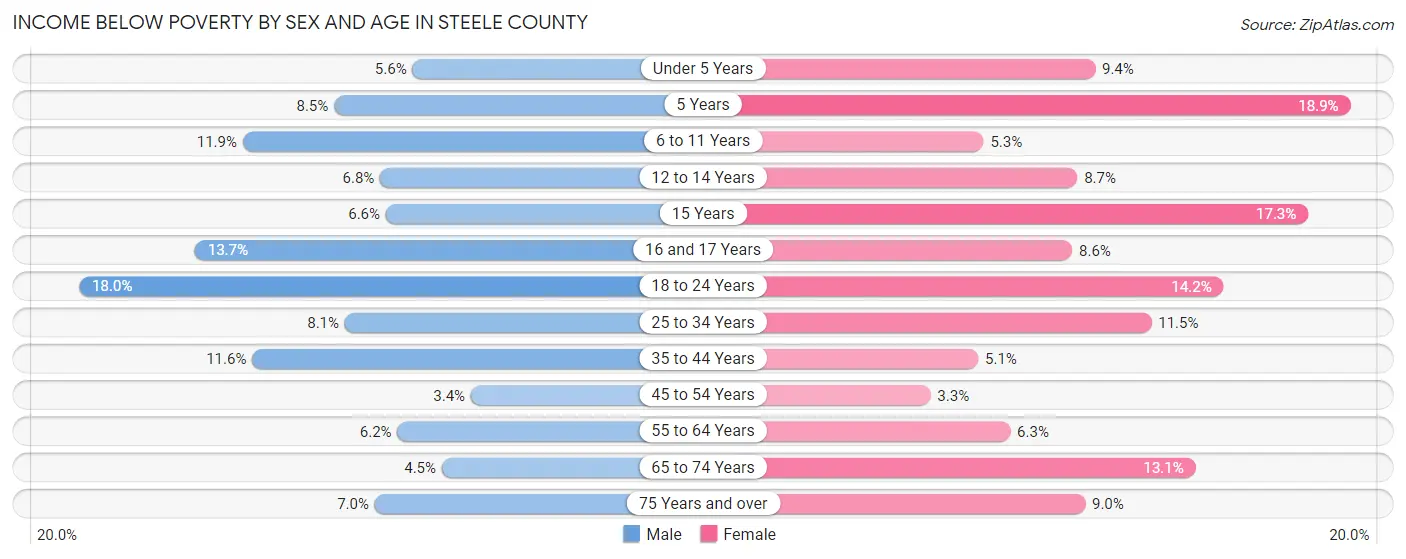
Income Below Poverty by Sex and Age in Steele County
With 8.4% poverty level for males and 8.6% for females among the residents of Steele County, 18 to 24 year old males and 5 year old females are the most vulnerable to poverty, with 292 males (18.0%) and 44 females (18.9%) in their respective age groups living below the poverty level.
| Age Bracket | Male | Female |
| Under 5 Years | 57 (5.6%) | 107 (9.4%) |
| 5 Years | 20 (8.5%) | 44 (18.9%) |
| 6 to 11 Years | 160 (11.9%) | 80 (5.3%) |
| 12 to 14 Years | 69 (6.8%) | 75 (8.7%) |
| 15 Years | 22 (6.6%) | 67 (17.3%) |
| 16 and 17 Years | 71 (13.7%) | 40 (8.6%) |
| 18 to 24 Years | 292 (18.0%) | 195 (14.2%) |
| 25 to 34 Years | 180 (8.1%) | 220 (11.5%) |
| 35 to 44 Years | 278 (11.6%) | 114 (5.1%) |
| 45 to 54 Years | 78 (3.4%) | 72 (3.3%) |
| 55 to 64 Years | 157 (6.2%) | 149 (6.2%) |
| 65 to 74 Years | 82 (4.5%) | 261 (13.1%) |
| 75 Years and over | 81 (7.0%) | 150 (9.0%) |
| Total | 1,547 (8.4%) | 1,574 (8.6%) |
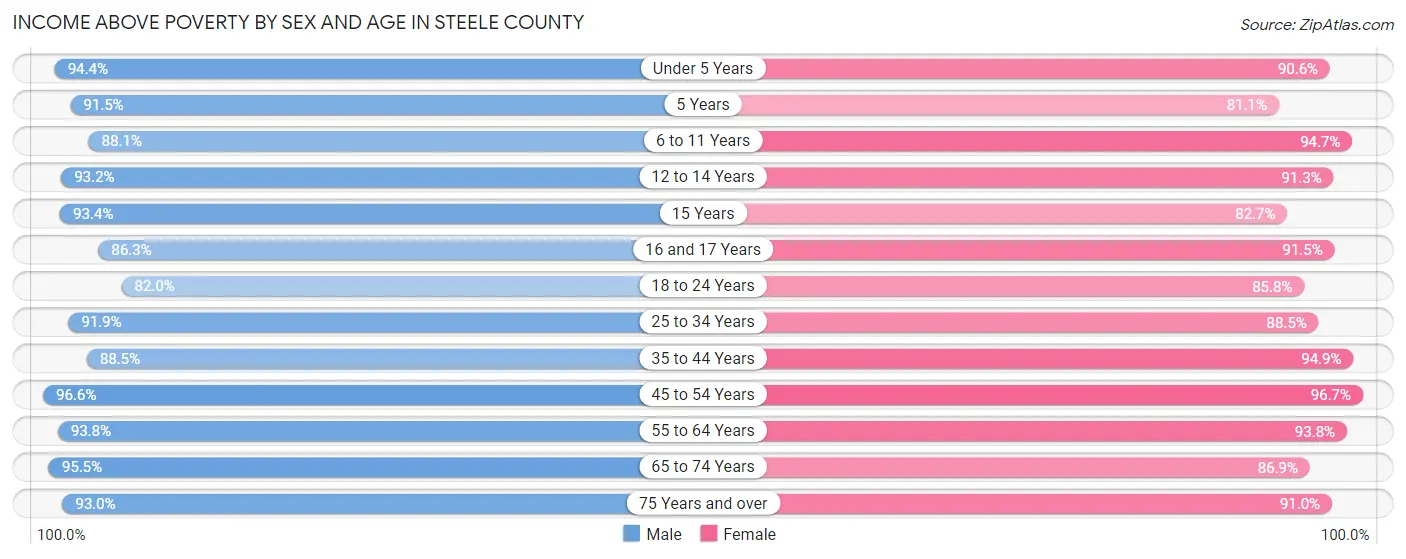
Income Above Poverty by Sex and Age in Steele County
According to the poverty statistics in Steele County, males aged 45 to 54 years and females aged 45 to 54 years are the age groups that are most secure financially, with 96.6% of males and 96.7% of females in these age groups living above the poverty line.
| Age Bracket | Male | Female |
| Under 5 Years | 961 (94.4%) | 1,031 (90.6%) |
| 5 Years | 215 (91.5%) | 189 (81.1%) |
| 6 to 11 Years | 1,184 (88.1%) | 1,442 (94.7%) |
| 12 to 14 Years | 945 (93.2%) | 783 (91.3%) |
| 15 Years | 312 (93.4%) | 320 (82.7%) |
| 16 and 17 Years | 448 (86.3%) | 428 (91.4%) |
| 18 to 24 Years | 1,332 (82.0%) | 1,181 (85.8%) |
| 25 to 34 Years | 2,040 (91.9%) | 1,695 (88.5%) |
| 35 to 44 Years | 2,128 (88.4%) | 2,141 (94.9%) |
| 45 to 54 Years | 2,195 (96.6%) | 2,118 (96.7%) |
| 55 to 64 Years | 2,391 (93.8%) | 2,236 (93.8%) |
| 65 to 74 Years | 1,736 (95.5%) | 1,727 (86.9%) |
| 75 Years and over | 1,076 (93.0%) | 1,511 (91.0%) |
| Total | 16,963 (91.6%) | 16,802 (91.4%) |
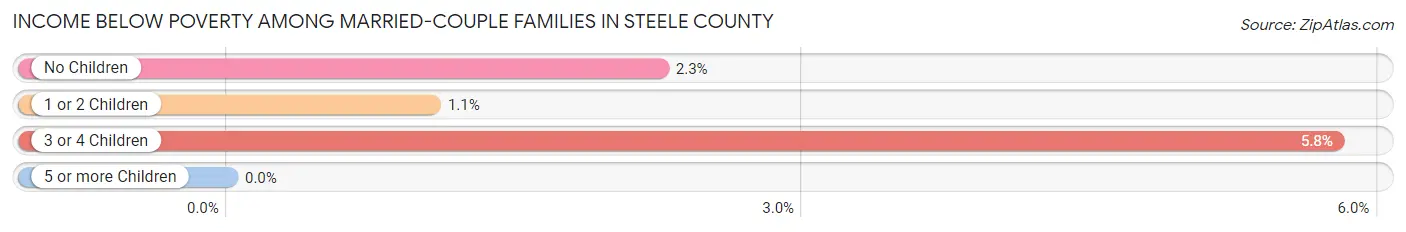
Income Below Poverty Among Married-Couple Families in Steele County
The poverty statistics for married-couple families in Steele County show that 2.3% or 182 of the total 8,061 families live below the poverty line. Families with 3 or 4 children have the highest poverty rate of 5.8%, comprising of 48 families. On the other hand, families with 5 or more children have the lowest poverty rate of 0.0%, which includes 0 families.
| Children | Above Poverty | Below Poverty |
| No Children | 4,773 (97.8%) | 110 (2.2%) |
| 1 or 2 Children | 2,244 (98.9%) | 24 (1.1%) |
| 3 or 4 Children | 782 (94.2%) | 48 (5.8%) |
| 5 or more Children | 80 (100.0%) | 0 (0.0%) |
| Total | 7,879 (97.7%) | 182 (2.3%) |
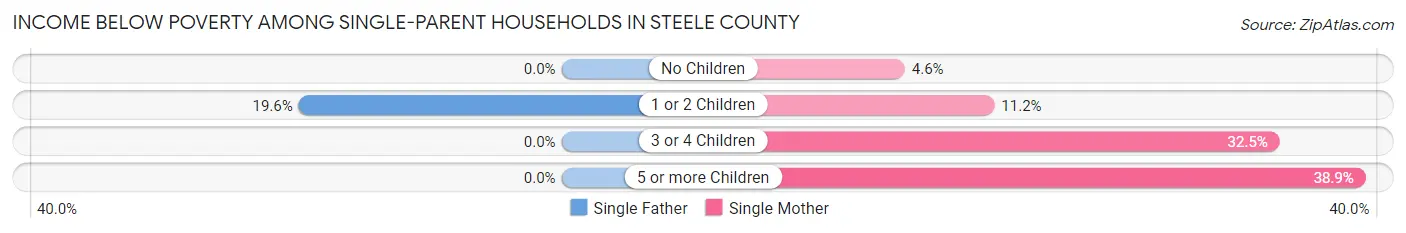
Income Below Poverty Among Single-Parent Households in Steele County
According to the poverty data in Steele County, 12.2% or 57 single-father households and 15.0% or 196 single-mother households are living below the poverty line. Among single-father households, those with 1 or 2 children have the highest poverty rate, with 57 households (19.6%) experiencing poverty. Likewise, among single-mother households, those with 5 or more children have the highest poverty rate, with 14 households (38.9%) falling below the poverty line.
| Children | Single Father | Single Mother |
| No Children | 0 (0.0%) | 18 (4.6%) |
| 1 or 2 Children | 57 (19.6%) | 63 (11.2%) |
| 3 or 4 Children | 0 (0.0%) | 101 (32.5%) |
| 5 or more Children | 0 (0.0%) | 14 (38.9%) |
| Total | 57 (12.2%) | 196 (15.0%) |
Income Below Poverty Among Married-Couple vs Single-Parent Households in Steele County
The poverty data for Steele County shows that 182 of the married-couple family households (2.3%) and 253 of the single-parent households (14.3%) are living below the poverty level. Within the married-couple family households, those with 3 or 4 children have the highest poverty rate, with 48 households (5.8%) falling below the poverty line. Among the single-parent households, those with 5 or more children have the highest poverty rate, with 14 household (38.9%) living below poverty.
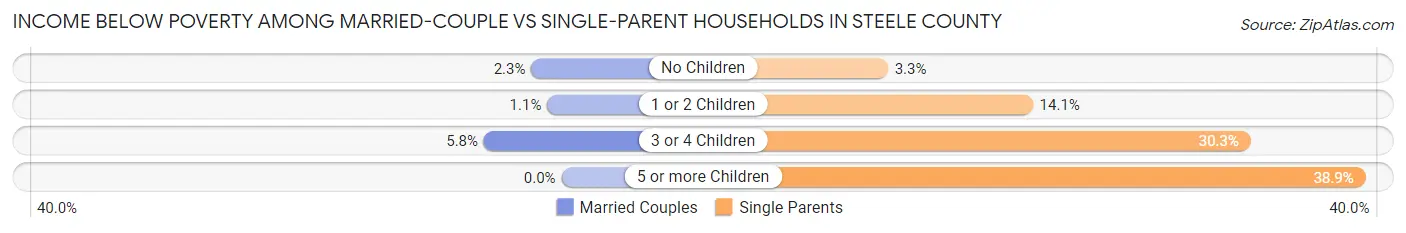
| Children | Married-Couple Families | Single-Parent Households |
| No Children | 110 (2.2%) | 18 (3.3%) |
| 1 or 2 Children | 24 (1.1%) | 120 (14.1%) |
| 3 or 4 Children | 48 (5.8%) | 101 (30.3%) |
| 5 or more Children | 0 (0.0%) | 14 (38.9%) |
| Total | 182 (2.3%) | 253 (14.3%) |
Employment Characteristics in Steele County
Employment by Class of Employer in Steele County
Among the 18,758 employed individuals in Steele County, private company employees (12,837 | 68.4%), local government employees (1,744 | 9.3%), and not-for-profit organizations (1,551 | 8.3%) make up the most common classes of employment.
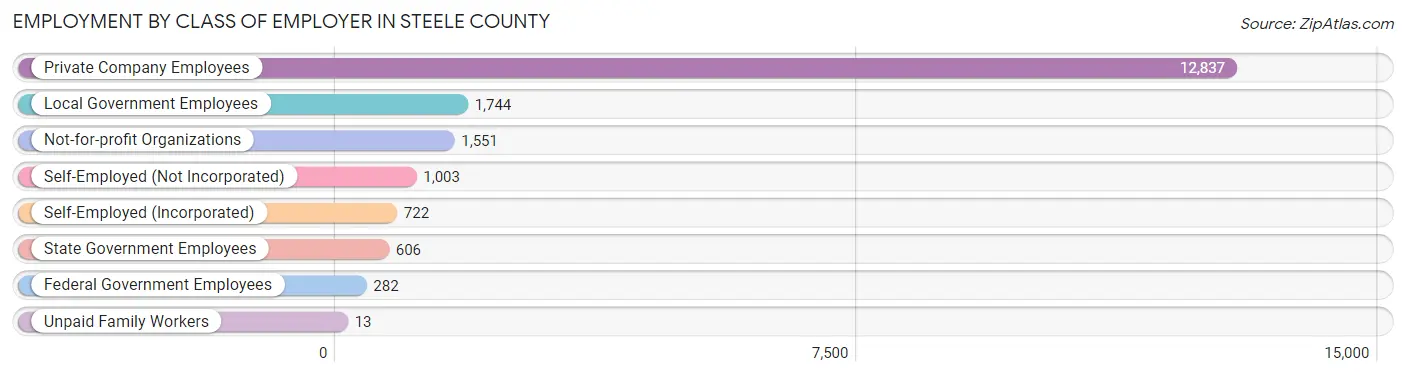
| Employer Class | # Employees | % Employees |
| Private Company Employees | 12,837 | 68.4% |
| Self-Employed (Incorporated) | 722 | 3.8% |
| Self-Employed (Not Incorporated) | 1,003 | 5.3% |
| Not-for-profit Organizations | 1,551 | 8.3% |
| Local Government Employees | 1,744 | 9.3% |
| State Government Employees | 606 | 3.2% |
| Federal Government Employees | 282 | 1.5% |
| Unpaid Family Workers | 13 | 0.1% |
| Total | 18,758 | 100.0% |
Employment Status by Age in Steele County
According to the labor force statistics for Steele County, out of the total population over 16 years of age (29,205), 67.8% or 19,801 individuals are in the labor force, with 3.4% or 673 of them unemployed. The age group with the highest labor force participation rate is 20 to 24 years, with 92.1% or 1,850 individuals in the labor force. Within the labor force, the 16 to 19 years age range has the highest percentage of unemployed individuals, with 12.5% or 128 of them being unemployed.
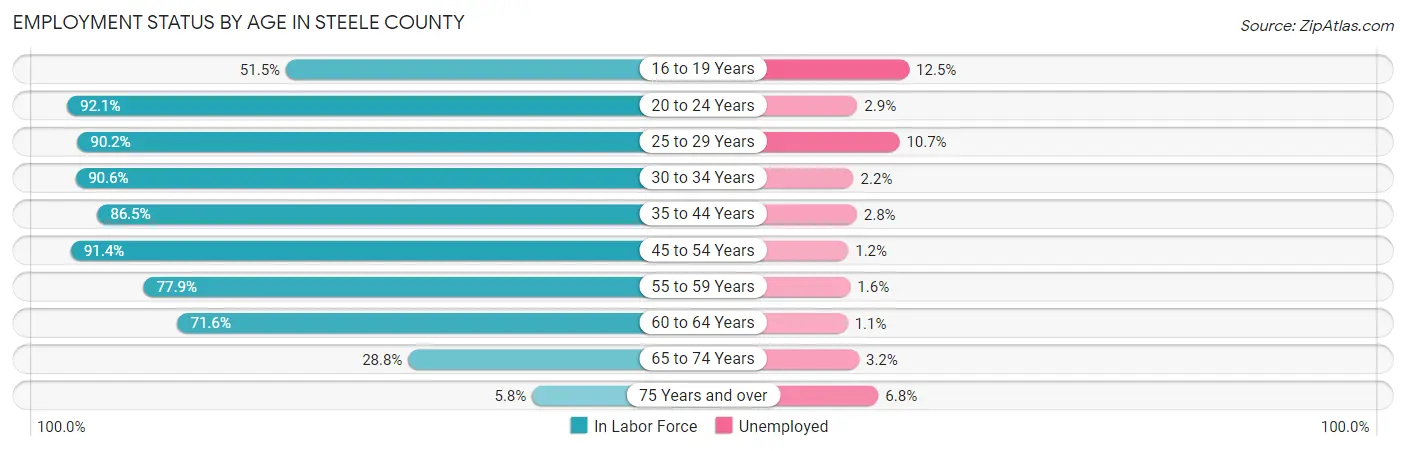
| Age Bracket | In Labor Force | Unemployed |
| 16 to 19 Years | 1,022 (51.5%) | 128 (12.5%) |
| 20 to 24 Years | 1,850 (92.1%) | 54 (2.9%) |
| 25 to 29 Years | 1,762 (90.2%) | 189 (10.7%) |
| 30 to 34 Years | 1,994 (90.6%) | 44 (2.2%) |
| 35 to 44 Years | 4,065 (86.5%) | 114 (2.8%) |
| 45 to 54 Years | 4,091 (91.4%) | 49 (1.2%) |
| 55 to 59 Years | 2,122 (77.9%) | 34 (1.6%) |
| 60 to 64 Years | 1,625 (71.6%) | 18 (1.1%) |
| 65 to 74 Years | 1,110 (28.8%) | 36 (3.2%) |
| 75 Years and over | 176 (5.8%) | 12 (6.8%) |
| Total | 19,801 (67.8%) | 673 (3.4%) |
Employment Status by Educational Attainment in Steele County
According to labor force statistics for Steele County, 85.5% of individuals (15,665) out of the total population between 25 and 64 years of age (18,322) are in the labor force, with 2.9% or 454 of them being unemployed. The group with the highest labor force participation rate are those with the educational attainment of bachelor's degree or higher, with 90.5% or 5,187 individuals in the labor force. Within the labor force, individuals with less than high school education have the highest percentage of unemployment, with 11.3% or 102 of them being unemployed.
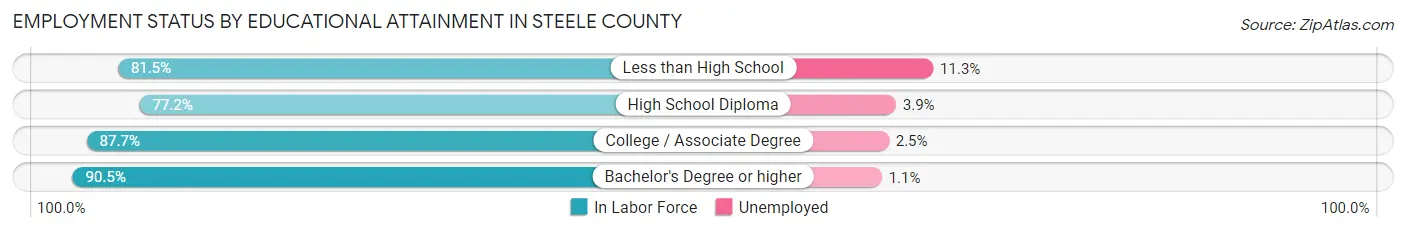
| Educational Attainment | In Labor Force | Unemployed |
| Less than High School | 903 (81.5%) | 125 (11.3%) |
| High School Diploma | 3,729 (77.2%) | 188 (3.9%) |
| College / Associate Degree | 5,835 (87.7%) | 166 (2.5%) |
| Bachelor's Degree or higher | 5,187 (90.5%) | 63 (1.1%) |
| Total | 15,665 (85.5%) | 531 (2.9%) |
Employment Occupations by Sex in Steele County
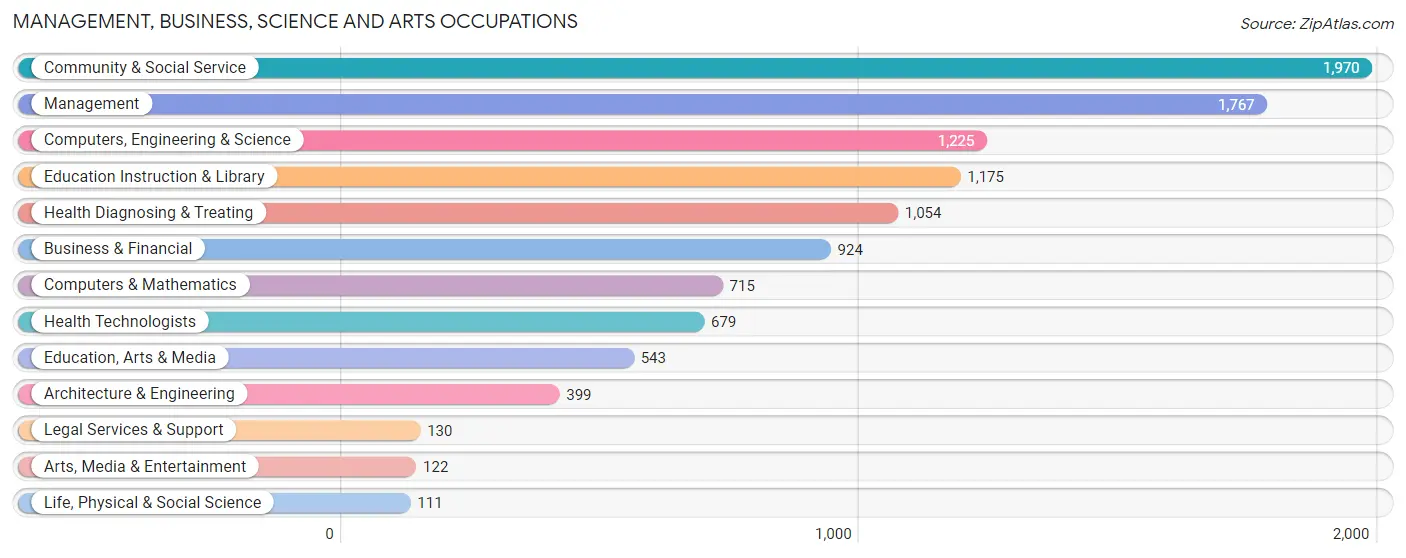
Management, Business, Science and Arts Occupations
The most common Management, Business, Science and Arts occupations in Steele County are Community & Social Service (1,970 | 10.3%), Management (1,767 | 9.2%), Computers, Engineering & Science (1,225 | 6.4%), Education Instruction & Library (1,175 | 6.1%), and Health Diagnosing & Treating (1,054 | 5.5%).
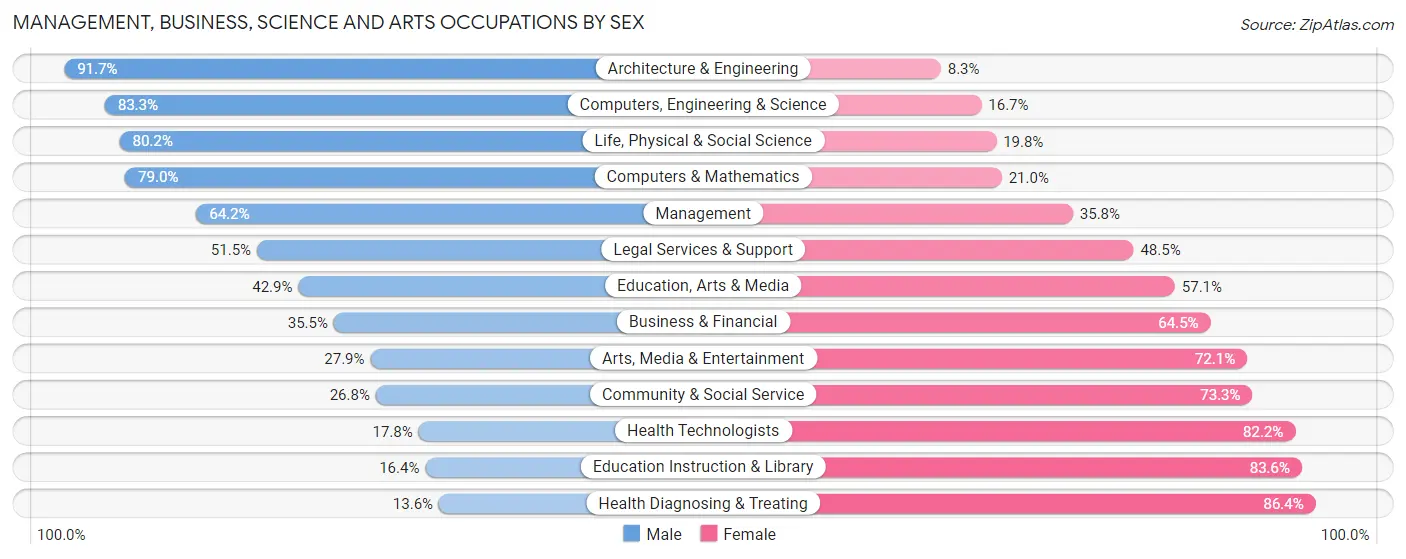
Management, Business, Science and Arts Occupations by Sex
Within the Management, Business, Science and Arts occupations in Steele County, the most male-oriented occupations are Architecture & Engineering (91.7%), Computers, Engineering & Science (83.3%), and Life, Physical & Social Science (80.2%), while the most female-oriented occupations are Health Diagnosing & Treating (86.4%), Education Instruction & Library (83.6%), and Health Technologists (82.2%).
| Occupation | Male | Female |
| Management | 1,134 (64.2%) | 633 (35.8%) |
| Business & Financial | 328 (35.5%) | 596 (64.5%) |
| Computers, Engineering & Science | 1,020 (83.3%) | 205 (16.7%) |
| Computers & Mathematics | 565 (79.0%) | 150 (21.0%) |
| Architecture & Engineering | 366 (91.7%) | 33 (8.3%) |
| Life, Physical & Social Science | 89 (80.2%) | 22 (19.8%) |
| Community & Social Service | 527 (26.8%) | 1,443 (73.3%) |
| Education, Arts & Media | 233 (42.9%) | 310 (57.1%) |
| Legal Services & Support | 67 (51.5%) | 63 (48.5%) |
| Education Instruction & Library | 193 (16.4%) | 982 (83.6%) |
| Arts, Media & Entertainment | 34 (27.9%) | 88 (72.1%) |
| Health Diagnosing & Treating | 143 (13.6%) | 911 (86.4%) |
| Health Technologists | 121 (17.8%) | 558 (82.2%) |
| Total (Category) | 3,152 (45.4%) | 3,788 (54.6%) |
| Total (Overall) | 10,381 (54.2%) | 8,755 (45.8%) |
Services Occupations
The most common Services occupations in Steele County are Food Preparation & Serving (771 | 4.0%), Healthcare Support (528 | 2.8%), Personal Care & Service (480 | 2.5%), Cleaning & Maintenance (452 | 2.4%), and Security & Protection (373 | 1.9%).

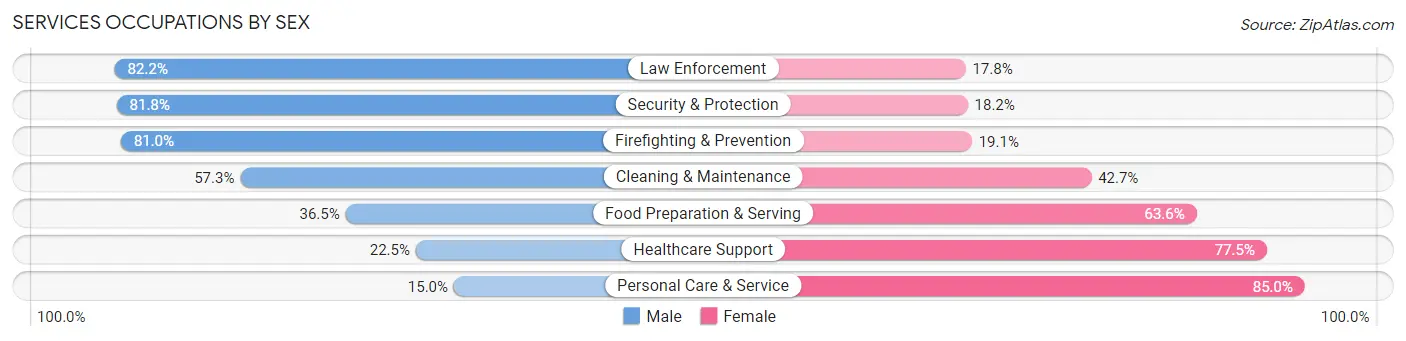
Services Occupations by Sex
Within the Services occupations in Steele County, the most male-oriented occupations are Law Enforcement (82.2%), Security & Protection (81.8%), and Firefighting & Prevention (80.9%), while the most female-oriented occupations are Personal Care & Service (85.0%), Healthcare Support (77.5%), and Food Preparation & Serving (63.5%).
| Occupation | Male | Female |
| Healthcare Support | 119 (22.5%) | 409 (77.5%) |
| Security & Protection | 305 (81.8%) | 68 (18.2%) |
| Firefighting & Prevention | 102 (80.9%) | 24 (19.1%) |
| Law Enforcement | 203 (82.2%) | 44 (17.8%) |
| Food Preparation & Serving | 281 (36.4%) | 490 (63.5%) |
| Cleaning & Maintenance | 259 (57.3%) | 193 (42.7%) |
| Personal Care & Service | 72 (15.0%) | 408 (85.0%) |
| Total (Category) | 1,036 (39.8%) | 1,568 (60.2%) |
| Total (Overall) | 10,381 (54.2%) | 8,755 (45.8%) |
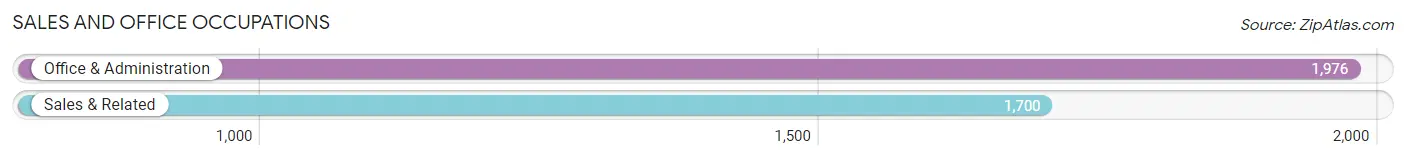
Sales and Office Occupations
The most common Sales and Office occupations in Steele County are Office & Administration (1,976 | 10.3%), and Sales & Related (1,700 | 8.9%).
Sales and Office Occupations by Sex
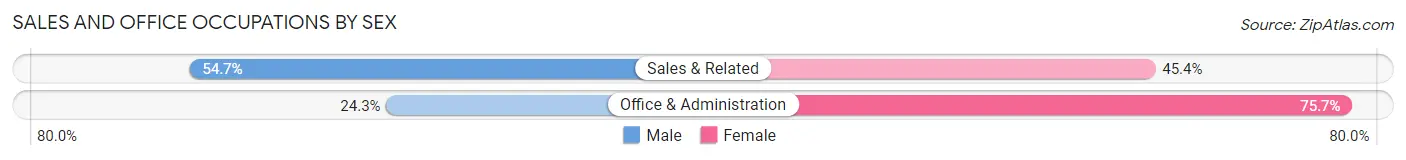
| Occupation | Male | Female |
| Sales & Related | 929 (54.6%) | 771 (45.4%) |
| Office & Administration | 481 (24.3%) | 1,495 (75.7%) |
| Total (Category) | 1,410 (38.4%) | 2,266 (61.6%) |
| Total (Overall) | 10,381 (54.2%) | 8,755 (45.8%) |
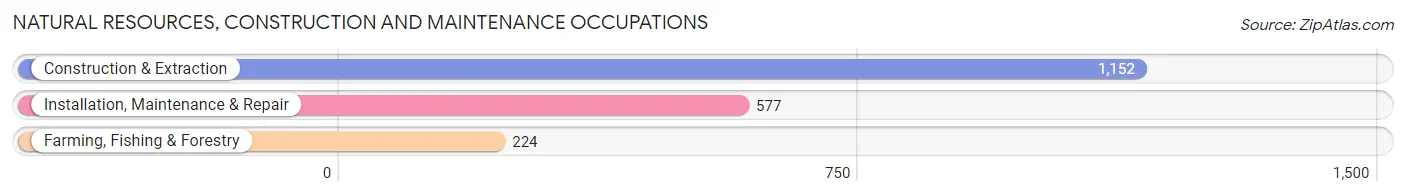
Natural Resources, Construction and Maintenance Occupations
The most common Natural Resources, Construction and Maintenance occupations in Steele County are Construction & Extraction (1,152 | 6.0%), Installation, Maintenance & Repair (577 | 3.0%), and Farming, Fishing & Forestry (224 | 1.2%).
Natural Resources, Construction and Maintenance Occupations by Sex
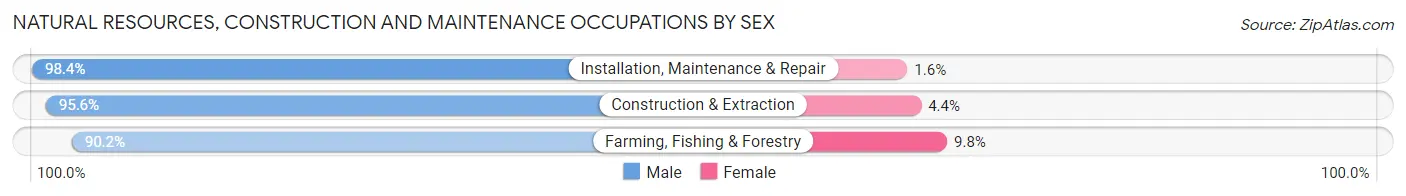
| Occupation | Male | Female |
| Farming, Fishing & Forestry | 202 (90.2%) | 22 (9.8%) |
| Construction & Extraction | 1,101 (95.6%) | 51 (4.4%) |
| Installation, Maintenance & Repair | 568 (98.4%) | 9 (1.6%) |
| Total (Category) | 1,871 (95.8%) | 82 (4.2%) |
| Total (Overall) | 10,381 (54.2%) | 8,755 (45.8%) |
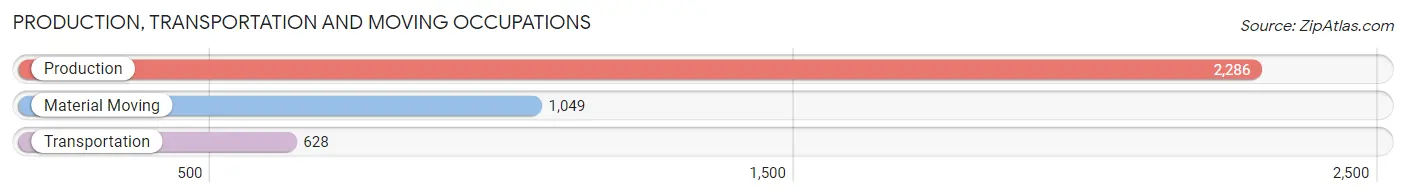
Production, Transportation and Moving Occupations
The most common Production, Transportation and Moving occupations in Steele County are Production (2,286 | 11.9%), Material Moving (1,049 | 5.5%), and Transportation (628 | 3.3%).
Production, Transportation and Moving Occupations by Sex
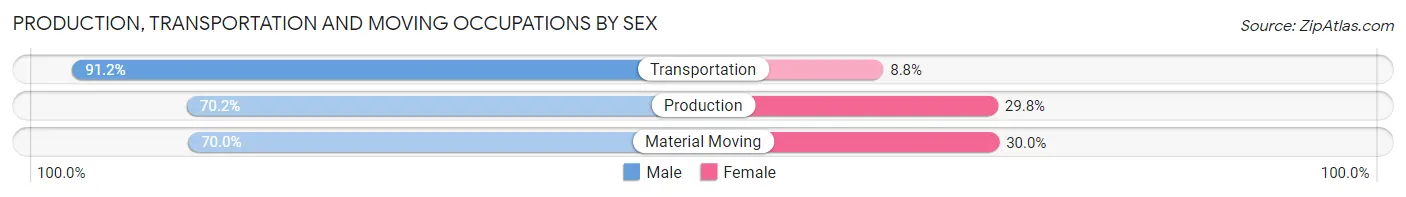
| Occupation | Male | Female |
| Production | 1,605 (70.2%) | 681 (29.8%) |
| Transportation | 573 (91.2%) | 55 (8.8%) |
| Material Moving | 734 (70.0%) | 315 (30.0%) |
| Total (Category) | 2,912 (73.5%) | 1,051 (26.5%) |
| Total (Overall) | 10,381 (54.2%) | 8,755 (45.8%) |
Employment Industries by Sex in Steele County
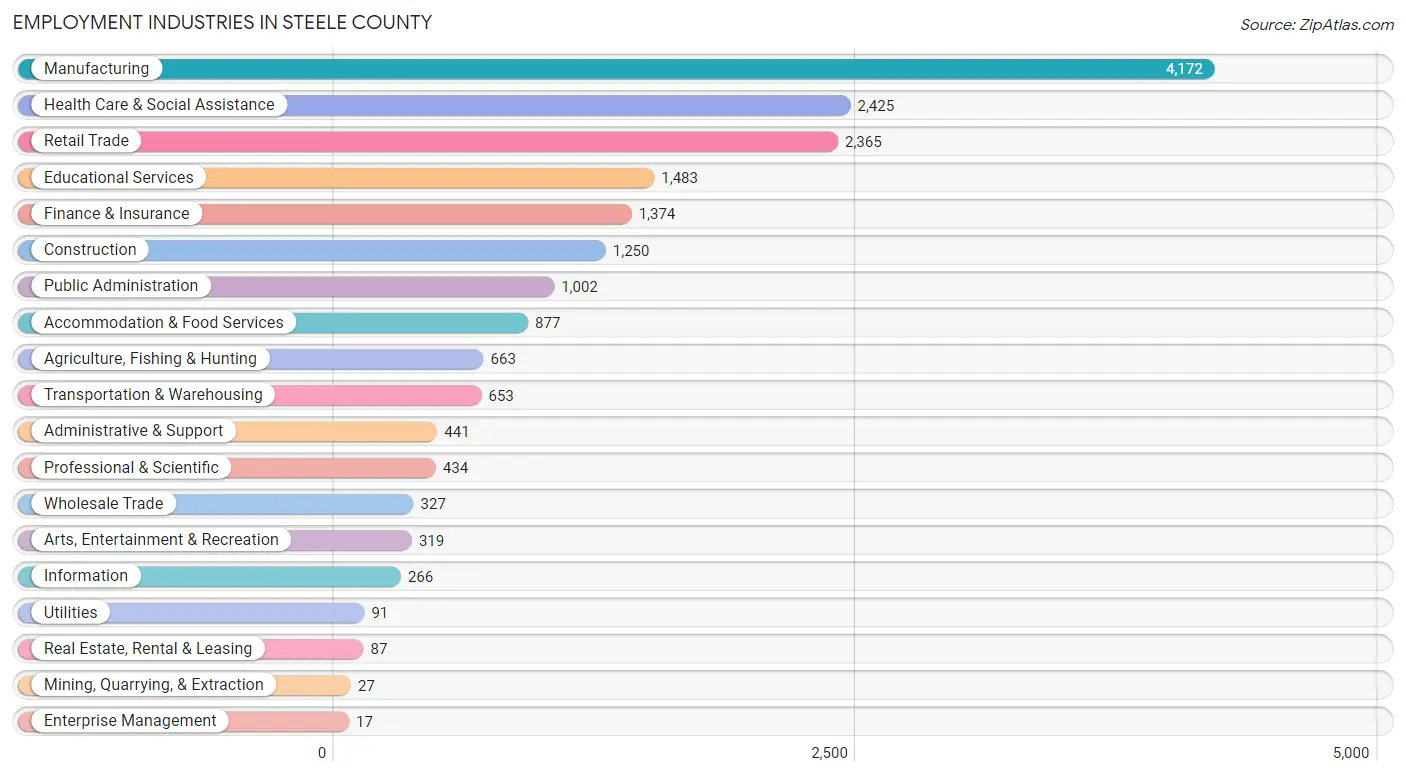
Employment Industries in Steele County
The major employment industries in Steele County include Manufacturing (4,172 | 21.8%), Health Care & Social Assistance (2,425 | 12.7%), Retail Trade (2,365 | 12.4%), Educational Services (1,483 | 7.7%), and Finance & Insurance (1,374 | 7.2%).
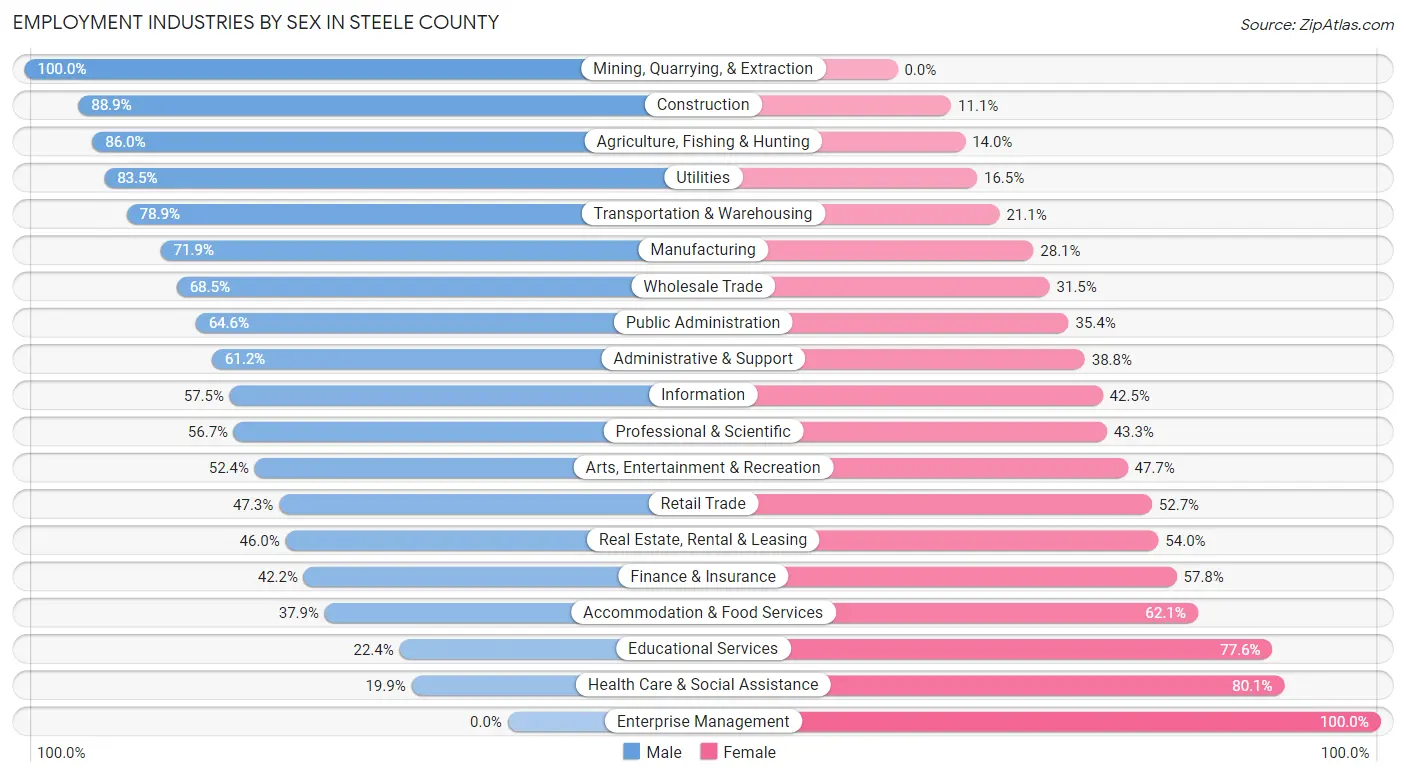
Employment Industries by Sex in Steele County
The Steele County industries that see more men than women are Mining, Quarrying, & Extraction (100.0%), Construction (88.9%), and Agriculture, Fishing & Hunting (86.0%), whereas the industries that tend to have a higher number of women are Enterprise Management (100.0%), Health Care & Social Assistance (80.1%), and Educational Services (77.6%).
| Industry | Male | Female |
| Agriculture, Fishing & Hunting | 570 (86.0%) | 93 (14.0%) |
| Mining, Quarrying, & Extraction | 27 (100.0%) | 0 (0.0%) |
| Construction | 1,111 (88.9%) | 139 (11.1%) |
| Manufacturing | 2,998 (71.9%) | 1,174 (28.1%) |
| Wholesale Trade | 224 (68.5%) | 103 (31.5%) |
| Retail Trade | 1,119 (47.3%) | 1,246 (52.7%) |
| Transportation & Warehousing | 515 (78.9%) | 138 (21.1%) |
| Utilities | 76 (83.5%) | 15 (16.5%) |
| Information | 153 (57.5%) | 113 (42.5%) |
| Finance & Insurance | 580 (42.2%) | 794 (57.8%) |
| Real Estate, Rental & Leasing | 40 (46.0%) | 47 (54.0%) |
| Professional & Scientific | 246 (56.7%) | 188 (43.3%) |
| Enterprise Management | 0 (0.0%) | 17 (100.0%) |
| Administrative & Support | 270 (61.2%) | 171 (38.8%) |
| Educational Services | 332 (22.4%) | 1,151 (77.6%) |
| Health Care & Social Assistance | 483 (19.9%) | 1,942 (80.1%) |
| Arts, Entertainment & Recreation | 167 (52.3%) | 152 (47.6%) |
| Accommodation & Food Services | 332 (37.9%) | 545 (62.1%) |
| Public Administration | 647 (64.6%) | 355 (35.4%) |
| Total | 10,381 (54.2%) | 8,755 (45.8%) |
Education in Steele County
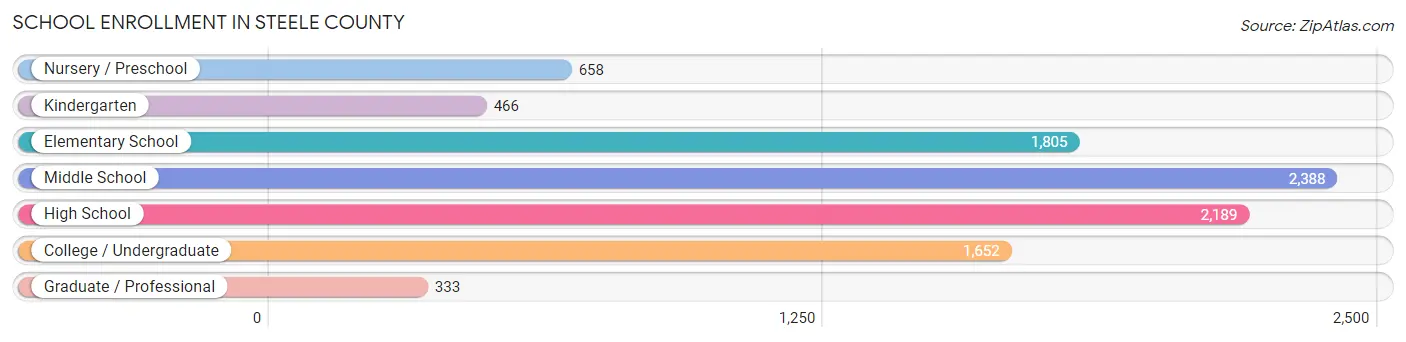
School Enrollment in Steele County
The most common levels of schooling among the 9,491 students in Steele County are middle school (2,388 | 25.2%), high school (2,189 | 23.1%), and elementary school (1,805 | 19.0%).
| School Level | # Students | % Students |
| Nursery / Preschool | 658 | 6.9% |
| Kindergarten | 466 | 4.9% |
| Elementary School | 1,805 | 19.0% |
| Middle School | 2,388 | 25.2% |
| High School | 2,189 | 23.1% |
| College / Undergraduate | 1,652 | 17.4% |
| Graduate / Professional | 333 | 3.5% |
| Total | 9,491 | 100.0% |
School Enrollment by Age by Funding Source in Steele County
Out of a total of 9,491 students who are enrolled in schools in Steele County, 1,348 (14.2%) attend a private institution, while the remaining 8,143 (85.8%) are enrolled in public schools. The age group of 35 years and over has the highest likelihood of being enrolled in private schools, with 145 (38.1% in the age bracket) enrolled. Conversely, the age group of 15 to 17 year olds has the lowest likelihood of being enrolled in a private school, with 1,561 (94.3% in the age bracket) attending a public institution.
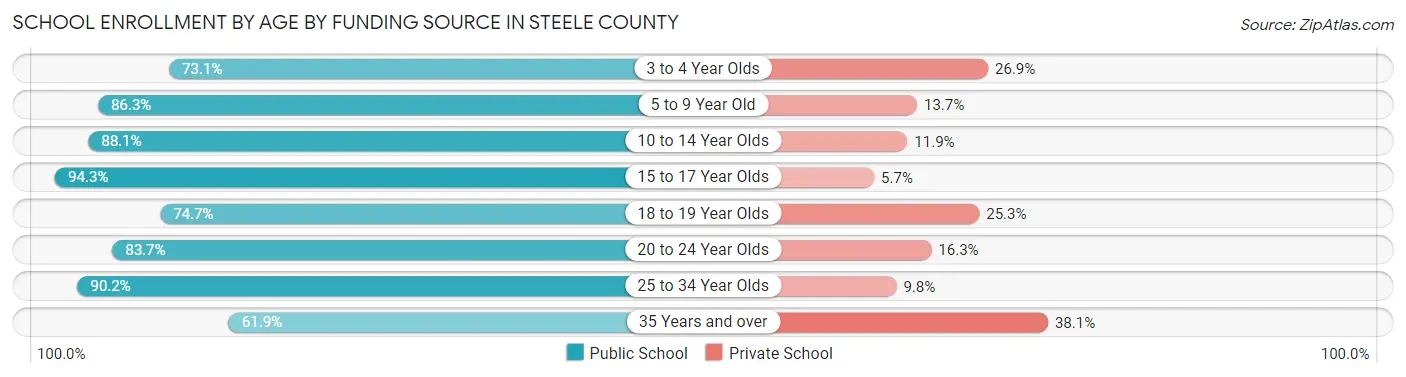
| Age Bracket | Public School | Private School |
| 3 to 4 Year Olds | 288 (73.1%) | 106 (26.9%) |
| 5 to 9 Year Old | 1,875 (86.3%) | 297 (13.7%) |
| 10 to 14 Year Olds | 2,614 (88.1%) | 352 (11.9%) |
| 15 to 17 Year Olds | 1,561 (94.3%) | 94 (5.7%) |
| 18 to 19 Year Olds | 568 (74.7%) | 192 (25.3%) |
| 20 to 24 Year Olds | 650 (83.7%) | 127 (16.3%) |
| 25 to 34 Year Olds | 348 (90.2%) | 38 (9.8%) |
| 35 Years and over | 236 (61.9%) | 145 (38.1%) |
| Total | 8,143 (85.8%) | 1,348 (14.2%) |
Educational Attainment by Field of Study in Steele County
Business (1,930 | 24.2%), education (1,391 | 17.4%), science & technology (722 | 9.0%), bio, nature & agricultural (611 | 7.7%), and arts & humanities (579 | 7.3%) are the most common fields of study among 7,980 individuals in Steele County who have obtained a bachelor's degree or higher.
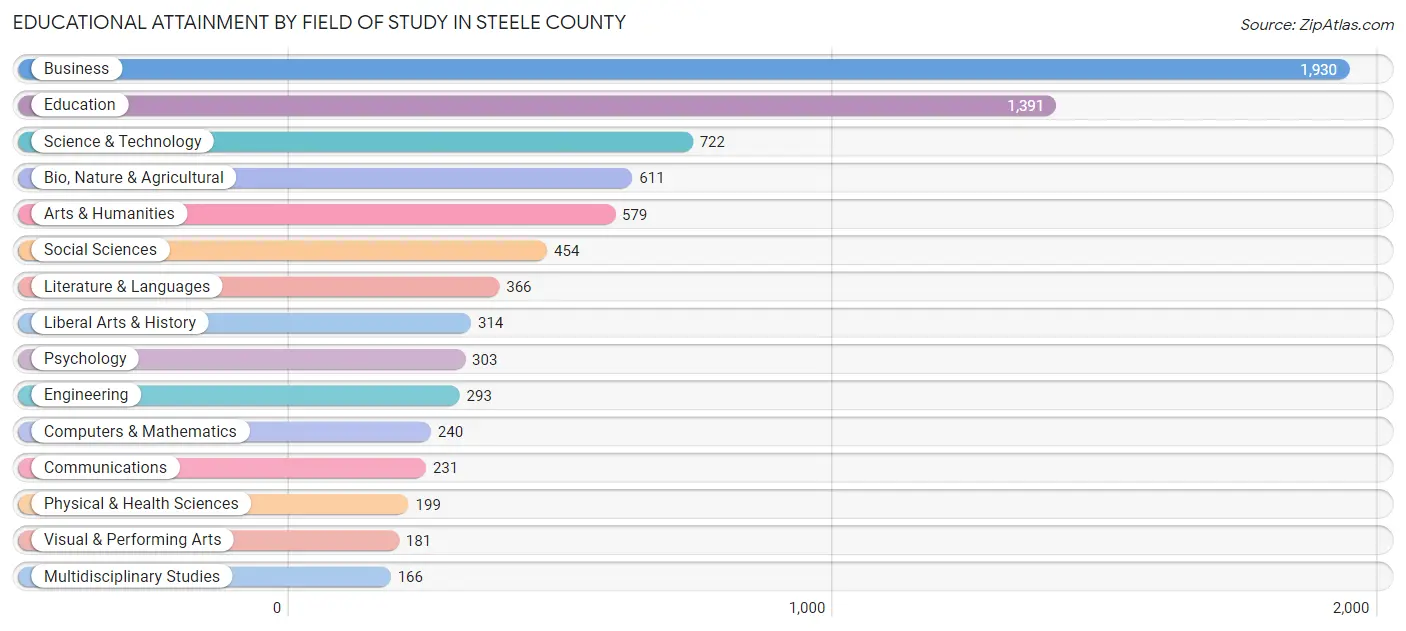
| Field of Study | # Graduates | % Graduates |
| Computers & Mathematics | 240 | 3.0% |
| Bio, Nature & Agricultural | 611 | 7.7% |
| Physical & Health Sciences | 199 | 2.5% |
| Psychology | 303 | 3.8% |
| Social Sciences | 454 | 5.7% |
| Engineering | 293 | 3.7% |
| Multidisciplinary Studies | 166 | 2.1% |
| Science & Technology | 722 | 9.0% |
| Business | 1,930 | 24.2% |
| Education | 1,391 | 17.4% |
| Literature & Languages | 366 | 4.6% |
| Liberal Arts & History | 314 | 3.9% |
| Visual & Performing Arts | 181 | 2.3% |
| Communications | 231 | 2.9% |
| Arts & Humanities | 579 | 7.3% |
| Total | 7,980 | 100.0% |
Transportation & Commute in Steele County
Vehicle Availability by Sex in Steele County
The most prevalent vehicle ownership categories in Steele County are males with 2 vehicles (3,829, accounting for 37.7%) and females with 2 vehicles (3,254, making up 44.8%).
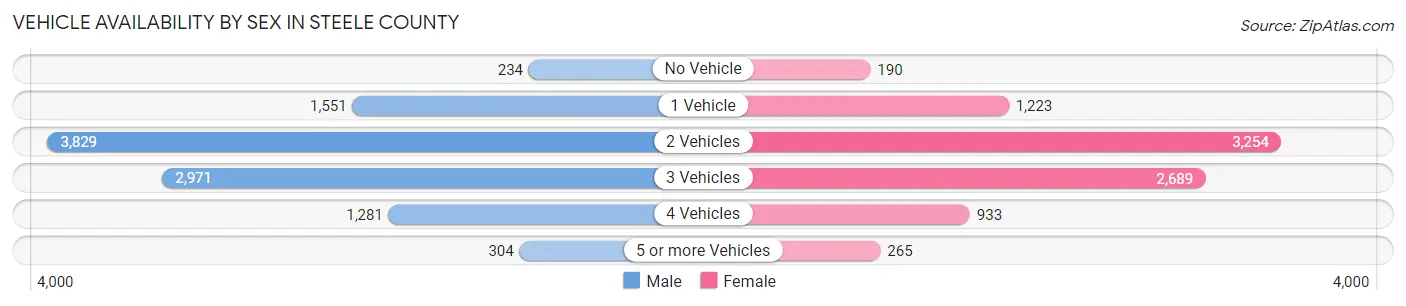
| Vehicles Available | Male | Female |
| No Vehicle | 234 (2.3%) | 190 (2.2%) |
| 1 Vehicle | 1,551 (15.2%) | 1,223 (14.3%) |
| 2 Vehicles | 3,829 (37.7%) | 3,254 (38.0%) |
| 3 Vehicles | 2,971 (29.2%) | 2,689 (31.4%) |
| 4 Vehicles | 1,281 (12.6%) | 933 (10.9%) |
| 5 or more Vehicles | 304 (3.0%) | 265 (3.1%) |
| Total | 10,170 (100.0%) | 8,554 (100.0%) |
Commute Time in Steele County
The most frequently occuring commute durations in Steele County are 10 to 14 minutes (4,594 commuters, 26.3%), 5 to 9 minutes (4,294 commuters, 24.6%), and 15 to 19 minutes (1,922 commuters, 11.0%).
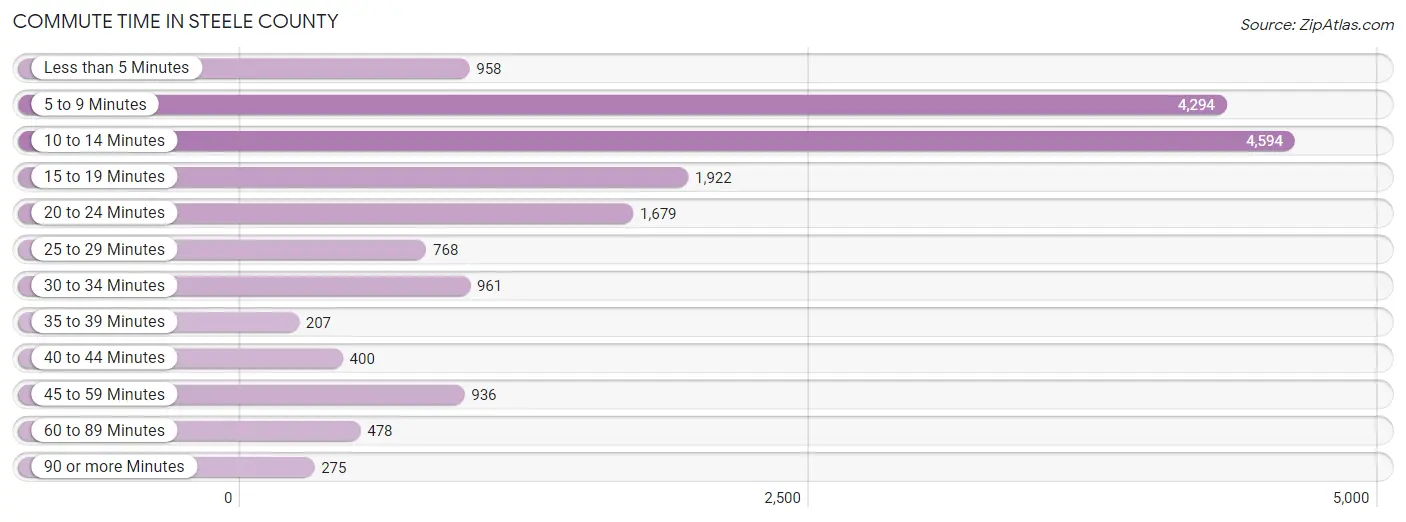
| Commute Time | # Commuters | % Commuters |
| Less than 5 Minutes | 958 | 5.5% |
| 5 to 9 Minutes | 4,294 | 24.6% |
| 10 to 14 Minutes | 4,594 | 26.3% |
| 15 to 19 Minutes | 1,922 | 11.0% |
| 20 to 24 Minutes | 1,679 | 9.6% |
| 25 to 29 Minutes | 768 | 4.4% |
| 30 to 34 Minutes | 961 | 5.5% |
| 35 to 39 Minutes | 207 | 1.2% |
| 40 to 44 Minutes | 400 | 2.3% |
| 45 to 59 Minutes | 936 | 5.4% |
| 60 to 89 Minutes | 478 | 2.7% |
| 90 or more Minutes | 275 | 1.6% |
Commute Time by Sex in Steele County
The most common commute times in Steele County are 5 to 9 minutes (2,404 commuters, 25.1%) for males and 10 to 14 minutes (2,365 commuters, 30.0%) for females.
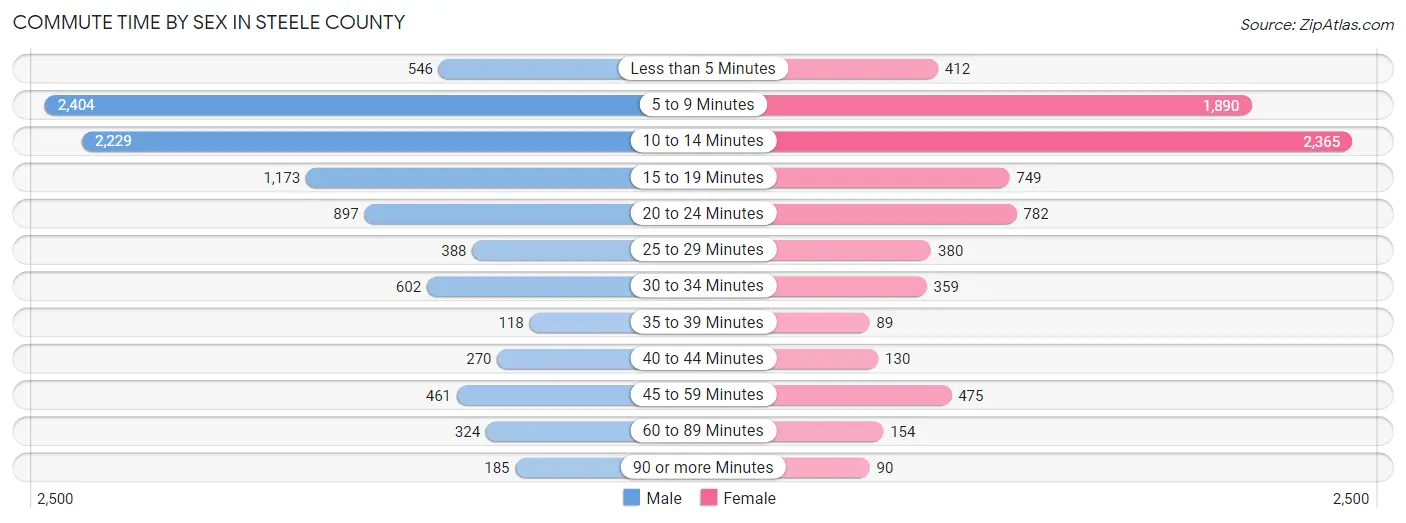
| Commute Time | Male | Female |
| Less than 5 Minutes | 546 (5.7%) | 412 (5.2%) |
| 5 to 9 Minutes | 2,404 (25.1%) | 1,890 (24.0%) |
| 10 to 14 Minutes | 2,229 (23.2%) | 2,365 (30.0%) |
| 15 to 19 Minutes | 1,173 (12.2%) | 749 (9.5%) |
| 20 to 24 Minutes | 897 (9.3%) | 782 (9.9%) |
| 25 to 29 Minutes | 388 (4.0%) | 380 (4.8%) |
| 30 to 34 Minutes | 602 (6.3%) | 359 (4.6%) |
| 35 to 39 Minutes | 118 (1.2%) | 89 (1.1%) |
| 40 to 44 Minutes | 270 (2.8%) | 130 (1.7%) |
| 45 to 59 Minutes | 461 (4.8%) | 475 (6.0%) |
| 60 to 89 Minutes | 324 (3.4%) | 154 (2.0%) |
| 90 or more Minutes | 185 (1.9%) | 90 (1.1%) |
Time of Departure to Work by Sex in Steele County
The most frequent times of departure to work in Steele County are 7:00 AM to 7:29 AM (1,422, 14.8%) for males and 7:30 AM to 7:59 AM (1,628, 20.7%) for females.
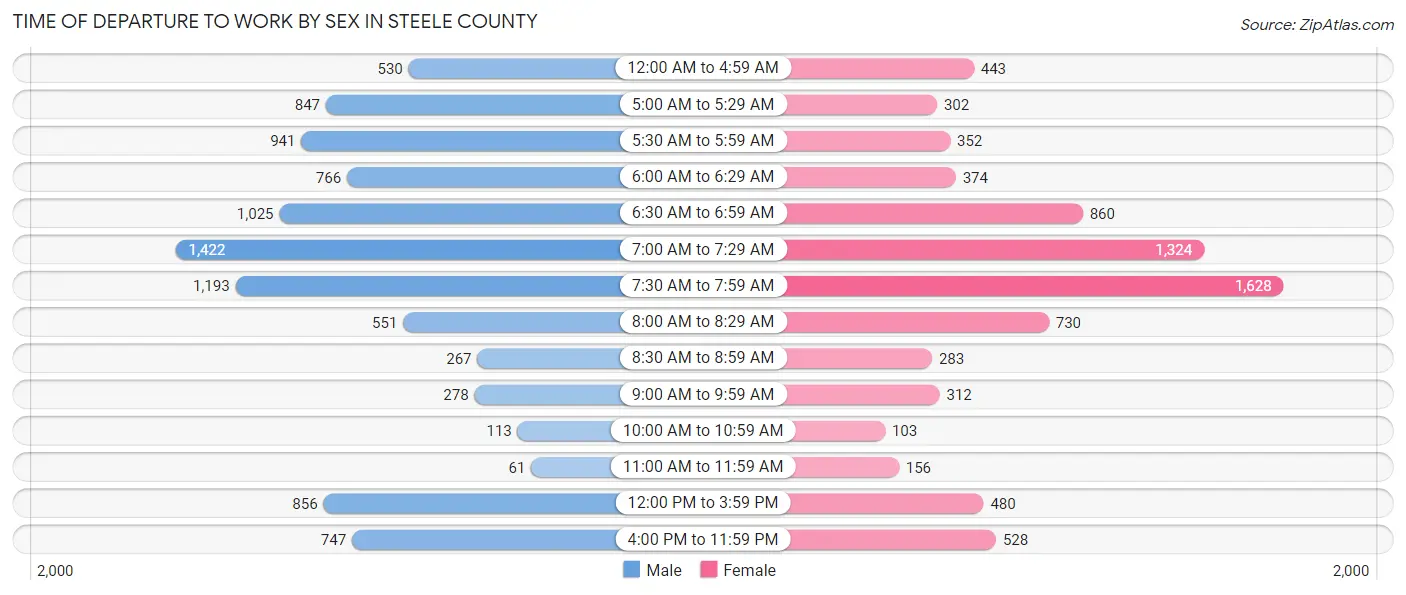
| Time of Departure | Male | Female |
| 12:00 AM to 4:59 AM | 530 (5.5%) | 443 (5.6%) |
| 5:00 AM to 5:29 AM | 847 (8.8%) | 302 (3.8%) |
| 5:30 AM to 5:59 AM | 941 (9.8%) | 352 (4.5%) |
| 6:00 AM to 6:29 AM | 766 (8.0%) | 374 (4.8%) |
| 6:30 AM to 6:59 AM | 1,025 (10.7%) | 860 (10.9%) |
| 7:00 AM to 7:29 AM | 1,422 (14.8%) | 1,324 (16.8%) |
| 7:30 AM to 7:59 AM | 1,193 (12.4%) | 1,628 (20.7%) |
| 8:00 AM to 8:29 AM | 551 (5.7%) | 730 (9.3%) |
| 8:30 AM to 8:59 AM | 267 (2.8%) | 283 (3.6%) |
| 9:00 AM to 9:59 AM | 278 (2.9%) | 312 (4.0%) |
| 10:00 AM to 10:59 AM | 113 (1.2%) | 103 (1.3%) |
| 11:00 AM to 11:59 AM | 61 (0.6%) | 156 (2.0%) |
| 12:00 PM to 3:59 PM | 856 (8.9%) | 480 (6.1%) |
| 4:00 PM to 11:59 PM | 747 (7.8%) | 528 (6.7%) |
| Total | 9,597 (100.0%) | 7,875 (100.0%) |
Housing Occupancy in Steele County
Occupancy by Ownership in Steele County
Of the total 15,011 dwellings in Steele County, owner-occupied units account for 11,624 (77.4%), while renter-occupied units make up 3,387 (22.6%).
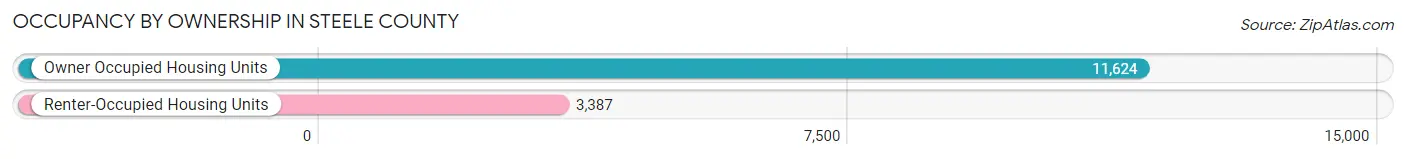
| Occupancy | # Housing Units | % Housing Units |
| Owner Occupied Housing Units | 11,624 | 77.4% |
| Renter-Occupied Housing Units | 3,387 | 22.6% |
| Total Occupied Housing Units | 15,011 | 100.0% |
Occupancy by Household Size in Steele County
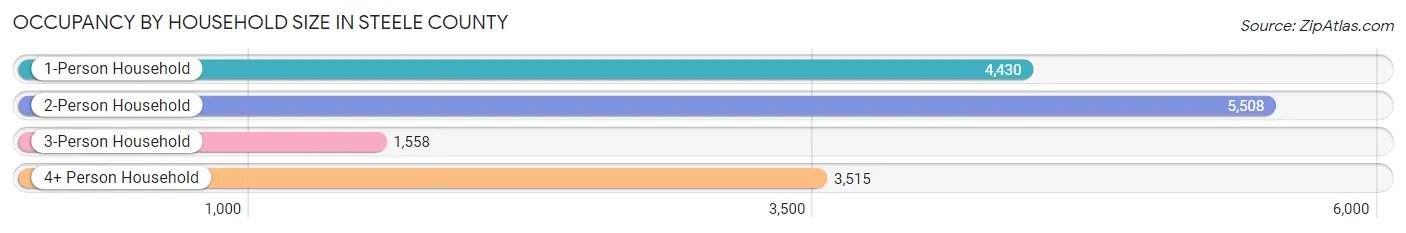
| Household Size | # Housing Units | % Housing Units |
| 1-Person Household | 4,430 | 29.5% |
| 2-Person Household | 5,508 | 36.7% |
| 3-Person Household | 1,558 | 10.4% |
| 4+ Person Household | 3,515 | 23.4% |
| Total Housing Units | 15,011 | 100.0% |
Occupancy by Ownership by Household Size in Steele County
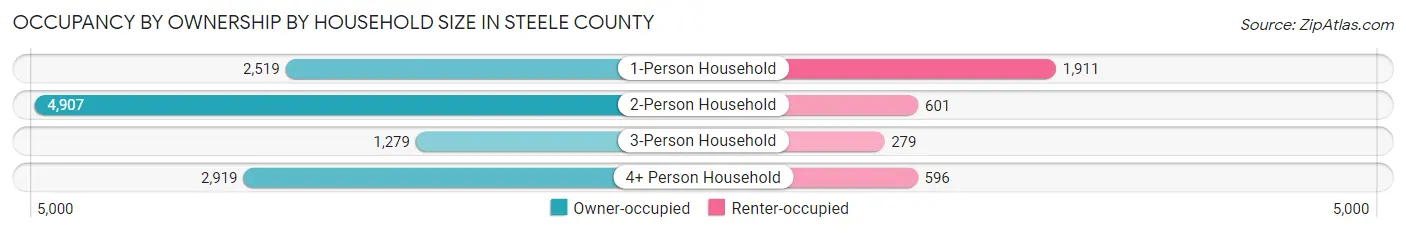
| Household Size | Owner-occupied | Renter-occupied |
| 1-Person Household | 2,519 (56.9%) | 1,911 (43.1%) |
| 2-Person Household | 4,907 (89.1%) | 601 (10.9%) |
| 3-Person Household | 1,279 (82.1%) | 279 (17.9%) |
| 4+ Person Household | 2,919 (83.0%) | 596 (17.0%) |
| Total Housing Units | 11,624 (77.4%) | 3,387 (22.6%) |
Occupancy by Educational Attainment in Steele County
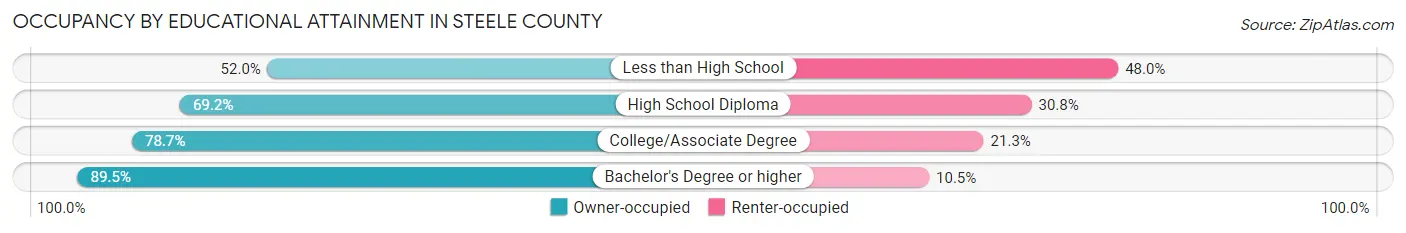
| Household Size | Owner-occupied | Renter-occupied |
| Less than High School | 504 (52.0%) | 465 (48.0%) |
| High School Diploma | 2,935 (69.2%) | 1,307 (30.8%) |
| College/Associate Degree | 4,265 (78.7%) | 1,155 (21.3%) |
| Bachelor's Degree or higher | 3,920 (89.5%) | 460 (10.5%) |
Occupancy by Age of Householder in Steele County
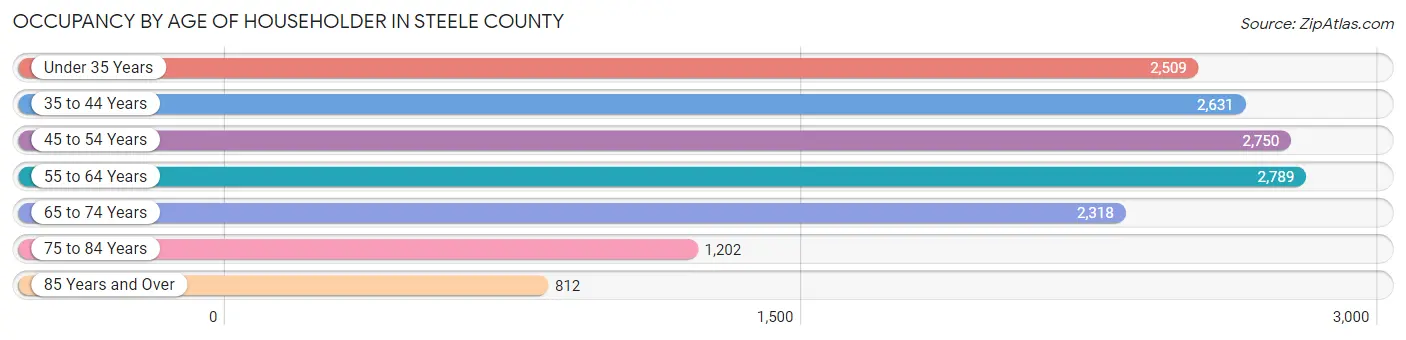
| Age Bracket | # Households | % Households |
| Under 35 Years | 2,509 | 16.7% |
| 35 to 44 Years | 2,631 | 17.5% |
| 45 to 54 Years | 2,750 | 18.3% |
| 55 to 64 Years | 2,789 | 18.6% |
| 65 to 74 Years | 2,318 | 15.4% |
| 75 to 84 Years | 1,202 | 8.0% |
| 85 Years and Over | 812 | 5.4% |
| Total | 15,011 | 100.0% |
Housing Finances in Steele County
Median Income by Occupancy in Steele County
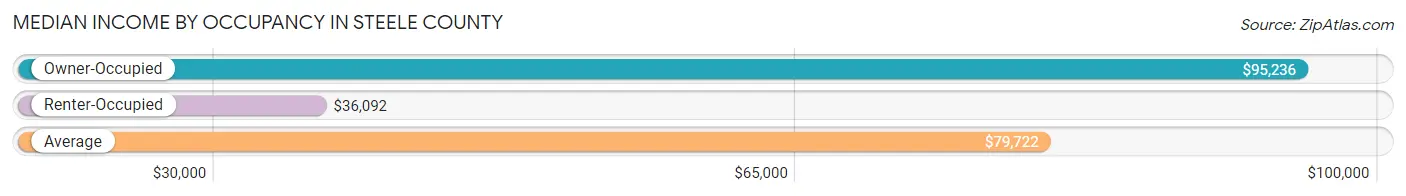
| Occupancy Type | # Households | Median Income |
| Owner-Occupied | 11,624 (77.4%) | $95,236 |
| Renter-Occupied | 3,387 (22.6%) | $36,092 |
| Average | 15,011 (100.0%) | $79,722 |
Occupancy by Householder Income Bracket in Steele County
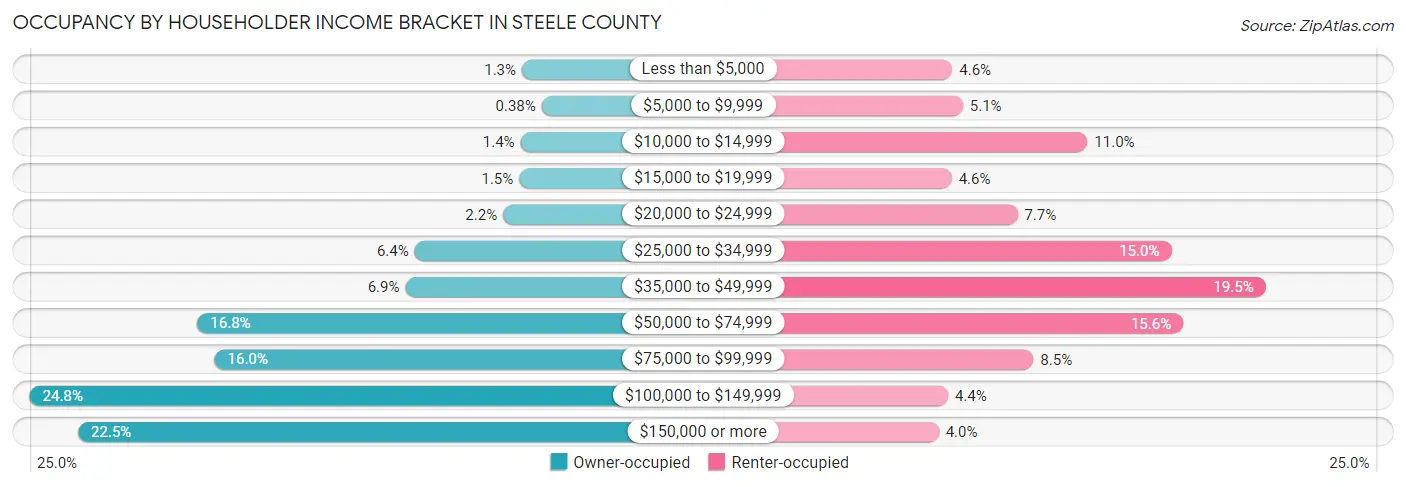
| Income Bracket | Owner-occupied | Renter-occupied |
| Less than $5,000 | 154 (1.3%) | 156 (4.6%) |
| $5,000 to $9,999 | 44 (0.4%) | 173 (5.1%) |
| $10,000 to $14,999 | 161 (1.4%) | 374 (11.0%) |
| $15,000 to $19,999 | 169 (1.5%) | 155 (4.6%) |
| $20,000 to $24,999 | 258 (2.2%) | 261 (7.7%) |
| $25,000 to $34,999 | 748 (6.4%) | 509 (15.0%) |
| $35,000 to $49,999 | 798 (6.9%) | 661 (19.5%) |
| $50,000 to $74,999 | 1,949 (16.8%) | 528 (15.6%) |
| $75,000 to $99,999 | 1,854 (16.0%) | 287 (8.5%) |
| $100,000 to $149,999 | 2,878 (24.8%) | 149 (4.4%) |
| $150,000 or more | 2,611 (22.5%) | 134 (4.0%) |
| Total | 11,624 (100.0%) | 3,387 (100.0%) |
Monthly Housing Cost Tiers in Steele County
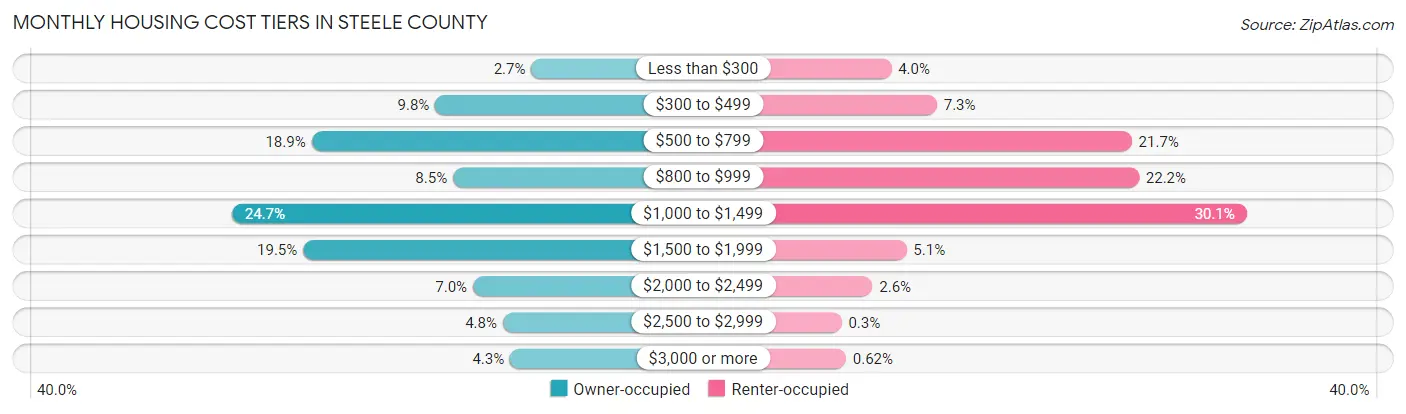
| Monthly Cost | Owner-occupied | Renter-occupied |
| Less than $300 | 311 (2.7%) | 134 (4.0%) |
| $300 to $499 | 1,134 (9.8%) | 248 (7.3%) |
| $500 to $799 | 2,194 (18.9%) | 734 (21.7%) |
| $800 to $999 | 982 (8.5%) | 752 (22.2%) |
| $1,000 to $1,499 | 2,876 (24.7%) | 1,021 (30.1%) |
| $1,500 to $1,999 | 2,266 (19.5%) | 172 (5.1%) |
| $2,000 to $2,499 | 811 (7.0%) | 87 (2.6%) |
| $2,500 to $2,999 | 556 (4.8%) | 10 (0.3%) |
| $3,000 or more | 494 (4.3%) | 21 (0.6%) |
| Total | 11,624 (100.0%) | 3,387 (100.0%) |
Physical Housing Characteristics in Steele County
Housing Structures in Steele County
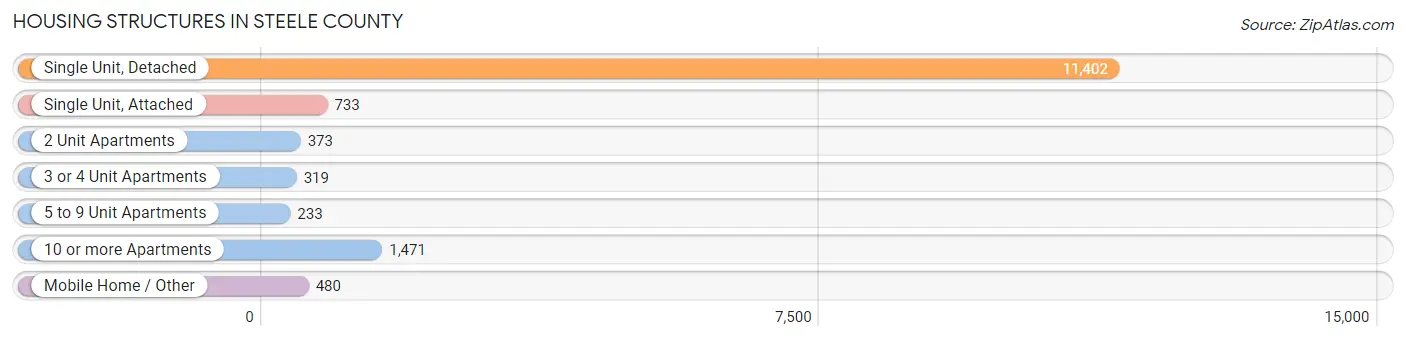
| Structure Type | # Housing Units | % Housing Units |
| Single Unit, Detached | 11,402 | 76.0% |
| Single Unit, Attached | 733 | 4.9% |
| 2 Unit Apartments | 373 | 2.5% |
| 3 or 4 Unit Apartments | 319 | 2.1% |
| 5 to 9 Unit Apartments | 233 | 1.5% |
| 10 or more Apartments | 1,471 | 9.8% |
| Mobile Home / Other | 480 | 3.2% |
| Total | 15,011 | 100.0% |
Housing Structures by Occupancy in Steele County
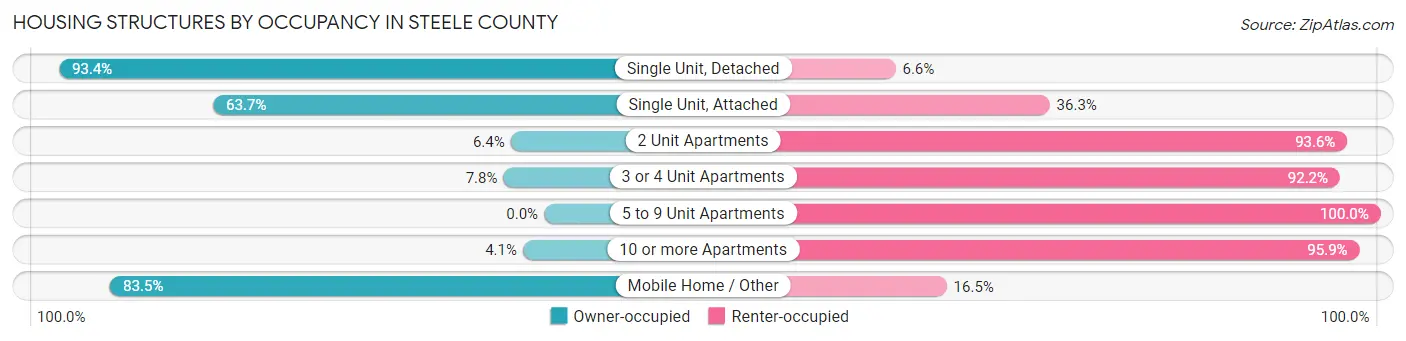
| Structure Type | Owner-occupied | Renter-occupied |
| Single Unit, Detached | 10,647 (93.4%) | 755 (6.6%) |
| Single Unit, Attached | 467 (63.7%) | 266 (36.3%) |
| 2 Unit Apartments | 24 (6.4%) | 349 (93.6%) |
| 3 or 4 Unit Apartments | 25 (7.8%) | 294 (92.2%) |
| 5 to 9 Unit Apartments | 0 (0.0%) | 233 (100.0%) |
| 10 or more Apartments | 60 (4.1%) | 1,411 (95.9%) |
| Mobile Home / Other | 401 (83.5%) | 79 (16.5%) |
| Total | 11,624 (77.4%) | 3,387 (22.6%) |
Housing Structures by Number of Rooms in Steele County
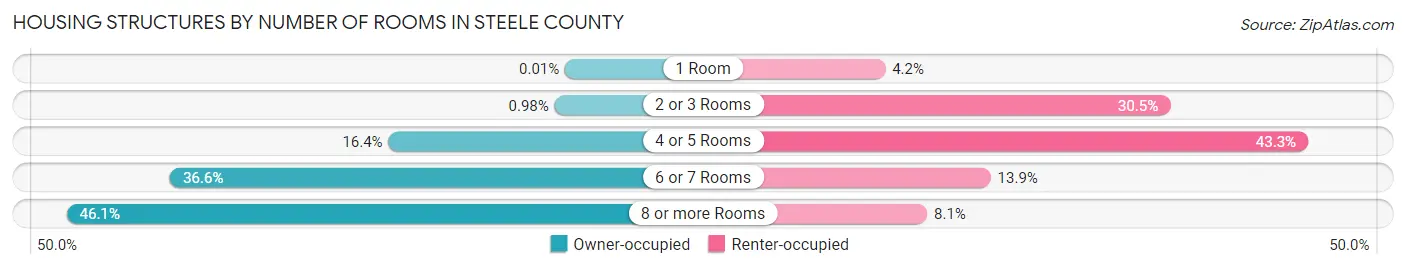
| Number of Rooms | Owner-occupied | Renter-occupied |
| 1 Room | 1 (0.0%) | 142 (4.2%) |
| 2 or 3 Rooms | 114 (1.0%) | 1,034 (30.5%) |
| 4 or 5 Rooms | 1,900 (16.4%) | 1,466 (43.3%) |
| 6 or 7 Rooms | 4,249 (36.5%) | 472 (13.9%) |
| 8 or more Rooms | 5,360 (46.1%) | 273 (8.1%) |
| Total | 11,624 (100.0%) | 3,387 (100.0%) |
Housing Structure by Heating Type in Steele County
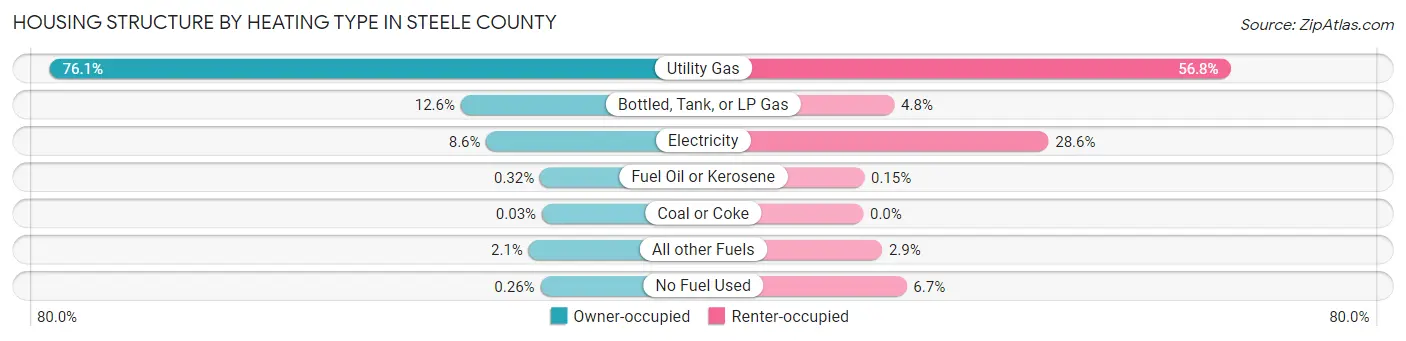
| Heating Type | Owner-occupied | Renter-occupied |
| Utility Gas | 8,848 (76.1%) | 1,923 (56.8%) |
| Bottled, Tank, or LP Gas | 1,461 (12.6%) | 163 (4.8%) |
| Electricity | 1,002 (8.6%) | 970 (28.6%) |
| Fuel Oil or Kerosene | 37 (0.3%) | 5 (0.2%) |
| Coal or Coke | 4 (0.0%) | 0 (0.0%) |
| All other Fuels | 242 (2.1%) | 99 (2.9%) |
| No Fuel Used | 30 (0.3%) | 227 (6.7%) |
| Total | 11,624 (100.0%) | 3,387 (100.0%) |
Household Vehicle Usage in Steele County
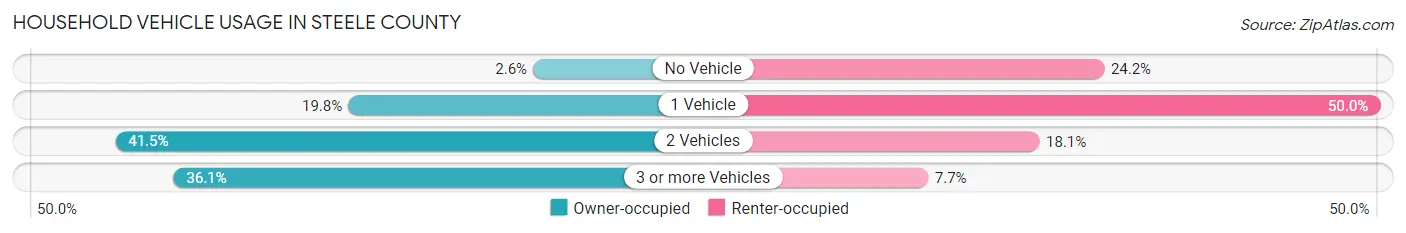
| Vehicles per Household | Owner-occupied | Renter-occupied |
| No Vehicle | 296 (2.5%) | 819 (24.2%) |
| 1 Vehicle | 2,303 (19.8%) | 1,692 (50.0%) |
| 2 Vehicles | 4,827 (41.5%) | 614 (18.1%) |
| 3 or more Vehicles | 4,198 (36.1%) | 262 (7.7%) |
| Total | 11,624 (100.0%) | 3,387 (100.0%) |
Real Estate & Mortgages in Steele County
Real Estate and Mortgage Overview in Steele County
| Characteristic | Without Mortgage | With Mortgage |
| Housing Units | 4,198 | 7,426 |
| Median Property Value | $207,000 | $223,400 |
| Median Household Income | $67,582 | $2,079 |
| Monthly Housing Costs | $612 | $486 |
| Real Estate Taxes | $2,611 | $167 |
Property Value by Mortgage Status in Steele County
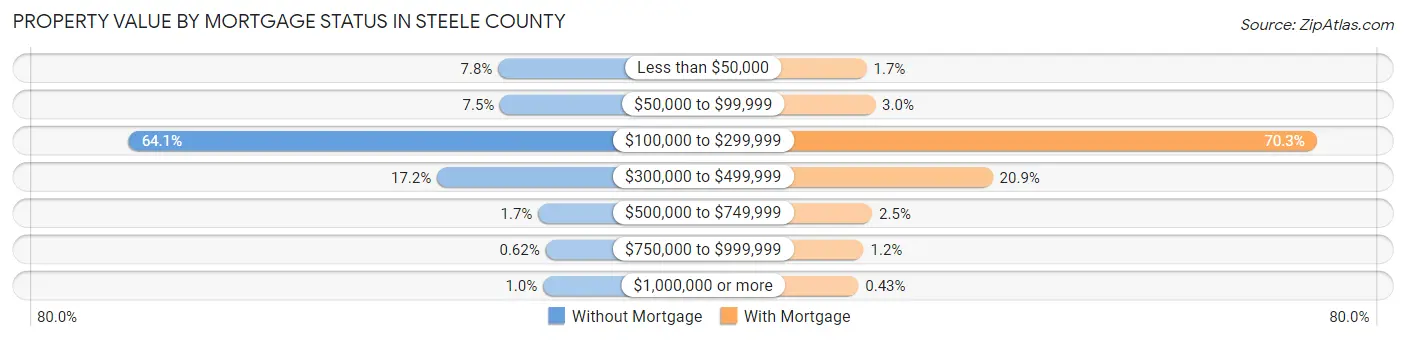
| Property Value | Without Mortgage | With Mortgage |
| Less than $50,000 | 329 (7.8%) | 125 (1.7%) |
| $50,000 to $99,999 | 316 (7.5%) | 222 (3.0%) |
| $100,000 to $299,999 | 2,692 (64.1%) | 5,217 (70.3%) |
| $300,000 to $499,999 | 720 (17.2%) | 1,551 (20.9%) |
| $500,000 to $749,999 | 73 (1.7%) | 188 (2.5%) |
| $750,000 to $999,999 | 26 (0.6%) | 91 (1.2%) |
| $1,000,000 or more | 42 (1.0%) | 32 (0.4%) |
| Total | 4,198 (100.0%) | 7,426 (100.0%) |
Household Income by Mortgage Status in Steele County
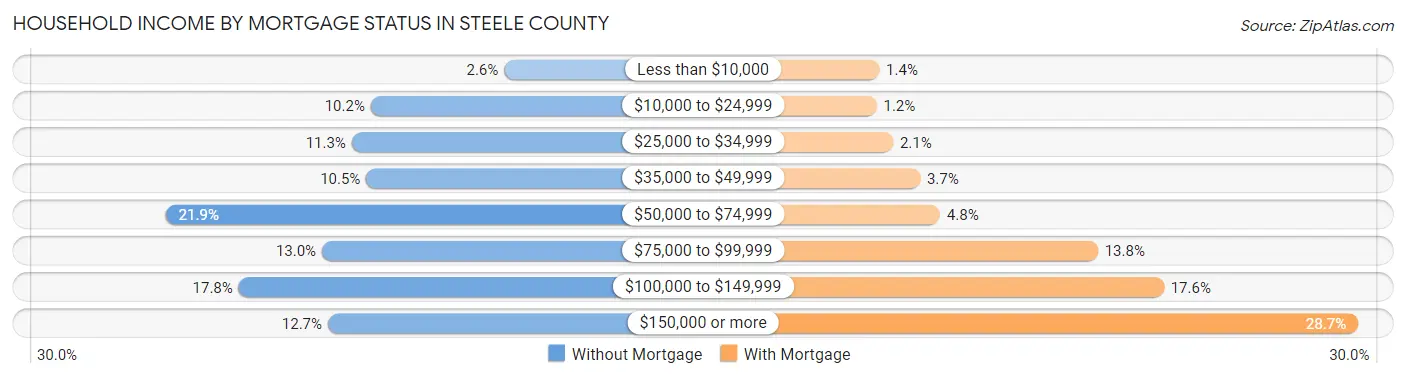
| Household Income | Without Mortgage | With Mortgage |
| Less than $10,000 | 109 (2.6%) | 100 (1.3%) |
| $10,000 to $24,999 | 429 (10.2%) | 89 (1.2%) |
| $25,000 to $34,999 | 475 (11.3%) | 159 (2.1%) |
| $35,000 to $49,999 | 440 (10.5%) | 273 (3.7%) |
| $50,000 to $74,999 | 921 (21.9%) | 358 (4.8%) |
| $75,000 to $99,999 | 546 (13.0%) | 1,028 (13.8%) |
| $100,000 to $149,999 | 746 (17.8%) | 1,308 (17.6%) |
| $150,000 or more | 532 (12.7%) | 2,132 (28.7%) |
| Total | 4,198 (100.0%) | 7,426 (100.0%) |
Property Value to Household Income Ratio in Steele County
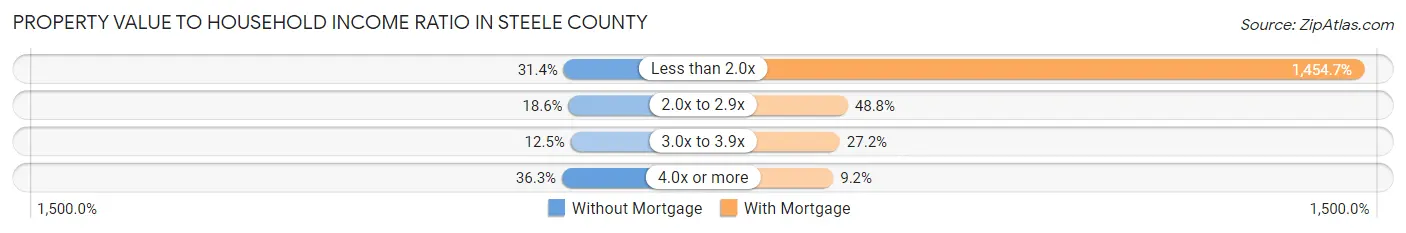
| Value-to-Income Ratio | Without Mortgage | With Mortgage |
| Less than 2.0x | 1,317 (31.4%) | 108,026 (1,454.7%) |
| 2.0x to 2.9x | 781 (18.6%) | 3,626 (48.8%) |
| 3.0x to 3.9x | 524 (12.5%) | 2,022 (27.2%) |
| 4.0x or more | 1,522 (36.3%) | 683 (9.2%) |
| Total | 4,198 (100.0%) | 7,426 (100.0%) |
Real Estate Taxes by Mortgage Status in Steele County
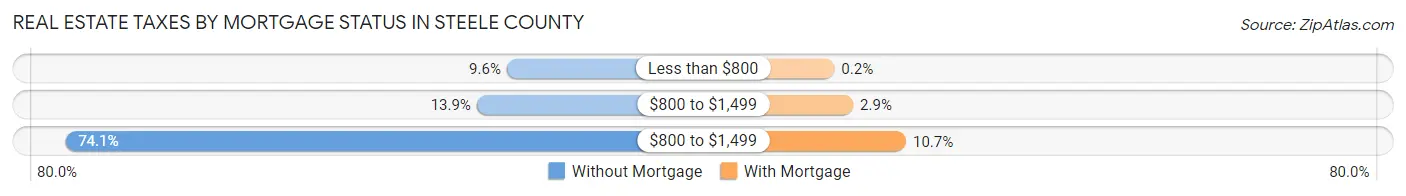
| Property Taxes | Without Mortgage | With Mortgage |
| Less than $800 | 401 (9.6%) | 15 (0.2%) |
| $800 to $1,499 | 585 (13.9%) | 218 (2.9%) |
| $800 to $1,499 | 3,109 (74.1%) | 792 (10.7%) |
| Total | 4,198 (100.0%) | 7,426 (100.0%) |
Health & Disability in Steele County
Health Insurance Coverage by Age in Steele County
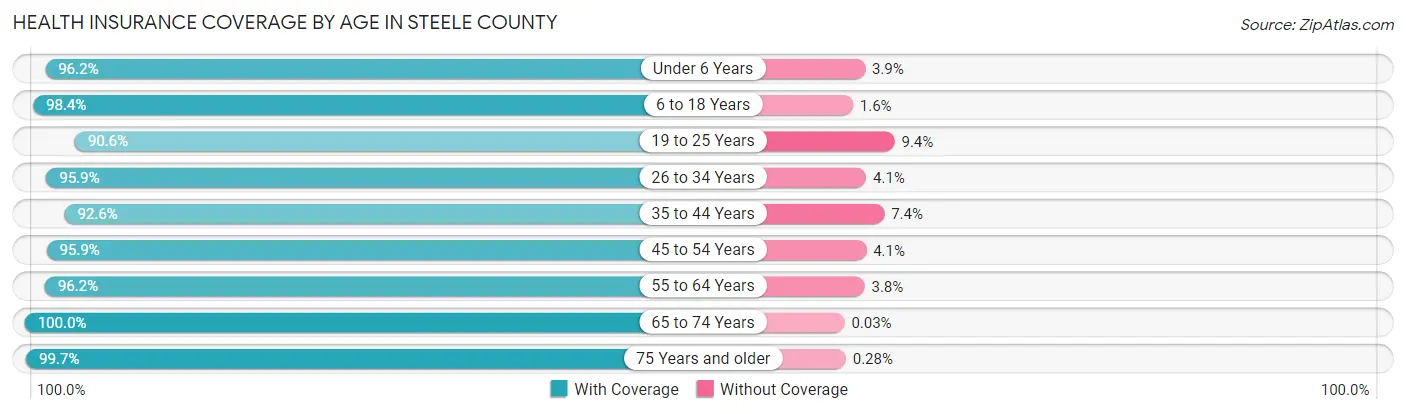
| Age Bracket | With Coverage | Without Coverage |
| Under 6 Years | 2,572 (96.2%) | 103 (3.8%) |
| 6 to 18 Years | 6,950 (98.4%) | 112 (1.6%) |
| 19 to 25 Years | 2,514 (90.6%) | 260 (9.4%) |
| 26 to 34 Years | 3,642 (95.9%) | 154 (4.1%) |
| 35 to 44 Years | 4,314 (92.6%) | 347 (7.4%) |
| 45 to 54 Years | 4,281 (95.9%) | 182 (4.1%) |
| 55 to 64 Years | 4,747 (96.2%) | 186 (3.8%) |
| 65 to 74 Years | 3,805 (100.0%) | 1 (0.0%) |
| 75 Years and older | 2,810 (99.7%) | 8 (0.3%) |
| Total | 35,635 (96.3%) | 1,353 (3.7%) |
Health Insurance Coverage by Citizenship Status in Steele County
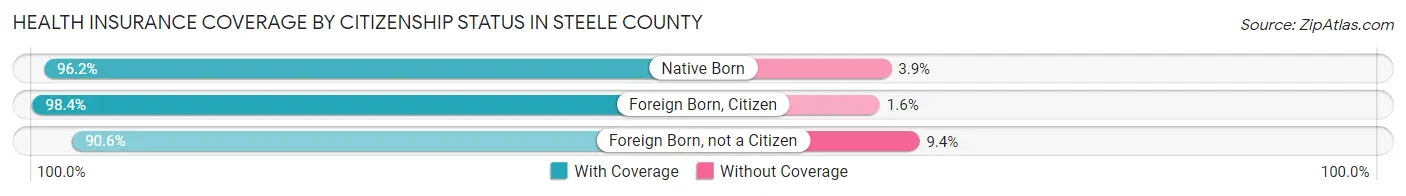
| Citizenship Status | With Coverage | Without Coverage |
| Native Born | 2,572 (96.2%) | 103 (3.8%) |
| Foreign Born, Citizen | 6,950 (98.4%) | 112 (1.6%) |
| Foreign Born, not a Citizen | 2,514 (90.6%) | 260 (9.4%) |
Health Insurance Coverage by Household Income in Steele County
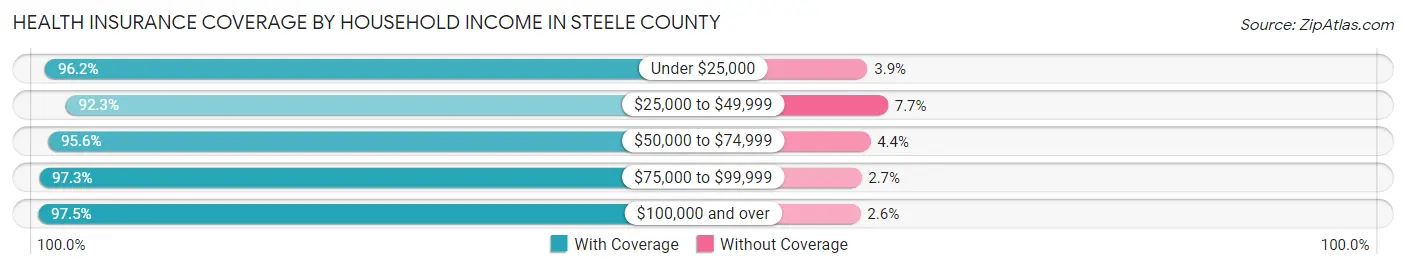
| Household Income | With Coverage | Without Coverage |
| Under $25,000 | 2,723 (96.2%) | 109 (3.8%) |
| $25,000 to $49,999 | 4,553 (92.3%) | 379 (7.7%) |
| $50,000 to $74,999 | 5,614 (95.6%) | 258 (4.4%) |
| $75,000 to $99,999 | 5,634 (97.3%) | 157 (2.7%) |
| $100,000 and over | 16,940 (97.5%) | 444 (2.5%) |
Public vs Private Health Insurance Coverage by Age in Steele County
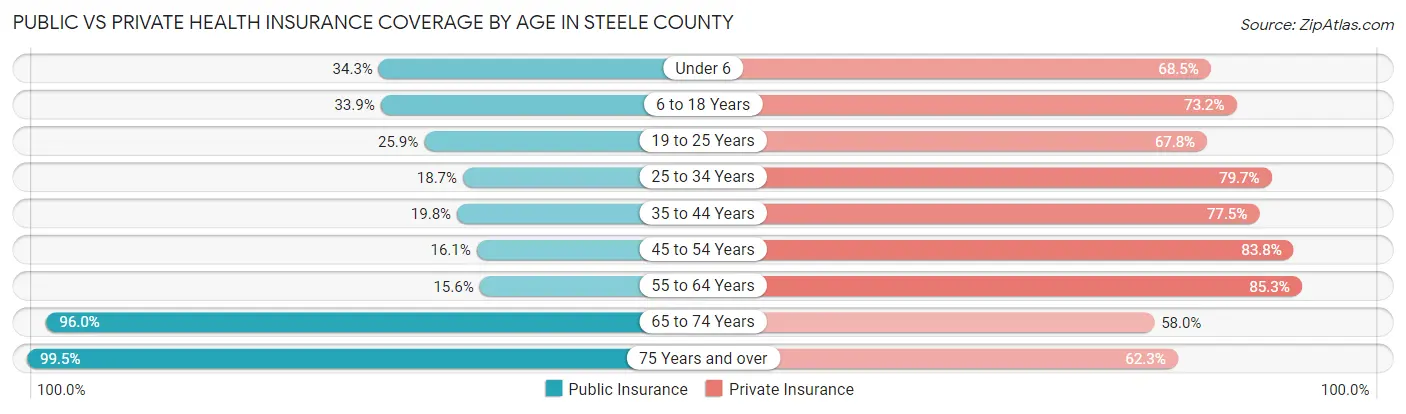
| Age Bracket | Public Insurance | Private Insurance |
| Under 6 | 917 (34.3%) | 1,831 (68.4%) |
| 6 to 18 Years | 2,397 (33.9%) | 5,171 (73.2%) |
| 19 to 25 Years | 717 (25.9%) | 1,880 (67.8%) |
| 25 to 34 Years | 708 (18.6%) | 3,026 (79.7%) |
| 35 to 44 Years | 921 (19.8%) | 3,610 (77.4%) |
| 45 to 54 Years | 719 (16.1%) | 3,742 (83.8%) |
| 55 to 64 Years | 768 (15.6%) | 4,209 (85.3%) |
| 65 to 74 Years | 3,652 (96.0%) | 2,207 (58.0%) |
| 75 Years and over | 2,805 (99.5%) | 1,756 (62.3%) |
| Total | 13,604 (36.8%) | 27,432 (74.2%) |
Disability Status by Sex by Age in Steele County
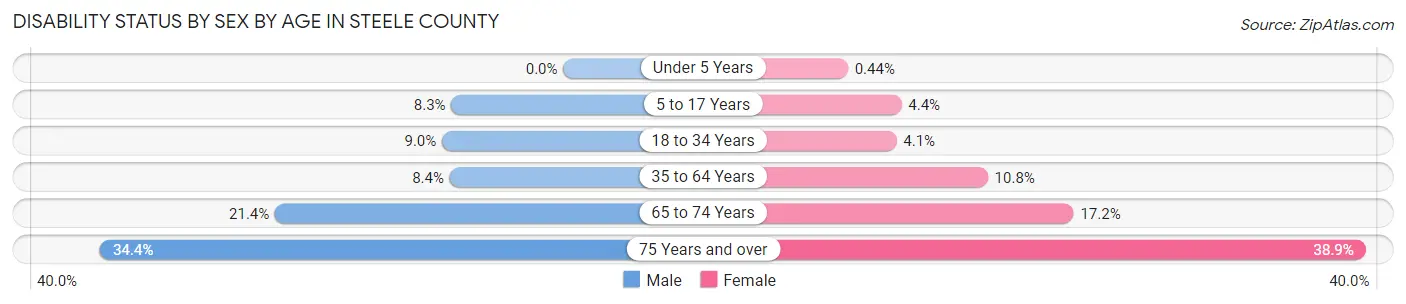
| Age Bracket | Male | Female |
| Under 5 Years | 0 (0.0%) | 5 (0.4%) |
| 5 to 17 Years | 291 (8.3%) | 155 (4.4%) |
| 18 to 34 Years | 346 (9.0%) | 133 (4.1%) |
| 35 to 64 Years | 609 (8.4%) | 740 (10.8%) |
| 65 to 74 Years | 389 (21.4%) | 342 (17.2%) |
| 75 Years and over | 398 (34.4%) | 646 (38.9%) |
Disability Class by Sex by Age in Steele County
Disability Class: Hearing Difficulty
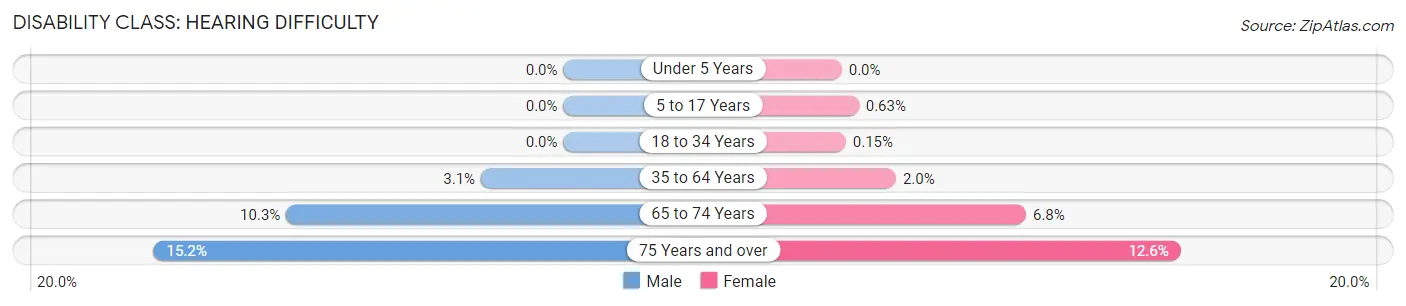
| Age Bracket | Male | Female |
| Under 5 Years | 0 (0.0%) | 0 (0.0%) |
| 5 to 17 Years | 0 (0.0%) | 22 (0.6%) |
| 18 to 34 Years | 0 (0.0%) | 5 (0.2%) |
| 35 to 64 Years | 221 (3.1%) | 137 (2.0%) |
| 65 to 74 Years | 187 (10.3%) | 136 (6.8%) |
| 75 Years and over | 176 (15.2%) | 209 (12.6%) |
Disability Class: Vision Difficulty
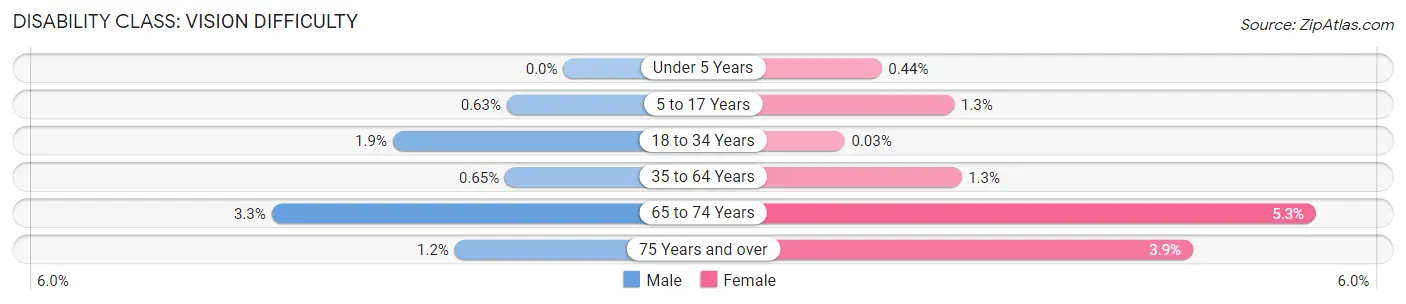
| Age Bracket | Male | Female |
| Under 5 Years | 0 (0.0%) | 5 (0.4%) |
| 5 to 17 Years | 22 (0.6%) | 44 (1.3%) |
| 18 to 34 Years | 73 (1.9%) | 1 (0.0%) |
| 35 to 64 Years | 47 (0.6%) | 91 (1.3%) |
| 65 to 74 Years | 59 (3.3%) | 105 (5.3%) |
| 75 Years and over | 14 (1.2%) | 65 (3.9%) |
Disability Class: Cognitive Difficulty
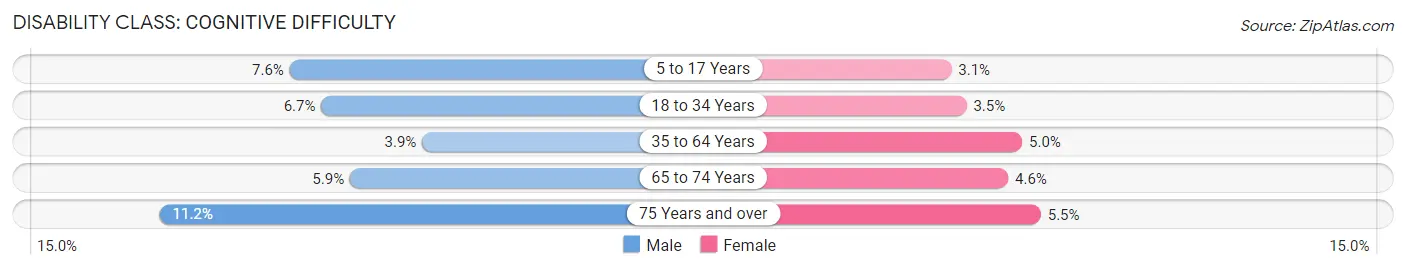
| Age Bracket | Male | Female |
| 5 to 17 Years | 267 (7.6%) | 107 (3.0%) |
| 18 to 34 Years | 259 (6.7%) | 114 (3.5%) |
| 35 to 64 Years | 284 (3.9%) | 343 (5.0%) |
| 65 to 74 Years | 108 (5.9%) | 92 (4.6%) |
| 75 Years and over | 130 (11.2%) | 92 (5.5%) |
Disability Class: Ambulatory Difficulty
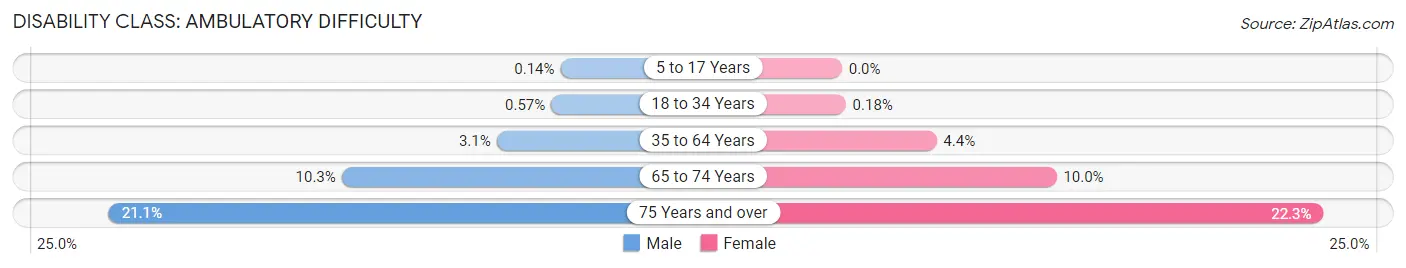
| Age Bracket | Male | Female |
| 5 to 17 Years | 5 (0.1%) | 0 (0.0%) |
| 18 to 34 Years | 22 (0.6%) | 6 (0.2%) |
| 35 to 64 Years | 224 (3.1%) | 300 (4.4%) |
| 65 to 74 Years | 187 (10.3%) | 198 (10.0%) |
| 75 Years and over | 244 (21.1%) | 371 (22.3%) |
Disability Class: Self-Care Difficulty
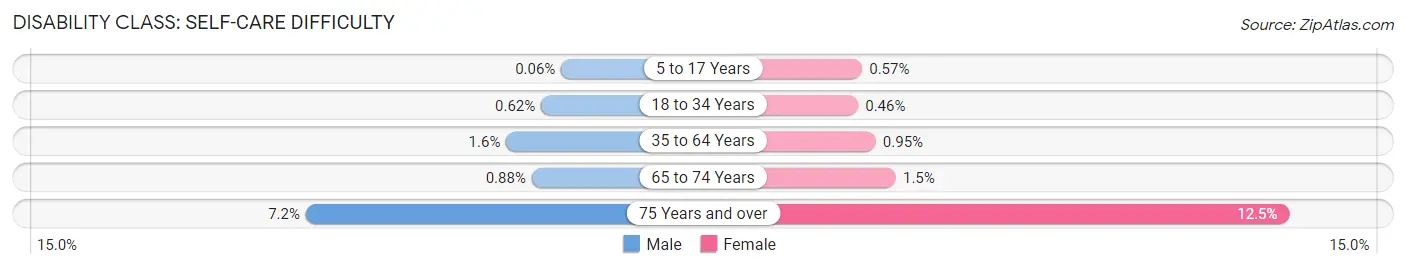
| Age Bracket | Male | Female |
| 5 to 17 Years | 2 (0.1%) | 20 (0.6%) |
| 18 to 34 Years | 24 (0.6%) | 15 (0.5%) |
| 35 to 64 Years | 115 (1.6%) | 65 (0.9%) |
| 65 to 74 Years | 16 (0.9%) | 30 (1.5%) |
| 75 Years and over | 83 (7.2%) | 207 (12.5%) |
Technology Access in Steele County
Computing Device Access in Steele County
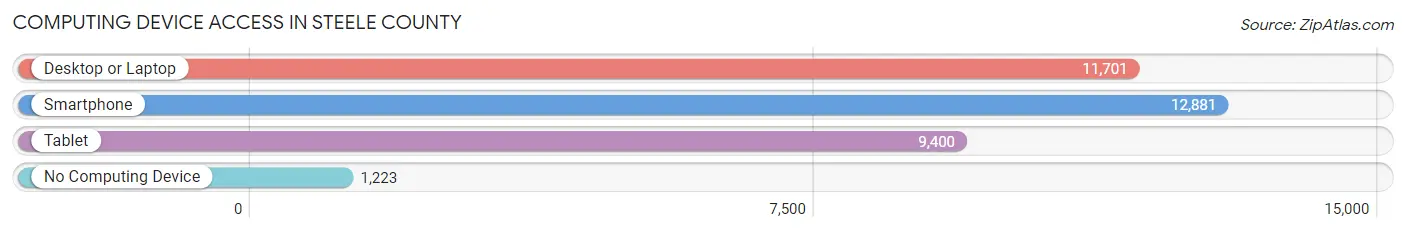
| Device Type | # Households | % Households |
| Desktop or Laptop | 11,701 | 77.9% |
| Smartphone | 12,881 | 85.8% |
| Tablet | 9,400 | 62.6% |
| No Computing Device | 1,223 | 8.2% |
| Total | 15,011 | 100.0% |
Internet Access in Steele County
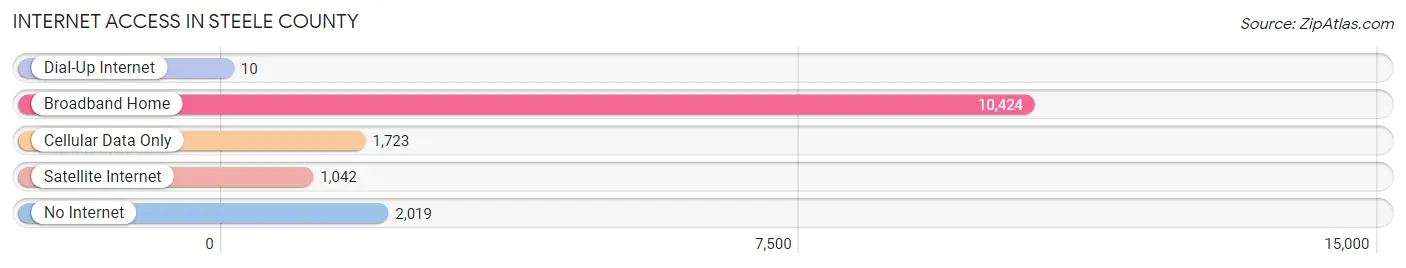
| Internet Type | # Households | % Households |
| Dial-Up Internet | 10 | 0.1% |
| Broadband Home | 10,424 | 69.4% |
| Cellular Data Only | 1,723 | 11.5% |
| Satellite Internet | 1,042 | 6.9% |
| No Internet | 2,019 | 13.5% |
| Total | 15,011 | 100.0% |
Steele County Summary
Steele County is located in the southeastern corner of Minnesota, and is part of the Mankato-North Mankato Metropolitan Statistical Area. The county was established in 1855 and named after Franklin Steele, a prominent early settler. As of the 2010 census, the population was 36,576, making it the 25th most populous county in Minnesota.
Geography
Steele County covers an area of 576 square miles, making it the 25th largest county in Minnesota. It is bordered by Rice County to the north, Waseca County to the east, Freeborn County to the south, and Dodge and Goodhue counties to the west. The county is mostly flat, with rolling hills in the western part. The Straight River runs through the county, and there are several small lakes and ponds scattered throughout.
The county seat is Owatonna, which is also the largest city in the county. Other cities in the county include Medford, Ellendale, Claremont, and Blooming Prairie.
Economy
Steele County has a diverse economy, with a mix of manufacturing, agriculture, and services. The largest employers in the county are the Owatonna Public Schools, Federated Insurance, and the Mayo Clinic Health System.
Agriculture is a major part of the economy, with corn, soybeans, and wheat being the main crops. Livestock production is also important, with beef and dairy cattle, hogs, and poultry being raised in the county.
Manufacturing is also a major part of the economy, with companies such as Federated Insurance, Owatonna Tool Company, and Owatonna Manufacturing Company providing jobs.
Demographics
As of the 2010 census, there were 36,576 people, 13,845 households, and 9,717 families living in Steele County. The population density was 63.3 people per square mile. The racial makeup of the county was 94.2% White, 1.3% African American, 0.5% Native American, 1.7% Asian, 0.1% Pacific Islander, 1.2% from other races, and 1.1% from two or more races. Hispanic or Latino of any race were 3.2% of the population.
The median income for a household in the county was $54,945, and the median income for a family was $66,945. The per capita income for the county was $25,945. About 5.2% of families and 8.2% of the population were below the poverty line, including 10.2% of those under age 18 and 6.2% of those age 65 or over.
Conclusion
Steele County is a diverse and vibrant county in southeastern Minnesota. It has a mix of agriculture, manufacturing, and services that provide jobs and economic stability. The population is diverse, with a mix of races and ethnicities. The median income is higher than the state average, and the poverty rate is lower than the state average. Steele County is a great place to live, work, and raise a family.
Common Questions
What is the Total Population of Steele County?
Total Population of Steele County is 37,396.
What is the Total Male Population of Steele County?
Total Male Population of Steele County is 18,799.
What is the Total Female Population of Steele County?
Total Female Population of Steele County is 18,597.
What is the Ratio of Males per 100 Females in Steele County?
There are 101.09 Males per 100 Females in Steele County.
What is the Ratio of Females per 100 Males in Steele County?
There are 98.93 Females per 100 Males in Steele County.
What is the Median Population Age in Steele County?
Median Population Age in Steele County is 39.9 Years.
What is the Average Family Size in Steele County
Average Family Size in Steele County is 3.0 People.
What is the Average Household Size in Steele County
Average Household Size in Steele County is 2.5 People.
What is Per Capita Income in Steele County?
Per Capita income in Steele County is $40,146.
What is the Median Family Income in Steele County?
Median Family Income in Steele County is $102,451.
What is the Median Household income in Steele County?
Median Household Income in Steele County is $79,722.
What is Income or Wage Gap in Steele County?
Income or Wage Gap in Steele County is 30.6%.
Women in Steele County earn 69.4 cents for every dollar earned by a man.
What is Family Income Deficit in Steele County?
Family Income Deficit in Steele County is $10,451.
Families that are below poverty line in Steele County earn $10,451 less on average than the poverty threshold level.
What is Inequality or Gini Index in Steele County?
Inequality or Gini Index in Steele County is 0.43.
How Large is the Labor Force in Steele County?
There are 19,801 People in the Labor Forcein in Steele County.
What is the Percentage of People in the Labor Force in Steele County?
67.8% of People are in the Labor Force in Steele County.
What is the Unemployment Rate in Steele County?
Unemployment Rate in Steele County is 3.4%.