Sherburne County, MN
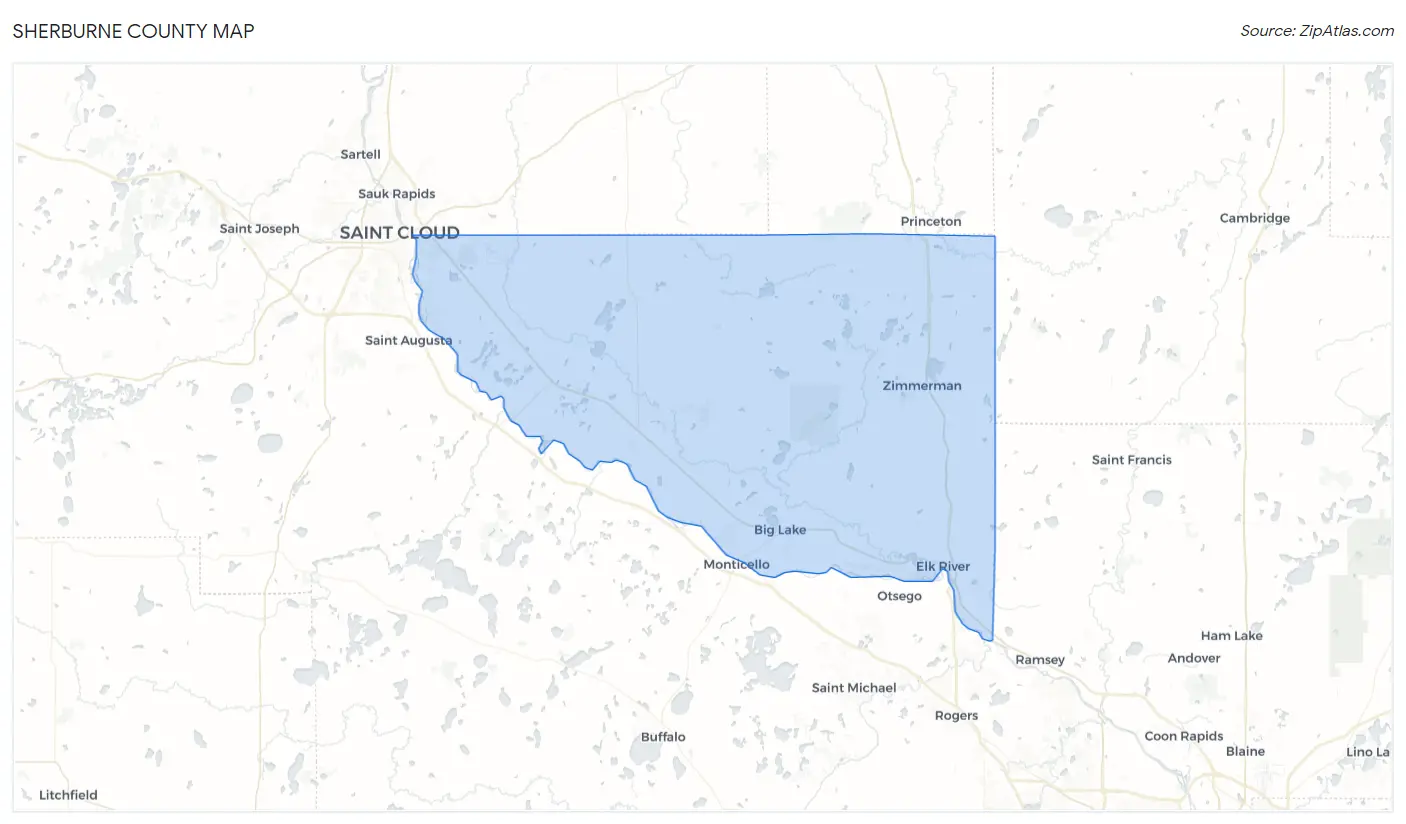
Sherburne County Map
Sherburne County Overview
97,820
TOTAL POPULATION
50,268
MALE POPULATION
47,552
FEMALE POPULATION
105.71
MALES / 100 FEMALES
94.60
FEMALES / 100 MALES
36.6
MEDIAN AGE
3.2
AVG FAMILY SIZE
2.8
AVG HOUSEHOLD SIZE
$41,412
PER CAPITA INCOME
$114,968
AVG FAMILY INCOME
$99,431
AVG HOUSEHOLD INCOME
24.9%
WAGE / INCOME GAP [ % ]
75.1¢/ $1
WAGE / INCOME GAP [ $ ]
$9,381
FAMILY INCOME DEFICIT
0.38
INEQUALITY / GINI INDEX
55,472
LABOR FORCE [ PEOPLE ]
73.5%
PERCENT IN LABOR FORCE
3.0%
UNEMPLOYMENT RATE
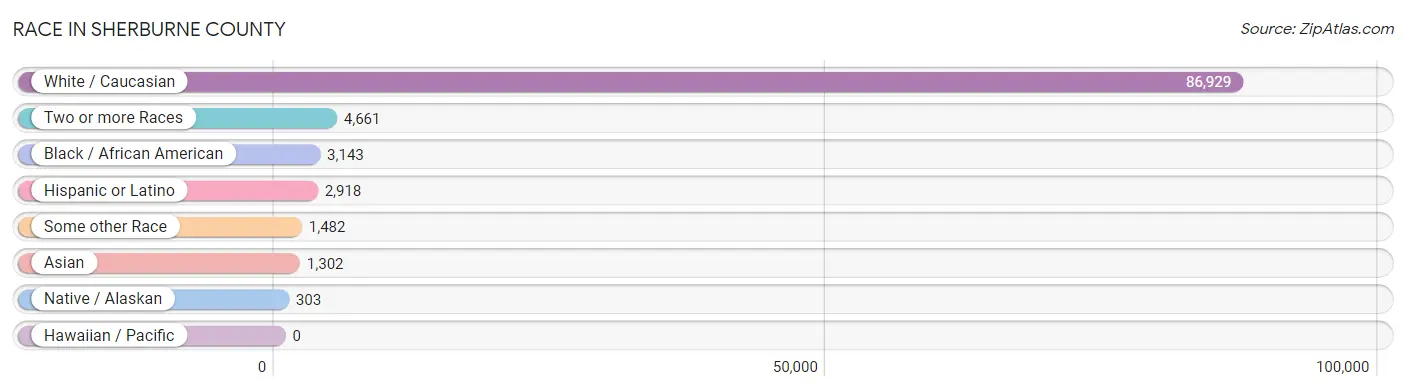
Race in Sherburne County
The most populous races in Sherburne County are White / Caucasian (86,929 | 88.9%), Two or more Races (4,661 | 4.8%), and Black / African American (3,143 | 3.2%).
| Race | # Population | % Population |
| Asian | 1,302 | 1.3% |
| Black / African American | 3,143 | 3.2% |
| Hawaiian / Pacific | 0 | 0.0% |
| Hispanic or Latino | 2,918 | 3.0% |
| Native / Alaskan | 303 | 0.3% |
| White / Caucasian | 86,929 | 88.9% |
| Two or more Races | 4,661 | 4.8% |
| Some other Race | 1,482 | 1.5% |
| Total | 97,820 | 100.0% |
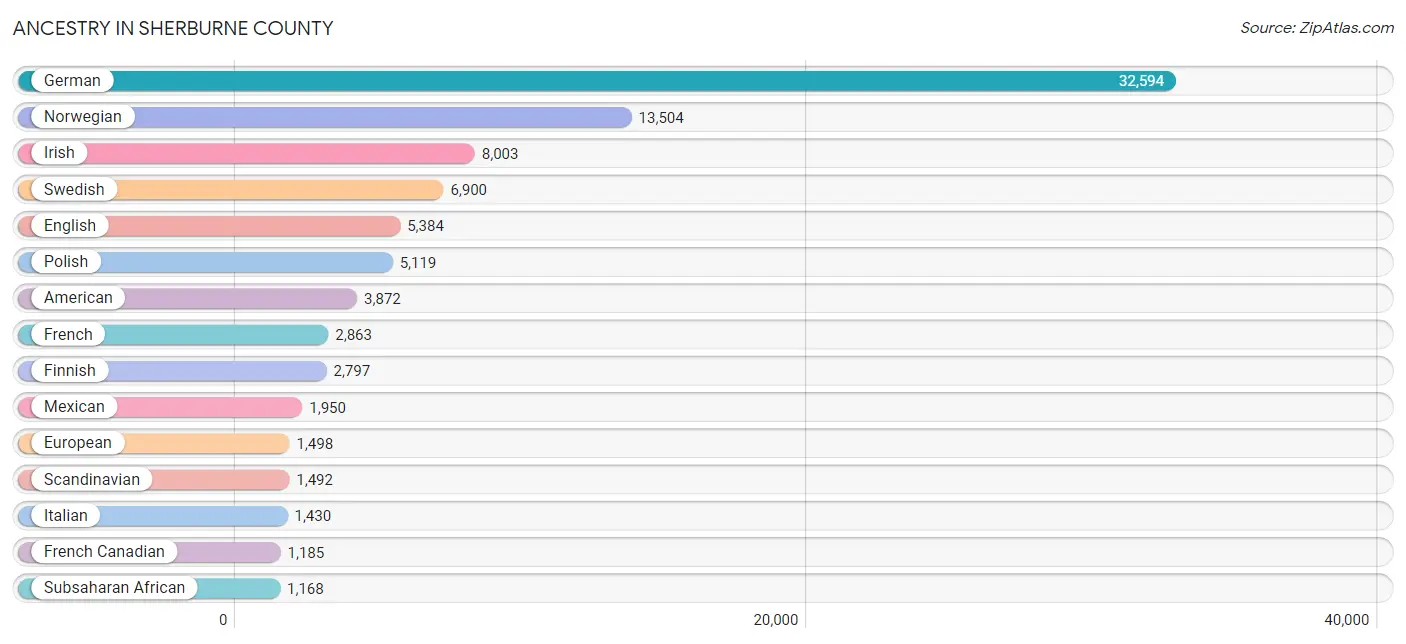
Ancestry in Sherburne County
The most populous ancestries reported in Sherburne County are German (32,594 | 33.3%), Norwegian (13,504 | 13.8%), Irish (8,003 | 8.2%), Swedish (6,900 | 7.0%), and English (5,384 | 5.5%), together accounting for 67.9% of all Sherburne County residents.
| Ancestry | # Population | % Population |
| African | 226 | 0.2% |
| Alaska Native | 9 | 0.0% |
| American | 3,872 | 4.0% |
| Arab | 132 | 0.1% |
| Australian | 4 | 0.0% |
| Austrian | 137 | 0.1% |
| Bangladeshi | 155 | 0.2% |
| Belgian | 83 | 0.1% |
| Bhutanese | 97 | 0.1% |
| Blackfeet | 63 | 0.1% |
| Bolivian | 7 | 0.0% |
| Brazilian | 7 | 0.0% |
| British | 250 | 0.3% |
| Bulgarian | 3 | 0.0% |
| Burmese | 247 | 0.3% |
| Canadian | 16 | 0.0% |
| Celtic | 3 | 0.0% |
| Central American | 201 | 0.2% |
| Central American Indian | 15 | 0.0% |
| Cherokee | 31 | 0.0% |
| Chippewa | 843 | 0.9% |
| Colombian | 16 | 0.0% |
| Costa Rican | 42 | 0.0% |
| Croatian | 38 | 0.0% |
| Cuban | 57 | 0.1% |
| Czech | 923 | 0.9% |
| Czechoslovakian | 177 | 0.2% |
| Danish | 1,062 | 1.1% |
| Dominican | 101 | 0.1% |
| Dutch | 703 | 0.7% |
| Eastern European | 89 | 0.1% |
| Egyptian | 4 | 0.0% |
| English | 5,384 | 5.5% |
| Ethiopian | 24 | 0.0% |
| European | 1,498 | 1.5% |
| Filipino | 31 | 0.0% |
| Finnish | 2,797 | 2.9% |
| French | 2,863 | 2.9% |
| French Canadian | 1,185 | 1.2% |
| German | 32,594 | 33.3% |
| German Russian | 24 | 0.0% |
| Greek | 103 | 0.1% |
| Guatemalan | 47 | 0.1% |
| Honduran | 23 | 0.0% |
| Hungarian | 121 | 0.1% |
| Icelander | 1 | 0.0% |
| Indian (Asian) | 426 | 0.4% |
| Iraqi | 52 | 0.1% |
| Irish | 8,003 | 8.2% |
| Italian | 1,430 | 1.5% |
| Japanese | 33 | 0.0% |
| Kenyan | 29 | 0.0% |
| Korean | 434 | 0.4% |
| Laotian | 11 | 0.0% |
| Latvian | 15 | 0.0% |
| Lebanese | 18 | 0.0% |
| Liberian | 45 | 0.1% |
| Luxembourger | 12 | 0.0% |
| Malaysian | 121 | 0.1% |
| Mexican | 1,950 | 2.0% |
| Mexican American Indian | 2 | 0.0% |
| Moroccan | 3 | 0.0% |
| Native Hawaiian | 64 | 0.1% |
| Navajo | 51 | 0.1% |
| Nicaraguan | 18 | 0.0% |
| Nigerian | 16 | 0.0% |
| Northern European | 280 | 0.3% |
| Norwegian | 13,504 | 13.8% |
| Pakistani | 99 | 0.1% |
| Pennsylvania German | 12 | 0.0% |
| Peruvian | 110 | 0.1% |
| Polish | 5,119 | 5.2% |
| Portuguese | 31 | 0.0% |
| Puerto Rican | 205 | 0.2% |
| Romanian | 16 | 0.0% |
| Russian | 479 | 0.5% |
| Salvadoran | 71 | 0.1% |
| Scandinavian | 1,492 | 1.5% |
| Scotch-Irish | 238 | 0.2% |
| Scottish | 748 | 0.8% |
| Sierra Leonean | 131 | 0.1% |
| Sioux | 81 | 0.1% |
| Slavic | 125 | 0.1% |
| Slovak | 42 | 0.0% |
| Slovene | 151 | 0.2% |
| Somali | 548 | 0.6% |
| South American | 234 | 0.2% |
| Spaniard | 13 | 0.0% |
| Spanish | 37 | 0.0% |
| Sri Lankan | 213 | 0.2% |
| Subsaharan African | 1,168 | 1.2% |
| Sudanese | 11 | 0.0% |
| Swedish | 6,900 | 7.0% |
| Swiss | 542 | 0.5% |
| Syrian | 7 | 0.0% |
| Thai | 159 | 0.2% |
| Turkish | 2 | 0.0% |
| Ugandan | 4 | 0.0% |
| Ukrainian | 294 | 0.3% |
| Vietnamese | 47 | 0.1% |
| Welsh | 327 | 0.3% |
| Yugoslavian | 17 | 0.0% | View All 102 Rows |
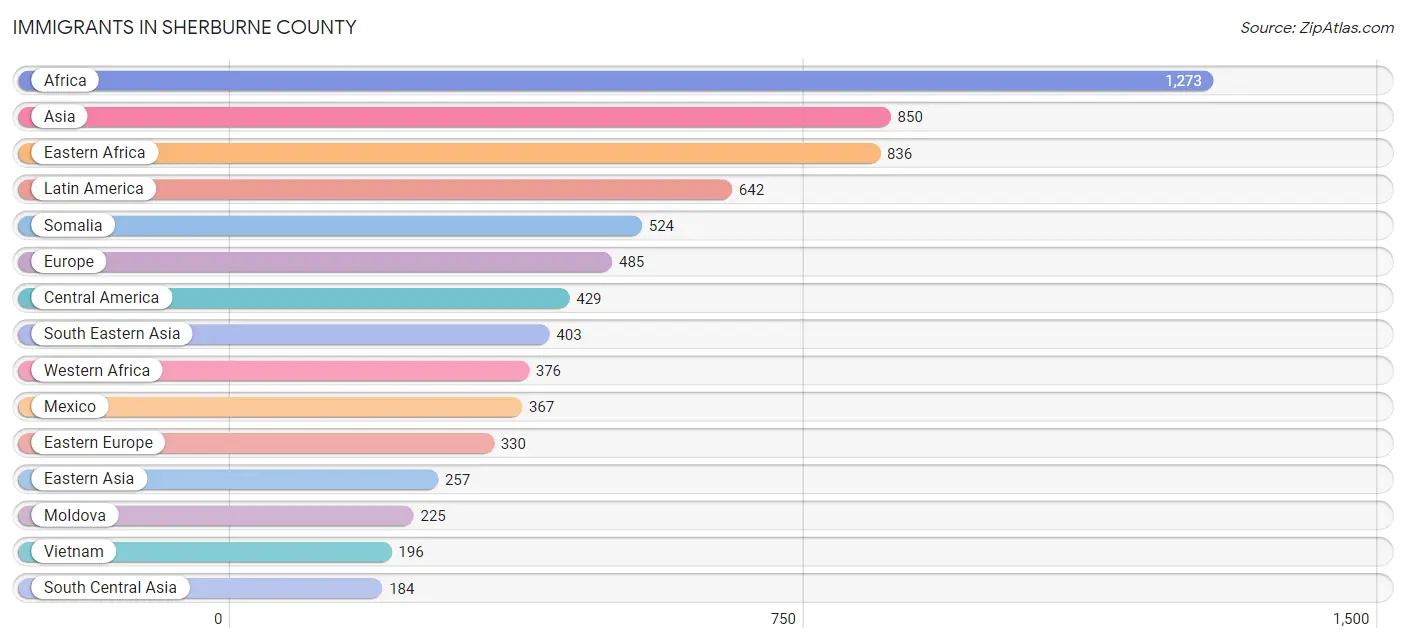
Immigrants in Sherburne County
The most numerous immigrant groups reported in Sherburne County came from Africa (1,273 | 1.3%), Asia (850 | 0.9%), Eastern Africa (836 | 0.9%), Latin America (642 | 0.7%), and Somalia (524 | 0.5%), together accounting for 4.2% of all Sherburne County residents.
| Immigration Origin | # Population | % Population |
| Africa | 1,273 | 1.3% |
| Asia | 850 | 0.9% |
| Bolivia | 7 | 0.0% |
| Brazil | 11 | 0.0% |
| Canada | 117 | 0.1% |
| Caribbean | 46 | 0.1% |
| Central America | 429 | 0.4% |
| China | 100 | 0.1% |
| Colombia | 17 | 0.0% |
| Czechoslovakia | 3 | 0.0% |
| Denmark | 2 | 0.0% |
| Dominican Republic | 46 | 0.1% |
| Eastern Africa | 836 | 0.9% |
| Eastern Asia | 257 | 0.3% |
| Eastern Europe | 330 | 0.3% |
| El Salvador | 13 | 0.0% |
| England | 45 | 0.1% |
| Ethiopia | 104 | 0.1% |
| Europe | 485 | 0.5% |
| Germany | 54 | 0.1% |
| Guatemala | 43 | 0.0% |
| Honduras | 6 | 0.0% |
| India | 100 | 0.1% |
| Iraq | 6 | 0.0% |
| Kenya | 159 | 0.2% |
| Korea | 157 | 0.2% |
| Laos | 53 | 0.1% |
| Latin America | 642 | 0.7% |
| Liberia | 20 | 0.0% |
| Mexico | 367 | 0.4% |
| Middle Africa | 37 | 0.0% |
| Moldova | 225 | 0.2% |
| Nepal | 11 | 0.0% |
| Netherlands | 3 | 0.0% |
| Nigeria | 91 | 0.1% |
| Northern Africa | 24 | 0.0% |
| Northern Europe | 98 | 0.1% |
| Peru | 129 | 0.1% |
| Philippines | 86 | 0.1% |
| Russia | 84 | 0.1% |
| Scotland | 3 | 0.0% |
| Sierra Leone | 131 | 0.1% |
| Somalia | 524 | 0.5% |
| South America | 167 | 0.2% |
| South Central Asia | 184 | 0.2% |
| South Eastern Asia | 403 | 0.4% |
| Sri Lanka | 69 | 0.1% |
| Sudan | 24 | 0.0% |
| Sweden | 20 | 0.0% |
| Taiwan | 24 | 0.0% |
| Thailand | 68 | 0.1% |
| Ukraine | 14 | 0.0% |
| Vietnam | 196 | 0.2% |
| Western Africa | 376 | 0.4% |
| Western Asia | 6 | 0.0% |
| Western Europe | 57 | 0.1% |
| Zaire | 37 | 0.0% | View All 57 Rows |
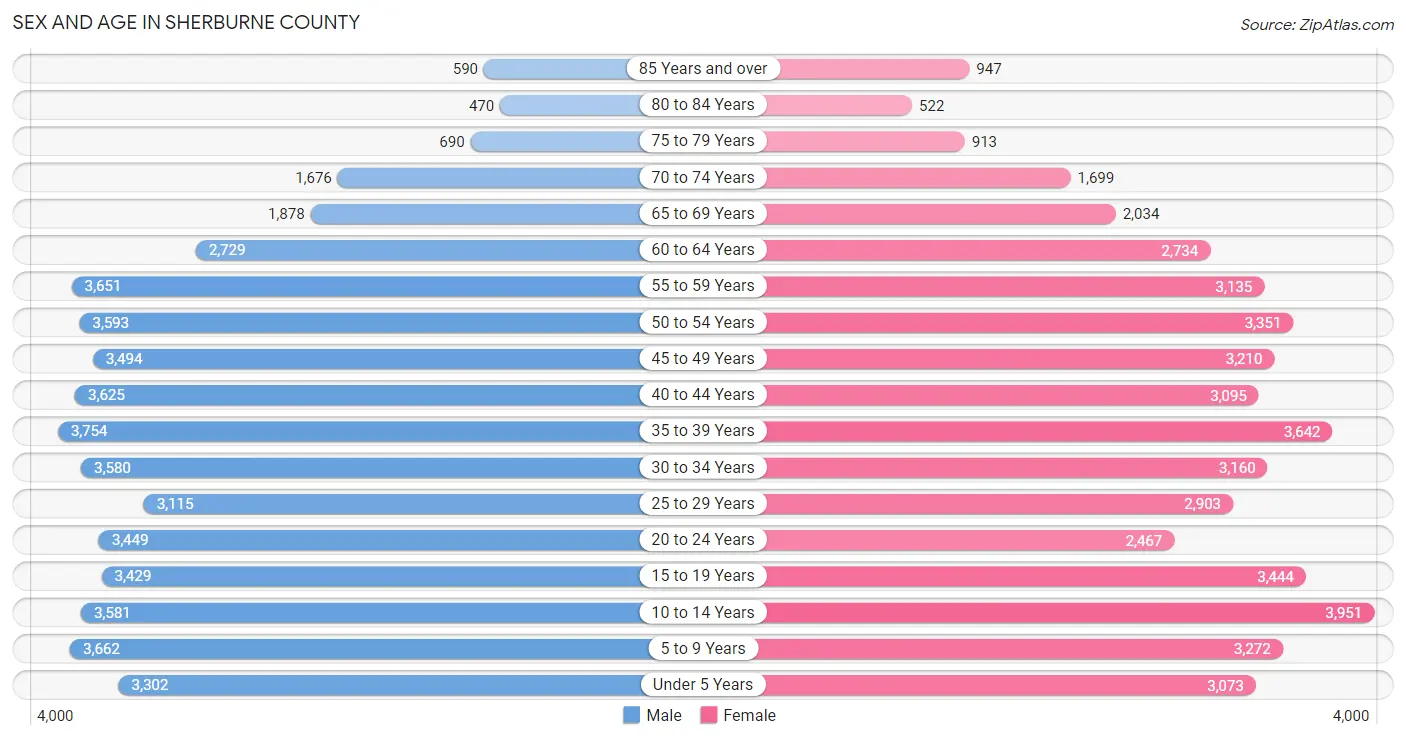
Sex and Age in Sherburne County
Sex and Age in Sherburne County
The most populous age groups in Sherburne County are 35 to 39 Years (3,754 | 7.5%) for men and 10 to 14 Years (3,951 | 8.3%) for women.
| Age Bracket | Male | Female |
| Under 5 Years | 3,302 (6.6%) | 3,073 (6.5%) |
| 5 to 9 Years | 3,662 (7.3%) | 3,272 (6.9%) |
| 10 to 14 Years | 3,581 (7.1%) | 3,951 (8.3%) |
| 15 to 19 Years | 3,429 (6.8%) | 3,444 (7.2%) |
| 20 to 24 Years | 3,449 (6.9%) | 2,467 (5.2%) |
| 25 to 29 Years | 3,115 (6.2%) | 2,903 (6.1%) |
| 30 to 34 Years | 3,580 (7.1%) | 3,160 (6.7%) |
| 35 to 39 Years | 3,754 (7.5%) | 3,642 (7.7%) |
| 40 to 44 Years | 3,625 (7.2%) | 3,095 (6.5%) |
| 45 to 49 Years | 3,494 (7.0%) | 3,210 (6.8%) |
| 50 to 54 Years | 3,593 (7.1%) | 3,351 (7.0%) |
| 55 to 59 Years | 3,651 (7.3%) | 3,135 (6.6%) |
| 60 to 64 Years | 2,729 (5.4%) | 2,734 (5.8%) |
| 65 to 69 Years | 1,878 (3.7%) | 2,034 (4.3%) |
| 70 to 74 Years | 1,676 (3.3%) | 1,699 (3.6%) |
| 75 to 79 Years | 690 (1.4%) | 913 (1.9%) |
| 80 to 84 Years | 470 (0.9%) | 522 (1.1%) |
| 85 Years and over | 590 (1.2%) | 947 (2.0%) |
| Total | 50,268 (100.0%) | 47,552 (100.0%) |
Families and Households in Sherburne County
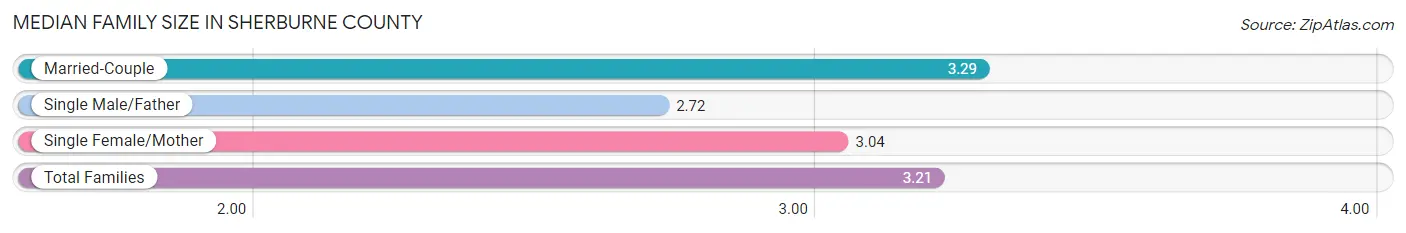
Median Family Size in Sherburne County
The median family size in Sherburne County is 3.21 persons per family, with married-couple families (19,721 | 78.3%) accounting for the largest median family size of 3.29 persons per family. On the other hand, single male/father families (2,259 | 9.0%) represent the smallest median family size with 2.72 persons per family.
| Family Type | # Families | Family Size |
| Married-Couple | 19,721 (78.3%) | 3.29 |
| Single Male/Father | 2,259 (9.0%) | 2.72 |
| Single Female/Mother | 3,200 (12.7%) | 3.04 |
| Total Families | 25,180 (100.0%) | 3.21 |
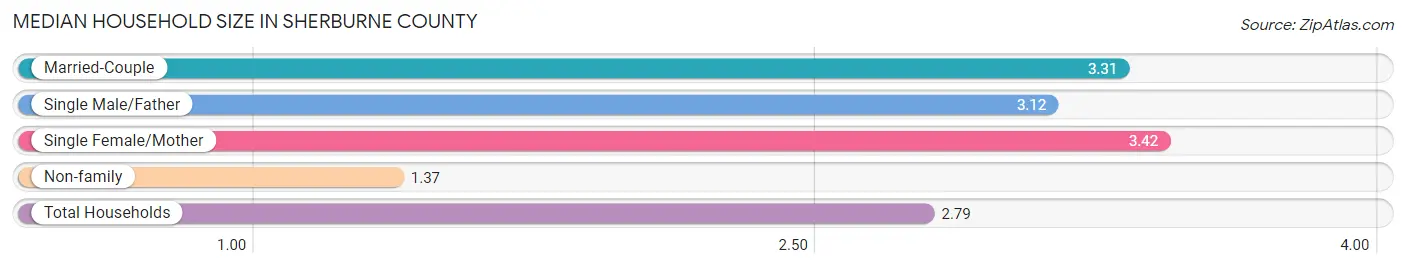
Median Household Size in Sherburne County
The median household size in Sherburne County is 2.79 persons per household, with single female/mother households (3,200 | 9.3%) accounting for the largest median household size of 3.42 persons per household. non-family households (9,199 | 26.8%) represent the smallest median household size with 1.37 persons per household.
| Household Type | # Households | Household Size |
| Married-Couple | 19,721 (57.4%) | 3.31 |
| Single Male/Father | 2,259 (6.6%) | 3.12 |
| Single Female/Mother | 3,200 (9.3%) | 3.42 |
| Non-family | 9,199 (26.8%) | 1.37 |
| Total Households | 34,379 (100.0%) | 2.79 |
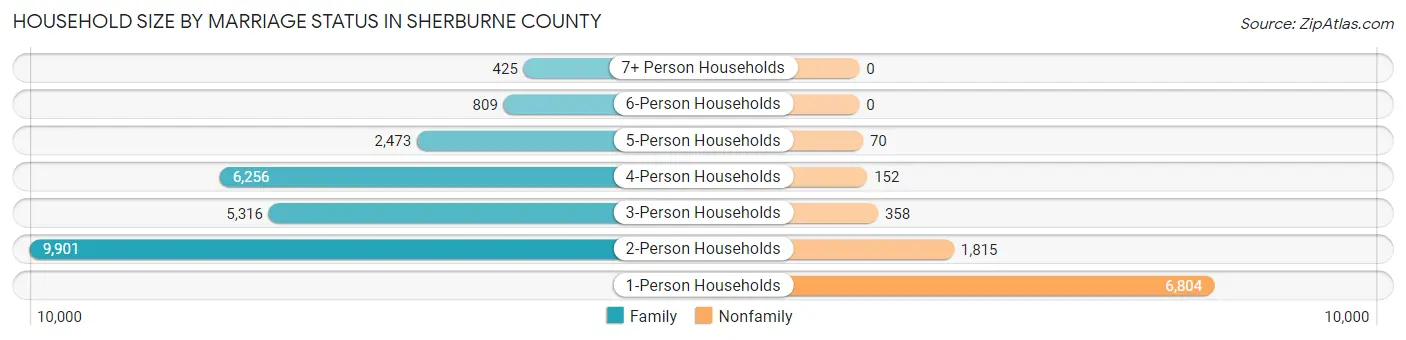
Household Size by Marriage Status in Sherburne County
Out of a total of 34,379 households in Sherburne County, 25,180 (73.2%) are family households, while 9,199 (26.8%) are nonfamily households. The most numerous type of family households are 2-person households, comprising 9,901, and the most common type of nonfamily households are 1-person households, comprising 6,804.
| Household Size | Family Households | Nonfamily Households |
| 1-Person Households | - | 6,804 (19.8%) |
| 2-Person Households | 9,901 (28.8%) | 1,815 (5.3%) |
| 3-Person Households | 5,316 (15.5%) | 358 (1.0%) |
| 4-Person Households | 6,256 (18.2%) | 152 (0.4%) |
| 5-Person Households | 2,473 (7.2%) | 70 (0.2%) |
| 6-Person Households | 809 (2.4%) | 0 (0.0%) |
| 7+ Person Households | 425 (1.2%) | 0 (0.0%) |
| Total | 25,180 (73.2%) | 9,199 (26.8%) |
Female Fertility in Sherburne County
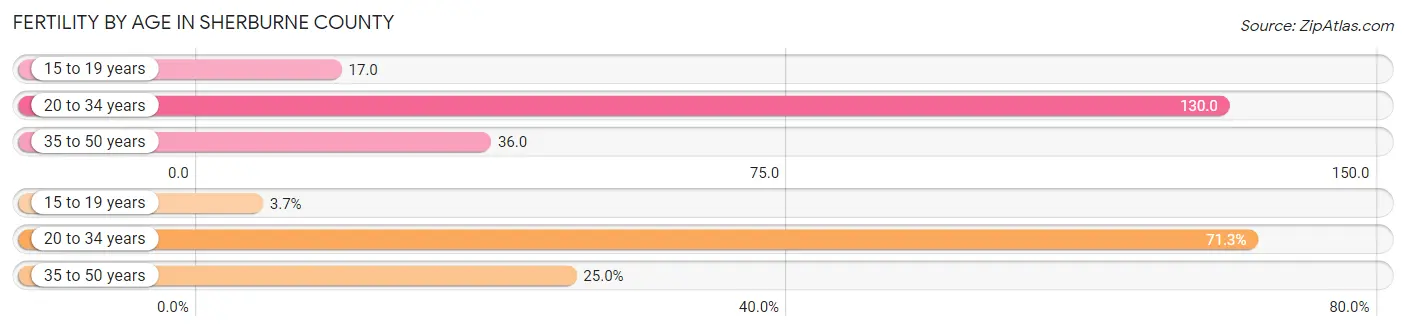
Fertility by Age in Sherburne County
Average fertility rate in Sherburne County is 69.0 births per 1,000 women. Women in the age bracket of 20 to 34 years have the highest fertility rate with 130.0 births per 1,000 women. Women in the age bracket of 20 to 34 years acount for 71.3% of all women with births.
| Age Bracket | Women with Births | Births / 1,000 Women |
| 15 to 19 years | 58 (3.7%) | 17.0 |
| 20 to 34 years | 1,112 (71.3%) | 130.0 |
| 35 to 50 years | 390 (25.0%) | 36.0 |
| Total | 1,560 (100.0%) | 69.0 |
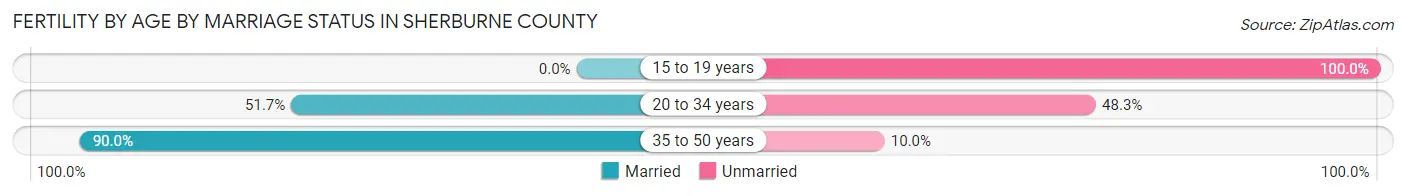
Fertility by Age by Marriage Status in Sherburne County
59.4% of women with births (1,560) in Sherburne County are married. The highest percentage of unmarried women with births falls into 15 to 19 years age bracket with 100.0% of them unmarried at the time of birth, while the lowest percentage of unmarried women with births belong to 35 to 50 years age bracket with 10.0% of them unmarried.
| Age Bracket | Married | Unmarried |
| 15 to 19 years | 0 (0.0%) | 58 (100.0%) |
| 20 to 34 years | 575 (51.7%) | 537 (48.3%) |
| 35 to 50 years | 351 (90.0%) | 39 (10.0%) |
| Total | 927 (59.4%) | 633 (40.6%) |
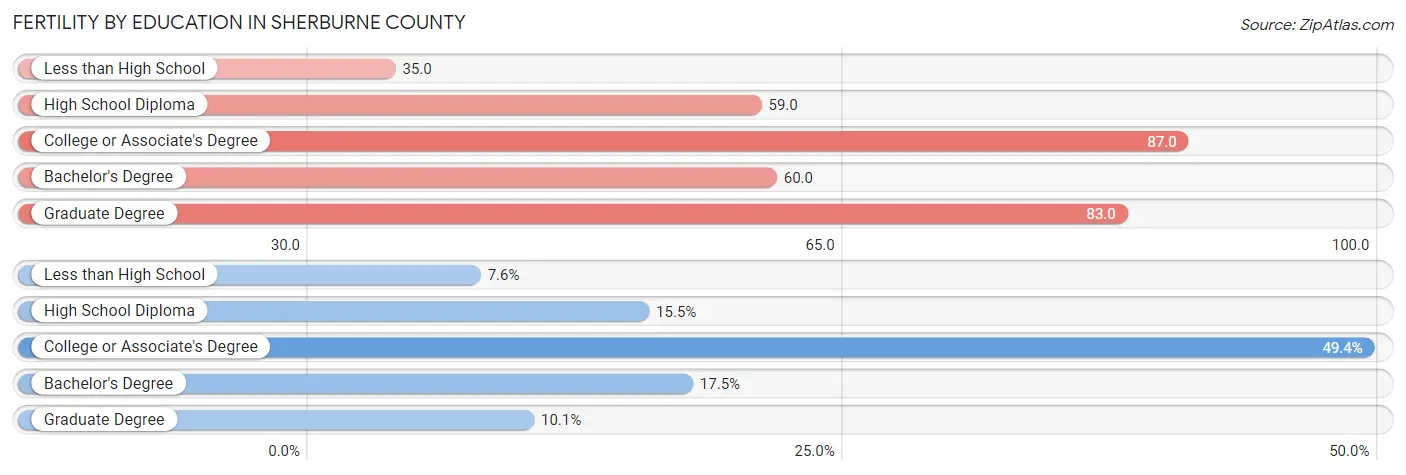
Fertility by Education in Sherburne County
Average fertility rate in Sherburne County is 69.0 births per 1,000 women. Women with the education attainment of college or associate's degree have the highest fertility rate of 87.0 births per 1,000 women, while women with the education attainment of less than high school have the lowest fertility at 35.0 births per 1,000 women. Women with the education attainment of college or associate's degree represent 49.4% of all women with births.
| Educational Attainment | Women with Births | Births / 1,000 Women |
| Less than High School | 118 (7.6%) | 35.0 |
| High School Diploma | 241 (15.4%) | 59.0 |
| College or Associate's Degree | 771 (49.4%) | 87.0 |
| Bachelor's Degree | 273 (17.5%) | 60.0 |
| Graduate Degree | 157 (10.1%) | 83.0 |
| Total | 1,560 (100.0%) | 69.0 |
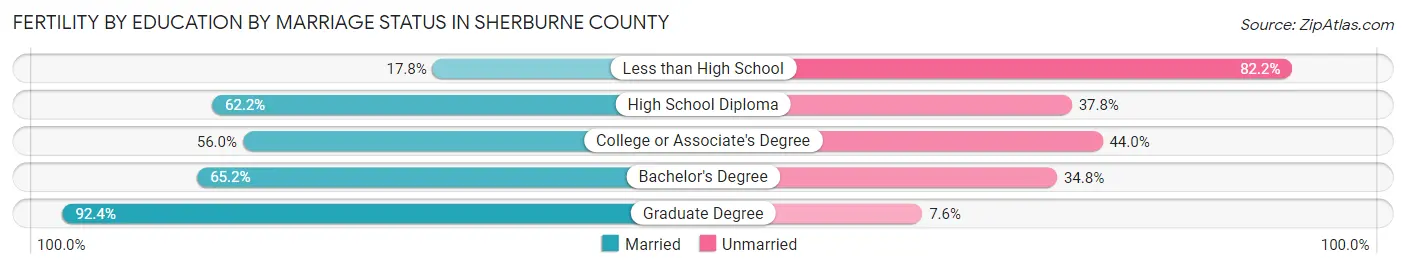
Fertility by Education by Marriage Status in Sherburne County
40.6% of women with births in Sherburne County are unmarried. Women with the educational attainment of graduate degree are most likely to be married with 92.4% of them married at childbirth, while women with the educational attainment of less than high school are least likely to be married with 82.2% of them unmarried at childbirth.
| Educational Attainment | Married | Unmarried |
| Less than High School | 21 (17.8%) | 97 (82.2%) |
| High School Diploma | 150 (62.2%) | 91 (37.8%) |
| College or Associate's Degree | 432 (56.0%) | 339 (44.0%) |
| Bachelor's Degree | 178 (65.2%) | 95 (34.8%) |
| Graduate Degree | 145 (92.4%) | 12 (7.6%) |
| Total | 927 (59.4%) | 633 (40.6%) |
Income in Sherburne County
Income Overview in Sherburne County
Per Capita Income in Sherburne County is $41,412, while median incomes of families and households are $114,968 and $99,431 respectively.
| Characteristic | Number | Measure |
| Per Capita Income | 97,820 | $41,412 |
| Median Family Income | 25,180 | $114,968 |
| Mean Family Income | 25,180 | $127,141 |
| Median Household Income | 34,379 | $99,431 |
| Mean Household Income | 34,379 | $114,114 |
| Income Deficit | 25,180 | $9,381 |
| Wage / Income Gap (%) | 97,820 | 24.89% |
| Wage / Income Gap ($) | 97,820 | 75.11¢ per $1 |
| Gini / Inequality Index | 97,820 | 0.38 |
Earnings by Sex in Sherburne County
Average Earnings in Sherburne County are $50,569, $57,729 for men and $43,363 for women, a difference of 24.9%.
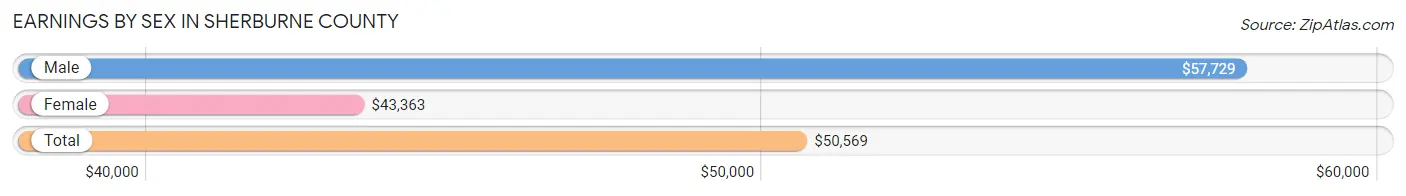
| Sex | Number | Average Earnings |
| Male | 31,701 (54.3%) | $57,729 |
| Female | 26,661 (45.7%) | $43,363 |
| Total | 58,362 (100.0%) | $50,569 |
Earnings by Sex by Income Bracket in Sherburne County
The most common earnings brackets in Sherburne County are $100,000+ for men (5,848 | 18.4%) and $75,000 to $99,999 for women (2,815 | 10.6%).
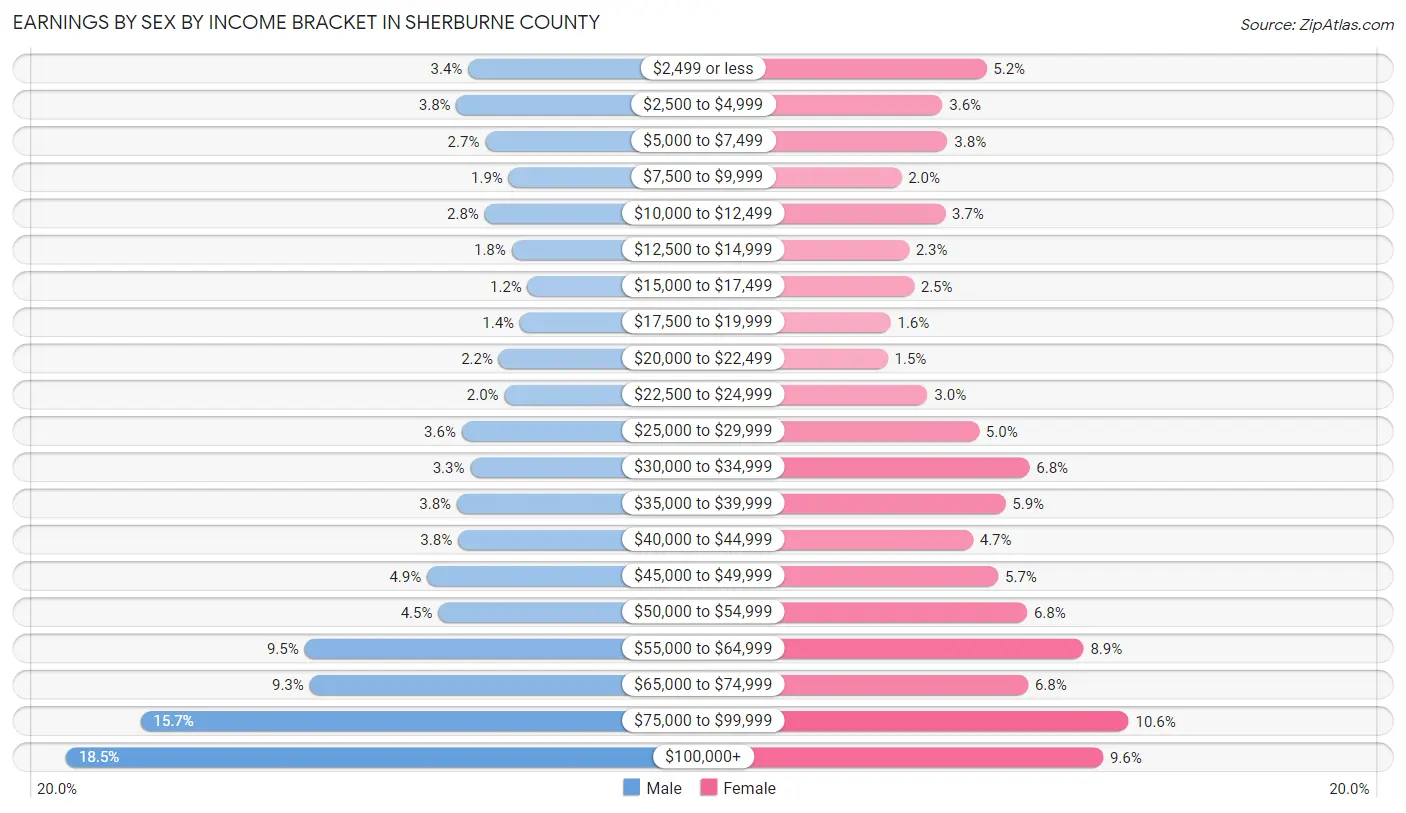
| Income | Male | Female |
| $2,499 or less | 1,070 (3.4%) | 1,394 (5.2%) |
| $2,500 to $4,999 | 1,210 (3.8%) | 955 (3.6%) |
| $5,000 to $7,499 | 870 (2.7%) | 1,004 (3.8%) |
| $7,500 to $9,999 | 590 (1.9%) | 544 (2.0%) |
| $10,000 to $12,499 | 876 (2.8%) | 981 (3.7%) |
| $12,500 to $14,999 | 556 (1.8%) | 619 (2.3%) |
| $15,000 to $17,499 | 365 (1.1%) | 669 (2.5%) |
| $17,500 to $19,999 | 458 (1.4%) | 438 (1.6%) |
| $20,000 to $22,499 | 708 (2.2%) | 407 (1.5%) |
| $22,500 to $24,999 | 640 (2.0%) | 805 (3.0%) |
| $25,000 to $29,999 | 1,146 (3.6%) | 1,319 (5.0%) |
| $30,000 to $34,999 | 1,047 (3.3%) | 1,823 (6.8%) |
| $35,000 to $39,999 | 1,206 (3.8%) | 1,583 (5.9%) |
| $40,000 to $44,999 | 1,191 (3.8%) | 1,259 (4.7%) |
| $45,000 to $49,999 | 1,559 (4.9%) | 1,512 (5.7%) |
| $50,000 to $54,999 | 1,428 (4.5%) | 1,800 (6.8%) |
| $55,000 to $64,999 | 3,015 (9.5%) | 2,364 (8.9%) |
| $65,000 to $74,999 | 2,953 (9.3%) | 1,810 (6.8%) |
| $75,000 to $99,999 | 4,965 (15.7%) | 2,815 (10.6%) |
| $100,000+ | 5,848 (18.4%) | 2,560 (9.6%) |
| Total | 31,701 (100.0%) | 26,661 (100.0%) |
Earnings by Sex by Educational Attainment in Sherburne County
Average earnings in Sherburne County are $66,137 for men and $49,509 for women, a difference of 25.1%. Men with an educational attainment of bachelor's degree enjoy the highest average annual earnings of $87,172, while those with high school diploma education earn the least with $52,168. Women with an educational attainment of graduate degree earn the most with the average annual earnings of $76,375, while those with high school diploma education have the smallest earnings of $33,889.
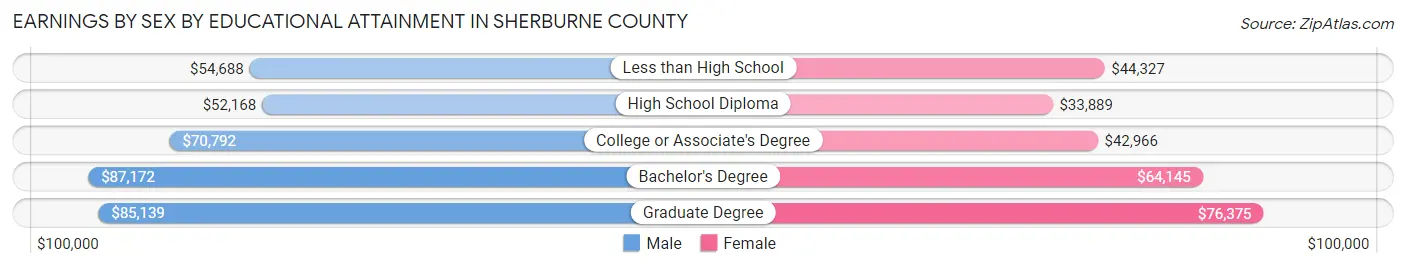
| Educational Attainment | Male Income | Female Income |
| Less than High School | $54,688 | $44,327 |
| High School Diploma | $52,168 | $33,889 |
| College or Associate's Degree | $70,792 | $42,966 |
| Bachelor's Degree | $87,172 | $64,145 |
| Graduate Degree | $85,139 | $76,375 |
| Total | $66,137 | $49,509 |
Family Income in Sherburne County
Family Income Brackets in Sherburne County
According to the Sherburne County family income data, there are 7,126 families falling into the $100,000 to $149,999 income range, which is the most common income bracket and makes up 28.3% of all families. Conversely, the $10,000 to $14,999 income bracket is the least frequent group with only 277 families (1.1%) belonging to this category.
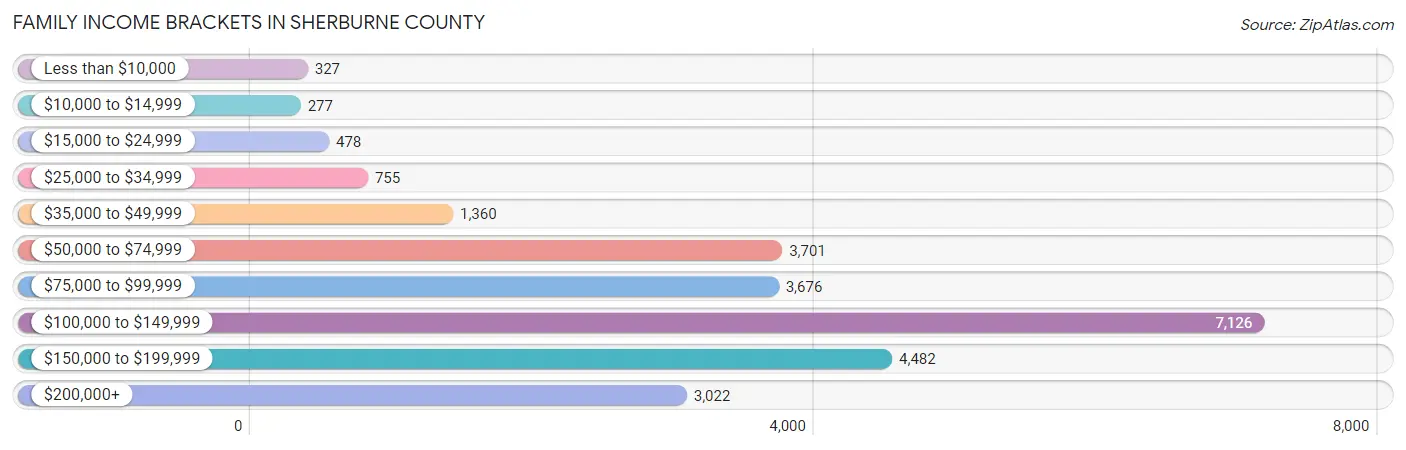
| Income Bracket | # Families | % Families |
| Less than $10,000 | 327 | 1.3% |
| $10,000 to $14,999 | 277 | 1.1% |
| $15,000 to $24,999 | 478 | 1.9% |
| $25,000 to $34,999 | 755 | 3.0% |
| $35,000 to $49,999 | 1,360 | 5.4% |
| $50,000 to $74,999 | 3,701 | 14.7% |
| $75,000 to $99,999 | 3,676 | 14.6% |
| $100,000 to $149,999 | 7,126 | 28.3% |
| $150,000 to $199,999 | 4,482 | 17.8% |
| $200,000+ | 3,022 | 12.0% |
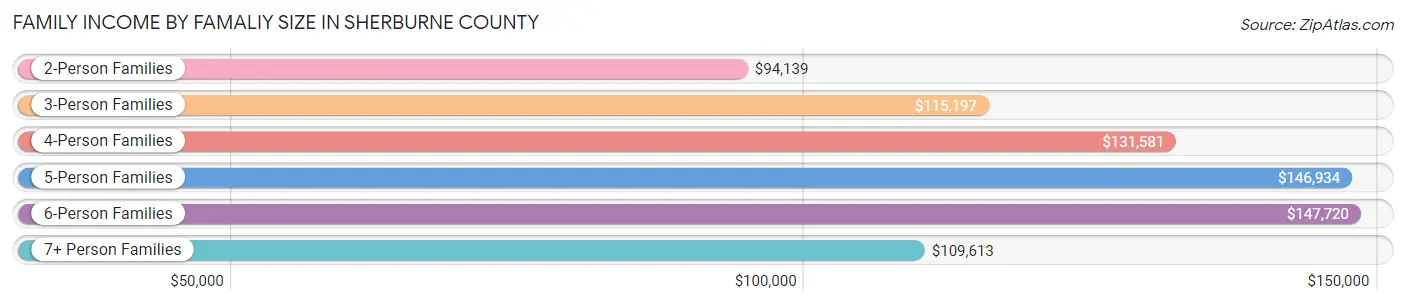
Family Income by Famaliy Size in Sherburne County
6-person families (700 | 2.8%) account for the highest median family income in Sherburne County with $147,720 per family, while 2-person families (10,967 | 43.5%) have the highest median income of $47,070 per family member.
| Income Bracket | # Families | Median Income |
| 2-Person Families | 10,967 (43.5%) | $94,139 |
| 3-Person Families | 5,173 (20.5%) | $115,197 |
| 4-Person Families | 5,651 (22.4%) | $131,581 |
| 5-Person Families | 2,319 (9.2%) | $146,934 |
| 6-Person Families | 700 (2.8%) | $147,720 |
| 7+ Person Families | 370 (1.5%) | $109,613 |
| Total | 25,180 (100.0%) | $114,968 |
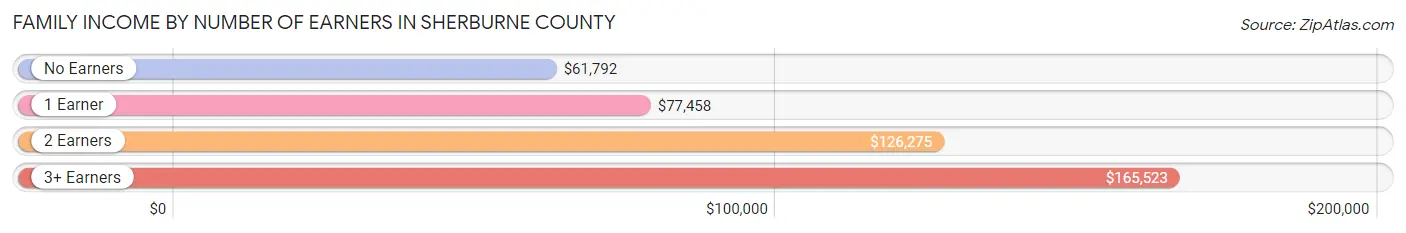
Family Income by Number of Earners in Sherburne County
The median family income in Sherburne County is $114,968, with families comprising 3+ earners (4,027) having the highest median family income of $165,523, while families with no earners (2,412) have the lowest median family income of $61,792, accounting for 16.0% and 9.6% of families, respectively.
| Number of Earners | # Families | Median Income |
| No Earners | 2,412 (9.6%) | $61,792 |
| 1 Earner | 5,811 (23.1%) | $77,458 |
| 2 Earners | 12,930 (51.3%) | $126,275 |
| 3+ Earners | 4,027 (16.0%) | $165,523 |
| Total | 25,180 (100.0%) | $114,968 |
Household Income in Sherburne County
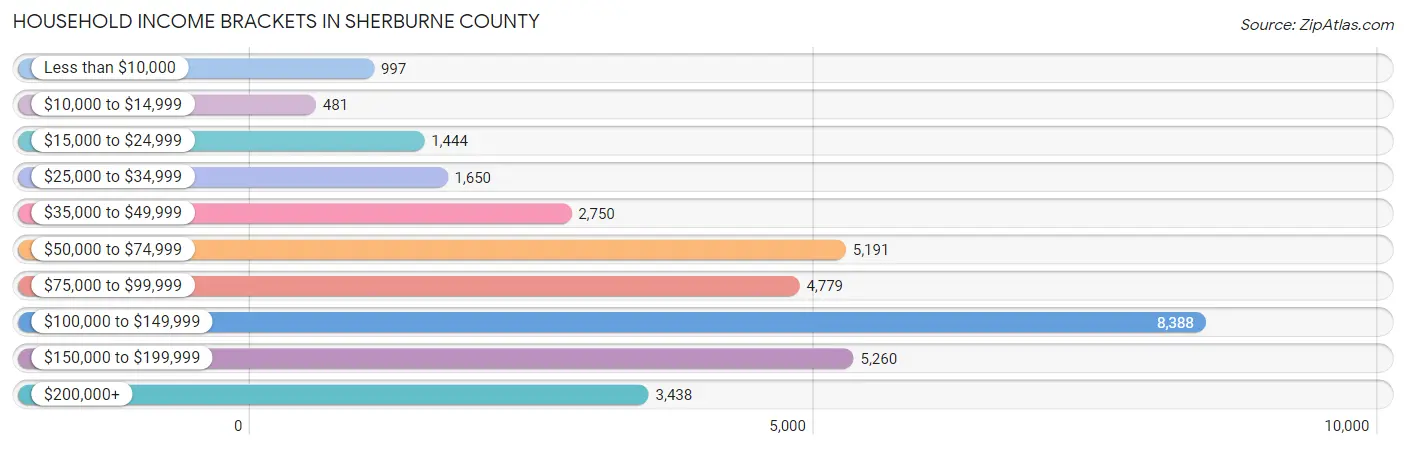
Household Income Brackets in Sherburne County
With 8,388 households falling in the category, the $100,000 to $149,999 income range is the most frequent in Sherburne County, accounting for 24.4% of all households. In contrast, only 481 households (1.4%) fall into the $10,000 to $14,999 income bracket, making it the least populous group.
| Income Bracket | # Households | % Households |
| Less than $10,000 | 997 | 2.9% |
| $10,000 to $14,999 | 481 | 1.4% |
| $15,000 to $24,999 | 1,444 | 4.2% |
| $25,000 to $34,999 | 1,650 | 4.8% |
| $35,000 to $49,999 | 2,750 | 8.0% |
| $50,000 to $74,999 | 5,191 | 15.1% |
| $75,000 to $99,999 | 4,779 | 13.9% |
| $100,000 to $149,999 | 8,388 | 24.4% |
| $150,000 to $199,999 | 5,260 | 15.3% |
| $200,000+ | 3,438 | 10.0% |
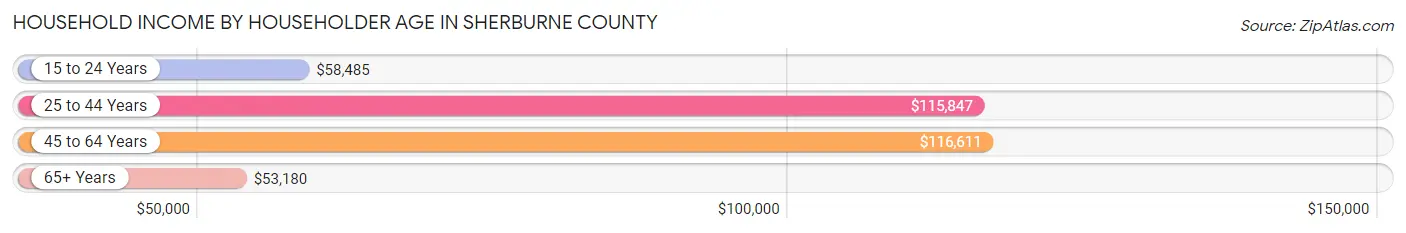
Household Income by Householder Age in Sherburne County
The median household income in Sherburne County is $99,431, with the highest median household income of $116,611 found in the 45 to 64 years age bracket for the primary householder. A total of 13,746 households (40.0%) fall into this category. Meanwhile, the 65+ years age bracket for the primary householder has the lowest median household income of $53,180, with 7,009 households (20.4%) in this group.
| Income Bracket | # Households | Median Income |
| 15 to 24 Years | 911 (2.6%) | $58,485 |
| 25 to 44 Years | 12,713 (37.0%) | $115,847 |
| 45 to 64 Years | 13,746 (40.0%) | $116,611 |
| 65+ Years | 7,009 (20.4%) | $53,180 |
| Total | 34,379 (100.0%) | $99,431 |
Poverty in Sherburne County
Income Below Poverty by Sex and Age in Sherburne County
With 4.5% poverty level for males and 7.2% for females among the residents of Sherburne County, 12 to 14 year old males and 75 year old and over females are the most vulnerable to poverty, with 184 males (8.9%) and 317 females (14.9%) in their respective age groups living below the poverty level.
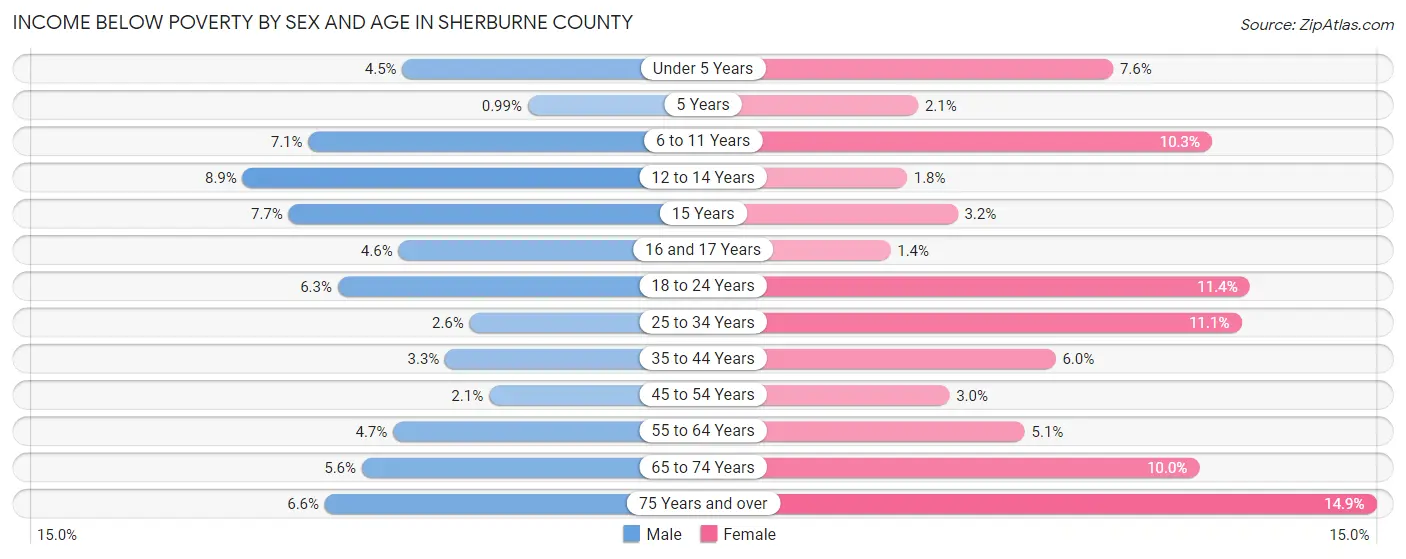
| Age Bracket | Male | Female |
| Under 5 Years | 146 (4.5%) | 229 (7.5%) |
| 5 Years | 7 (1.0%) | 16 (2.1%) |
| 6 to 11 Years | 309 (7.1%) | 378 (10.3%) |
| 12 to 14 Years | 184 (8.9%) | 48 (1.8%) |
| 15 Years | 51 (7.6%) | 27 (3.2%) |
| 16 and 17 Years | 71 (4.6%) | 20 (1.3%) |
| 18 to 24 Years | 286 (6.3%) | 407 (11.4%) |
| 25 to 34 Years | 162 (2.6%) | 673 (11.1%) |
| 35 to 44 Years | 229 (3.3%) | 400 (5.9%) |
| 45 to 54 Years | 145 (2.1%) | 196 (3.0%) |
| 55 to 64 Years | 298 (4.7%) | 296 (5.1%) |
| 65 to 74 Years | 198 (5.6%) | 367 (10.0%) |
| 75 Years and over | 110 (6.6%) | 317 (14.9%) |
| Total | 2,196 (4.5%) | 3,374 (7.2%) |
Income Above Poverty by Sex and Age in Sherburne County
According to the poverty statistics in Sherburne County, males aged 5 years and females aged 16 and 17 years are the age groups that are most secure financially, with 99.0% of males and 98.7% of females in these age groups living above the poverty line.
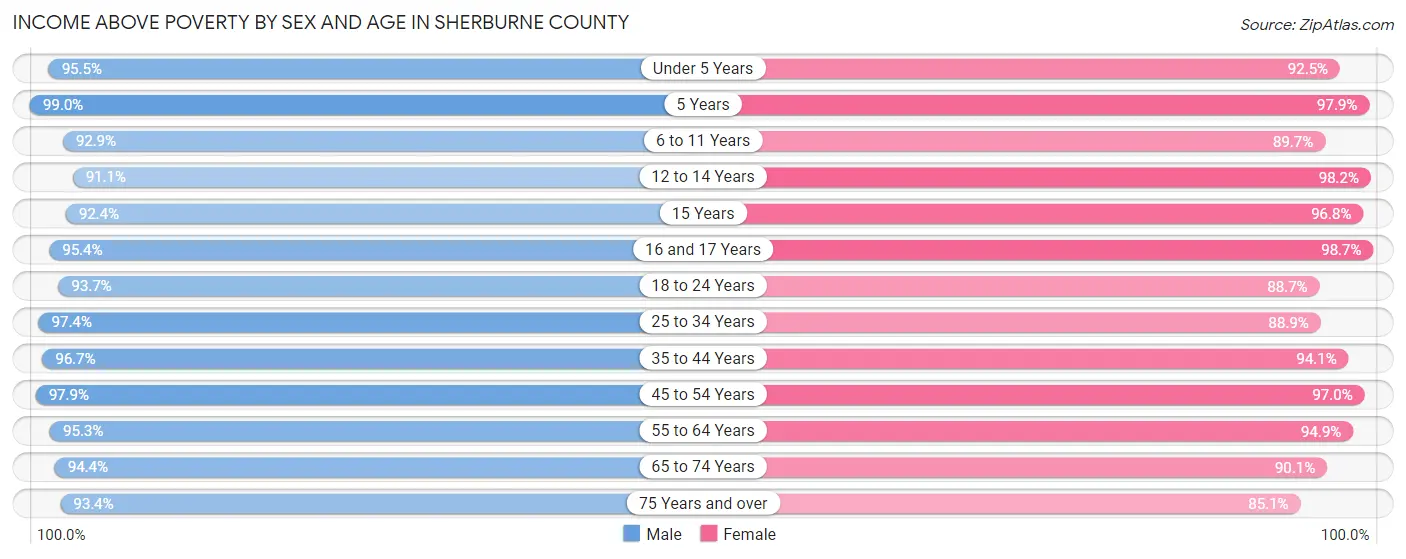
| Age Bracket | Male | Female |
| Under 5 Years | 3,116 (95.5%) | 2,805 (92.4%) |
| 5 Years | 698 (99.0%) | 740 (97.9%) |
| 6 to 11 Years | 4,043 (92.9%) | 3,292 (89.7%) |
| 12 to 14 Years | 1,876 (91.1%) | 2,599 (98.2%) |
| 15 Years | 616 (92.3%) | 812 (96.8%) |
| 16 and 17 Years | 1,475 (95.4%) | 1,460 (98.7%) |
| 18 to 24 Years | 4,270 (93.7%) | 3,178 (88.6%) |
| 25 to 34 Years | 6,035 (97.4%) | 5,381 (88.9%) |
| 35 to 44 Years | 6,742 (96.7%) | 6,323 (94.1%) |
| 45 to 54 Years | 6,862 (97.9%) | 6,365 (97.0%) |
| 55 to 64 Years | 5,985 (95.3%) | 5,524 (94.9%) |
| 65 to 74 Years | 3,330 (94.4%) | 3,323 (90.0%) |
| 75 Years and over | 1,546 (93.4%) | 1,814 (85.1%) |
| Total | 46,594 (95.5%) | 43,616 (92.8%) |
Income Below Poverty Among Married-Couple Families in Sherburne County
The poverty statistics for married-couple families in Sherburne County show that 2.1% or 404 of the total 19,721 families live below the poverty line. Families with 5 or more children have the highest poverty rate of 13.5%, comprising of 15 families. On the other hand, families with 3 or 4 children have the lowest poverty rate of 0.1%, which includes 2 families.
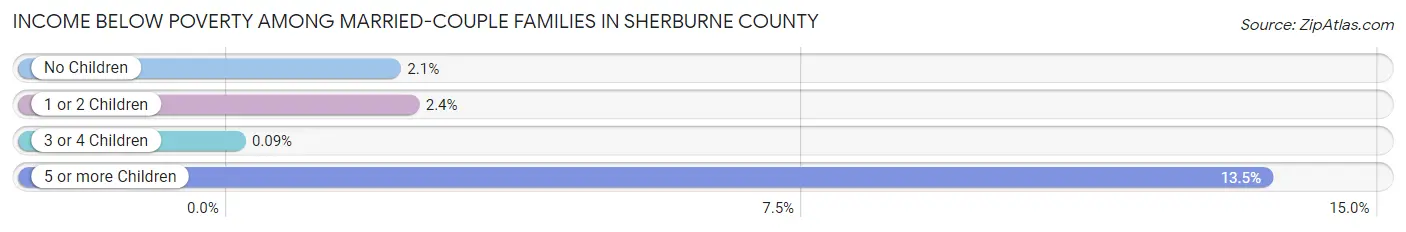
| Children | Above Poverty | Below Poverty |
| No Children | 10,385 (97.9%) | 225 (2.1%) |
| 1 or 2 Children | 6,712 (97.6%) | 162 (2.4%) |
| 3 or 4 Children | 2,124 (99.9%) | 2 (0.1%) |
| 5 or more Children | 96 (86.5%) | 15 (13.5%) |
| Total | 19,317 (98.0%) | 404 (2.1%) |
Income Below Poverty Among Single-Parent Households in Sherburne County
According to the poverty data in Sherburne County, 2.7% or 60 single-father households and 15.6% or 499 single-mother households are living below the poverty line. Among single-father households, those with 1 or 2 children have the highest poverty rate, with 51 households (4.3%) experiencing poverty. Likewise, among single-mother households, those with 5 or more children have the highest poverty rate, with 50 households (79.4%) falling below the poverty line.
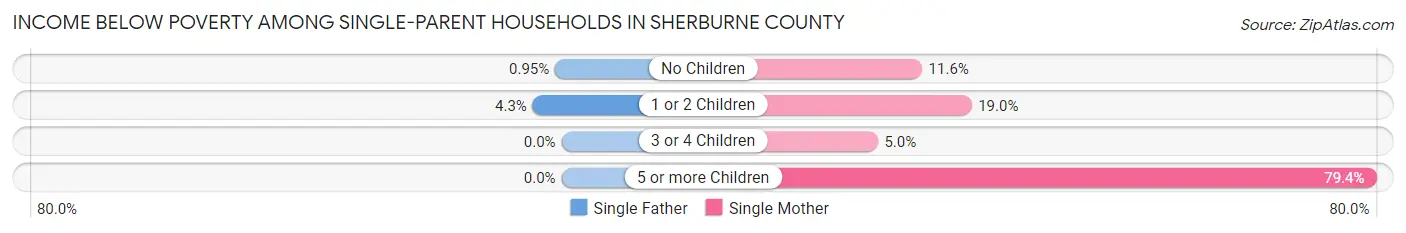
| Children | Single Father | Single Mother |
| No Children | 9 (0.9%) | 114 (11.6%) |
| 1 or 2 Children | 51 (4.3%) | 308 (19.0%) |
| 3 or 4 Children | 0 (0.0%) | 27 (5.0%) |
| 5 or more Children | 0 (0.0%) | 50 (79.4%) |
| Total | 60 (2.7%) | 499 (15.6%) |
Income Below Poverty Among Married-Couple vs Single-Parent Households in Sherburne County
The poverty data for Sherburne County shows that 404 of the married-couple family households (2.1%) and 559 of the single-parent households (10.2%) are living below the poverty level. Within the married-couple family households, those with 5 or more children have the highest poverty rate, with 15 households (13.5%) falling below the poverty line. Among the single-parent households, those with 5 or more children have the highest poverty rate, with 50 household (79.4%) living below poverty.
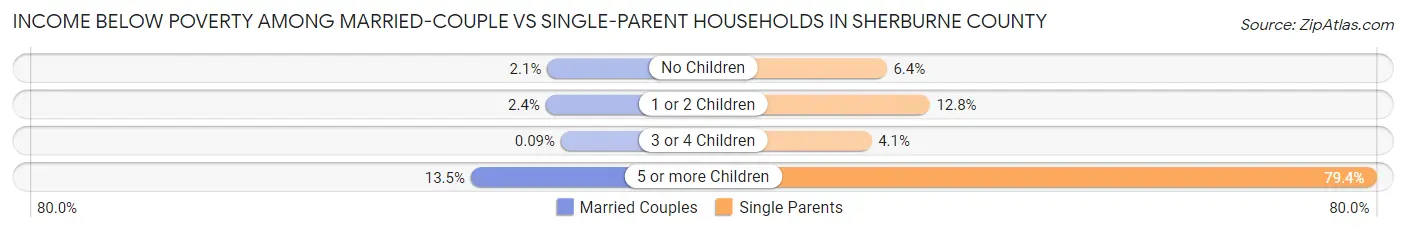
| Children | Married-Couple Families | Single-Parent Households |
| No Children | 225 (2.1%) | 123 (6.4%) |
| 1 or 2 Children | 162 (2.4%) | 359 (12.8%) |
| 3 or 4 Children | 2 (0.1%) | 27 (4.1%) |
| 5 or more Children | 15 (13.5%) | 50 (79.4%) |
| Total | 404 (2.1%) | 559 (10.2%) |
Employment Characteristics in Sherburne County
Employment by Class of Employer in Sherburne County
Among the 52,791 employed individuals in Sherburne County, private company employees (37,950 | 71.9%), local government employees (4,294 | 8.1%), and not-for-profit organizations (3,954 | 7.5%) make up the most common classes of employment.
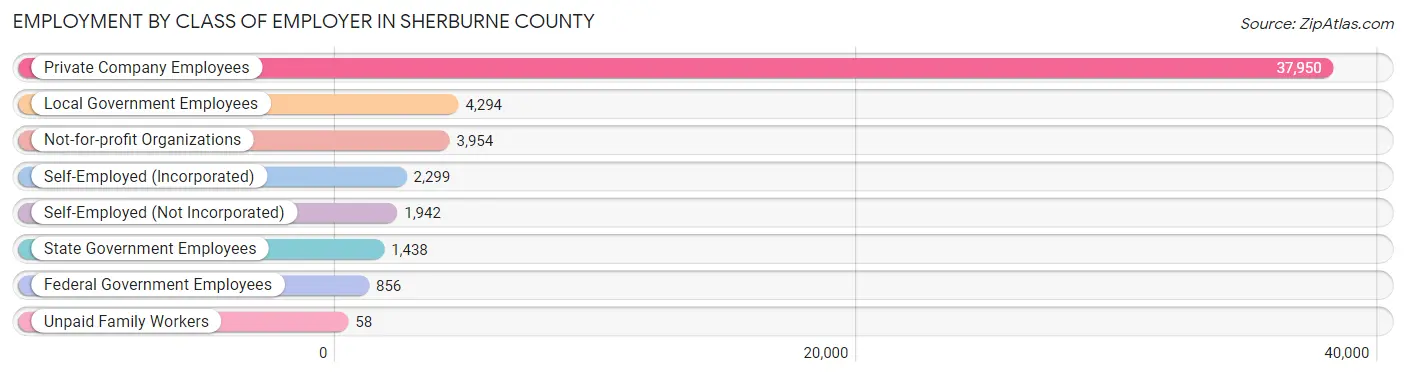
| Employer Class | # Employees | % Employees |
| Private Company Employees | 37,950 | 71.9% |
| Self-Employed (Incorporated) | 2,299 | 4.3% |
| Self-Employed (Not Incorporated) | 1,942 | 3.7% |
| Not-for-profit Organizations | 3,954 | 7.5% |
| Local Government Employees | 4,294 | 8.1% |
| State Government Employees | 1,438 | 2.7% |
| Federal Government Employees | 856 | 1.6% |
| Unpaid Family Workers | 58 | 0.1% |
| Total | 52,791 | 100.0% |
Employment Status by Age in Sherburne County
According to the labor force statistics for Sherburne County, out of the total population over 16 years of age (75,472), 73.5% or 55,472 individuals are in the labor force, with 3.0% or 1,664 of them unemployed. The age group with the highest labor force participation rate is 45 to 54 years, with 90.2% or 12,310 individuals in the labor force. Within the labor force, the 20 to 24 years age range has the highest percentage of unemployed individuals, with 8.0% or 404 of them being unemployed.
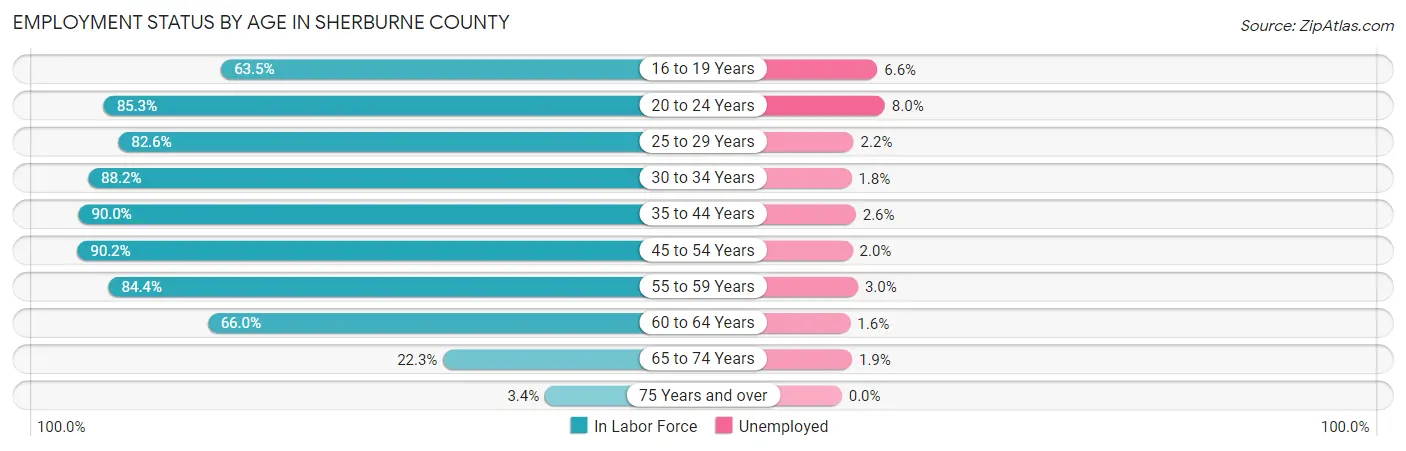
| Age Bracket | In Labor Force | Unemployed |
| 16 to 19 Years | 3,407 (63.5%) | 225 (6.6%) |
| 20 to 24 Years | 5,046 (85.3%) | 404 (8.0%) |
| 25 to 29 Years | 4,971 (82.6%) | 109 (2.2%) |
| 30 to 34 Years | 5,945 (88.2%) | 107 (1.8%) |
| 35 to 44 Years | 12,704 (90.0%) | 330 (2.6%) |
| 45 to 54 Years | 12,310 (90.2%) | 246 (2.0%) |
| 55 to 59 Years | 5,727 (84.4%) | 172 (3.0%) |
| 60 to 64 Years | 3,606 (66.0%) | 58 (1.6%) |
| 65 to 74 Years | 1,625 (22.3%) | 31 (1.9%) |
| 75 Years and over | 140 (3.4%) | 0 (0.0%) |
| Total | 55,472 (73.5%) | 1,664 (3.0%) |
Employment Status by Educational Attainment in Sherburne County
According to labor force statistics for Sherburne County, 85.8% of individuals (45,278) out of the total population between 25 and 64 years of age (52,771) are in the labor force, with 2.2% or 996 of them being unemployed. The group with the highest labor force participation rate are those with the educational attainment of bachelor's degree or higher, with 90.6% or 13,726 individuals in the labor force. Within the labor force, individuals with high school diploma education have the highest percentage of unemployment, with 2.7% or 301 of them being unemployed.
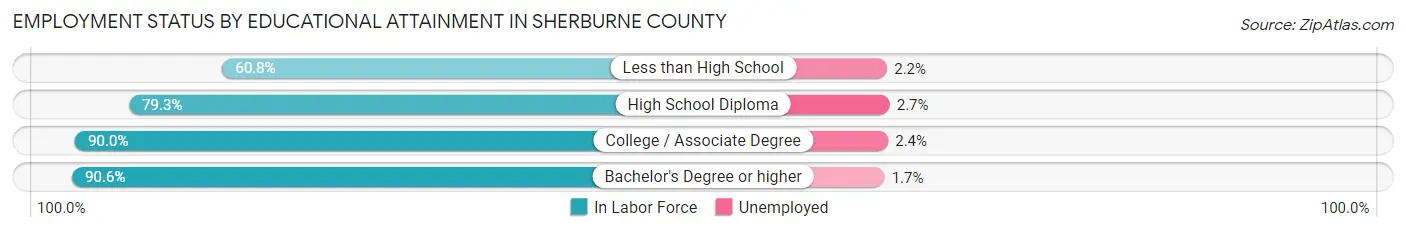
| Educational Attainment | In Labor Force | Unemployed |
| Less than High School | 1,671 (60.8%) | 60 (2.2%) |
| High School Diploma | 11,130 (79.3%) | 379 (2.7%) |
| College / Associate Degree | 18,754 (90.0%) | 500 (2.4%) |
| Bachelor's Degree or higher | 13,726 (90.6%) | 258 (1.7%) |
| Total | 45,278 (85.8%) | 1,161 (2.2%) |
Employment Occupations by Sex in Sherburne County
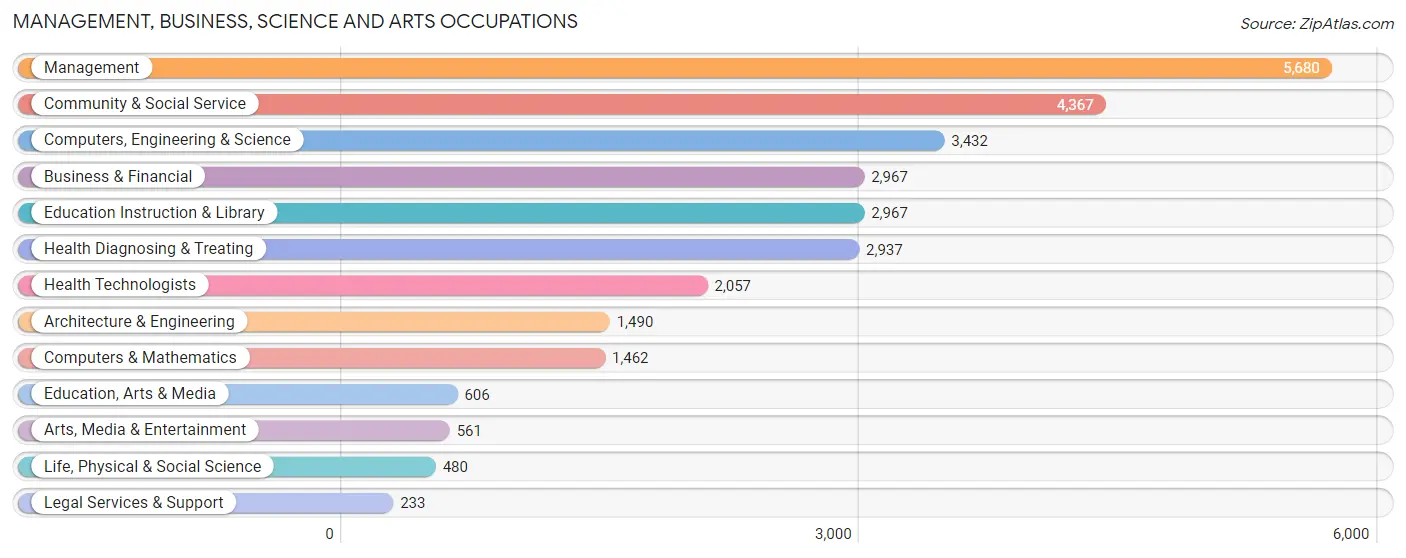
Management, Business, Science and Arts Occupations
The most common Management, Business, Science and Arts occupations in Sherburne County are Management (5,680 | 10.6%), Community & Social Service (4,367 | 8.1%), Computers, Engineering & Science (3,432 | 6.4%), Business & Financial (2,967 | 5.5%), and Education Instruction & Library (2,967 | 5.5%).
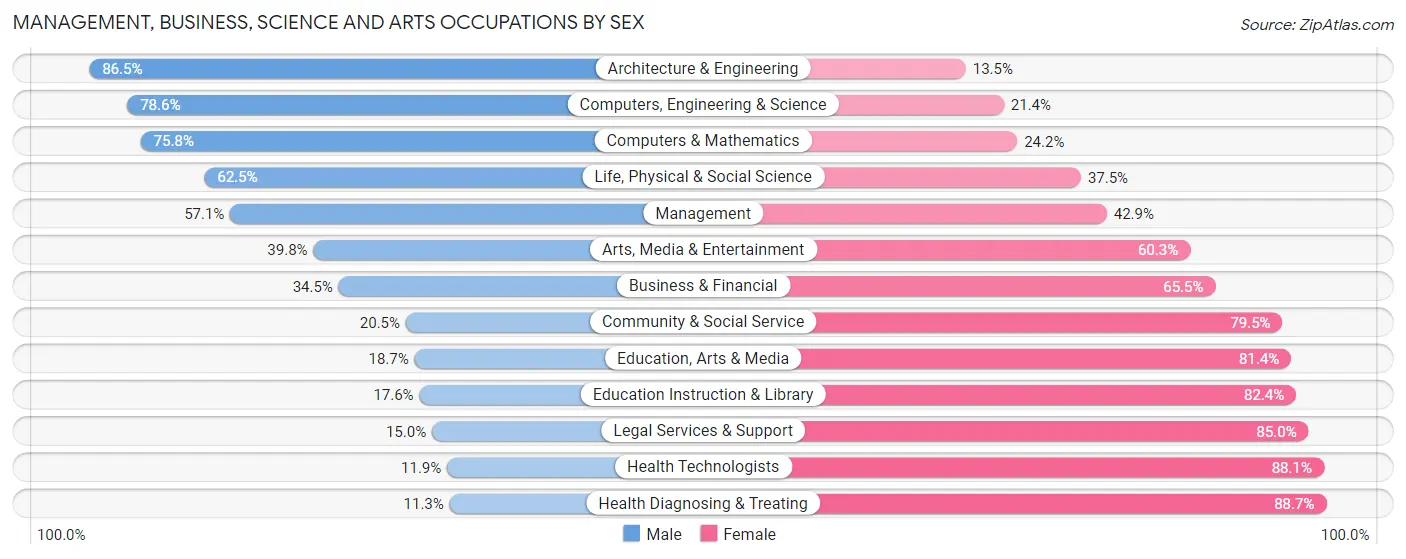
Management, Business, Science and Arts Occupations by Sex
Within the Management, Business, Science and Arts occupations in Sherburne County, the most male-oriented occupations are Architecture & Engineering (86.5%), Computers, Engineering & Science (78.6%), and Computers & Mathematics (75.8%), while the most female-oriented occupations are Health Diagnosing & Treating (88.7%), Health Technologists (88.1%), and Legal Services & Support (85.0%).
| Occupation | Male | Female |
| Management | 3,244 (57.1%) | 2,436 (42.9%) |
| Business & Financial | 1,023 (34.5%) | 1,944 (65.5%) |
| Computers, Engineering & Science | 2,697 (78.6%) | 735 (21.4%) |
| Computers & Mathematics | 1,108 (75.8%) | 354 (24.2%) |
| Architecture & Engineering | 1,289 (86.5%) | 201 (13.5%) |
| Life, Physical & Social Science | 300 (62.5%) | 180 (37.5%) |
| Community & Social Service | 894 (20.5%) | 3,473 (79.5%) |
| Education, Arts & Media | 113 (18.6%) | 493 (81.4%) |
| Legal Services & Support | 35 (15.0%) | 198 (85.0%) |
| Education Instruction & Library | 523 (17.6%) | 2,444 (82.4%) |
| Arts, Media & Entertainment | 223 (39.8%) | 338 (60.3%) |
| Health Diagnosing & Treating | 333 (11.3%) | 2,604 (88.7%) |
| Health Technologists | 244 (11.9%) | 1,813 (88.1%) |
| Total (Category) | 8,191 (42.3%) | 11,192 (57.7%) |
| Total (Overall) | 28,763 (53.6%) | 24,864 (46.4%) |
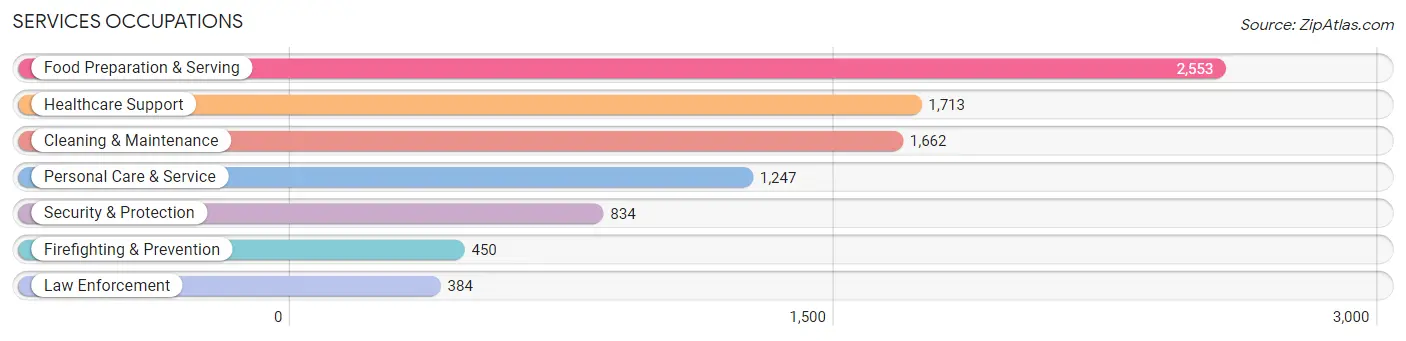
Services Occupations
The most common Services occupations in Sherburne County are Food Preparation & Serving (2,553 | 4.8%), Healthcare Support (1,713 | 3.2%), Cleaning & Maintenance (1,662 | 3.1%), Personal Care & Service (1,247 | 2.3%), and Security & Protection (834 | 1.6%).
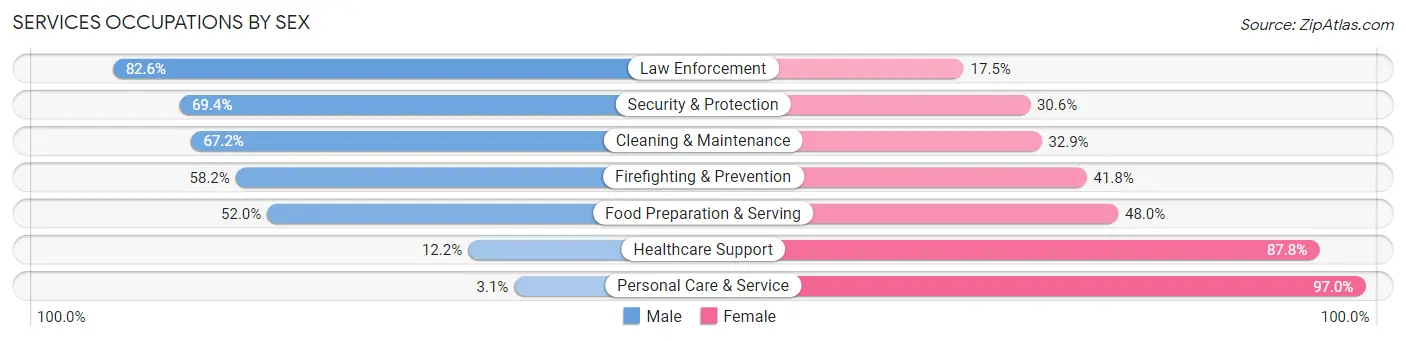
Services Occupations by Sex
Within the Services occupations in Sherburne County, the most male-oriented occupations are Law Enforcement (82.6%), Security & Protection (69.4%), and Cleaning & Maintenance (67.1%), while the most female-oriented occupations are Personal Care & Service (97.0%), Healthcare Support (87.8%), and Food Preparation & Serving (48.0%).
| Occupation | Male | Female |
| Healthcare Support | 209 (12.2%) | 1,504 (87.8%) |
| Security & Protection | 579 (69.4%) | 255 (30.6%) |
| Firefighting & Prevention | 262 (58.2%) | 188 (41.8%) |
| Law Enforcement | 317 (82.6%) | 67 (17.4%) |
| Food Preparation & Serving | 1,327 (52.0%) | 1,226 (48.0%) |
| Cleaning & Maintenance | 1,116 (67.1%) | 546 (32.9%) |
| Personal Care & Service | 38 (3.0%) | 1,209 (97.0%) |
| Total (Category) | 3,269 (40.8%) | 4,740 (59.2%) |
| Total (Overall) | 28,763 (53.6%) | 24,864 (46.4%) |
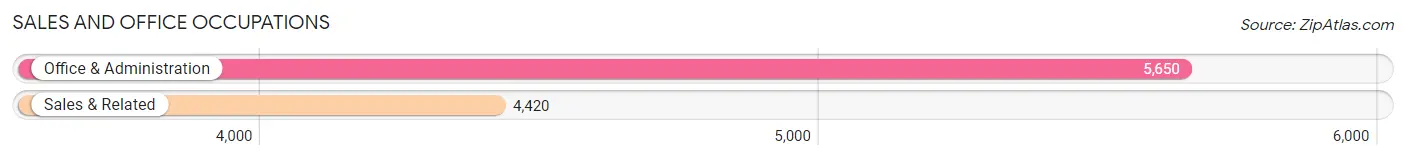
Sales and Office Occupations
The most common Sales and Office occupations in Sherburne County are Office & Administration (5,650 | 10.5%), and Sales & Related (4,420 | 8.2%).
Sales and Office Occupations by Sex
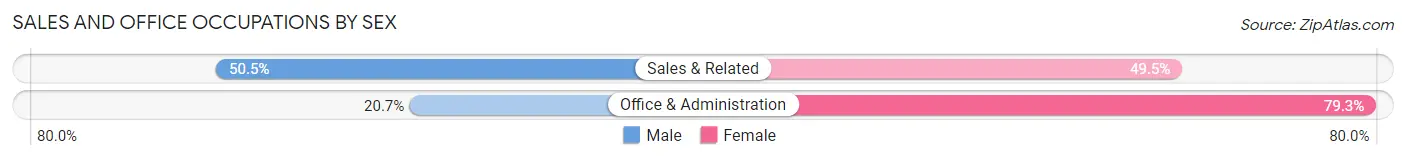
| Occupation | Male | Female |
| Sales & Related | 2,233 (50.5%) | 2,187 (49.5%) |
| Office & Administration | 1,169 (20.7%) | 4,481 (79.3%) |
| Total (Category) | 3,402 (33.8%) | 6,668 (66.2%) |
| Total (Overall) | 28,763 (53.6%) | 24,864 (46.4%) |
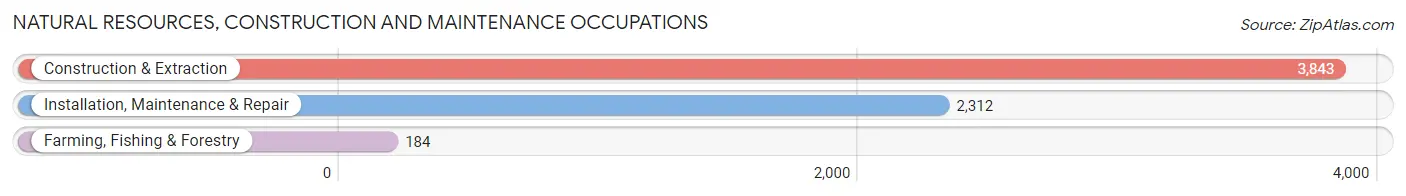
Natural Resources, Construction and Maintenance Occupations
The most common Natural Resources, Construction and Maintenance occupations in Sherburne County are Construction & Extraction (3,843 | 7.2%), Installation, Maintenance & Repair (2,312 | 4.3%), and Farming, Fishing & Forestry (184 | 0.3%).
Natural Resources, Construction and Maintenance Occupations by Sex
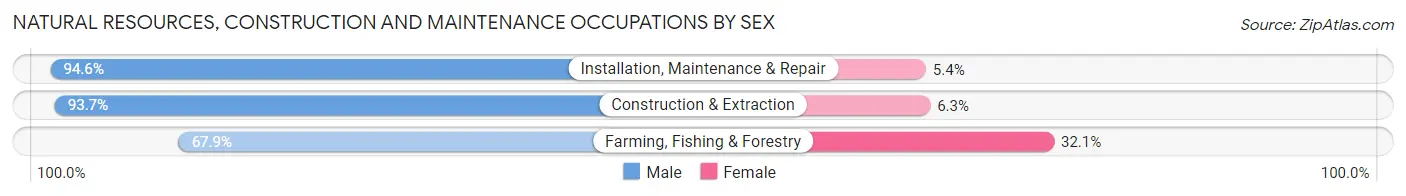
| Occupation | Male | Female |
| Farming, Fishing & Forestry | 125 (67.9%) | 59 (32.1%) |
| Construction & Extraction | 3,601 (93.7%) | 242 (6.3%) |
| Installation, Maintenance & Repair | 2,187 (94.6%) | 125 (5.4%) |
| Total (Category) | 5,913 (93.3%) | 426 (6.7%) |
| Total (Overall) | 28,763 (53.6%) | 24,864 (46.4%) |
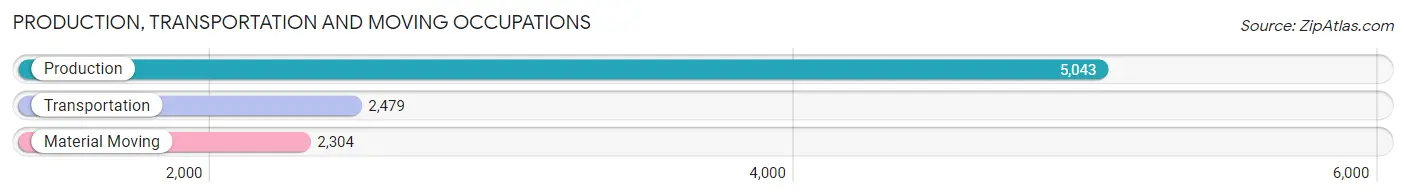
Production, Transportation and Moving Occupations
The most common Production, Transportation and Moving occupations in Sherburne County are Production (5,043 | 9.4%), Transportation (2,479 | 4.6%), and Material Moving (2,304 | 4.3%).
Production, Transportation and Moving Occupations by Sex
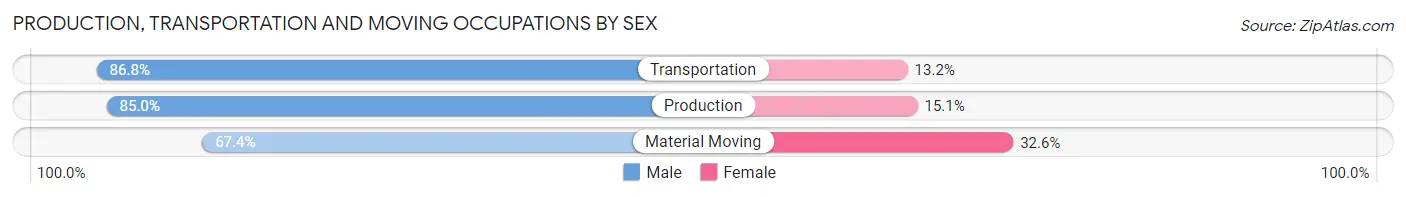
| Occupation | Male | Female |
| Production | 4,284 (85.0%) | 759 (15.0%) |
| Transportation | 2,151 (86.8%) | 328 (13.2%) |
| Material Moving | 1,553 (67.4%) | 751 (32.6%) |
| Total (Category) | 7,988 (81.3%) | 1,838 (18.7%) |
| Total (Overall) | 28,763 (53.6%) | 24,864 (46.4%) |
Employment Industries by Sex in Sherburne County
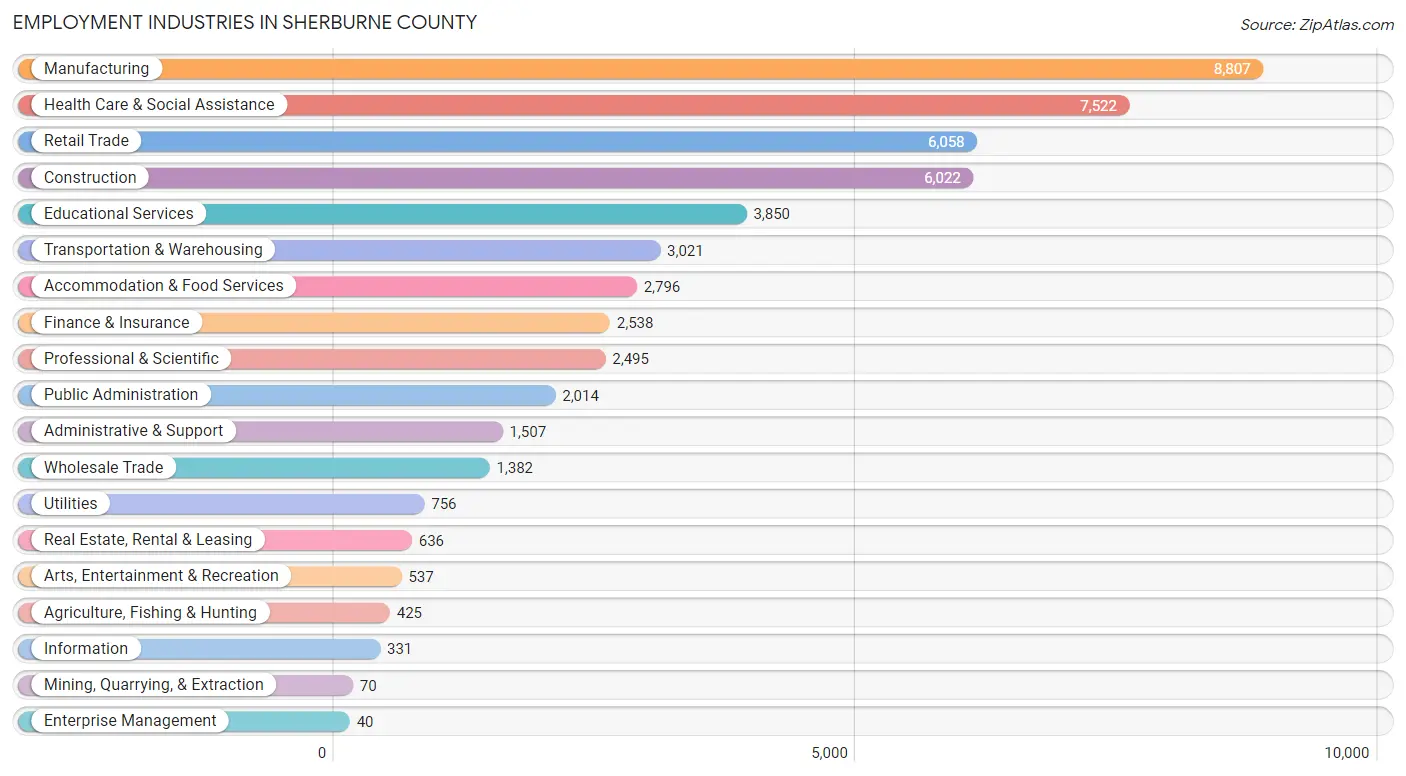
Employment Industries in Sherburne County
The major employment industries in Sherburne County include Manufacturing (8,807 | 16.4%), Health Care & Social Assistance (7,522 | 14.0%), Retail Trade (6,058 | 11.3%), Construction (6,022 | 11.2%), and Educational Services (3,850 | 7.2%).
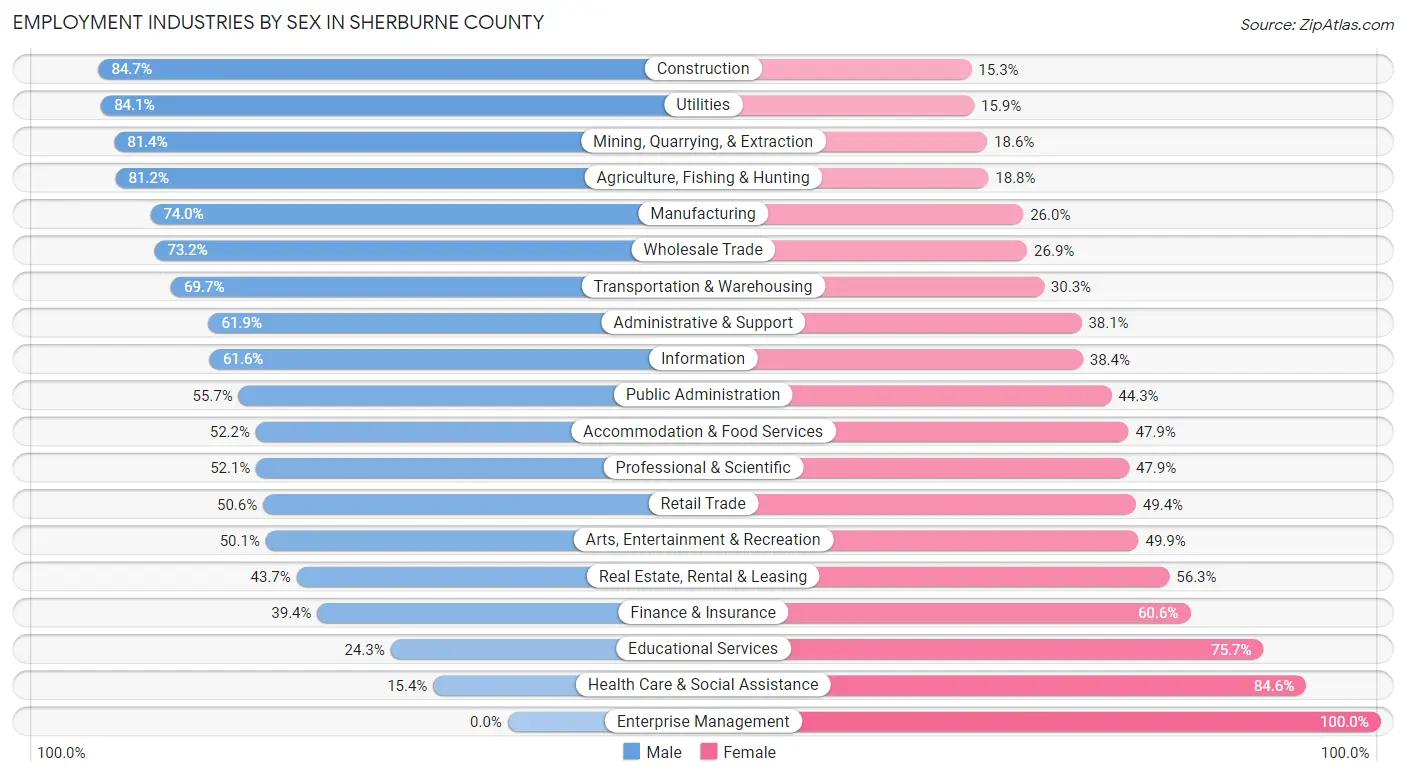
Employment Industries by Sex in Sherburne County
The Sherburne County industries that see more men than women are Construction (84.7%), Utilities (84.1%), and Mining, Quarrying, & Extraction (81.4%), whereas the industries that tend to have a higher number of women are Enterprise Management (100.0%), Health Care & Social Assistance (84.6%), and Educational Services (75.7%).
| Industry | Male | Female |
| Agriculture, Fishing & Hunting | 345 (81.2%) | 80 (18.8%) |
| Mining, Quarrying, & Extraction | 57 (81.4%) | 13 (18.6%) |
| Construction | 5,100 (84.7%) | 922 (15.3%) |
| Manufacturing | 6,514 (74.0%) | 2,293 (26.0%) |
| Wholesale Trade | 1,011 (73.2%) | 371 (26.9%) |
| Retail Trade | 3,068 (50.6%) | 2,990 (49.4%) |
| Transportation & Warehousing | 2,105 (69.7%) | 916 (30.3%) |
| Utilities | 636 (84.1%) | 120 (15.9%) |
| Information | 204 (61.6%) | 127 (38.4%) |
| Finance & Insurance | 1,000 (39.4%) | 1,538 (60.6%) |
| Real Estate, Rental & Leasing | 278 (43.7%) | 358 (56.3%) |
| Professional & Scientific | 1,299 (52.1%) | 1,196 (47.9%) |
| Enterprise Management | 0 (0.0%) | 40 (100.0%) |
| Administrative & Support | 933 (61.9%) | 574 (38.1%) |
| Educational Services | 934 (24.3%) | 2,916 (75.7%) |
| Health Care & Social Assistance | 1,161 (15.4%) | 6,361 (84.6%) |
| Arts, Entertainment & Recreation | 269 (50.1%) | 268 (49.9%) |
| Accommodation & Food Services | 1,458 (52.1%) | 1,338 (47.8%) |
| Public Administration | 1,122 (55.7%) | 892 (44.3%) |
| Total | 28,763 (53.6%) | 24,864 (46.4%) |
Education in Sherburne County
School Enrollment in Sherburne County
The most common levels of schooling among the 24,643 students in Sherburne County are high school (6,090 | 24.7%), middle school (5,620 | 22.8%), and elementary school (5,051 | 20.5%).
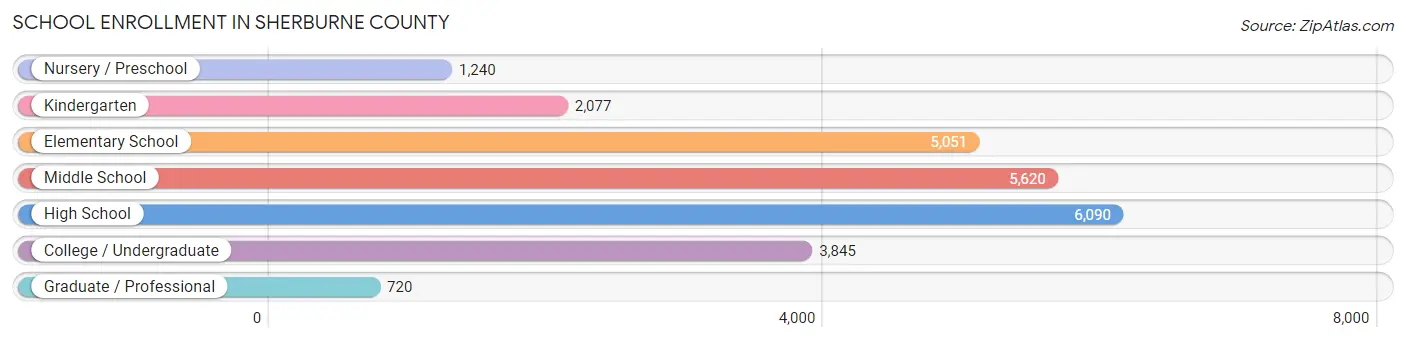
| School Level | # Students | % Students |
| Nursery / Preschool | 1,240 | 5.0% |
| Kindergarten | 2,077 | 8.4% |
| Elementary School | 5,051 | 20.5% |
| Middle School | 5,620 | 22.8% |
| High School | 6,090 | 24.7% |
| College / Undergraduate | 3,845 | 15.6% |
| Graduate / Professional | 720 | 2.9% |
| Total | 24,643 | 100.0% |
School Enrollment by Age by Funding Source in Sherburne County
Out of a total of 24,643 students who are enrolled in schools in Sherburne County, 2,070 (8.4%) attend a private institution, while the remaining 22,573 (91.6%) are enrolled in public schools. The age group of 25 to 34 year olds has the highest likelihood of being enrolled in private schools, with 290 (27.6% in the age bracket) enrolled. Conversely, the age group of 15 to 17 year olds has the lowest likelihood of being enrolled in a private school, with 4,248 (96.4% in the age bracket) attending a public institution.
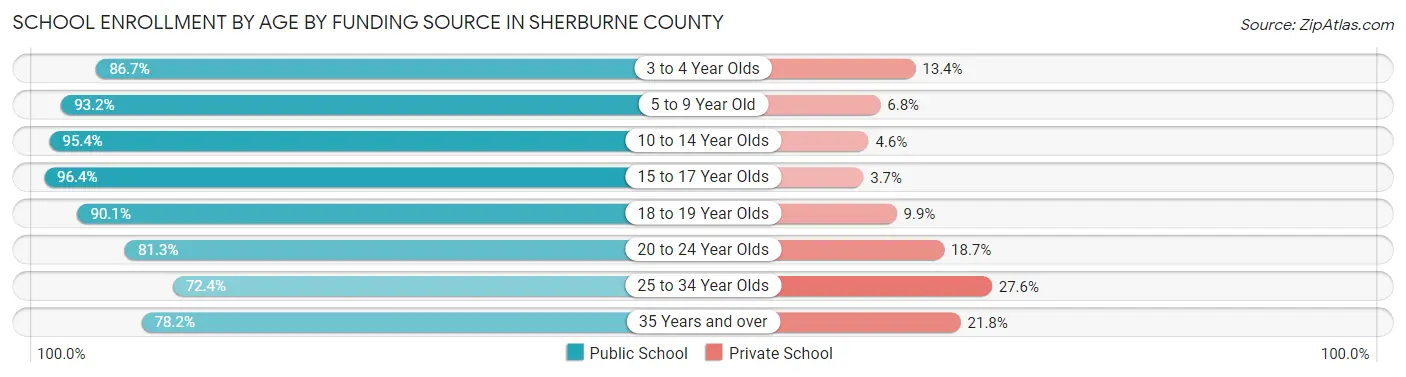
| Age Bracket | Public School | Private School |
| 3 to 4 Year Olds | 753 (86.7%) | 116 (13.4%) |
| 5 to 9 Year Old | 6,121 (93.2%) | 449 (6.8%) |
| 10 to 14 Year Olds | 7,090 (95.4%) | 344 (4.6%) |
| 15 to 17 Year Olds | 4,248 (96.4%) | 161 (3.6%) |
| 18 to 19 Year Olds | 1,216 (90.1%) | 133 (9.9%) |
| 20 to 24 Year Olds | 1,612 (81.3%) | 371 (18.7%) |
| 25 to 34 Year Olds | 761 (72.4%) | 290 (27.6%) |
| 35 Years and over | 765 (78.2%) | 213 (21.8%) |
| Total | 22,573 (91.6%) | 2,070 (8.4%) |
Educational Attainment by Field of Study in Sherburne County
Business (4,462 | 23.4%), education (2,966 | 15.6%), science & technology (2,298 | 12.1%), arts & humanities (1,605 | 8.4%), and bio, nature & agricultural (1,318 | 6.9%) are the most common fields of study among 19,054 individuals in Sherburne County who have obtained a bachelor's degree or higher.
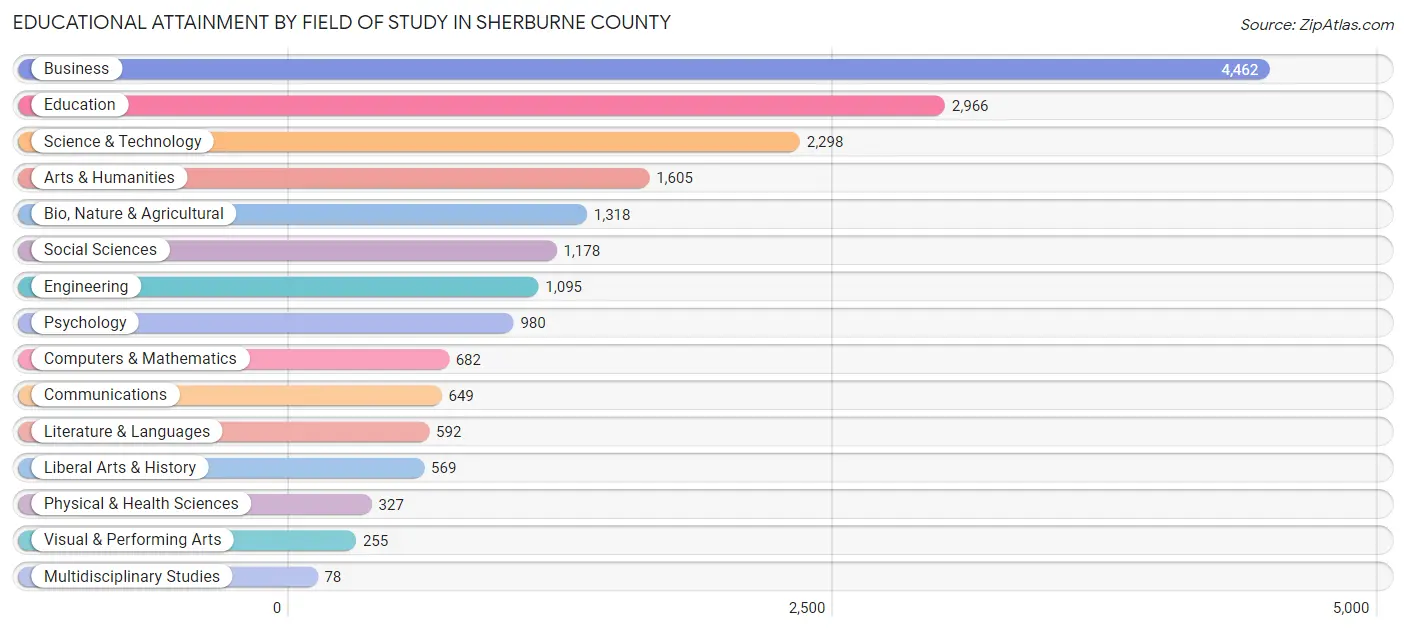
| Field of Study | # Graduates | % Graduates |
| Computers & Mathematics | 682 | 3.6% |
| Bio, Nature & Agricultural | 1,318 | 6.9% |
| Physical & Health Sciences | 327 | 1.7% |
| Psychology | 980 | 5.1% |
| Social Sciences | 1,178 | 6.2% |
| Engineering | 1,095 | 5.8% |
| Multidisciplinary Studies | 78 | 0.4% |
| Science & Technology | 2,298 | 12.1% |
| Business | 4,462 | 23.4% |
| Education | 2,966 | 15.6% |
| Literature & Languages | 592 | 3.1% |
| Liberal Arts & History | 569 | 3.0% |
| Visual & Performing Arts | 255 | 1.3% |
| Communications | 649 | 3.4% |
| Arts & Humanities | 1,605 | 8.4% |
| Total | 19,054 | 100.0% |
Transportation & Commute in Sherburne County
Vehicle Availability by Sex in Sherburne County
The most prevalent vehicle ownership categories in Sherburne County are males with 2 vehicles (10,572, accounting for 37.7%) and females with 2 vehicles (9,793, making up 42.9%).
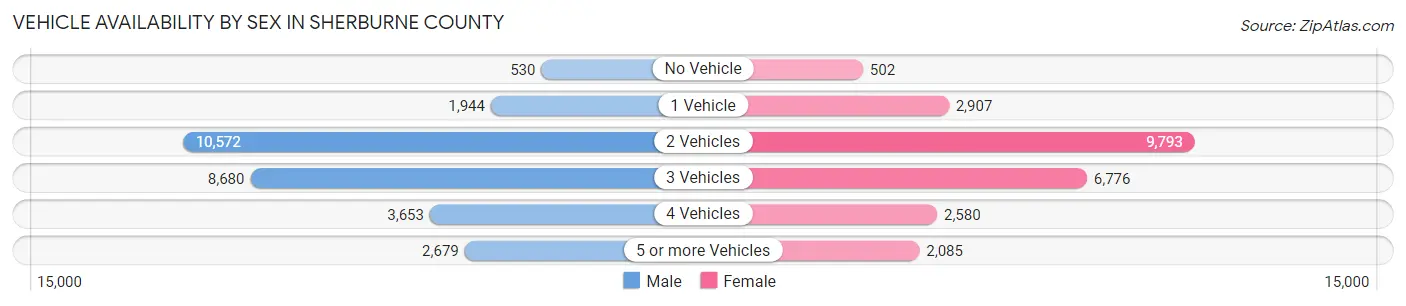
| Vehicles Available | Male | Female |
| No Vehicle | 530 (1.9%) | 502 (2.0%) |
| 1 Vehicle | 1,944 (6.9%) | 2,907 (11.8%) |
| 2 Vehicles | 10,572 (37.7%) | 9,793 (39.7%) |
| 3 Vehicles | 8,680 (30.9%) | 6,776 (27.5%) |
| 4 Vehicles | 3,653 (13.0%) | 2,580 (10.5%) |
| 5 or more Vehicles | 2,679 (9.6%) | 2,085 (8.5%) |
| Total | 28,058 (100.0%) | 24,643 (100.0%) |
Commute Time in Sherburne County
The most frequently occuring commute durations in Sherburne County are 45 to 59 minutes (6,409 commuters, 13.6%), 30 to 34 minutes (5,470 commuters, 11.6%), and 15 to 19 minutes (5,411 commuters, 11.4%).
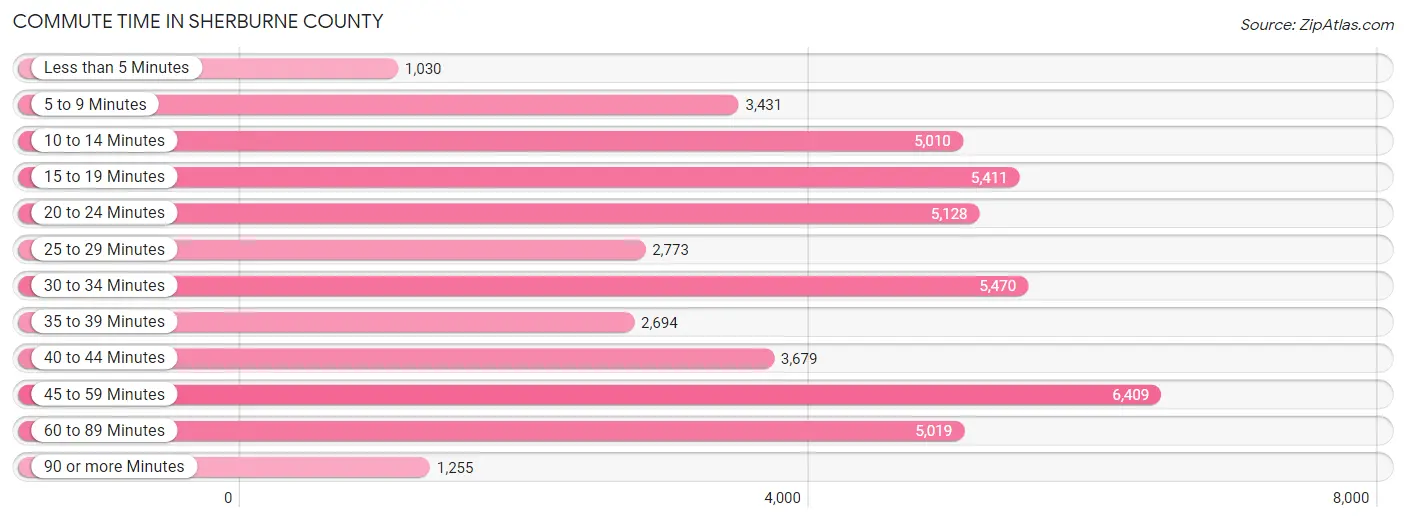
| Commute Time | # Commuters | % Commuters |
| Less than 5 Minutes | 1,030 | 2.2% |
| 5 to 9 Minutes | 3,431 | 7.2% |
| 10 to 14 Minutes | 5,010 | 10.6% |
| 15 to 19 Minutes | 5,411 | 11.4% |
| 20 to 24 Minutes | 5,128 | 10.8% |
| 25 to 29 Minutes | 2,773 | 5.9% |
| 30 to 34 Minutes | 5,470 | 11.6% |
| 35 to 39 Minutes | 2,694 | 5.7% |
| 40 to 44 Minutes | 3,679 | 7.8% |
| 45 to 59 Minutes | 6,409 | 13.6% |
| 60 to 89 Minutes | 5,019 | 10.6% |
| 90 or more Minutes | 1,255 | 2.6% |
Commute Time by Sex in Sherburne County
The most common commute times in Sherburne County are 45 to 59 minutes (3,889 commuters, 15.0%) for males and 15 to 19 minutes (2,815 commuters, 13.2%) for females.
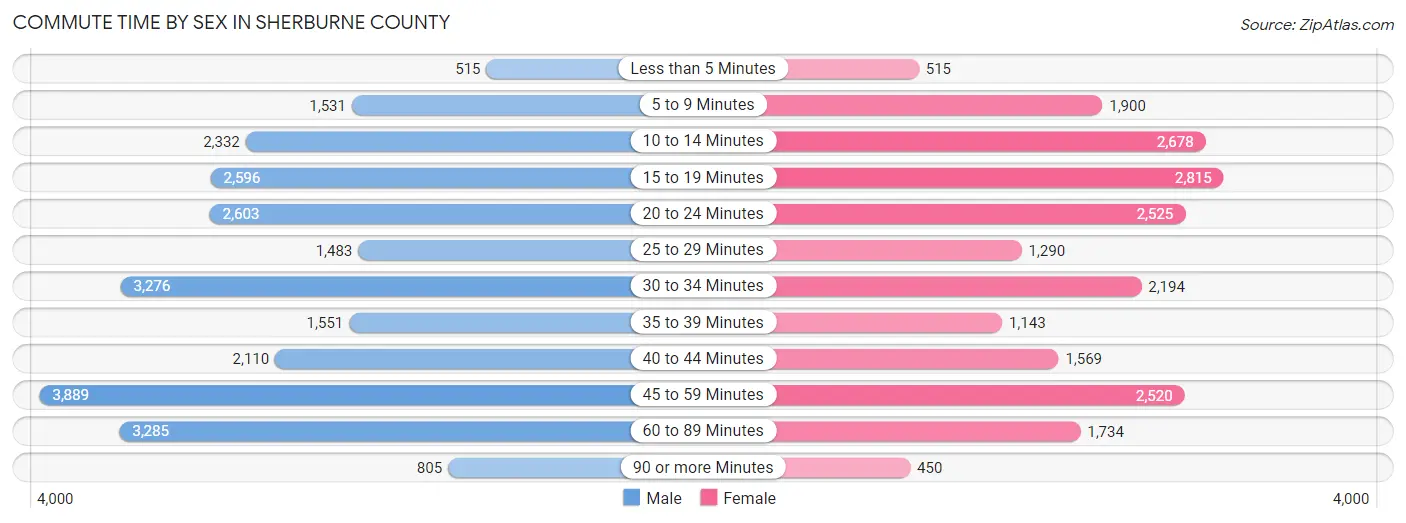
| Commute Time | Male | Female |
| Less than 5 Minutes | 515 (2.0%) | 515 (2.4%) |
| 5 to 9 Minutes | 1,531 (5.9%) | 1,900 (8.9%) |
| 10 to 14 Minutes | 2,332 (9.0%) | 2,678 (12.6%) |
| 15 to 19 Minutes | 2,596 (10.0%) | 2,815 (13.2%) |
| 20 to 24 Minutes | 2,603 (10.0%) | 2,525 (11.8%) |
| 25 to 29 Minutes | 1,483 (5.7%) | 1,290 (6.0%) |
| 30 to 34 Minutes | 3,276 (12.6%) | 2,194 (10.3%) |
| 35 to 39 Minutes | 1,551 (6.0%) | 1,143 (5.4%) |
| 40 to 44 Minutes | 2,110 (8.1%) | 1,569 (7.3%) |
| 45 to 59 Minutes | 3,889 (15.0%) | 2,520 (11.8%) |
| 60 to 89 Minutes | 3,285 (12.7%) | 1,734 (8.1%) |
| 90 or more Minutes | 805 (3.1%) | 450 (2.1%) |
Time of Departure to Work by Sex in Sherburne County
The most frequent times of departure to work in Sherburne County are 7:00 AM to 7:29 AM (3,426, 13.2%) for males and 7:00 AM to 7:29 AM (3,616, 17.0%) for females.
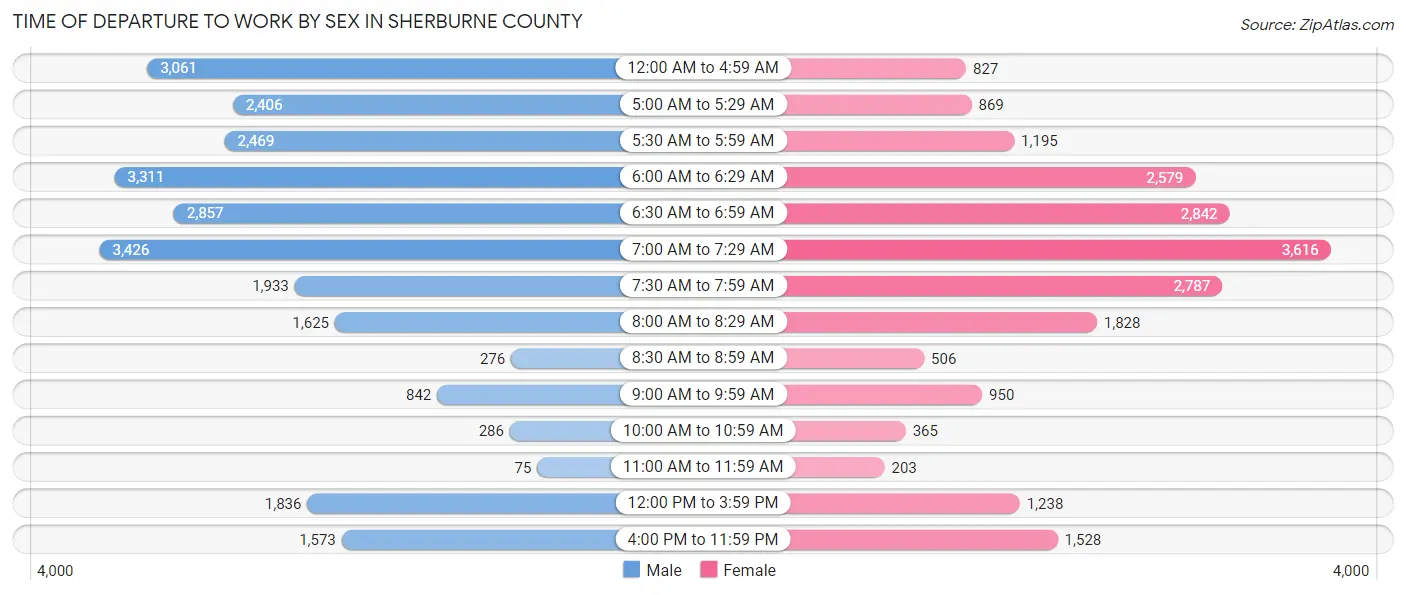
| Time of Departure | Male | Female |
| 12:00 AM to 4:59 AM | 3,061 (11.8%) | 827 (3.9%) |
| 5:00 AM to 5:29 AM | 2,406 (9.3%) | 869 (4.1%) |
| 5:30 AM to 5:59 AM | 2,469 (9.5%) | 1,195 (5.6%) |
| 6:00 AM to 6:29 AM | 3,311 (12.8%) | 2,579 (12.1%) |
| 6:30 AM to 6:59 AM | 2,857 (11.0%) | 2,842 (13.3%) |
| 7:00 AM to 7:29 AM | 3,426 (13.2%) | 3,616 (17.0%) |
| 7:30 AM to 7:59 AM | 1,933 (7.4%) | 2,787 (13.1%) |
| 8:00 AM to 8:29 AM | 1,625 (6.3%) | 1,828 (8.6%) |
| 8:30 AM to 8:59 AM | 276 (1.1%) | 506 (2.4%) |
| 9:00 AM to 9:59 AM | 842 (3.2%) | 950 (4.4%) |
| 10:00 AM to 10:59 AM | 286 (1.1%) | 365 (1.7%) |
| 11:00 AM to 11:59 AM | 75 (0.3%) | 203 (0.9%) |
| 12:00 PM to 3:59 PM | 1,836 (7.1%) | 1,238 (5.8%) |
| 4:00 PM to 11:59 PM | 1,573 (6.1%) | 1,528 (7.2%) |
| Total | 25,976 (100.0%) | 21,333 (100.0%) |
Housing Occupancy in Sherburne County
Occupancy by Ownership in Sherburne County
Of the total 34,379 dwellings in Sherburne County, owner-occupied units account for 28,655 (83.4%), while renter-occupied units make up 5,724 (16.7%).
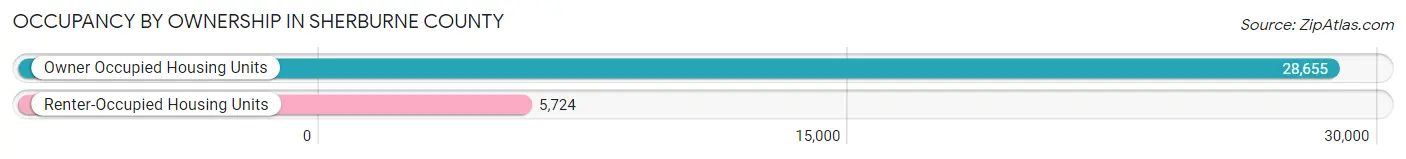
| Occupancy | # Housing Units | % Housing Units |
| Owner Occupied Housing Units | 28,655 | 83.4% |
| Renter-Occupied Housing Units | 5,724 | 16.7% |
| Total Occupied Housing Units | 34,379 | 100.0% |
Occupancy by Household Size in Sherburne County
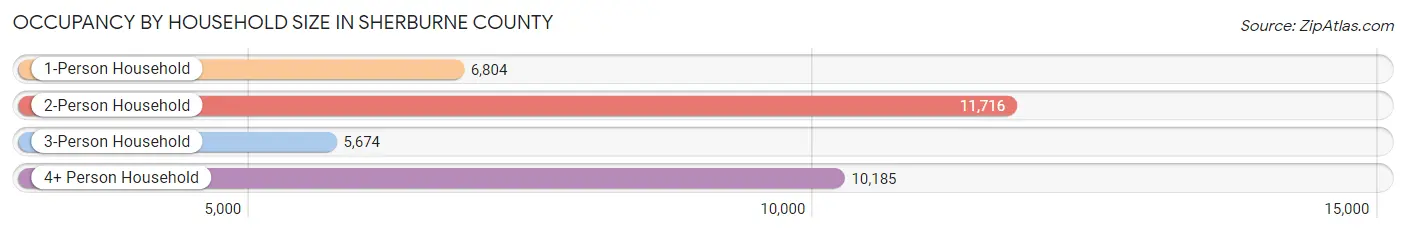
| Household Size | # Housing Units | % Housing Units |
| 1-Person Household | 6,804 | 19.8% |
| 2-Person Household | 11,716 | 34.1% |
| 3-Person Household | 5,674 | 16.5% |
| 4+ Person Household | 10,185 | 29.6% |
| Total Housing Units | 34,379 | 100.0% |
Occupancy by Ownership by Household Size in Sherburne County
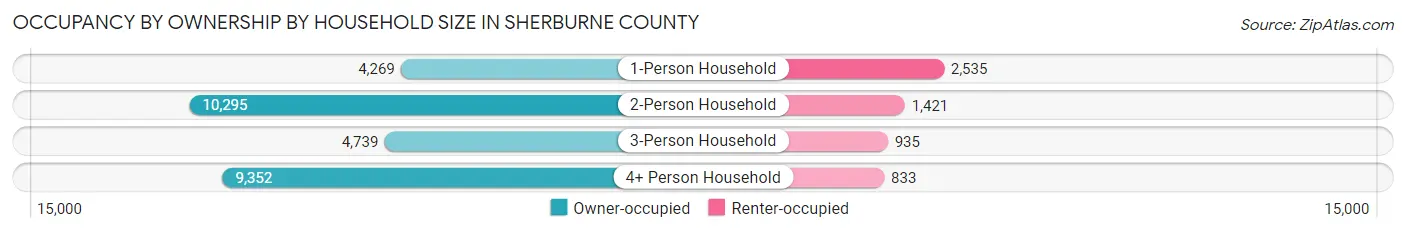
| Household Size | Owner-occupied | Renter-occupied |
| 1-Person Household | 4,269 (62.7%) | 2,535 (37.3%) |
| 2-Person Household | 10,295 (87.9%) | 1,421 (12.1%) |
| 3-Person Household | 4,739 (83.5%) | 935 (16.5%) |
| 4+ Person Household | 9,352 (91.8%) | 833 (8.2%) |
| Total Housing Units | 28,655 (83.4%) | 5,724 (16.7%) |
Occupancy by Educational Attainment in Sherburne County
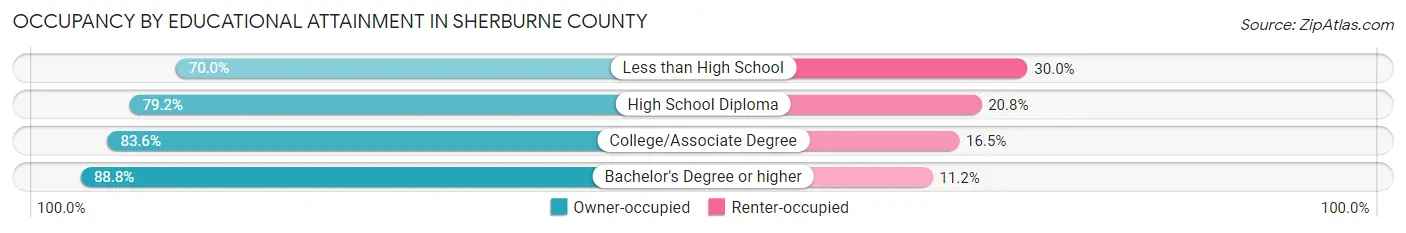
| Household Size | Owner-occupied | Renter-occupied |
| Less than High School | 1,357 (70.0%) | 581 (30.0%) |
| High School Diploma | 6,343 (79.2%) | 1,669 (20.8%) |
| College/Associate Degree | 11,786 (83.6%) | 2,320 (16.5%) |
| Bachelor's Degree or higher | 9,169 (88.8%) | 1,154 (11.2%) |
Occupancy by Age of Householder in Sherburne County
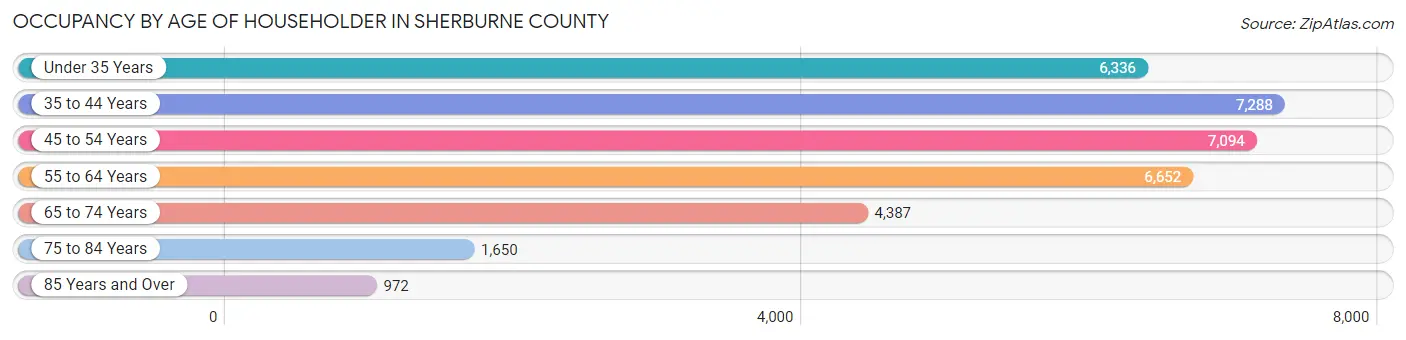
| Age Bracket | # Households | % Households |
| Under 35 Years | 6,336 | 18.4% |
| 35 to 44 Years | 7,288 | 21.2% |
| 45 to 54 Years | 7,094 | 20.6% |
| 55 to 64 Years | 6,652 | 19.4% |
| 65 to 74 Years | 4,387 | 12.8% |
| 75 to 84 Years | 1,650 | 4.8% |
| 85 Years and Over | 972 | 2.8% |
| Total | 34,379 | 100.0% |
Housing Finances in Sherburne County
Median Income by Occupancy in Sherburne County
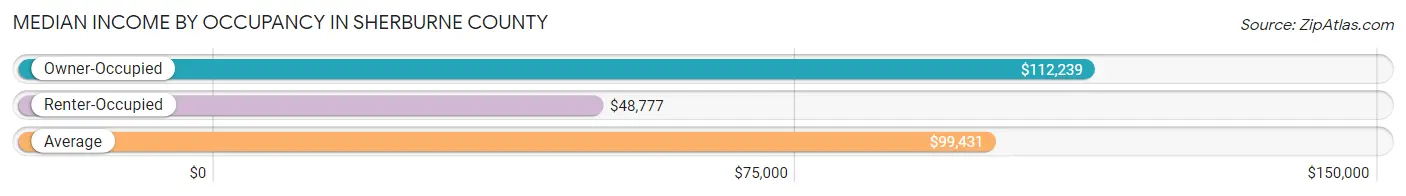
| Occupancy Type | # Households | Median Income |
| Owner-Occupied | 28,655 (83.4%) | $112,239 |
| Renter-Occupied | 5,724 (16.7%) | $48,777 |
| Average | 34,379 (100.0%) | $99,431 |
Occupancy by Householder Income Bracket in Sherburne County
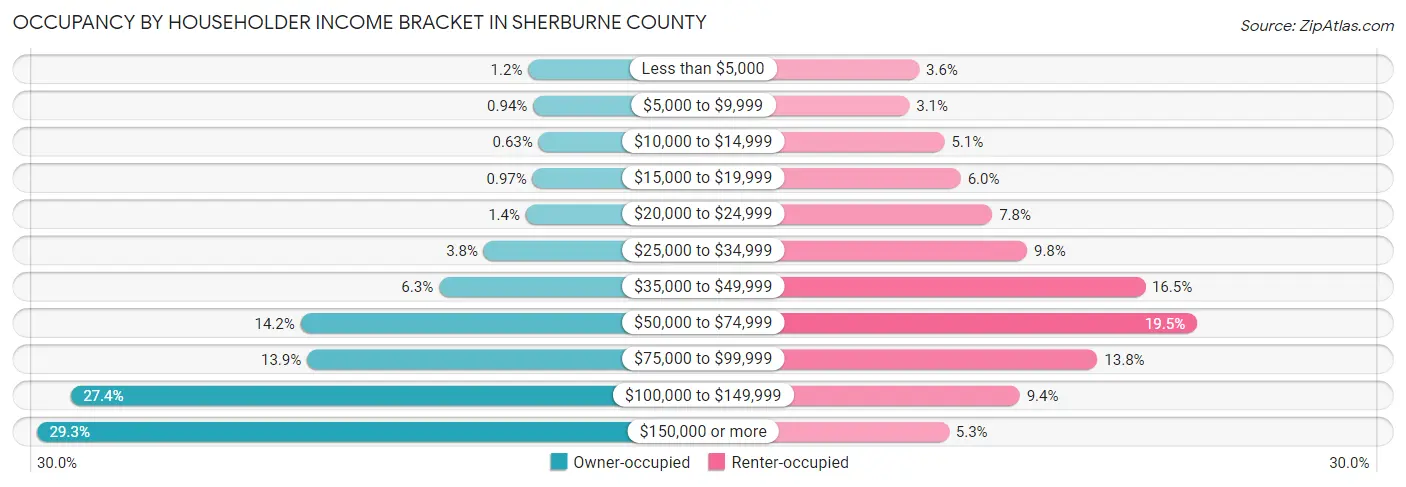
| Income Bracket | Owner-occupied | Renter-occupied |
| Less than $5,000 | 350 (1.2%) | 208 (3.6%) |
| $5,000 to $9,999 | 268 (0.9%) | 176 (3.1%) |
| $10,000 to $14,999 | 181 (0.6%) | 291 (5.1%) |
| $15,000 to $19,999 | 277 (1.0%) | 344 (6.0%) |
| $20,000 to $24,999 | 389 (1.4%) | 447 (7.8%) |
| $25,000 to $34,999 | 1,078 (3.8%) | 561 (9.8%) |
| $35,000 to $49,999 | 1,810 (6.3%) | 947 (16.5%) |
| $50,000 to $74,999 | 4,078 (14.2%) | 1,117 (19.5%) |
| $75,000 to $99,999 | 3,973 (13.9%) | 791 (13.8%) |
| $100,000 to $149,999 | 7,849 (27.4%) | 537 (9.4%) |
| $150,000 or more | 8,402 (29.3%) | 305 (5.3%) |
| Total | 28,655 (100.0%) | 5,724 (100.0%) |
Monthly Housing Cost Tiers in Sherburne County
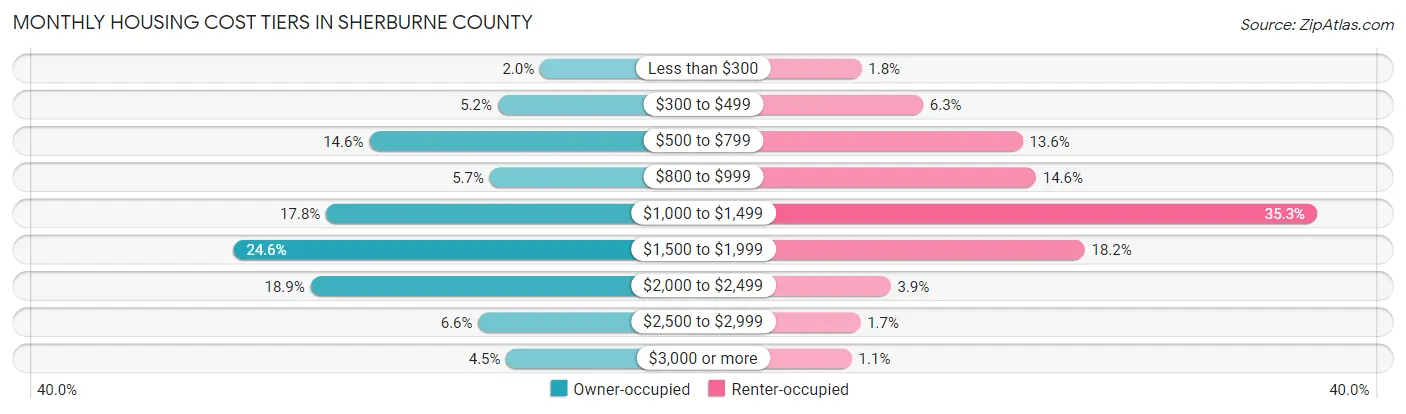
| Monthly Cost | Owner-occupied | Renter-occupied |
| Less than $300 | 584 (2.0%) | 101 (1.8%) |
| $300 to $499 | 1,475 (5.1%) | 360 (6.3%) |
| $500 to $799 | 4,189 (14.6%) | 780 (13.6%) |
| $800 to $999 | 1,646 (5.7%) | 836 (14.6%) |
| $1,000 to $1,499 | 5,097 (17.8%) | 2,021 (35.3%) |
| $1,500 to $1,999 | 7,059 (24.6%) | 1,042 (18.2%) |
| $2,000 to $2,499 | 5,426 (18.9%) | 224 (3.9%) |
| $2,500 to $2,999 | 1,885 (6.6%) | 96 (1.7%) |
| $3,000 or more | 1,294 (4.5%) | 60 (1.1%) |
| Total | 28,655 (100.0%) | 5,724 (100.0%) |
Physical Housing Characteristics in Sherburne County
Housing Structures in Sherburne County
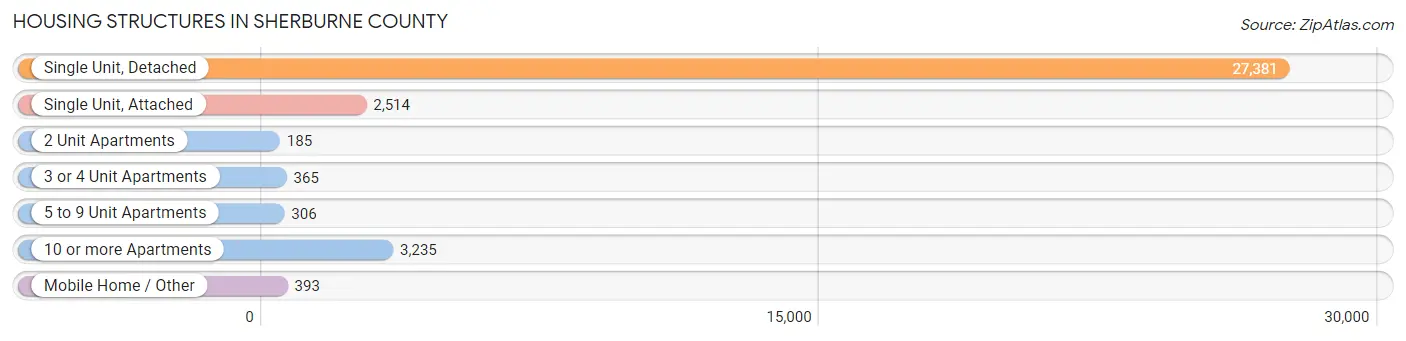
| Structure Type | # Housing Units | % Housing Units |
| Single Unit, Detached | 27,381 | 79.6% |
| Single Unit, Attached | 2,514 | 7.3% |
| 2 Unit Apartments | 185 | 0.5% |
| 3 or 4 Unit Apartments | 365 | 1.1% |
| 5 to 9 Unit Apartments | 306 | 0.9% |
| 10 or more Apartments | 3,235 | 9.4% |
| Mobile Home / Other | 393 | 1.1% |
| Total | 34,379 | 100.0% |
Housing Structures by Occupancy in Sherburne County
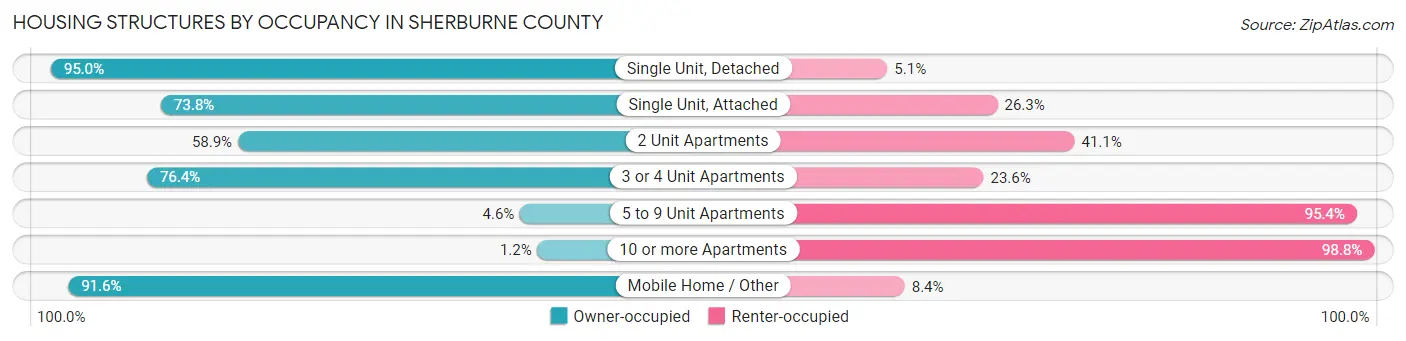
| Structure Type | Owner-occupied | Renter-occupied |
| Single Unit, Detached | 25,999 (95.0%) | 1,382 (5.1%) |
| Single Unit, Attached | 1,854 (73.8%) | 660 (26.3%) |
| 2 Unit Apartments | 109 (58.9%) | 76 (41.1%) |
| 3 or 4 Unit Apartments | 279 (76.4%) | 86 (23.6%) |
| 5 to 9 Unit Apartments | 14 (4.6%) | 292 (95.4%) |
| 10 or more Apartments | 40 (1.2%) | 3,195 (98.8%) |
| Mobile Home / Other | 360 (91.6%) | 33 (8.4%) |
| Total | 28,655 (83.4%) | 5,724 (16.7%) |
Housing Structures by Number of Rooms in Sherburne County
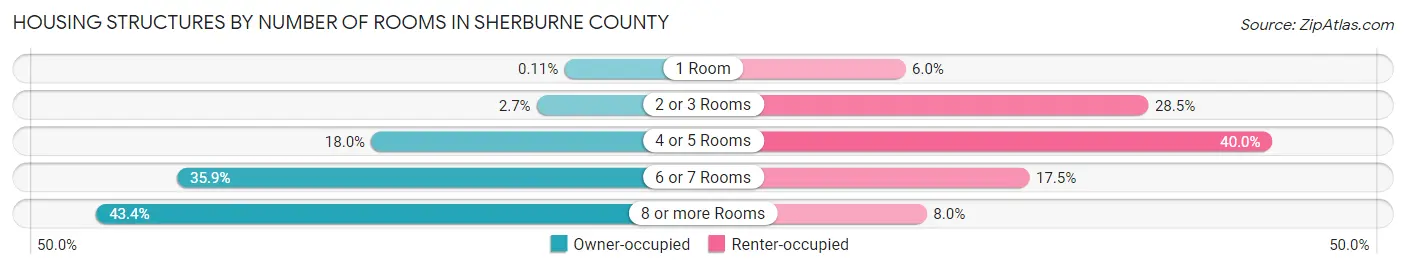
| Number of Rooms | Owner-occupied | Renter-occupied |
| 1 Room | 31 (0.1%) | 345 (6.0%) |
| 2 or 3 Rooms | 763 (2.7%) | 1,631 (28.5%) |
| 4 or 5 Rooms | 5,149 (18.0%) | 2,289 (40.0%) |
| 6 or 7 Rooms | 10,284 (35.9%) | 1,001 (17.5%) |
| 8 or more Rooms | 12,428 (43.4%) | 458 (8.0%) |
| Total | 28,655 (100.0%) | 5,724 (100.0%) |
Housing Structure by Heating Type in Sherburne County
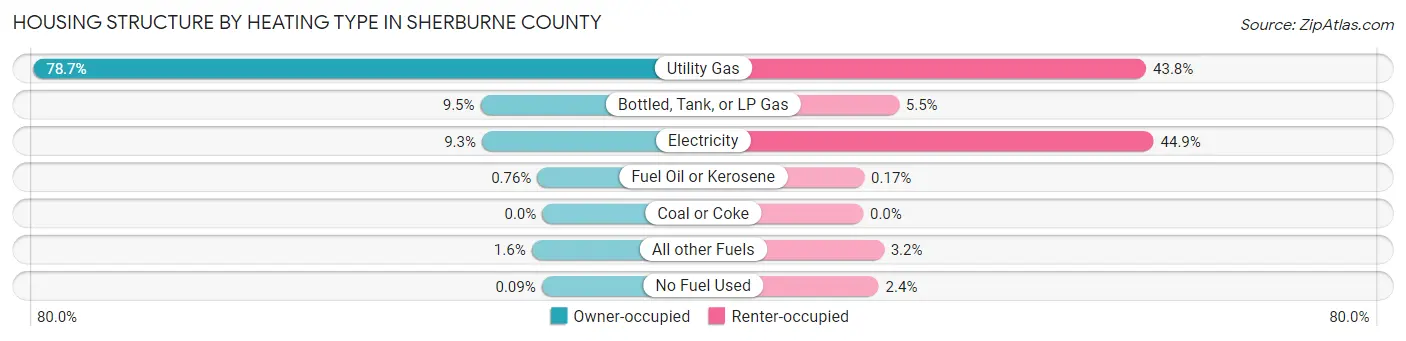
| Heating Type | Owner-occupied | Renter-occupied |
| Utility Gas | 22,537 (78.6%) | 2,505 (43.8%) |
| Bottled, Tank, or LP Gas | 2,734 (9.5%) | 317 (5.5%) |
| Electricity | 2,672 (9.3%) | 2,571 (44.9%) |
| Fuel Oil or Kerosene | 217 (0.8%) | 10 (0.2%) |
| Coal or Coke | 0 (0.0%) | 0 (0.0%) |
| All other Fuels | 469 (1.6%) | 183 (3.2%) |
| No Fuel Used | 26 (0.1%) | 138 (2.4%) |
| Total | 28,655 (100.0%) | 5,724 (100.0%) |
Household Vehicle Usage in Sherburne County
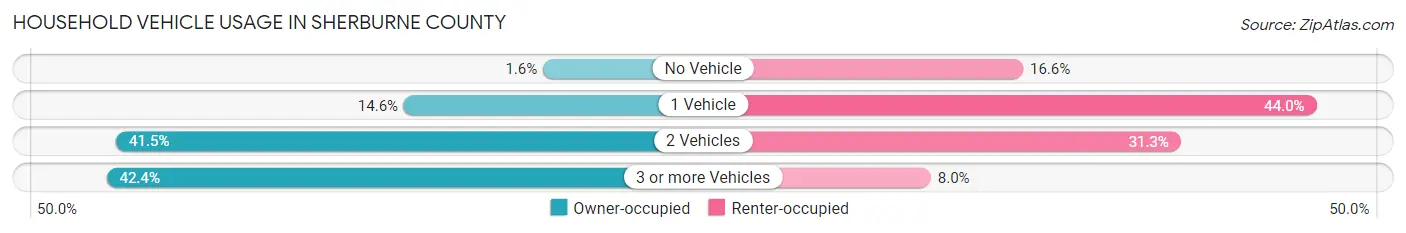
| Vehicles per Household | Owner-occupied | Renter-occupied |
| No Vehicle | 458 (1.6%) | 952 (16.6%) |
| 1 Vehicle | 4,182 (14.6%) | 2,519 (44.0%) |
| 2 Vehicles | 11,880 (41.5%) | 1,794 (31.3%) |
| 3 or more Vehicles | 12,135 (42.3%) | 459 (8.0%) |
| Total | 28,655 (100.0%) | 5,724 (100.0%) |
Real Estate & Mortgages in Sherburne County
Real Estate and Mortgage Overview in Sherburne County
| Characteristic | Without Mortgage | With Mortgage |
| Housing Units | 7,132 | 21,523 |
| Median Property Value | $290,900 | $310,900 |
| Median Household Income | $83,808 | $7,036 |
| Monthly Housing Costs | $623 | $1,294 |
| Real Estate Taxes | $3,146 | $244 |
Property Value by Mortgage Status in Sherburne County
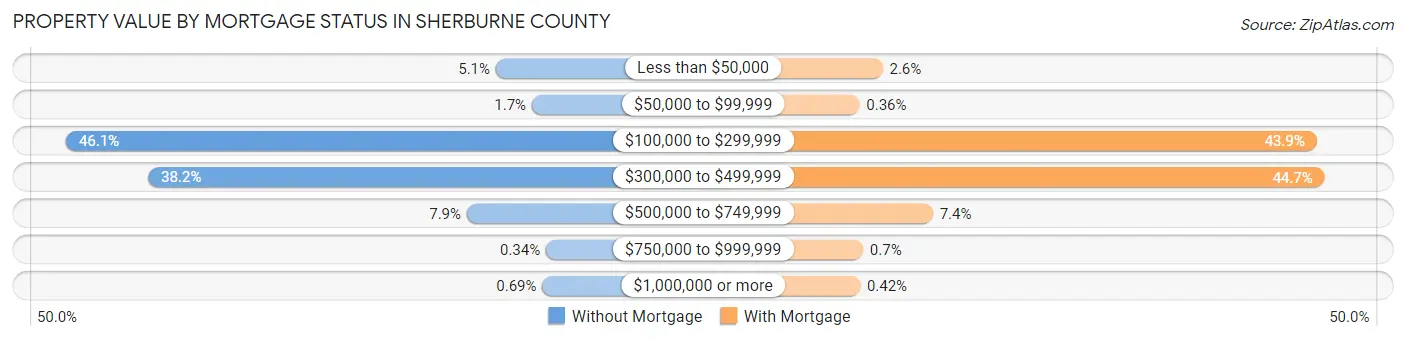
| Property Value | Without Mortgage | With Mortgage |
| Less than $50,000 | 365 (5.1%) | 554 (2.6%) |
| $50,000 to $99,999 | 120 (1.7%) | 78 (0.4%) |
| $100,000 to $299,999 | 3,285 (46.1%) | 9,452 (43.9%) |
| $300,000 to $499,999 | 2,727 (38.2%) | 9,617 (44.7%) |
| $500,000 to $749,999 | 562 (7.9%) | 1,581 (7.3%) |
| $750,000 to $999,999 | 24 (0.3%) | 150 (0.7%) |
| $1,000,000 or more | 49 (0.7%) | 91 (0.4%) |
| Total | 7,132 (100.0%) | 21,523 (100.0%) |
Household Income by Mortgage Status in Sherburne County
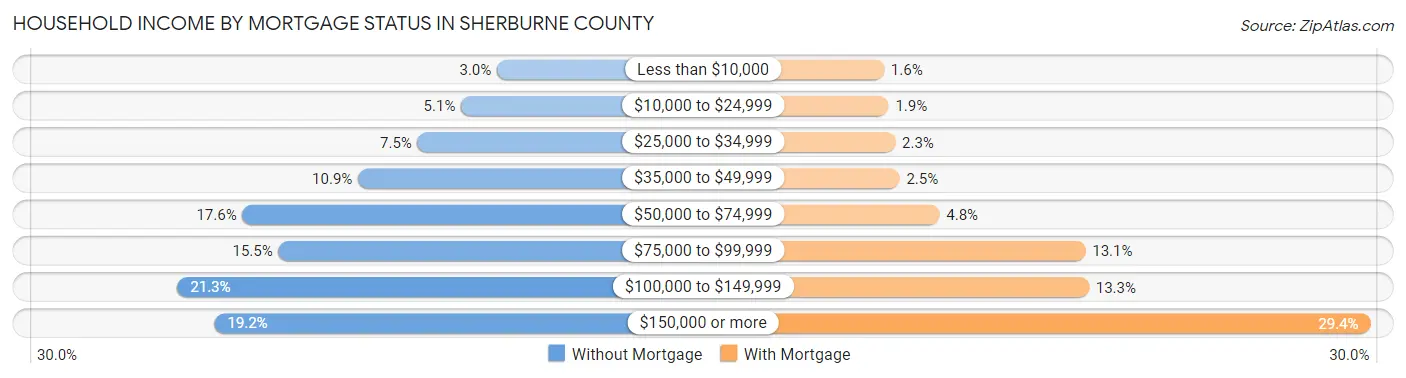
| Household Income | Without Mortgage | With Mortgage |
| Less than $10,000 | 214 (3.0%) | 349 (1.6%) |
| $10,000 to $24,999 | 360 (5.1%) | 404 (1.9%) |
| $25,000 to $34,999 | 538 (7.5%) | 487 (2.3%) |
| $35,000 to $49,999 | 780 (10.9%) | 540 (2.5%) |
| $50,000 to $74,999 | 1,252 (17.5%) | 1,030 (4.8%) |
| $75,000 to $99,999 | 1,105 (15.5%) | 2,826 (13.1%) |
| $100,000 to $149,999 | 1,517 (21.3%) | 2,868 (13.3%) |
| $150,000 or more | 1,366 (19.2%) | 6,332 (29.4%) |
| Total | 7,132 (100.0%) | 21,523 (100.0%) |
Property Value to Household Income Ratio in Sherburne County
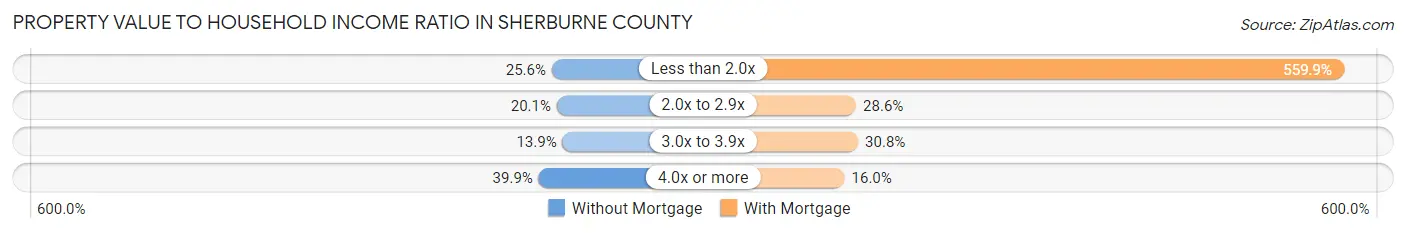
| Value-to-Income Ratio | Without Mortgage | With Mortgage |
| Less than 2.0x | 1,823 (25.6%) | 120,508 (559.9%) |
| 2.0x to 2.9x | 1,433 (20.1%) | 6,154 (28.6%) |
| 3.0x to 3.9x | 989 (13.9%) | 6,620 (30.8%) |
| 4.0x or more | 2,842 (39.9%) | 3,444 (16.0%) |
| Total | 7,132 (100.0%) | 21,523 (100.0%) |
Real Estate Taxes by Mortgage Status in Sherburne County
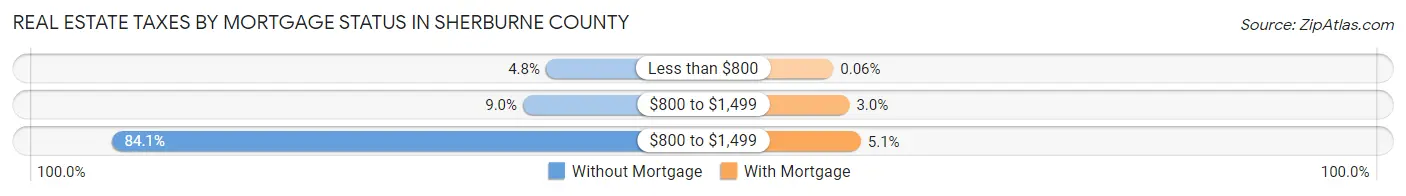
| Property Taxes | Without Mortgage | With Mortgage |
| Less than $800 | 342 (4.8%) | 12 (0.1%) |
| $800 to $1,499 | 641 (9.0%) | 645 (3.0%) |
| $800 to $1,499 | 5,998 (84.1%) | 1,094 (5.1%) |
| Total | 7,132 (100.0%) | 21,523 (100.0%) |
Health & Disability in Sherburne County
Health Insurance Coverage by Age in Sherburne County
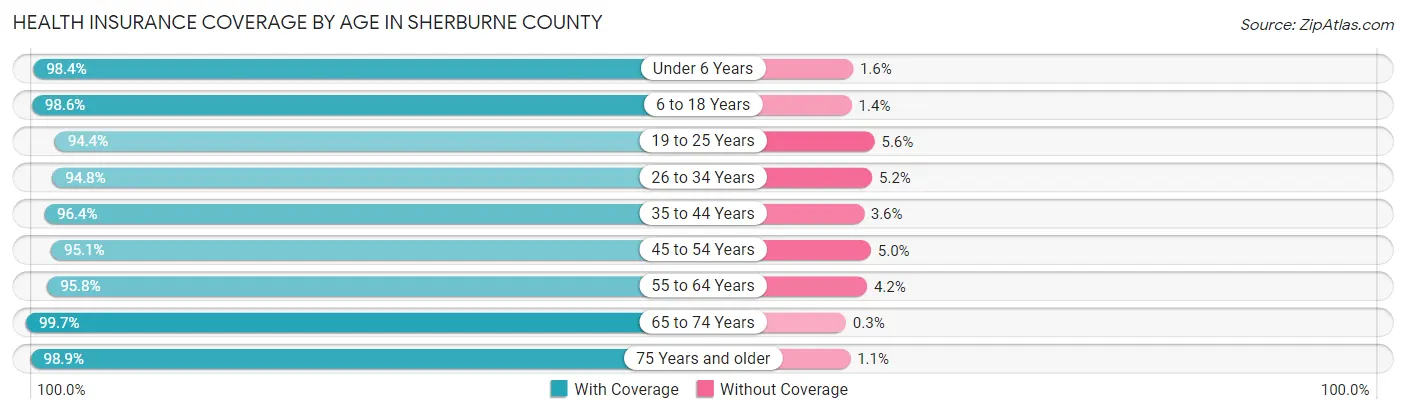
| Age Bracket | With Coverage | Without Coverage |
| Under 6 Years | 7,723 (98.4%) | 127 (1.6%) |
| 6 to 18 Years | 18,378 (98.6%) | 255 (1.4%) |
| 19 to 25 Years | 7,773 (94.4%) | 465 (5.6%) |
| 26 to 34 Years | 10,312 (94.8%) | 563 (5.2%) |
| 35 to 44 Years | 13,197 (96.4%) | 497 (3.6%) |
| 45 to 54 Years | 12,879 (95.1%) | 671 (5.0%) |
| 55 to 64 Years | 11,591 (95.8%) | 512 (4.2%) |
| 65 to 74 Years | 7,196 (99.7%) | 22 (0.3%) |
| 75 Years and older | 3,745 (98.9%) | 42 (1.1%) |
| Total | 92,794 (96.7%) | 3,154 (3.3%) |
Health Insurance Coverage by Citizenship Status in Sherburne County
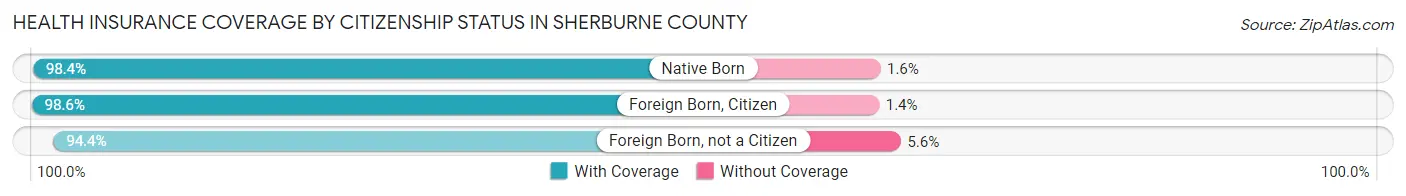
| Citizenship Status | With Coverage | Without Coverage |
| Native Born | 7,723 (98.4%) | 127 (1.6%) |
| Foreign Born, Citizen | 18,378 (98.6%) | 255 (1.4%) |
| Foreign Born, not a Citizen | 7,773 (94.4%) | 465 (5.6%) |
Health Insurance Coverage by Household Income in Sherburne County
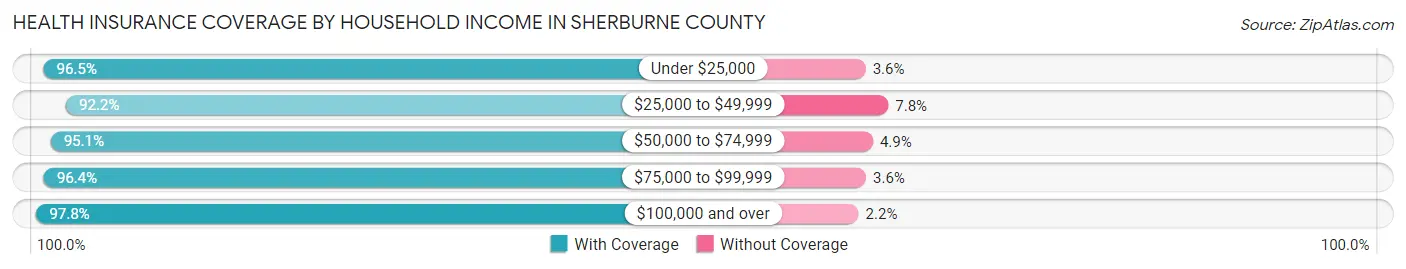
| Household Income | With Coverage | Without Coverage |
| Under $25,000 | 4,294 (96.5%) | 158 (3.5%) |
| $25,000 to $49,999 | 7,256 (92.2%) | 612 (7.8%) |
| $50,000 to $74,999 | 11,906 (95.1%) | 613 (4.9%) |
| $75,000 to $99,999 | 12,677 (96.4%) | 475 (3.6%) |
| $100,000 and over | 56,495 (97.8%) | 1,284 (2.2%) |
Public vs Private Health Insurance Coverage by Age in Sherburne County
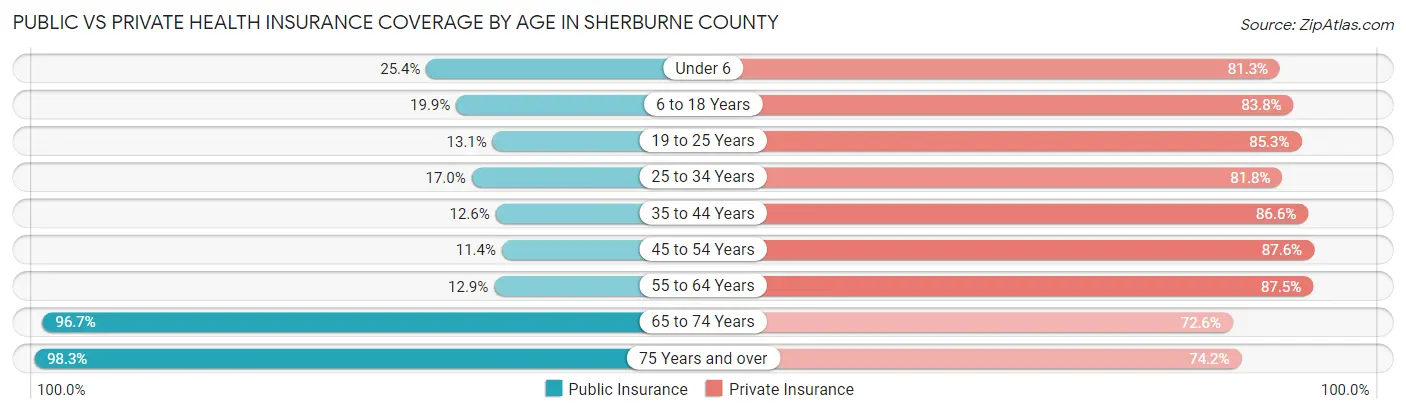
| Age Bracket | Public Insurance | Private Insurance |
| Under 6 | 1,997 (25.4%) | 6,383 (81.3%) |
| 6 to 18 Years | 3,709 (19.9%) | 15,620 (83.8%) |
| 19 to 25 Years | 1,082 (13.1%) | 7,025 (85.3%) |
| 25 to 34 Years | 1,853 (17.0%) | 8,892 (81.8%) |
| 35 to 44 Years | 1,724 (12.6%) | 11,853 (86.6%) |
| 45 to 54 Years | 1,547 (11.4%) | 11,872 (87.6%) |
| 55 to 64 Years | 1,555 (12.9%) | 10,588 (87.5%) |
| 65 to 74 Years | 6,980 (96.7%) | 5,239 (72.6%) |
| 75 Years and over | 3,721 (98.3%) | 2,808 (74.2%) |
| Total | 24,168 (25.2%) | 80,280 (83.7%) |
Disability Status by Sex by Age in Sherburne County
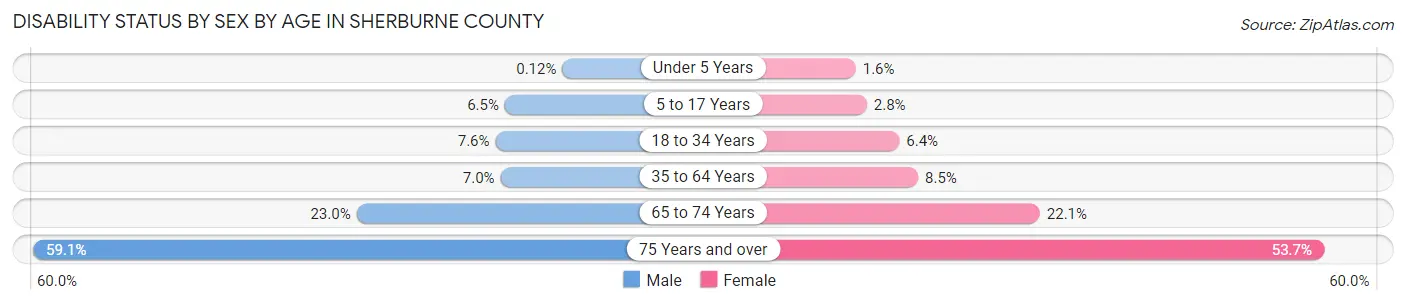
| Age Bracket | Male | Female |
| Under 5 Years | 4 (0.1%) | 48 (1.6%) |
| 5 to 17 Years | 616 (6.5%) | 266 (2.8%) |
| 18 to 34 Years | 814 (7.6%) | 607 (6.4%) |
| 35 to 64 Years | 1,420 (7.0%) | 1,623 (8.5%) |
| 65 to 74 Years | 813 (23.0%) | 814 (22.1%) |
| 75 Years and over | 978 (59.1%) | 1,144 (53.7%) |
Disability Class by Sex by Age in Sherburne County
Disability Class: Hearing Difficulty
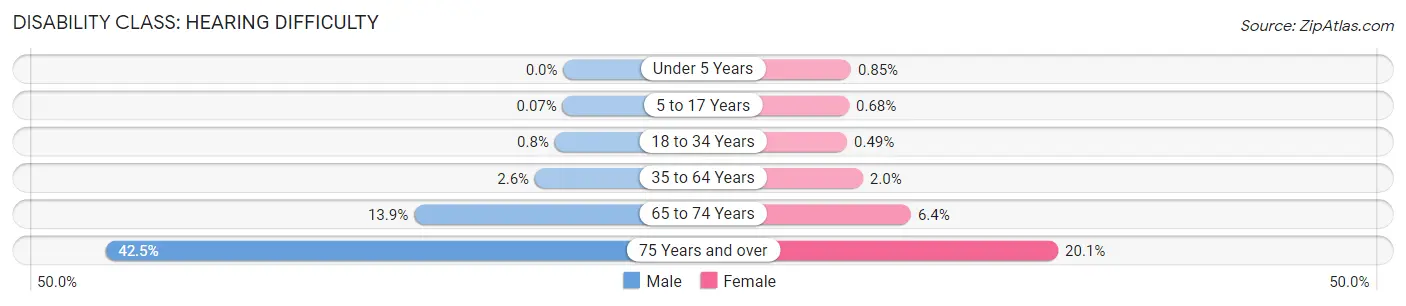
| Age Bracket | Male | Female |
| Under 5 Years | 0 (0.0%) | 26 (0.9%) |
| 5 to 17 Years | 7 (0.1%) | 65 (0.7%) |
| 18 to 34 Years | 86 (0.8%) | 46 (0.5%) |
| 35 to 64 Years | 535 (2.6%) | 374 (2.0%) |
| 65 to 74 Years | 489 (13.9%) | 237 (6.4%) |
| 75 Years and over | 704 (42.5%) | 428 (20.1%) |
Disability Class: Vision Difficulty
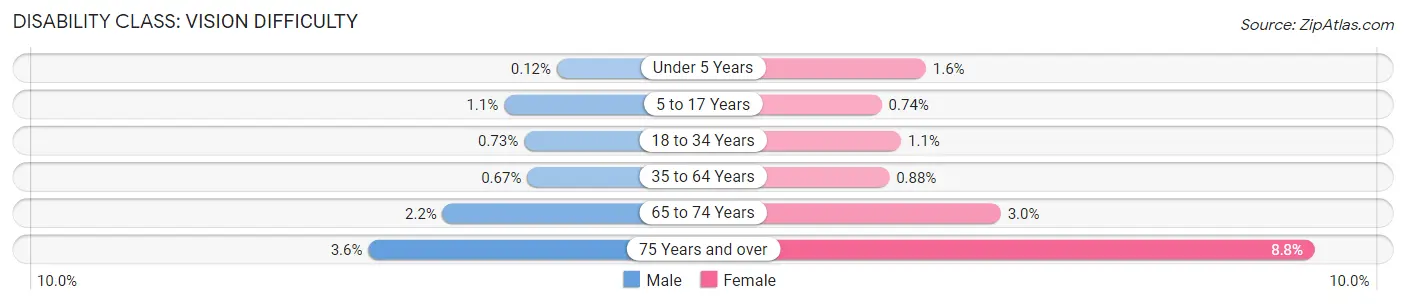
| Age Bracket | Male | Female |
| Under 5 Years | 4 (0.1%) | 48 (1.6%) |
| 5 to 17 Years | 104 (1.1%) | 71 (0.7%) |
| 18 to 34 Years | 78 (0.7%) | 104 (1.1%) |
| 35 to 64 Years | 136 (0.7%) | 169 (0.9%) |
| 65 to 74 Years | 79 (2.2%) | 109 (2.9%) |
| 75 Years and over | 60 (3.6%) | 187 (8.8%) |
Disability Class: Cognitive Difficulty
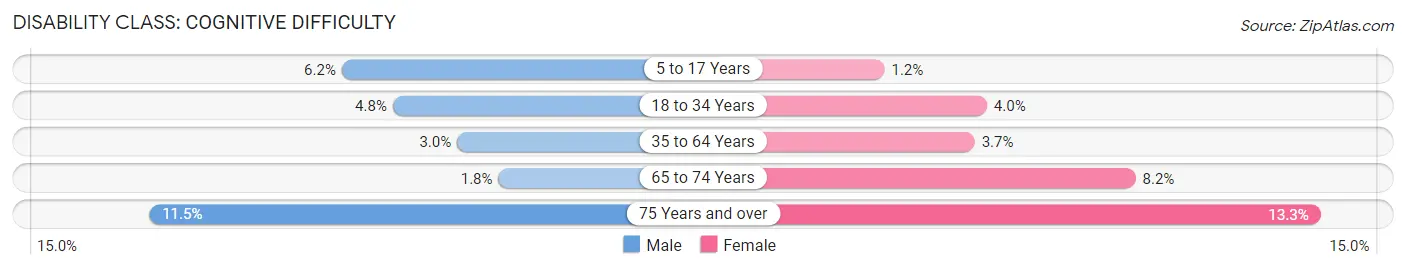
| Age Bracket | Male | Female |
| 5 to 17 Years | 583 (6.2%) | 114 (1.2%) |
| 18 to 34 Years | 511 (4.8%) | 383 (4.0%) |
| 35 to 64 Years | 599 (3.0%) | 706 (3.7%) |
| 65 to 74 Years | 64 (1.8%) | 302 (8.2%) |
| 75 Years and over | 191 (11.5%) | 284 (13.3%) |
Disability Class: Ambulatory Difficulty
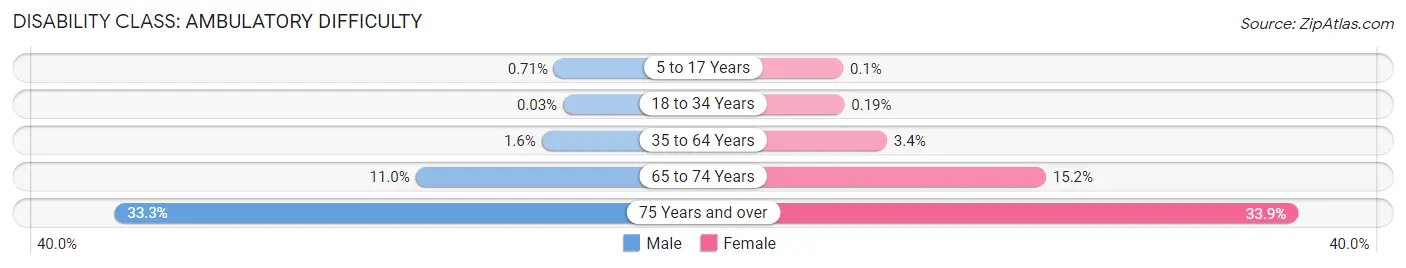
| Age Bracket | Male | Female |
| 5 to 17 Years | 67 (0.7%) | 10 (0.1%) |
| 18 to 34 Years | 3 (0.0%) | 18 (0.2%) |
| 35 to 64 Years | 328 (1.6%) | 640 (3.4%) |
| 65 to 74 Years | 387 (11.0%) | 559 (15.1%) |
| 75 Years and over | 552 (33.3%) | 722 (33.9%) |
Disability Class: Self-Care Difficulty
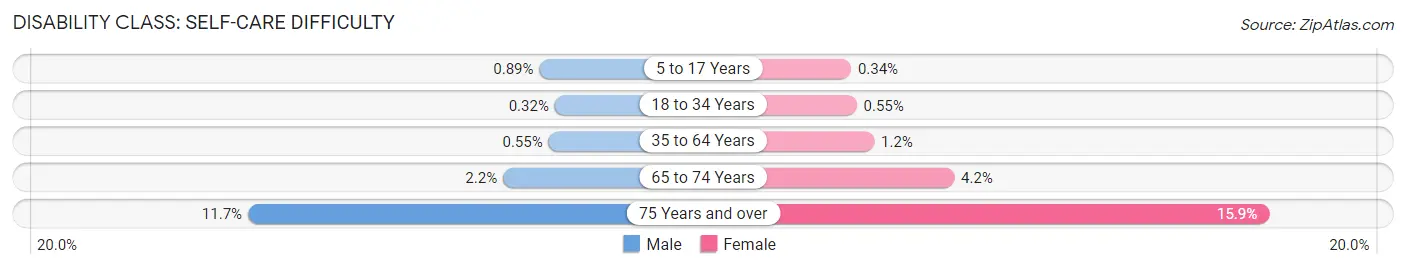
| Age Bracket | Male | Female |
| 5 to 17 Years | 84 (0.9%) | 32 (0.3%) |
| 18 to 34 Years | 34 (0.3%) | 52 (0.5%) |
| 35 to 64 Years | 112 (0.5%) | 229 (1.2%) |
| 65 to 74 Years | 79 (2.2%) | 154 (4.2%) |
| 75 Years and over | 194 (11.7%) | 338 (15.9%) |
Technology Access in Sherburne County
Computing Device Access in Sherburne County
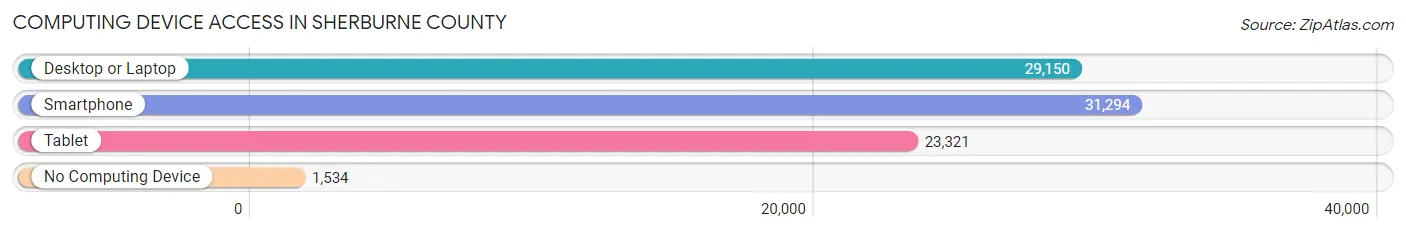
| Device Type | # Households | % Households |
| Desktop or Laptop | 29,150 | 84.8% |
| Smartphone | 31,294 | 91.0% |
| Tablet | 23,321 | 67.8% |
| No Computing Device | 1,534 | 4.5% |
| Total | 34,379 | 100.0% |
Internet Access in Sherburne County
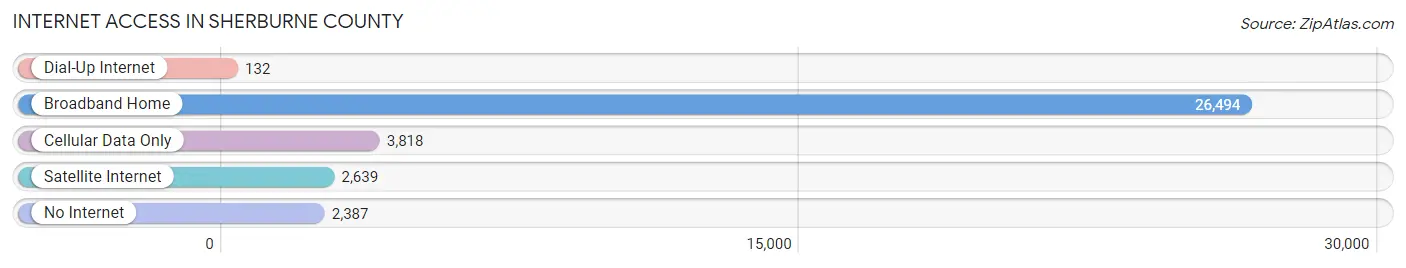
| Internet Type | # Households | % Households |
| Dial-Up Internet | 132 | 0.4% |
| Broadband Home | 26,494 | 77.1% |
| Cellular Data Only | 3,818 | 11.1% |
| Satellite Internet | 2,639 | 7.7% |
| No Internet | 2,387 | 6.9% |
| Total | 34,379 | 100.0% |
Sherburne County Summary
Sherburne County is located in the central part of Minnesota, and is part of the Twin Cities metropolitan area. It is bordered by Anoka County to the north, Isanti County to the east, Wright County to the south, and Stearns County to the west. The county seat is Elk River, and the county is home to over 88,000 people.
History
Sherburne County was established in 1856, and was named after Isaac Sherburne, a prominent early settler in the area. The county was originally part of the larger Benton County, which was divided into two separate counties in 1856. The first settlers in the area were mostly of German and Scandinavian descent, and the county was largely agricultural.
In the late 19th century, the county began to industrialize, with the construction of several railroads and the establishment of several small towns. The county also saw an influx of immigrants from Europe, particularly from Germany and Scandinavia.
Geography
Sherburne County is located in the central part of Minnesota, and is part of the Twin Cities metropolitan area. It is bordered by Anoka County to the north, Isanti County to the east, Wright County to the south, and Stearns County to the west. The county is mostly flat, with some rolling hills in the northern and western parts of the county. The county is home to several lakes, including Big Lake, Clear Lake, and Lake Orono.
Economy
Sherburne County has a diverse economy, with a mix of manufacturing, retail, and service industries. The county is home to several large employers, including the Sherburne County Government, the Elk River School District, and the Elk River Municipal Utilities. The county is also home to several large manufacturing companies, including 3M, Andersen Windows, and Polaris Industries.
The county is also home to several small businesses, including restaurants, retail stores, and professional services. The county is also home to several tourist attractions, including the Sherburne National Wildlife Refuge, the Sherburne History Center, and the Sherburne County Fairgrounds.
Demographics
As of the 2010 census, the population of Sherburne County was 88,499. The racial makeup of the county was 90.2% White, 4.2% Hispanic or Latino, 2.2% Asian, 1.2% African American, 0.5% Native American, and 1.7% from other races. The median household income was $63,945, and the median family income was $76,945.
The county is home to several large cities, including Elk River, Big Lake, and Clear Lake. The county is also home to several small towns, including Becker, Santiago, and Zimmerman. The county is also home to several unincorporated communities, including Baldwin, Palmer, and Santiago.
Common Questions
What is the Total Population of Sherburne County?
Total Population of Sherburne County is 97,820.
What is the Total Male Population of Sherburne County?
Total Male Population of Sherburne County is 50,268.
What is the Total Female Population of Sherburne County?
Total Female Population of Sherburne County is 47,552.
What is the Ratio of Males per 100 Females in Sherburne County?
There are 105.71 Males per 100 Females in Sherburne County.
What is the Ratio of Females per 100 Males in Sherburne County?
There are 94.60 Females per 100 Males in Sherburne County.
What is the Median Population Age in Sherburne County?
Median Population Age in Sherburne County is 36.6 Years.
What is the Average Family Size in Sherburne County
Average Family Size in Sherburne County is 3.2 People.
What is the Average Household Size in Sherburne County
Average Household Size in Sherburne County is 2.8 People.
What is Per Capita Income in Sherburne County?
Per Capita income in Sherburne County is $41,412.
What is the Median Family Income in Sherburne County?
Median Family Income in Sherburne County is $114,968.
What is the Median Household income in Sherburne County?
Median Household Income in Sherburne County is $99,431.
What is Income or Wage Gap in Sherburne County?
Income or Wage Gap in Sherburne County is 24.9%.
Women in Sherburne County earn 75.1 cents for every dollar earned by a man.
What is Family Income Deficit in Sherburne County?
Family Income Deficit in Sherburne County is $9,381.
Families that are below poverty line in Sherburne County earn $9,381 less on average than the poverty threshold level.
What is Inequality or Gini Index in Sherburne County?
Inequality or Gini Index in Sherburne County is 0.38.
How Large is the Labor Force in Sherburne County?
There are 55,472 People in the Labor Forcein in Sherburne County.
What is the Percentage of People in the Labor Force in Sherburne County?
73.5% of People are in the Labor Force in Sherburne County.
What is the Unemployment Rate in Sherburne County?
Unemployment Rate in Sherburne County is 3.0%.